
Submitted:
09 October 2026
Posted:
10 October 2026
You are already at the latest version
Abstract
Isolated mountain ecosystems provide an opportunity to study how long-term natural fragmentation shapes population persistence. Unlike species fragmented by human activi-ties, many mountain endemics have evolved under naturally discontinuous conditions over long timescales, allowing historical and contemporary processes to be disentangled. Degenia velebitica (Brassicaceae) represents a suitable model for such studies. We analysed nuclear microsatellites, chloroplast DNA, fine-scale spatial genetic structure, effective population size, and demographic characteristics across all currently known populations. Despite pronounced genetic differentiation, restricted contemporary gene flow, small effec-tive population sizes, and marked demographic differences, populations maintained moderate nuclear genetic diversity. Chloroplast DNA revealed low haplotype variation and strong spatial structuring of maternal lineages, consistent with limited historical seed-mediated dispersal. Importantly, demographic and genetic indicators were not al-ways concordant: in one population, an apparent recent decline in census size and low effective population size were accompanied by relatively well-preserved nuclear genetic diversity. These findings demonstrate that neutral genetic diversity alone may provide an incomplete picture of population status and evolutionary potential, highlighting the im-portance of integrating genetic, demographic, and ecological information and maintaining existing population structure and habitat integrity in conservation planning.
Keywords:
chloroplast DNA
; conservation genetics
; effective population size
; evolutionary resilience
; fine-scale spatial genetic structure
; historical demography
; mountain endemics
; population fragmentation
1. Introduction
Understanding how species manage to persist in naturally fragmented populations has long been an important question in evolutionary and conservation biology [1,2]. Much recent work has focused on human-driven habitat fragmentation because of its strong impact on biodiversity, but many species have lived for thousands of years in environments shaped by natural processes. In such systems, spatial isolation, environmental variation and limited dispersal arise from slow geological and evolutionary changes rather than from recent human activity [3,4,5].
Mountain ecosystems illustrate this particularly well. Populations are often separated by complex topography, which can restrict connectivity and gene flow among them. Moreover, steep environmental gradients along elevational ranges can generate marked differences in temperature, moisture, and habitat conditions over relatively short geographic distances. These sharp ecological transitions may further promote local adaptation, leading to pronounced genetic differentiation among populations. Yet, contemporary patterns of genetic variation in mountain species are shaped not only by these spatial and ecological constraints but also by their responses to past climatic changes. During climatic oscillations, shifts in suitable habitat repeatedly forced populations into refugial areas, followed by range expansion when conditions became more favorable. These cycles of contraction and expansion have left recognizable patterns in the genetic structure of many mountain organisms [3,6,7].
Mountain plants frequently occupy narrow, naturally fragmented ranges, which often results in strong genetic differentiation. Because of that, they offer valuable opportunities to study how long-term fragmentation influences genetic diversity and adaptation. They also serve as natural laboratories for examining how landscape structure, climatic oscillations and demographic history interact to shape population genetics. Insights from such systems are useful not only for understanding evolutionary processes but also for improving conservation strategies for species living in both natural and human-fragmented habitats [5,8].
From a conservation standpoint, species that are naturally fragmented are particularly challenging to conserve. However, their population size and genetic diversity do not always reflect the long-term consequences of isolation. In long-lived plants, relatively high genetic diversity may persist even after effective population size has declined or gene flow has been restricted for extended periods [1,2,9,10]. As a result, populations may appear genetically stable while already having lost part of their evolutionary potential. Measures of genetic diversity alone therefore often fail to capture the true conservation status of a species [2,10,11].
A reliable assessment of long-term persistence requires an approach that integrates effective population size, spatial patterns of genetic diversity, demographic history, variation in mating patterns, and both historical and contemporary isolation, while also considering the potential influence of reproductive processes such as variation in mating patterns [10,12,13,14,15]. Considering these factors congruently provides a clearer picture of evolutionary potential and the ability of populations to respond to future environmental change. This is especially important for narrowly distributed species with limited dispersal and small effective population sizes, which are expected to face severe challenges under ongoing climate change. Understanding what determines the resilience of such populations remains a central question in conservation biology.
Advances in molecular ecology have greatly improved our ability to study population history and dynamics. Nuclear DNA markers help reveal contemporary gene flow and connectivity [9,16], whereas chloroplast DNA reflects historical patterns of maternal lineage divergence and seed-mediated dispersal, making it useful for reconstructing historical migration routes and responses to past climatic changes [17]. In addition, analyses of population genetic structure, including fine-scale spatial genetic structure (FSGS), can clarify reproductive systems, changes in effective population size, and demographic events such as bottlenecks or expansions [9,18,19]. Moreover, FSGS analyses specifically reveal the spatial scale over which dispersal, successful establishment of new individuals, and mating shape genetic structure within populations [18,19].
Degenia velebitica (Degen) Hayek (Brassicaceae) is a Neogene relict and a narrow endemic species restricted to the Velebit Mountain range and Liburnian Karst in Croatia. It grows on exposed limestone cliffs, scree slopes and rocky crevices, where it experiences strong winds, intense sunlight and large temperature fluctuations (Figure 1) [20,21,22]. Its restricted range, naturally fragmented populations and long-term adaptation to harsh conditions make it a suitable model for studying the evolutionary consequences of natural fragmentation. Previous work using AFLP markers showed strong genetic differentiation and limited contemporary gene flow which are mirrored in differences in community composition and site ecology [23]. However, dominant markers cannot fully resolve within-population diversity, demographic history or phylogeographic patterns [9,16,23,24,25]. Several important questions about the evolutionary history and persistence of D. velebitica therefore remain unanswered.
he aim of this study was to investigate the processes underlying the long-term persistence of naturally fragmented populations of Degenia velebitica by integrating patterns of genetic diversity and population structure with demographic history, effective population size, and patterns of historical and contemporary connectivity. We combined nuclear microsatellite markers (simple sequence repeats; SSRs) with chloroplast DNA sequence data from three regions (rpl32–trnL(UAG), trnS(GCU)–trnG(UUC), and psbZ–trnfM), together with analyses of fine-scale spatial genetic structure (FSGS), effective population size, and demographic history. By integrating these complementary lines of evidence, we aimed to disentangle the relative contributions of historical and contemporary processes to the genetic structure and persistence of the species. More broadly, our study provides insights into the evolutionary dynamics of mountain endemics and the mechanisms that may enable naturally fragmented populations to persist over long evolutionary timescales.
2. Results
2.1. Population Size and Density
Plant density ranged from 0.037 to 1.952 individuals per square meter among the studied populations. The highest density was recorded in P3 (1.952 ind./m²), followed by P2 (1.608 ind./m²), whereas the lowest density was recorded in P4 (0.037 ind./m²). Population P1 had the largest estimated population area (2609.12 m²) and the highest estimated population size (3444 individuals), with a plant density of 1.32 ind./m². In contrast, P4 occupied a relatively large estimated area (1,594.36 m²) despite having the smallest estimated population size (59 individuals). Compared with the previous AFLP-based survey [22], P4 showed a marked reduction in abundance (Table 1).
2.2. Microsatellite Diversity
Ten microsatellite loci were analysed in a total of 778 samples of D. velebitica from five localities. A total of 125 alleles were detected, ranging from 4 (DvUZ001 and DvUZ012) to 46 (DvUZ002) with an average of 12.50 alleles per locus. The effective number of alleles (Ne) ranged from 1.522 for DvUZ004 to 17.24 for DvUZ002 with an average of 5.46. In the analysis of individual loci, the polymorphism information content (PIC) ranged from 0.322 to 0.938 with an average value of 0.662. PIC values higher than 0.70 were observed for the five loci (DvUZ002, DvUZ005, DvUZ006, DvUZ007, DvUZ009) demonstrating their high informativeness in biodiversity studies [26]. The probability of identity (PI) for individual SSR loci ranged from 0.006 (DvUZ002) to 0.453 (DvUZ004), with a combined PI of 3.22 × 10⁻¹¹, indicating that these markers are highly informative and well-suited for analyzing the genetic diversity and structure of D. velebitica (Table S1). Null alleles were detected in three population/microsatellite locus combinations, out of a total of 50 tests (6.00%). The null allele frequencies ranged from 0.032 (Dv002) to 0.218 (Dv005) (Table S2).
2.3. Within-Population Diversity
The highest average number of alleles (Nav) was detected in population P1 (Nav = 9.600) as well as allelic richness (Nar = 8.082), while the lowest values for these two parameters were recorded in P2 (Nav = 4.100; Nar = 3.319). A total of 44 private alleles were detected, ranging from 1 in P4 and P5 to 31 in P1 (Figure 2, Table S3). Observed heterozygosity (HO) ranged from 0.284 in P2 to 0.568 in P3, with an average value of 0.482. The average expected heterozygosity (HE) for the species was slightly higher (HE = 0.487), ranging from 0.322 in P2 to 0.575 in P3 (Figure 2; Table 2).
The expected heterozygosity values [HE (null)] corrected for the presence of null alleles were only slightly higher than the original values, and no significant differences between HE and HE (null) were observed in any population (PWilcoxon = 0.517-0.739), indicating that null alleles did not have a significant effect on estimates of expected heterozygosity. All the examined populations were in Hardy–Weinberg equilibrium (HWE), except P2. Highly significant inbreeding coefficient (FIS = 0.121, P < 0.001) indicates the heterozygotes deficiency (Table 2). To determine whether the deviation from HWE was the result of null alleles or inbreeding a Bayesian approach (individual inbreeding model; IIM) was applied. The model incorporating null alleles and genotyping failures had a marginally lower Deviance Information Criterion (DICnb = 3980.486) than the model including also inbreeding effects (DICnfb = 3981.384), implicating that the deviation from HWE is more likely due to null alleles than to inbreeding.
2.4. Demographic History and Effective Population Size
Bottleneck effect was inferred based on heterozygosity excess determined by Wilcoxon signed rank test assuming two-phase model (TPM) and calculating Garza-Williamson M-ratio. Under the TPM, the results displayed no recent genetic bottleneck in either of examined D. velebitica populations, however, a clear signature of historical bottleneck was revealed by the calculated M-ratios, whereas they were significantly reduced than expected under mutation-drift equilibrium in all analysed populations except P2. The contemporary effective population size based on linkage disequilibrium was highest in P1 (79.8, 95% Confidence Intervals (CI) = 58.8 – 112.8) followed by P3 (54.7, 95% CI = 42.6 – 70.8). The lowest estimated contemporary effective population size was found for P4 (18.7; 95% CI = 12 – 29.5) (Table 2).
2.5. Population Differentiation and Structure
The pairwise FST values among D. velebitica populations were significant (P < 0.05), with an average value of 0.340; whereas the highest FST value was observed between P1 and P2 (FST = 0.496), while the lowest (FST = 0.180) was observed between P4 and P5 (Table S4). To provide an accurate estimation of FST we used the ENA method to efficiently correct for the positive bias induced by the presence of null alleles. The global FST values with and without ENA correction were similar (FST = 0.340, FST (null) = 0.344), however, significantly different (PWilcoxon = 0.004), suggesting that the presence of null alleles had the influence on the differentiation pattern among populations. In both cases (FST with and without ENA) the highest values were observed between P1 and P2 (FST = 0.496; FST (null) = 0.486), and the lowest between P4 and P5 (FST = 0.180; FST (null) = 0.179) (Table S4 and S5).
The analysis of molecular variance revealed a high percentage of variability between individuals within populations (63.47% of the total variation) and the existence of a significant population structure, with 36.53% of total variance found among populations (P < 0.0001) (Table S6).
Factorial correspondence analysis was used to visualize the genetic relationships among individuals from five D. velebitica populations. The results are presented in a two-dimensional factorial plot, with the first and second factors (FC1 and FC2) accounting for 42.36% and 32.00% of total variation, respectively. The FC1 separated individuals from P2 from other populations, while FC2 separated populations P3 from P1. The intermediate position and overlapping of individuals from P4 and P5, indicate high degree of genetic similarity (Figure 3).
The STRUCTURE analysis revealed a clustering pattern consistent with the FCA results. For each value of K (K = 1-11), 30 independent runs were performed to estimate the likelihood of the data conditional on K [ln P(X|K)]. Mean ln P(X|K) values increased steadily up to K = 4 and then plateaued at higher K values. Based on these likelihood estimates, the highest ΔK value occurred at K = 4 (5206.03), indicating that four clusters most likely represent the underlying population structure (Figure S1). At K = 4, populations P1, P2, and P3 each formed distinct clusters (A, B, and C), whereas cluster D included individuals from P4 and P5. Although the ΔK value for K = 5 was substantially lower than that for K = 4 (Figure S1), the K = 5 solution provided complete separation of individuals from all analyzed populations into distinct clusters (A-E; Figure 4).
2.6. Spatial Genetic Structure
The isolation-by-distance analysis yielded a correlation coefficient of r = 0.523, indicating a moderate positive relationship between genetic and geographic distances, but this pattern was not statistically significant (PMantel = 0.220) (Figure S2).
Fine-scale spatial genetic structure (FSGS) was detected in all five D. velebitica populations, although its intensity varied substantially among sites. All populations exhibited significant kinship coefficients in the first distance class [F(1)], with values ranging from 0.017 to 0.068, indicating elevated relatedness among nearby individuals. The regression slopes of kinship on the logarithm of spatial distance (b-log) ranged from −0.028 to −0.009, and the corresponding Sp statistics varied between 0.010 and 0.030. Estimated neighbourhood sizes (Nb) ranged from 33.41 to 105.21. Population P2 showed the strongest spatial genetic structure, characterized by the steepest decline in kinship with distance (b-log = −0.028), the highest Sp value (0.030), and the smallest Nb (33.41). In contrast, P3 exhibited the weakest structure, with the least negative slope (−0.009), the lowest Sp value (0.010), and the largest Nb (105.21). Populations P1 and P5 displayed similarly weak spatial structure (Sp = 0.011) and relatively large neighbourhood sizes (91.02 and 90.42, respectively), whereas P4 showed intermediate values (b-log = −0.017, Sp = 0.018, Nb = 56.39) (Figure 5).
2.7. Chloroplast DNA Sequence Analysis
Sequence analysis of three chloroplast DNA (cpDNA) regions (Table S7) was performed on 50 individuals from all five known populations of D. velebitica. Three different haplotypes were identified. Number of haplotypes per individual (h / n) was 0.060, indicating low haplotypic variation. The unbiased haplotype diversity (Hd) was 0.571, and the nucleotide diversity (π) was 0.00141, revealing very low sequence divergence between individuals. The median-joining haplotype network shows three cpDNA haplotypes (H1, H2, and H3) whereas one haplotype was shared among three populations (P3, P4, P5) while the other two haplotypes were private to P1 and P2, respectively (Figure 6).
3. Discussion
Naturally fragmented mountain ecosystems offer a rare opportunity to study how ecological conditions, demographic processes, and evolutionary history interact to shape the persistence of isolated populations [27]. Unlike species affected by recent anthropogenic habitat fragmentation, many mountain endemics have existed in naturally discontinuous populations for long periods of time. As a result, the isolation observed today is often part of their evolutionary history rather than a consequence of recent habitat loss. Mountain systems are therefore particularly useful for disentangling the effects of long-term natural fragmentation from those associated with contemporary human disturbance. Within this context, Degenia velebitica is a suitable species for such investigations. Its fragmented distribution across the Velebit Mts. and the Liburnian karst, strong habitat specialization, and long-lived perennial life history, all previously documented by Liber et al. [22], provide an opportunity to examine processes operating over both ecological and evolutionary timescales. For us, one of the most interesting aspects of this species is that its populations differ markedly in size, density, and spatial configuration despite occupying broadly similar habitats. By combining demographic surveys with analyses of nuclear microsatellites, chloroplast DNA, fine-scale spatial genetic structure, and effective population size, we aimed to understand how these differences contribute to the maintenance of genetic diversity and long-term population persistence.
The pronounced demographic differences among Degenia populations provide an important context for interpreting the genetic results. Although estimated population area, estimated population size, and plant density were related, each reflected a different aspect of population structure. Tomišina draga (P1), for example, occupied the largest scree system and contained by far the highest number of individuals, yet plant density remained only moderate. This observation suggests that most reproductive interactions probably occur among neighboring plants rather than occurring throughout the population. In contrast, the three Šugarska duliba populations (P3–P5) differed surprisingly strongly in their demographic characteristics despite being separated by relatively short distances. During fieldwork, this contrast was much more pronounced than we initially expected. One possible explanation is that relatively small differences in habitat configuration influence the establishment and survival of individuals more strongly than geographic distance itself. Local ecological and reproductive factors may further contribute to these differences, as variation in pollinator communities and mating systems can influence the maintenance and spatial distribution of genetic diversity within plant populations [28,29]. Given that the floral biology, pollination ecology, and mating system of Degenia velebitica remain largely unknown, our preliminary field observations suggest that these factors may warrant further investigation in near future. However, present-day habitat conditions may not provide the whole explanation. Some of the observed differences could also reflect historical demographic events or differences in colonisation history that are no longer visible in the contemporary landscape. Similar relationships between local habitat conditions and the demographic and historical processes shaping populations have been reported in other naturally fragmented plant species [1,30,31,32]. Rather than treating demographic variation as background noise, our results suggest that it may represent an important factor shaping subsequent genetic patterns.
The analyses of nuclear genetic diversity demonstrated that populations of D. velebitica do not respond uniformly to long-term spatial isolation. Overall microsatellite diversity was moderate and largely consistent with patterns typically reported for long-lived perennial plants [9,33]. At first glance, this result might suggest that natural fragmentation has had little impact on the species' genetic diversity. However, a more detailed analysis revealed considerable differences among populations, highlighting the importance of local demographic and reproductive processes. P1 stood out by possessing the highest allelic richness, the greatest number of private alleles, and a unique chloroplast haplotype. Floristic composition of these stand differs markedly from all the other stands along its distribution range [22]. Together, these findings suggest that this population may have acted as an important long-term reservoir of genetic diversity. Nevertheless, this interpretation should be treated cautiously. The currently high diversity may not solely reflect long-term population stability but could also represent a legacy of historically greater connectivity among populations that has since been lost. An opposite pattern was observed in the Prikinuto brdo population (P2), which exhibited the lowest nuclear genetic diversity, a significant heterozygote deficiency, and the strongest fine-scale spatial genetic structure. These findings indicate limited reproductive connectivity among individuals and increased genetic structure within the population. Interestingly, no clear evidence of a recent severe population bottleneck was detected. This suggests that the current genetic pattern may not result from a single demographic event but rather from the gradual effects of long-term isolation and restricted gene flow. However, alternative explanations, such as unequal reproductive success among individuals or partial self-fertilization, cannot be ruled out. Without more detailed information on the reproductive biology of this population, as well as the other populations, these possibilities remain unresolved. The Šugarska duliba–Krivi kuk population (P3) displayed a different pattern. Despite the naturally isolated habitat, it maintained high heterozygosity and relatively weak fine-scale spatial genetic structure. One possible explanation is that the high local density of plants increases opportunities for pollen transfer among individuals, thereby maintaining effective genetic connectivity within the population. If this interpretation is correct, local demographic conditions may partially mitigate the genetic consequences of long-term fragmentation. This finding further emphasizes that the level of neutral genetic diversity alone may not represent a reliable indicator of the evolutionary resilience of populations. Naturally fragmented mountain endemics may retain substantial neutral genetic variation while simultaneously experiencing localized reductions in reproductive connectivity [1] and evolutionary potential [2,11], underscoring the importance of interpreting genetic diversity within its demographic and ecological context [8].
Estimates of effective population size provided additional insights into processes that were not evident from genetic diversity alone. Because effective population size reflects the genetic contribution of individuals to subsequent generations, it provides a more direct measure of evolutionary potential than estimated population size alone [2,15,34,35]. As expected, effective population size was not necessarily associated with estimated population size or with the observed level of genetic diversity, which may partly reflect differences in reproductive processes among populations. Particularly noteworthy was P4, which exhibited the greatest discrepancy between genetic and demographic indicators. During fieldwork, only 59 individuals were recorded, compared with an estimated 2,916 individuals reported for the same population in the previous population-genetics study [22], consistent with a possible demographic decline. Although the field methods differed between the earlier survey [22] and the present survey, the results of these two independent assessments support the interpretation that the observed difference is consistent with a reduction in population size. At the same time, the estimated habitat area remained comparable between the two studies. Interestingly, this apparent demographic decline has not yet been reflected by an equally strong reduction in nuclear genetic diversity. One possible explanation is the temporal lag between demographic decline and the loss of neutral genetic variation, a phenomenon particularly pronounced in long-lived perennial plants [1,9]. If so, the present genetic diversity may reflect the historical state of the population, whereas effective population size and field observations provide a more realistic picture of its current condition.
The bottleneck signal detected by the M-ratio analysis further highlights potential importance of historical events in shaping present-day populations. Given the well-known climatic history of the Velebit Mts. and Liburnian karst, these signals may be compatible with range reductions and population contractions associated with Quaternary climatic oscillations. However, it should be emphasized that bottleneck detection methods do not allow precise estimation of the timing or magnitude of these events [36]. Consequently, the results should be interpreted as evidence consistent with historical demographic reductions rather than as a direct reconstruction or dating of their dynamics.
Combining different categories of genetic data proved particularly informative. Nuclear microsatellites primarily reflected relatively recent population processes, including mating, pollen-mediated connectivity, and genetic drift [9], whereas chloroplast DNA provided insights into older processes related to seed dispersal and the persistence of maternal lineages [17]. Fine-scale spatial genetic structure linked local dispersal and recruitment and mating processes with the genetic patterns observed within populations [18,32].
When all results are considered together, it becomes evident that different genetic indicators often capture different aspects of the same evolutionary history. P1 combined high nuclear genetic diversity with a unique chloroplast haplotype, consistent with a scenario of long-term persistence under specific local site conditions. In contrast, P3, P4 and P5 shared the same chloroplast lineage but displayed markedly different contemporary demographic and genetic characteristics. Particularly striking was the contrast between populations P3 and P4. Although they likely share a similar history of maternal lineages, they differ substantially in effective population size, genetic diversity, and fine-scale spatial genetic structure. These results clearly demonstrate that historical and contemporary processes do not necessarily leave identical genetic signatures. Rather than providing conflicting information, different datasets reveal distinct temporal layers of population evolutionary history. Similar temporal decoupling between the persistence of historical lineages and contemporary demographic processes has also been documented in other mountain plant species that survived Quaternary climatic oscillations within naturally fragmented refugial landscapes [3,5,6,17].
Our findings therefore indicate that the evolutionary resilience of naturally fragmented mountain endemics cannot be assessed using a single genetic parameter. Neither genetic diversity, effective population size, nor demographic indicators alone provide a complete picture of population status. This is particularly well illustrated by population P4, where field observations suggested an apparent recent demographic decline, while nuclear genetic diversity remained relatively well preserved. Studies of other narrowly distributed plant species similarly suggest that demographic and ecological factors, including population size, reproductive processes, and plant–pollinator interactions, may interact in shaping patterns of genetic variation and population differentiation [37]. These findings reinforce the importance of simultaneously considering demographic, ecological, and genetic indicators. Their integration provides a more comprehensive understanding of the processes shaping the long-term persistence of populations. Degenia velebitica thus represents a valuable model system for demonstrating how an integrative approach can provide a robust basis for assessing evolutionary potential and informing the conservation of naturally fragmented mountain endemics.
Future research should build on this integrative framework by combining more detailed genomic analyses with direct studies of reproductive biology and long-term demographic monitoring. Genome-wide markers could provide finer resolution of contemporary gene flow, relatedness, and potentially adaptive genetic variation, while studies of the mating system, pollen dispersal, reproductive success, and plant–pollinator interactions would help clarify the mechanisms underlying the contrasting fine-scale genetic patterns observed among populations. Repeated demographic surveys will be particularly important for determining whether the apparent decline observed in some populations, especially P4, represents a continuing trend or temporal fluctuation. Where feasible, field monitoring could be complemented by high-resolution UAV imagery and other remote-sensing approaches to track changes in habitat extent, vegetation structure, and population spatial configuration through time. Integrating these approaches would allow future studies to distinguish more clearly between historical genetic legacies and ongoing ecological and reproductive processes, while also providing a stronger basis for the long-term monitoring and conservation of Degenia velebitica.
Implications for Conservation
Our results indicate that conservation of Degenia velebitica should focus on maintaining the existing network of populations and the ecological integrity of their limestone scree habitats. Because the fragmented distribution of the species appears to reflect a long history of natural habitat discontinuity rather than recent anthropogenic fragmentation, the genetic and demographic differences among populations should be regarded as potentially important components of the species' evolutionary legacy [3,5,6]. Conservation assessments should therefore not rely on neutral genetic diversity alone, as moderate genetic diversity may persist even in populations characterized by low effective population size or restricted reproductive connectivity [2,11].
The populations examined here differ in their potential conservation significance and vulnerability. P1 represents an important reservoir of genetic variation, combining the largest population size with the highest allelic richness, the greatest number of private alleles, and a unique chloroplast haplotype. The populations within the Šugarska duliba locality (P3–P5), despite their geographic proximity and shared chloroplast lineage, differ markedly in their demographic and contemporary genetic characteristics and should therefore be maintained as complementary components of the species' population structure. Particular attention should be given to P4, where the pronounced reduction in census size suggested by the comparison of previous and present surveys, together with low effective population size, indicates the need for continued conservation monitoring.
Conservation actions should primarily aim to maintain populations in situ and preserve the habitat conditions that support their natural demographic and reproductive processes. Interventions that artificially increase gene flow among historically isolated populations, including translocations or population reinforcement using material from other populations, should be approached cautiously because they may alter existing patterns of genetic differentiation [2]. Where such interventions become necessary, the choice of source material should consider the genetic composition and demographic characteristics of both source and recipient populations. The number and spatial arrangement of introduced individuals should also be carefully considered, given that planting density can influence establishment, reproductive interactions, pollen transfer, and recruitment [38], and that translocation studies in other plant species have shown that sufficiently large founding populations and appropriate planting densities can improve establishment and reproductive success [39]. However, the present data do not allow species-specific recommendations for the number, density, or spatial arrangement of individuals used in translocation or population reinforcement of D. velebitica. Until these parameters can be evaluated specifically for the species, maintaining the integrity of existing populations and their habitats represents the most appropriate strategy for preserving its evolutionary potential.
4. Materials and Methods
4.1. Sampling of the Plant Material
In this study we sampled the individuals from all three known localities of Degenia velebitica; Tomišina draga (P1) located in the Liburnian karst, Prikinuto brdo (P2) and Šugarska duliba (with three spatially isolated populations Krivi kuk (P3), Krug (P4) and Pavanovka (P5)) from the Mt. Velebit (Table 1). The sampling of plant material was conducted under permit issued by the Ministry of Environmental Protection and Nature of the Republic of Croatia.(Class: UP/I-612-07/15-48/147, No.: 517-07-1-1-1-16-4). Voucher specimens are deposited at the ZA – Herbarium Croaticum (Herbarium IDs: 5396, 5397, 27946 and 44429; available at: https://herbariumcroaticum.biol.pmf.hr/) and Herbarium ZAGR (Herbarium ID: 32939; available at: https://herbarium.agr.hr/index.html).
A plot-based sampling design was employed to survey all study populations [40]. In each population, five square sampling plots (5 × 5 m; 25 m²) were established, except in population P4 Šugarska duliba–Krug, where three plots were established due to site constraints. Within each plot, every individual plant was recorded, and its spatial position was mapped using planar coordinates in the Croatian Terrestrial Reference System (HTRS96/TM). For each individual, the plot identifier, individual identifier, and planar coordinates (X and Y) were documented.
4.2. Population Density and Estimation of the Population Area and Size
Population density was calculated separately for each sampling plot as the number of individuals divided by the plot area (25 m²). Mean population density was calculated as the arithmetic mean of the densities obtained from the five plots [41,42]. Variability among plots was described using the standard deviation (SD), standard error of the mean (SE), coefficient of variation (CV), and the 95% confidence interval of the mean density. In population P4 Šugarska duliba–Krug, all existing plants were sampled and genotyped, allowing a complete census of individuals. Consequently, population density was calculated by dividing the estimated population area by the total population size (Table 1).
The population area was estimated by the spatial arrangement of the sampling plots, which were established to cover both the central and peripheral parts of the entire population. The geometric centres (centroids) of the plots were estimated from the mean coordinates of all mapped individuals within each plot. A convex polygon connecting the centroids of the peripheral plots was constructed to approximate the outer configuration of the population [43]. Because the centroids are located near the centres of 5 × 5 m plots rather than at the actual population boundary, the polygon was expanded outward by 2.5 m (half the plot width) to account for the distance between the plot centers and the presumed population margin. The resulting buffered polygon was considered an approximation of the occupied population area. This approach provides an estimate of population extent and should therefore be interpreted as an approximation rather than a direct field measurement (Table 1).
The total population size was estimated by multiplying the estimated population area by the mean plant density obtained from the five sampling plots. Uncertainty associated with the density estimate was quantified using the 95% confidence interval [42], which was subsequently propagated to provide confidence limits for the estimated population size (Table 1). These estimates should be interpreted as approximations because spatial heterogeneity in plant density across scree habitats may introduce additional uncertainty beyond that rep-resented by the calculated confidence intervals.
4.3. DNA Extraction and Microsatellite Analysis
This total genomic DNA was isolated from 25 mg of silica-dried plant leaf tissue using DNeasy® Plant Mini Kit (Qiagen GmbH, Hilden, Germany). Microsatellite analysis was based on 10 microsatellite loci [44]. Microsatellite alleles were amplified using a PCR protocol with an initial touchdown cycle (94 °C for 5 minutes; 5 cycles of 45 seconds at 94 °C, 30 seconds at 60 °C lowered by 1 °C at each cycle, and 90 seconds at 72 °C; 25 cycles of 45 seconds at 94 °C, 30 seconds at 55 °C, and 90 seconds at 72 °C; and 8-minute extension step at 72 °C). The 20 µl PCR reaction mixture contained 0.25 µM of each primer (forward primers labeled with FAM, NED, VIC, or PET fluorescent dyes and unlabeled reverse primers), 1× PCR buffer, 1.5 mM MgCl₂, 200 µM of each dNTP, 0.5 U Taq™ HS DNA Polymerase (TaKaRa™ Bio Inc., Kusatsu, Japan), and 5 ng of template DNA. Fluorescently labeled PCR products were detected on an ABI 3730XL (Applied Biosystems™, Foster City, California, USA) using the Fragment Analysis service (Macrogen Europe, Amsterdam). The allele sizes of the PCR products were estimated using the GeneMapper 4.0 software (Applied Biosystems™, Foster City, California, USA).
4.4. Chloroplast DNA
The PCR primers and conditions for amplification of the cpDNA regions rpl32-trnL(UAG) and trnS(GCU)-trnG(UUC) were the same as in [45]. For PCR amplification of the psbZ-trnfM chloroplast region, 20 μl of the PCR reaction mixture contained 0.25 µM forward (CTTCTTGGTGGTATCCTTA) and reverse primers (CATAACCTTGAGGTCACGG), 1 x PCR buffer, 1.5 mM MgCl2, 200 µM each dNTP, 0.5 U Taq™ HS DNA Polymerase (TaKaRa™ Bio Inc, Kusatsu, Japan) and 5 ng of template DNA. The PCR conditions were: 3 min at 94 °C, followed by 35 cycles of 1 min at 94 °C, 50 s at 55 °C, 2 min at 72 °C, followed by a final 10-min extension step at 72 °C. All PCR reactions were performed using the ProflexTM PCR System (Thermo Fisher Scientific Inc., Waltham, MA, USA). PCR products were purified prior to sequencing with exonuclease I and thermosensitive alkaline phosphatase (Thermo Scientific™, Thermo Fisher Scientific, Waltham, MA, USA) according to the procedure described by Werle et al. [46]. The PCR products were bidirectionally sequenced by Macrogen Europe BV (Amsterdam, The Netherlands) using an ABI 3730XL DNA Analyzer (Applied Biosystems™, Foster City, California, USA).
4.5. Data analysis
4.5.1. Microsatellite Diversity
For each microsatellite locus, we calculated the total number of alleles (Na), the polymorphic information content (PIC) and the probability of identity (PI) in Cervus v. 3.0 [47]. In each population, the presence of null alleles and scoring errors was checked in Micro-Checker v. 2.2.3 [48] and the frequencies of null alleles were estimated in FreeNA [49] using the expectation-maximization algorithm.
4.5.2. Within-Population Diversity
The average number of alleles (Nav), allelic richness (Nar), number of private alleles (Npr) and private allelic richness (Npar) were determined in each population using HP-Rare v. 1.0 [50]). Observed heterozygosity (HO), expected heterozygosity (HE) and inbreeding coefficient (FIS) were calculated in Genepop v. 4.7 [51]. Genepop was also used to test for deviations from Hardy-Weinberg equilibrium (HWE) in each population. The significance level was adjusted after sequential Bonferroni corrections for multiple testing using SAS v. 9.4 (SAS Institute Inc., Cary, NC, USA).
The values of expected heterozygosity [HE(null)] were also calculated by adjusting the allele frequencies for the presence of null alleles in FreeNA. The Wilcoxon Signed-Rank Test in SAS was used to compare them with the original values. Population P2, which showed a significant deviation from HWE, was further analyzed to determine whether the reason for the deviation from HWE was the result of null alleles or inbreeding. Therefore, we applied a Bayesian approach (individual inbreeding model; IIM) to simultaneously estimate the effects of null alleles and inbreeding using INEST v. 2.2 [52]. We compared the full model ('nfb'), which includes the effects of inbreeding and genotypic failures (FIS > 0), with a random model ('nb') that assumes the presence of null alleles and genotypic failures (FIS = 0).
Evidence of past and current genetic bottlenecks in populations of Degenia velebitica was examined using the M-ratio test [36] and the heterozygosity excess test [53], respectively, in INEST. The M-ratio was calculated as the average ratio between the total number of alleles (k) and the total allele size range (r) in each population. For the heterozygosity excess test, we applied the two-phase model (TMP) with the proportion of multistep mutations of pg = 0.22 and the average multistep mutation size of δg = 0.31, as recommended by Peery et al. [54]
The contemporary effective population size (Ne) of each Degenia velebitica population was estimated using NeEstimator v. 2.1 [55]. We used the bias-corrected method based on linkage disequilibrium [56], following the random mating model with a critical allele frequency value of Pcrit = 0.02, as suggested by Waples & Do [57] for sample sizes larger than 25. 95% confidence intervals were determined by jackknifing across individuals.
4.5.3. Population Differentiation and Structure
The genetic differentiation between the populations of Degenia velebitica was estimated by calculating the FST values and the corresponding P values (after 10,000 permutations) in FSTAT v. 2.9.3.2 [58]. The pairwise FST values were also calculated using the ENA correction method [Excluding Null Alleles; FST (null)] in FreeNA and compared with the original values using the Wilcoxon Signed-Rank Test in SAS.
The partitioning of total microsatellite diversity between and within Degenia velebitica populations was performed using the Analysis of molecular variance (AMOVA; [59]) in ARLEQUIN v. 3.5.2.2 [60]. The significance level of the parameter φST was determined after 10,000 permutations.
The genetic relationships among the individual plants of Degenia velebitica belonging to five populations were graphically represented using factorial correspondence analysis (FCA) in GENETIX v. 4.05 [61].
The genetic structure of the D. velebitica populations was derived in STRUCTURE [62] by performing 30 runs for each K (number of clusters) from 1 to 11. For each run, a burn-in period of 200,000 steps followed by 1,000,000 Monte Carlo Markov Chain (MCMC) steps was specified, assuming an admixture model and correlated frequencies. The calculations were performed on the Padobran computer cluster at the University of Zagreb (Croatia), University Computing Center (SRCE). The optimal number of clusters was determined by calculating an ad hoc ΔK statistic [63] using the web-based software StructureSelector [64], which also allows clustering and merging of the resulting runs according to the CLUMPAK method described in Kopelman et al. [65].
4.5.4. Spatial Genetic Structure
Isolation by distance (IBD) was evaluated following the method of Rousset [66], by calculating the correlation between two matrices: the natural logarithm of geographic distances (in kilometers) and the pairwise FST/(1 ‒ FST) ratios among populations. Statistical significance was assessed using a Mantel test with 10,000 permutations, performed in NTSYS-pc v. 2.21L [67].
Fine-scale genetic structure within each population was analyzed using spatial autocorrelation in SpaGeDi v. 1.5a [19]. For this purpose, a multi-locus kinship coefficient, Fij [68], was calculated for all pairs of individuals and then averaged within ten spatial distance classes. The distance classes were defined such that the number of pairwise comparisons within each class was approximately constant. Pairwise kinship coefficients were regressed against the logarithm of pairwise spatial distances, and the significance of the regression was assessed using 10,000 random permutations of individual locations. The Sp statistic, describing the intensity of spatial genetic structure, and the neighborhood size (Nb) were subsequently estimated based on the regression slope (b-log) and the mean kinship coefficient of individuals in the first distance class (F(1)), following the approach of Vekemans & Hardy [18].
4.5.5. Chloroplast DNA Data Analysis
The DNA sequences were aligned using MUSCLE [69], implemented through the European Bioinformatics Institute web server [70], and, where necessary, manually edited in BioEdit v. 7.2 [71]. Insertions or deletions (indels) in the cpDNA were treated as substitutions (single events) [72]. Haplotype diversity within populations was quantified by calculating the number of haplotypes (h), the number of haplotypes per number of individuals (h/n), the number of private haplotypes (hpr), unbiased haplotype diversity (Hd; [73]) and nucleotide diversity (π; [74]) using Arlequin v. 3.5.2.2 [60]. Arlequin was also used to calculate the interhaplotype distance matrix. The median-joining haplotype network was created using PopART v. 1.7 [75].
5. Conclusions
This study demonstrates that understanding evolutionary resilience in naturally fragmented mountain endemics requires integrating demographic, ecological, and genetic information across multiple temporal scales. By combining nuclear microsatellites, chloroplast DNA, effective population size, fine-scale spatial genetic structure, and demographic data, we show that moderate neutral genetic diversity can persist despite long-term natural isolation, patterns consistent with restricted contemporary gene flow, limited historical seed dispersal, and small effective population sizes. Consequently, neutral genetic diversity alone may provide an incomplete picture of population status and long-term evolutionary potential.
Demographic and genetic indicators captured complementary and sometimes temporally decoupled aspects of population persistence. This was particularly evident in P4, where an apparent recent demographic decline and low effective population size coexist with relatively well-preserved nuclear genetic diversity. More generally, contrasting patterns among populations indicate that local demographic and reproductive processes may modify the genetic consequences of long-term fragmentation. These findings support conservation strategies that prioritize the in-situ maintenance of the existing population network and the ecological integrity of limestone scree habitats, with particular attention to populations showing demographic decline or low effective population size. Interventions that could alter the genetic structure of historically differentiated populations should therefore be approached cautiously.
Future research should complement this framework with genome-wide analyses, direct studies of mating systems, pollen dispersal and plant–pollinator interactions, and repeated demographic surveys. Long-term field monitoring, potentially supported by high-resolution UAV imagery and other remote-sensing approaches, could help determine whether observed demographic changes represent continuing trends or temporal fluctuations. Integrating these approaches should improve our ability to distinguish historical genetic legacies from ongoing demographic and reproductive processes and provide a stronger basis for the long-term conservation of Degenia velebitica and other naturally fragmented mountain endemics.
Supplementary Materials
The following supporting information can be downloaded at the website of this paper posted on Preprints.org. Table S1: Informativeness of 10 SSR markers used in molecular analyses of five Degenia velebitica populations; Table S2: Null allele frequencies across 10 microsatellite loci in 5 Degenia velebitica populations estimated using FreeNA; Table S3: Detection of recent (heterozygosity-excess test) and historacal bottlenecks (M-ratio test) using 10 microsatellite loci in 5 D. velebitica populations; Table S4: Genetic differentiation among five natural D. velebitica populations: pairwise FST values (lower diagonal) and corresponding P-values (upper diagonal); Table S5: Pairwise FST(null) values among 5 D. velebitica populations, estimated using ENA (Excluding Null Alleles); Table S6: Analysis of molecular variance for the partitioning of microsatellite diversity; Table S7: GenBank accession numbers for the three chloroplast DNA regions; Figure S1: The choice of the most likely number of clusters (K) inferred from SSR analysis of 5 D. velebitica populations using STRUCTURE: ln P(X|K) values and ΔK values for each K; Figure S2: Isolation by distance (IBD) in Degenia velebitica populations.
Author Contributions
Conceptualization, Z.L. and Z.Š.; methodology, Z.L., Z.Š., B.S., T.N. and F.V.; software, Z.L., Z.Š. and F.V.; validation, Z.L. and Z.Š.; formal analysis, Z.L., Z.Š. and M.G.; investigation, Z.L., Z.Š., B.S. and T.N.; resources, Z.L., Z.Š., B.S. and T.N.; data curation, Z.L. and Z.Š.; writing—original draft preparation, M.G, Z.L. and Z.Š.; writing—review and editing Z.L., Z.Š., B.S., T.N., F.V and M.G.; visualization, F.V.; supervision, Z.L. and Z.Š.; project administration, Z.L. and M.G.; funding acquisition, Z.L. and M.G. All authors have read and agreed to the published version of the manuscript.
Funding
The research and the APC were funded by the Intervention 70.05. 'Support for the Conservation, Sustainable use and Development of Genetic Resources in Agriculture for Plant Genetic Resources', under the Strategic Plan of the Common Agricultural Policy of the Republic of Croatia 2023 – 2027.
Data Availability Statement
The data presented in this study are available on request from all authors.
Conflicts of Interest
The authors declare no conflicts of interest.
References
- Aguilar, R.; Quesada, M.; Ashworth, L.; Herrerias-Diego, Y.; Lobo, J. Genetic consequences of habitat fragmentation in plant populations: susceptible signals in plant traits and methodological approaches. Mol. Ecol. 2008, 17, 5177–5188. [Google Scholar] [CrossRef] [PubMed]
- Frankham, R.; Ballou, J.D.; Ralls, K.; Eldridge, M.; Dudash, M.R.; Fenster, C.B.; Lacy, R.C.; Sunnucks, P. Genetic Management of Fragmented Animal and Plant Populations; Oxford University Press: Oxford, UK, 2017; ISBN 0198783396. [Google Scholar]
- Hewitt, G. The genetic legacy of the Quaternary ice ages. Nat. 2000 4056789 2000, 405, 907–913. [Google Scholar] [CrossRef] [PubMed]
- Schmitt, T. Biogeographical and evolutionary importance of the European high mountain systems. Front. Zool. 2009, 6, 9. [Google Scholar] [CrossRef]
- Hughes, C.E.; Atchison, G.W. The ubiquity of alpine plant radiations: from the Andes to the Hengduan Mountains. New Phytol. 2015, 207, 275–282. [Google Scholar] [CrossRef] [PubMed]
- Comes, H.P.; Kadereit, J.W. The effect of quaternary climatic changes on plant distribution and evolution. Trends Plant Sci. 1998, 3, 432–438. [Google Scholar] [CrossRef]
- Médail, F.; Diadema, K. Glacial refugia influence plant diversity patterns in the Mediterranean Basin. J. Biogeogr. 2009, 36, 1333–1345. [Google Scholar] [CrossRef]
- Freeman, B.G.; Flantua, S.G.A.; Feeley, K.J.; McCain, C.M.; McGuire, J.L. The fate of mountain biodiversity in a warming world. Nat. Rev. Biodivers. 2026 27 2026, 2, 441–456. [Google Scholar] [CrossRef]
- Nybom, H. Comparison of different nuclear DNA markers for estimating intraspecific genetic diversity in plants. Mol. Ecol. 2004, 13, 1143–1155. [Google Scholar] [CrossRef] [PubMed]
- Hoban, S.; Bruford, M.; D’Urban Jackson, J.; Lopes-Fernandes, M.; Heuertz, M.; Hohenlohe, P.A.; Paz-Vinas, I.; Sjögren-Gulve, P.; Segelbacher, G.; Vernesi, C.; et al. Genetic diversity targets and indicators in the CBD post-2020 Global Biodiversity Framework must be improved. Biol. Conserv. 2020, 248. [Google Scholar] [CrossRef]
- Chung, M.Y.; Merilä, J.; Li, J.; Mao, K.; López-Pujol, J.; Tsumura, Y.; Chung, M.G. Neutral and adaptive genetic diversity in plants: An overview. Front. Ecol. Evol. 2023, 11, 1116814. [Google Scholar] [CrossRef]
- Glémin, S.; Bazin, E.; Charlesworth, D. Impact of mating systems on patterns of sequence polymorphism in flowering plants. Proc. R. Soc. B Biol. Sci. 2006, 273, 3011. [Google Scholar] [CrossRef] [PubMed]
- Whitehead, M.R.; Lanfear, R.; Mitchell, R.J.; Karron, J.D. Plant mating systems often vary widely among populations. Front. Ecol. Evol. 2018, 6, 317406. [Google Scholar] [CrossRef]
- Segelbacher, G.; Bosse, M.; Burger, P.; Galbusera, P.; Godoy, J.A.; Helsen, P.; Hvilsom, C.; Iacolina, L.; Kahric, A.; Manfrin, C.; et al. New developments in the field of genomic technologies and their relevance to conservation management. Conserv. Genet. 2021 232 2021, 23, 217–242. [Google Scholar] [CrossRef]
- Waples, R.S. Practical application of the linkage disequilibrium method for estimating contemporary effective population size: A review. Mol. Ecol. Resour. 2024, 24. [Google Scholar] [CrossRef] [PubMed]
- Selkoe, K.A.; Toonen, R.J. Microsatellites for ecologists: a practical guide to using and evaluating microsatellite markers. Ecol. Lett. 2006, 9, 615–629. [Google Scholar] [CrossRef] [PubMed]
- Petit, R.J.; Duminil, J.; Fineschi, S.; Hampe, A.; Salvini, D.; Vendramin, G.G. Comparative organization of chloroplast, mitochondrial and nuclear diversity in plant populations. Mol. Ecol. 2005, 14, 689–701. [Google Scholar] [CrossRef] [PubMed]
- Vekemans, X.; Hardy, O.J. New insights from fine-scale spatial genetic structure analyses in plant populations. Mol. Ecol. 2004, 13, 921–935. [Google Scholar] [CrossRef] [PubMed]
- Hardy, O.J.; Vekemans, X. SPAGeDi: A versatile computer program to analyse spatial genetic structure at the individual or population levels. Mol. Ecol. Notes 2002, 2, 618–620. [Google Scholar] [CrossRef]
- Horvat, I. Vegetacijske studije o hrvatskim planinama. II. Zadruge na planinskim stijenama i točilima. Jugoslavenska Akad. Znan. i Umjet. 1931, 241, 147–206. [Google Scholar]
- Kušan, F. Über die Lebensverhältnisse der endemischen Art Degenia velebitica (Deg.) Hay. auf dem Velebit in Kroatien. Informationes 1963, 2, 21–25. [Google Scholar]
- Liber, Z.; Surina, B.; Nikolić, T.; Škrtić, D.; Šatović, Z. Spatial distribution, niche ecology and conservation genetics of Degenia velebitica (Brassicaceae), a narrow endemic species of the north-western Dinaric Alps. Plant Syst. Evol. 2020 3064 2020, 306, 1–19. [Google Scholar] [CrossRef]
- Collard, B.C.Y.; Jahufer, M.Z.Z.; Brouwer, J.B.; Pang, E.C.K. An introduction to markers, quantitative trait loci (QTL) mapping and marker-assisted selection for crop improvement: The basic concepts. Euphytica 2005 1421 2005, 142, 169–196. [Google Scholar] [CrossRef]
- Meudt, H.M.; Clarke, A.C. Almost Forgotten or Latest Practice? AFLP applications, analyses and advances. Trends Plant Sci. 2007, 12, 106–117. [Google Scholar] [CrossRef] [PubMed]
- Vieira, M.L.C.; Santini, L.; Diniz, A.L.; Munhoz, C. de F. Microsatellite markers: what they mean and why they are so useful. Genet. Mol. Biol. 2016, 39, 312. [Google Scholar] [CrossRef] [PubMed]
- Hildebrand, C.E.; Torney, D.C.; Wagner, R.P. Informativeness of Polymorphic DNA Markers. Los. Alamos Sci. 1992, 20, 100–102. [Google Scholar]
- Love, S.J.; Schweitzer, J.A.; Woolbright, S.A.; Bailey, J.K. Sky Islands Are a Global Tool for Predicting the Ecological and Evolutionary Consequences of Climate Change. Annu. Rev. Ecol. Evol. Syst. 2023, 54, 219–236. [Google Scholar] [CrossRef]
- Loveless, M.D.; Hamrick, J.L. Ecological determinants of genetic structure in plant populations. Annu. Rev. Ecol. Syst. 1984, 15, 65–95. [Google Scholar] [CrossRef]
- Segarra-Moragues, J.G.; Carrión Marco, Y.; Castellanos, M.C.; Molina, M.J.; García-Fayos, P. Ecological and historical determinants of population genetic structure and diversity in the Mediterranean shrub Rosmarinus officinalis (Lamiaceae). Bot. J. Linn. Soc. 2016, 180, 50–63. [Google Scholar] [CrossRef]
- Honnay, O.; Jacquemyn, H. Susceptibility of common and rare plant species to the genetic consequences of habitat fragmentation. Conserv. Biol. 2007, 21, 823–831. [Google Scholar] [CrossRef] [PubMed]
- López-Delgado, J.; Meirmans, P.G. History or demography? Determining the drivers of genetic variation in North American plants. Mol. Ecol. 2021, 31, 1951. [Google Scholar] [CrossRef] [PubMed]
- Miguel-Peñaloza, A.; Cultid-Medina, C.A.; Pérez-Alquicira, J.; Rico, Y. Do habitat fragmentation and degradation influence the strength of fine-scale spatial genetic structure in plants? A global meta-analysis. AoB Plants 2023, 15, 1–12. [Google Scholar] [CrossRef] [PubMed]
- Hamrick, J.L.; Godt, M.J.W. Effects of life history traits on genetic diversity in plant species. Philos. Trans. R. Soc. Lond. B Biol. Sci. 1996, 351, 1291–1298. [Google Scholar] [CrossRef]
- Palstra, F.P.; Ruzzante, D.E. Genetic estimates of contemporary effective population size: what can they tell us about the importance of genetic stochasticity for wild population persistence? Mol. Ecol. 2008, 17, 3428–3447. [Google Scholar] [CrossRef] [PubMed]
- Waples, R.S. What Is Ne, Anyway? J. Hered. 2022, 113, 371–379. [Google Scholar] [CrossRef] [PubMed]
- Garza, J.C.; Williamson, E.G. Detection of reduction in population size using data from microsatellite loci. Mol. Ecol. 2001, 10, 305–318. [Google Scholar] [CrossRef] [PubMed]
- Surina, B.; Balant, M.; Glasnović, P.; Gogala, A.; Fišer, Ž.; Satovic, Z.; Liber, Z.; Radosavljević, I.; Classen-Bockhoff, R. Lack of pollinators selects for increased selfing, restricted gene flow and resource allocation in the rare Mediterranean sage Salvia brachyodon. Sci. Rep. 2024 141 2024, 14, 5017. [Google Scholar] [CrossRef] [PubMed]
- Bellis, J.; Osazuwa-Peters, O.; Maschinski, J.; Keir, M.J.; Parsons, E.W.; Kaye, T.N.; Kunz, M.; Possley, J.; Menges, E.; Smith, S.A.; et al. Identifying predictors of translocation success in rare plant species. Conserv. Biol. 2024, 38. [Google Scholar] [CrossRef] [PubMed]
- Silcock, J.L.; Simmons, C.L.; Monks, L.; Dillon, R.; Reiter, N.; Jusaitis, M.; Vesk, P.A.; Byrne, M.; Coates, D.J. Threatened plant translocation in Australia: A review. Biol. Conserv. 2019, 236, 211–222. [Google Scholar] [CrossRef]
- Keith, D.A. Sampling designs, field techniques and analytical methods for systematic plant population surveys. Ecol. Manag. Restor. 2000, 1, 125–139. [Google Scholar] [CrossRef]
- Rice, E.L. A Statistical Method for Determining Quadrat Size and Adequacy of Sampling. Ecology 1967, 48, 1047–1049. [Google Scholar] [CrossRef]
- Bonham, C.D. Measurements for Terrestrial Vegetation: Second Edition. Meas. Terr. Veg. Second Ed. 2013, 1–246. [Google Scholar] [CrossRef]
- Sheth, S.N.; Morueta-Holme, N.; Angert, A.L. Determinants of geographic range size in plants. New Phytol. 2020, 226, 650–665. [Google Scholar] [CrossRef] [PubMed]
- Radosavljević, I.; Satovic, Z.; Jakse, J.; Javornik, B.; Greguraš, D.; Jug-Dujaković, M.; Liber, Z. Development of new microsatellite markers for Salvia officinalis L. and its potential use in conservation-genetic studies of narrow endemic Salvia brachyodon Vandas. Int. J. Mol. Sci. 2012, 13, 12082–12093. [Google Scholar] [CrossRef] [PubMed]
- Shaw, J.; Lickey, E.B.; Schilling, E.E.; Small, R.L. Comparison of whole chloroplast genome sequences to choose noncoding regions for phylogenetic studies in angiosperms: the tortoise and the hare III. Am. J. Bot. 2007, 94, 275–288. [Google Scholar] [CrossRef] [PubMed]
- Werle, E.; Schneider, C.; Renner, M.; Völker, M.; Fiehn, W. Convenient single-step, one tube purification of PCR products for direct sequencing. Nucleic Acids Res. 1994, 22, 4354–4355. [Google Scholar] [CrossRef] [PubMed]
- Kalinowski, S.T.; Taper, M.L.; Marshall, T.C. Revising how the computer program CERVUS accommodates genotyping error increases success in paternity assignment. Mol. Ecol. 2007, 16, 1099–1106. [Google Scholar] [CrossRef] [PubMed]
- van Oosterhout, C.; Hutchinson, W.F.; Wills, D.P.M.; Shipely, P. micro-checker: software for identifying and correcting genotyping errors in microsatellite data. Mol. Ecol. Notes 2004, 4, 535–538. [Google Scholar] [CrossRef]
- Chapuis, M.P.; Estoup, A. Microsatellite null alleles and estimation of population differentiation. Mol. Biol. Evol. 2007, 24, 621–631. [Google Scholar] [CrossRef] [PubMed]
- Kalinowski, S.T. HP-RARE 1.0: A computer program for performing rarefaction on measures of allelic richness. Mol. Ecol. Notes 2005, 5, 187–189. [Google Scholar] [CrossRef]
- Rousset, F. Genetic differentiation and estimation of gene flow from F-statistics under isolation by distance. Genetics 1997, 145, 1219–1228. [Google Scholar] [CrossRef] [PubMed]
- Chybicki, I.J.; Burczyk, J. Simultaneous Estimation of Null Alleles and Inbreeding Coefficients. J. Hered. 2009, 100, 106–113. [Google Scholar] [CrossRef] [PubMed]
- Cornuet, J.M.; Luikart, G. Description and power analysis of two tests for detecting recent population bottlenecks from allele frequency data. Genetics 1996, 144, 2001–2014. [Google Scholar] [CrossRef] [PubMed]
- Peery, Z.M.; Kirby, R.; Reid, B.N.; Stoelting, R.; Doucet-Bëer, E.; Robinson, S.; Vásquez-Carrillo, C.; Pauli, J.N.; Palsboll, P.J. Reliability of genetic bottleneck tests for detecting recent population declines. Mol. Ecol. 2012, 21, 3403–3418. [Google Scholar] [CrossRef] [PubMed]
- Do, C.; Waples, R.S.; Peel, D.; Macbeth, G.M.; Tillett, B.J.; Ovenden, J.R. NeEstimator v2: re-implementation of software for the estimation of contemporary effective population size (Ne ) from genetic data. Mol. Ecol. Resour. 2014, 14, 209–214. [Google Scholar] [CrossRef] [PubMed]
- Waples, R.S. A bias correction for estimates of effective population size based on linkage disequilibrium at unlinked gene loci. Conserv. Genet. 2006, 7, 167–184. [Google Scholar] [CrossRef]
- Waples, R.S.; Do, C. Linkage disequilibrium estimates of contemporary N e using highly variable genetic markers: a largely untapped resource for applied conservation and evolution. Evol. Appl. 2010, 3, 244–262. [Google Scholar] [CrossRef] [PubMed]
- Goudet, J. FSTAT, Version 2.9.4. A program to estimate and test gene diversities and fixation indices 2002. [PubMed]
- Excoffier, L.; Smouse, P.E.; Quattro, J.M. Analysis of Molecular Variance Inferred From Metric Distances Among DNA Haplotypes: Application to Human Mitochondrial DNA Restriction Data. Genetics 1992, 131, 479–491. [Google Scholar] [CrossRef] [PubMed]
- Excoffier, L.; Lischer, H.E.L. Arlequin suite ver 3.5: A new series of programs to perform population genetics analyses under Linux and Windows. Mol. Ecol. Resour. 2010, 10, 564–567. [Google Scholar] [CrossRef] [PubMed]
- Belkhir, K.; Borsa, P.; Chikhi, L.; Raufaste, N.C.F. GENETIX 4.05 Population genetics software for WindowsTM. 2004. [Google Scholar]
- Pritchard, J.K.; Stephens, M.; Donnelly, P. Inference of population structure using multilocus genotype data. Genetics 2000, 155, 945–959. [Google Scholar] [CrossRef] [PubMed]
- Evanno, G.; Regnaut, S.; Goudet, J. Detecting the number of clusters of individuals using the software STRUCTURE: a simulation study. Mol. Ecol. 2005, 14, 2611–2620. [Google Scholar] [CrossRef] [PubMed]
- Li, Y.L.; Liu, J.X. StructureSelector: A web-based software to select and visualize the optimal number of clusters using multiple methods. Mol. Ecol. Resour. 2018, 18, 176–177. [Google Scholar] [CrossRef] [PubMed]
- Kopelman, N.M.; Mayzel, J.; Jakobsson, M.; Rosenberg, N.A.; Mayrose, I. Clumpak: a program for identifying clustering modes and packaging population structure inferences across K. Mol. Ecol. Resour. 2015, 15, 1179–1191. [Google Scholar] [CrossRef] [PubMed]
- Rousset, F. genepop’007: a complete re-implementation of the genepop software for Windows and Linux. Mol. Ecol. Resour. 2008, 8, 103–106. [Google Scholar] [CrossRef] [PubMed]
- Rohlf, F.J. NTSYS-pc: Numerical Taxonomy and Multivariate Analysis System, version 2.2. 2009. [Google Scholar] [PubMed]
- Loiselle, B.A.; Sork, V.L.; Nason, J.; Graham, C. Spatial genetic structure of a tropical understory shrub, Psychotria officinalis (Rubiaceae). Am. J. Bot. 1995, 82, 1420–1425. [Google Scholar] [CrossRef]
- Edgar, R.C. MUSCLE: multiple sequence alignment with high accuracy and high throughput. Nucleic Acids Res. 2004, 32, 1792–1797. [Google Scholar] [CrossRef] [PubMed]
- Madeira, F.; Madhusoodanan, N.; Lee, J.; Eusebi, A.; Niewielska, A.; Tivey, A.R.N.; Lopez, R.; Butcher, S. The EMBL-EBI Job Dispatcher sequence analysis tools framework in 2024. Nucleic Acids Res. 2024, 52, W521–W525. [Google Scholar] [CrossRef] [PubMed]
- Hall, T.A. BioEdit: A User-Friendly Biological Sequence Alignment Editor and Analysis Program for Windows 95/98/NT. 1999, 95–98. [Google Scholar] [PubMed]
- Caicedo, A.L.; Schaal, B.A. Population structure and phylogeography of Solanum pimpinellifolium inferred from a nuclear gene. Mol. Ecol. 2004, 13, 1871–1882. [Google Scholar] [CrossRef] [PubMed]
- Nei, M. Molecular Evolutionary Genetics; Columbia University Press: New York, NY, USA, 1987. [Google Scholar]
- Nei, M.; Li, W.H. Mathematical model for studying genetic variation in terms of restriction endonucleases. Proc. Natl. Acad. Sci. U. S. A. 1979, 76, 5269–5273. [Google Scholar] [CrossRef] [PubMed]
- Leigh, J.W.; Bryant, D. POPART: Full-feature software for haplotype network construction. Methods Ecol. Evol. 2015, 6, 1110–1116. [Google Scholar] [CrossRef]
Figure 1.
Degenia velebitica (Degen) Hayek (Brassicaceae) at the locality Tomišina draga (P1). (A) Population in full flower (26.3.2016). (B) A flowering plant. (C) Plant mapping and sampling using plots 5 × 5 m. Photos: B. Surina (A and B), Z. Liber (C).
Figure 1.
Degenia velebitica (Degen) Hayek (Brassicaceae) at the locality Tomišina draga (P1). (A) Population in full flower (26.3.2016). (B) A flowering plant. (C) Plant mapping and sampling using plots 5 × 5 m. Photos: B. Surina (A and B), Z. Liber (C).
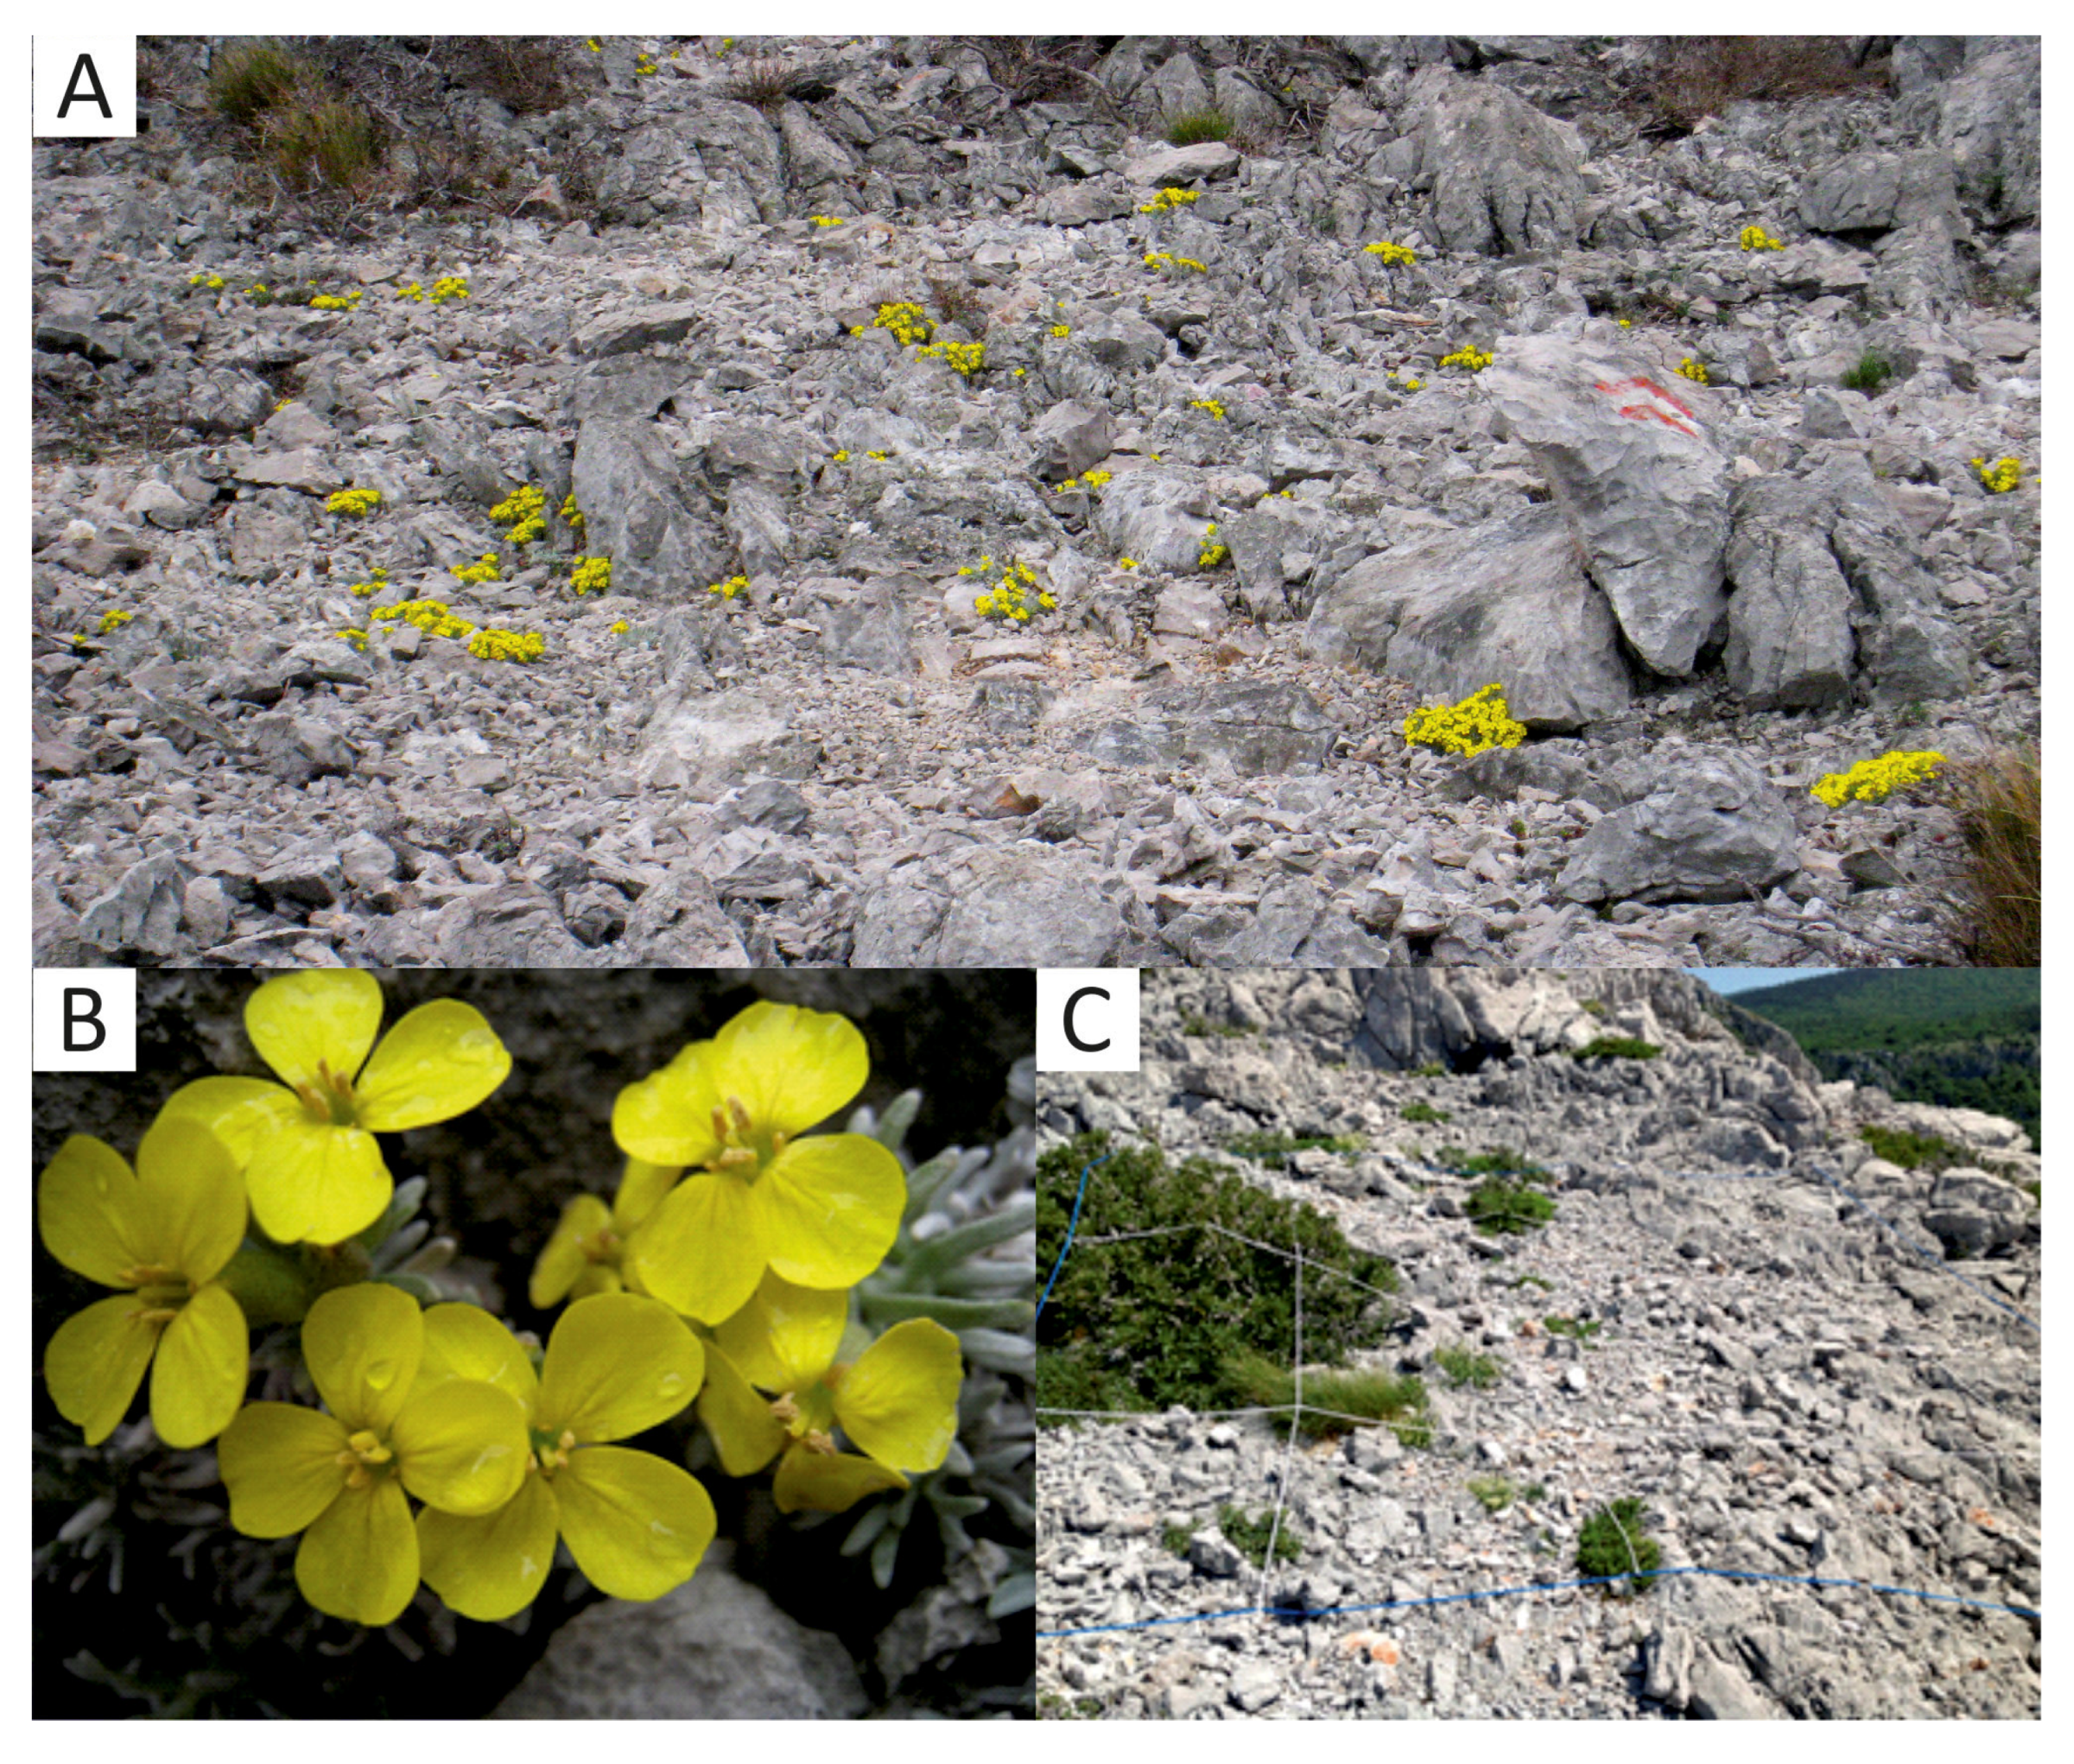
Figure 2.
Sampling sites and genetic diversity of five Degenia velebitica populations: allelic richness (Nar), private allelic richness (Npar), and expected heterozygosity (HE).
Figure 2.
Sampling sites and genetic diversity of five Degenia velebitica populations: allelic richness (Nar), private allelic richness (Npar), and expected heterozygosity (HE).
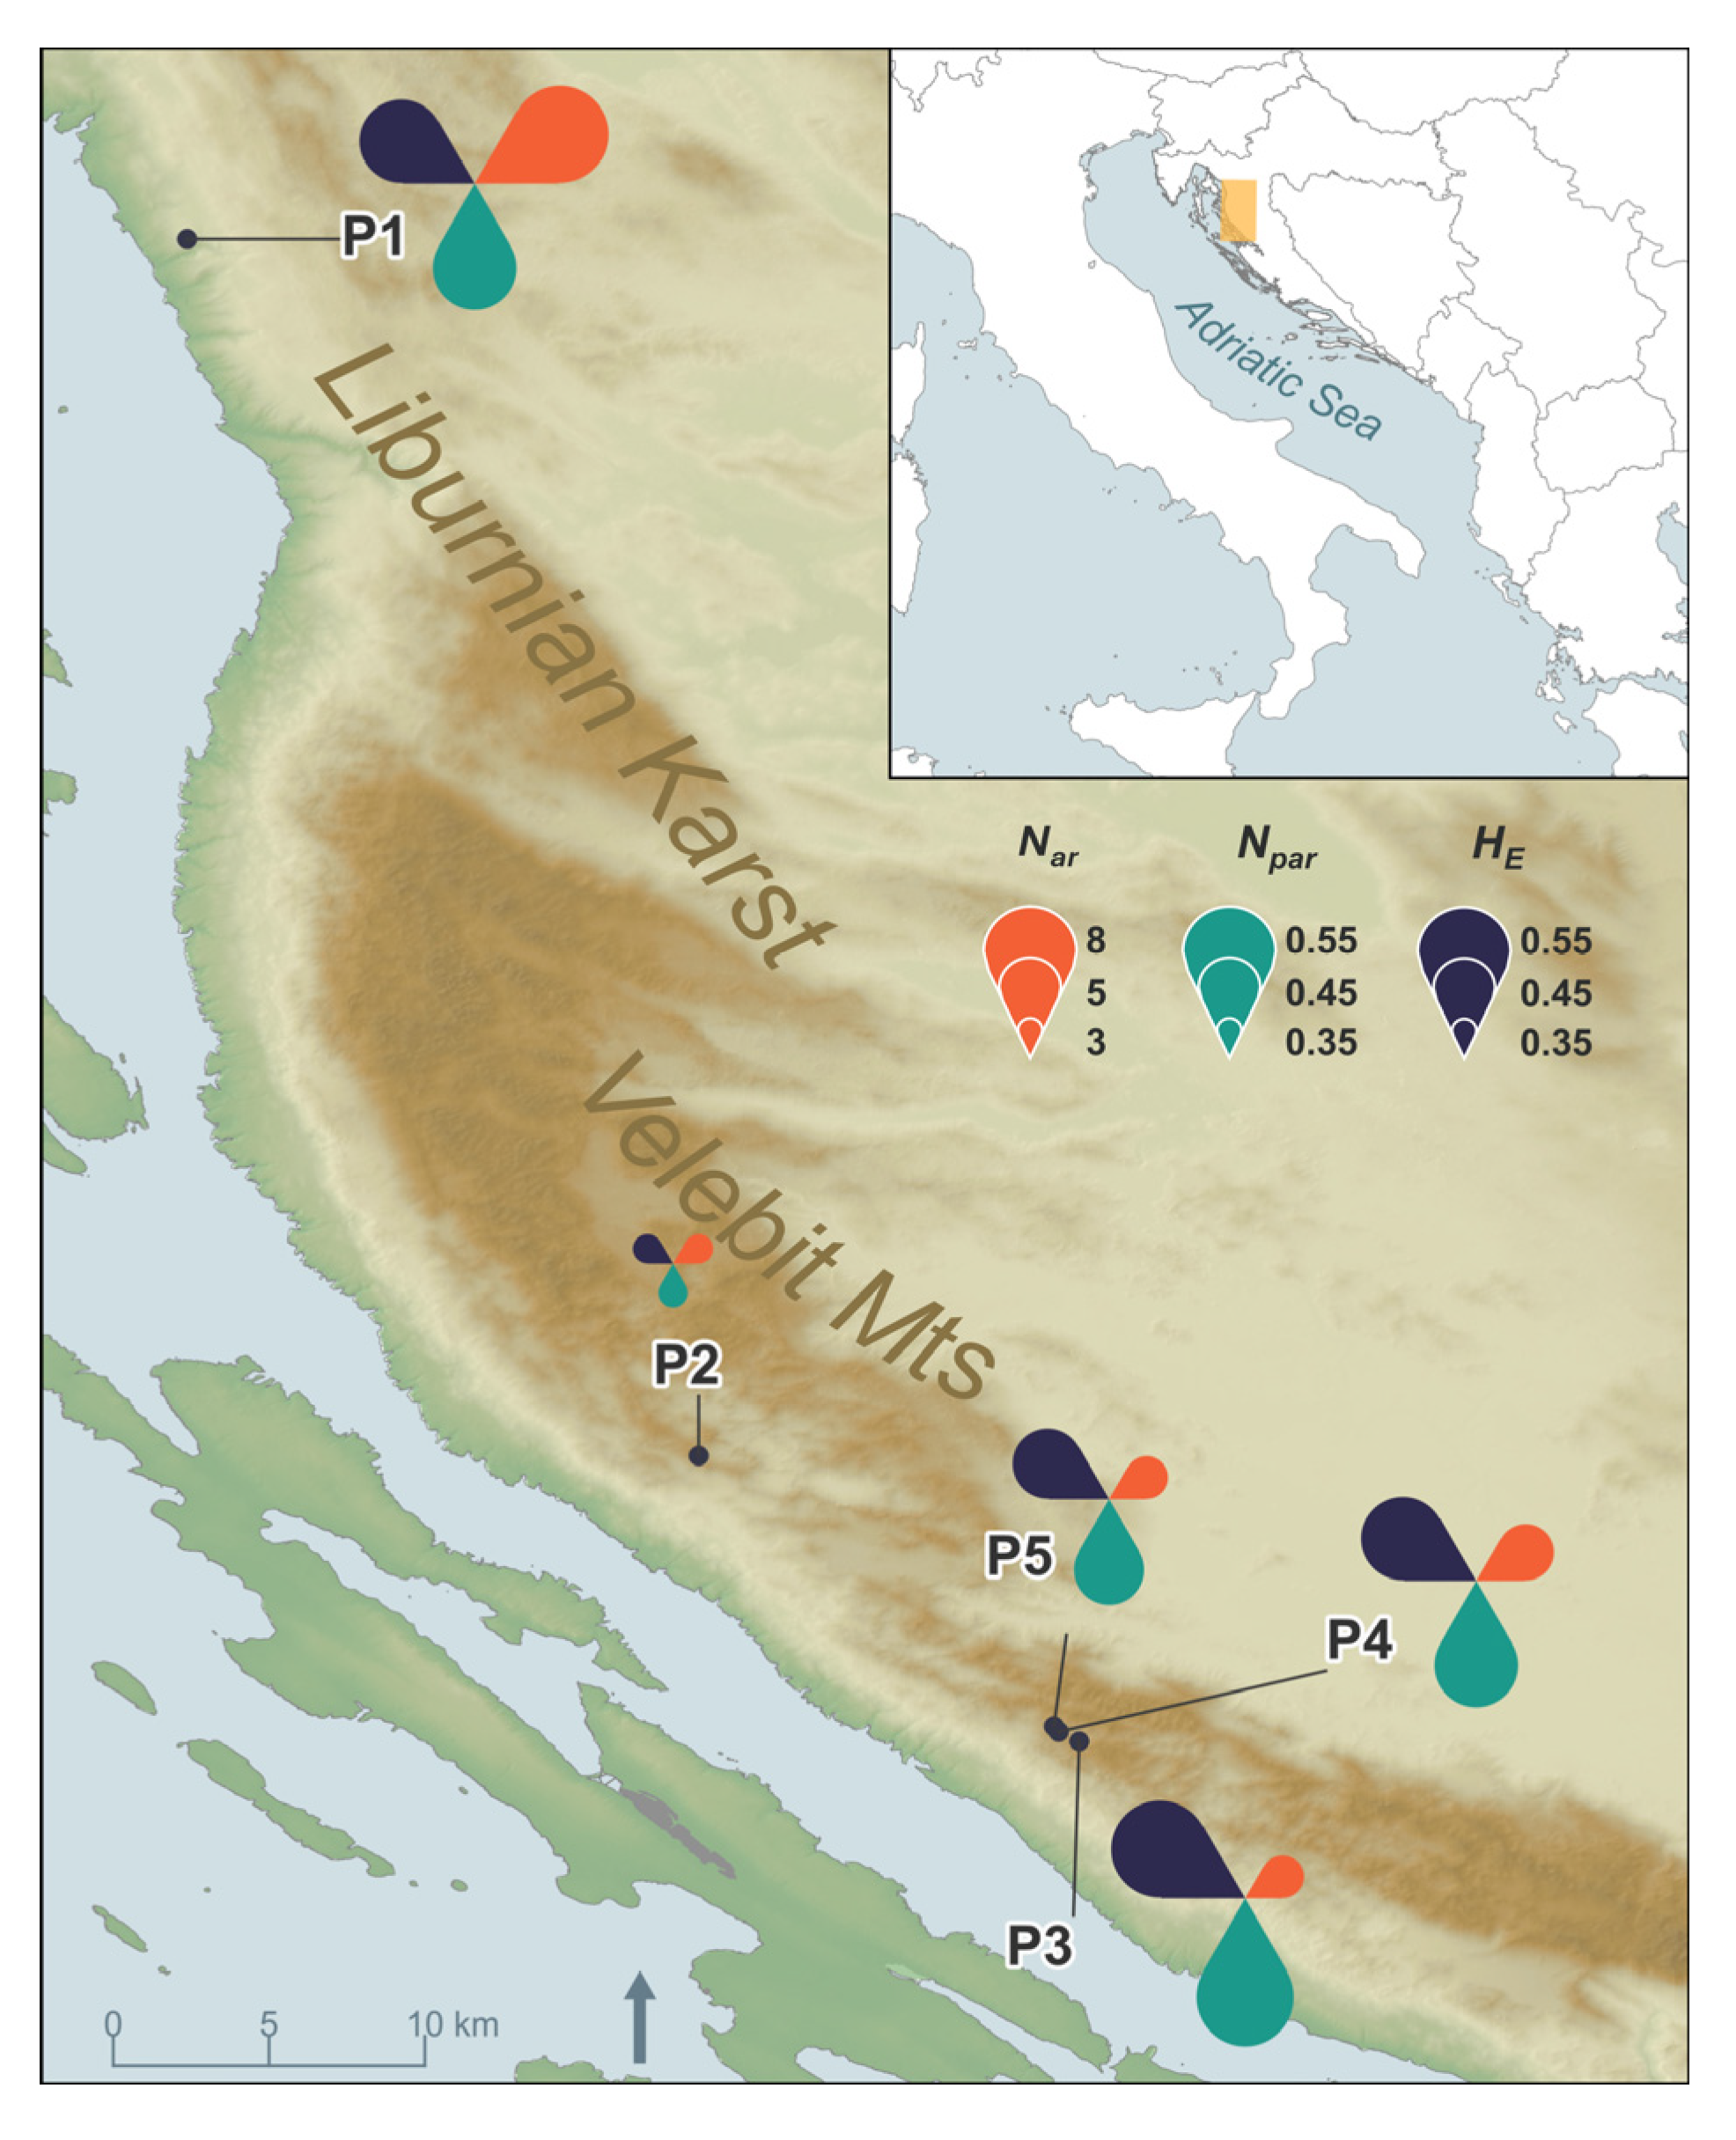
Figure 3.
Scatter plot of Factorial correspondence analysis (FCA) showing relationships among Degenia velebitica populations.
Figure 3.
Scatter plot of Factorial correspondence analysis (FCA) showing relationships among Degenia velebitica populations.
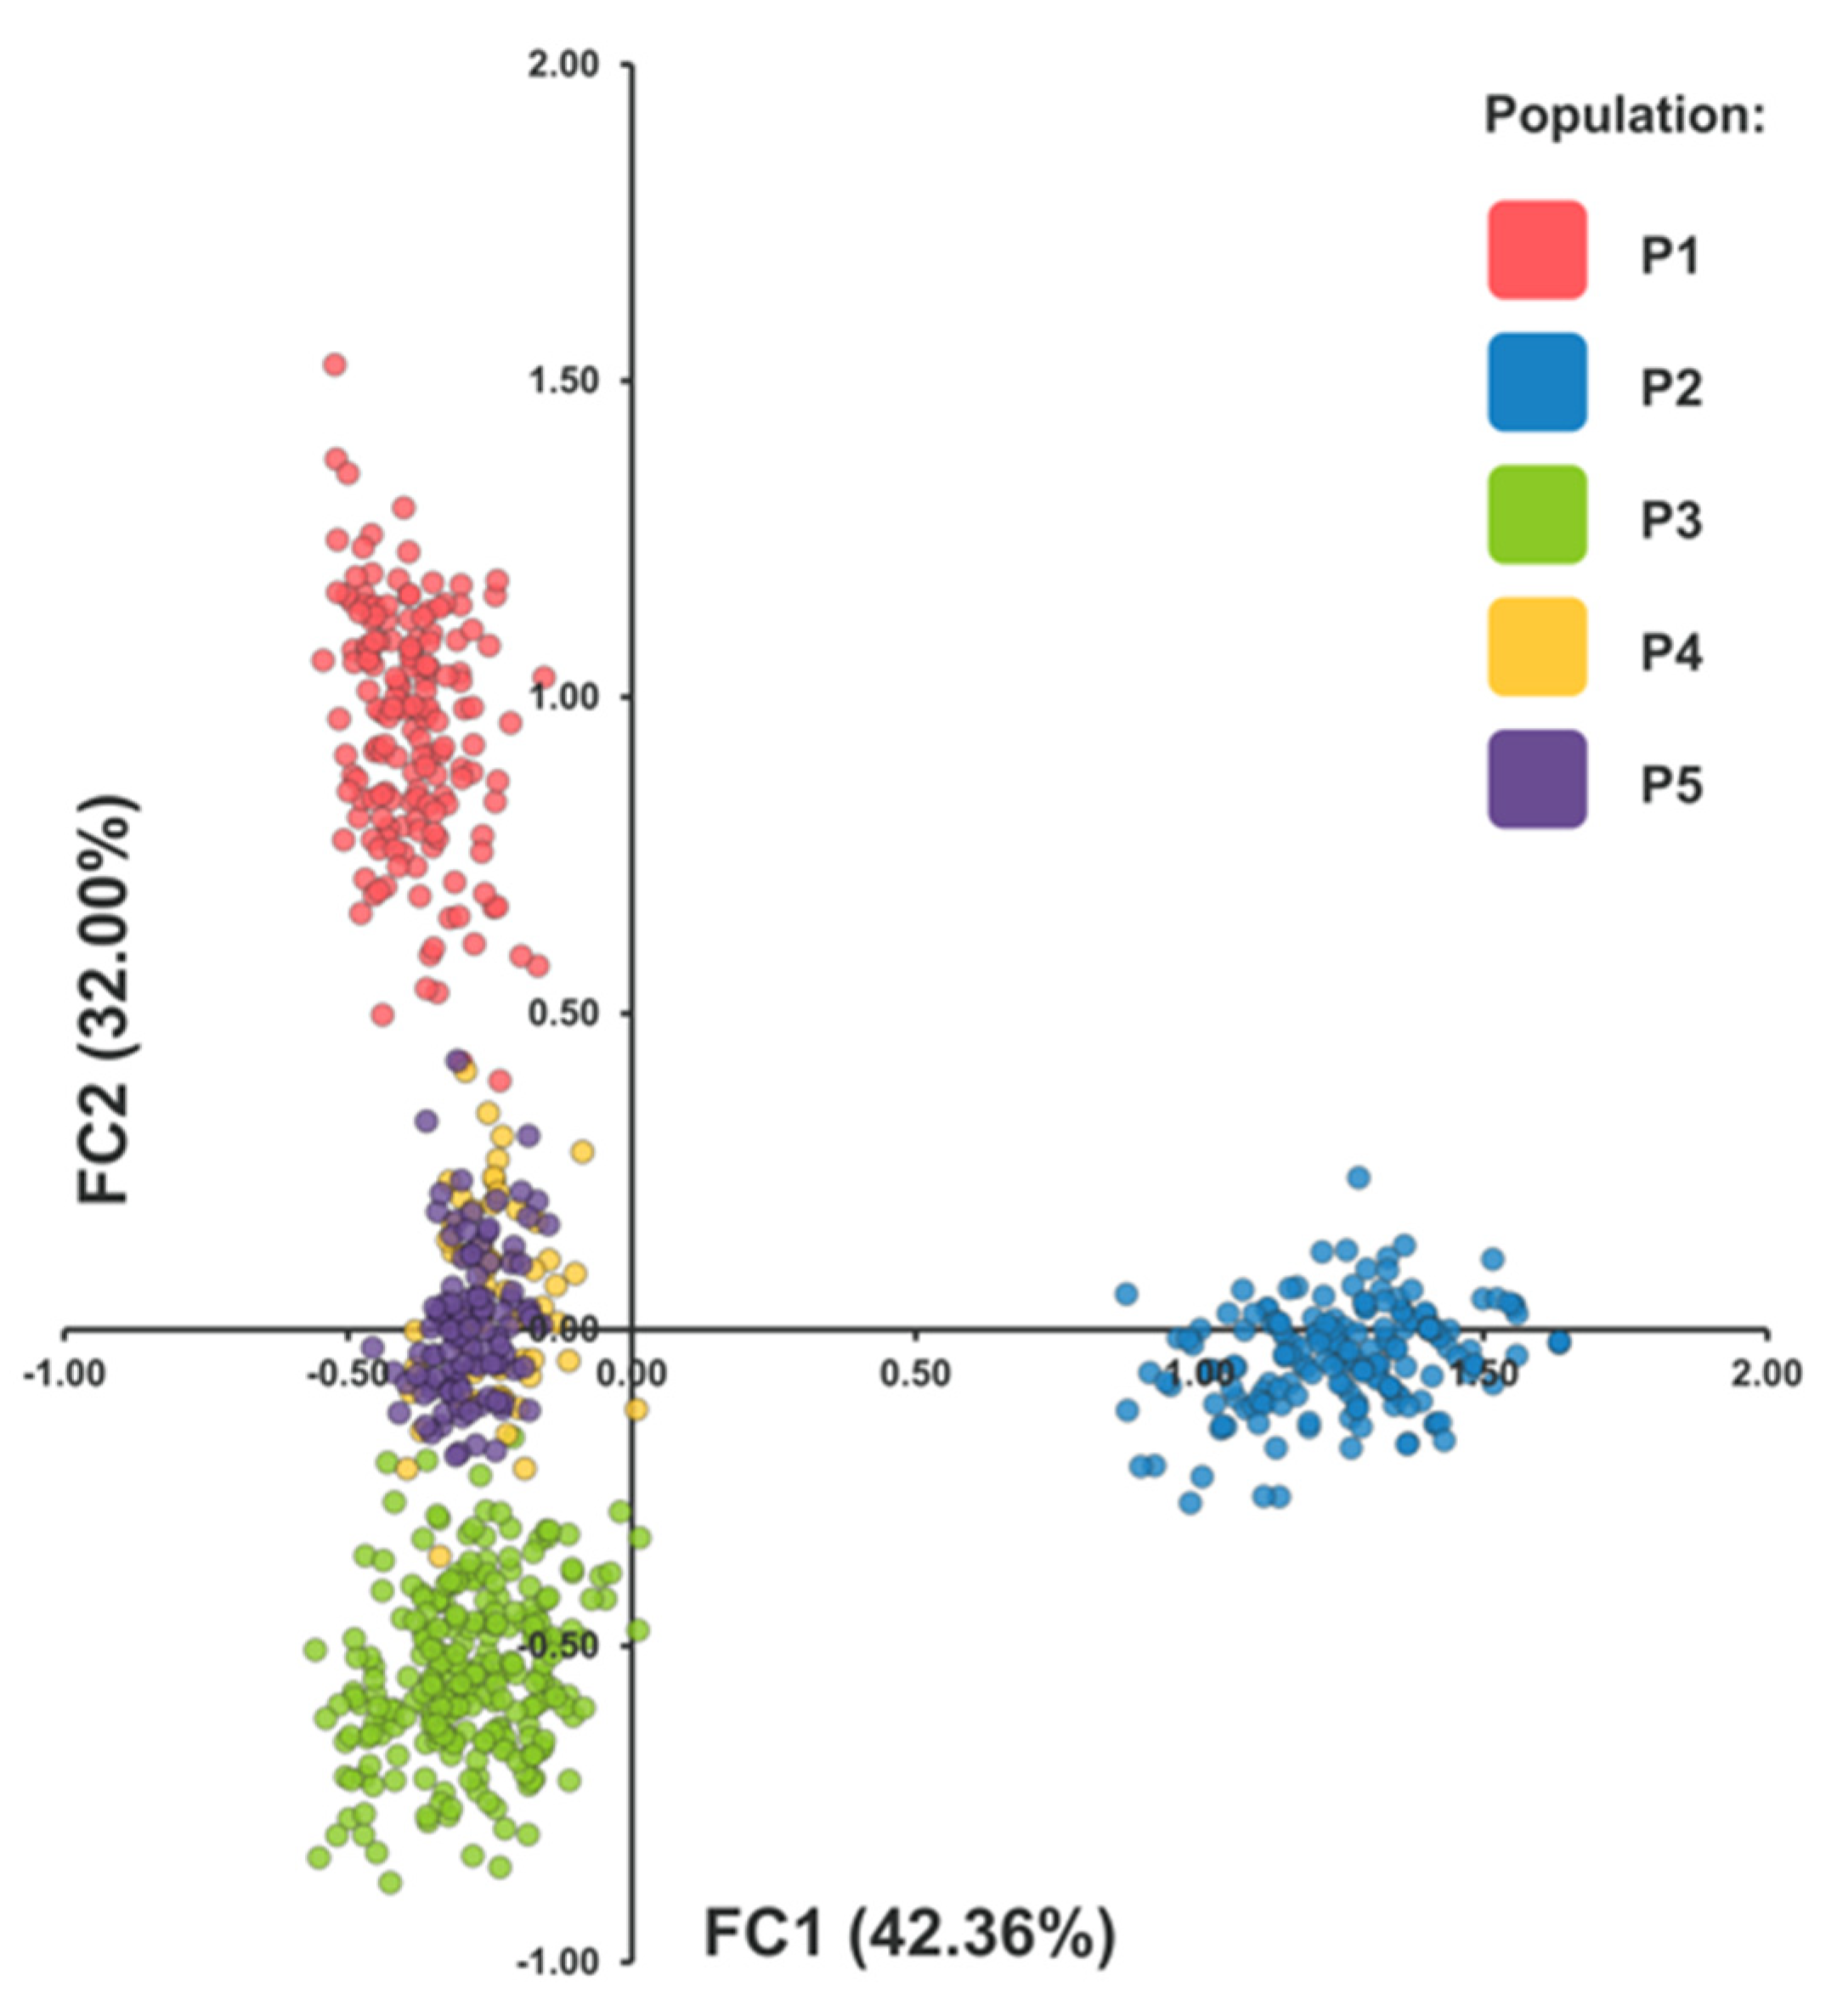
Figure 4.
Genetic structure of Degenia velebitica populations inferred using STRUCTURE for K = 2 -5. Each individual is represented by a single vertical bar partitioned into colored segments, where each color denotes a genetic cluster and the segment length corresponds to the individual’s estimated membership proportion in that cluster.
Figure 4.
Genetic structure of Degenia velebitica populations inferred using STRUCTURE for K = 2 -5. Each individual is represented by a single vertical bar partitioned into colored segments, where each color denotes a genetic cluster and the segment length corresponds to the individual’s estimated membership proportion in that cluster.
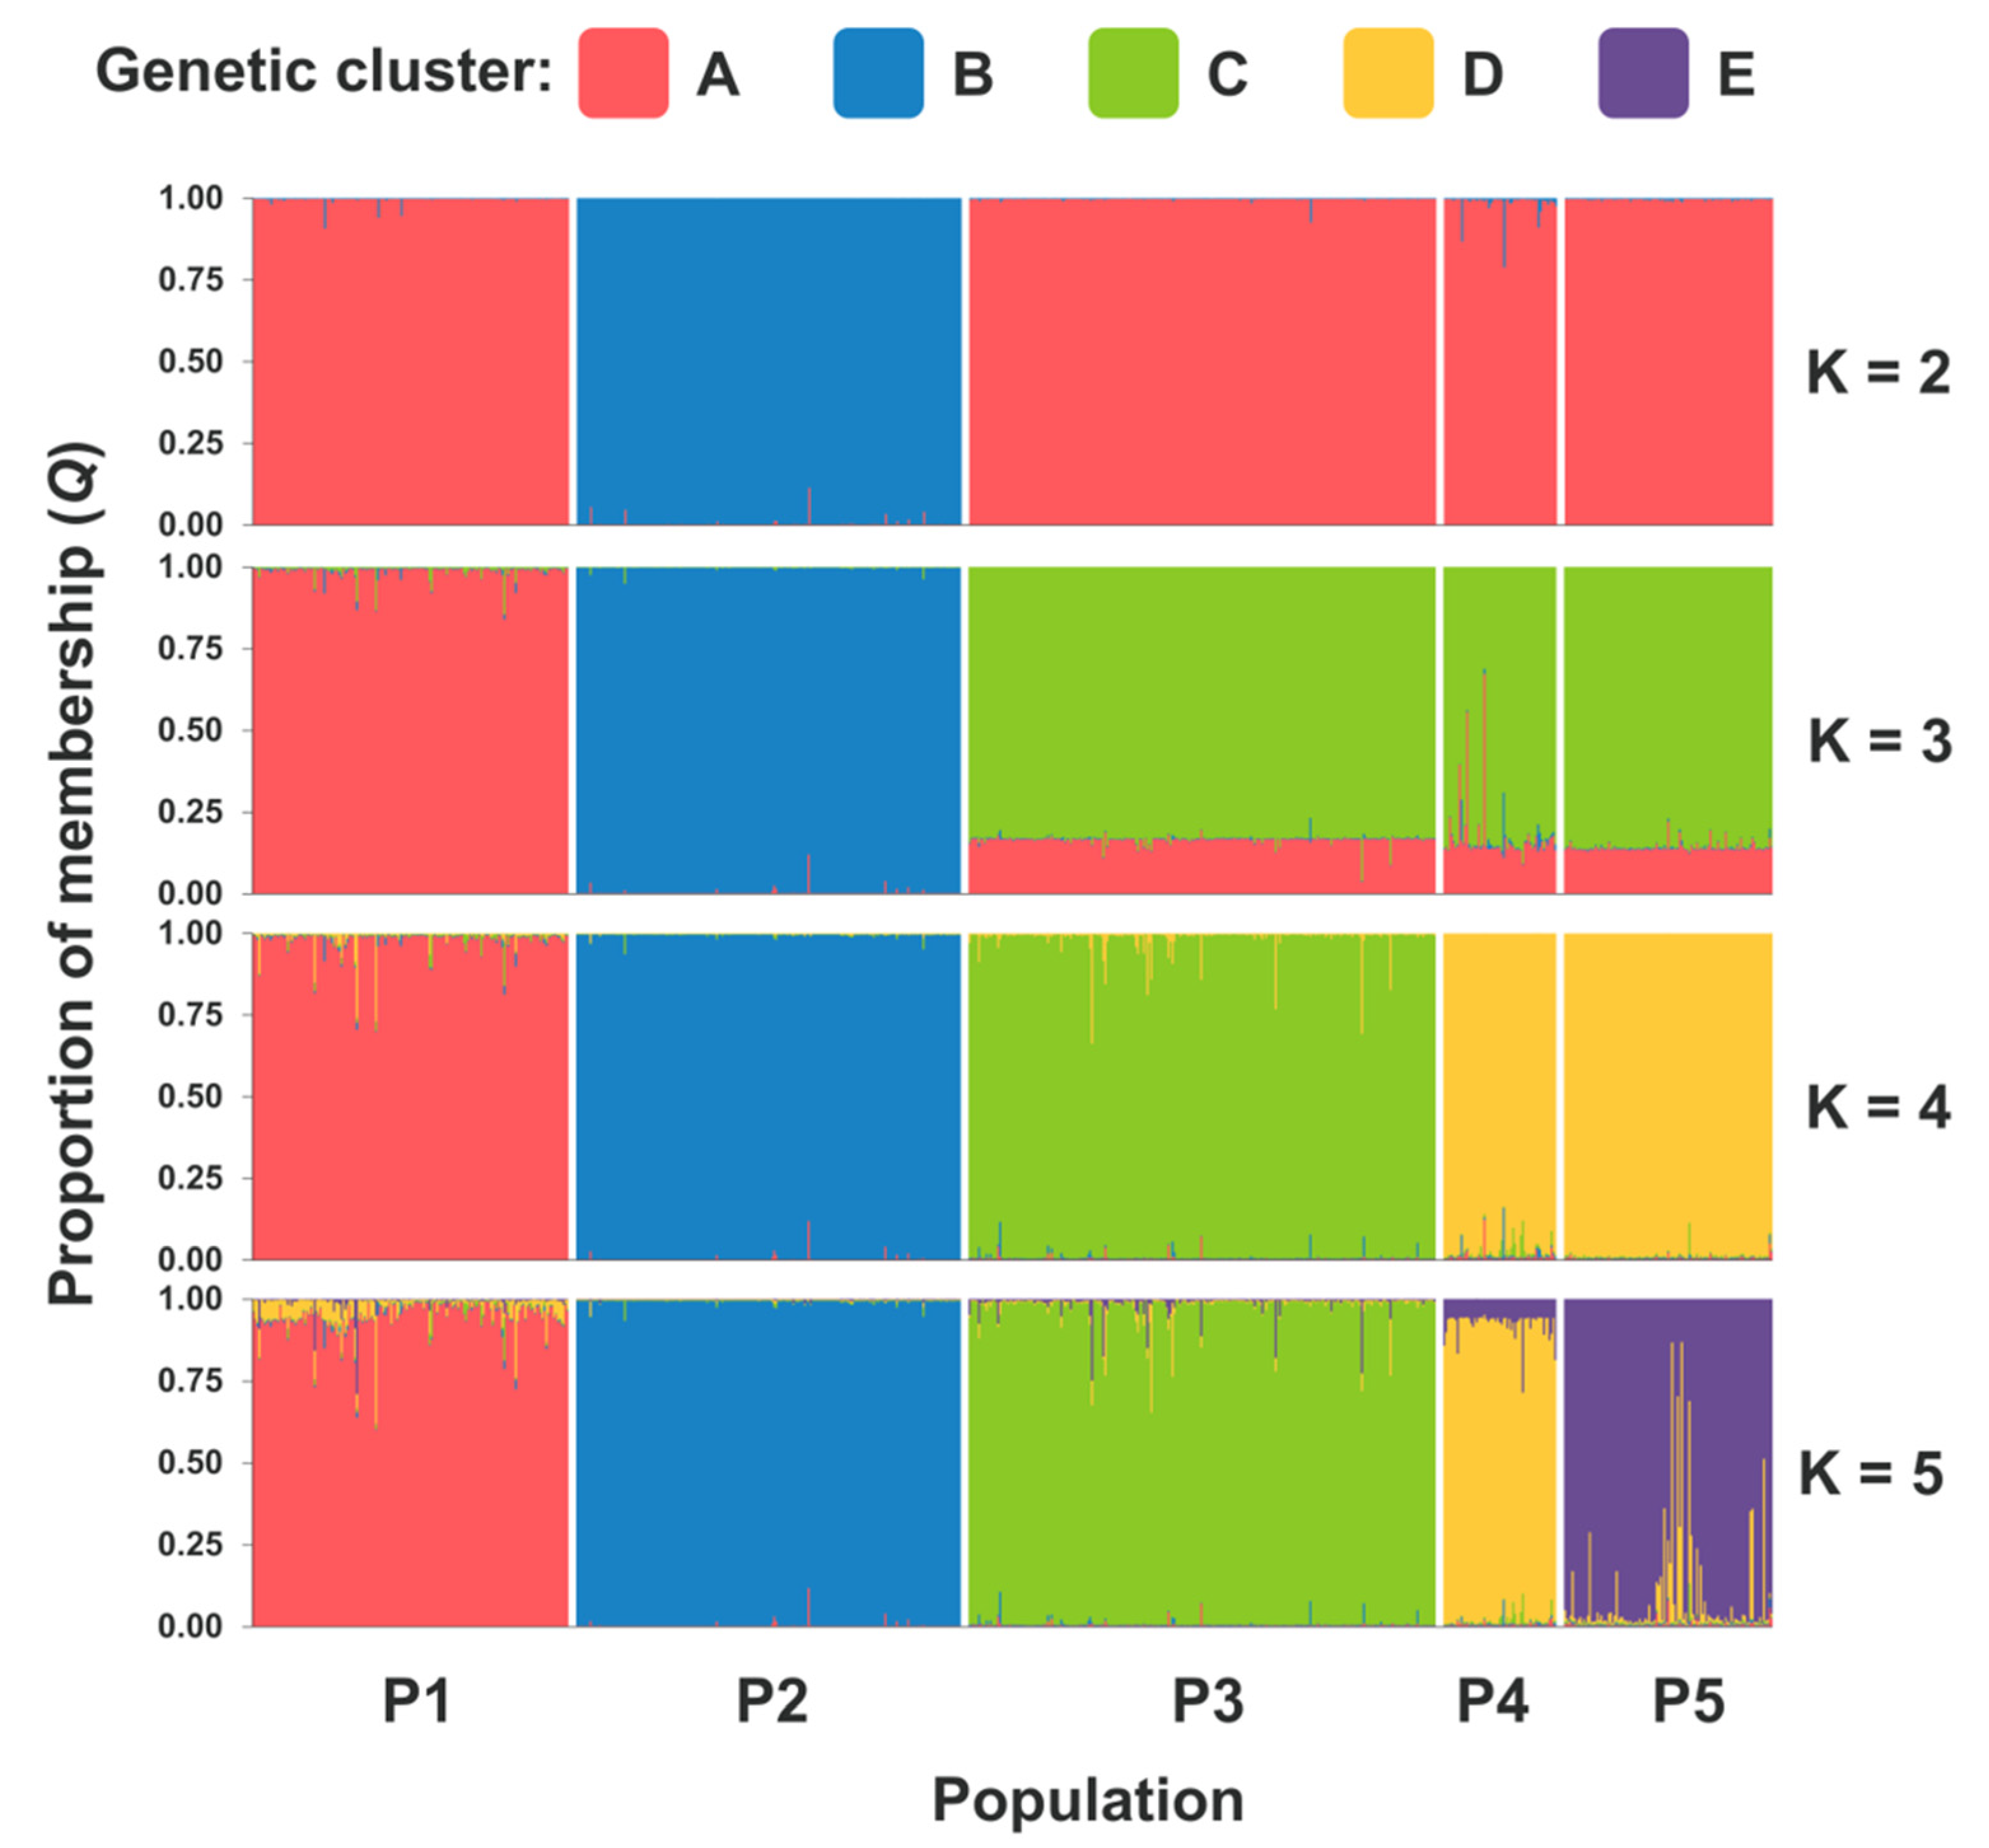
Figure 5.
Spatial correlograms showing the relationship between the spatial distance and kinship coefficient of D. velebitica individuals. Dashed lines represent the 95% confidence interval under the null hypothesis of random spatial distribution Statistically significant values are marked with an asterisk. Fij - kinship coefficient; F(1) - average kinship coefficient of individuals belonging to the first distance class; b-log - regression slope of observed relatedness on the logarithm of distance between individuals; Sp - statistic describing spatial genetic structure; Nb - neighborhood size.
Figure 5.
Spatial correlograms showing the relationship between the spatial distance and kinship coefficient of D. velebitica individuals. Dashed lines represent the 95% confidence interval under the null hypothesis of random spatial distribution Statistically significant values are marked with an asterisk. Fij - kinship coefficient; F(1) - average kinship coefficient of individuals belonging to the first distance class; b-log - regression slope of observed relatedness on the logarithm of distance between individuals; Sp - statistic describing spatial genetic structure; Nb - neighborhood size.
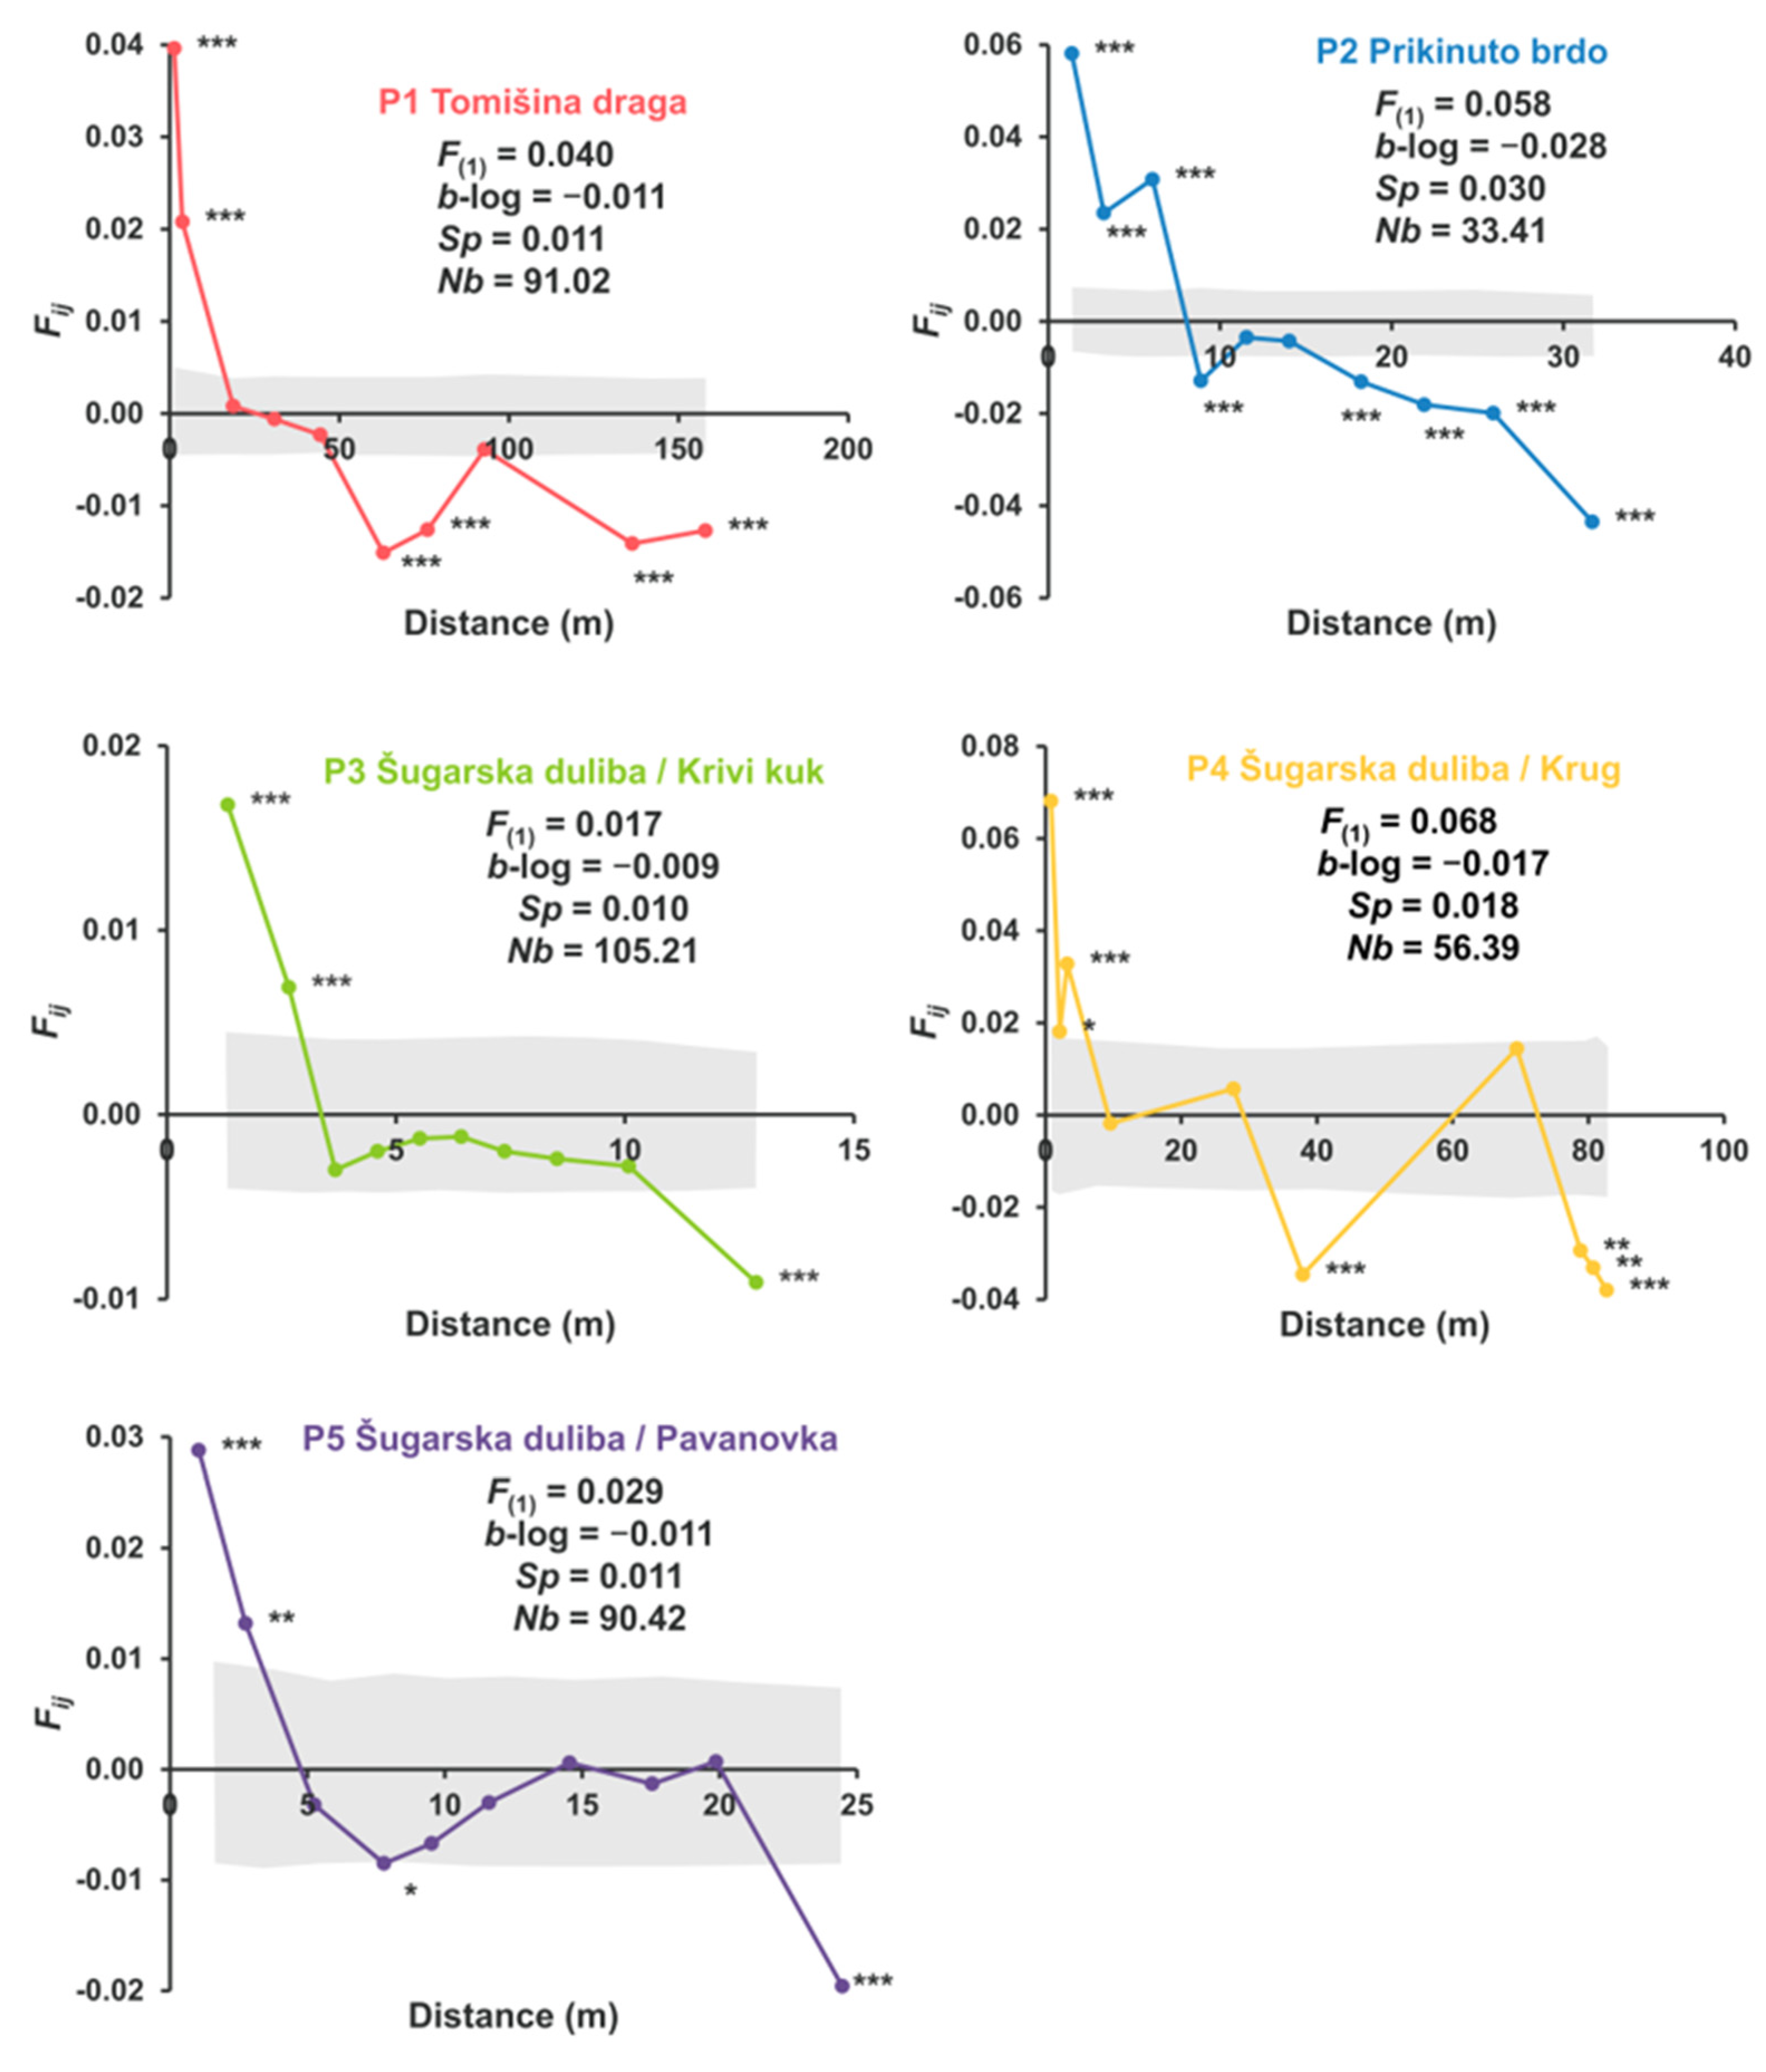
Figure 6.
Median-joining haplotype network of chloroplast haplotypes found in Degenia velebitica populations. The circles represent unique observed haplotypes (H1, H2, and H3), and the black lines represent mutational steps (i.e. inferred missing haplotypes). The black circle at the centre of the network represents an inferred median vector (an un-sampled or hypothetical intermediate haplotype). Circle diameter is proportional to the observed frequency of each haplotype, with a corresponding scale provided in the lower right corner.
Figure 6.
Median-joining haplotype network of chloroplast haplotypes found in Degenia velebitica populations. The circles represent unique observed haplotypes (H1, H2, and H3), and the black lines represent mutational steps (i.e. inferred missing haplotypes). The black circle at the centre of the network represents an inferred median vector (an un-sampled or hypothetical intermediate haplotype). Circle diameter is proportional to the observed frequency of each haplotype, with a corresponding scale provided in the lower right corner.
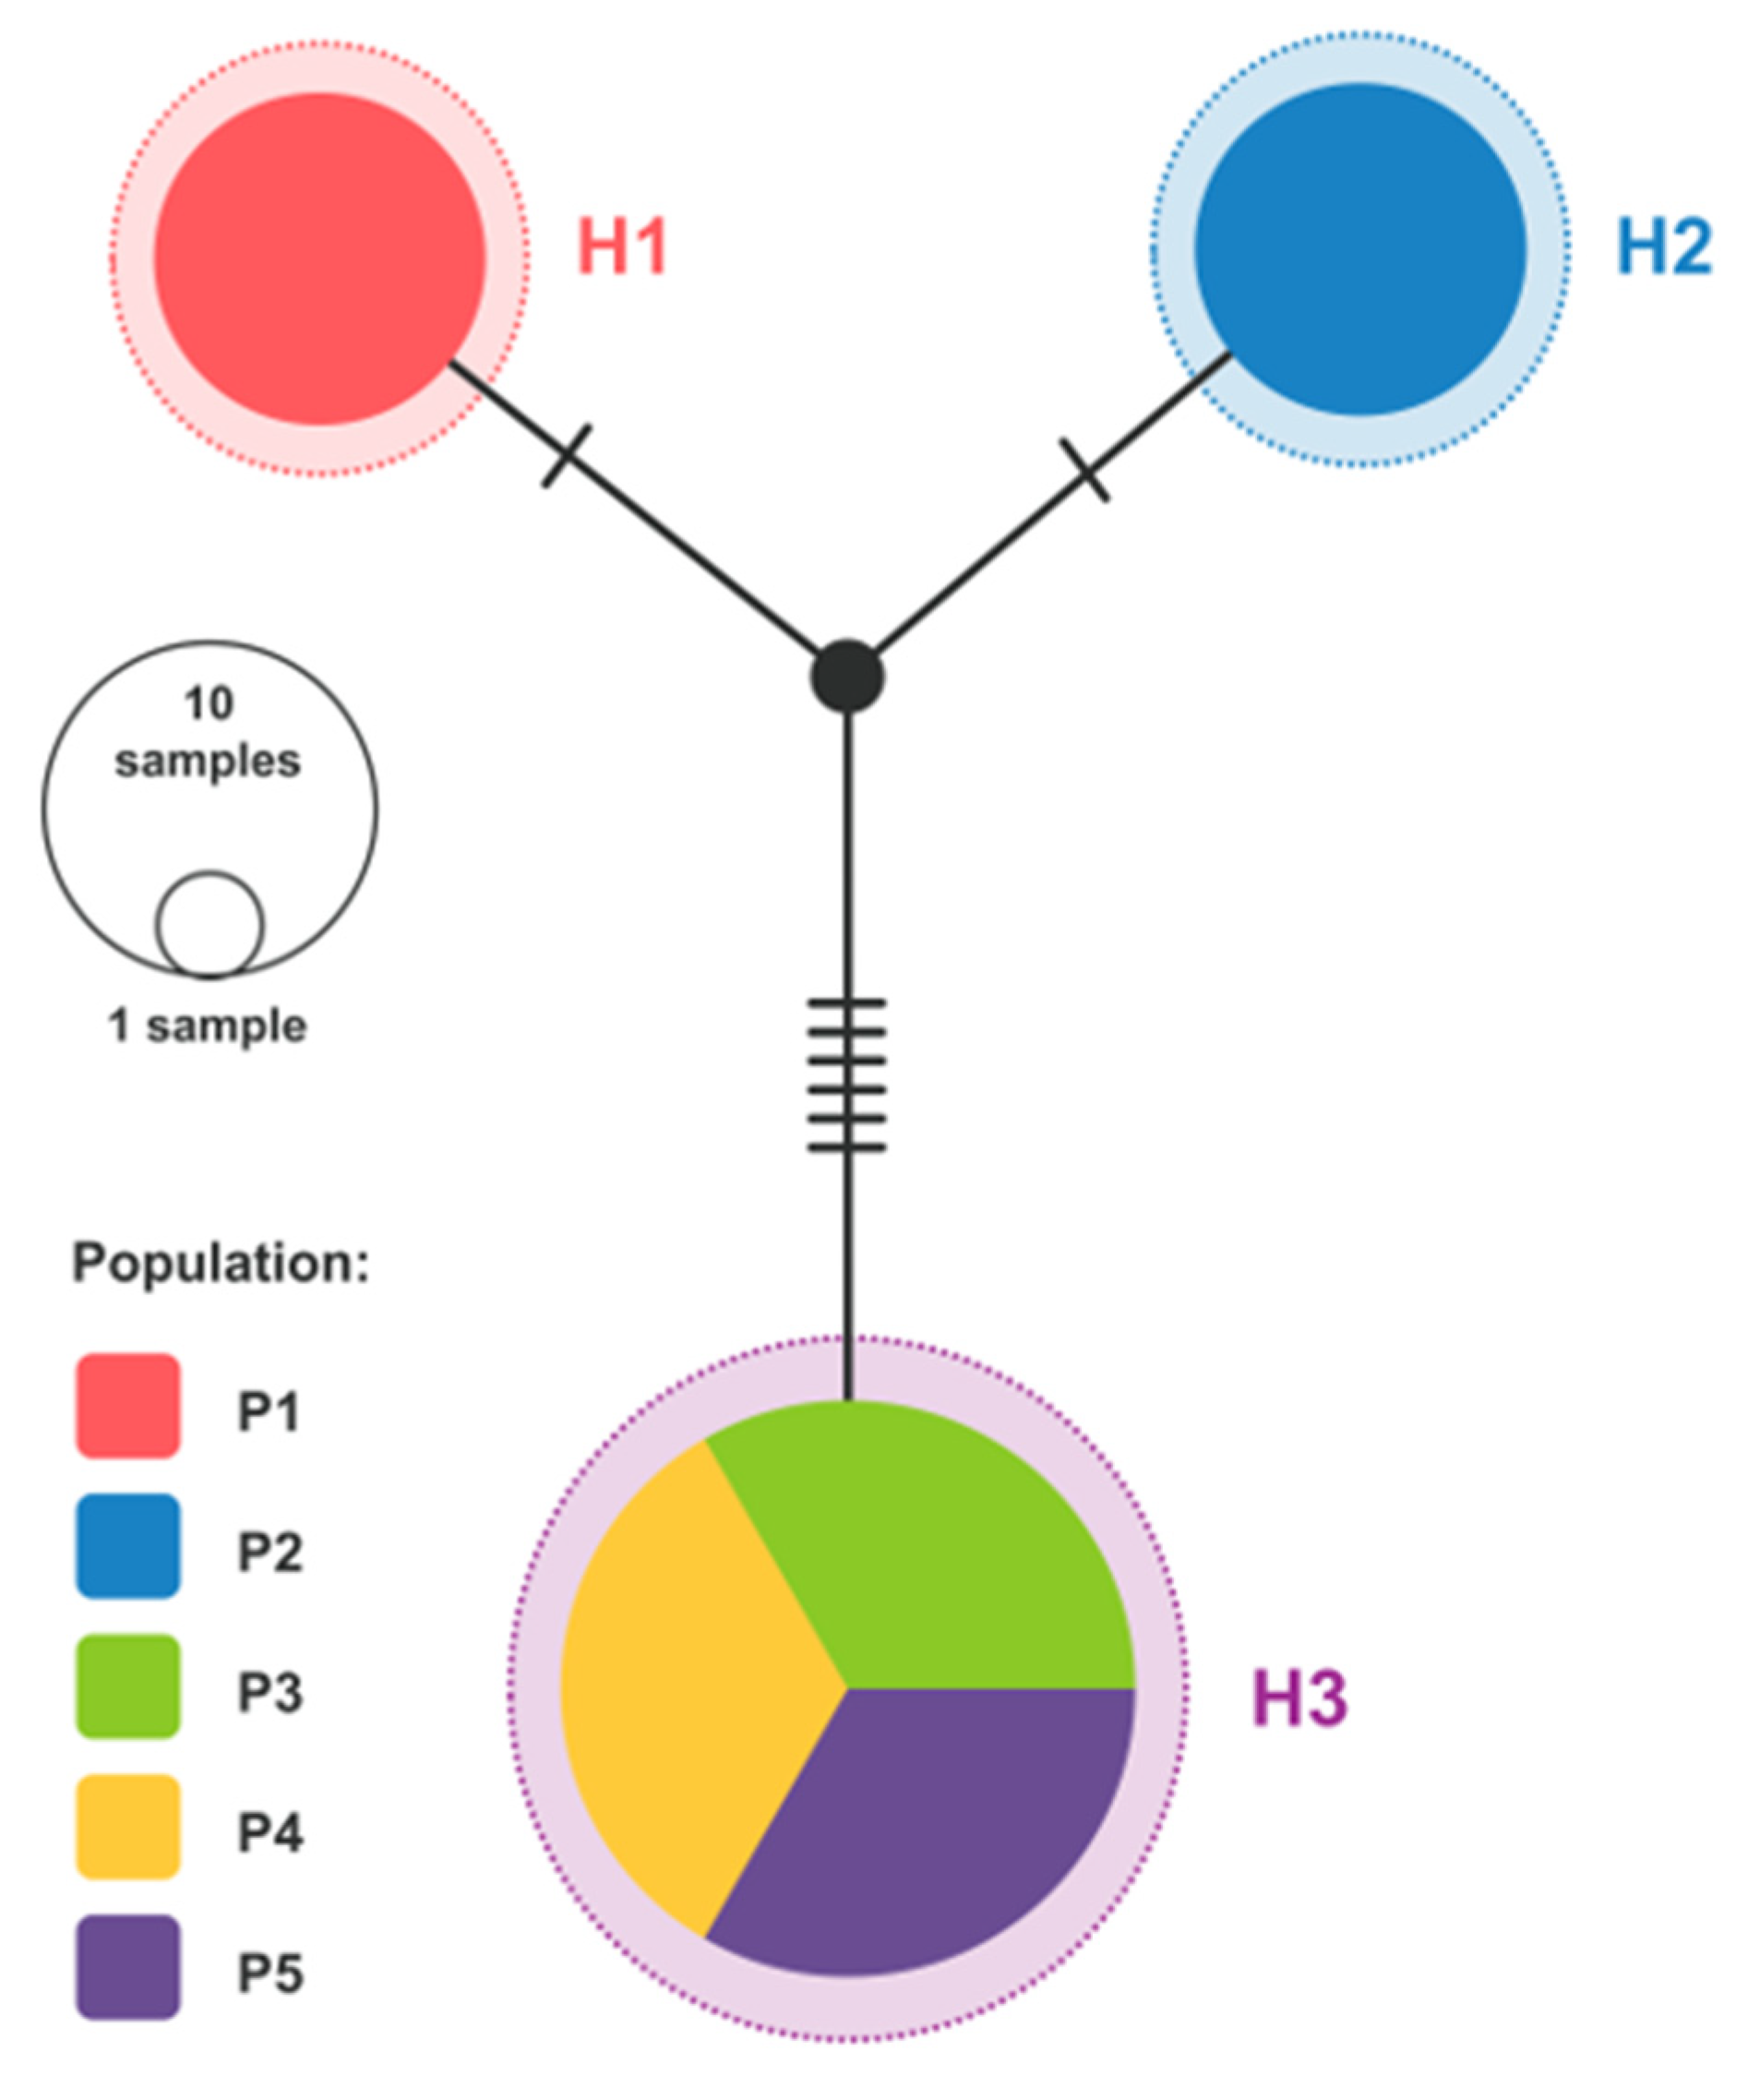

Table 1.
Sampling site characteristics and estimated population parameters of Degenia velebitica.
| Pop. | Locality |
Latitude / Longitude |
Elevation (m a.s.l) |
No. of individuals | Estimated population area (m2) |
Estimated population size (95% CI) |
Plant density (ind./m2 ± 95% CI) |
| P1 | Tomišina draga | 45° 03′ 55″/ | 301 – 361 | 165 | 2609.12 | 3444.03 (3089.15 – 3798.92) |
1.32 ± 0.136 |
| 14° 53′ 06″ | |||||||
| P2 | Prikinuto brdo | 44° 34′ 17″/ | 1167 – 1185 | 201 | 288.60 | 464.06 (303.36 – 624.77) |
1.608 ± 0.557 |
| 15° 05′ 32″ | |||||||
| P3 | Šugarska duliba – Krivi kuk | 44° 27′ 01″/ | 1260 – 1279 | 244 | 126.44 | 246.80 (195.52 – 298.09) |
1.952 ± 0.406 |
| 15° 14′ 47″ | |||||||
| P4 | Šugarska duliba – Krug | 44° 27′ 34″/ | 1241 – 1289 | 59 | 1594.36 | 59.00 (NA) |
0.037 |
| 15° 14′ 17″ | |||||||
| P5 | Šugarska duliba – Pavanovka | 44° 27′ 42″/ | 1297 – 1313 | 109 | 335.58 | 292.62 (172.78 – 412.46) |
0.872 ± 0.357 |
| 15° 14′ 10″ |
Table 2.
Sampling sites and genetic diversity assessed from 10 microsatellite markers in five Degenia velebitica populations.
Table 2.
Sampling sites and genetic diversity assessed from 10 microsatellite markers in five Degenia velebitica populations.
| Pop. | n | Nar | Npar | HO | HE | FIS | Ne | Nₑ (95% CI) | |
| P1 | 165 | 8.082 | 2.837 | 0.537 | 0.536 | -0.001 | ns | 79.8 | 58.8-112.8 |
| P2 | 201 | 3.319 | 0.873 | 0.284 | 0.322 | 0.121 | *** | 41.1 | 27.4-62.1 |
| P3 | 244 | 4.729 | 0.418 | 0.568 | 0.575 | 0.011 | ns | 54.7 | 42.6-70.8 |
| P4 | 59 | 5.200 | 0.378 | 0.542 | 0.531 | -0.022 | ns | 18.7 | 12.0-29.5 |
| P5 | 109 | 4.712 | 0.054 | 0.478 | 0.469 | -0.020 | ns | 29.1 | 19.1-45.2 |
| Average | 155.60 | 5.208 | 0.912 | 0.482 | 0.487 |
* n - sample size; Nar - allelic richness; Npar - private allelic richness; HO - observed heterozygosity; HE - expected heterozygosity; FIS - inbreeding coefficient (ns – non-significant value; * significant at P < 0.05; ** significant at P < 0.01; *** significant at P < 0.001); Ne - Effective population size; Nₑ (95% CI) - 95% CI for Ne.
Disclaimer/Publisher’s Note: The statements, opinions and data contained in all publications are solely those of the individual author(s) and contributor(s) and not of MDPI and/or the editor(s). MDPI and/or the editor(s) disclaim responsibility for any injury to people or property resulting from any ideas, methods, instructions or products referred to in the content. |
© 2026 by the authors. Licensee MDPI, Basel, Switzerland. This article is an open access article distributed under the terms and conditions of the Creative Commons Attribution (CC BY) license (http://creativecommons.org/licenses/by/4.0/).
Copyright: This open access article is published under a Creative Commons CC BY 4.0 license, which permit the free download, distribution, and reuse, provided that the author and preprint are cited in any reuse.