

Submitted:
09 October 2026
Posted:
10 October 2026
You are already at the latest version
Abstract
This paper presents the end-to-end multidisciplinary development and flight-test assessment of a Class I fixed-wing mini unmanned aerial vehicle (UAV) designed for surveillance and reconnaissance missions. The development process progresses from mission and system-level requirements through conceptual, preliminary, and detailed design, followed by prototype fabrication and experimental flight testing. Conceptual design establishes aircraft mass, wing and power loading, aerodynamic configuration, wing geometry, airfoil selection, mass distribution, and initial stability characteristics. The preliminary and detailed stages progressively increase analysis fidelity through assessments of aerodynamics, structures, aeroelasticity, propulsion, stability and control, performance, and thermal management. High-fidelity Computational Fluid Dynamics (CFD) is employed for aerodynamic char-acterization and load prediction, while Finite-Element (FE) and aeroelastic models are used to assess strength, stiffness, static and dynamic aeroelastic behavior. The aircraft configuration incorporates a V-tail, electric pusher propulsion, composite structural components, integrated control surfaces, wingtip devices, and dedicated cooling arrangements. A representative 3D-printed flight-test article retaining the principal aerodynamic architecture was subsequently evaluated in climb, straight-and-level flight, sustained turns, and low-speed operation. The vehicle exhibited stable and predictable handling throughout the tested envelope. Flight-derived aerodynamic characteristics showed close agreement with the detailed-design CFD database, with drag-coefficient deviations remaining below approximately 3% in straight-and-level flight and within approximately 1.5% during climb. Larger discrepancies, reaching approximately 16%, were observed during sustained turns, highlighting the increased uncertainty associated with maneuvering flight and with drag values inferred using the propulsion model. Overall, the study demonstrates a traceable progressive-fidelity methodology for advancing a mini-UAV from requirements and conceptual sizing to multidisciplinary verification and prototype-level flight assessment.
Keywords:
unmanned aerial vehicle (UAV)
; multidisciplinary aircraft design
; aerodynamic analysis
; structural analysis
; aeroelasticity
; stability and control
; flight testing
; experimental validation
1. Introduction
Unmanned aerial vehicles (UAVs) have undergone substantial development during the last two decades and are now employed in a broad range of civilian, scientific, commercial, and defense applications. Fixed-wing UAVs are particularly attractive for missions requiring comparatively long range and endurance, including surveillance, reconnaissance, mapping, environmental monitoring, infrastructure inspection, and remote sensing. Their relatively low operating cost, ease of deployment, and ability to operate in environments where larger aircraft may be impractical have motivated the development of increasingly capable small-scale platforms. Consequently, considerable research effort has been directed toward the aerodynamic design, propulsion integration, performance evaluation, and mission-oriented development of fixed-wing UAVs [1,2,3,4,5].
Despite their comparatively small dimensions, mini-UAVs constitute strongly multidisciplinary engineering systems. Aerodynamic efficiency, structural mass, propulsion-system performance, stability and control, payload integration, energy storage, thermal management, manufacturability, and operational requirements are closely interconnected. Changes introduced within one discipline may therefore propagate throughout the complete aircraft. An increase in wing aspect ratio, for example, can improve induced-drag characteristics while simultaneously increasing structural bending requirements and sensitivity to elastic deformation. Similarly, external subsystem installations affect both local aerodynamics and internal packaging, whereas propulsion and battery selection influence mass distribution, endurance, available thrust, and cooling requirements. The aircraft must therefore be designed as an integrated system rather than as a collection of independently sized components.
The problem is further complicated by the low-Reynolds-number regime characteristic of mini-UAV operation. In this regime, aerodynamic performance is particularly sensitive to boundary-layer transition, separation, stall behavior, surface condition, and small geometric variations. Airfoil selection, wing planform, control-surface geometry, and empennage configuration consequently influence not only lift and drag, but also stability, controllability, propulsion requirements, and mission performance. At the same time, the restricted mass and internal volume available to electrically powered small aircraft impose additional constraints on structural architecture, battery placement, avionics packaging, and thermal management.
Several systematic methodologies for fixed-wing UAV design have been reported. Kontogiannis and Ekaterinaris [1] presented an integrated UAV design, performance-evaluation, and optimization procedure, while Panagiotou et al. [2] investigated the aerodynamic design of a medium-altitude long-endurance UAV using computational methods. Panagiotou and Yakinthos [3] further examined aerodynamic-efficiency and performance enhancement for fixed-wing UAVs. Dündar et al. [4] considered an electrically powered fixed-wing VTOL configuration, illustrating the increasing coupling between aerodynamic, propulsion, and operational requirements in modern UAV design. At a broader aircraft-design level, multidisciplinary approaches have also been employed to account for interactions between aerodynamic, structural, and performance disciplines [6]. Classical aircraft-design references remain valuable in this context, particularly during conceptual and preliminary sizing, where computationally inexpensive methods are necessary to examine a large number of design choices [7,8,9].
A further integration challenge is associated with the selected V-tail empennage. The V-tail combines the longitudinal and directional functions of conventional horizontal and vertical stabilizers into two inclined surfaces, thereby reducing the number of aerodynamic surfaces and geometric intersections. At the same time, pitch and yaw control become intrinsically coupled and tail inclination directly affects the longitudinal and lateral-directional derivatives. Classical investigations established the fundamental aerodynamic and stability relationships of V-tail configurations [10,11,12,13], while subsequent numerical and experimental work has examined tail-dihedral effects, low-speed stability, flight-control behavior, and UAV applications [14,15,16,17,18,19].
For the present aircraft, the analytical methodology used for early V-tail sizing and stability assessment has already been reported in a dedicated study [20]. That work connects conventional tail-sizing relationships with classical V-tail theory and verifies the resulting geometric and stability estimates using both low- and high-fidelity aerodynamic analyses. The detailed derivation is therefore not repeated in the present manuscript; the V-tail is treated here as one element of the complete multidisciplinary aircraft-development process.
The structural design presents an equally important challenge. Lightweight UAV structures must provide sufficient strength and stiffness while maintaining low mass and practical manufacturability. For composite airframes, this requires consideration of material selection, structural layout, local reinforcements, buckling resistance, joints, control-surface attachments, and the transfer of aerodynamic and inertial loads between airframe components. Structural flexibility additionally introduces an aeroelastic dimension. Aerodynamic loading can deform the lifting surfaces, modify effective incidence and load distribution, and potentially influence structural and stability margins. Consequently, static strength alone is insufficient when progressing toward a flight-ready configuration; modal behavior, divergence, flutter, and propulsion-induced excitation must also be considered.
This naturally motivates a progressive increase in analysis fidelity as the aircraft matures. Conceptual methods permit rapid estimation of weight, wing loading, power loading, geometry, stability, and mission performance. Once the basic architecture is defined, component-level aerodynamic models, full-aircraft CFD, finite-element models, and aeroelastic analyses can progressively replace the assumptions introduced during earlier stages. Such a hierarchical approach limits computational expenditure while retaining the ability to revisit assumptions before the design is frozen.
Subsystem integration is also important for electrically powered mini-UAVs. Electric propulsion performance depends on the coupled behavior of the motor, propeller, battery, and electronic speed-control system, and the limited available energy must be considered at mission level rather than only at a nominal cruise condition [5]. High power density also produces non-negligible thermal-management requirements. In the broader program, dedicated methodologies were developed for wingtip-device design and internal cooling-system integration; these have already been published separately [21,22]. They are therefore incorporated here only through their resulting aircraft configurations, rather than by reproducing the corresponding optimization procedures.
Numerical verification alone, however, cannot demonstrate that the complete aircraft behaves as expected under real operating conditions. Manufacturing tolerances, surface quality, atmospheric disturbances, propulsion effects, control activity, sensor uncertainty, and interactions between subsystems can all produce differences between the numerical representation and the physical aircraft. Flight testing therefore provides an essential final assessment step by examining airworthiness, handling, stability, controllability, and performance under representative operational conditions. Flight-based system identification and numerical–experimental comparison have been applied previously to small V-tail aircraft [17], while combined numerical and experimental control investigations demonstrate the value of experimental verification for coupled V-tail configurations [18].
The present study describes the complete development of a Class I fixed-wing mini-UAV from initial mission definition to experimental flight assessment. The development process begins with operational and system-level requirements and proceeds through conceptual sizing, preliminary multidisciplinary design, detailed numerical verification, subsystem integration, prototype realization, and flight testing. The principal contribution of the present work is therefore the demonstration of a traceable progressive-fidelity development process connecting mission requirements, conceptual and preliminary sizing, complete-aircraft aerodynamics, detailed composite structural design, aeroelastic verification, propulsion and performance assessment, and prototype-level flight testing. Particular emphasis is placed on how assumptions and design quantities evolve between successive stages and on the extent to which the final numerical predictions are supported by experimental flight data.
2. Materials and Methods
2.1. Mission Requirements and Overall Design Framework
The development of the UAV platform was initiated from a mission-driven definition of the intended operational role rather than from a predefined aircraft geometry. The vehicle was conceived as a fixed-wing Class I mini-UAV intended to provide short-range aerial surveillance and reconnaissance in support of tactical ground operations. The principal operational objective was to extend line-of-sight awareness by providing near-real-time electro-optical and infrared imagery of areas of interest.
The operational concept assumed deployment from temporary or non-permanent field locations without dependence on fixed airfield infrastructure. A representative mission sequence consisted of pre-flight preparation and mission planning, launch and climb-out, transit toward the area of interest, surveillance or loiter, recovery, and post-mission review. Line-of-sight command and control was assumed throughout the mission. Rapid battery replacement, vehicle transport, repeated sorties, and operation by a small ground team were additional system-level considerations.
The Concept of Operations was translated into quantitative mission requirements, the principal values of which are summarized in Table 1. The aerodynamic and propulsion sizing were particularly governed by the climb, cruise, range, endurance, loiter, and altitude requirements.
Two mass values appeared at different requirement levels. The system-level air-vehicle requirement constrained maximum take-off mass to below , whereas the general platform specification introduced a more restrictive nominal target of . These values are intentionally retained separately in the present paper, because the design evolved relative to the early nominal target while remaining within the broader Class I system-level ceiling.
The general specification also constrained the wingspan to the class and the fuselage length to below due to transportation limitations. Environmental requirements covered temperatures from to , wind speeds up to , and limited precipitation.
In parallel, certification-oriented structural and flight-safety criteria were adopted from STANAG 4703/AEP-83 guidance for light unmanned aircraft systems [23]. These criteria were used to define design-speed margins, maneuver and gust loading, ultimate-load factors, component-specific safety factors, and aeroelastic requirements. The maximum design speed was set to times the maximum operating speed. The specified maneuver envelope included a positive limit load factor of at least and a negative limit load factor extending to at least . The aeroelastic requirement prescribed freedom from flutter and divergence with a verification margin of at least .
These requirements formed the common reference for the development process. Conceptual design employed analytical and semi-empirical methods to establish the initial aircraft mass, wing and power loading, geometric proportions, propulsion requirements, and stability characteristics [7,8,9]. Preliminary design subsequently introduced component-level and complete-aircraft aerodynamic analysis, control-surface design, structural modeling, aeroelastic assessment, propulsion selection, weight and balance and mission-performance evaluation. Finally, detailed design employed high-fidelity CFD, detailed FEM, and static and dynamic aeroelastic models to verify the integrated configuration prior to experimental flight assessment.

Table 2.
Selected platform-level design constraints.
| Parameter | Requirement |
|---|---|
| Aircraft type | Fixed-wing mini-UAV |
| Propulsion | Battery-powered electric |
| System-level maximum take-off mass | |
| Nominal platform MTOW target | |
| Maximum wingspan | |
| Maximum length | |
| Operating temperature | to |
| Maximum wind speed | |
| Maximum design speed | |
| Positive maneuver load factor | |
| Negative maneuver load factor | |
| Primary-structure ultimate factor | |
| Secondary-structure ultimate factor | |
| Special composite structural factor | in the adopted design specification |
| Aeroelastic requirement | No flutter, reversal, or divergence |
| Aeroelastic verification margin |
2.2. Conceptual and Preliminary Design Methodology
The conceptual-design phase began with an iterative estimate of take-off mass. Because the payload was prescribed, the initial aircraft mass could be obtained by balancing payload, battery, and empty-aircraft contributions through representative battery- and empty-weight fractions. For a trial take-off mass , the procedure used
and
where EWF and BMF denote the empty-weight and battery-mass fractions, respectively. Iteration was continued until consistency was obtained between the calculated and tentative empty masses. The converged conceptual value was approximately . The convergence history of the iterative mass estimate is shown in Figure 1.
The conceptual design point was then identified through a constraint analysis in terms of wing loading and power loading . Six criteria were considered: stall speed, catapult launch, cruise, maneuvering flight, rate of climb, and climb gradient. For example, the stall boundary followed
The resulting conceptual design adopted a wing loading of approximately . Combined with the mass estimate, this produced a reference wing area of approximately . The imposed span then corresponded to an initial aspect ratio of approximately 7.73. The resulting feasible sizing region and selected design point are illustrated in Figure 2.
The main conceptual wing had a taper ratio of 0.5, a root chord of approximately , a tip chord of approximately , and a mean aerodynamic chord of approximately . These values subsequently changed as the aircraft transitioned to preliminary design.
Airfoil selection was carried out using a weighted decision matrix rather than a single aerodynamic metric. Candidate sections were assessed in four groups: aerodynamic performance, structural/integration suitability, operational maturity, and handling/control. The corresponding weights were 0.50, 0.25, 0.15, and 0.10. Evaluation criteria included , loiter drag, stall behavior, roughness sensitivity, pitching moment, available structural thickness, control surface compatibility, manufacturability, data maturity, and aileron authority near stall. The matrix produced several closely ranked candidates. The well-known DAE31 airfoil obtained a weighted score of 8.0, hence it was subsequently adopted for the preliminary wing definition.
The conceptual fuselage was defined around subsystem packaging and the required longitudinal center-of-gravity range. A first component-based weight build-up yielded a mass of approximately without component margins and a longitudinal CG position of approximately . With component-level margins included, the estimated mass increased to approximately and the CG shifted to approximately .
The corresponding analytical longitudinal-stability calculations [7] yielded positive stick-fixed static margins of approximately and for the two mass distributions. For the margin-inclusive case, the corresponding stick-free static margin was approximately . These calculations were used as early verification that the component arrangement and wing position were compatible with a statically stable configuration before higher-fidelity aerodynamic models became available.
In terms of the tail, a V-tail configuration was selected. The complete analytical methodology used to size the V-tail and estimate its associated stability and control derivatives is reported separately in [20]. The method combines classical V-tail theory with conventional aircraft stability relationships and was subsequently verified using low- and high-fidelity aerodynamic analyses. The resulting V-tail geometry was carried into the complete aircraft model. The corresponding conceptual aircraft arrangement is shown in Figure 3.
During preliminary design, the wing area was refined to approximately while the span was retained. The resulting aspect ratio increased to 8.8. The planform employed a taper ratio of 0.5, root and tip chords of approximately and , respectively, and a mean aerodynamic chord of approximately . The DAE31 section was retained as the preliminary wing airfoil.
Component-level CFD was used to evaluate the wing over the principal mission conditions and to obtain distributed aerodynamic loads. The wing was divided spanwise to identify local stall development and to support control-surface sizing. At full-aircraft level, preliminary CFD predicted stall at approximately angle of attack. For a take-off mass, the required angles of attack for cruise, climb, and loiter were approximately , , and , respectively. For the higher mass condition, the corresponding values were approximately , , and . Thus, the principal mission points remained below the predicted preliminary stall angle.
The preliminary structural wing development involved a substantial trade-off between two competing concepts. The Plan A family employed lighter structural arrangements but showed sensitivity to local skin buckling. Alternative reinforcements, additional ribs, sandwich skins, and spar configurations were therefore examined. The Plan B concept used a stiffer front-spar arrangement and ultimately provided lower deformation and improved buckling behavior.
Compared with Plan A, Plan B was approximately 150– heavier but reduced wingtip deflection by approximately , increased the buckling load factors substantially, reduced static-aeroelastic twist, and simplified the structural connection between the front spar and the interconnection member. After successive mass-reduction iterations, Plan B configuration was selected. For the half-wing FE model, the selected configuration had a mass of approximately , positive and negative buckling load factors of approximately 2.10 and 3.69, a maximum tip deflection of approximately , and a very small tip twist of approximately . No flutter instability was identified within the investigated preliminary-design envelope. The selected preliminary wing configuration and its integrated subsystems are illustrated in Figure 4.
The complete preliminary finite-element model subsequently integrated the selected wing, fuselage, onboard equipment, and empennage into a half-aircraft representation using symmetry boundary conditions. The preliminary full-aircraft structure exhibited buckling load factors of approximately 1.81 and 1.30 for the two critical load combinations considered at that stage. The first five free–free structural frequencies were approximately 7.96, 25.42, 28.79, 31.06, and , associated primarily with equipment-floor motion, fuselage bending, wing bending, and combined wing–fuselage modes.
The resulting preliminary airframe mass was approximately . This value exceeded the intermediate structural mass target and motivated further mass reduction during detailed design. The preliminary stage therefore did not merely verify the initial concept; it identified the structural regions and system-level quantities requiring further refinement before configuration freeze. Representative preliminary aerodynamic and structural models are shown together in Figure 5.
The updated structural mass was propagated to the weight-and-balance model, while preliminary propulsion studies examined alternative APC propellers and the motor operating limits. Low- and high-fidelity aerodynamic data were then used to update stability, control, and mission performance calculations. This progressive exchange of information between disciplines established the baseline configuration for final detailed verification.
2.3. Detailed Multidisciplinary Design and Verification
The detailed-design stage represented the final numerical verification of the aircraft configuration prior to prototype-level flight assessment. The basic aerodynamic architecture was retained, but the geometric and physical representation was increased to a level representative of a Critical Design Review. Manufacturing constraints, structural interfaces, external components, subsystem integration, realistic loading, and detailed mass properties were incorporated explicitly.
The external aerodynamic model was analyzed in ANSYS Fluent using a steady-state, incompressible Reynolds-averaged Navier–Stokes formulation discretized with the finite volume method [24]. The computational domain and atmospheric properties were adjusted to the corresponding mission altitude and velocity. A mesh-independence study preceded the production calculations, with local Bodies of Influence used around projecting external components, control-surface stagnation regions, and cooling-duct openings in order to increase local resolution without refining the entire domain. Poly-hexcore meshes with boundary-layer inflation were employed during the final turbulence-model assessment. For the Transition SST cases, the representative full-aircraft mesh used a target near-wall resolution of approximately , 17 boundary-layer cells, a first-layer height of approximately , and approximately million cells in a domain. These values characterize the refined mesh used in the detailed turbulence-model study; the production meshes retained the same local-refinement strategy.
The principal operating conditions are summarized in Table 3. Six RANS turbulence formulations were examined during the detailed-design investigation: Spalart–Allmaras, standard k–, SST k–, BSL k–, GEKO k–, and Transition SST k–. Comparison of the predicted integrated loads and flow separation patterns led to selection of the Transition SST formulation for the principal complete-aircraft simulations, particularly because of its improved representation of transition and separated flow at the higher investigated angles of attack. Additional mesh characteristics and quantitative turbulence-model comparisons are provided in Appendix B. In the full-aircraft comparison at , the Transition SST and Spalart–Allmaras solutions differed in lift by approximately , , and and in drag by approximately , , and at , , and angle of attack, respectively.
Symmetry was employed for symmetric angle-of-attack and symmetric control-deflection cases, while the complete aircraft was retained for sideslip, differential aileron motion, and other asymmetric conditions. The resulting aerodynamic database provided force and moment coefficients, stability derivatives, control-surface effectiveness, trim data, and surface-pressure fields for structural loading. During the mesh and turbulence-model studies, numerical convergence was monitored through the residual behavior together with the stabilization of the integrated aerodynamic forces. Critical structural and aeroelastic cases were selected from the full aerodynamic campaign. The principal cases used in the final structural and aeroelastic verification are summarized in Table 4.
The detailed structural model was developed in MSC Patran/Nastran. Thin-walled components were represented predominantly using CQUAD4 shell elements, with TRIA3 elements introduced where required by geometric constraints and solid elements used in thicker regions. The wing structure incorporated front and rear spars, sandwich skins, composite and foam ribs, aileron structure, local plugs, and the control-surface hinge representation. The fuselage model included monolithic and sandwich skin regions, bulkheads, internal floors, longerons, local reinforcements, and concentrated equipment masses.
The mechanical properties adopted in the finite-element model are summarized in Appendix A. The composite and core material properties are reported in Table A1, while the properties of the metallic, foam, and adhesive materials are provided in Table A2. These material definitions were used consistently in the subsequent static, buckling, modal, and aeroelastic analyses.
For the detailed static structural calculations, inertia relief was employed to represent the unconstrained aircraft under the combined gravitational, aerodynamic, propulsion, and gyroscopic loads. The high-fidelity CFD surface-pressure fields were transferred from the aerodynamic discretization to the structural mesh within the ANSYS environment, with external MATLAB routines supporting the coupling and data-transfer procedure. Because the aerodynamic and structural meshes were non-coincident, the transferred loads were checked at aircraft level by comparing the resultant force and moment components before they were accepted for structural analysis. This verification step was retained for the critical cases so that interpolation of the distributed pressure field did not introduce a significant imbalance in the global aerodynamic loading. The transferred aerodynamic loads were then combined with maximum engine thrust and torque where applicable, and the ultimate loading combinations incorporated the adopted structural safety factors. The numerical analysis sequence is summarized in Table 5.
The aeroelastic models required a different treatment from the free-flight static model. The aerodynamic surfaces and structural model were coupled through the Doublet Lattice Method (DLM)-based aeroelastic representation and the aircraft was constrained at the center-of-gravity location for the SOL 144 and SOL 145 calculations. The control surfaces were defined explicitly through the corresponding aerodynamic control-surface entries and hinge-line coordinate systems. Representative detailed structural and aeroelastic models are shown in Figure 6.
The detailed aerodynamic database was also used for final static and dynamic stability analysis. Static stability was evaluated using the complete-aircraft CFD force and moment derivatives, while the dynamic model considered the short-period, phugoid, Dutch-roll, roll-subsidence, and spiral modes in a conventional small-disturbance framework [25].
Following structural and aeroelastic verification, the updated structural mass and aerodynamic coefficients were propagated to the propulsion and performance models. The detailed propulsion assessment imposed several operating constraints: generated advance speed had to satisfy the required flight speed, generated thrust had to exceed the required thrust, propeller power had to remain below the motor output capability of approximately , continuous torque had to remain below approximately , and continuous motor speed had to remain below .
The APC propeller was selected for the final analysis. APC provided attractive aerodynamic performance but exceeded the nominal motor-torque constraint in the investigated operating range. Three battery-energy scenarios were subsequently analyzed: climb and operation at ASL, climb and cruise at ASL followed by loiter at , and climb and cruise at ASL followed by loiter at .
2.4. Prototype Manufacturing and Flight-Test Methodology
Following completion of the numerical verification, a representative flight-test article was fabricated to assess the aerodynamic configuration, stability, controllability, and basic flight performance under operational conditions. The test vehicle retained the principal aircraft architecture—fixed wing, V-tail, aft-mounted electric pusher propulsion, ailerons, and ruddervators—but it was not physically identical to the complete composite structural configuration analyzed during detailed design.
The flight-test airframe was manufactured using 3D-printing techniques to enable rapid fabrication and early flight trials. The principal test-vehicle characteristics are listed in Table 6.
The onboard instrumentation included GPS, airspeed sensing, and telemetry for real-time monitoring and post-flight data analysis. An FPV camera supplying analog video was installed to represent the intended surveillance functionality, while a datalink provided live transmission to the ground station. Video-recording capability was also included.
Flight testing was conducted at a designated UAV test area in an unpopulated region with sufficient airspace for maneuver execution. Testing was restricted to visual meteorological conditions with wind below , no precipitation, and visibility exceeding . Ambient temperature and atmospheric pressure were recorded before testing to support subsequent normalization of the aerodynamic quantities.
The initial flight program was conducted under Visual Line of Sight operation using manual pilot control. The prescribed test profile required take-off using either the catapult or detachable undercarriage, climb to approximately , and execution of representative figure-eight maneuvers. The subsequent campaign included straight-and-level flight, climb, circular turns, figure-eight trajectories, sustained turns, low-speed flight, approach, go-around, and landing.
The experimental assessment combined qualitative handling observations with quantitative data reduction. Rather than fitting the complete transient flight history, discrete representative segments were isolated from the recorded GPS trajectory for straight-and-level flight, climb, and sustained level turns. Each selected segment was treated as a quasi-steady operating condition and characterized by its measured GPS velocity together with the additional trajectory quantity required for the corresponding force balance: flight-path angle for climb and turn geometry and bank angle for sustained turning flight.
For straight-and-level flight,
and therefore
The corresponding drag coefficient was inferred by equating aerodynamic drag with the required propulsive thrust:
giving
The thrust T was not measured directly in flight; it was obtained from the propulsion model at the measured flight speed. The resulting values should therefore be interpreted as flight-derived quantities dependent on the propulsion-model calibration.
For climbing flight, the lift requirement was evaluated from
where is the reconstructed flight-path angle. The drag coefficient followed from the corresponding force balance along the flight path and the modeled thrust.
For sustained level turns,
where denotes the reconstructed bank angle. Turn radius, velocity, bank angle, load factor, and the corresponding aerodynamic coefficients were evaluated for each selected quasi-steady segment.
The detailed-design CFD database was subsequently used to associate each flight-derived lift coefficient with a corresponding angle of attack and to compare the resulting , , and characteristics under the three investigated flight conditions.
3. Results
3.1. Aircraft Design Evolution and Final Configuration
The design evolved progressively rather than through a sequence of fundamentally different aircraft concepts. The fixed wing, V-tail, aft electric pusher propulsion system, and internally integrated payload and avionics were established during conceptual design and retained through preliminary and detailed development.
The conceptual sizing stage produced an initial take-off mass of approximately , a wing area of , and an aspect ratio of approximately 7.73. Preliminary aerodynamic and structural refinement reduced the wing area to approximately while retaining the span, increasing the aspect ratio to 8.8.
The preliminary structural stage proved particularly important because it identified several incompatibilities that were not evident from conceptual sizing alone. The selected wing architecture resulted from a compromise between mass, manufacturability, buckling resistance, stiffness, and aeroelastic behavior rather than from minimum structural mass alone. The complete preliminary airframe had a nominal mass of approximately and required additional mass reduction during the detailed-design phase.
The corresponding preliminary integrated aircraft mass was approximately before the final design margin, with the longitudinal CG located at approximately and a static margin close to .
Table 7.
Evolution of selected aircraft parameters through the design process.
| Parameter | Conceptual | Preliminary | Detailed |
|---|---|---|---|
| Design mass basis (kg) | 12.7 | 13.66 | 14.04 * |
| Wing reference area () | 0.684 | 0.601 | 0.601 |
| Wingspan (m) | 2.30 | 2.30 | 2.30 |
| Wing aspect ratio | 7.73 | 8.80 | 8.80 |
| Wing taper ratio | 0.50 | 0.50 | 0.50 |
| Wing mean aerodynamic chord (m) | 0.308 | 0.271 | 0.271 |
| Cruise speed (m/s) | 22.2 | 23.7 | 23.7 |
| Nominal airframe mass (kg) | – | 4.796 | 4.644 |
* Maximum detailed-design UAV mass including onboard systems and design margins.
Detailed structural refinement reduced the nominal airframe mass from approximately to . When the prescribed structural margins were included, the airframe mass increased to approximately , while the maximum complete detailed-design mass including onboard systems and design margins was approximately .
The detailed design also incorporated external antennas, pitot probe, catapult interfaces, wing-locking features, manufacturing-driven fuselage changes, and the cooling architecture reported in [22]. A representative view of the final detailed external configuration is provided in Figure 7, highlighting the integration of the external subsystem installations and cooling features within the frozen aircraft geometry.
The final mass remained below the broader system-level ceiling, but it exceeded the nominal platform target defined at the beginning of the program. Similarly, the final span lies exactly at the numerical value associated with the early “” requirement and should therefore be interpreted as a boundary design value rather than as having strict numerical margin.
3.2. Aerodynamic, Structural, Aeroelastic, and Performance Assessment
The final high-fidelity aerodynamic analyses produced a maximum lift coefficient of
and a lift-curve slope of approximately
These values were subsequently employed in the final maneuver and gust-envelope construction.
The detailed neutral-point calculation produced an average value of approximately
The detailed trim assessment considered longitudinal CG positions of approximately , , and to represent the investigated mass-distribution range. Using the final mean aerodynamic chord of together with the average high-fidelity neutral-point location above, these positions correspond to static margins of approximately , , and , respectively. The final configuration therefore retained a positive longitudinal static margin throughout the investigated CG range.
The static aerodynamic derivatives showed the expected stabilizing tendencies over the principal operating conditions, while explicit control-deflection analyses were used to quantify aileron and ruddervator authority.
At angle of attack, the aileron retained approximately of its zero-angle-of-attack effectiveness. This result was close to the approximately effectiveness predicted during preliminary design, demonstrating useful consistency between the preliminary and detailed aerodynamic descriptions. The principal high-fidelity lift, drag, and pitching-moment trends are summarized in Figure 8.
The dynamic-stability analysis introduced additional nuance. The lateral-directional modes exhibited satisfactory damping over the investigated stall, climb, loiter, and cruise conditions. The calculated Dutch-roll damping ratios ranged from approximately 0.76 to 0.91, and the lateral-mode acceptance criteria used in the detailed-design study were classified according to U.S. military standards [26] for the specific UAV category as Level I throughout the investigated operating conditions.
The longitudinal behavior was also generally well damped away from stall. The short-period damping ratio decreased from approximately 0.64 at the stall-speed condition to approximately 0.55 at cruise, while remaining stable. The phugoid mode, however, was slightly unstable at the investigated stall condition, with a damping ratio of approximately . The same mode became positively damped at climb, loiter, and cruise, with damping ratios of approximately 0.053, 0.055, and 0.122, respectively. Thus, the high-fidelity stability model identifies a marginal low-speed longitudinal dynamic condition that is obscured by a simple statement of globally satisfactory stability. The corresponding lateral-directional and longitudinal pole locations are shown in Figure 9.
The detailed structural analyses were performed for the five governing load cases identified previously. The maximum wing displacement was approximately , with a maximum absolute tip twist of approximately . The corresponding maximum V-tail displacement was approximately , while the fuselage displacement remained much smaller.
Table 8.
Summary of the most demanding detailed structural results.
| Quantity | Wing | V-Tail | Fuselage |
|---|---|---|---|
| Maximum displacement (mm) | 32.2 | 21.4 | 1.65 |
| Maximum absolute tip twist (°) | 1.93 | 0.53 | – |
| Minimum composite FoS | 7.56 | 7.60 | 6.00 |
| Minimum foam/core FoS | 2.11 | 2.10 | 2.00 |
| Minimum metallic FoS | – | – | 2.00 |
| Minimum reported buckling load factor | 2.14 |
The minimum composite-material safety factor over the complete structure was 6.0, while the minimum foam/core and metallic safety factors were approximately 2.0. The calculated buckling load factors exceeded 2.0 over the detailed load-case set. Representative displacement and stress fields for the governing C1 case are shown in Figure 10.
An important part of the multidisciplinary verification was the comparison between the CFD-derived structural loading and the DLM-based rigid and aeroelastic loads. The dominant vertical aerodynamic force for each load case is summarized in Table 9.
The comparison shows that the dominant loading trends were generally reproduced, although the agreement was not uniform across all conditions. Differences arise because the DLM model excludes detailed fuselage and external-device aerodynamics and is based on a linear potential-flow formulation that cannot reproduce separated or strongly nonlinear flow. The C3 result in particular demonstrates that the elastic DLM response can differ substantially from both the rigid DLM and transferred CFD load, emphasizing the importance of retaining high-fidelity load information when defining critical structural cases.
Static and dynamic aeroelastic analyses were then used to investigate divergence and flutter. No divergence root was identified within the operational envelope. The first formal divergence root of the linearized model occurred near . Because this lies far beyond both the aircraft design range and the applicability of the low-speed aerodynamic model, the meaningful conclusion is simply that divergence is not a governing instability within the relevant envelope.
Flutter calculations were performed over approximately 10– for all five governing cases. No unstable flutter mode was identified within this range. Since for corresponds to approximately , the investigated flutter range extended beyond the specified aeroelastic verification margin. Representative V–g and V–f results for the C1 case are presented in Figure 11.
The modal assessment was also used to examine possible propulsion-induced resonance. The principal motor excitation frequencies were approximately during climb, during cruise, and during loiter. The first five relevant rear-bulkhead structural frequencies were between approximately 166 and . No direct overlap with the principal excitation frequencies was identified for the investigated normal operating conditions.
The final flight envelope was constructed using the detailed aerodynamic coefficients and the adopted STANAG-derived requirements [23]. The maximum positive maneuver load factor within the operational envelope reached approximately , while the corresponding negative value reached approximately . For the dive condition, the corresponding limits were approximately and .
The resulting maneuver and gust envelope used for structural verification is shown in Figure 12.
The APC propeller satisfied the motor torque and power constraints over the principal mission conditions. The predicted maximum level-flight speed ranged from approximately at sea level to at ASL. The minimum-power speed was approximately 18– and the minimum-drag speed approximately 21–, depending on altitude.
The three battery and mission scenarios are summarized in Table 10.
The nominal mission meets the range and endurance objectives numerically, with a total predicted duration of approximately . However, its calculated energy consumption is almost identical to the approximately available battery energy and therefore leaves essentially no explicit operational reserve. The higher-altitude scenarios required corresponding mission-duration or range reductions in order to remain within the same battery-energy budget.
3.3. Flight-Test Results and Numerical Validation
The flight campaign provided the experimental closure of the design process by examining the physical test article under representative operational conditions. During the take-off run, the aircraft exhibited a slight left-yaw tendency consistent with propeller-induced effects, but only small corrective inputs were required. Rotation occurred at approximately and was followed by a stable initial climb.
After the first turn, the aircraft was trimmed using small pitch and roll corrections. The subsequent flight included oval trajectories, turns, figure-eight maneuvers, climb and cruise segments, and low-speed flight. The aircraft response remained progressive and predictable throughout these maneuvers, with no abrupt attitude changes. Adverse yaw associated with roll inputs was observable during maneuvering flight.
A deliberate low-speed pass was conducted before landing. The aircraft was not driven into a full stall because the pilot retained a conservative airspeed margin. During the first landing approach, the aircraft decelerated more rapidly than intended following thrust reduction, and a go-around was executed successfully. On the subsequent landing, pilot-induced oscillations developed close to the ground and were attributed in the post-flight assessment to pilot overcorrection associated with the rapid change in descent behavior on entering ground effect. The recorded flight trajectory used to identify the representative analysis segments is shown in Figure 13.
For straight-and-level flight, nine representative segments were extracted over a velocity range from approximately to . The flight-derived aerodynamic coefficients followed the detailed CFD trends closely. The drag-coefficient deviation remained below in magnitude for all selected segments, with the largest difference equal to approximately .
The cruise comparison was particularly close at the higher test speeds, where several segments exhibited drag differences below . This provides useful support for the steady CFD database under attached-flow, low-to-moderate angle-of-attack conditions.
Seven representative climb segments were subsequently isolated at velocities between approximately and . The reconstructed climb angles ranged from approximately to . The corresponding drag-coefficient differences remained between approximately and .
Table 11.
Summary of the numerical–experimental aerodynamic comparison.
| Condition | Segments | Velocity range | deviation | Maximum deviation |
|---|---|---|---|---|
| (m/s) | range (%) | (%) | ||
| Level flight | 9 | 17.47–31.13 | to | 2.71 |
| Climb | 7 | 23.02–25.23 | to | 1.41 |
| Sustained turn | 10 | 25.05–28.28 | to | 16.19 |
The corresponding lift–drag comparisons for straight-and-level flight and climb are shown in Figure 14.
The sustained-turn comparison was more demanding. Ten representative turning segments were identified at velocities between approximately and . The reconstructed bank angles ranged from approximately to , corresponding to load factors between about 1.22 and 1.66.
For every sustained-turn segment, the flight-derived drag coefficient was higher than the corresponding steady CFD prediction. The discrepancy ranged from approximately to . In contrast, the lift-coefficient trends remained consistent with the detailed numerical data. The corresponding sustained-turn lift–drag comparison is shown in Figure 15.
Several factors can contribute to the increased turn discrepancy. Maneuvering flight can involve sideslip, continuous control-surface activity, local separation, and additional three-dimensional aerodynamic losses that are not represented fully by the corresponding steady CFD condition. In addition, the bank angle is reconstructed from the flight trajectory and the drag coefficient is inferred using the propulsion model rather than measured directly. Thus, uncertainty in both the flight state and the thrust estimate propagates directly into the derived .
The experimental agreement should also be interpreted in the context of the test article. The flight vehicle had a take-off mass of approximately and was manufactured primarily by 3D printing, whereas the detailed numerical structural model corresponds to the fully integrated composite configuration with a maximum design mass of approximately . The flight campaign therefore validates the principal aerodynamic configuration, stability and control behavior, and combined numerical methodology; it does not constitute direct structural qualification of the detailed composite airframe.
3.4. Discussion
The results demonstrate the benefit of increasing analysis fidelity together with design maturity. Conceptual methods were sufficient to establish the initial aircraft architecture and feasible sizing region, but preliminary multidisciplinary analyses exposed several features that required further refinement. In particular, the preliminary wing design showed that minimum mass alone was insufficient as a structural selection criterion: the ultimately selected configuration was somewhat heavier than the competing concept, but provided substantially lower deformation, improved buckling behavior, and better static-aeroelastic characteristics.
The progression from conceptual to preliminary and detailed design also demonstrates the importance of closing disciplinary loops. Aerodynamic data influence structural loads and propulsion requirements; structural refinement changes aircraft mass and CG; mass and aerodynamic updates modify trim, stability, propulsion demand, and mission energy. Treating these analyses as a one-way sequence would therefore obscure several of the design compromises observed during development.
The detailed aerodynamic and structural models were generally consistent with the preliminary trends, but the increased fidelity also revealed limitations that are important for interpretation. The marginally unstable phugoid predicted at the investigated stall condition is one example. The aircraft remained stable in the principal climb, loiter, and cruise conditions and was controllable during the experimental low-speed assessment, but the numerical result indicates that low-speed longitudinal dynamics warrant additional attention during any future envelope-expansion campaign.
The aeroelastic comparisons similarly illustrate the distinction between model verification and literal physical prediction. The formal divergence root near has little physical significance for this aircraft; the relevant engineering conclusion is simply that divergence does not govern the operational envelope. Likewise, the DLM reproduces the overall aerodynamic loading trends but cannot represent all nonlinear viscous and separated-flow phenomena contained in the CFD database.
Mission-energy margin is another area where a simple “requirement satisfied” statement would be misleading. The nominal mission achieves the target range and endurance numerically, but the predicted energy consumption is nearly equal to the available battery energy. A flight-operational configuration would normally require additional allowance for battery aging, temperature, wind, reserve policy, propulsion uncertainty, and contingency maneuvers. The present result therefore establishes the numerical feasibility of the mission model rather than a robust operational energy margin.
Table 12 summarizes the principal quantitative requirements that can be compared directly with the final numerical or experimental results.
Overall, several core aerodynamic, structural, and mission objectives were achieved, but the nominal mass target was exceeded, the span lies on the stated dimensional boundary, and the nominal mission-energy reserve is negligible. The flight campaign also provides an additional but intentionally bounded validation level. The close cruise and climb correlation supports the aerodynamic database under nominal steady conditions. The increased sustained-turn discrepancy, however, identifies the regime in which improved flight instrumentation and unsteady aerodynamic modeling would provide the greatest benefit. Direct or independently calibrated thrust measurement, angle-of-attack sensing, sideslip measurement, and synchronized control-surface recording would substantially reduce the uncertainty of future numerical–experimental comparisons.
4. Conclusions
This work presented the end-to-end multidisciplinary development of a Class I mini-UAV from mission definition through conceptual and preliminary sizing, detailed aerodynamic, structural, and aeroelastic verification, aircraft integration, and prototype-level flight assessment.
The conceptual stage established an initial design state, a wing, and the basic fixed-wing, V-tail, electric-pusher architecture. Preliminary design refined the wing to approximately and aspect ratio 8.8, introduced complete-aircraft aerodynamics, and produced a structural wing configuration selected on the basis of stiffness, buckling resistance, manufacturability, aeroelastic behavior, and mass rather than minimum weight alone.
Detailed structural refinement reduced nominal airframe mass from approximately to . The complete detailed-design configuration, including onboard systems and design margins, reached approximately . This remained below the system-level ceiling, although it exceeded the earlier nominal target.
High-fidelity CFD yielded a maximum lift coefficient of approximately and confirmed useful control authority across the principal operating conditions. At angle of attack, approximately of the zero-angle-of-attack aileron effectiveness remained. The final dynamic analysis showed well-damped lateral-directional behavior and stable short-period response, while a slightly unstable phugoid was predicted at the investigated stall-speed condition and therefore remains a point for future low-speed flight assessment.
The detailed structural configuration satisfied the adopted strength and buckling criteria for the investigated load cases. The minimum composite safety factor was 6.0, the relevant isotropic/core safety factors remained approximately 2 or higher, and the reported buckling load factors exceeded 2.0. No flutter instability was found over the 10– range, which extended beyond the required aeroelastic margin, and no operationally relevant divergence instability was identified.
The nominal mission model achieved a predicted ground distance and duration. However, the associated energy requirement was almost equal to the available battery energy, indicating essentially no explicit reserve within the reported numerical scenario.
Experimental flight testing of the representative 3D-printed test article showed stable and predictable handling throughout the tested maneuvers. Flight-derived drag characteristics agreed with the detailed CFD/propulsion model to within approximately during straight-and-level flight and approximately during climb. Sustained turns exhibited larger discrepancies of up to approximately , while retaining consistent lift trends.
Because the flight-test article differed in construction and mass from the final composite design, the experiment is interpreted primarily as validation of the aerodynamic configuration, stability and control behavior, and overall development methodology rather than as direct experimental verification of the detailed structural model.
Overall, the UAV development demonstrates that a progressive-fidelity multidisciplinary process can effectively connect early requirements and conceptual aircraft sizing with high-fidelity aerodynamic, structural, and aeroelastic verification and subsequent experimental flight assessment. Future work should focus on flight testing of the fully integrated structural configuration, explicit operational energy reserve, improved onboard measurement of angle of attack, sideslip and propulsion state, direct or independently calibrated thrust estimation, and further low-speed and maneuvering-envelope expansion.
Author Contributions
Conceptualization, E.N., S.K., S.A., P.K. and T.Z.; methodology, E.N., S.K., S.A., P.K. and T.Z.; software, E.N., S.K., S.A., P.K. and T.Z.; validation, E.N., S.K., S.A., P.K. and T.Z.; formal analysis, E.N., S.K., S.A., P.K. and T.Z.; investigation, E.N., S.K., S.A., P.K. and T.Z.; resources, E.N., S.K., S.A., P.K. and T.Z.; data curation, E.N., S.K., S.A., P.K. and T.Z.; writing—original draft preparation, E.N. and S.K.; writing—review and editing, E.N. and S.K.; visualization, E.N., S.K., S.A., P.K. and T.Z.; supervision, E.N., S.K., P.K. and V.K.; project administration, E.N., S.K. and V.K. All authors have read and agreed to the published version of the manuscript.
Funding
This research received no external funding.
Institutional Review Board Statement
Not applicable.
Informed Consent Statement
Not applicable.
Data Availability Statement
The data supporting the findings of this study are available from the corresponding authors upon reasonable request.
Conflicts of Interest
The authors declare no conflict of interest.
Abbreviations
The following abbreviations are used in this manuscript:
| AGL | Above Ground Level |
| AoA | Angle of Attack |
| ASL | Above Sea Level |
| BMF | Battery Mass Fraction |
| CFD | Computational Fluid Dynamics |
| CG | Center of Gravity |
| DLM | Doublet-Lattice Method |
| EWF | Empty Weight Fraction |
| FEM | Finite Element Method |
| FoS | Factor of Safety |
| GCS | Ground Control Station |
| MAC | Mean Aerodynamic Chord |
| MTOW | Maximum Take-Off Weight |
| RANS | Reynolds-Averaged Navier–Stokes |
| UAV | Unmanned Aerial Vehicle |
| VLOS | Visual Line of Sight |
Appendix A. Material Properties Used in the Structural Analyses
The mechanical properties adopted in the finite-element analyses are summarized in Table A1 and Table A2. The values correspond to the material definitions employed during the structural design and verification of the UAV.
Table A1.
Mechanical properties of the composite and core materials used in the structural analyses.
Table A1.
Mechanical properties of the composite and core materials used in the structural analyses.
| Property | SHD VTC401-TDC-200gsm (woven) | SHD VTC401-T700 (UD) | R&G standard carbon fiber | Nomex honeycomb, 3.2-mm cell |
|---|---|---|---|---|
| Density, () | 1450 | 1510 | 1580 | 29 |
| Elastic modulus, | 56.5 GPa | 116.6 GPa | 140 GPa | 72.5 GPa |
| Elastic modulus, | 53.8 GPa | 7.77 GPa | – | 7.1 GPa |
| Poisson’s ratio, | 0.053 | 0.30 | 0.25 | 0.26 |
| In-plane shear modulus, | 3.09 GPa | 3.6 GPa | – | 0.9 GPa |
| Out-of-plane shear modulus, | 3.09 GPa | – | – | 23.9 GPa |
| Out-of-plane shear modulus, | 3.09 GPa | – | – | 14.1 GPa |
| Fiber-direction tensile strength, | 705 MPa | 2354 MPa | 2300 MPa | – |
| Transverse tensile strength, | 705 MPa | 34.3 MPa | – | – |
| Fiber-direction compressive strength, | 725 MPa | 1102 MPa | 1600 MPa | – |
| Transverse compressive strength, | 725 MPa | 184 MPa | – | – |
| In-plane shear strength, | 113.5 MPa | 104.5 MPa | – | – |
| Cured ply thickness | 0.233 mm | 0.306 mm | – | – |
| Fiber volume fraction, | 48.7% | 54.4% | – | – |
Table A2.
Mechanical properties of metallic, foam, and adhesive materials used in the structural analyses.
Table A2.
Mechanical properties of metallic, foam, and adhesive materials used in the structural analyses.
| Property | Al-2024-T3 | 100Cr6 | Divinycell F130 | Rohacell 31A | Rohacell 51A | Rohacell 71A | Loctite EA 9323 |
|---|---|---|---|---|---|---|---|
| Density () | 2700 | 7800 | 130 | 32 | 52 | 75 | – |
| Elastic modulus | 72.4 GPa | 210 GPa | 60 MPa | 36 MPa | 70 MPa | 92 MPa | 2.58 GPa |
| Yield strength | 330 MPa | 740 MPa | – | – | – | – | – |
| Ultimate tensile strength | 435 MPa | 930 MPa | 3.3 MPa | 1.0 MPa | 1.9 MPa | 2.8 MPa | 24.1 MPa |
| Ultimate shear strength | 268 MPa | 605 MPa | 1.7 MPa | 0.4 MPa | 0.8 MPa | 1.3 MPa | 28.9 MPa |
| Ultimate bearing allowable | 655 MPa | – | – | – | – | – | – |
| Compressive strength | – | – | 1.7 MPa | 0.4 MPa | 0.9 MPa | 1.5 MPa | – |
| (wet/dry) | – | – | – | – | – | – |
Appendix B. CFD Mesh and Turbulence-Model Assessment
The detailed aerodynamic methodology included a dedicated turbulence-model assessment for the final UAV geometry. An initial wing-level comparison was used to screen the candidate formulations, after which the study was narrowed to the Transition SST k– and Spalart–Allmaras models for complete-aircraft calculations. The full-aircraft comparison was performed at for angles of attack of , , and .
For the Transition SST calculations, the refined poly-hexcore mesh used a target , 17 boundary-layer cells, a first-layer thickness of , and approximately million cells within a domain. The corresponding Spalart–Allmaras mesh used a target , 17 boundary-layer cells, a first-layer thickness of , and approximately million cells within a domain. The principal mesh characteristics are summarized in Table B1.
Table B1.
Representative full-aircraft mesh characteristics used in the turbulence-model assessment.
Table B1.
Representative full-aircraft mesh characteristics used in the turbulence-model assessment.
| Quantity | Transition SST | Spalart–Allmaras |
|---|---|---|
| Target | 5 | 30 |
| Domain dimensions (m) | ||
| Boundary-layer cells | 17 | 17 |
| First-layer thickness (m) | ||
| Cell type | Poly-hexcore | Poly-hexcore |
| Number of cells | 10,256,619 | 5,970,000 |
| Maximum reported skewness | 0.570 | 0.607 |
| Minimum reported orthogonal quality | 0.270 | 0.272 |
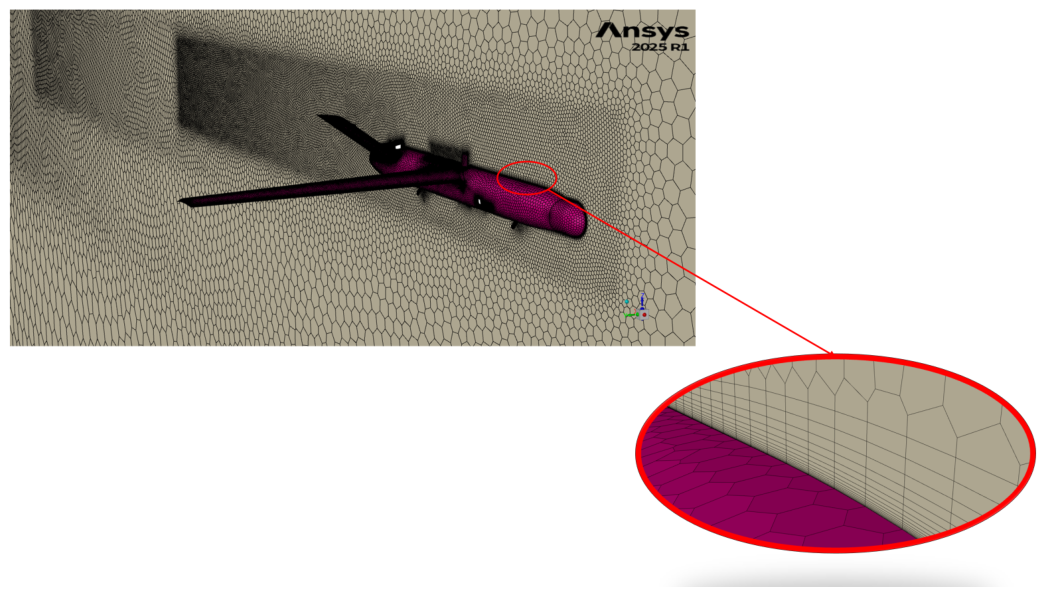
The computational domain and the representative global and near-body mesh refinements used in the complete-aircraft comparison are shown in Figure B1–Figure B3.
Figure B1.
Computational domain used for the full-aircraft CFD turbulence-model assessment.
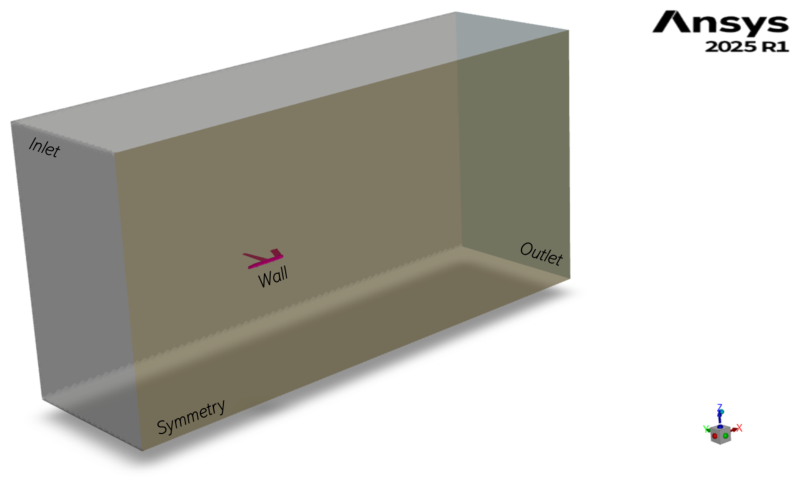
Figure B2.
Representative global poly-hexcore mesh and local refinement surrounding the UAV.
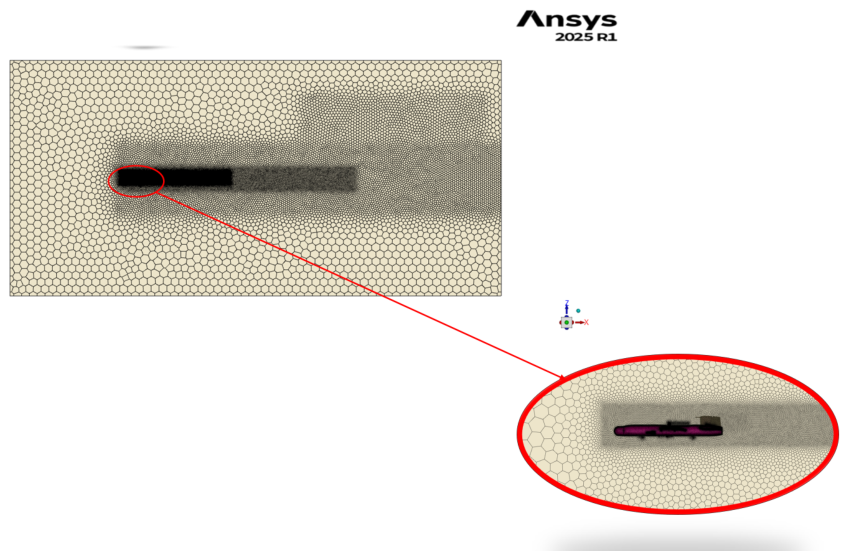
Figure B3.
Detailed near-body and boundary-layer mesh refinement around the final aircraft geometry.
Figure B3.
Detailed near-body and boundary-layer mesh refinement around the final aircraft geometry.
The complete-aircraft force comparison showed close agreement in the integrated lift and drag predictions at the lower angles of attack, with increasing lift sensitivity at . The numerical differences between the two turbulence-model solutions are summarized in Table B2. Across the three conditions, the lift difference increased from approximately to , while the drag difference remained below approximately .
Table B2.
Full-aircraft comparison between Transition SST and Spalart–Allmaras at .
| AoA | Lift difference | Drag difference | ||||
|---|---|---|---|---|---|---|
| (N) | (N) | (%) | (N) | (N) | (%) | |
| 0 | 74.60 | 74.48 | 0.16 | 5.240 | 5.264 | 0.45 |
| 6 | 116.11 | 117.59 | 1.26 | 9.647 | 9.675 | 0.29 |
| 12 | 130.16 | 134.59 | 3.29 | 16.45 | 16.57 | 0.72 |
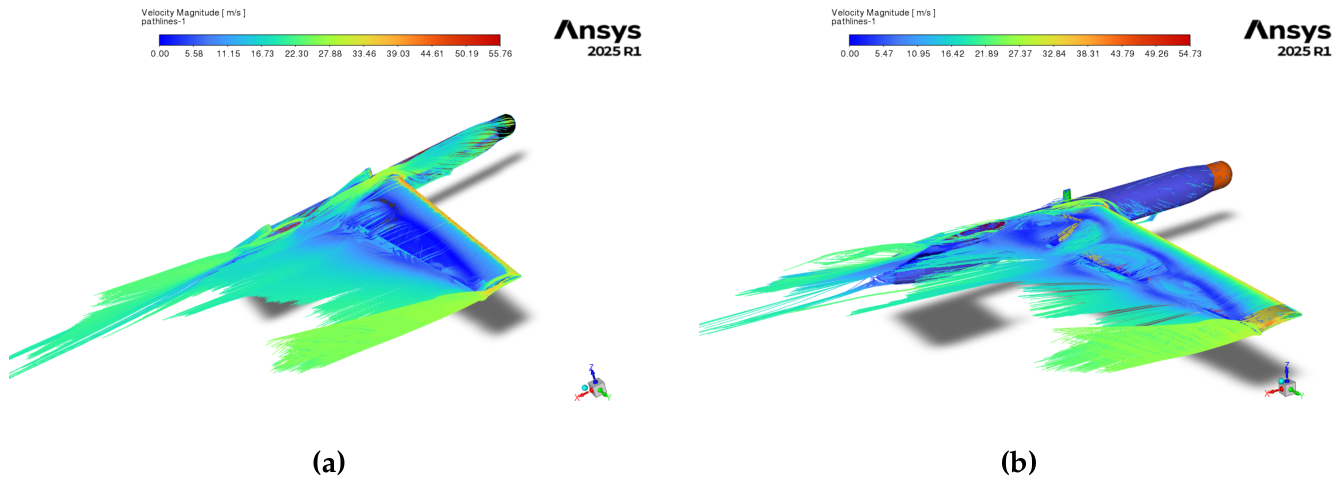
The similarity of the integrated forces did not imply identical local flow prediction. The detailed comparison reported larger differences in pitching moment, reaching approximately for the comparison and for the comparison. Flow-field inspection showed similar attached-flow behavior at and , whereas the models differed more clearly at in their prediction of transition, separation, and the downstream interaction between the wing wake, the disturbance induced by the GPS antenna, and the V-tail flow. These differences were one of the principal reasons for retaining Transition SST for the detailed aerodynamic database. The corresponding pressure-coefficient and temperature-field comparisons are shown in Figure B4, while representative pathline comparisons are shown in Figure B5.
The near-wall resolution assessment showed that approximately of the cells exceeded the target in the Transition SST mesh and approximately exceeded the target in the Spalart–Allmaras mesh. These exceedances were reported primarily in geometrically complex regions, including the catapult and wing-lock pins. The corresponding computational-domain and mesh-refinement views are shown in Figure B1–Figure B3, while the representative turbulence-model surface-field and pathline comparisons are shown in Figure B4 and Figure B5, respectively.
Figure B4.
Representative comparison of full-aircraft flow-field predictions obtained with the Spalart–Allmaras and Transition SST turbulence models: (a) pressure-coefficient distribution for the Spalart–Allmaras model, (b) pressure-coefficient distribution for the Transition SST model, (c) temperature field for the Spalart–Allmaras model, and (d) temperature field for the Transition SST model.
Figure B4.
Representative comparison of full-aircraft flow-field predictions obtained with the Spalart–Allmaras and Transition SST turbulence models: (a) pressure-coefficient distribution for the Spalart–Allmaras model, (b) pressure-coefficient distribution for the Transition SST model, (c) temperature field for the Spalart–Allmaras model, and (d) temperature field for the Transition SST model.
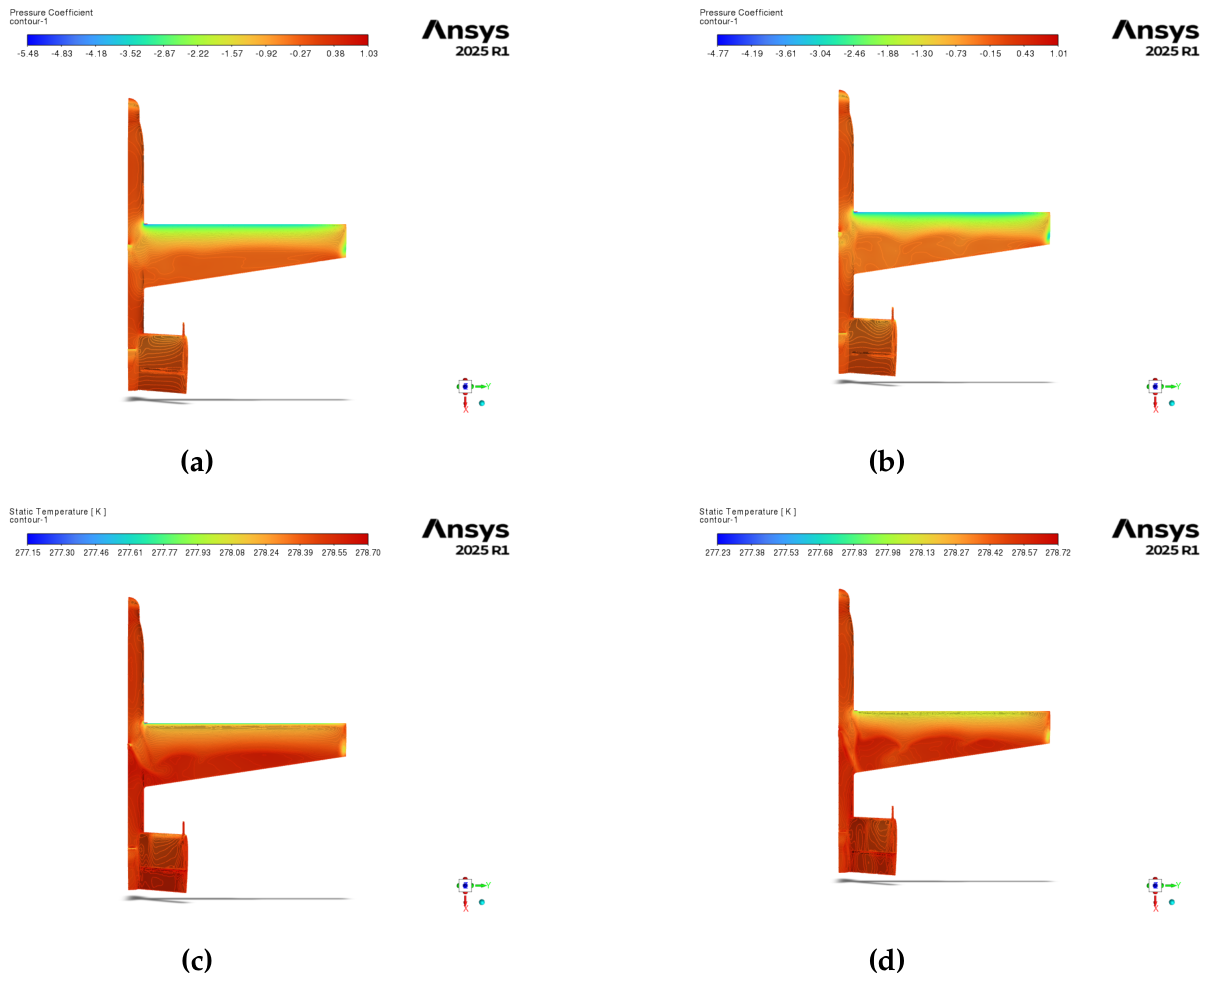
Figure B5.
Representative comparison of full-aircraft pathline predictions obtained with the two turbulence models: (a) Spalart–Allmaras model and (b) Transition SST model.
Figure B5.
Representative comparison of full-aircraft pathline predictions obtained with the two turbulence models: (a) Spalart–Allmaras model and (b) Transition SST model.
References
- Kontogiannis, S.G.; Ekaterinaris, J.A. Design, Performance Evaluation and Optimization of a UAV. Aerosp. Sci. Technol. 2013, 29, 339–350. [Google Scholar] [CrossRef]
- Panagiotou, P.; Kaparos, P.; Salpingidou, C.; Yakinthos, K. Aerodynamic Design of a MALE UAV. Aerosp. Sci. Technol. 2016, 50, 127–138. [Google Scholar] [CrossRef]
- Panagiotou, P.; Yakinthos, K. Aerodynamic Efficiency and Performance Enhancement of Fixed-Wing UAVs. Aerosp. Sci. Technol. 2020, 99, 105575. [Google Scholar] [CrossRef]
- Dündar, Ö.; Bilici, M.; Ünler, T. Design and Performance Analyses of a Fixed-Wing Battery VTOL UAV. Eng. Sci. Technol. An. Int. J. 2020, 23, 1182–1193. [Google Scholar] [CrossRef]
- Zhao, A.; Zhang, J.; Li, K.; Wen, D. Design and Implementation of an Innovative Airborne Electric Propulsion Measure System of Fixed-Wing UAV. Aerosp. Sci. Technol. 2021, 109, 106357. [Google Scholar] [CrossRef]
- Benaouali, A.; Kachel, S. Multidisciplinary Design Optimization of Aircraft Wing Using Commercial Software Integration. Aerosp. Sci. Technol. 2019, 92, 766–776. [Google Scholar] [CrossRef]
- Raymer, D.P. Aircraft Design: A Conceptual Approach. In AIAA Education Series, 6 ed.; American Institute of Aeronautics and Astronautics: Reston, VA, 2018. [Google Scholar]
- Sadraey, M.H. Aircraft Design: A Systems Engineering Approach; John Wiley & Sons: Chichester, UK, 2013. [Google Scholar] [CrossRef]
- Gudmundsson, S. General Aviation Aircraft Design: Applied Methods and Procedures, 2 ed.; Butterworth-Heinemann, 2021. [Google Scholar]
- Campbell, J.P. Also issued as NACA WR-L-212 and NACA-ACR-L5A03; Experimental Verification of a Simplified Vee-Tail Theory and Analysis of Available Data on Complete Models with Vee Tails. Technical Report NACA Report 823, National Advisory Committee for Aeronautics. Washington, D.C., 1945.
- Polhamus, R.J.; Moss, E.C. Wind-Tunnel Investigation of the Stability and Control Characteristics of a Complete Model Equipped with a Vee Tail; Technical Report NACA TN-1478; National Advisory Committee for Aeronautics: Washington, D.C., 1947. [Google Scholar]
- Schade, R.O. Effect of Geometric Dihedral on the Aerodynamic Characteristics of Two Isolated Vee-Tail Surfaces; Technical Report NACA TN-1369; National Advisory Committee for Aeronautics: Washington, D.C., 1947. [Google Scholar]
- Phillips, W.F.; Hansen, A.B.; Nelson, W.M. Effects of Tail Dihedral on Static Stability. J. Aircr. 2006, 43, 1829–1837. [Google Scholar] [CrossRef]
- Zhang, G.Q.; Yu, S.C.M.; Chien, A.; Xu, Y. Investigation of the Tail Dihedral Effects on the Aerodynamic Characteristics for the Low Speed Aircraft. Adv. Mech. Eng. 2013, 5, 308582. [Google Scholar] [CrossRef]
- Babu, P.H.; Rodriguez Arthurs, S.A.; Basha, S.M.; Sadiq, P. Design and Analysis of V-Tail Unmanned Air Vehicle (UAV) for Surveillance Application. Int. J. Eng. Trends Technol. 2016, 32, 119–123. [Google Scholar] [CrossRef]
- Sanchez-Carmona, A.; Cuerno-Rejado, C. Vee-Tail Conceptual Design Criteria for Commercial Transport Aeroplanes. Chin. J. Aeronaut. 2019, 32, 595–610. [Google Scholar] [CrossRef]
- Leshikar, C.; Valasek, J. System Identification Flight Testing of Inverted V-Tail Small Unmanned Air System. In Proceedings of the AIAA SCITECH 2022 Forum, 2022; American Institute of Aeronautics and Astronautics. [Google Scholar] [CrossRef]
- Liu, J.; Qian, W.; Bai, Y.; Xu, X. Numerical and Experimental Research on Flight Control of a V-Tail Configuration for the Wind Tunnel Model of Aircraft. Aerospace 2022, 9, 792. [Google Scholar] [CrossRef]
- Lesalli, P.V. Preliminary Design and Static Stability Analysis of V-Tail Small Fixed-Wing Unmanned Aerial Vehicle Purposed for Racing Plane Pilots and Anti-Drone Training Platform Using XFLR-5. In Proceedings of the Adisutjipto Aerospace, Science and Engineering International Conference (AASEIC 2024); Atlantis Press, 2025; Vol. 258, Advances in Engineering Research; pp. 75–87. [Google Scholar] [CrossRef]
- Nikolaou, E.; Kilimtzidis, S.; Lappas, V.; Kostopoulos, V. Analytical Methodology for Early-Stage Design and Stability Assessment of V-Tail Class-I UAVs. Aerospace 2026, 13, 658. [Google Scholar] [CrossRef]
- Nikolaou, E.; Karatzas, E.; Kilimtzidis, S.; Kostopoulos, V. Winglet Design for Class I Mini UAV—Aerodynamic and Performance Optimization. Eng. Proc. 2025, 90, 111. [Google Scholar] [CrossRef]
- Nikolaou, E.; Kilimtzidis, S.; Giannaros, E.; Lappas, V.; Kostopoulos, V. Thermal Management of Unmanned Aerial Vehicle Power Systems Using Ducted Forced Convection and Computational Fluid Dynamic Validation. Appl. Sci. 2025, 15, 12508. [Google Scholar] [CrossRef]
- NATO Standardization Office. Technical Report STANAG 4703, Edition 3; AEP-83, Edition C; Light Unmanned Aircraft Systems Airworthiness Requirements. North Atlantic Treaty Organization, 2023.
- ANSYS; Inc. ANSYS Fluent User’s Guide; Canonsburg, PA, USA, 2023. [Google Scholar]
- Napolitano, M.R. Aircraft Dynamics: From Modeling to Simulation; John Wiley & Sons, 2011. [Google Scholar]
- Moorhouse, D.J.; Woodcock, R.J. MIL-F-878SC, Military Specification Flying Qualities of Piloted Airplanes; Technical report; AF Wright Aeronautical Laboratories, 1982. [Google Scholar]
Figure 1.
Convergence history of the conceptual-design take-off-weight estimation.
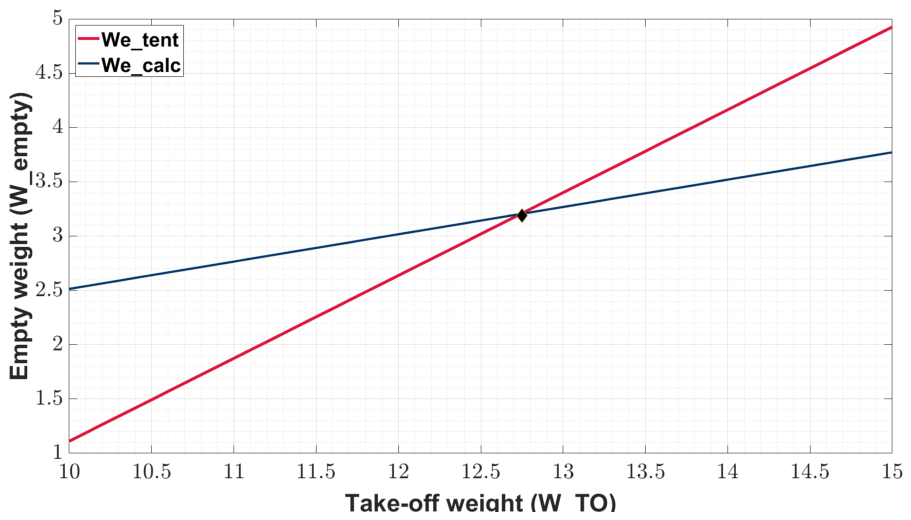
Figure 2.
Constraint diagram used for conceptual selection of wing and power loading.
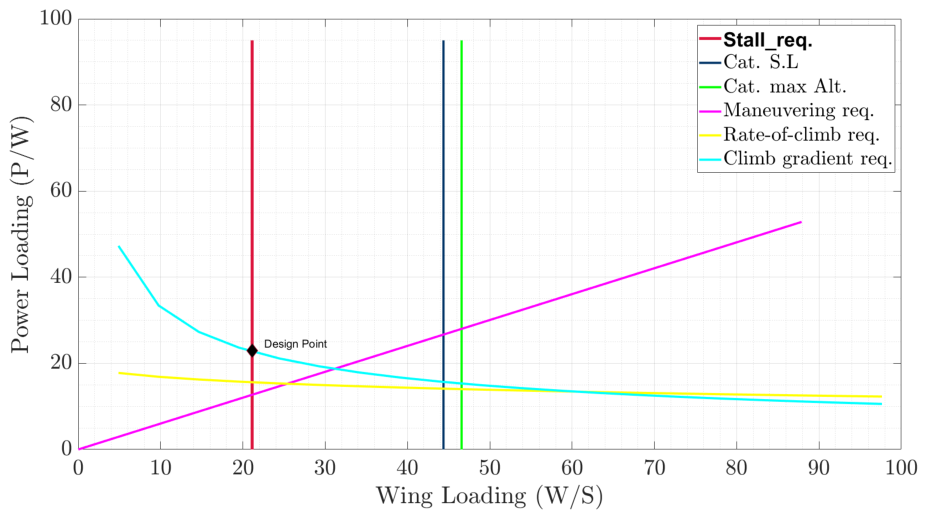
Figure 3.
Conceptual configuration of the Class I mini-UAV.
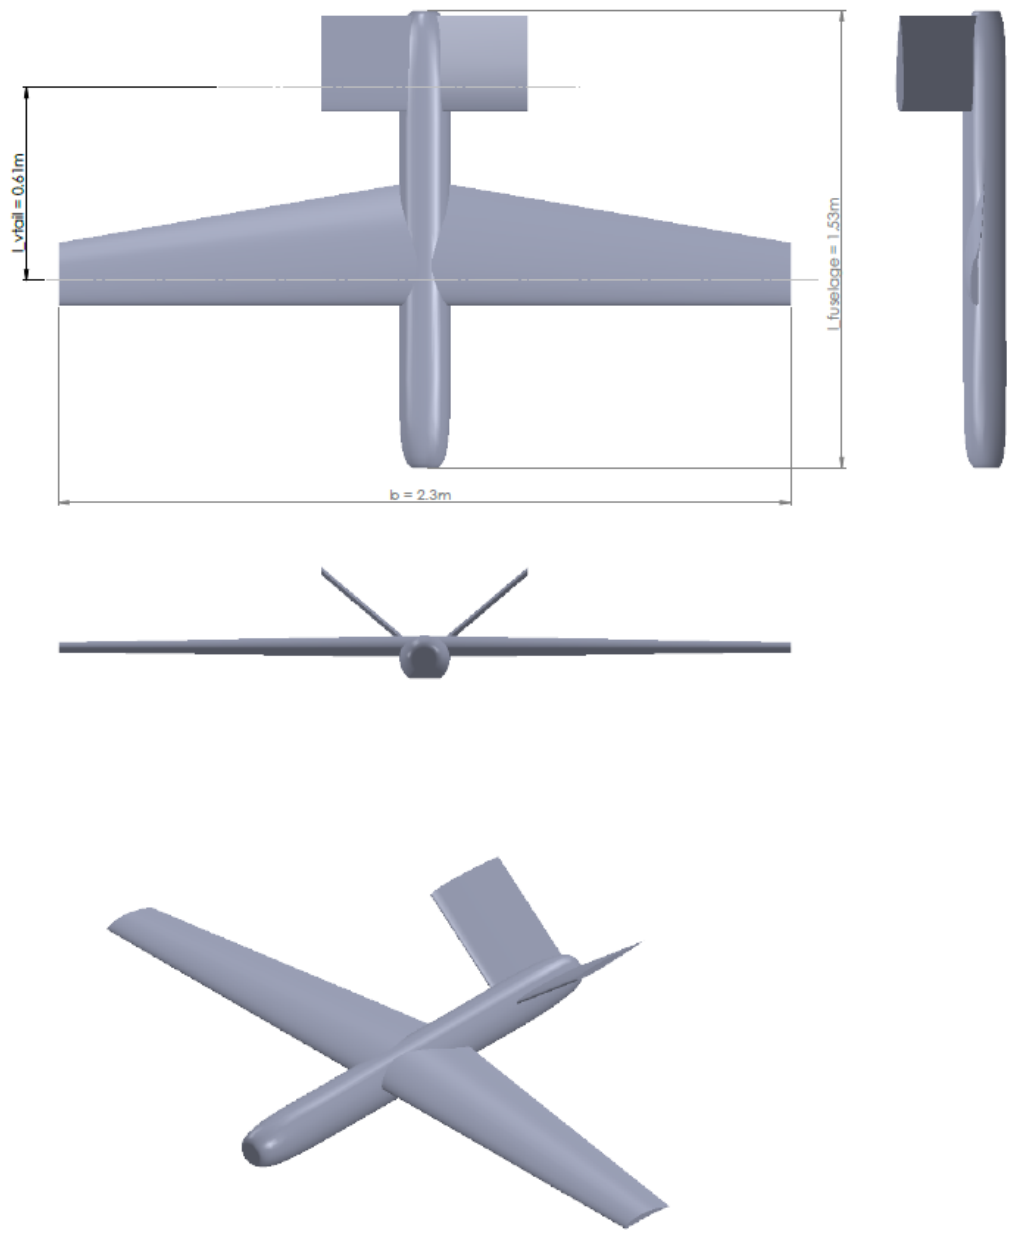
Figure 4.
Selected preliminary wing structural configuration and integrated subsystems: (a) top view, (b) side view, (c) external isometric view, and (d) internal isometric view.
Figure 4.
Selected preliminary wing structural configuration and integrated subsystems: (a) top view, (b) side view, (c) external isometric view, and (d) internal isometric view.
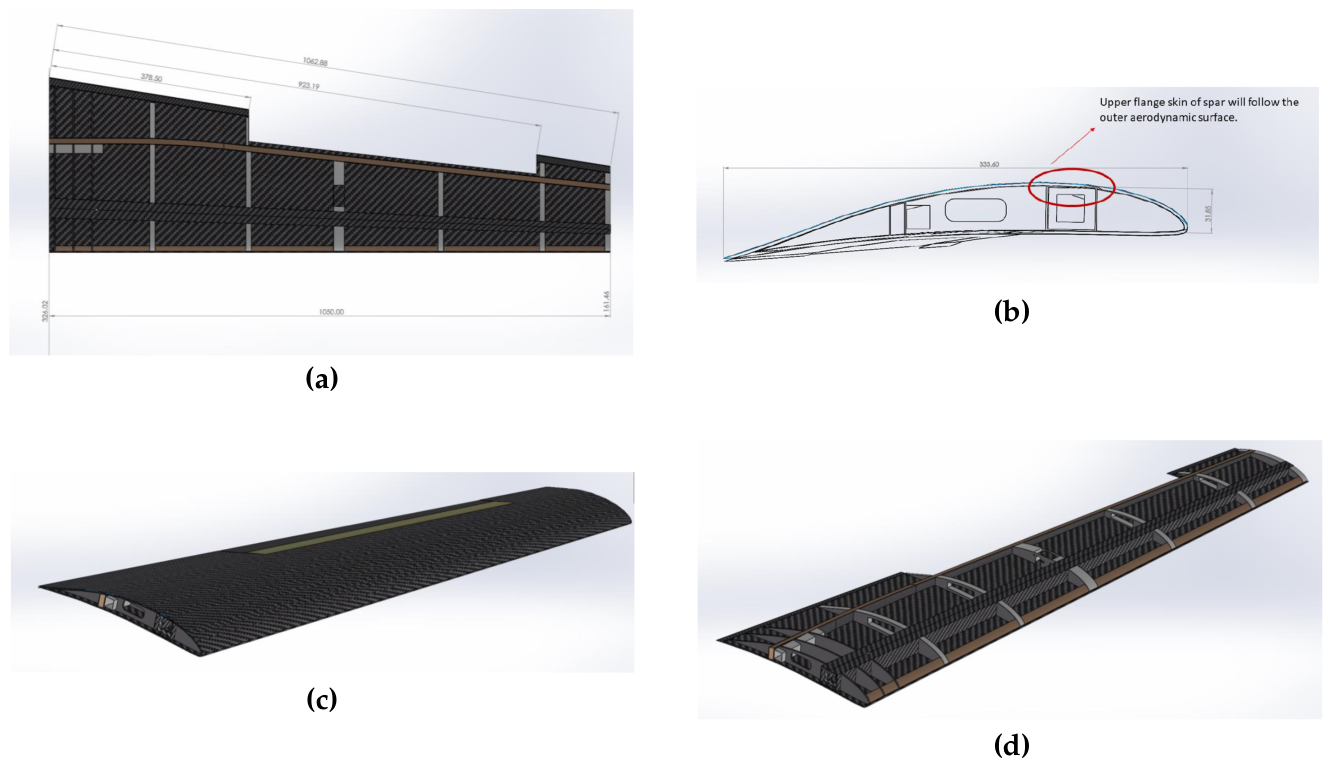
Figure 5.
Representative preliminary multidisciplinary models: (a) complete-aircraft aerodynamic pressure-coefficient field and (b) integrated half-aircraft finite-element model.
Figure 5.
Representative preliminary multidisciplinary models: (a) complete-aircraft aerodynamic pressure-coefficient field and (b) integrated half-aircraft finite-element model.
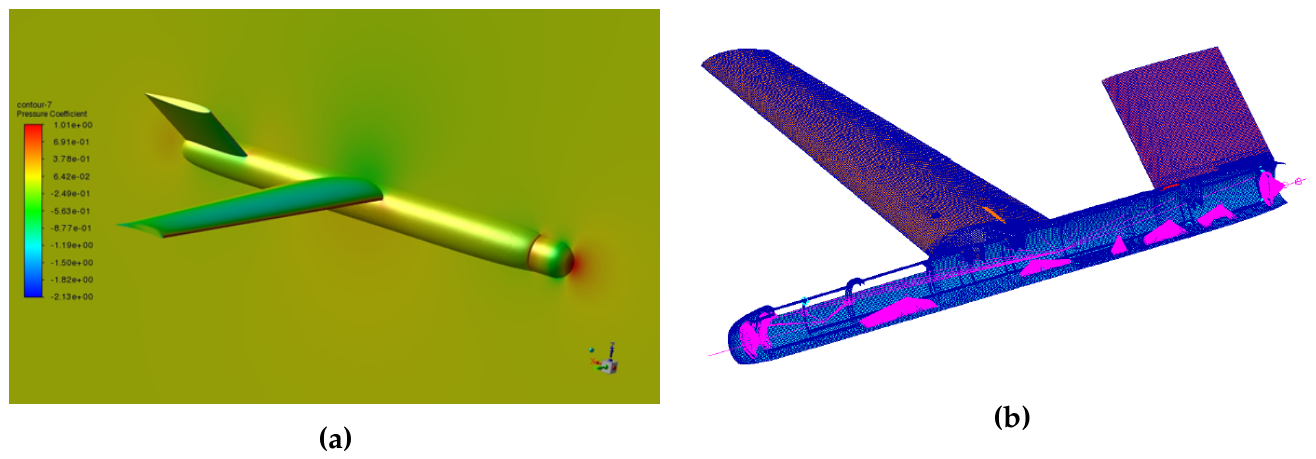
Figure 6.
Representative detailed structural and aeroelastic models used for final verification: (a) detailed wing finite-element model, (b) fuselage internal structural model, and (c) aerodynamic surfaces used in the CDR aeroelastic model.
Figure 6.
Representative detailed structural and aeroelastic models used for final verification: (a) detailed wing finite-element model, (b) fuselage internal structural model, and (c) aerodynamic surfaces used in the CDR aeroelastic model.
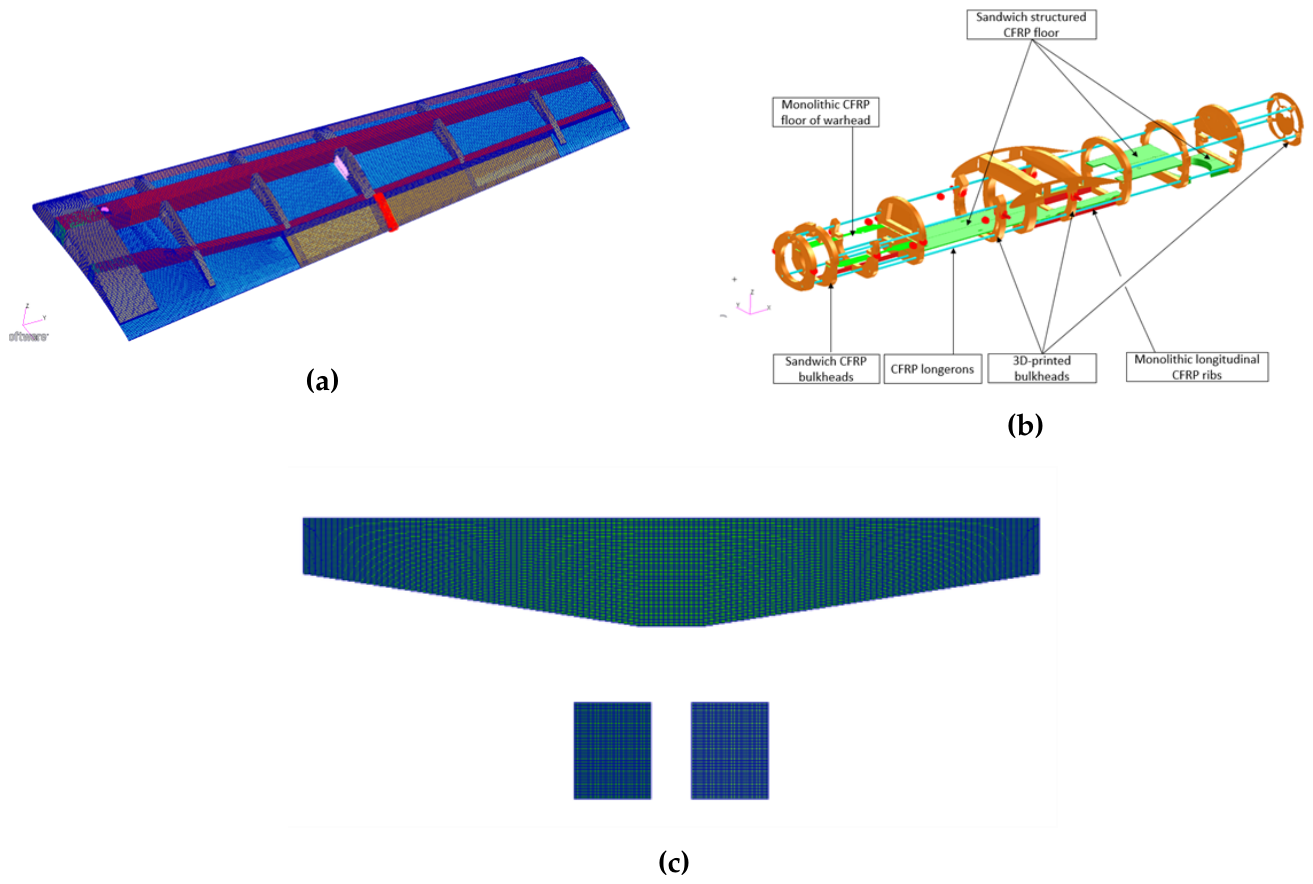
Figure 7.
Final detailed external aircraft configuration.
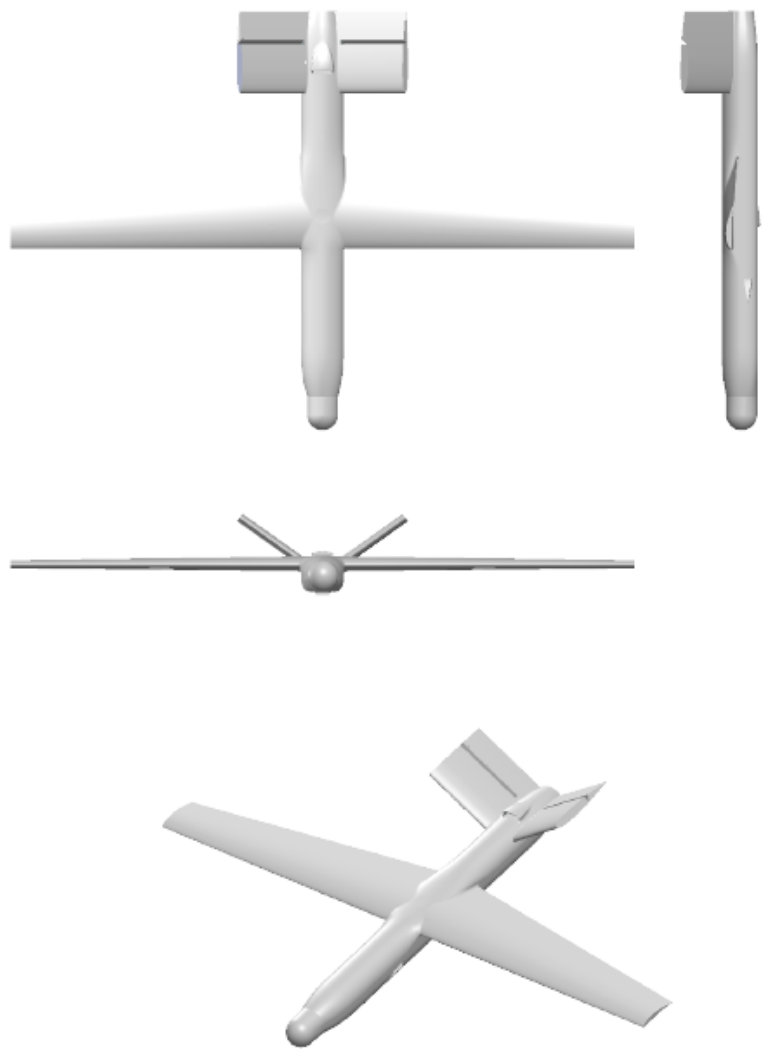
Figure 8.
High-fidelity aerodynamic characteristics of the detailed aircraft configuration: (a) lift coefficient, (b) drag coefficient, and (c) pitching-moment coefficient as functions of angle of attack.
Figure 8.
High-fidelity aerodynamic characteristics of the detailed aircraft configuration: (a) lift coefficient, (b) drag coefficient, and (c) pitching-moment coefficient as functions of angle of attack.
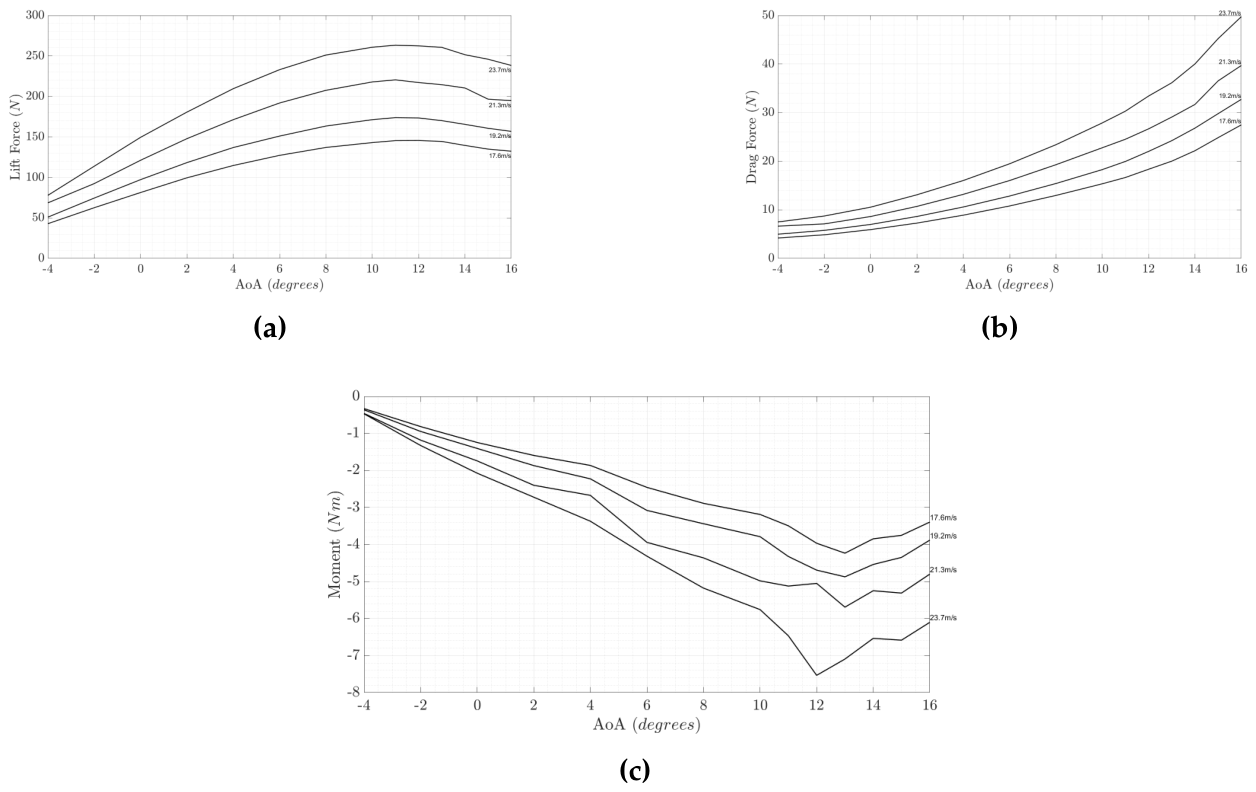
Figure 9.
Dynamic-stability poles of the final detailed aircraft model: (a) lateral-directional modes and (b) longitudinal modes.
Figure 9.
Dynamic-stability poles of the final detailed aircraft model: (a) lateral-directional modes and (b) longitudinal modes.
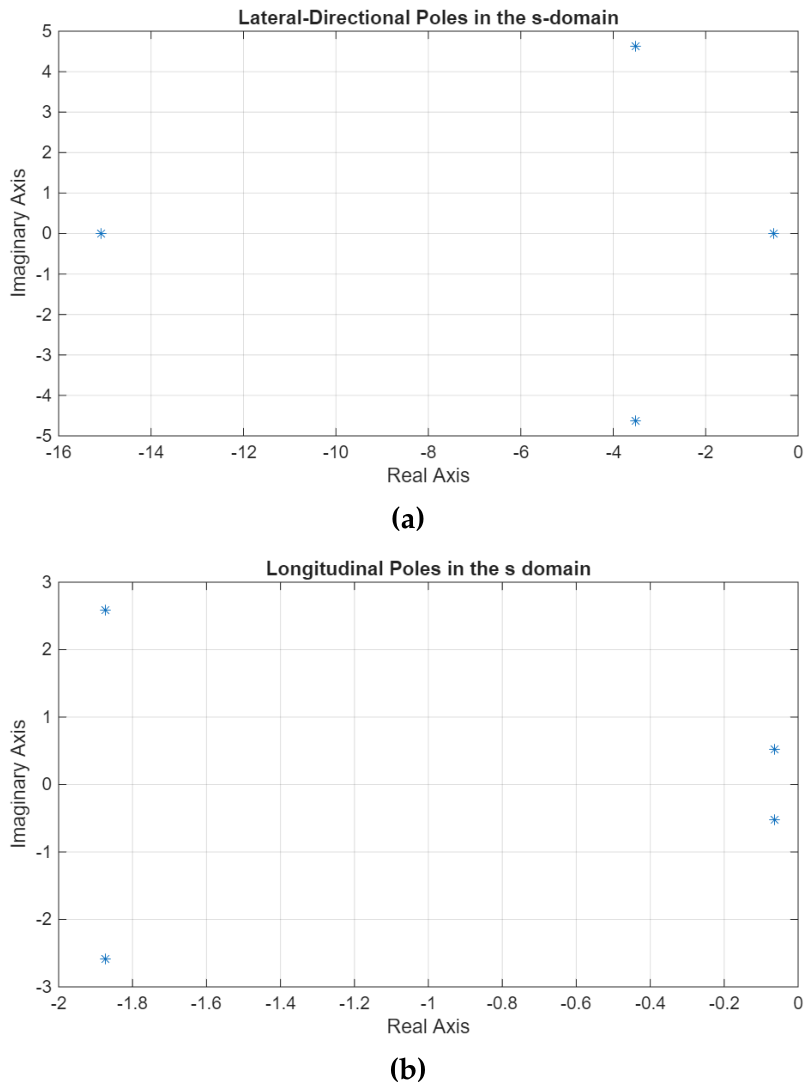
Figure 10.
Representative structural response for the C1 load case: (a) displacement field under aeroelastic loading (mm) and (b) stress field under transferred CFD loading (MPa).
Figure 10.
Representative structural response for the C1 load case: (a) displacement field under aeroelastic loading (mm) and (b) stress field under transferred CFD loading (MPa).
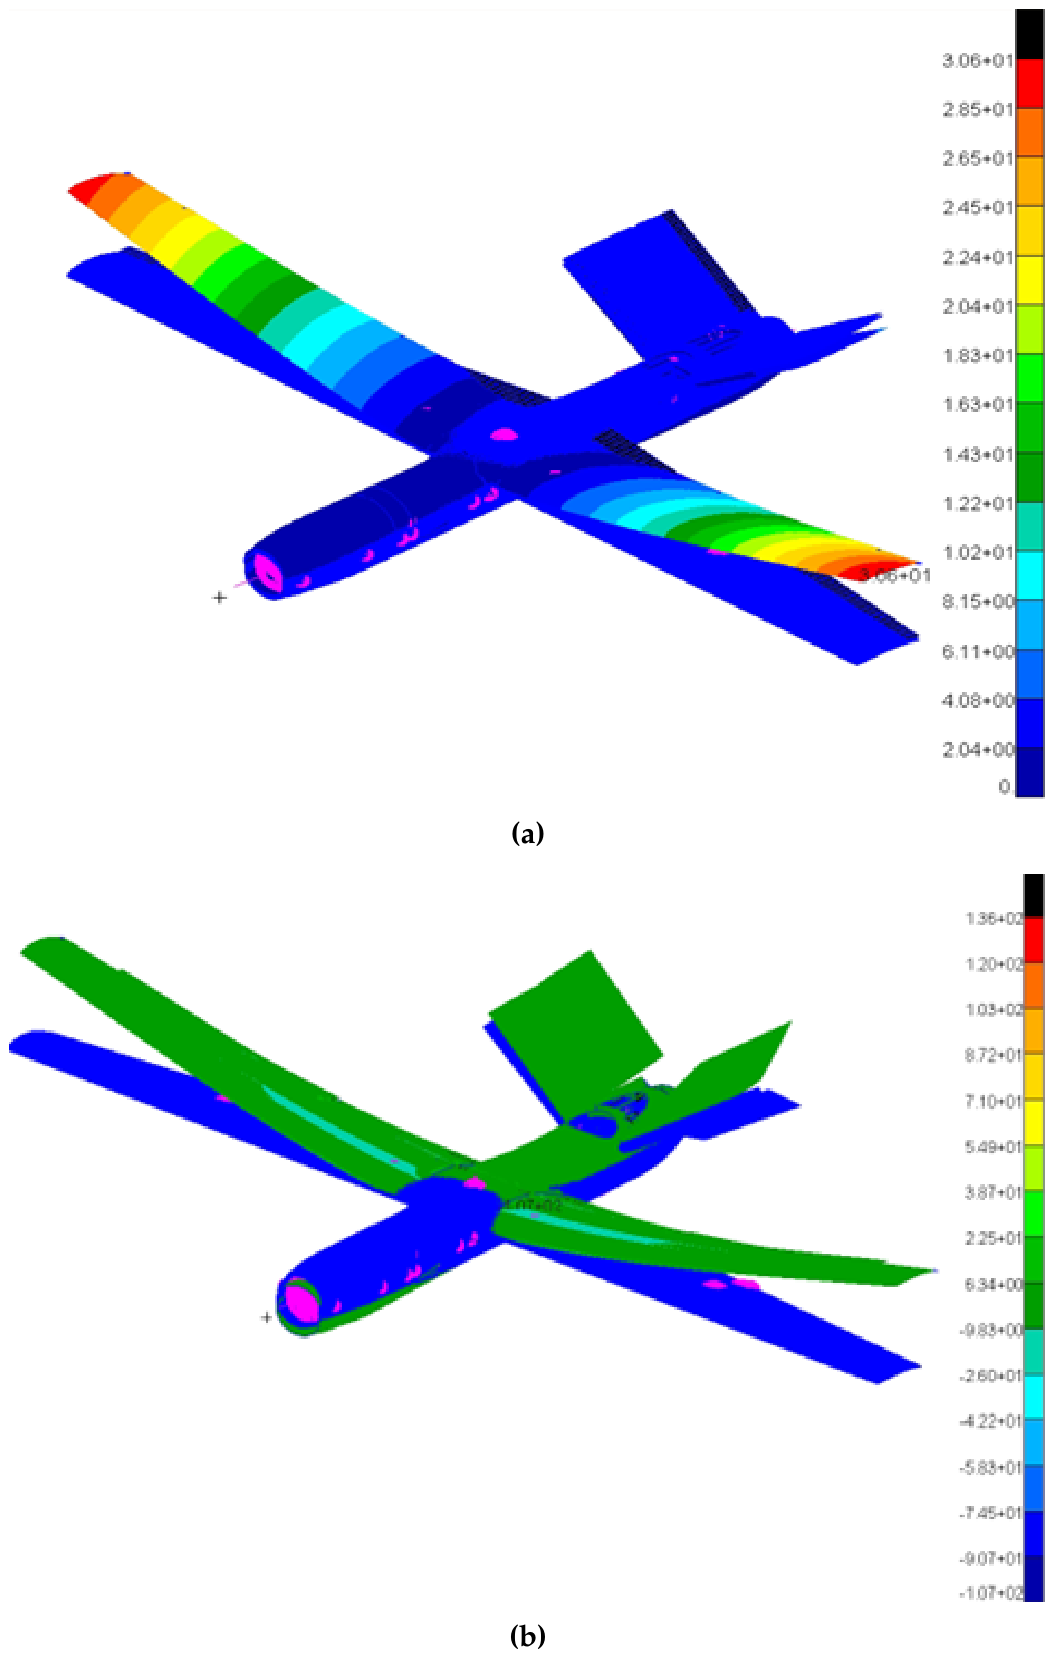
Figure 11.
Representative aeroelastic results for the C1 load case: (a) V–g diagram and (b) V–f diagram.
Figure 11.
Representative aeroelastic results for the C1 load case: (a) V–g diagram and (b) V–f diagram.
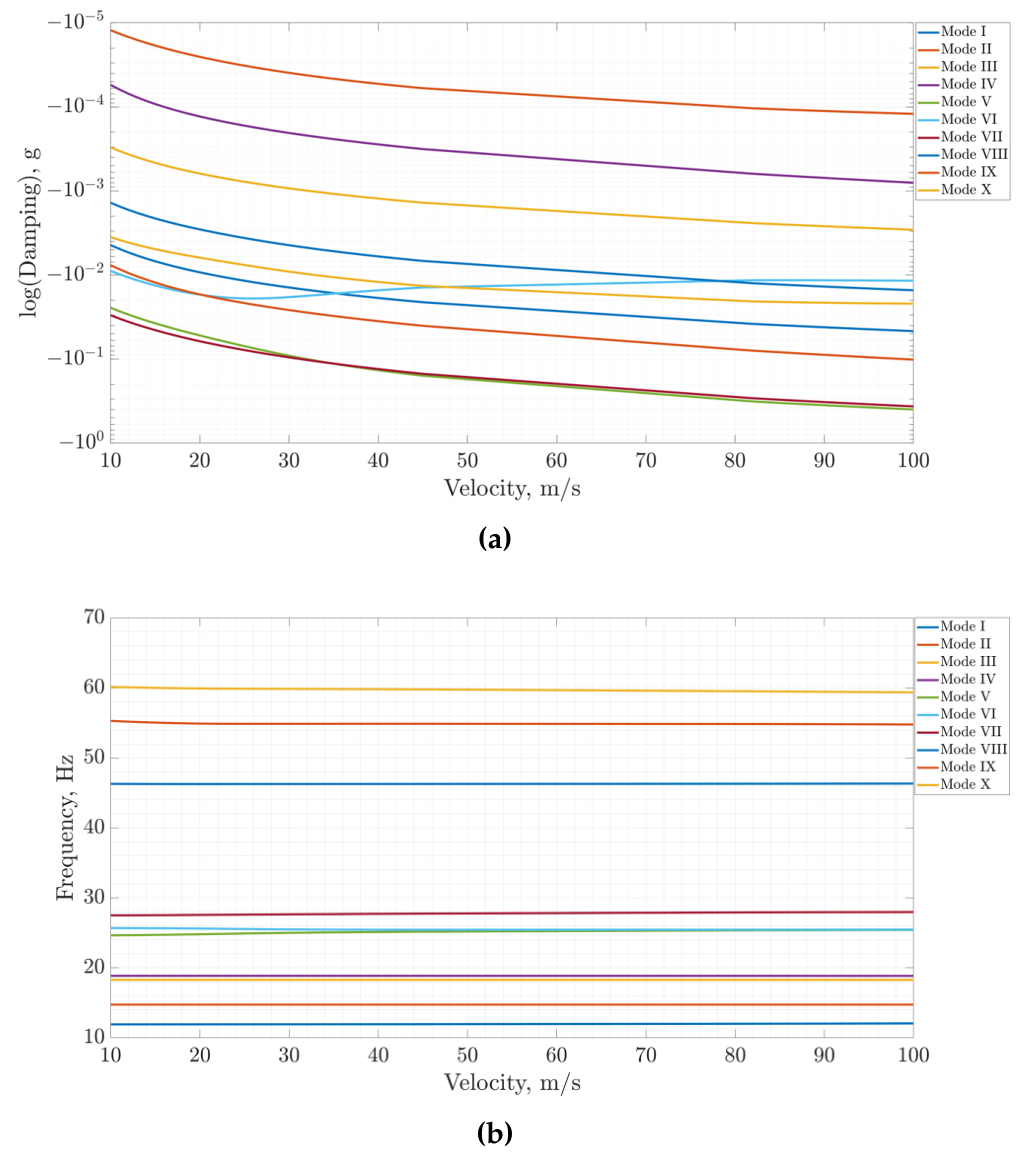
Figure 12.
Final maneuver and gust envelope used for detailed structural verification.
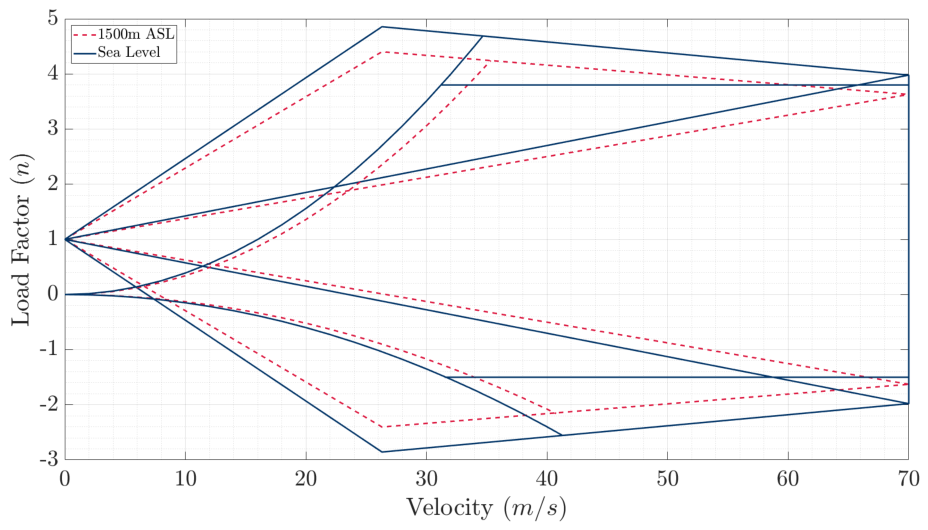
Figure 13.
Recorded flight path used to identify representative cruise, climb, and sustained-turn segments.
Figure 13.
Recorded flight path used to identify representative cruise, climb, and sustained-turn segments.
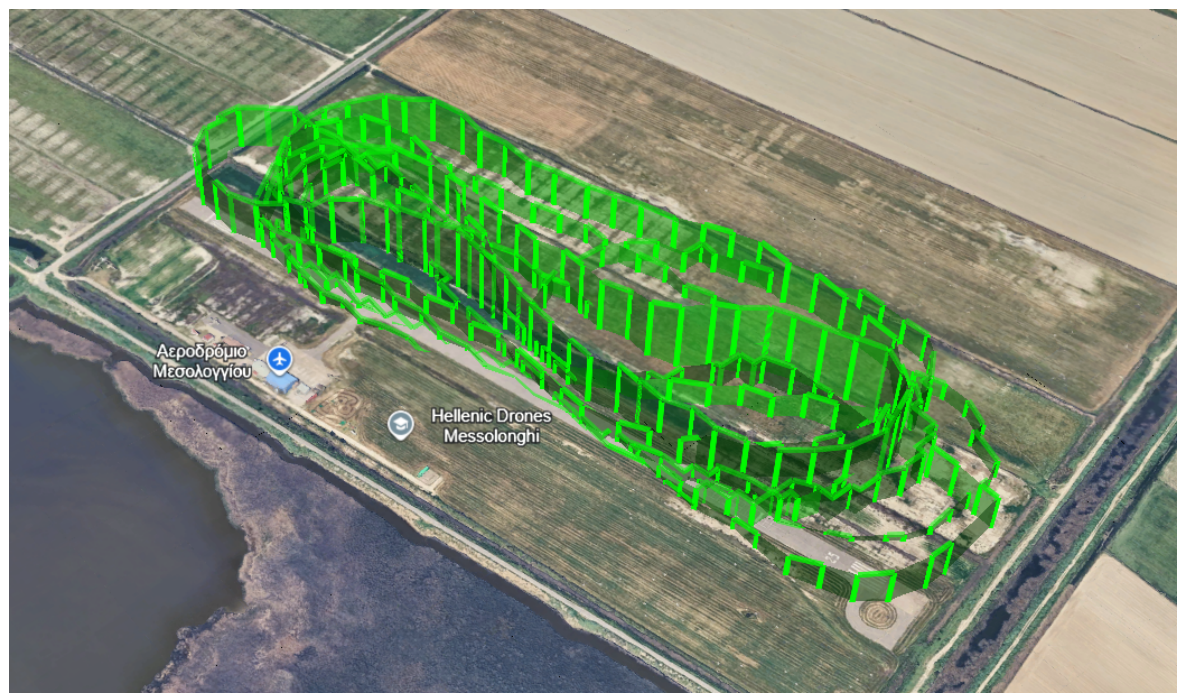
Figure 14.
Comparison between flight-derived and CFD-predicted aerodynamic characteristics: (a) straight-and-level flight and (b) climb.
Figure 14.
Comparison between flight-derived and CFD-predicted aerodynamic characteristics: (a) straight-and-level flight and (b) climb.
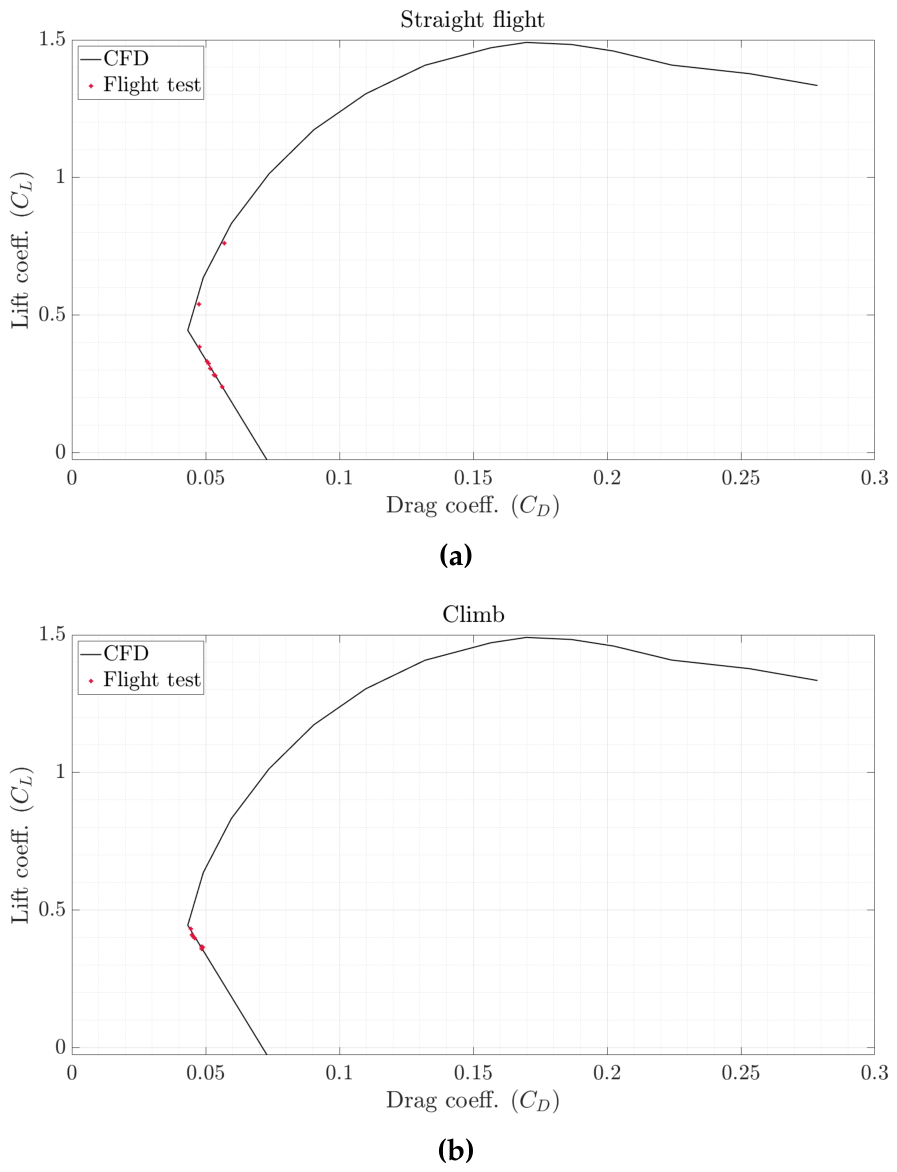
Figure 15.
Flight-derived and CFD-predicted lift–drag characteristics during sustained turning flight.
Figure 15.
Flight-derived and CFD-predicted lift–drag characteristics during sustained turning flight.
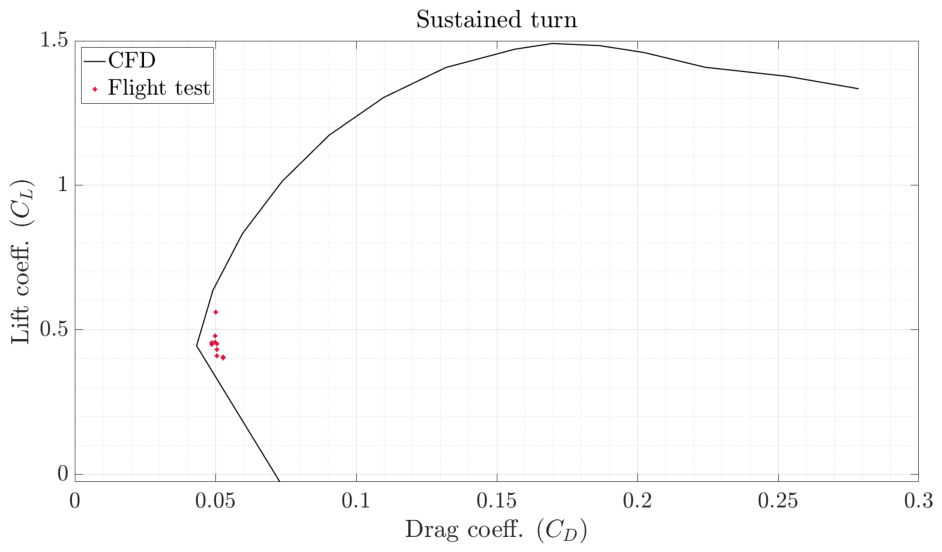
Table 1.
Principal mission requirements adopted for the UAV design.
| Parameter | Requirement |
|---|---|
| Maximum catapult-launch altitude | ASL |
| Minimum climb rate | |
| Cruise altitude | ASL |
| Mission altitude | 200– AGL |
| Operational ceiling | ASL |
| Minimum cruise speed | |
| Minimum loiter speed | |
| Maximum loiter radius | |
| Minimum range | |
| Minimum endurance | |
| Minimum loiter duration | |
| Launch / recovery | Catapult / parachute |
Table 3.
Principal flight conditions considered during detailed aerodynamic analysis.
| Flight condition | Velocity | Reference altitude |
|---|---|---|
| Stall | ASL | |
| Climb | ASL | |
| Loiter | ASL | |
| Cruise | Cruise condition | |
| Dive | ASL |
Table 4.
Principal aerodynamic conditions used for final structural and aeroelastic verification.
| Case | V | Altitude | |||
|---|---|---|---|---|---|
| C1 | 1.0581 | 34.7 | 1500 | 0 | 30 |
| C2 | 1.0581 | 41.5 | 1500 | 0 | -15 |
| C3 | 1.1370 | 70.0 | 500 | 0 | 2 |
| C4 | 1.0581 | 17.6 | 1500 | 0 | |
| C5 | 1.0581 | 23.7 | 1500 | 0 |
Table 5.
Structural and aeroelastic solution sequence used during detailed design.
| Analysis | Principal Output | Nastran Solution |
|---|---|---|
| Normal modes | Eigenfrequencies and mode shapes | SOL 103 |
| Linear static | Stress, strain, and displacement | SOL 101 |
| Linear buckling | Buckling load factors | SOL 105 |
| Static aeroelasticity / divergence | Aeroelastic equilibrium and divergence assessment | SOL 144 |
| Flutter | Damping and frequency as functions of velocity | SOL 145 |
Table 6.
Principal characteristics of the flight-test vehicle.
| Parameter | Flight-Test Configuration |
|---|---|
| Aircraft type | Fixed-wing electric UAV |
| Empennage | V-tail |
| Wingspan | |
| Take-off mass | |
| Wing loading | |
| Propulsion | Electric motor with fixed-pitch propeller |
| Propulsion arrangement | Aft-fuselage pusher |
| Primary controls | Ailerons and ruddervators |
Table 9.
Comparison of principal vertical aerodynamic loads obtained using rigid DLM, aeroelastic DLM, and CFD loads transferred to the Nastran structural model.
Table 9.
Comparison of principal vertical aerodynamic loads obtained using rigid DLM, aeroelastic DLM, and CFD loads transferred to the Nastran structural model.
| Case | Rigid DLM (N) | Aeroelastic DLM (N) | Transferred CFD (N) |
|---|---|---|---|
| C1 | 971.77 | 964.46 | 990.97 |
| C2 | -503.35 | -555.00 | -497.01 |
| C3 | 829.80 | 350.61 | 834.17 |
| C4 | 826.35 | 764.38 | 855.06 |
| C5 | 260.00 | 210.75 | 205.26 |
Table 10.
Detailed-design propulsion and mission-energy scenarios.
| Scenario | Time (min) | Distance (km) | Energy (Wh) |
|---|---|---|---|
| 500-m mission | 40.47 | 50.0 | 376.74 |
| 1000-m climb/cruise | 36.67 | 50.0 | 375.41 |
| 1500-m climb/cruise | 32.05 | 42.0 | 374.76 |
Table 12.
Summary of selected requirement-to-result comparisons for the final design.
| Requirement | Target | Final Result | Assessment |
|---|---|---|---|
| System-level MTOW | Met | ||
| Nominal MTOW target | Not met | ||
| Wingspan | At limit | ||
| Minimum cruise speed | Met | ||
| Minimum range | Met | ||
| Minimum endurance | Met † | ||
| Positive maneuver load | Met | ||
| Negative maneuver load | Met | ||
| Aeroelastic margin | No instability to | No flutter to ; no operational divergence | Met |
| Composite structural factor | Minimum FoS | At limit |
† Numerically achieved, but with negligible explicit battery-energy reserve.
Disclaimer/Publisher’s Note: The statements, opinions and data contained in all publications are solely those of the individual author(s) and contributor(s) and not of MDPI and/or the editor(s). MDPI and/or the editor(s) disclaim responsibility for any injury to people or property resulting from any ideas, methods, instructions or products referred to in the content. |
© 2026 by the authors. Licensee MDPI, Basel, Switzerland. This article is an open access article distributed under the terms and conditions of the Creative Commons Attribution (CC BY) license (http://creativecommons.org/licenses/by/4.0/).
Copyright: This open access article is published under a Creative Commons CC BY 4.0 license, which permit the free download, distribution, and reuse, provided that the author and preprint are cited in any reuse.