

Submitted:
09 October 2026
Posted:
10 October 2026
You are already at the latest version
Abstract
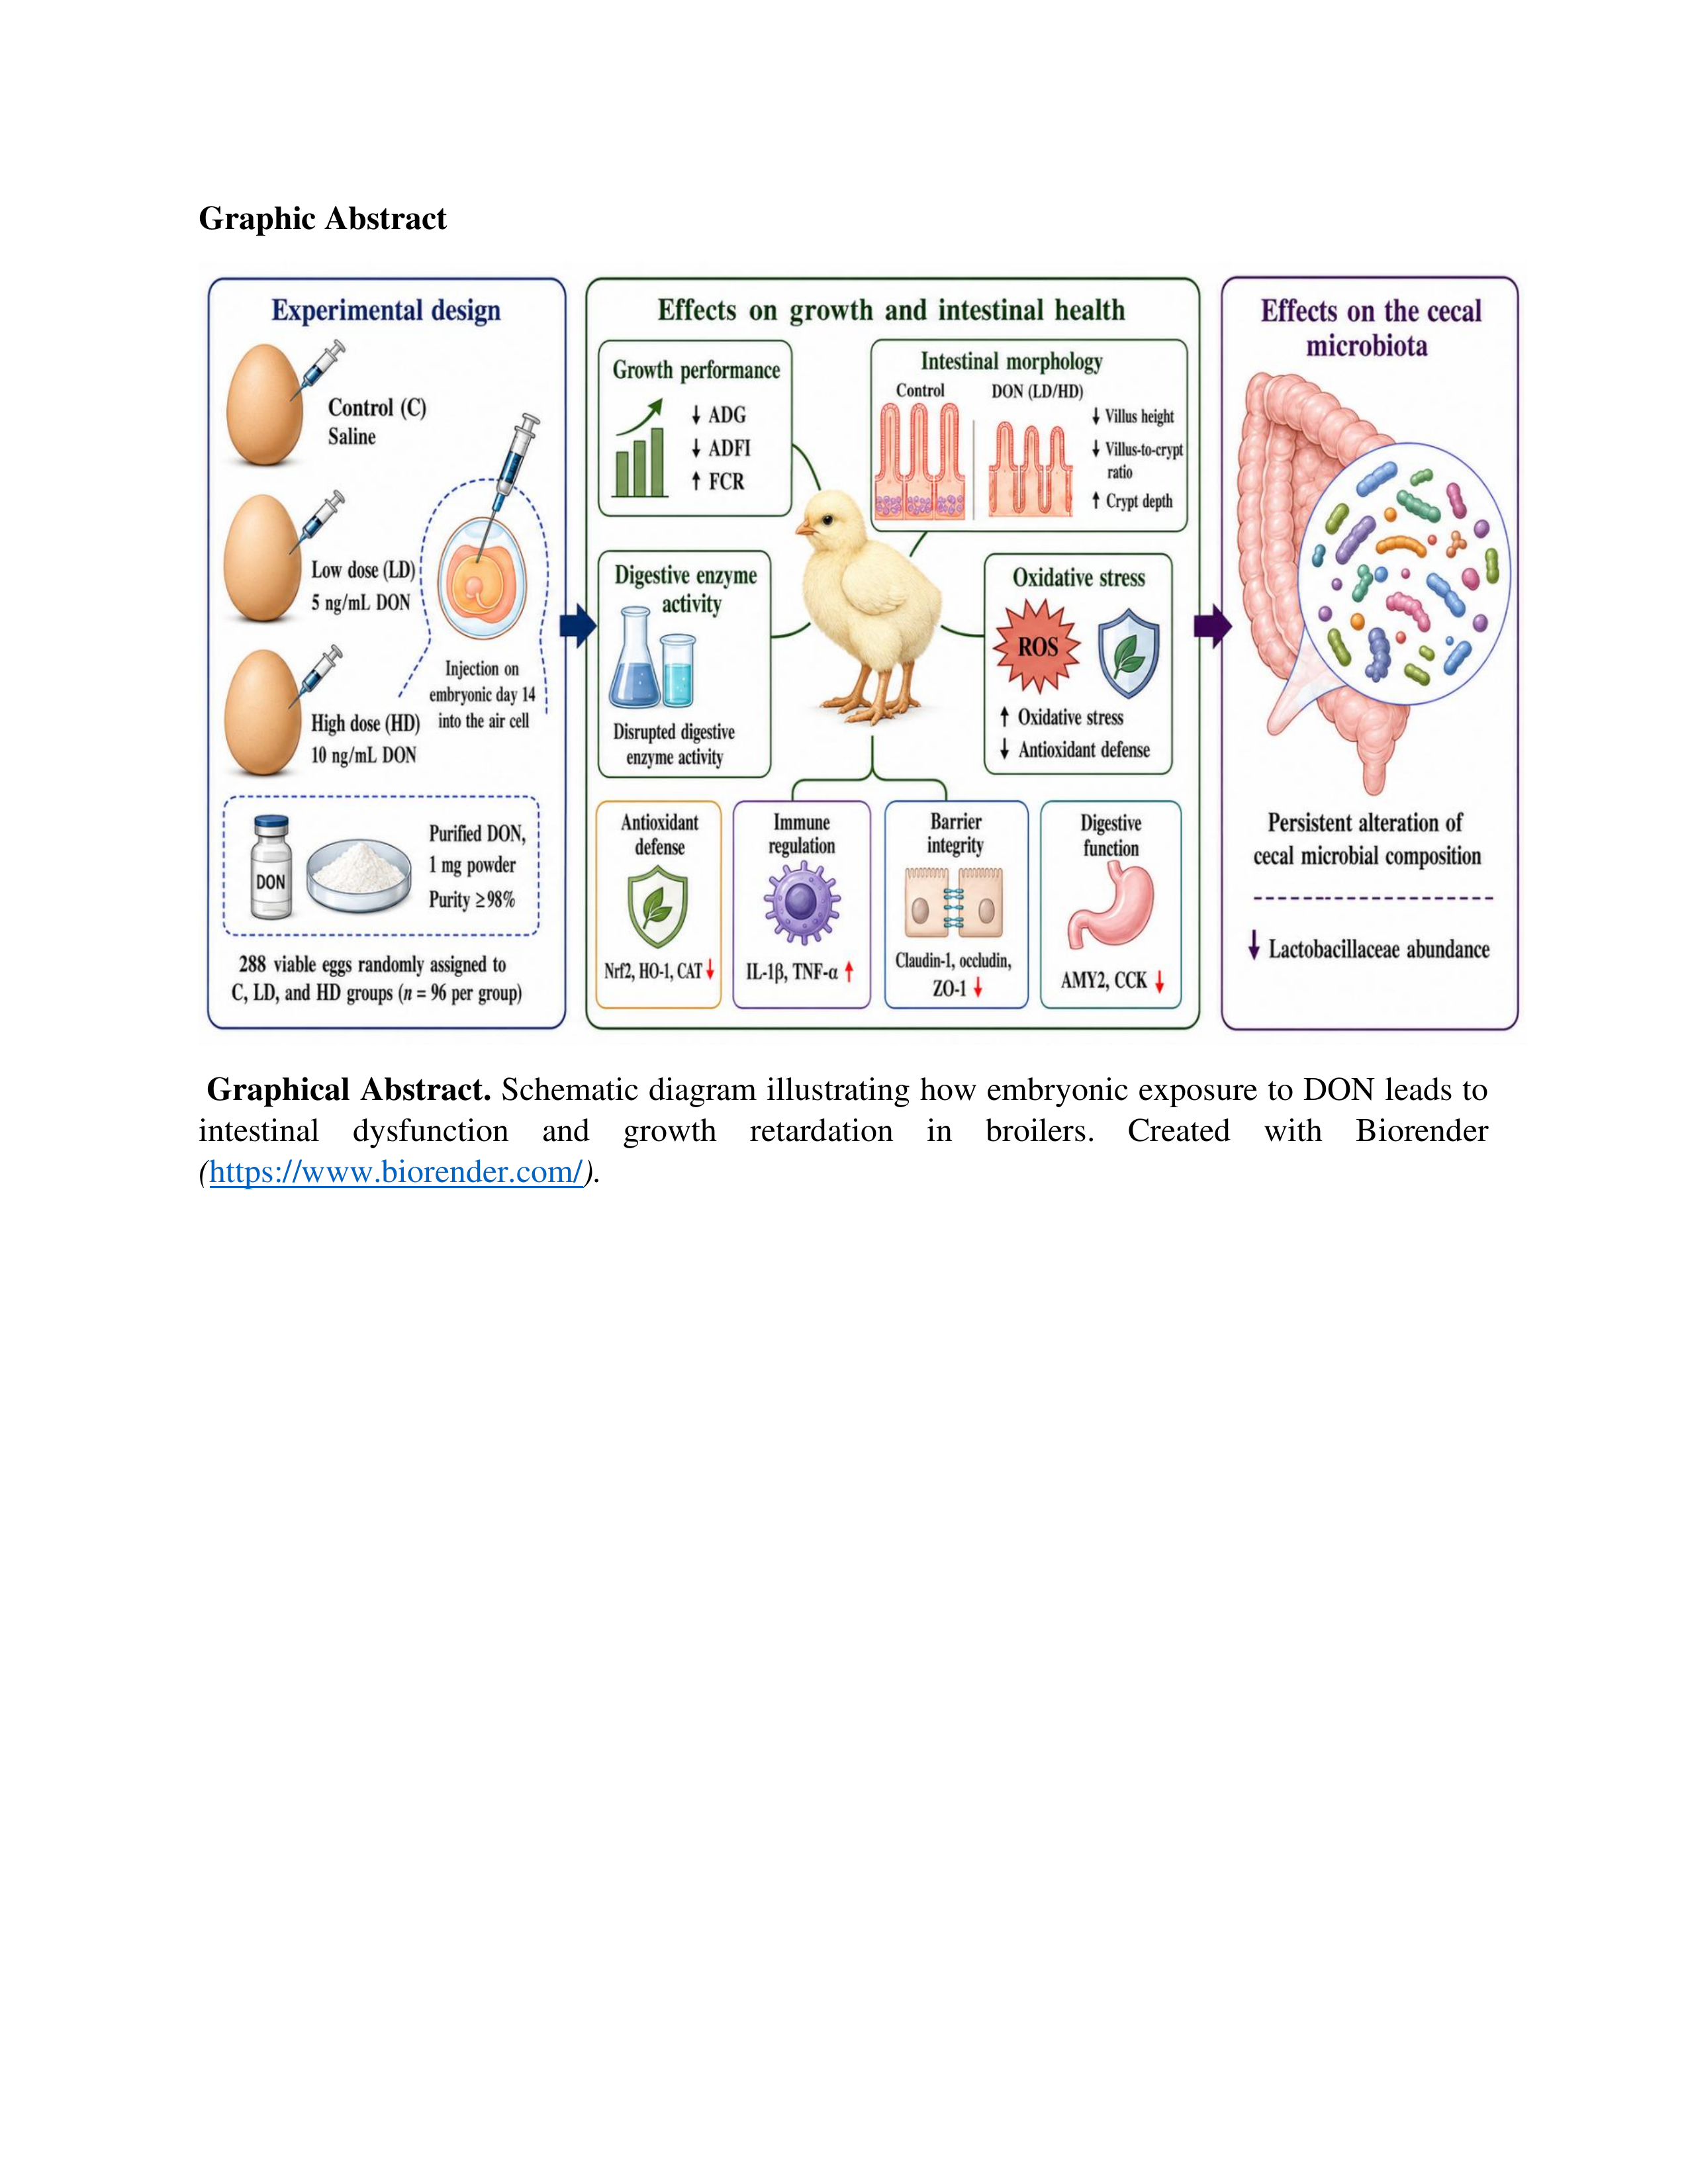
Deoxynivalenol (DON), a secondary metabolite produced by Fusarium fungi, is often present in cereal ingredients used in broiler feed formulations and can enter the food chain. Although post-hatch detrimental effects of DON have been widely studied, its effects on embryonic develop-ment remain underexplored. This study evaluated the impact of embryonic DON exposure on growth performance and intestinal integrity in broiler chickens. On day 14 of incubation, 288 viable embryos were randomly assigned to three groups: a control group (C) with saline injection and two DON-exposed groups, LD (low dose of DON, 0.5 µg/egg) and HD (high dose of DON, 1 µg/egg), which were injected into the air cell. After hatching, we analyzed growth performance, intestinal structure, digestive enzyme activity, oxidative status, barrier function, immune response, and the cecal microbiome. Embryonic DON exposure decreased average daily gain and average daily feed intake while increasing the feed conversion ratio, indicating impaired growth performance. In addi-tion, exposure altered digestive enzyme activities, increased oxidative stress, and affected gene ex-pression involved in barrier function and immunity at both time points, suggesting long-term intes-tinal effects. The cecal microbial population also changed, particularly with a decrease in beneficial bacteria such as the Lactobacillaceae group. In summary, the results suggest that early-life embryo exposure to DON negatively affects post-hatch growth and alters broiler intestinal characteristics.
Keywords:
broiler chickens
; cecal microbiota
; embryo exposure
; intestinal health
; performance
1. Introduction
Mycotoxins are toxic secondary metabolites primarily produced by filamentous fungi in the Fusarium, Aspergillus, and Penicillium genera. Due to their physicochemical properties and widespread distribution, mycotoxins pose substantial health risks to foods and feeds, contaminating crops during cultivation, harvesting, processing, transport, and storage [1]. Mycotoxin contamination in broiler production is significant because cereal grains constitute a large share of commercial broiler diets. Mycotoxin exposure reduces growth performance and feed conversion ratio, causes organ damage, oxidative stress, impaired immunity, reduced efficacy, and increased disease susceptibility [2]. Furthermore, multiple mycotoxins in feed can cause additive toxicity, even at low concentrations [3]
Among these contaminants, deoxynivalenol (DON) is one of the most prevalent mycotoxins in cereal-based feed ingredients. DON is a heat-stable class B trichothecene produced primarily by F. graminearum and F. culmorum and commonly found in wheat, maize, barley, and their derivatives [4]. While high levels of DON cause acute toxicosis, broilers are often exposed to low or subclinical levels via feed. Such exposure may not indicate obvious clinical signs but can reduce feed intake, weight gain, feed efficiency, and intestinal structure, and impair antioxidant function. A recent meta-analysis demonstrated the effects of DON on broiler growth performance and small-intestinal health, although the magnitude of these effects may vary by dose, exposure duration, age, and experimental design [5]. In addition, subclinical DON exposure has been shown to reduce amino acid digestibility, alter intestinal structure, and impair immune responses in broilers [6].
DON toxicity occurs through multiple interacting molecular pathways. Binding of DON to the peptidyl transferase center of the 60S ribosomal subunit inhibits protein synthesis and triggers ribotoxic stress response. This response involves activation of mitogen-activated protein kinase signaling pathways and induction of oxidative stress, inflammation, and apoptosis [7,8]. Since ingested DON comes into direct contact with the intestinal mucosal surface, the gastrointestinal tract is a primary site of its toxic effects. DON-induced toxicity includes villus atrophy, tissue damage, crypt hyperplasia, and a low villus height-to-crypt depth ratio. In addition, DON consumption can downregulate tight junction proteins such as zonula occludens-1, occludin, and claudin-1, increasing intestinal permeability [9,10].
Oxidative stress plays a key role in DON-induced toxicity. DON stimulates reactive oxygen species formation while interfering with the antioxidant defense system, which comprises superoxide dismutase, catalase, and glutathione peroxidase. This imbalance can cause lipid peroxidation, cell damage, and even cell death [11,12]. Reactive oxygen species can also exacerbate inflammatory responses, disrupt tight junction assembly, and increase intestinal epithelial permeability [13,14]. Beyond direct damage to the intestinal epithelium, DON intoxication can alter the intestinal flora, which plays roles in nutrient metabolism, immune response regulation, and overall intestinal balance. Previous research has linked DON exposure to decreased levels of beneficial microorganisms and increased levels of opportunistic flora [15,16].
Previous studies have investigated the effects of DON exposure post-hatch via feed contamination. Nevertheless, information on the effects of embryonic exposure remains limited, even though embryogenesis is a crucial period for digestive tract development, immune organ formation, and antioxidant protection [17,18]. Disruption during this vulnerable period can alter developmental trajectories and lead to long-term effects post-hatch. Mycotoxin exposure during embryogenesis can result from maternal transmission due to contaminated breeder diets or experimental exposure. Although mycotoxins can be transferred into eggs at nanogram concentrations, the biological importance of this process should not be underestimated because embryonic birds have poor detoxification capacity and immature antioxidant protection [19,20]. New data show that mycotoxin exposure during the embryonic period alters intestinal structure, immune function, and the microbiota [21,22].
Although the impact of environmental toxins on development is increasingly recognized, the effect of embryonic DON exposure on post-hatch intestinal development and physiology in broiler chickens remains poorly understood. In particular, the link between DON-triggered oxidative stress, inflammation, epithelial dysfunction, and microbiome imbalance remains unclear. This study examined the embryo’s sensitivity to low-level DON exposure without inducing severe acute toxicity, using controlled in ovo exposure. Thus, the objective of the current study was to determine whether low-level DON exposure during the embryonic stage leads to persistent changes in intestinal structure and function, redox and inflammatory homeostasis, cecal microbiome, and growth in broiler chickens.
It remains unclear whether low-level DON exposure during embryonic development has long-term effects on growth performance and intestinal physiology after hatching. Specifically, the interplay among intestinal morphological injury, oxidative stress, inflammation, impaired epithelial barrier function, and gut microbial dysbiosis following embryonic DON exposure requires further exploration. In this study, we used low-level in ovo DON feeding to assess broiler embryos’ sensitivity to DON without deliberately inducing acute toxicity. This study aimed to determine whether embryonic DON exposure causes long-term changes in post-hatch growth performance, intestinal morphology and function, epithelial barrier function, redox and inflammatory homeostasis, and the cecal microbiome in broiler chickens.
2. Materials and Methods
2.1. Ethical Consideration
All animal experiments were approved and monitored by the Animal Ethics Committee of Nanjing Agricultural University. The study followed the approved institutional protocols and animal care laws. Ethical approval was obtained under permit number SYXK(Su) 2017-0007. All animal treatment and procedures were conducted in accordance with national policies on animal care and use in China.
2.2. Experimental Design and Egg Injection Procedure
Fertile eggs from Chinese yellow-feathered broiler breeders were sourced from a commercial hatchery in Nanjing, China. Eggs were incubated at 37.8 ± 0.1 °C and 55–60% relative humidity from embryonic day 1 (ED1) to ED18 and were turned 45° every hour. On ED18, egg turning was discontinued, and incubation continued at 37.5 °C with 70% relative humidity until hatching. On ED14, candling identified 288 viable embryos, which were randomly assigned to three groups of 96 embryos each: saline-injected control group (C), 0.5 µg/egg (LD) group, and 1 µg/egg (HD) group. Each egg received a 0.1 mL injection, delivering an actual dose of 0.5 µg/egg and 1µg/egg in the LD and HD groups, respectively.
Deoxynivalenol (DON; purity ≥ 98%; Yuanye Biotechnology, Shanghai, China) was dissolved in sterile physiological saline to prepare a 1 mg/mL working stock solution and stored at −20 °C. We prepared a fresh working solution for administration. Injections were delivered into the air cell, a common, minimally invasive administration site. The injection site was immediately sealed with sterile paraffin wax. All manipulations with eggs outside the incubator were completed within 20 min per set, after which the eggs were returned to the incubator.
The selected DON doses were determined according to the known toxicological range that can induce oxidative and gastrointestinal changes without causing significant embryonic death. This app roach enabled the evaluation of subclinical DON effects on embryos. The saline-treated group served as an experimental control, supported by two pilot studies that showed no significant difference between saline-treated and untreated eggs. Following hatching, healthy chicks from each treatment were randomly assigned to six replicates of pens per treatment, with each pen serving as an experimental unit for growth performance testing.
2.3. Hatching, Brooding, and Feeding
Hatchability characteristics, such as hatchability percentage, fertile hatchability percentage, late embryonic mortality, and survival rate, were recorded. Successfully hatched chicks were individually weighed after drying and documented. The coefficient of variation (CV) for chick body weight was calculated to evaluate variability within groups. All healthy chicks were weighed using an electronic scale, and their weights were stored for future reference. Post-weighing, the chicks were moved to the broiler brooding house and raised for 42 days. They were fed a pelleted diet formulated to meet or exceed nutrient requirements [23], with unrestricted access to water. Prior to feeding, the final feed’s mycotoxin level was tested using LC-MS and found to be below the detection limit. Environmental conditions—including temperature, ventilation, and lighting—were kept within recommended ranges to promote optimal broiler chicken performance. The final feed composition and mycotoxin level is presented in supplementary material Table S1
2.4. Broiler Performance Measurement
Broiler growth parameters were evaluated by measuring average daily gain (ADG), average daily feed intake (ADFI), and feed-to-gain ratio (FCR). Individual chick weights were recorded at hatch, and the total body weight of all broilers in each pen was measured weekly to monitor growth progression. Weekly feed intake was estimated as the difference between cumulative feed offered and the residual feed in each pen. FCR was calculated by dividing total feed intake by total body weight gain for all broilers in a pen. Mortality rates were recorded daily to calculate cumulative mortality.
2.5. Sample Collection and Preservation
On days 21 and 42, six broilers per treatment (three males and three females) were randomly selected for blood, small intestine, and cecal content collection. Before collection, the broilers were fasted for 12 h to reduce variability from gut digesta while maintaining free access to water. Approximately 4-5 mL of blood was drawn from the wing vein into an anticoagulant-free tube and allowed to clot before serum separation. Broilers were fasted for 12 h prior to sampling to reduce contamination. After euthanasia, small-intestinal segments were excised and halved; one half was preserved for molecular studies, while the other was fixed in 4% neutral-buffered formalin at room temperature for 24 h and processed for histology. Cecal contents were preserved and stored at -80 °C for microbial analysis.
2.6. Histological examination
The collected intestinal segments were fixed in 4% neutral-buffered formalin and stored at room temperature for 24 h. The tissue samples underwent standard histological processing, including dehydration in ascending ethanol concentrations, clearing with xylene, and paraffin infiltration. They were then sectioned at 5 µm using a rotary microtome, mounted onto glass slides, and dried overnight at 37 °C. Slides were deparaffinized in xylene, rehydrated in graded alcohols, and stained with H&E. Sections were examined under a light microscope (Olympus BX41, Olympus Corporation, Tokyo, Japan), and well-oriented villi were photographed for morphometric analysis. Eight slides were prepared for each sample, and 10 well-oriented villi per slide (80 per sample) were measured. Villus height (VH) was measured from the villus tip to the villus-crypt junction, crypt depth (CD) was measured from the base of the crypt to the submucosa, and the ratio was calculated. The average value for each measurement per sample served as the representative for statistical analysis.
2.7. Digestive Enzyme Determination
Approximately 0.5 g of tissue from the duodenum, jejunum, and ileum was isolated separately to determine digestive enzyme activity. Each tissue sample was first homogenized in 900 µL of phosphate-buffered saline (PBS), and the appropriate amount of lysis buffer was then added per the assay protocol. The homogenates were centrifuged at 12,000 rpm for 15 min at 4 °C, and the supernatant was collected and stored at −20 °CDigestive enzyme activities in intestinal tissue homogenates were measured using commercial test kits from Nanjing Jiancheng Bioengineering Institute (Nanjing, China). Protein levels were determined with a BCA Protein Assay Kit from Beyotime Biotechnology (Shanghai, China; Cat. No. P0018S). Enzyme activities were normalized to protein concentration and expressed as activity units per milligram of protein.
2.8. Antioxidant Determination
Serum antioxidant parameters (MDA, T-SOD, GSH-Px, CAT, and T-AOC) were measured using commercial assay kits according to the manufacturer’s guidelines (Nanjing Jiancheng Bioengineering Institute, Nanjing, China). The antioxidant parameters in the intestine were assessed by placing about 0.5 g of tissue into a sterile centrifuge tube, adding 900 μL of PBS, and homogenizing it. The homogenate was centrifuged at 12,000 rpm for 15 min, and the supernatant was collected into 2.5 mL tubes. The antioxidant markers were assessed with the same diagnostic kits and methods as used for serum samples. Afterwards, these markers were normalized for total protein content using the bicinchoninic acid (BCA) protein assay reagent (Cat No: 23227, Thermo Scientific, MA), following the instructions in the product manual No. P0018S from Beyotime, Shanghai, China.
2.9. Total RNA Extraction and Quantification
Total RNA was isolated from intestinal tissue using Vazyme’s TRIzol-based Total RNA Isolation Kit (Nanjing, China). RNA quantity and purity were assessed with a NanoDrop 2000 spectrophotometer (Thermo Fisher Scientific, USA). To eliminate genomic DNA contamination, reverse transcription was performed using the HiFiScript All-in-One RT Master Mix and gDNA Remover kit from CWBIO (China). Quantitative real-time PCR (qPCR) was used to evaluate the relative expression of genes involved in antioxidant defense, digestion, inflammation, nutrient transport, and tight junctions in the jejunal tissue. Reactions were prepared in 20 µL volumes containing 2x SYBR Green master mix, specific primers (listed in Table 1), cDNA templates, and nuclease-free water. qPCR was carried out on the ABI 7500 system (USA) with the following cycling conditions: initial denaturation at 95 °C for 30 s, then 40 cycles of 95 °C for 5 s and 60 °C for 30 s for annealing and extension. Relative mRNA expression levels were calculated using the 2−ΔΔCt method, normalizing to β-actin as the reference gene. All gene expression data were standardized to β-actin against the respective controls.
2.1016. S ribosomal RNA gene sequencing
Cecal contents were aseptically collected from broiler chickens in both the control and high-dose groups on days 21 and 42. The samples were immediately stored in liquid nitrogen and later transferred to a −80 °C freezer for future analysis. Each treatment group at each time point included six biological replicates, with chickens randomly selected for microbiota analysis. Genomic DNA was extracted from the cecal samples using a DNA extraction kit (Shanghai Majorbio Bio-Pharm Technology Co., Ltd., Shanghai, China). The quality of DNA was evaluated using a NanoDrop 2000 spectrophotometer (Thermo Fisher Scientific, USA), and its integrity was checked by electrophoresis on a 1% agarose gel.
The bacterial 16S rRNA gene regions V3-V4 were amplified using the 338F and 806R primers. PCR started with an initial denaturation at 95 °C for 3 min, followed by 25-30 cycles involving 95 °C for 30 s, 55 °C for 30 s, and 72 °C for 45 s. A final extension occurred at 72 °C for 10 min. Post-PCR, the products were purified, quantified, and prepared for sequencing. The sequencing was carried out on the Illumina HiSeq 2500 platform with 250-bp paired-end reads.
Raw sequencing reads underwent quality control, paired-end merging, and removal of chimeric reads before further analysis. The sequence data were processed using QIIME version 1.9.1. Sequences were clustered into operational taxonomic units (OTUs) at 97% similarity and taxonomically assigned based on the SILVA database (version 138). Beta diversity was evaluated using Bray-Curtis dissimilarities, with Principal Coordinates Analysis (PCoA) employed to visualize the data. PERMANOVA with 999 permutations tested differences in microbial community compositions among groups. Data from days 21 and 42 were analyzed separately. All analyses and visualizations were conducted in R v.4.4.2.
2.11. Data Analysis
Statistical analyses were conducted in R v4.4.2, and data are presented as means ± SEM. Normality and homogeneity of variance were assessed before analysis. Treatment effects at each sampling time were evaluated with one-way ANOVA followed by Tukey’s HSD test when assumptions were met; otherwise, Welch’s ANOVA was used. The pen was the experimental unit for growth performance, whereas the sampled bird served as the unit for all other outcomes. Microbiota data from days 21 and 42 were analyzed separately. Alpha-diversity indices and phylum-level relative abundances were compared between the control and high-dose groups using Student’s t-test, Welch’s t-test, or the Mann–Whitney U test, as appropriate. We evaluated overall microbial community composition using PERMANOVA. The Benjamini–Hochberg procedure controlled the false discovery rate, and we set significance at P < 0.05. Graphs were generated in GraphPad Prism, and sequencing data were processed by Shanghai Majorbio Biotechnology Co., Ltd. (Shanghai, China).
3. Results
3.1. Effects of embryonic DON exposure on hatchability and hatch weight
Table 2 summarizes hatching performance and chick weight at hatch. Embryonic DON exposure did not significantly affect hatchability, late embryonic mortality, or post-hatch survival (P > 0.05). Although hatchability and survival were numerically lower in the DON-exposed groups than in the control group, no statistical difference was observed. However, chick weight at hatch differed significantly between groups (P < 0.05), with the HD group having a significantly lower mean chick weight than the control and LD groups (P < 0.05). The coefficient of variation in chick weight also differed significantly between the control and DON-exposed groups (P < 0.05).
3.2. Embryonic exposure to DON impaired broiler growth performance
Table 3 presents broiler growth parameters after embryonic DON exposure. Embryonic DON exposure significantly adversely affected growth performance across feeding periods, with the HD group showing greater effects than the control and low-dose groups. In the starter phase (1–21 days), embryonic HD exposure significantly reduced broiler growth performance compared with the control (P < 0.05). Embryonic exposure to DON resulted in persistent growth retardation during the grower-finisher period (22- 42 days). All groups exposed to DON during the embryonic period showed decreased ADG in the latter period, with the HD group experiencing the greatest suppression. Throughout the experimental periods (1-42 days), broilers in the HD group showed impaired growth performance (P < 0.05), while embryonic DON treatment did not affect mortality (P > 0.05).
3.3. Embryonic Exposure to DON Disrupts Intestinal Morphology
Table 4 shows the effect of embryonic DON exposure on broiler chickens’ small intestinal morphology. Embryonic exposure results in persistent impairment of small-intestinal structure at both sampling points. At 21 days of age, VH (villus height) was significantly reduced in three sections of the small intestine treatment group compared to the control (P < 0.05). The result indicated that embryonic DON exposure did not affect crypt depth compared with the control across the experimental periods. Intestinal structural damage persisted until 42 days of age, with VH remaining significantly reduced across three intestinal regions in the HD group compared with the control group. Furthermore, CD increased in the duodenum of the DON-exposed group, and VH: CD ratios decreased across intestinal segments, particularly in the HD group (P < 0.05).
3.4. Embryonic DON Exposure Modulates Digestive Enzyme Activity
Figure 1 presents the effects of embryonic DON exposure on digestive enzyme activities in intestinal tissue homogenates at the two sampling points. Embryonic DON exposure reduced digestive enzyme activities, and the suppression was more pronounced in the HD group than in the control. At 21 days of age (Figure 1A-D), AMS activity was notably reduced in HD groups within the duodenum and jejunum (P < 0.05). Chymotrypsin activity in the jejunum was severely suppressed by HD treatment compared with controls. Furthermore, Lipase and trypsin activities were significantly reduced in both LD and HD treatments across all three intestinal segments, and the HD group showed the greatest reductions (P < 0.05). At 42 days (Figure 1 E-H, AMS activity was reduced in the jejunum of the HD group compared with the control group (P < 0.05). Chymotrypsin activity was significantly reduced in the jejunum and ileum of DON-challenged groups, particularly in the HD group. All three intestinal segments showed considerable inhibition of lipase (LPS) activity in both LD and HD broilers, with HD showing the greatest inhibition.
3.5. Embryonic exposure impairs serum antioxidant defense
Figure 2 presents the effects of embryonic DON exposure on serum antioxidant activities. At 21 days of age (Figure 2 A-E), DON exposure increased serum MDA levels and reduced antioxidant enzyme activities. MDA levels were higher in the treatment groups than in the control group (P<0.05), indicating increased lipid peroxidation. However, GSH-Px, T-SOD, T-AOC, and CAT activities were lower in the treatment groups than in the control group (P < 0.05). Similar changes were observed at 42 days of age (Figure 2 F-J). Compared to the control group, broilers treated during embryonic development had higher serum MDA levels (P < 0.05) and lower GSH-Px, T-SOD, T-AOC, and CAT levels (P < 0.05). Antioxidant activity decreased in the HD group, suggesting a dose-dependent effect of DON exposure on embryos and resulting oxidative stress.
3.6. Embryonic Exposure to DON alters intestinal tissue homogenate antioxidant activities
The effects of embryonic DON exposure on oxidative stress in broiler intestinal tissue homogenate at the two sampling points are presented in Figure 3. At 21 days of age(Figure 3A-E), MDA increased in the embryonic DON-exposed group compared with the control (Figure 4A), and all antioxidant parameters, GSH and T-SOD, showed decreased activity in the jejunum, while T-AOC and CAT were substantially reduced in the duodenum and jejunum (Figure 4B- E). Oxidative imbalance triggered by embryonic DON exposure persisted at 42 days of age (Figure 3F-J). The results showed that MDA in the tissue homogenate was higher in the treatment group than in the control group, and T-SOD, CAT, and T-AOC activities were lower than in the control group (P < 0.05). A similar pattern was observed in the duodenum and ileum, though less pronounced. This indicates that embryonic DON exposure caused lasting impairment of intestinal antioxidant defenses, as evidenced by elevated lipid peroxidation and reduced antioxidant enzyme activity in intestinal tissue homogenates.
3.7. Embryonic exposure to DON alters jejunal mRNA expression
To elucidate the molecular basis of early-life DON exposure effects on intestinal function, we measured the relative expression of genes related to antioxidant defense, inflammation, intestinal barrier function, digestion, and absorption in jejunal tissues from broilers at 21 and 42 days of age.
At 21 days, embryonic exposure to DON downregulated the relative expression of several antioxidant genes (Figure 4A-E). The HD group showed significantly lower mRNA levels of Nrf2, HO-1, and CAT than the control group (P<0.05). Although SOD and GPx-1 expression levels were numerically lower in the DON group, the groups did not differ significantly. These transcriptional changes do not indicate decreased enzyme activity; rather, they suggest altered regulation.
IL-1β and TNF-α expression increased significantly in the HD group, whereas IL-10 decreased significantly in both DON-exposed groups compared with the control group (P < 0.05). IL-6 expression also increased slightly in the DON-exposed groups; however, this change was not statistically significant. Furthermore, DON exposure affected genes related to intestinal tight junction function and integrity. Claudin-1 and occludin gene expression significantly decreased in both DON-exposed groups, whereas ZO-1 expression decreased significantly only in the HD group (P < 0.05). This suggests that transcription factor expression related to intestinal barrier function changed; however, it does not suggest that intestinal barrier integrity was affected. Regarding digestion and nutrient absorption, gene expression of AMY2, CCK, PNLIP, and PEPT1 decreased slightly on day 21; however, these changes were not statistically significant. In contrast, GLUT2 and SGLT1 gene expression decreased significantly, especially in the HD group (P < 0.05).
At 42 days of age, Nrf2 expression was markedly reduced in the HD group, while HO-1, SOD, and GPx-1 levels were significantly lower in both DON groups compared with the control (Figure 4F-J). CAT expression did not differ significantly among groups. Regarding inflammatory responses, IL-1β, IL-6, and TNF-α levels were markedly elevated in the HD group, whereas IL-10 was significantly lower in both DON-exposed groups (P < 0.05). Additionally, genes related to tight junctions, including Claudin-1, occludin, and ZO-1, were significantly downregulated in both DON groups. For digestion and nutrient absorption, AMY2 expression decreased in both DON groups, and CCK and PEPT1 levels were significantly reduced, particularly in the HD group. No significant differences were observed in PNLIP, GLUT2, and SGLT1 expression across all groups on day 42. These results suggest that embryonic DON exposure induces lasting alterations in antioxidant defense, inflammation, barrier integrity, and nutrient absorption gene expression in the jejunum after hatching, with effects varying by gene and DON dose.
3.8. Effect on Cecal Microbiota
To assess whether embryonic DON exposure influenced cecal microbial community development, we performed 16S rRNA sequencing at the two sampling points. OTU-based principal coordinates analysis (PCoA) showed no separation between control and HD, suggesting embryonic DON exposure did not significantly alter cecal microbial structure (Figure 5A, B). However, PLS-DA displayed clear separation between the control and HD groups, indicating minor shifts in microbial community composition due to DON exposure (Figure 5C, D).
Taxonomic composition analysis identified Bacillota and Bacteroidetes as the most abundant bacterial phyla in both control and HD. Although overall microbiome composition remained largely stable, embryonic DON exposure altered the relative abundance of certain bacteria at both the phylum and genus levels (Figure 6A-D). These results indicate that DON affected specific microbial populations without disturbing the entire cecal microbial community.
Using an LDA score threshold of >2.0, LEfSe analysis identified significant microbial biomarkers between the C and HD groups at 21 days (Figure 7A and B). The cladogram showed group-specific taxonomic differences, including discriminating taxa from the families Enterococcaceae and Erysipelotrichaceae. The LDA analysis revealed taxa present in either the C or HD groups; therefore, embryonic DON affected microbial community composition in early life. Welch’s t-test at the genus level showed significant differences in the relative abundance of Thomasclavelia, Enterococcus, Tyzzerella, Parabacteroides, and Lactobacillaceae-related taxa between the groups (Figure 7C; p<0.05).
At day 42, microbiome biomarkers also differed between the control and HD groups (Figure 8A, B). As shown in the cladogram, the differential taxa were mainly from the phylum Deferribacterota, along with their taxonomic levels. The LDA plots showed that the enriched biomarkers were Anaerotignum, the V9D2013 group, Colidextribacter, Christensenellaceae-related taxa, DTU089, Deferribacterales, Deferribacteraceae, Deferribacter, and Mucispirillum, while the taxa Faccalibacterium, RF39-related taxa, and Tissierellales were present in the opposite group. At the genus level, Welch’s t-tests also showed significant differences in Faecalibacterium, RF39-related taxa, Colidextribacter, Anaerotignum, and the V9D2013 group between the control and HD groups (Figure 8C; p < 0.05). These findings indicate that the effects of the microbial changes caused by embryonic DON exposure persisted even at this stage of development.
4. Discussion
Mycotoxins are fungal contaminants of cereal-based animal feeds and are reported as major food chain contaminants in animal production systems worldwide. In broiler chicken production systems, broilers are more often exposed to low-level mycotoxins than to acute intoxication; however, even subclinical exposure can negatively affect performance, gut permeability, immune function, and metabolism [24]. Among these toxins, deoxynivalenol (DON) is found in many cereals, including wheat, maize, and barley [13,25]. Despite numerous studies investigating the post-hatch effects of this toxin, its embryonic exposure and its effects on broiler post-hatch development remain underexplored.
This study indicated that exposure to low concentrations of DON during the embryonic phase leads to prolonged poor post-hatch growth and intestinal performance. This suggests that the embryonic stage is a critical period when DON exposure can cause long-lasting physiological changes. This aligns with developmental programming, in which exposure to specific nutritional conditions at particular developmental stages may cause long-lasting effects on gastrointestinal development, metabolism, immunity, and health [22,26].
The intestines play an important role in nutrient utilization and growth performance in broiler chickens. Intestinal morphology directly correlates with absorptive efficiency and epithelial turnover rate (Wang et al., 2025). In this study, we found that early-life exposure to low-level DON led to significant changes in intestinal morphology, including decreased VH, reduced VH: CD across intestinal sections, and elongated CD. These changes indicated decreased absorptive efficiency and delayed epithelial maturation. The increase in CD reflects compensatory epithelial hypertrophy from toxin-induced damage; however, this mechanism appears inefficient at restoring normal villus structure.
Oxidative imbalance is considered the main pathway underlying DON-mediated cytotoxicity. DON treatment has been shown to increase ROS formation and diminish antioxidant defense, thereby disrupting redox balance [29,30,31]. Our results support these findings, indicating that embryonic exposure to DON induced oxidative imbalance, as evidenced by increased MDA levels and decreased antioxidant enzyme activity.
At the molecular level, the Nrf2 pathway maintains cellular antioxidant potential and protects the intestinal epithelium from oxidative stress. Previous studies show that DON exposure suppresses Nrf2 and reduces the expression of Nrf2-dependent antioxidant genes such as HO-1 and CAT, leading to inadequate ROS protection. Consistent with prior research, our study shows that embryonic DON exposure adversely affects Nrf2 antioxidant potential, likely due to increased oxidative stress. This adverse effect of DON on Nrf2 may be more pronounced during embryonic development because natural antioxidant systems are immature.
In addition to oxidative stress, DON-exposed broiler chicken embryos showed impaired intestinal digestion. According to the current experiment, digestive enzyme activities, including amylase, lipase, and proteases, decreased in DON-exposed broiler chickens. These results align with studies showing that DON exposure negatively affects digestive function. Moreover, reduced activity of enzymes identified in our study was associated with reduced expression of genes involved in digestion, such as AMY2 and CCK, indicating that embryonic DON exposure can affect the regulation of enzyme activity and signaling pathways within the GI tract. Previous studies have shown that consuming feed containing DON affects intestinal structure and metabolic processes in broilers, reducing digestive efficiency [32]. While previous studies focused on dietary exposure to DON after hatching, this study shows that exposing broiler embryos to DON during embryonic development leads to long-term alterations in intestinal digestive capacity. Considering that the period immediately after hatching is an important stage for intestinal maturation and nutrient assimilation, the continuous inhibition of digestive enzyme activity and the expression of their genes might be responsible for the decreased growth rate of DON-exposed broilers.
The intestinal epithelial barrier serves as the first line of defense by providing selective permeability and preventing the entry of luminal toxins, pathogens, and pro-inflammatory mediators into host tissues [33]. Tight junction proteins, including occludin, claudin-1, and zonula occludens-1 (ZO-1), are crucial for maintaining intestinal epithelial barrier integrity and regulating paracellular transport [34]. The current study found a long-term reduction in tight junction protein expression in the jejunum of DON-exposed embryos, suggesting impaired intestinal barrier function. These results align with previous studies showing DON’s effects on intestinal integrity, including changes in tight junction structure and increased epithelial permeability in poultry and other animal species. Consistent with this idea, we found that developmental exposure to DON enhanced the pro-inflammatory intestinal environment by up-regulating IL-1β, IL-6, and TNF-α and down-regulating the anti-inflammatory cytokine IL-10[35]. This inflammatory response following DON administration has been observed before, with DON-induced intestinal injury linked to activated inflammatory responses and disturbances in mucosal homeostasis [36]. Taken together, these results support the notion that oxidative stress, inflammation, and compromised intestinal epithelial integrity are interlinked factors that cause intestinal dysfunction in broiler chickens exposed to DON.
The gut microbiome is essential for metabolic function, immune regulation, and intestinal balance. The findings show that embryonic DON exposure causes persistent alterations in cecal microbial composition. Although alpha diversity did not appear to be affected, the microbial community composition changed, indicating an alteration without complete depletion of the microbial population. More specifically, beneficial bacteria such as Lactobacillaceae decreased, while other potentially inflammatory bacteria increased. This is significant because Lactobacillus bacteria produce short-chain fatty acids and exclude pathogens. However, beta diversity analysis shows minimal separation between groups, suggesting that DON exposure does not disrupt overall microbial diversity but instead affects specific microbes. This is expected, since targeted microbial modification may influence biological functions, such as metabolic outcomes and immune pathway activation, more than changes in overall microbial diversity.
5. Conclusion
These results indicate that embryonic exposure to low levels of DON produces persistent effects on post-hatching performance in broiler chicks without affecting hatchability, late embryonic mortality, post-hatching survival rate, or broiler mortality. Embryonic exposure, especially at 15 µg/egg, reduced hatching body weight and homogeneity and impaired growth and feed efficiency up to d 42 post-hatching. These performance defects were accompanied by prolonged villus injury, suppressed digestive enzyme activities, oxidative imbalance in both systemic and intestinal compartments, and altered gene expression in jejunal tissue involved in antioxidant and anti-inflammatory activity, tight junction regulation, digestion, and nutrient transport. Embryonic DON exposure also caused selective changes in cecal bacterial composition, especially a decrease in beneficial Lactobacillaceae taxa, without significantly reshaping the overall microbiota structure.
Figure caption
Figure 1: Intestinal digestive enzyme activities following embryonic DON exposure: amylase, chymotrypsin, lipase, and trypsin at 21 d (A–D) and amylase, lipase, and trypsin at 42 d (E–G). Data are mean ± SEM; different superscripts indicate significant differences within each intestinal segment (P < 0.05).
Figure 2: Serum MDA, GSH-Px, T-SOD, T-AOC, and CAT levels at 21 d (A–E) and 42 d (F–J) following embryonic DON exposure. Data are mean ± SEM; different superscripts indicate significant differences (P < 0.05).
Figure 3: Oxidative stress indices (MDA, T-SOD, GSH-Px, T-AOC, and CAT) in the duodenum, jejunum, and ileum at 21 d (A–E) and 42 d (F–J). Data are mean ± SEM; different superscripts indicate significant differences (P < 0.05).
Figure 4: Jejunal expression of antioxidant, inflammatory, tight-junction, digestive-enzyme, and nutrient-transporter genes at 21 d (A–E) and 42 d (F–J) following embryonic DON exposure. Data are mean ± SEM; different superscripts indicate significant differences within each gene (P < 0.05).
Figure 5: (A, B) and PLS-DA (C, D) of cecal microbial communities at 21 and 42 d. Each point represents an individual sample, and distances indicate differences in microbial composition.
Figure 6: Cecal microbiota composition following embryonic DON exposure. Relative abundance of dominant bacterial phyla and genera at 21 d (A, B) and 42 d (C, D).
Figure 7: Differential cecal microbiota at 21 d between control and high-dose DON groups: LEfSe cladogram (A), LDA scores > 2.0 (B), and genus-level Welch’s t-test (C). Significance was set at P < 0.05.
Figure 8: Differential cecal microbiota at 42 d between control and high-dose DON groups: LEfSe cladogram (A), LDA scores > 2.0 (B), and genus-level Welch’s t-test with 95% confidence intervals (C). Significance was set at P < 0.05.
Authors Contribution
Chala Adugna: Conceptualization, Investigation, Methodology, Data curation, Formal analysis, Writing—original draft. Du Jian: Conceptualization, Methodology, writing—review and editing. Sheng Li: Data curation, Resources. Qian Tang: Data curation, Resources. Shutong Zhang: Resources, writing—review and editing; Cuiguang Li: Writing—review and editing. Xiaoming Jin: Writing—review and editing. Yumna Sareem: Writing—review and editing. Chunmei Li: Funding acquisition, Project administration, Resources, Supervision, Writing- review and editing.
Supplementary Materials
The following supporting information can be downloaded at the website of this paper posted on Preprints.org.
Funding
This work was funded by the National Key Research and Development Program of China (2023YFD1300802-4), the National Natural Science Foundation of China (32372935), and the Fundamental Research Funds for the Central Universities (KYLH2025004).
Conflicts of Interest
The authors have no conflicts of interest to declare.
References
- Khan, R. Mycotoxins in Food: Occurrence, Health Implications, and Control Strategies-A Comprehensive Review. Toxicon 2024, 248, 108038. [Google Scholar] [CrossRef] [PubMed]
- Olariu, R.M.; Fiţ, N.I.; Bouari, C.M.; Nadăş, G.C. Mycotoxins in Broiler Production: Impacts on Growth, Immunity, Vaccine Efficacy, and Food Safety. Toxins 2025, 17, 261. [Google Scholar] [CrossRef] [PubMed]
- Akinmoladun, O.F.; Fon, F.N.; Nji, Q.; Adeniji, O.O.; Tangni, E.K.; Njobeh, P.B. Multiple Mycotoxin Contamination in Livestock Feed: Implications for Animal Health, Productivity, and Food Safety. Toxins 2025, 17, 365. [Google Scholar] [CrossRef] [PubMed]
- Hassan, M.; Jiang, S.; Ali, Q.; Xu, S.; Hanif, S.; Shaukat, A.; Ahmed, M.; Fu, A.; Wang, Y. Deoxynivalenol and Poultry Intestinal Health: Mechanisms, Current Mitigation Options, and Future-Ready Feed Safety Strategies. Poult. Sci. 2026, 105, 106194. [Google Scholar] [CrossRef] [PubMed]
- Adugna, C.; Wang, K.; Du, J.; Li, C. Deoxynivalenol Mycotoxin Dietary Exposure on Broiler Performance and Small Intestine Health: A Comprehensive Meta-Analysis. Poult. Sci. 2024, 103, 104412. [Google Scholar] [CrossRef] [PubMed]
- Shanmugasundaram, R.; Kappari, L.; Pilewar, M.; Jones, M.K.; Olukosi, O.A.; Pokoo-Aikins, A.; Applegate, T.J.; Glenn, A.E. Exposure to Subclinical Doses of Fumonisins, Deoxynivalenol, and Zearalenone Affects Immune Response, Amino Acid Digestibility, and Intestinal Morphology in Broiler Chickens. Toxins 2025, 17, 16. [Google Scholar] [CrossRef] [PubMed]
- Chen, J.; Zhang, X.; He, Z.; Xiong, D.; Long, M. Damage on Intestinal Barrier Function and Microbial Detoxification of Deoxynivalenol: A Review. J. Integr. Agric. 2024, 23, 2507–2524. [Google Scholar] [CrossRef]
- Deng, Y.; You, L.; Wang, X.; Wu, W.; Kuca, K.; Wu, Q.; Wei, W. Deoxynivalenol: Emerging Toxic Mechanisms and Control Strategies, Current and Future Perspectives. J. Agric. Food Chem. 2023, 71, 10901–10915. [Google Scholar] [CrossRef] [PubMed]
- Wan, S.; Sun, N.; Li, H.; Khan, A.; Zheng, X.; Sun, Y.; Fan, R. Deoxynivalenol Damages the Intestinal Barrier and Biota of the Broiler Chickens. BMC Vet. Res. 2022, 18, 311. [Google Scholar] [CrossRef] [PubMed]
- Zhai, X.; Qiu, Z.; Wang, L.; Luo, Y.; He, W.; Yang, J. Possible Toxic Mechanisms of Deoxynivalenol (DON) Exposure to Intestinal Barrier Damage and Dysbiosis of the Gut Microbiota in Laying Hens. Toxins 2022, 14, 682. [Google Scholar] [CrossRef] [PubMed]
- Lauridsen, C. From Oxidative Stress to Inflammation: Redox Balance and Immune System. Poult. Sci. 2019, 98, 4240–4246. [Google Scholar] [CrossRef] [PubMed]
- Wang, W.; Zhu, J.; Cao, Q.; Zhang, C.; Dong, Z.; Feng, D.; Ye, H.; Zuo, J. Dietary Catalase Supplementation Alleviates Deoxynivalenol-Induced Oxidative Stress and Gut Microbiota Dysbiosis in Broiler Chickens. Toxins 2022, 14, 830. [Google Scholar] [CrossRef] [PubMed]
- Hassan, M.; Jiang, S.; Ali, Q.; Xu, S.; Hanif, S.; Shaukat, A.; Ahmed, M.; Fu, A.; Wang, Y. Deoxynivalenol and Poultry Intestinal Health: Mechanisms, Current Mitigation Options, and Future-Ready Feed Safety Strategies. Poult. Sci. 2025, 106194. [Google Scholar] [CrossRef] [PubMed]
- Rajput, S.A.; Liang, S.-J.; Wang, X.-Q.; Yan, H.-C. Lycopene Protects Intestinal Epithelium from Deoxynivalenol-Induced Oxidative Damage via Regulating Keap1/Nrf2 Signaling. Antioxidants 2021, 10, 1493. [Google Scholar] [CrossRef] [PubMed]
- Bai, Y.; Ma, K.; Li, J.; Li, J.; Bi, C.; Shan, A. Deoxynivalenol Exposure Induces Liver Damage in Mice: Inflammation and Immune Responses, Oxidative Stress, and Protective Effects of Lactobacillus Rhamnosus GG. Food Chem. Toxicol. 2021, 156, 112514. [Google Scholar] [CrossRef] [PubMed]
- Wickramasuriya, S.S.; Park, I.; Lee, K.; Lee, Y.; Kim, W.H.; Nam, H.; Lillehoj, H.S. Role of Physiology, Immunity, Microbiota, and Infectious Diseases in the Gut Health of Poultry. Vaccines 2022, 10, 172. [Google Scholar] [CrossRef] [PubMed]
- Ács, V.; Szeli, N.; Nagy, J.; Áprily, S.; Tischler, A.; Csötönyi, O.; Jócsák, I.; Benedek, I.; Petneházy, Ö.; Turbók, J.; et al. Effects of Early Feeding Technologies Providing Methionine Supplementation on Performance, Lipid Oxidation, and Some Immune-Related Gene Expression in Broiler Chicken. Poult. Sci. 2025, 104, 105335. [Google Scholar] [CrossRef] [PubMed]
- Panda, A.; Bhanja, S.; Sunder, G.S. Early Post Hatch Nutrition on Immune System Development and Function in Broiler Chickens. World’s Poult. Sci. J. 2015, 71, 285–296. [Google Scholar] [CrossRef]
- Ebrahem, M.; Kersten, S.; Valenta, H.; Breves, G.; Dänicke, S. Residues of Deoxynivalenol (DON) and Its Metabolite de-Epoxy-DON in Eggs, Plasma and Bile of Laying Hens of Different Genetic Backgrounds. Arch. Anim. Nutr. 2014, 68, 412–422. [Google Scholar] [CrossRef] [PubMed]
- Stark, M.R.; Ross, M.M. The Chicken Embryo as a Model in Developmental Toxicology. Methods Mol. Biol. 2019, 1965, 155–171. [Google Scholar] [CrossRef] [PubMed]
- Guo, H.; Wang, P.; Liu, C.; Chang, J.; Yin, Q.; Wang, L.; Jin, S.; Zhu, Q.; Lu, F. Compound Mycotoxin Detoxifier Alleviating Aflatoxin B1 Toxic Effects on Broiler Growth Performance, Organ Damage and Gut Microbiota. Poult. Sci. 2023, 102, 102434. [Google Scholar] [CrossRef] [PubMed]
- Roura, E.; Khaskheli, A.A.; Meijer, M.M.Y.; Navarro, M.; Niknafs, S.; Zhou, X.; Nguyen, H.T.T.; van den Brand, H.; Uni, Z.; Ferket, P. Developmental Programming in Chickens Including Transgenerational Nutrition, Chemosensory Mechanisms and in Ovo Essential Oils, Organic Acids, and Pre- pro- Syn-Biotics; Role of Epigenetic Modifications. Poult. Sci. 2025, 104, 105857. [Google Scholar] [CrossRef] [PubMed]
- Dale, N. National Research Council Nutrient Requirements of Poultry – Ninth Revised Edition (1994). J. Appl. Poult. Res. 1994, 3, 101. [Google Scholar] [CrossRef]
- Ochieng, P.E.; Scippo, M.-L.; Kemboi, D.C.; Croubels, S.; Okoth, S.; Kang’ethe, E.K.; Doupovec, B.; Gathumbi, J.K.; Lindahl, J.F.; Antonissen, G. Mycotoxins in Poultry Feed and Feed Ingredients from Sub-Saharan Africa and Their Impact on the Production of Broiler and Layer Chickens: A Review. Toxins 2021, 13, 633. [Google Scholar] [CrossRef] [PubMed]
- Kim, J.H.; Park, G.H.; Han, G.P.; Kil, D.Y. Effect of Feeding Corn Distillers Dried Grains with Solubles Naturally Contaminated with Deoxynivalenol on Growth Performance, Meat Quality, Intestinal Permeability, and Utilization of Energy and Nutrients in Broiler Chickens. Poult. Sci. 2021, 100, 101215. [Google Scholar] [CrossRef] [PubMed]
- Jha, R.; Singh, A.K.; Yadav, S.; Berrocoso, J.F.D.; Mishra, B. Early Nutrition Programming (in Ovo and Post-Hatch Feeding) as a Strategy to Modulate Gut Health of Poultry. Front. Vet. Sci. 2019, 6, 82. [Google Scholar] [CrossRef] [PubMed]
- Ravindran, V.; Abdollahi, M.R. Nutrition and Digestive Physiology of the Broiler Chick: State of the Art and Outlook. Animals 2021, 11, 2795. [Google Scholar] [CrossRef] [PubMed]
- Wang, J.; Wu, Y.; Zhou, T.; Feng, Y.; Li, L. Common Factors and Nutrients Affecting Intestinal Villus Height-A Review. Anim. Biosci. 2025, 38, 1557. [Google Scholar] [CrossRef] [PubMed]
- Liang, S.; Wang, X. Deoxynivalenol Induces Intestinal Injury: Insights from Oxidative Stress and Intestinal Stem Cells. Environ. Sci. Pollut. Res. 2023, 30, 48676–48685. [Google Scholar] [CrossRef] [PubMed]
- Mishra, S.; Srivastava, S.; Dewangan, J.; Divakar, A.; Kumar Rath, S. Global Occurrence of Deoxynivalenol in Food Commodities and Exposure Risk Assessment in Humans in the Last Decade: A Survey. Crit. Rev. Food Sci. Nutr. 2022, 60, 1346–1374. [Google Scholar]
- Zhu, K.; Duan, J.; Zhuang, Y.; Shi, H.; Chen, X.; Liu, A. Recent Advances in the Mechanism of Deoxynivalenol-Induced Hepatotoxicity and Protective Strategies. Arch. Toxicol. 2026, 1–24. [Google Scholar] [CrossRef] [PubMed]
- Awad, W.A.; Ruhnau, D.; Hess, C.; Doupovec, B.; Schatzmayr, D.; Hess, M. Feeding of Deoxynivalenol Increases the Intestinal Paracellular Permeability of Broiler Chickens. Arch. Toxicol. 2019, 93, 2057–2064. [Google Scholar] [CrossRef] [PubMed]
- Di Vincenzo, F.; Del Gaudio, A.; Petito, V.; Lopetuso, L.R.; Scaldaferri, F. Gut Microbiota, Intestinal Permeability, and Systemic Inflammation: A Narrative Review. Intern. Emerg. Med. 2024, 19, 275–293. [Google Scholar] [CrossRef] [PubMed]
- Farré, R.; Fiorani, M.; Abdu Rahiman, S.; Matteoli, G. Intestinal Permeability, Inflammation and the Role of Nutrients. Nutrients 2020, 12, 1185. [Google Scholar] [CrossRef] [PubMed]
- Vancamelbeke, M.; Vermeire, S. The Intestinal Barrier: A Fundamental Role in Health and Disease. Expert Rev. Gastroenterol. Hepatol. 2017, 11, 821–834. [Google Scholar] [CrossRef] [PubMed]
- Barbara, G.; Barbaro, M.R.; Fuschi, D.; Palombo, M.; Falangone, F.; Cremon, C.; Marasco, G.; Stanghellini, V. Inflammatory and Microbiota-Related Regulation of the Intestinal Epithelial Barrier. Front. Nutr. 2021, 8, 718356. [Google Scholar] [CrossRef] [PubMed]
Figure 1.
Effect of embryonic exposure to deoxynivalenol on the digestive activity of intestinal tissue homogenates from broiler chickens. (A) amylase, (B) chymotrypsin, (C) lipase, and (D) trypsin at 21 d; and (E) amylase, (F) chymotrypsin, (G) lipase, and (H) trypsin at 42 d. Values are the mean ± SEM. Means with different superscripts in the same intestinal segment differ significantly between treatment groups (P < 0.05).
Figure 1.
Effect of embryonic exposure to deoxynivalenol on the digestive activity of intestinal tissue homogenates from broiler chickens. (A) amylase, (B) chymotrypsin, (C) lipase, and (D) trypsin at 21 d; and (E) amylase, (F) chymotrypsin, (G) lipase, and (H) trypsin at 42 d. Values are the mean ± SEM. Means with different superscripts in the same intestinal segment differ significantly between treatment groups (P < 0.05).
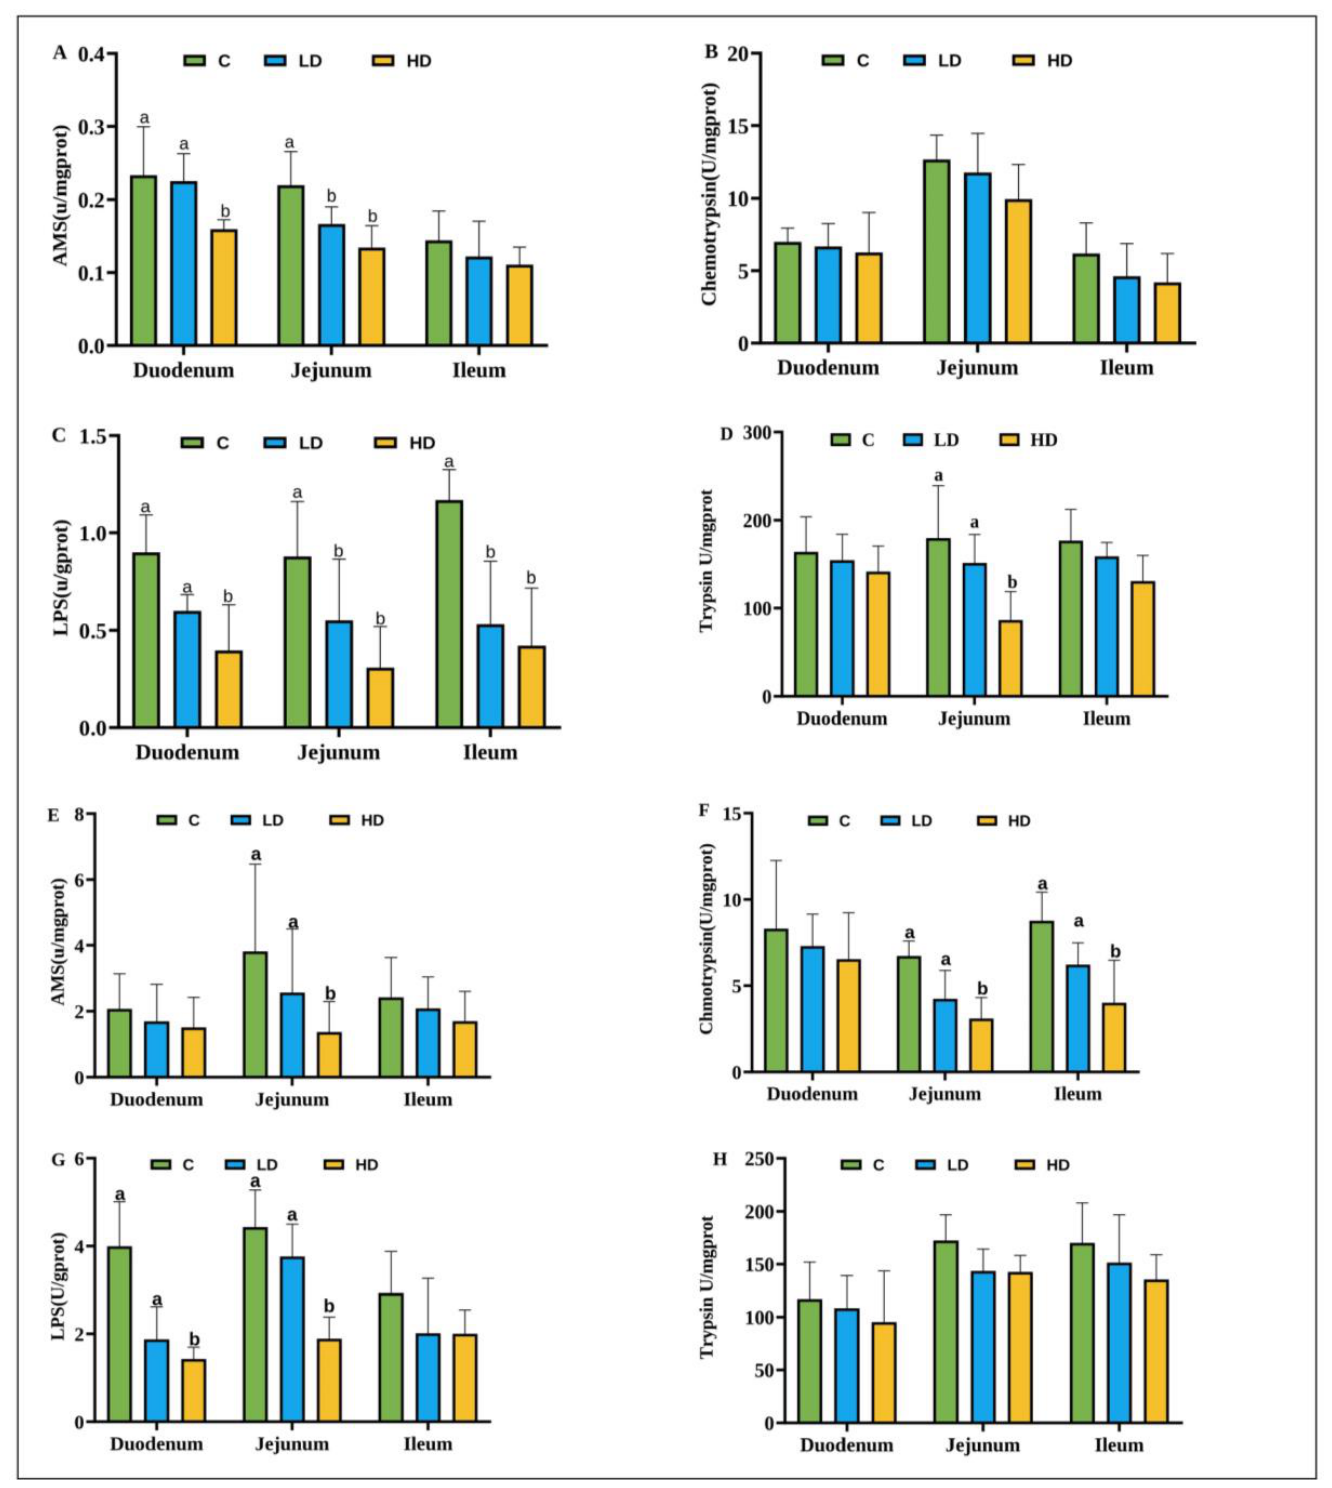
Figure 2.
The effect of embryonic DON exposure on serum oxidative biomarkers in broilers at 21 and 42 d. The 21d results for MDA, GSH-Px, T-SOD, T-AOC, and CAT are shown in panels (A–E), respectively, whereas the measurements at 42d are shown in panels (F–J). At both 21 and 42d, broilers in the LD and HD groups showed significantly higher MDA levels and lower antioxidant enzyme activities, including GSH-Px, T-SOD, T-AOC, and CAT, than the control group. Data are presented as mean ± SEM, and means with different superscripts differ significantly (P < 0.05).
Figure 2.
The effect of embryonic DON exposure on serum oxidative biomarkers in broilers at 21 and 42 d. The 21d results for MDA, GSH-Px, T-SOD, T-AOC, and CAT are shown in panels (A–E), respectively, whereas the measurements at 42d are shown in panels (F–J). At both 21 and 42d, broilers in the LD and HD groups showed significantly higher MDA levels and lower antioxidant enzyme activities, including GSH-Px, T-SOD, T-AOC, and CAT, than the control group. Data are presented as mean ± SEM, and means with different superscripts differ significantly (P < 0.05).
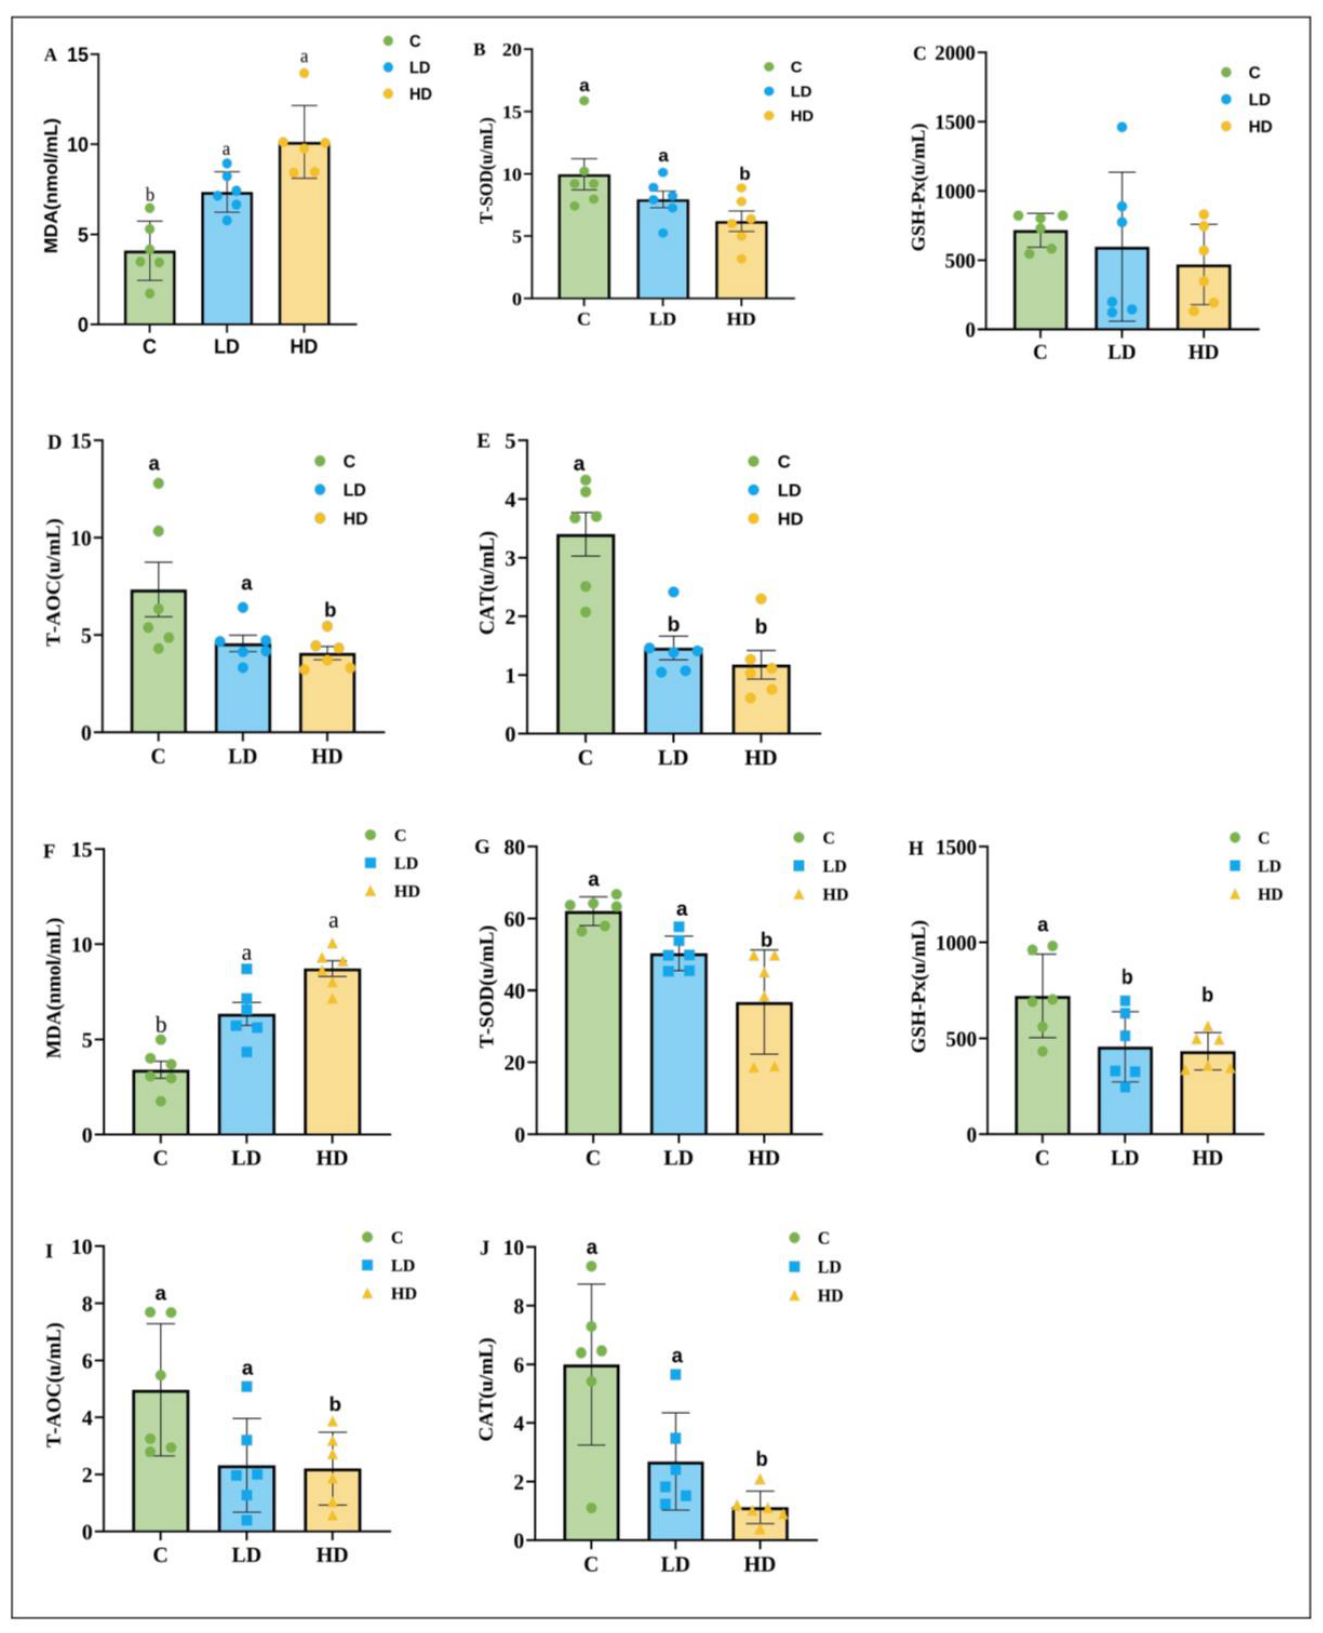
Figure 3.
This figure illustrates oxidative stress indicators in the duodenum, jejunum, and ileum of broilers at 21d (A-E) and 42d (F-J), respectively. Malondialdehyde (MDA), total superoxide dismutase (T-SOD), glutathione peroxidase (GSH-Px), total antioxidant capacity(T-AOC), and catalase (CAT). Values are presented as mean ± SEM, and different superscripts indicate significant differences between groups (P < 0.05). Malondialdehyde (MDA) concentration increased, while antioxidant enzyme activities decreased in the jejunum. These dysfunctions were observed at 21 and 42 d; T-SOD, CAT, and T-AOC declined, while MDA levels increased through 42 d, suggesting persistent damage to intestinal antioxidant status.
Figure 3.
This figure illustrates oxidative stress indicators in the duodenum, jejunum, and ileum of broilers at 21d (A-E) and 42d (F-J), respectively. Malondialdehyde (MDA), total superoxide dismutase (T-SOD), glutathione peroxidase (GSH-Px), total antioxidant capacity(T-AOC), and catalase (CAT). Values are presented as mean ± SEM, and different superscripts indicate significant differences between groups (P < 0.05). Malondialdehyde (MDA) concentration increased, while antioxidant enzyme activities decreased in the jejunum. These dysfunctions were observed at 21 and 42 d; T-SOD, CAT, and T-AOC declined, while MDA levels increased through 42 d, suggesting persistent damage to intestinal antioxidant status.
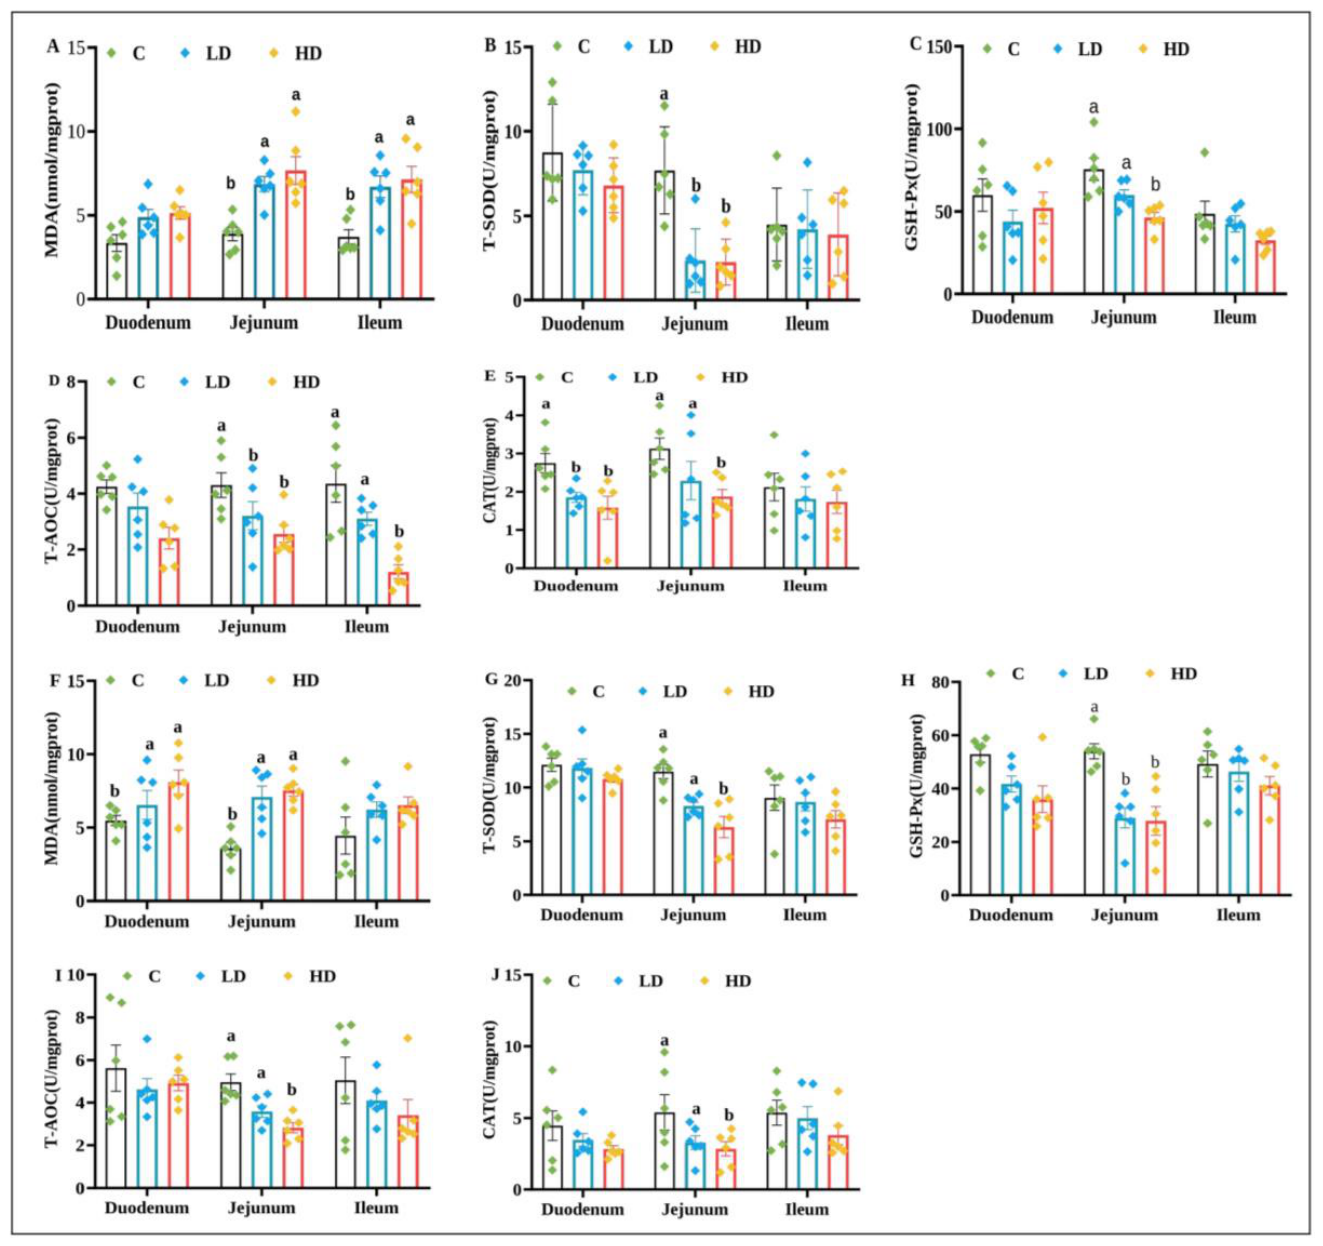
Figure 4.
Effect of embryonic DON exposure on jejunal mRNA expression of antioxidant, inflammatory, tight junction, digestive enzyme, and nutrient transporter genes at 21d and 42d post-hatch in broiler chickens. Expression of relative mRNA level in antioxidant-related genes (Nrf2, HO-1, SOD, GPx-1, CAT) at 21 d; inflammatory cytokines (IL-1β, IL-6, TNF-α, IL-10) at 21 d; tight junction genes (claudin-1, occludin, ZO-1) at 21 d; digestive enzyme–related genes (AMY2, CCK, PNLIP) at 21d; nutrient transporter genes (GLUT2, SGLT1, PEPT1) at 21 d(A-E) and corresponding gene expression pattern at 42d(F-J). Values are means ± SEM. In the same gene (P < 0.05), different superscripts mean significant differences among treatment groups.
Figure 4.
Effect of embryonic DON exposure on jejunal mRNA expression of antioxidant, inflammatory, tight junction, digestive enzyme, and nutrient transporter genes at 21d and 42d post-hatch in broiler chickens. Expression of relative mRNA level in antioxidant-related genes (Nrf2, HO-1, SOD, GPx-1, CAT) at 21 d; inflammatory cytokines (IL-1β, IL-6, TNF-α, IL-10) at 21 d; tight junction genes (claudin-1, occludin, ZO-1) at 21 d; digestive enzyme–related genes (AMY2, CCK, PNLIP) at 21d; nutrient transporter genes (GLUT2, SGLT1, PEPT1) at 21 d(A-E) and corresponding gene expression pattern at 42d(F-J). Values are means ± SEM. In the same gene (P < 0.05), different superscripts mean significant differences among treatment groups.
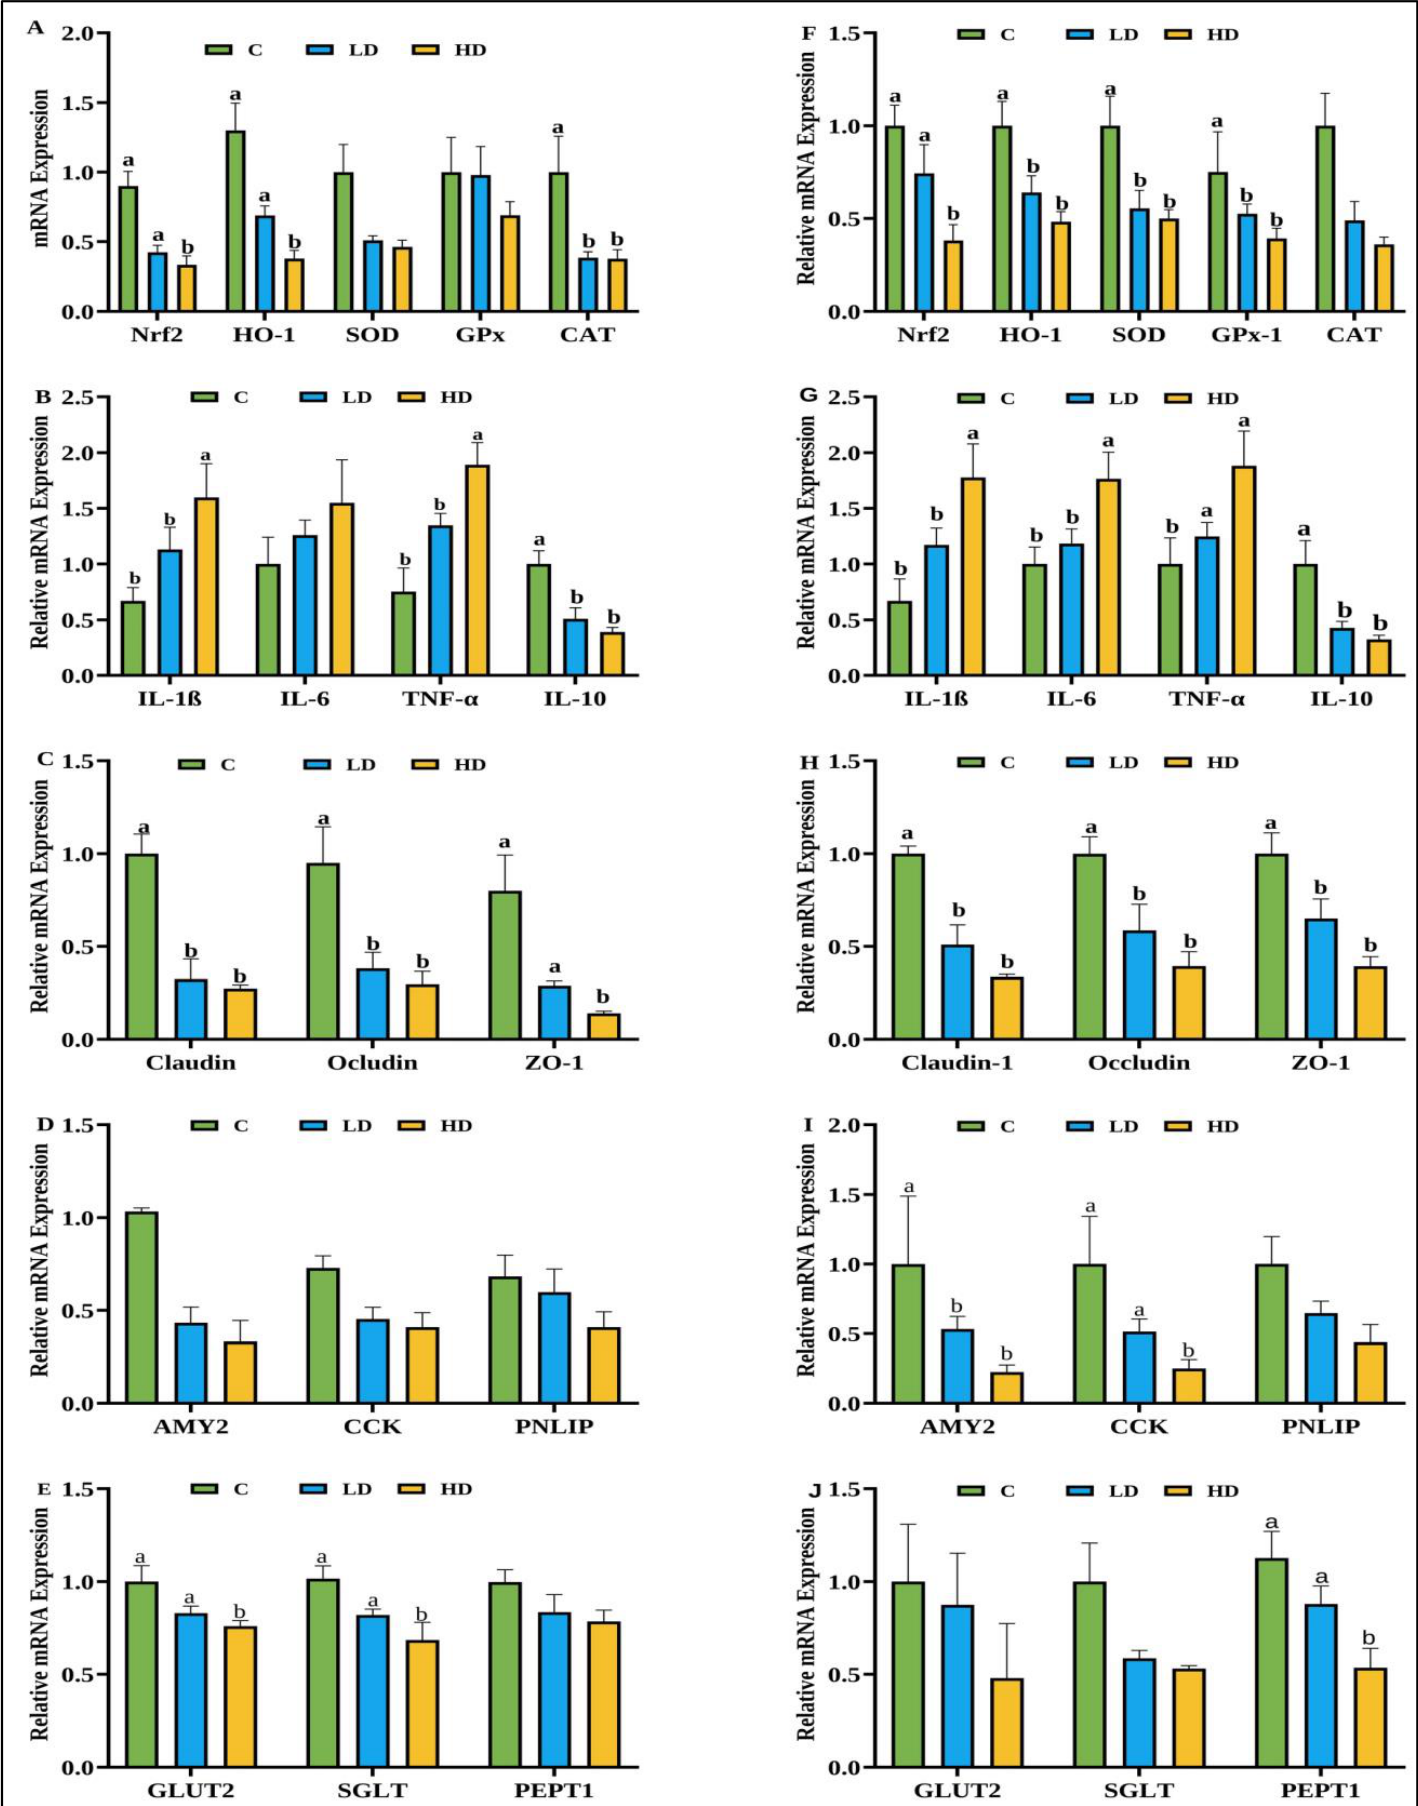
Figure 5.
(A, B) Principal coordinate analysis (PCoA) of OTU-level composition at 21 d (A) and 42 d (B). The PCoA reveals no clear separation between treatment groups in the general structure of cecal microbial communities. (C, D) Partial least squares discriminant analysis (PLS-DA) of cecal microbiota profiles at 21 d (C) and 42 d (D). PLS-DA shows clearer clustering between groups and a group-related treatment difference, which is not evident in PCoA. Each point represents an independent sample, and the distances between points indicate differences in microbial communities.
Figure 5.
(A, B) Principal coordinate analysis (PCoA) of OTU-level composition at 21 d (A) and 42 d (B). The PCoA reveals no clear separation between treatment groups in the general structure of cecal microbial communities. (C, D) Partial least squares discriminant analysis (PLS-DA) of cecal microbiota profiles at 21 d (C) and 42 d (D). PLS-DA shows clearer clustering between groups and a group-related treatment difference, which is not evident in PCoA. Each point represents an independent sample, and the distances between points indicate differences in microbial communities.
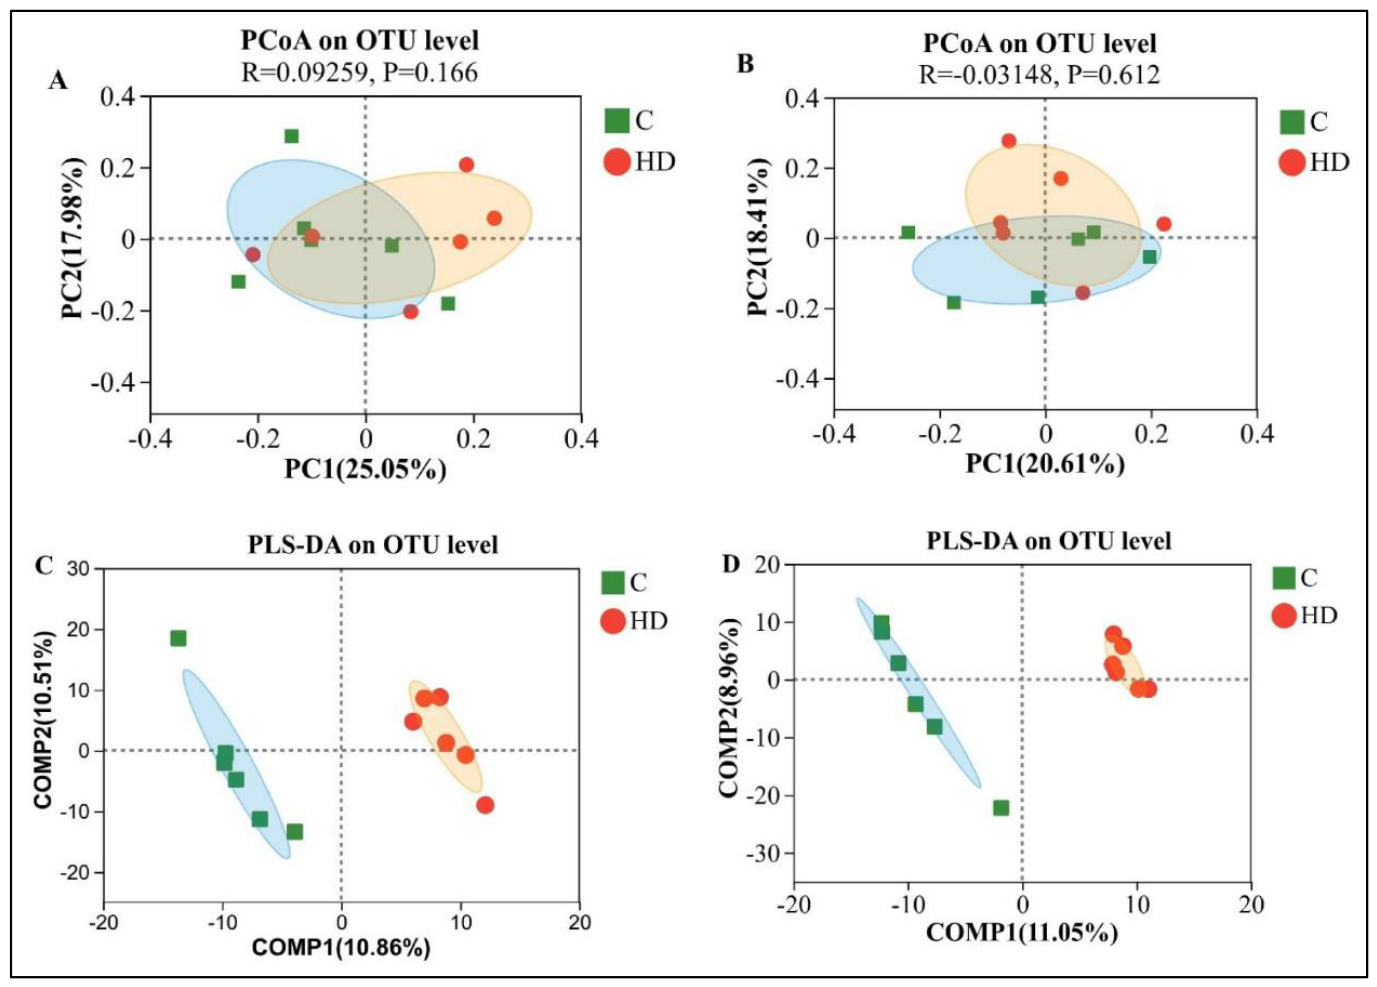
Figure 6.
Extensive plot analysis of the impact of embryonic DON exposure on cecal microbiota composition in broilers at 21 d and 42 d. (A, B) Relative abundance of dominant bacterial phyla (A) and genus level (B) at 21d. (C, D) Relative abundance of major bacterial phyla (C) and genus (D) at 42d. Stacked bar plots represent the relative contributions of dominant taxa in each treatment group.
Figure 6.
Extensive plot analysis of the impact of embryonic DON exposure on cecal microbiota composition in broilers at 21 d and 42 d. (A, B) Relative abundance of dominant bacterial phyla (A) and genus level (B) at 21d. (C, D) Relative abundance of major bacterial phyla (C) and genus (D) at 42d. Stacked bar plots represent the relative contributions of dominant taxa in each treatment group.
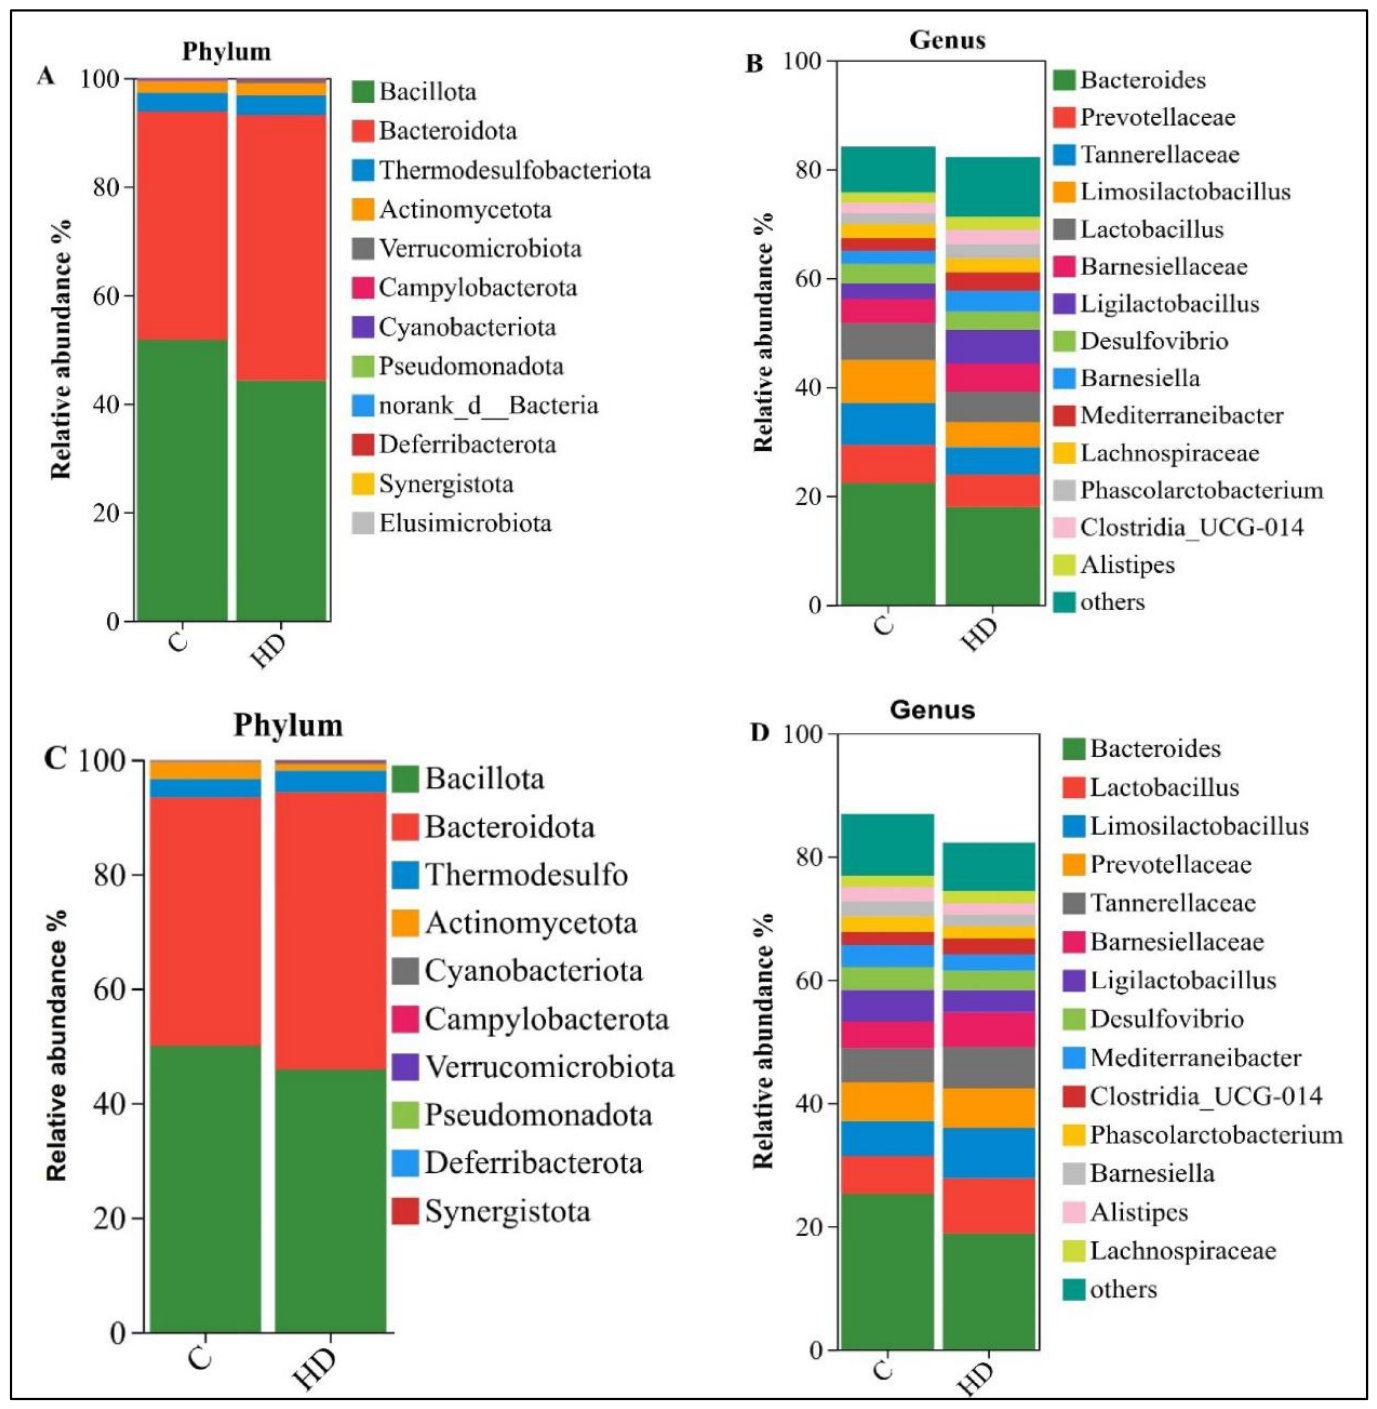
Figure 7.
Effects of embryonic DON exposure on the relative abundance of cecal microbiota at 21d. (A) LEfSe cladogram shows bacterial taxa that differ between control and HD groups at 21 days. Each node represents a taxonomic level from phylum to genus, with colored nodes indicating taxa that vary significantly between groups. (B) LEfSe LDA scores highlight bacterial taxa enriched in the control (green) or HD (red) group, with scores >2.0 indicating discriminative features. (C) Welch’s t-test bar plots display genus-level differences in bacterial relative abundance between groups. Bars indicate mean relative abundance (%). The right panel shows proportions, 95% confidence intervals, and P-values. A P-value <0.05 is considered statistically significant.
Figure 7.
Effects of embryonic DON exposure on the relative abundance of cecal microbiota at 21d. (A) LEfSe cladogram shows bacterial taxa that differ between control and HD groups at 21 days. Each node represents a taxonomic level from phylum to genus, with colored nodes indicating taxa that vary significantly between groups. (B) LEfSe LDA scores highlight bacterial taxa enriched in the control (green) or HD (red) group, with scores >2.0 indicating discriminative features. (C) Welch’s t-test bar plots display genus-level differences in bacterial relative abundance between groups. Bars indicate mean relative abundance (%). The right panel shows proportions, 95% confidence intervals, and P-values. A P-value <0.05 is considered statistically significant.
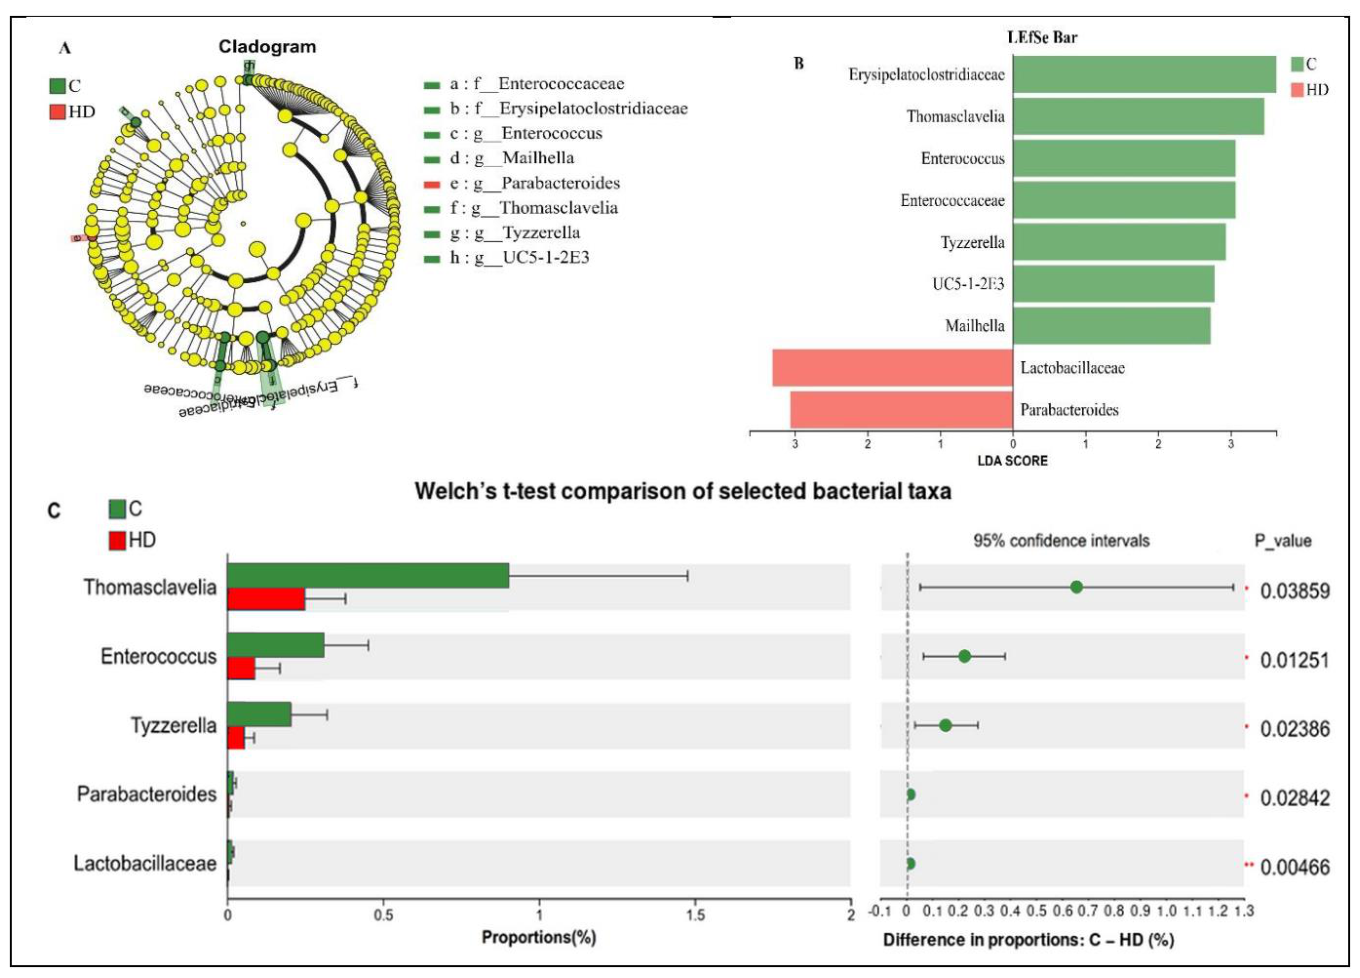
Figure 8.
Effect of embryonic DON exposure on cecal microbiota 42d. (A) LEfSe cladogram illustrating taxonomic biomarkers differentially enriched in C and HD groups. Circle size is proportional to relative abundance, and color indicates group-specific taxa. (B) LEfSe bar plot of taxa with LDA scores > 2.0, indicating significant enrichment of bacterial taxa in each treatment group. (C) A bar plot of Welch’s t-test at the genus level showed the relative abundance difference between CON and DON. The right panel shows 95% confidence intervals and P-values associated with significantly different genera.
Figure 8.
Effect of embryonic DON exposure on cecal microbiota 42d. (A) LEfSe cladogram illustrating taxonomic biomarkers differentially enriched in C and HD groups. Circle size is proportional to relative abundance, and color indicates group-specific taxa. (B) LEfSe bar plot of taxa with LDA scores > 2.0, indicating significant enrichment of bacterial taxa in each treatment group. (C) A bar plot of Welch’s t-test at the genus level showed the relative abundance difference between CON and DON. The right panel shows 95% confidence intervals and P-values associated with significantly different genera.
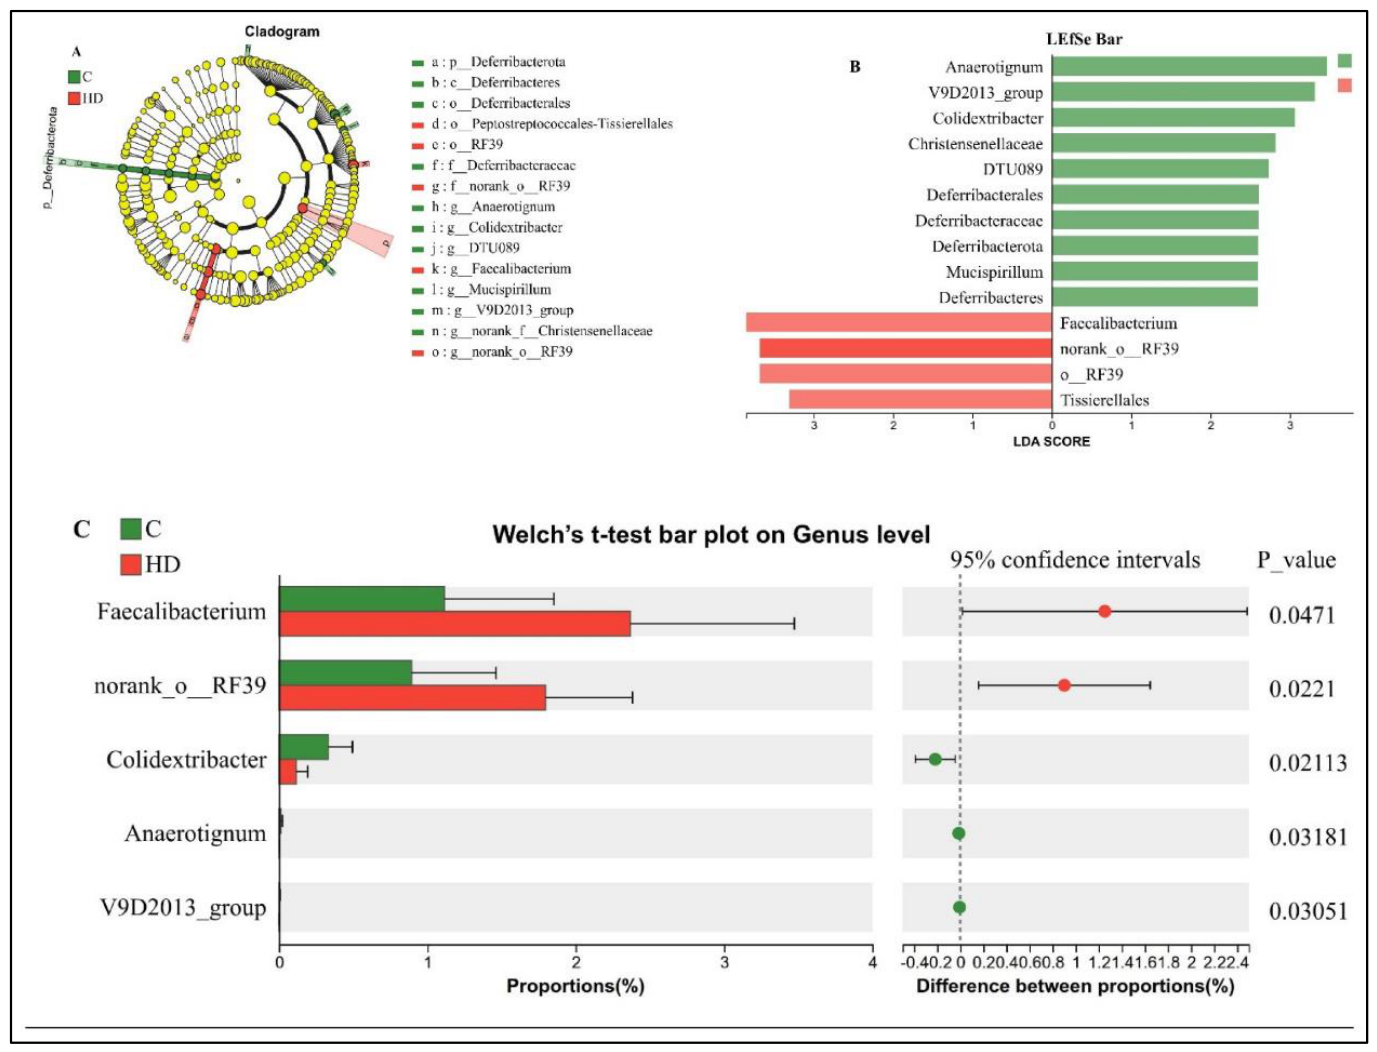

Table 1.
List of primers used in jejunum tissue gene quantification.
| S/N | Gene | Forward (5′ to 3′) | Reverse (5′ to 3′) | Accession number |
| 1. | ß-actin | GTGGATCAGCAAGCAGGAGT | ATCCTGAGTCAAGCGCCAAA | NM_205518.2 |
| 2. | NRF2 | AAAGCTGTTTCCTTAAAGGCGT | TTCCCCTAGAGGGCTTACCA | NM_001007858.1 |
| 3. | HO-1 | AACGCTGAAAGCATGTCCCA | GGAGAGGTGGTCAGCATGTC | NM_205344.2 |
| 4. | SOD-1 | TGATGACCTGGGTAGAGGGG | ACAACGGTTAGCACTTGGCT | NM_205064.1 |
| 5. | CAT | CCTGACTATGGCGCACGTAT | CAGACACACGAGAAGTGGCT | NM_001031215.2 |
| 6. | Gpx-1 | CAACGACGTCTCCTGGAACT | TCGTCCTGCAGTTTGATGGT | NM_001277853.3 |
| 7. | IL-1β | GCCTGCAGAAGAAGCCTCG | TGTAGGTGGCGATGTTGACC | NM_204524.2 |
| 8. | IL-6 | CATGAACTTCACCGAGGGCT | TTGAGGTTGTTCCGGACGAG | NM_204628.2 |
| 9. | TNF-α | CTGAGGCATTTGGAAGCAGC | GACAGGGTAGGGGTGAGGAT | NM_204628.2 |
| 10. | IL-10 | GGCTCAATGGCAGCTTAACG | TGAATGCCTCAGTGCCCAAT | NM_001004414.4 |
| 11. | CLDN1 | GGTATGGCAACAGAGTGGCT | CAGCCAATGAAGAGGGCTGA | NM_001013611.2 |
| 12. | OCLN | GGAGGAGTGGGTGAAGAACG | TGTGATGCTGTTGCAGACCT | NM_205128.1 |
| 13. | ZO-1 | ACCTGACTGTCTTGCAGATGG | CGTAGCTCGTTCATCTCGCT | XM_015278975 |
| 14. | AMY2 | GAGGAGGAGGAGGAGGAGAA | AGGCTGCTGTTGATGTTGGT | NM_001001473 |
| 15. | CCK | CTGCTGCTGCTGCTGCTACT | GGGTCAGGTAGCGTTGTTGT | NM_205294 |
| 16. | PNLIP | GGCTGCTGCTGCTGTTCTT | CAGGATGGTGGTGATGTTGT | NM_205366 |
Table 2.
Impact of Embryonic DON Exposure on Hatching Characteristics and Hatchling Body Weight in Broiler Chickens (Mean ± SEM).
Table 2.
Impact of Embryonic DON Exposure on Hatching Characteristics and Hatchling Body Weight in Broiler Chickens (Mean ± SEM).
| Parameter | C | LD | HD | P-value |
| Hatchability (%) | 83.33 ± 1.01 | 77.88 ± 1.40 | 76.11 ± 0.84 | 0.418 |
| Fertile hatchability (%) | 89.02 ± 0.88 | 82.15 ± 1.20 | 80.47 ± 0.68 | 0.391 |
| Late embryonic mortality (%) | 4.12 ± 0.19 | 4.88 ± 0.76 | 5.11 ± 0.81 | 0.287 |
| Post-hatch survival (%) | 95.95 ± 1.05 | 88.77 ± 1.15 | 86.68 ± 0.97 | 0.35 |
| Body weight (g) | 39.40 ± 0.33b | 38.72 ± 0.25b | 36.95 ± 0.91a | 0.02 |
| Day-old weight CV (%) | 8.11 ± 0.13a | 7.24 ± 0.10a | 17.82 ± 0.34b | 0.04 |
Mean values in the same row with different superscripts differ significantly at P<0.05. C = Control (saline), LD = low dose (0.5 5 µg/egg), HD = high dose (1 5 µg/egg).
Table 3.
Effect of Embryonic DON Exposure on Broiler Chickens’ Growth Performance (Mean ± SEM).
| 1-21day | C | LD | HD | P-value |
| ADG | 15.56 ± 0.18a | 14.23 ± 0.16a | 11.98 ± 0.25b | 0.04 |
| ADFI | 29.91 ± 0.08a | 27.22 ± 0.26a | 25.38 ± 0.46b | 0.01 |
| FCR | 1.9 ± 0.03a | 1.91 ± 0.02a | 2.11 ± 0.02b | 0.04 |
| Mortality | 3.08 ± 0.52 | 4.84± 0.55 | 3.28 ± 0.52 | 0.821 |
| 22-42d | ||||
| ADG | 29.56 ± 1.12a | 25.83 ± 1.61b | 22.53 ± 1. 53b | 0.01 |
| ADFI | 62.56 ± 0.07a | 60.40 ± 0.08 a | 58.32 ±0.06b | 0.02 |
| FCR | 2.14 ± 0.08 | 2.41 ± 0.17 | 2.62 ± 0.12 | 0.19 |
| Mortality | 1.56± 0.41 | 3.28 ± 0.52 | 5.00 ± 0.55 | 0.52 |
| 1-42d | ||||
| ADG | 22.56 ±1.24a | 20.03± 1.67b | 17.76 ± 0.68b | 0.001 |
| ADFI | 46.24 ± 0.18a | 43.81 ±0.44a | 41.85 ± 0.46b | 0.003 |
| FCR | 2.05 ±0.06a | 2.18 ± 0.09a | 2.35 ± 0.06b | 0.007 |
| Mortality | 5.00 ± 2.24 | 6.67 ± 2.11 | 7.50 ± 2.58 | 0.78 |
Note. Values are presented as mean ± standard error of the mean (SEM). C = control; LD = low-dose deoxynivalenol exposure; HD = high-dose deoxynivalenol exposure; DON = deoxynivalenol; ADG = average daily gain; ADFI = average daily feed intake; FCR = feed conversion ratio. Within each row, means with different superscript letters differ significantly (P < 0.05); means sharing the same letter do not differ significantly.
Table 4.
Effect of in ovo DON exposures on intestinal morphological structures.
| Intestinal Section | Treatment group | ||||
| 21d | C | LD | HD | P-Value | |
| Duodenum(µm) | VH | 1075.47± 13.16a | 968 ± 14.3b | 960.61 ± 13.88b | 0.0004 |
| CD | 162.89 ± 20.21 | 173.91 ± 4.59 | 184.24 ± 26.47 | 0.746 | |
| VH: CD | 6.89± 0.78 | 5.58 ± 0.19 | 5.48 ± 0.63 | 0.2251 | |
| Jejunum (µm) | VH | 1220.77 ± 41.35a | 1026.95 ± 5.63a | 957.01 ± 47.60b | 0.001 |
| CD | 161.33 ± 16.60 | 182.50 ± 12.96 | 179.42 ± 29.13 | 0.7452 | |
| VH: CD | 6.05 ± 0.44 | 5.71 ± 0.41 | 7.27 ± 0.99 | 0.2769 | |
| Ileum (µm) | VH | 1234.92 ± 25.45a | 889.10 ± 27.97b | 675.07 ± 27.97b | <0.0001 |
| CD | 180.86± 15.30 | 211.21 ± 24.22 | 199.12 ± 24.22 | 0.7545 | |
| VH: CD | 6.97 ± 0.55a | 4.44 ± 0.70a | 3.95 ± 0.70b | 0.0451 | |
| 42d | |||||
| Duodenum(µm) | VH | 988.89 ± 78.17a | 931.28 ± 83.39a | 705.53 ± 39.99b | 0.02 |
| CD | 144.03 ± 7.80a | 166.22 ± 14.04b | 182.64 ± 6.01b | 0.04 | |
| VH: CD | 6.87 ± 0.31 | 5.60 ± 0.22 | 3.86± 0.22 | 0.15 | |
| Jejunum(µm) | VH | 1169.65 ± 59.40a | 1053.59 ± 18.35a | 1014.71 ± 12.07b | 0.02 |
| CD | 147.06 ± 9.62 | 172.71 ± 9.54 | 182.98 ± 16.04 | 0.12 | |
| VH: CD | 7.95 ± 0.45 | 6.10 ± 0.31 | 5.55 ± 0.36 | 0.13 | |
| Ileum(µm) | VH | 1069.79 ± 35.14a | 907.62 ± 52.84a | 663.1 ± 145.95b | 0.02 |
| CD | 164.11 ± 17.03 | 166.37 ± 10.45 | 180.81 ± 14.43 | 0.67 | |
| VH: CD | 6.52 ± 0.63 | 5.46 ± 0.57 | 3.67 ± 0.75 | 0.299 |
Note: VH = villus height; CD= crypt depth; VH: CD = villus height-to-crypt depth ratio. Measurements were from samples at 21 and 42 days. Values are the mean ± SEM. Different superscripts in each row indicate significant differences (P < 0.05).
Disclaimer/Publisher’s Note: The statements, opinions and data contained in all publications are solely those of the individual author(s) and contributor(s) and not of MDPI and/or the editor(s). MDPI and/or the editor(s) disclaim responsibility for any injury to people or property resulting from any ideas, methods, instructions or products referred to in the content. |
© 2026 by the authors. Licensee MDPI, Basel, Switzerland. This article is an open access article distributed under the terms and conditions of the Creative Commons Attribution (CC BY) license (http://creativecommons.org/licenses/by/4.0/).
Copyright: This open access article is published under a Creative Commons CC BY 4.0 license, which permit the free download, distribution, and reuse, provided that the author and preprint are cited in any reuse.