

Submitted:
09 October 2026
Posted:
10 October 2026
You are already at the latest version
Abstract
TGA (TGACG motif-binding factor) proteins are plant-specific group D basic leucine zipper (bZIP) transcription factors that bind as-1/TGACG elements. They integrate jasmonic acid (JA) and salicylic acid (SA) signaling with growth, development and stress responses. Tea (Camellia sinensis) and oil tea (Camellia oleifera) are Theaceae crops grown for beverages and edible oil, and anthracnose, drought and chilling reduce their yield and quality. TGA genes had not been characterized in either crop. We therefore identified TGA genes ge-nome-wide in six representative Theaceae species: Camellia chekiangoleosa, C. oleifera, C. sinensis, Camellia crapnelliana, Camellia japonica and Stewartia sinensis. We then examined their phylogeny, gene structure and conserved motifs, codon usage, duplication and col-linearity, and promoter cis-elements. Transcriptome data and qRT-PCR provided expres-sion evidence for C. oleifera TGA (ColeTGA) genes after inoculation with Colletotrichum fruc-ticola. The survey yielded 68 non-redundant TGA genes, 10 to 13 per species, each with in-tact bZIP and DOG1 domains and a predicted nuclear localization. Phylogenetic analysis resolved five groups, and Theaceae members clustered mainly in Groups II and IV, where motif composition and exon–intron structure were conserved. Codon usage bias was weak (effective number of codons 52–54; codon adaptation index 0.77–0.80). The mean Ka/Ks was 0.25, indicating purifying selection. Whole-genome and segmental duplication drove most family expansion (60–91.67%), while tandem duplication was rare. Promoters were enriched in cis-elements responsive to light, JA, SA and abscisic acid (ABA). Expres-sion varied among tissues, and several genes were enriched in fruit and leaves. Salt, drought and cold each induced subsets of TGA genes. After inoculation with C. fructicola, the 12 ColeTGA genes showed four expression patterns. ColeTGA2, ColeTGA3, ColeTGA4, ColeTGA6, ColeTGA10 and ColeTGA12 were strongly activated. Together, these compari-sons clarify how TGA genes have been conserved and how they diverged among Theaceae lineages. They also identify candidates for functional tests of anthracnose resistance and for stress-tolerance breeding in tea and oil tea.
Keywords:
Theaceae
; TGA gene family
; whole-genome duplication
; abiotic stress
; anthracnose resistance
1. Introduction
TGA (TGACG motif-binding factor) proteins form the group D clade of the plant bZIP family and recognize the as-1/TGACG cis-element [1]. They bind NPR1 (nonexpressor of pathogenesis-related genes 1), a central regulator of jasmonic acid (JA) and salicylic acid (SA) signaling [2,3]. TGA proteins therefore integrate JA and SA signaling, and their functions extend beyond pathogen defense. They control PR (pathogenesis-related) gene expression during pathogen attack and also contribute to drought, salinity and chilling responses [4,5].
Tea (Camellia sinensis) and oil tea (Camellia oleifera) are Theaceae crops grown for beverages and edible oil. Anthracnose, drought and chilling reduce the yield and quality of both crops. TGA proteins are central to defense and stress signaling [2,17], but their contribution to these losses in Theaceae is unknown. Functional evidence for TGA genes has come mainly from tomato and melon. In tomato, TGA1a supports Mi-1-mediated resistance to root-knot nematodes [18]. In melon, CmTGA confers contrasting effects on resistance to bacteria and to Botrytis cinerea [19].
Genome-wide surveys have catalogued TGA genes in many plants, and the counts vary widely. Sweet orange carries seven TGA genes, common bean eight, kiwifruit 13 and sunflower 14 [6,7,8,9]. Polyploid genomes hold larger repertoires, including 39 genes in rapeseed and 48 in wheat [10,11]. These differences are usually attributed to whole-genome duplication (WGD) and the subsequent retention or loss of duplicated copies [12,13]. In Camellia, a WGD event dated to about 57.5 Mya is shared across the genus [14]. The tea genome also carries evidence of two more ancient polyploidization events [15,16]. Whether these events expanded the TGA family in Theaceae, and whether duplicated copies diverged in function, has not been tested.
In this study, we identified TGA genes in six representative Theaceae species and compared their phylogeny, gene structure, chromosomal distribution, duplication history and promoter cis-elements. We also examined protein physicochemical properties, codon usage bias and cross-species collinearity. We profiled expression across tissues and after salt, drought and cold treatments. Quantitative reverse transcription PCR (qRT-PCR) then monitored C. oleifera TGA (ColeTGA) genes after Colletotrichum fructicola inoculation. These comparisons clarify how the TGA family expanded and diverged within Theaceae and identify candidate genes for functional tests of anthracnose resistance and stress tolerance.
2. Materials and Methods
2.1. Plant Materials and Treatment
Changlin 53, a cultivar of C. oleifera, was grown in the oil-tea plantation of Xinyang Agriculture and Forestry University, Xinyang City, Henan Province, China. Xinyang lies at about 32°08′ N, 114°05′ E, in the transition between the northern subtropical and warm temperate zones. The climate there is mild and humid, with annual precipitation of 1105–1109 mm, an annual mean temperature of 15.1–15.3 °C and a frost-free period of about 221 d. Changlin 53 is an elite oil-tea cultivar released nationally by the Research Institute of Subtropical Forestry, Chinese Academy of Forestry. An earlier resistance evaluation rated this clone as moderately resistant to anthracnose [20].
Inoculum was prepared from fresh colonies of C. fructicola strain TQ2. The isolate was cultured on potato dextrose agar (PDA) at a constant 28 °C in darkness for 7 d. Mycelium was scraped, and the spore suspension was calibrated to 1 × 10⁶ mL⁻¹ with a hemocytometer [21]. Leaves of uniform development were wounded twice on either side of the main vein with a sterile needle, and 10 μL of the suspension was applied dropwise to each wound. After inoculation, the plants were kept in a plastic shed. Leaf tissue was harvested at 0, 2, 4 and 6 d post-inoculation, frozen immediately in liquid nitrogen and stored at –80 °C.
2.2. Identification and Physicochemical Property Analysis of TGA Gene Family Members
Whole-genome and proteome datasets were downloaded for six Theaceae species: Camellia chekiangoleosa, C. oleifera, C. sinensis, Camellia crapnelliana, Camellia japonica and Stewartia sinensis. The data came from the Tea Plant Information Archive (TPIA; https://tpia.teaplants.cn/index.html; accessed 3 February 2026) [22,23]. The ten annotated AtTGA proteins from Arabidopsis thaliana, retrieved from TAIR (The Arabidopsis Information Resource; https://www.arabidopsis.org/; accessed 3 February 2026), served as queries. Homology searches were run against the six genomes with BLASTP (NCBI BLAST+ v2.14.1) at identity ≥30%, query coverage ≥70% and e-value ≤1 × 10⁻⁵.
Domain content was checked against the NCBI Conserved Domain Database (https://www.ncbi.nlm.nih.gov/Structure/cdd/wrpsb.cgi; accessed 5 February 2026) and SMART (https://smart.embl.de/smart/change_mode.cgi; accessed 5 February 2026). Only sequences with a complete bZIP domain (PF00170) and a DOG1 domain (PF08195) were retained [24,25]. Sequences with incomplete domains or substantial deletions were discarded. Where the annotation contained alternative transcripts, the longest transcript was used, and the resulting TGA protein set was non-redundant. We calculated the theoretical isoelectric point (pI) and molecular weight (MW) of each retained protein with the ExPASy ProtParam server (https://web.expasy.org/protparam/; accessed 8 February 2026) [26]. Subcellular localization was predicted with WoLF PSORT (https://wolfpsort.hgc.jp/; accessed 11 February 2026). Table S1 lists the chromosomal positions, gene lengths and exon–intron structures of these genes.
2.3. TGA Gene Family Sequence Alignment and Phylogenetic Analysis
Full-length TGA proteins from the six Theaceae species were aligned with MUSCLE 5.1 [27] using default settings. The alignment was edited manually, and conserved domains were then annotated and visualized in Jalview 2.11 [28]. A phylogenetic tree was inferred in MEGA11 [29] by the neighbor-joining (NJ) method with the JTT+G model, 1000 bootstrap replicates for branch support and pairwise deletion of missing data. The tree was visualized and annotated on iTOL (https://itol.embl.de/; accessed 22 February 2026).
2.4. Gene Structure and Motif Analysis of the TGA Gene Family
Exon–intron information for the TGA genes came from the GFF files and genome data. These features were examined with the SMART web server, and functional domain diagrams were drawn from the CDD database. Motifs were predicted with the MEME Suite (https://meme-suite.org/meme/; accessed 7 March 2026) [30], with the maximum number of motifs set to 8 and other parameters at their default values. Predicted motifs, gene structures and conserved domains were displayed together in TBtools-II using its Gene Structure View program [31].
2.5. Codon Usage Bias Analysis of the TGA Gene Family
Total GC (guanine–cytosine) content, the effective number of codons (ENC) and the codon adaptation index (CAI) were calculated for the TGA gene families of seven species. EMBOSS (http://www.bioinformatics.nl/emboss-explorer/; accessed 3 April 2026) and CODONW (https://sourceforge.net/projects/codonw/files/codonw/; accessed 9 April 2026) were used for these calculations. GC content was also determined separately for codon positions 1, 2 and 3 (GC1, GC2, GC3).
2.6. Evolutionary Analysis of the TGA Gene Family
The six genomes were compared for collinearity with the One Step MCScanX module of TBtools-II [31]. TGA genes were assigned to duplication classes with the Duplicate Gene Classification module of the same program. Syntenic blocks that contained TGA genes were extracted from the collinearity output and displayed with the Advanced Circos module. Ka/Ks values were calculated by the YN method in the Simple Ka/Ks Calculator module.
2.7. Analysis of Promoter Cis-Regulatory Elements of the TGA Gene Family
For each species, the promoter of each TGA gene was defined as the 2000 bp region upstream of the ATG start codon. These sequences were submitted to PlantCARE (http://bioinformatics.psb.ugent.be/webtools/plantcare/; accessed 25 April 2026) to predict and annotate cis-acting regulatory elements. The annotated elements were then summarized by type and copy number. Elements assigned to development and growth, hormone signaling, and abiotic and biotic stress responses were examined more closely.
2.8. Expression Profile Analysis of TGA Family Genes
Expression data for 32 TGA genes from C. sinensis, C. oleifera and C. chekiangoleosa were retrieved from TPIA (https://tpia.teaplants.cn/index.html; accessed 4 May 2026) [23]. These genes were compared across tissues, developmental stages and stress treatments. The HeatMap tool of TBtools-II was used for hierarchical clustering, normalization and visualization of the expression data [31].
2.9. Quantitative Reverse Transcription Polymerase Chain Reaction (qRT-PCR) Analysis
Total RNA was extracted from C. oleifera leaves with a plant total RNA extraction kit (Tiangen Biotech (Beijing) Co., Ltd.). First-strand cDNA was synthesized with the PrimeScript RT kit (Takara Bio Inc.). The C. oleifera GAPDH gene served as the reference [32]. Quantitative PCR was performed with SYBR Premix Ex Taq II (Tli RNaseH Plus; Takara Bio Inc.) on an ABI 7500 system (Applied Biosystems). Relative expression was calculated by the 2^−ΔΔCT method [33]. The primers used for qRT-PCR are listed in Table S2.
3. Results and Analysis
3.1. Identification and Characterization of the TGA Gene Family in Six Theaceae Species
Across the six species, 68 TGA members were identified in total (Table S1). C. sinensis and C. chekiangoleosa each carried 10 members, C. crapnelliana 11, C. oleifera and C. japonica 12, and S. sinensis 13. Protein length ranged from 321 aa (CcheTGA7) to 535 aa (CsinTGA5), and the median was lowest in C. sinensis (406 aa) and highest in C. oleifera (456.5 aa). Predicted molecular weights ranged from 36.07 kDa (CcheTGA7) to 58.73 kDa (CcraTGA7), and isoelectric points (pI) from 5.09 (CsinTGA5) to 8.70 (CjapTGA5). More proteins had pI < 7.0 than pI > 7.0. Theaceae TGA genes ranged from 4,674 bp (CcraTGA2) to 33,276 bp (SsinTGA6) and contained 8 to 15 exons. All 68 proteins were predicted to localize to the nucleus.
3.2. Phylogenetic Classification and Evolutionary Characteristics of the TGA Gene Family
TGA protein sequences from A. thaliana and six Theaceae species (C. chekiangoleosa, C. crapnelliana, C. japonica, C. oleifera, C. sinensis and S. sinensis) were aligned and used to build a neighbor-joining (NJ) tree (Figure 1). Support from 1000 bootstrap replicates indicated a generally robust topology. The tree resolved five groups, Groups I to V. Group II was the largest and contained AthaTGA2, AthaTGA5 and AthaTGA6 together with Theaceae sequences. Group IV was the second largest and contained AthaTGA9, AthaTGA10 and Theaceae sequences. Group III contained AthaTGA3, AthaTGA7 and Theaceae sequences, and Group I contained AthaTGA1, AthaTGA4 and Theaceae sequences. Group V contained one A. thaliana sequence, AthaTGA8, and six Theaceae sequences: CjapTGA7, ColeTGA4, CsinTGA4, CcraTGA4, CcheTGA4 and CjapTGA2. The 10 A. thaliana genes were distributed across the five groups in numbers of 2, 3, 2, 2 and 1 (Group I–V). Theaceae genes were more frequent in Group II and IV than in Group I and III. Copy number also differed among the six Theaceae species within groups.
3.3. Multiple Sequence Alignment of the TGA Gene Family
TGA protein sequences from the six Theaceae species were aligned (Figure 2). A bZIP domain was present in every protein, comprising a DNA-binding site at the N-terminus and a dimer interface at the C-terminus. Basic residues were abundant at the DNA-binding site, and the canonical leucine zipper at the dimer interface mediates homodimer or heterodimer formation. A conserved DOG1 domain was identified at the C-terminus. The bZIP and DOG1 domains were strongly conserved across the family, whereas substitutions occurred mainly at the sequence extremities and in the linker regions.
3.4. Gene Structure, Conserved Motif, and Domain Analysis of the TGA Gene Family
Gene structure, conserved motifs, conserved domains and phylogeny were examined together for TGA proteins from the six Theaceae species and A. thaliana (Figure 3). Motif number, combination and linear order were similar among members of the same group (Figure 3A,B). Motif distribution varied more in Groups II and IV than in Groups I, III and V. The A. thaliana sequences (AthaTGA) were dispersed among the groups, and their motif composition matched that of Theaceae proteins in the same branch. Every protein contained a bZIP domain and a DOG1 domain (Figure 3C). Exon–intron organization also differed among groups (Figure 3D).
3.5. Codon Usage Bias Analysis of the TGA Gene Family
Codon usage bias (CUB) was evaluated for TGA genes in the six Theaceae species and A. thaliana. Clustering of relative synonymous codon usage (RSCU) values separated codon usage by species (Figure S2A), and two clusters were resolved in the heat map. CAI, ENC and GC content were calculated for the same genes (Figure S2B). CAI medians ranged from 0.77 to 0.80 among the Theaceae species, compared with 0.76 in A. thaliana. ENC varied little: the lowest species median was 53 in C. sinensis, and S. sinensis included values above 55. GC content was 0.44–0.47, close to the value for A. thaliana (0.45). The GC2 and GC3 distributions overlapped between the Theaceae species and A. thaliana. GC1 was higher in the Theaceae species (medians 0.55–0.57) than in A. thaliana (0.54), with the highest median in C. chekiangoleosa.
3.6. Chromosomal Distribution and Duplication Analysis of the TGA Gene Family
Using a distance threshold of 0.5–1 Mb, one TGA gene cluster was detected on Chr12 of C. oleifera, where ColeTGA7 and ColeTGA8 lie 0.54 Mb apart. Intraspecific collinearity (Figure 4; Table S3) identified collinear TGA gene pairs in C. japonica (6), C. oleifera (5), C. crapnelliana (4), S. sinensis (4), C. chekiangoleosa (3) and C. sinensis (2). Ka, Ks and Ka/Ks were compared between A. thaliana and the Theaceae species (Figure S3). Ks was higher in A. thaliana than in the Theaceae species examined, and Ka/Ks remained below 1 in every species (mean 0.25), indicating purifying selection. Ka/Ks was higher in the Theaceae species than in A. thaliana and reached its highest value in C. sinensis.
WGD or segmental duplication accounted for most TGA genes in each Theaceae species (Figure 5). In C. oleifera, 91.67% of TGA genes (11 genes) were WGD-derived, followed by 75% (9) in C. japonica and 72.73% (8) in C. crapnelliana. The corresponding values were 70% (7) in C. chekiangoleosa, 61.54% (8) in S. sinensis and 60% (6) in C. sinensis. Dispersed duplication was detected in the five Theaceae species other than C. oleifera (25–40%). Tandem duplication was detected only in C. oleifera (8.33%, 1 gene) among the Theaceae species and in A. thaliana (11.11%, 1 gene).
3.7. Collinearity Analysis of TGA Genes Among Different Theaceae Species
Cross-species collinearity was derived from whole-genome alignments (Figure 6; Table S4). Within Theaceae, comparisons between adjacent phylogenetic nodes yielded 85 collinear TGA gene pairs: 19 between S. sinensis and C. crapnelliana, 15 between C. crapnelliana and C. sinensis, 14 between C. sinensis and C. chekiangoleosa, 19 between C. chekiangoleosa and C. japonica, and 18 between C. japonica and C. oleifera. A comparison between S. sinensis, which represents the basal lineage of Theaceae, and A. thaliana yielded a further 8 collinear gene pairs (Figure 6; Table S4), bringing the total to 93.
3.8. Promoter Analysis of the TGA Gene Family
The 2000 bp region upstream of the ATG start codon of each TGA gene was submitted to PlantCARE for cis-acting element prediction. In total, 1611 elements were predicted, representing 51 types (Figure 7; Tables S5 and S6). Using the criteria in Table S5, 5 types were related to stress responses, 12 to hormone regulation and 34 to growth and development. Within the growth and development category, light-responsive elements were the most numerous (676). Hormone-responsive elements totalled 512, comprising 212 jasmonic acid-responsive, 145 abscisic acid-responsive, 70 salicylic acid-responsive, 55 gibberellin-responsive and 30 auxin-responsive elements.
Promoter sequences resolved into the same five groups as the protein phylogeny (Figure 7 and Figure S4), and cis-element composition differed among groups. Figure S5 and Table S7 present the low-temperature-, drought- and hormone-responsive elements; the hormone-responsive elements were mainly abscisic acid-, gibberellin-, methyl jasmonate-, salicylic acid- and auxin-responsive. CjapTGA9, CsinTGA4 and CcheTGA8 were richest in methyl jasmonate-related elements, whereas CsinTGA4, ColeTGA9 and ColeTGA12 carried the most salicylic acid-responsive elements. One to three low-temperature- or drought-related elements were present in most TGA genes, while SsinTGA6, CjapTGA5, CcheTGA6 and CcraTGA10 carried none.
3.9. Expression Profile Analysis of TGA Genes in Different Tissues and Under Abiotic Stress Conditions
An RNA-seq transcriptome atlas was used to examine TGA expression in three Theaceae species (C. sinensis, C. oleifera and C. chekiangoleosa) across tissues and under abiotic stress (Figure 8A,B). Genes on the upper branch of the tree were up-regulated along the leaf position gradient (First leaf, Second leaf, Third leaf). CcheTGA9, ColeTGA9 and CsinTGA8 peaked in the second leaf and remained low in buds. ColeTGA5, CcheTGA5 and CsinTGA5 accumulated preferentially in mature leaves, old leaves and fruit, and CcheTGA8 was abundant in stems. The remaining genes showed low expression across the tissues surveyed. ColeTGA1 and ColeTGA4 clustered together, but ColeTGA4 was higher than ColeTGA1 at every leaf position.
Under NaCl treatment (24 h and 72 h), eleven genes on the upper branch were up-regulated: CsinTGA5, CsinTGA8, CsinTGA9, CsinTGA10, ColeTGA5, ColeTGA6, ColeTGA9, ColeTGA12, CcheTGA5, CcheTGA7 and CcheTGA9. PEG-imposed drought induced ColeTGA5, CcheTGA5 and CsinTGA5 at 48 h and 72 h, and cold treatment induced the same three genes at CA1 7 d, CA2 7 d and DA 7 d. The other genes showed low expression or little change under drought and cold.
3.10. Expression Analysis of ColeTGA Genes After Inoculation with C. fructicola
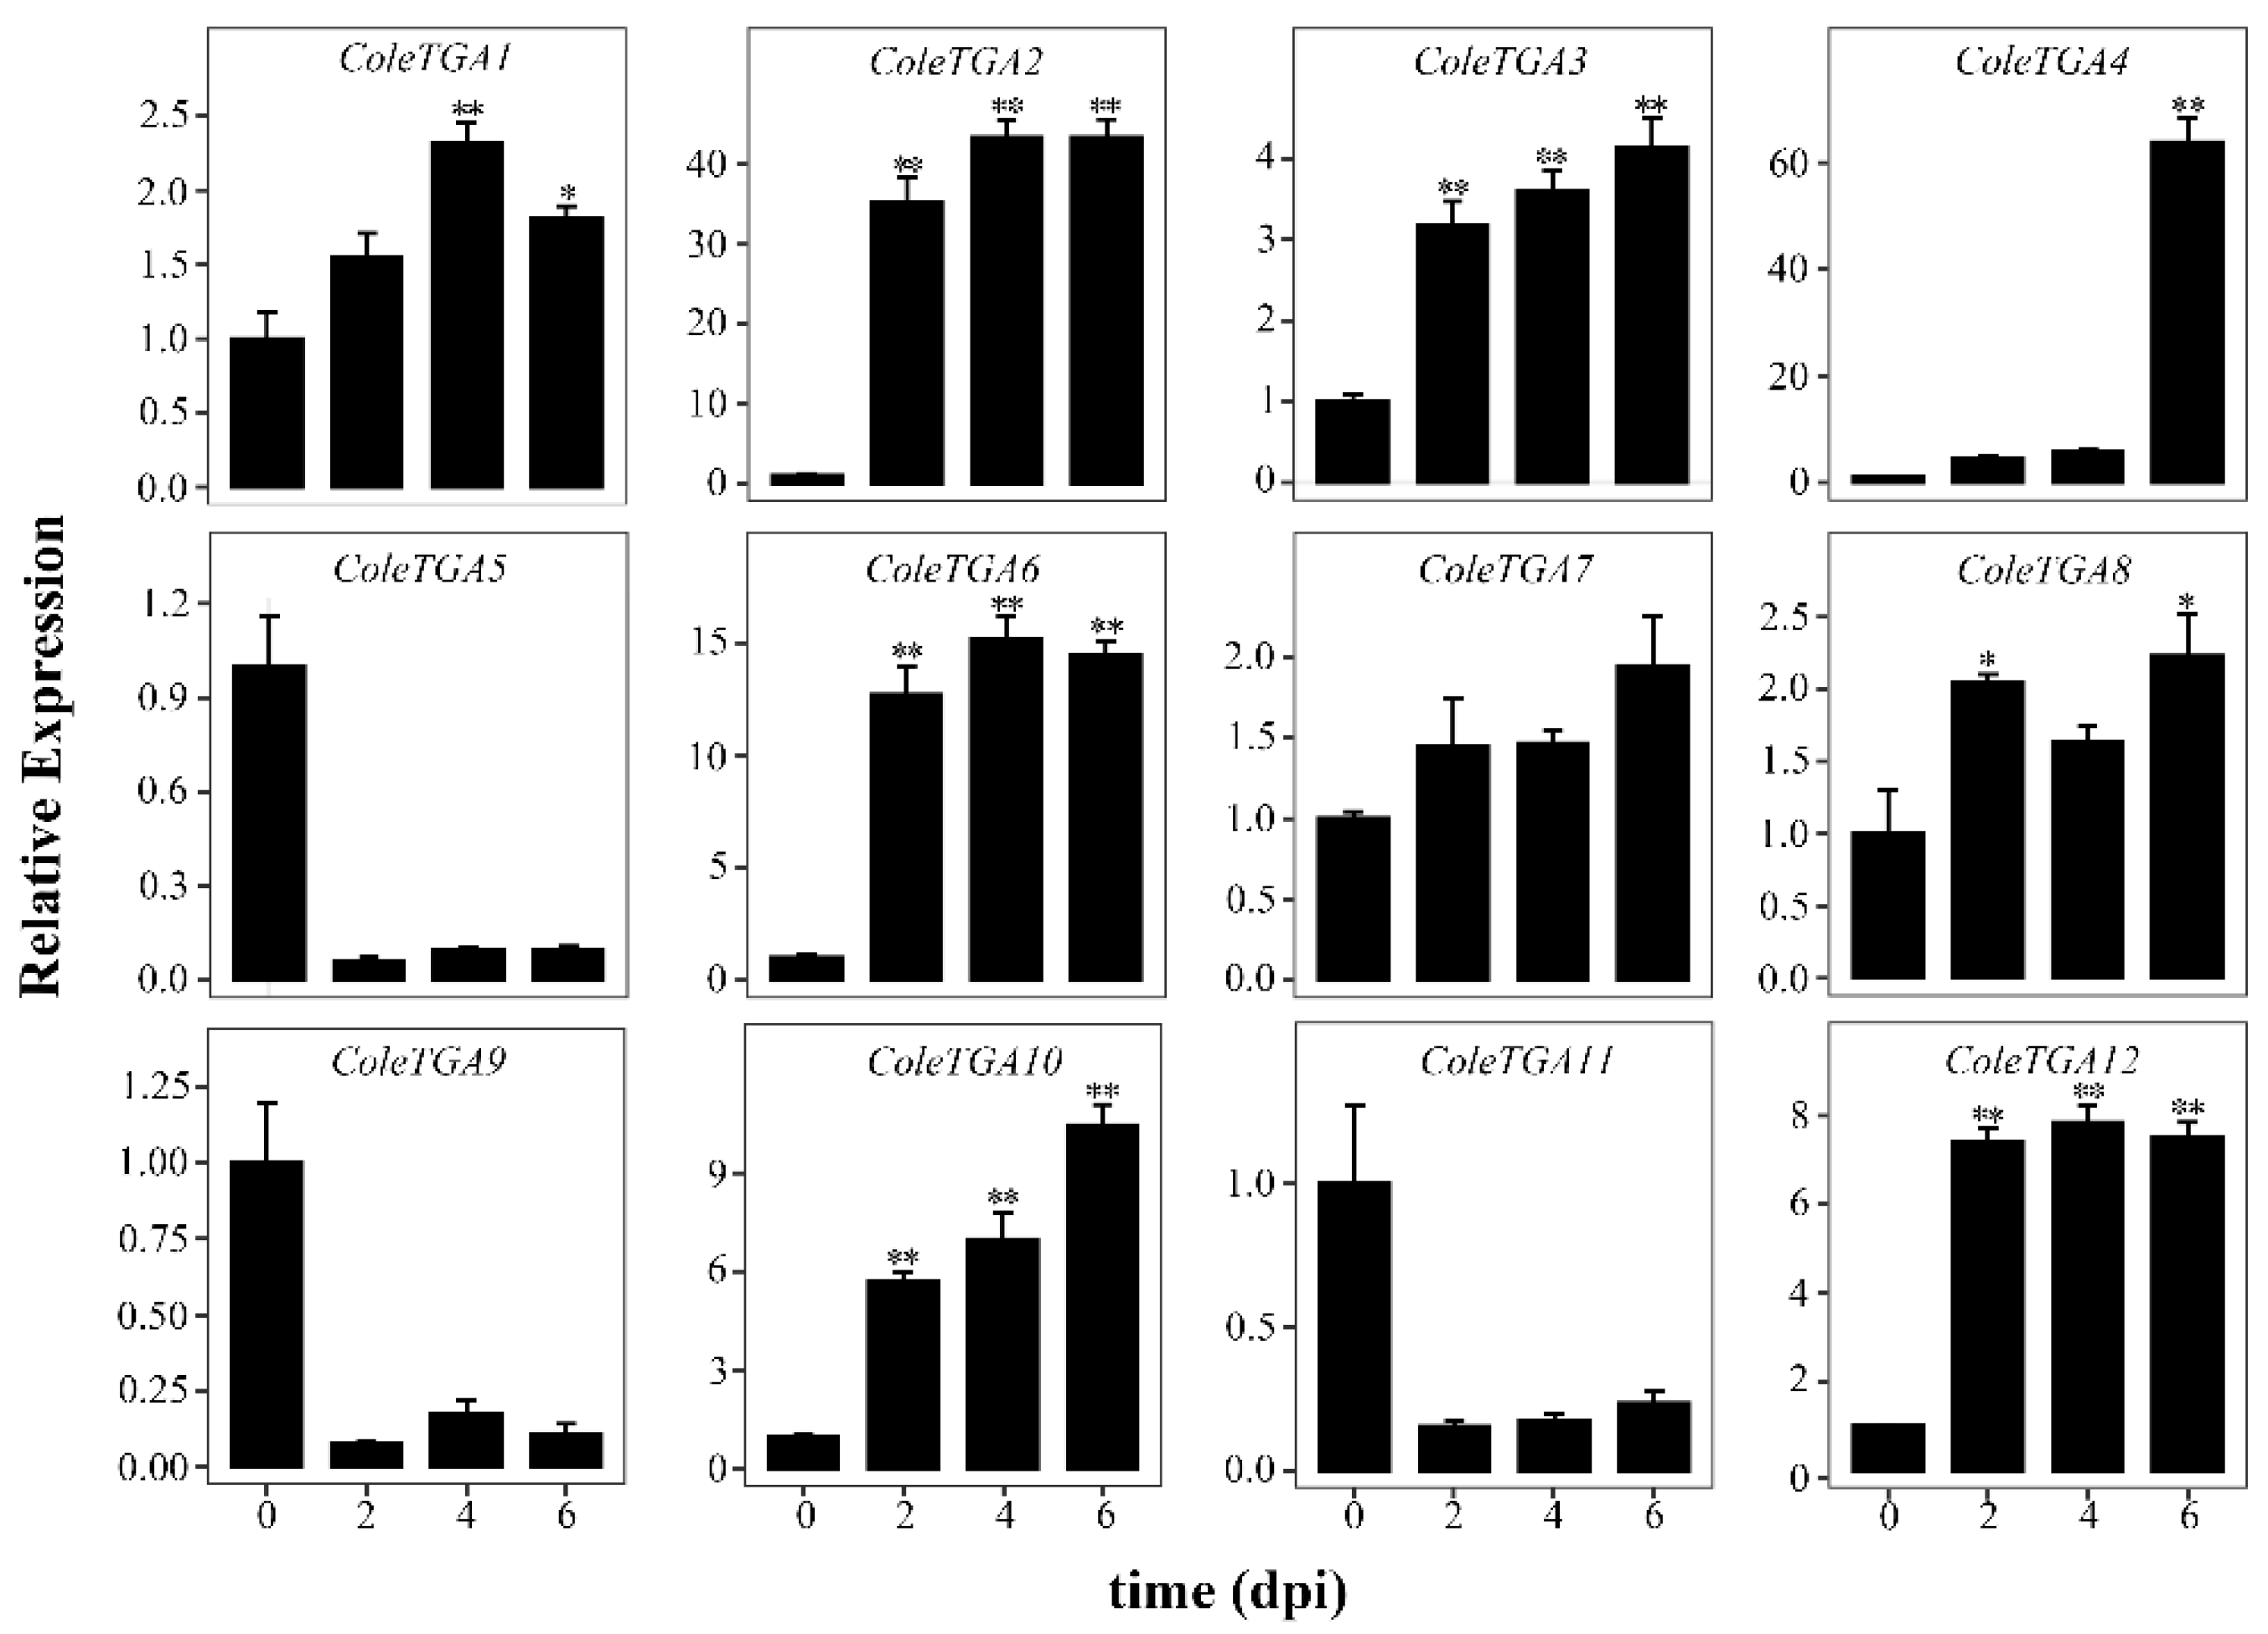
Expression dynamics of the 12 TGA genes of C. oleifera (ColeTGA1 to ColeTGA12) in leaf tissue after C. fructicola infection were followed by qRT-PCR (Figure 9), with the value at 0 d after inoculation as baseline (set to 1). Four patterns were apparent. ColeTGA2, ColeTGA3, ColeTGA6, ColeTGA10, and ColeTGA12 rose strongly and persistently, ColeTGA2 most of all (34-fold at 2 d, then 45-fold at 6 d). ColeTGA4 showed a distinctive "delayed burst", changing little at first and then climbing to 65-fold at 6 d. ColeTGA1, ColeTGA8, and ColeTGA7 rose and then declined or fluctuated; ColeTGA1 peaked at 2.4-fold at 4 d before dropping, and ColeTGA8 increased again at 6 d. ColeTGA5, ColeTGA9, and ColeTGA11 fell sharply after inoculation, dropping below 0.2 times the control by 2 d and staying very low thereafter. The C. oleifera TGA family therefore appears to cooperate in anthracnose defense through several modes—rapid response, late burst, progressive enhancement, and negative regulation—and ColeTGA2, ColeTGA3, ColeTGA4, ColeTGA6, ColeTGA10, and ColeTGA12 are plausible hub genes in that response.
4. Discussion
Sixty-eight TGA members were identified across six Theaceae species, with 10–13 members per species. Molecular weight, protein length and isoelectric point varied widely among these proteins, whereas nuclear localization was predicted for all of them. In TGA proteins, which belong to bZIP subfamily D, the basic region determines DNA-binding specificity [1]. Most proteins identified here had pI < 7.0, as also reported for sunflower TGA genes [9]. Median protein length differed between species (406 aa in C. sinensis and 456.5 aa in C. oleifera), so sequence plasticity persists among close relatives. Nuclear localization was predicted here rather than measured. The prediction agrees with the basic character of TGA transcription factors [1] and with experimental evidence from other species: PagTGA7b of poplar was localized to the nucleus and shown to activate transcription [34], and GmTGA13 of soybean was also nuclear [35]. These findings do not exclude other localization patterns in Theaceae, because only sequence-based prediction was used here.
Both the Theaceae TGA family and the A. thaliana members fell into five groups. Groups II and IV contained most Theaceae genes, whereas the smallest group contained members of both lineages. Because only one A. thaliana genome was sampled, this distribution cannot be extended to angiosperms generally. TGA families described for banana, common bean, kiwifruit, Brassica napus and wheat also contain four to five subgroups [7,8,10,11,36], which suggests that the subfamily framework is broadly stable. Branch-to-branch differences in member distribution may reflect differences in copy retention among lineages. Every retained protein contained the bZIP domain, which provides the dimerization interface and the DNA-binding site, and the C-terminal DOG1 domain [3,5]. Members of the same group shared motif composition, gene structure and exon–intron pattern, in line with reports that bZIP families are structurally conserved in other horticultural crops [37]. Variation was largely confined to the N- and C-termini and to linker regions. Whether this variation alters protein interactions remains untested. TGA genes have documented roles in biotic stress, including root-knot nematode resistance in tomato [18].
Family size in Theaceae was close to that of sweet orange (7) [6] and common bean (8) [7], and similar to kiwifruit (13) [8] and sunflower (14) [9]. It was below that of species with recent polyploidization or whole-genome duplication, including banana (18) [36], peanut (20) [38], soybean (27) [39], B. napus (39) [10], potato (42) [40], sugarcane (44) [41] and wheat (48) [11]. Seventy-four TGA homologs have been reported across 10 cotton species, where family differentiation is attributed to divergence and retention after polyploidization [42].
Chromosomal mapping and duplication analysis showed that Theaceae TGA genes are clustered but widely spaced on chromosomes. Expansion proceeded mainly through WGD or segmental duplication, followed by dispersed duplication; tandem duplication was uncommon. Similar expansion patterns have been reported for peanut, wheat and cotton [11,38,42] and for kiwifruit, where segmental duplication prevailed [8]. Sweet orange has fewer members and no detectable tandem or segmental duplication [6], which indicates that duplication alone does not determine family size; long-term retention also depends on dosage constraints, subfunctionalization and copy loss [12,13,43]. Selection pressure can differ among duplication sources, as reported for subfamily Aurantioideae [44]. A WGD dated to approximately 57.5 Mya is shared within Camellia [14], and two ancient polyploidization events occurred in the tea genome [15,16]. Family size nevertheless remained at 10–13 genes per species, so genome duplication was not accompanied by proportional expansion of the TGA family. This pattern is consistent with dosage constraints limiting copy retention in Theaceae. Collinear pairs probably trace back to the ancient WGD, while wide intra-cluster spacing may reflect older tandem duplication events that were later disrupted by chromosome rearrangement [12]. Ka/Ks remained below 1 in all species, indicating purifying selection, and the ratios were higher in Theaceae than in A. thaliana, with the highest value in tea. These differences are consistent with selection acting on functionally redundant copies, and with an influence of duplication mode and the extent of functional divergence [45].
Codon usage bias was weak in the Theaceae TGA genes. CAI medians were 0.77–0.80 and ENC values varied little among species, GC content was stable, GC1 was above the A. thaliana value, and RSCU values formed two patterns. Similar trends have been reported for Ginkgo biloba and the Dalbergia nuclear genome [46,47], and polyploidization can alter codon usage bias, expression and the allocation of transcription factor copies [48]. Codon usage bias generally reflects genetic drift, mutation pressure and selection [49]; weak bias with high GC1 is therefore more consistent with lineage-specific base composition than with strong selection for translational efficiency.
Light-responsive elements were the most abundant type in the TGA promoters (676), followed by hormone-responsive elements (512), which comprised jasmonic acid (212), abscisic acid (145), salicylic acid (70), gibberellin (55) and auxin (30) elements. Only 5 of the 51 element types were classified as stress-responsive, and element composition differed among the five promoter groups. TGA proteins bind as-1/TGACG elements, which are themselves salicylic acid-responsive. The abundance of salicylic acid- and jasmonic acid-related elements in these promoters is therefore expected from TGA binding specificity rather than independent evidence for a role in SA–JA crosstalk [2,3]. NPR1 enhances TGA binding to target promoters in a redox-dependent manner [4], which provides one route through which salicylic acid signaling could act at these promoters. Rose DIR promoters and chrysanthemum bZIP promoters are also enriched in hormone- and stress-related elements, and the combinations of these elements follow their expression patterns [37,50]. JAZ family members in Camellia nitidissima respond to hormone treatments [51].
Expression profiles across tissues and stresses showed tissue-specific patterns among Theaceae TGA genes. CcheTGA9, ColeTGA9 and CsinTGA8 peaked in the second leaf and remained low in buds. ColeTGA5, CcheTGA5 and CsinTGA5 were enriched in mature leaves, old leaves and fruit, and CcheTGA8 was abundant in stems. ColeTGA1 and ColeTGA4 clustered together, but ColeTGA4 was higher at every leaf position. Expression divergence of this kind is commonly attributed to subfunctionalization or neofunctionalization of duplicated genes [12]. The difference reported here rests on transcript abundance alone, so promoter analysis or functional tests would be needed to distinguish the two possibilities. Comparable patterns have been reported for kiwifruit TGA genes [8], B. napus and wheat TGA genes under drought [10,11], peanut TGA genes responding to salicylic acid and jasmonic acid [38], and sweet orange CsTGA7 [6]. A family-level comparison with the mulberry bZIP family gives a similar result [52].
Salicylic acid contributes to salt stress tolerance [53], which offers a possible link between the NaCl-induced members reported here and salicylic acid signaling, although this link was not tested. The transcriptome and metabolome remodeling reported in Camellia under drought and cold [54,55] is consistent with the PEG- and cold-induced up-regulation observed for three members. Stress-related elements were present at one to three copies in most genes and were absent from four members, yet eleven genes responded to NaCl and three responded to drought or cold. Promoter cis-element composition alone therefore does not explain these induction patterns. Distal elements, differences in copy number and post-transcriptional control are plausible alternatives, as are functional redundancy and post-translational regulation in weakly responding members. These possibilities require direct tests.
After C. fructicola inoculation, the 12 ColeTGA genes showed four expression patterns, which is consistent with both activating and repressing roles in defense. TGA proteins activate PR gene expression as part of a complex with NPR1 [2,4], whereas clade II TGA proteins feed back negatively on salicylic acid accumulation [17]. Negative feedback could account for the members that declined late in infection, although this explanation was not tested here. Colletotrichum species are biotrophic early and necrotrophic later, and the transition is generally accompanied by a shift from salicylic acid toward jasmonic acid and ethylene signaling [56]. The delayed increase in ColeTGA4 by 6 d after inoculation may coincide with the later necrotrophic phase, but the timing of this switch was not determined in the present pathosystem. The sweet orange bZIP family responds differentially to Penicillium digitatum [57], and melon CmTGA has opposite effects on bacteria and on B. cinerea [19]. In kiwifruit, TGA members contribute to resistance against Pseudomonas syringae pv. actinidiae (Psa) [8]. In tomato, virus-induced gene silencing showed that TGA1a is required for Mi-1-mediated resistance to root-knot nematodes, whereas silencing TGA2.1 caused only partial loss of resistance [18]. The two genes therefore differ in the magnitude of their contribution to resistance signaling. Breeding oil tea for anthracnose resistance is an active objective [58]. ColeTGA2, ColeTGA3, ColeTGA4, ColeTGA6, ColeTGA10 and ColeTGA12 showed the strongest and most consistent induction after C. fructicola inoculation and therefore provide candidate genetic resources for anthracnose-resistance breeding in oil tea and tea, pending functional validation.
5. Conclusion
This study examined the TGA gene family across six representative Theaceae species and identified 68 non-redundant TGA members, with 10 to 13 genes per species. Phylogenetic analysis resolved these members into five groups. Cis-regulatory element analysis showed that TGA promoters were dominated by light-responsive elements and were also rich in hormone-responsive elements, particularly those responding to jasmonic acid and abscisic acid. Analysis of collinear gene pairs and duplication types indicated that whole-genome and segmental duplication were the main drivers of family expansion (60–91.67%), whereas tandem duplication was rare. Transcriptome data showed that Camellia TGA genes responded to salt, drought and cold treatments, and qRT-PCR showed that the 12 ColeTGA genes followed four expression patterns after C. fructicola inoculation, with ColeTGA2, ColeTGA3, ColeTGA4, ColeTGA6, ColeTGA10 and ColeTGA12 strongly induced. This comprehensive analysis provides evidence for the structural conservation and functional divergence of TGA genes in Theaceae and offers new perspectives on the evolution of this family in perennial woody plants.
Supplementary Materials
The following supporting information can be downloaded at: Preprints.org, Figure S1: Sequence logos of 8 motifs in both Theaceae and Arabidopsis TGA proteins; Figure S2: Codon preference analysis of the TGA genes. (A) Analysis of relative synonymous codon usage (RSCU) in the TGA gene family. Each row represents a TGA gene from the indicated species, and each column represents codons. (B) The codon usage bias six parameters; Figure S3: The Ka, Ks, and Ka/Ks of TGA genes among Theaceae, A. thaliana; Figure S4: Functional statistics of cis-elements in the promoters within different groupings; Figure S5: Cis-acting elements of TGA genes responded to cold, drought stress and hormone treatment; Table S1: The TGA genes identified in this study; Table S2: Primer sequences used for qRT-PCR of candidate genes; Table S3: Intra-collinear gene pairs identified in six Theaceae species; Table S4: Collinear gene pairs among different species; Table S5: Cis elements identified in TGA genes; Table S6: Cis-regulatory elements number in the promoter region of TGA genes in this study; Table S7: Classification criteria for Cis-regulatory elements in promoters.
Author Contributions
Conceptualization, H.Z. and T.N.; Data curation, G.Z. and J.P.; Formal analysis, S.H. and W.S.; Investigation, H.Z., X.L. and D.Z.; Project administration J.S. and J.H.; Supervision, S.G., G.C and Y.Z.; Writing, H.Z. and Y.Z. All authors have approved the final manuscript and agreed to the published version of the manuscript.
Funding
This work was supported by the Key Scientific Research Projects of Henan Province (252102110224, 252102110233, 252102110329), the Key scientific research projects of colleges and universities in Henan Province (26B210026), Dabie Mountains Laboratory Key Research Project (Grant DMLP013), Furong Plan Young Talent Program-Youth Support Category (2026ZRB-QN076).
Data Availability Statement
The original contributions presented in this study are included in the article. Further inquiries can be directed to the corresponding author.
Conflicts of Interest
The authors declare no conflict of interest.
References
- Jakoby, M.; Weisshaar, B.; Dröge-Laser, W.; Vicente-Carbajosa, J.; Tiedemann, J.; Kroj, T.; Parcy, F. bZIP transcription factors in Arabidopsis. Trends Plant Sci. 2002, 7, 106–111. [Google Scholar] [CrossRef]
- Gatz, C. From Pioneers to Team Players: TGA Transcription Factors Provide a Molecular Link Between Different Stress Pathways. Mol. Plant-Microbe Interact. 2013, 26, 151–159. [Google Scholar] [CrossRef]
- Lu, C.; Liu, X.; Tang, Y.; Fu, Y.; Zhang, J.; Yang, L.; Li, P.; Zhu, Z.; Dong, P. A comprehensive review of TGA transcription factors in plant growth, stress responses, and beyond. Int. J. Biol. Macromol. 2024, 258, 128880. [Google Scholar] [CrossRef]
- Després, C.; DeLong, C.; Glaze, S.; Liu, E.; Fobert, P.R. The Arabidopsis NPR1/NIM1 Protein Enhances the DNA Binding Activity of a Subgroup of the TGA Family of bZIP Transcription Factors. Plant Cell 2000, 12, 279–290. [Google Scholar] [CrossRef]
- Tomaž, Š.; Gruden, K.; Coll, A. TGA transcription factors—Structural characteristics as basis for functional variability. Front. Plant Sci. 2022, 13, 935819. [Google Scholar] [CrossRef]
- Wang, M.; Ma, Y.; Qiu, Y.X.; Long, S.S.; Dai, W.S. Genome-wide characterization and expression profiling of the TGA gene family in sweet orange (Citrus sinensis) reveal CsTGA7 responses to multiple phytohormones and abiotic stresses. Front. Plant Sci. 2025, 16, 1530242. [Google Scholar] [CrossRef]
- Liu, Y.; Huang, Y.; Li, Z.; Feng, M.; Ge, W.; Zhong, C.; Xue, R. Genome-wide identification of the TGA genes in common bean (Phaseolus vulgaris) and revealing their functions in response to Fusarium oxysporum f. sp. phaseoli infection. Front. Genet. 2023, 14, 1137634. [Google Scholar] [CrossRef]
- Liu, W.; Zhao, C.; Liu, L.; Huang, D.; Ma, C.; Li, R.; Huang, L. Genome-wide identification of the TGA gene family in kiwifruit (Actinidia chinensis spp.) and revealing its roles in response to Pseudomonas syringae pv. actinidiae (Psa) infection. Int. J. Biol. Macromol. 2022, 222, 101–113. [Google Scholar] [CrossRef]
- Zeng, Q.; Gu, J.; Cai, M.; Wang, Y.; Xie, Q.; Han, Y.; Zhang, S.; Lu, L.; Chen, Y.; Zeng, Y.; Chen, T. Genome-Wide Identification and Expression Analysis of TGA Family Genes Associated with Abiotic Stress in Sunflowers (Helianthus annuus L.). Int. J. Mol. Sci. 2024, 25, 4097. [Google Scholar] [CrossRef]
- Duan, Y.; Xu, Z.; Liu, H.; Wang, Y.; Zou, X.; Zhang, Z.; Xu, L.; Xu, M. Genome-Wide Identification of the TGA Gene Family and Expression Analysis under Drought Stress in Brassica napus L. Int. J. Mol. Sci. 2024, 25, 6355. [Google Scholar] [CrossRef]
- Ru, J.; Hao, J.; Ji, X.; Hao, B.; Yang, J.; Wang, H.; Quan, B.; Guo, P.; Zhao, J.; Wang, C.; Shi, H.; Xu, Z. Functional Identification Reveals That TaTGA16-2D Promotes Drought and Heat Tolerance. Plants 2025, 14, 2125. [Google Scholar] [CrossRef]
- Panchy, N.; Lehti-Shiu, M.; Shiu, S.H. Evolution of Gene Duplication in Plants. Plant Physiol. 2016, 171, 2294–2316. [Google Scholar] [CrossRef]
- Qiao, X.; Li, Q.; Yin, H.; Qi, K.; Li, L.; Wang, R.; Zhang, S.; Paterson, A.H. Gene duplication and evolution in recurring polyploidization–diploidization cycles in plants. Genome Biol. 2019, 20, 38. [Google Scholar] [CrossRef]
- Shen, T.F.; Huang, B.; Xu, M.; Zhou, P.Y.; Ni, Z.X.; Gong, C.; Wen, Q.; Cao, F.L.; Xu, L.A. The reference genome of Camellia chekiangoleosa provides insights into Camellia evolution and tea oil biosynthesis. Hortic. Res. 2022, 9, uhab083. [Google Scholar] [CrossRef]
- Wei, C.; Yang, H.; Wang, S.; Zhao, J.; Liu, C.; Gao, L.; Xia, E.; Lu, Y.; Tai, Y.; She, G.; Sun, J.; Cao, H.; Tong, W.; Gao, Q.; Li, Y.; Deng, W.; Jiang, X.; Wang, W.; Chen, Q.; Zhang, S.; Li, H.; Wu, J.; Wang, P.; Li, P.; Shi, C.; Zheng, F.; Jian, J.; Huang, B.; Shan, D.; Shi, M.; Fang, C.; Yue, Y.; Li, F.; Li, D.; Wei, S.; Han, B.; Jiang, C.; Yin, Y.; Xia, T.; Zhang, Z.; Bennetzen, J.L.; Zhao, S.; Wan, X. Draft genome sequence of Camellia sinensis var. sinensis provides insights into the evolution of the tea genome and tea quality. Proc. Natl. Acad. Sci. U.S.A. 2018, 115, E4151–E4158. [Google Scholar] [CrossRef]
- Xia, E.H.; Zhang, H.B.; Sheng, J.; Li, K.; Zhang, Q.J.; Kim, C.; Zhang, Y.; Liu, Y.; Zhu, T.; Li, W.; Huang, H.; Tong, Y.; Nan, H.; Shi, C.; Shi, C.; Jiang, J.J.; Mao, S.Y.; Jiao, J.Y.; Zhang, D.; Zhao, Y.; Zhao, Y.J.; Zhang, L.P.; Liu, Y.L.; Liu, B.Y.; Yu, Y.; Shao, S.F.; Ni, D.J.; Eichler, E.E.; Gao, L.Z. The Tea Tree Genome Provides Insights into Tea Flavor and Independent Evolution of Caffeine Biosynthesis. Mol. Plant 2017, 10, 866–877. [Google Scholar] [CrossRef]
- Fonseca, A.; Urzúa, T.; Jelenska, J.; Sbarbaro, C.; Seguel, A.; Duarte, Y.; Greenberg, J.T.; Holuigue, L.; Blanco-Herrera, F.; Herrera-Vásquez, A. The TGA Transcription Factors from Clade II Negatively Regulate the Salicylic Acid Accumulation in Arabidopsis. Int. J. Mol. Sci. 2022, 23, 11631. [Google Scholar] [CrossRef]
- Pascual, S.; Emiliozzi, M.; Nombela, G. Role of Two Transcription Factors (TGA 1a and TGA 2.1) in the Mi-1-Mediated Resistance of Tomato to the Root-Knot Nematode Meloidogyne javanica. Horticulturae 2024, 10, 134. [Google Scholar] [CrossRef]
- Tian, M.; Dai, Y.; Noman, M.; Li, R.; Li, X.; Wu, X.; Wang, H.; Song, F.; Li, D. Genome-wide characterization and functional analysis of the melon TGA gene family in disease resistance through ectopic overexpression in Arabidopsis thaliana. Plant Physiol. Biochem. 2024, 212, 108784. [Google Scholar] [CrossRef]
- Wu, P.F.; Gong, H.E.; Yao, X.H.; Chang, W.X.; Wang, K.L. Evaluating the Resistance of Camellia oleifera Clones to Anthracnose. For. Res. 2018, 31, 158–163. [Google Scholar] [CrossRef]
- Wang, Y.X.; Chen, J.Y.; Xu, X.W.; Cheng, J.Y.; Zheng, L.; Huang, J.B.; Li, D.W. Identification and Characterization of Colletotrichum Species Associated with Anthracnose Disease of Camellia oleifera in China. Plant Dis. 2020, 104, 474–482. [Google Scholar] [CrossRef]
- Xia, E.; Li, F.; Tong, W.; Li, P.; Wu, Q.; Zhao, H.; Ge, R.; Li, R.; Li, Y.; Zhang, Z.; Wei, C.; Wan, X. Tea Plant Information Archive: a comprehensive genomics and bioinformatics platform for tea plant. Plant Biotechnol. J. 2019, 17, 1938–1953. [Google Scholar] [CrossRef]
- Gao, Q.; Tong, W.; Li, F.; Wang, Y.; Wu, Q.; Wan, X.; Xia, E. TPIA2: an updated tea plant information archive for Camellia genomics. Nucleic Acids Res. 2024, 52, D1661–D1667. [Google Scholar] [CrossRef]
- Letunic, I.; Khedkar, S.; Bork, P. SMART: recent updates, new developments and status in 2020. Nucleic Acids Res. 2021, 49, D458–D460. [Google Scholar] [CrossRef]
- Lu, S.; Wang, J.; Chitsaz, F.; Derbyshire, M.K.; Geer, R.C.; Gonzales, N.R.; Gwadz, M.; Hurwitz, D.I.; Marchler, G.H.; Song, J.S.; Thanki, N.; Yamashita, R.A.; Yang, M.; Zhang, D.; Zheng, C.; Lanczycki, C.J.; Marchler-Bauer, A. CDD/SPARCLE: the conserved domain database in 2020. Nucleic Acids Res. 2020, 48, D265–D268. [Google Scholar] [CrossRef]
- Gasteiger, E.; Hoogland, C.; Gattiker, A.; Duvaud, S.; Wilkins, M.R.; Appel, R.D.; Bairoch, A. Protein Identification and Analysis Tools on the ExPASy Server. In The Proteomics Protocols Handbook; Walker, J.M., Ed.; Humana Press: Totowa, NJ, USA, 2005; pp. 571–607. [Google Scholar] [CrossRef]
- Edgar, R.C. MUSCLE: multiple sequence alignment with high accuracy and high throughput. Nucleic Acids Res. 2004, 32, 1792–1797. [Google Scholar] [CrossRef]
- Waterhouse, A.M.; Procter, J.B.; Martin, D.M.A.; Clamp, M.; Barton, G.J. Jalview Version 2—a multiple sequence alignment editor and analysis workbench. Bioinformatics 2009, 25, 1189–1191. [Google Scholar] [CrossRef]
- Tamura, K.; Stecher, G.; Kumar, S. MEGA11: Molecular Evolutionary Genetics Analysis Version 11. Mol. Biol. Evol. 2021, 38, 3022–3027. [Google Scholar] [CrossRef]
- Bailey, T.L.; Boden, M.; Buske, F.A.; Frith, M.; Grant, C.E.; Clementi, L.; Ren, J.; Li, W.W.; Noble, W.S. MEME SUITE: tools for motif discovery and searching. Nucleic Acids Res. 2009, 37, W202–W208. [Google Scholar] [CrossRef]
- Feng, J.; Chen, C.; Wu, Y.; Fan, L.; Zhang, Z.; Chen, M.; Tang, H.; Yu, G.; Ren, J.; Luo, J.; Liao, Y.; Luan, A.; Wang, Z.; Tang, S.; Shao, Y.; Liang, Y.; Wang, J.; Xie, J.; Xia, R. How to make big data accessible to plant biologists and beyond: Ten years of lessons from TBtools. Mol. Plant 2026, 19, 1378–1391. [Google Scholar] [CrossRef]
- Gong, W.; Song, Q.; Ji, K.; Gong, S.; Wang, L.; Chen, L.; Zhang, J.; Yuan, D. Full-Length Transcriptome from Camellia oleifera Seed Provides Insight into the Transcript Variants Involved in Oil Biosynthesis. J. Agric. Food Chem. 2020, 68, 14670–14683. [Google Scholar] [CrossRef]
- Livak, K.J.; Schmittgen, T.D. Analysis of Relative Gene Expression Data Using Real-Time Quantitative PCR and the 2−ΔΔCT Method. Methods 2001, 25, 402–408. [Google Scholar] [CrossRef]
- Wang, J.; Song, J.; Qi, S.; Zou, Q.; Liu, H.; Zhang, H.; Ru, X. Genome-wide identification of the TGA transcription factor family in Populus alba × Populus glandulosa and functional validation of PagTGA7b in salt tolerance. Plant Stress 2026, 19, 101157. [Google Scholar] [CrossRef]
- Ke, D.; He, Y.; Fan, L.; Niu, R.; Cheng, L.; Wang, L.; Zhang, Z. The soybean TGA transcription factor GmTGA13 plays important roles in the response to salinity stress. Plant Biol. 2022, 24, 313–322. [Google Scholar] [CrossRef]
- Zhang, B.; Wang, W.; Wang, C.; Cai, B.; Feng, J.; Zhou, D.; Chen, Y.; Zhang, M.; Qi, D.; Wang, Z.; Wei, Y.; Xie, J. Genome-Wide Identification and Expression Analysis of the TGA Gene Family in Banana (Musa nana Lour.) Under Various Nitrogen Conditions. Int. J. Mol. Sci. 2025, 26, 2168. [Google Scholar] [CrossRef]
- Guo, Y.; Ji, K.; Jia, Z.; Aiwaili, P.; Liu, L.; Ren, H.; Liu, Q.; Jiang, Y.; Gao, J.; Xu, Y. Genome-Wide Identification and Expression Analysis of bZIP Transcription Factors Under Salt Stress in Chrysanthemum. Horticulturae 2024, 10, 1327. [Google Scholar] [CrossRef]
- Zhong, C.; Liu, Y.; Li, Z.; Wang, X.; Jiang, C.; Zhao, X.; Kang, S.; Liu, X.; Zhao, S.; Wang, J.; Zhang, H.; Huang, Y.; Yu, H.; Xue, R. Genome-wide analysis reveals regulatory mechanisms and expression patterns of TGA genes in peanut under abiotic stress and hormone treatments. Front. Plant Sci. 2023, 14, 1269200. [Google Scholar] [CrossRef]
- Jiang, H.; Gu, S.; Li, K.; Gai, J. Two TGA Transcription Factor Members from Hyper-Susceptible Soybean Exhibiting Significant Basal Resistance to Soybean mosaic virus. Int. J. Mol. Sci. 2021, 22, 11329. [Google Scholar] [CrossRef]
- Tian, T.; Yu, R.; Suo, Y.; Cheng, L.; Li, G.; Yao, D.; Song, Y.; Wang, H.; Li, X.; Gao, G. A Genome-Wide Analysis of StTGA Genes Reveals the Critical Role in Enhanced Bacterial Wilt Tolerance in Potato During Ralstonia solanacearum Infection. Front. Genet. 2022, 13, 894844. [Google Scholar] [CrossRef]
- Zhao, Z.; Zhang, R.; Wang, D.; Zhang, J.; Zang, S.; Zou, W.; Feng, A.; You, C.; Su, Y.; Wu, Q.; Que, Y. Dissecting the features of TGA gene family in Saccharum and the functions of ScTGA1 under biotic stresses. Plant Physiol. Biochem. 2023, 200, 107760. [Google Scholar] [CrossRef]
- Meng, L.; Fan, J.; Shi, S.; Zhu, F.; Zhang, G.; Wang, J.; Li, Z.; Wang, F.; Li, H. GhTGA2, a Potential Key Regulator of Salt Stress Response: Insights from Genome-Wide Identification of TGA Family Genes Across Ten Cotton Species. Genes 2025, 16, 1143. [Google Scholar] [CrossRef]
- Wang, Y.; Wang, X.; Tang, H.; Tan, X.; Ficklin, S.P.; Feltus, F.A.; Paterson, A.H. Modes of Gene Duplication Contribute Differently to Genetic Novelty and Redundancy, but Show Parallels across Divergent Angiosperms. PLoS ONE 2011, 6, e28150. [Google Scholar] [CrossRef]
- Liu, J.; Wu, J.; Silaiyiman, S.; Ouyang, L.; Cao, Z.; Shen, C. Comparative Genomics Reveals Gene Duplication and Evolution in 26 Aurantioideae Species. Horticulturae 2025, 11, 209. [Google Scholar] [CrossRef]
- Qiao, X.; Yin, H.; Li, L.; Wang, R.; Wu, J.; Wu, J.; Zhang, S. Different Modes of Gene Duplication Show Divergent Evolutionary Patterns and Contribute Differently to the Expansion of Gene Families Involved in Important Fruit Traits in Pear (Pyrus bretschneideri). Front. Plant Sci. 2018, 9, 161. [Google Scholar] [CrossRef]
- Wang, Z.K.; Liu, Y.; Zheng, H.Y.; Tang, M.Q.; Xie, S.Q. Comparative Analysis of Codon Usage Patterns in Nuclear and Chloroplast Genome of Dalbergia (Fabaceae). Genes 2023, 14, 1110. [Google Scholar] [CrossRef]
- He, B.; Dong, H.; Jiang, C.; Cao, F.; Tao, S.; Xu, L.A. Analysis of codon usage patterns in Ginkgo biloba reveals codon usage tendency from A/U-ending to G/C-ending. Sci. Rep. 2016, 6, 35927. [Google Scholar] [CrossRef]
- Han, Y.; Hu, W.; Wu, X.; Li, X.; Luo, J.; Zhu, Z.; Wang, Z.; Liu, Y. Impact of Two Hexaploidizations on Distribution, Codon Bias, and Expression of Transcription Factors in Tomato Fruit Ripeness. Horticulturae 2025, 11, 447. [Google Scholar] [CrossRef]
- Parvathy, S.T.; Udayasuriyan, V.; Bhadana, V. Codon usage bias. Mol. Biol. Rep. 2022, 49, 539–565. [Google Scholar] [CrossRef]
- Dong, Q.; Yang, Q.; Wang, Z.; Zhao, Y.; Guo, S.; Peng, Y.; Li, Q.; Han, Y. Genome-Wide Identification and Pollen-Specific Promoter Analysis of the DIR Gene Family in Rosa chinensis. Horticulturae 2025, 11, 717. [Google Scholar] [CrossRef]
- Cao, Y.; Feng, Y.; Wu, H.; Chen, L.; Yin, H.; Sun, Y.; Liu, W. JAZ Gene Family in Camellia nitidissima: Genome-Wide Identification and Expression Analysis During Flower Development and Hormone Treatments. Horticulturae 2026, 12, 736. [Google Scholar] [CrossRef]
- Liu, Q.; Fang, H.; Zhou, H.; Wang, X.; Hou, Z. Identification and Characterization of bZIP Gene Family Combined Transcriptome Analysis Revealed Their Functional Roles on Abiotic Stress and Anthocyanin Biosynthesis in Mulberry (Morus alba). Horticulturae 2025, 11, 694. [Google Scholar] [CrossRef]
- Yang, W.; Zhou, Z.; Chu, Z. Emerging Roles of Salicylic Acid in Plant Saline Stress Tolerance. Int. J. Mol. Sci. 2023, 24, 3388. [Google Scholar] [CrossRef]
- Zhou, R.; Wang, L.; Tian, H.; Guo, X.; Jiang, X.; Fan, M.; Sun, Y. Full-Length Transcriptome of Camellia japonica (Naidong) Reveals Molecular Characteristics in Drought Stress. Horticulturae 2024, 10, 114. [Google Scholar] [CrossRef]
- Xu, H.; Huang, C.; Jiang, X.; Zhu, J.; Gao, X.; Yu, C. Impact of Cold Stress on Leaf Structure, Photosynthesis, and Metabolites in Camellia weiningensis and C. oleifera Seedlings. Horticulturae 2022, 8, 494. [Google Scholar] [CrossRef]
- Narusaka, Y.; Narusaka, M.; Park, P.; Kubo, Y.; Hirayama, T.; Seki, M.; Shiraishi, T.; Ishida, J.; Nakashima, M.; Enju, A.; Sakurai, T.; Satou, M.; Kobayashi, M.; Shinozaki, K. RCH1, a Locus in Arabidopsis That Confers Resistance to the Hemibiotrophic Fungal Pathogen Colletotrichum higginsianum. Mol. Plant-Microbe Interact. 2004, 17, 749–762. [Google Scholar] [CrossRef]
- Han, P.; Yin, T.; Xi, D.; Yang, X.; Zhang, M.; Zhu, L.; Zhang, H.; Liu, X. Genome-Wide Identification of the Sweet Orange bZIP Gene Family and Analysis of Their Expression in Response to Infection by Penicillium digitatum. Horticulturae 2023, 9, 393. [Google Scholar] [CrossRef]
- Shen, J.; Xun, C.; Ma, X.; Zhang, Y.; Zhang, Z.; He, Z.; He, Y.; Yang, D.; Lai, H.; Wang, R.; Chen, Y. Screening 60Co-γ Irradiated Camellia oleifera Lines for Anthracnose-Resistant. Horticulturae 2024, 10, 940. [Google Scholar] [CrossRef]
Figure 1.
Phylogenetic analysis of the TGA gene family from six Theaceae species, and Arabidopsis thaliana. Genes designated with Atha prefix correspond to A. thaliana, Cche is C. chekiangoleosa, Ccra is C. crapnelliana, Cjap is C. japonica, Cole is C. oleifera, Csin is C. sinensis, Ssin is S. sinensis. The phylogenetic tree was constructed using MEGA with the NJ method and 1,000 bootstrap replicates. Based on the bootstrap values and evolutionary distances, the tree was clustered into five subgroups (Groups I–V). The TGA proteins were categorized into five clades (Groups I–V), distinguished by distinct background colors.
Figure 1.
Phylogenetic analysis of the TGA gene family from six Theaceae species, and Arabidopsis thaliana. Genes designated with Atha prefix correspond to A. thaliana, Cche is C. chekiangoleosa, Ccra is C. crapnelliana, Cjap is C. japonica, Cole is C. oleifera, Csin is C. sinensis, Ssin is S. sinensis. The phylogenetic tree was constructed using MEGA with the NJ method and 1,000 bootstrap replicates. Based on the bootstrap values and evolutionary distances, the tree was clustered into five subgroups (Groups I–V). The TGA proteins were categorized into five clades (Groups I–V), distinguished by distinct background colors.
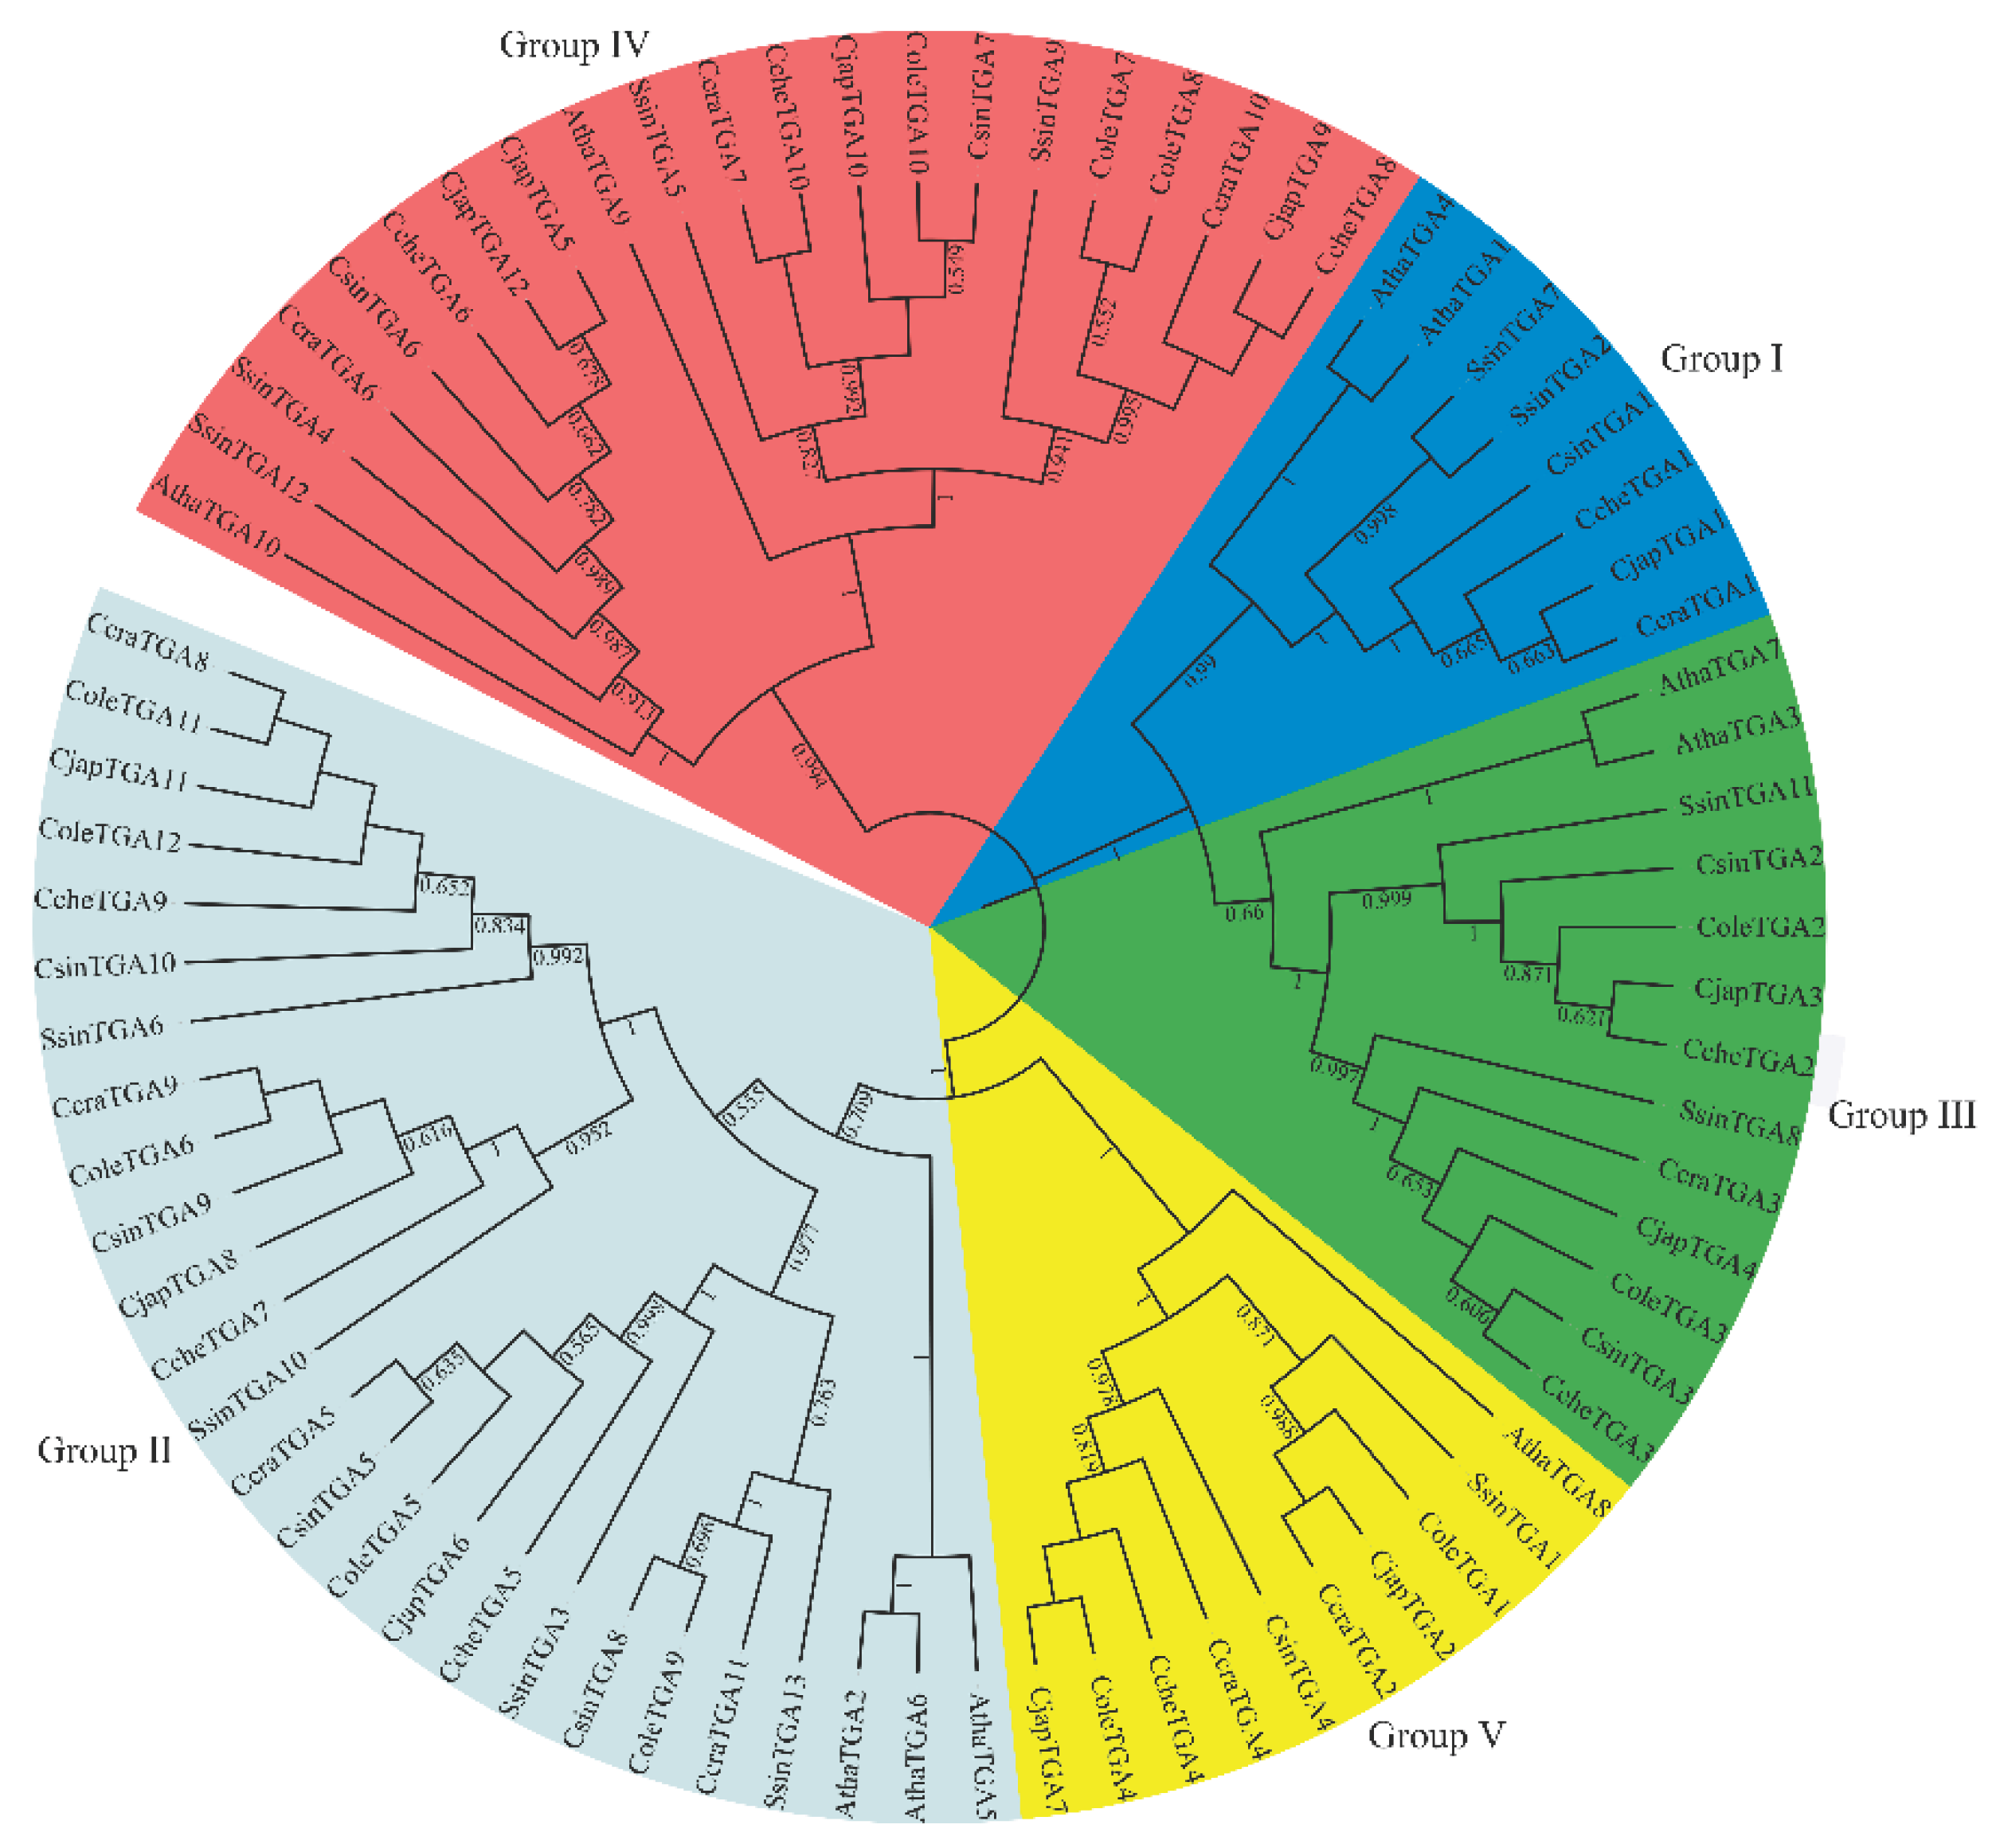
Figure 2.
Multiple sequence alignment of the TGA gene family in Theaceae.
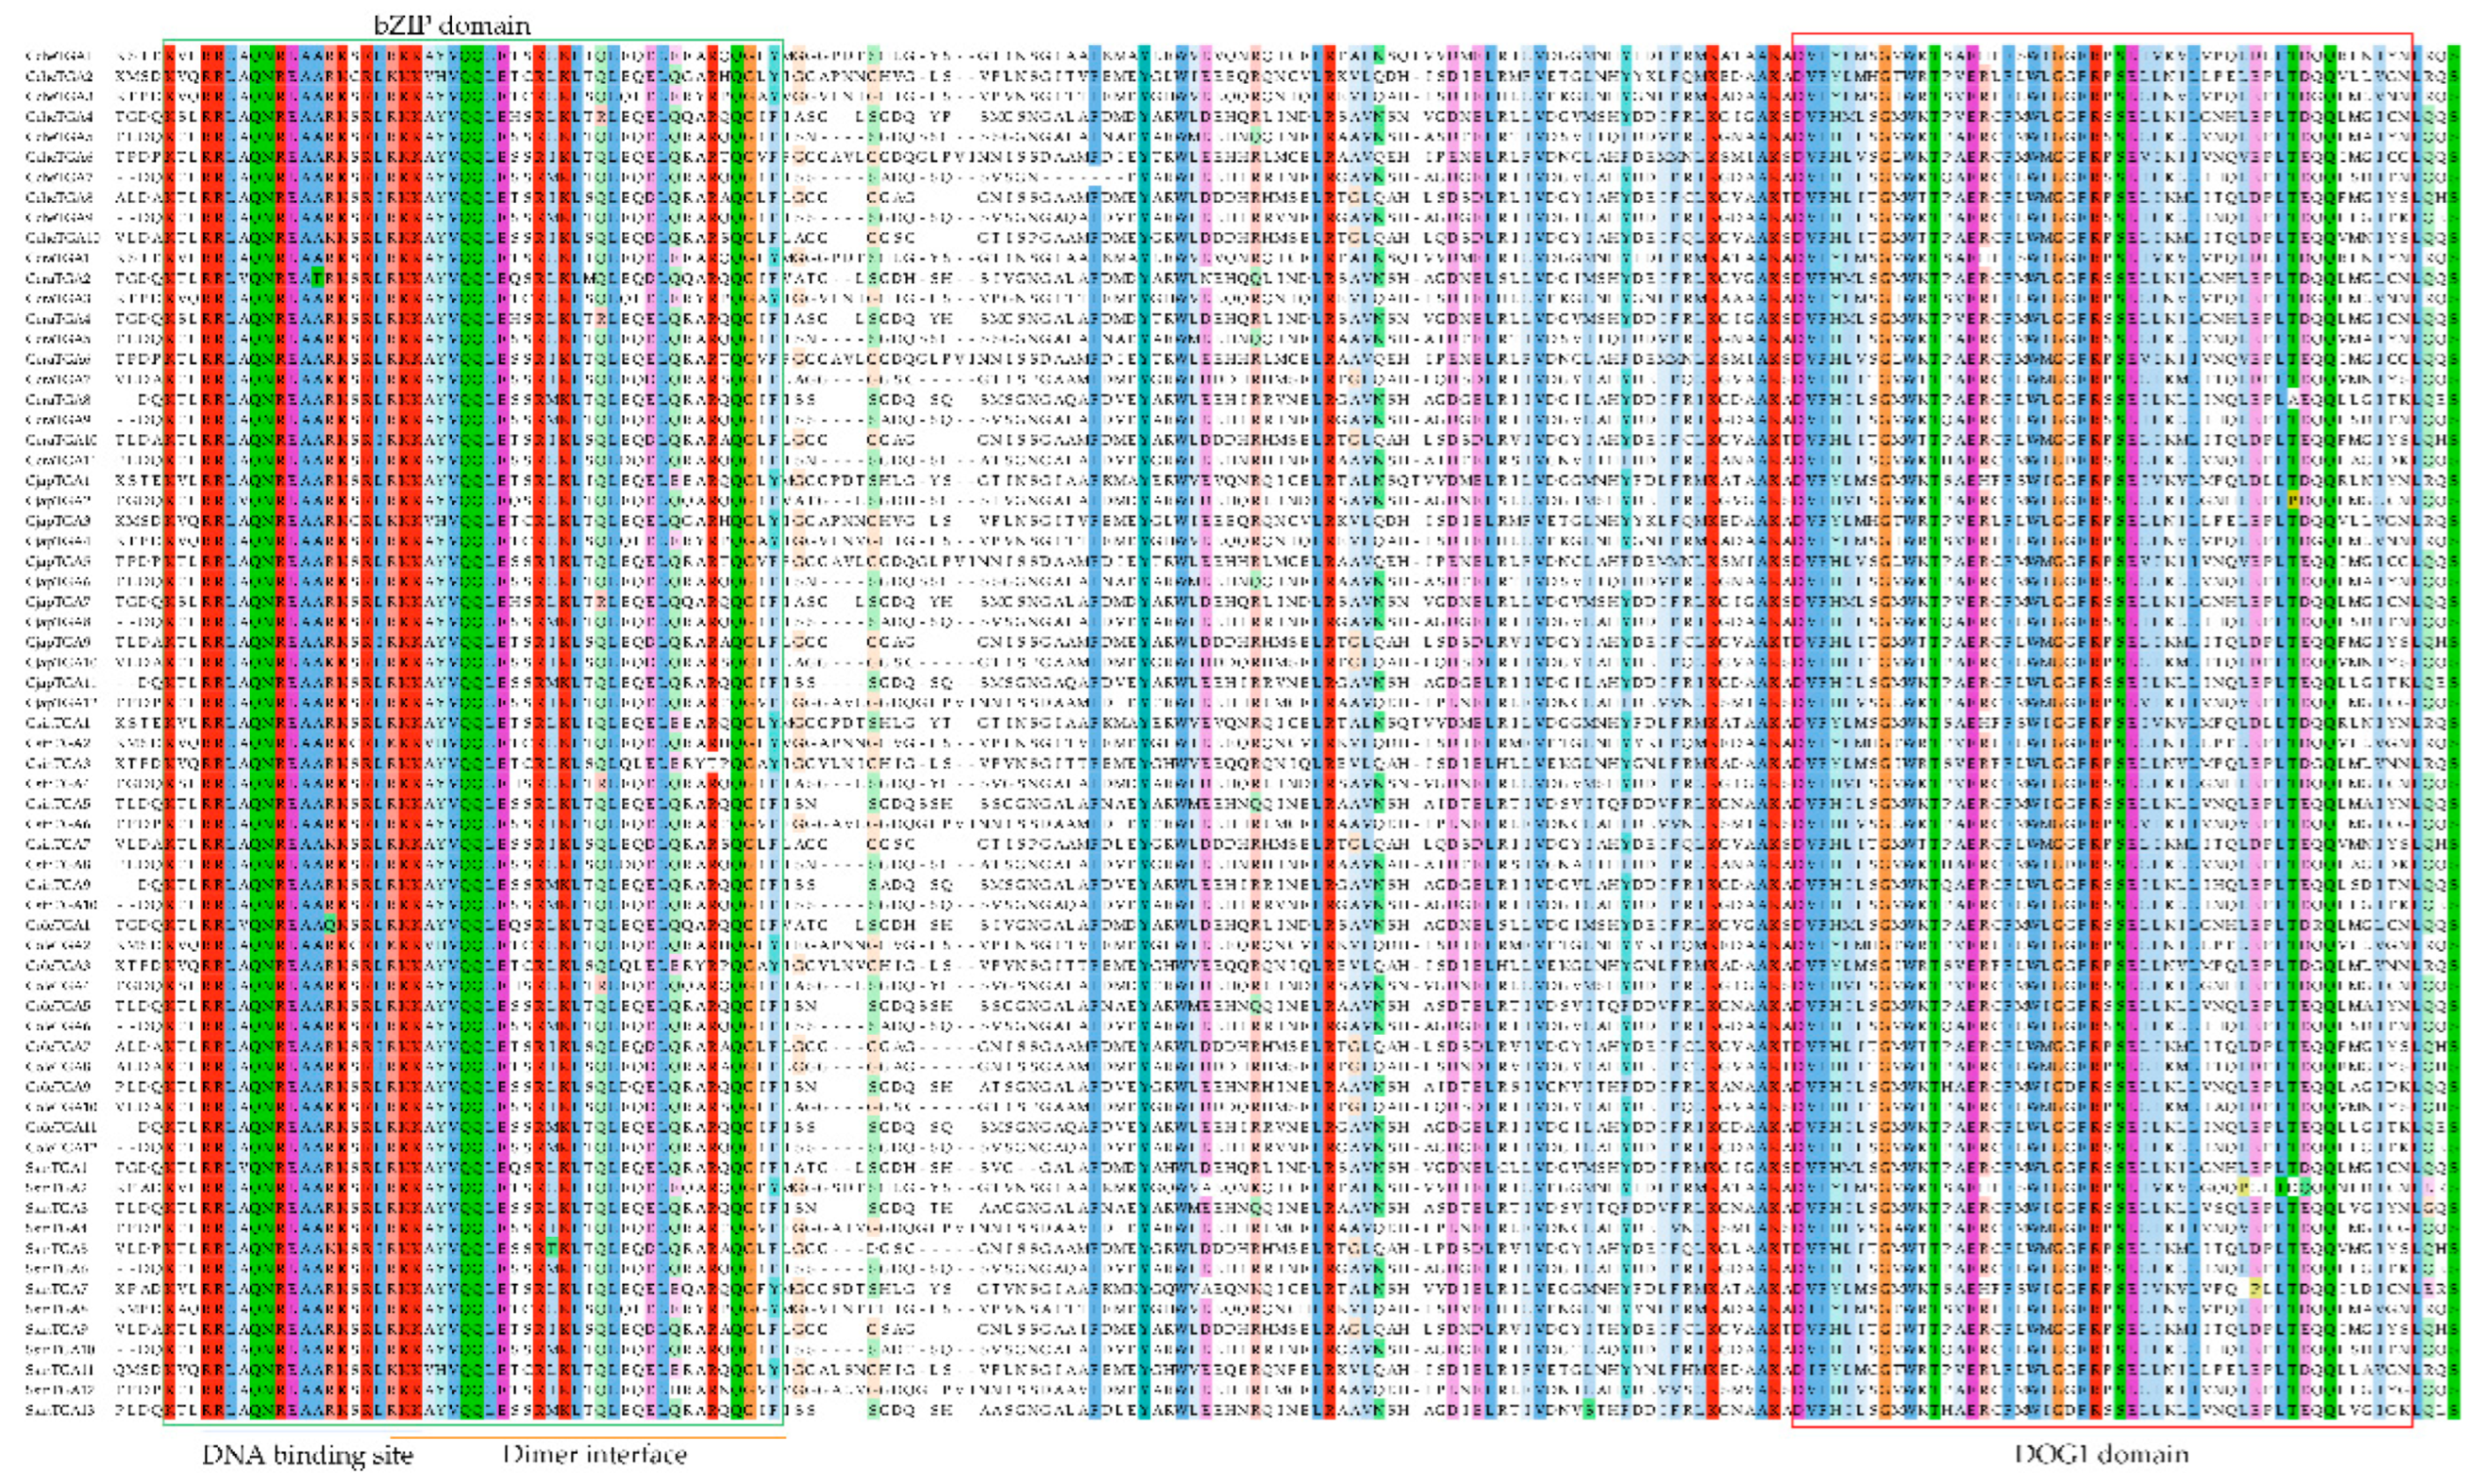
Figure 3.
Phylogenetic evolutionary tree-based Conserved motifs, gene structures, and conserved domains of TGA genes in both Theaceae and Arabidopsis were examined. (A) Different groups in the phylogenetic tree were distinguished by inconsistent colors. (B) Conserved motifs within TGAs were identified using MEME, with different colors representing distinct motifs. (C) A comparison of conserved domains was conducted, with the ruler at the bottom indicating sequence lengths. (D) The structural characteristics of TGA genes were analyzed.
Figure 3.
Phylogenetic evolutionary tree-based Conserved motifs, gene structures, and conserved domains of TGA genes in both Theaceae and Arabidopsis were examined. (A) Different groups in the phylogenetic tree were distinguished by inconsistent colors. (B) Conserved motifs within TGAs were identified using MEME, with different colors representing distinct motifs. (C) A comparison of conserved domains was conducted, with the ruler at the bottom indicating sequence lengths. (D) The structural characteristics of TGA genes were analyzed.
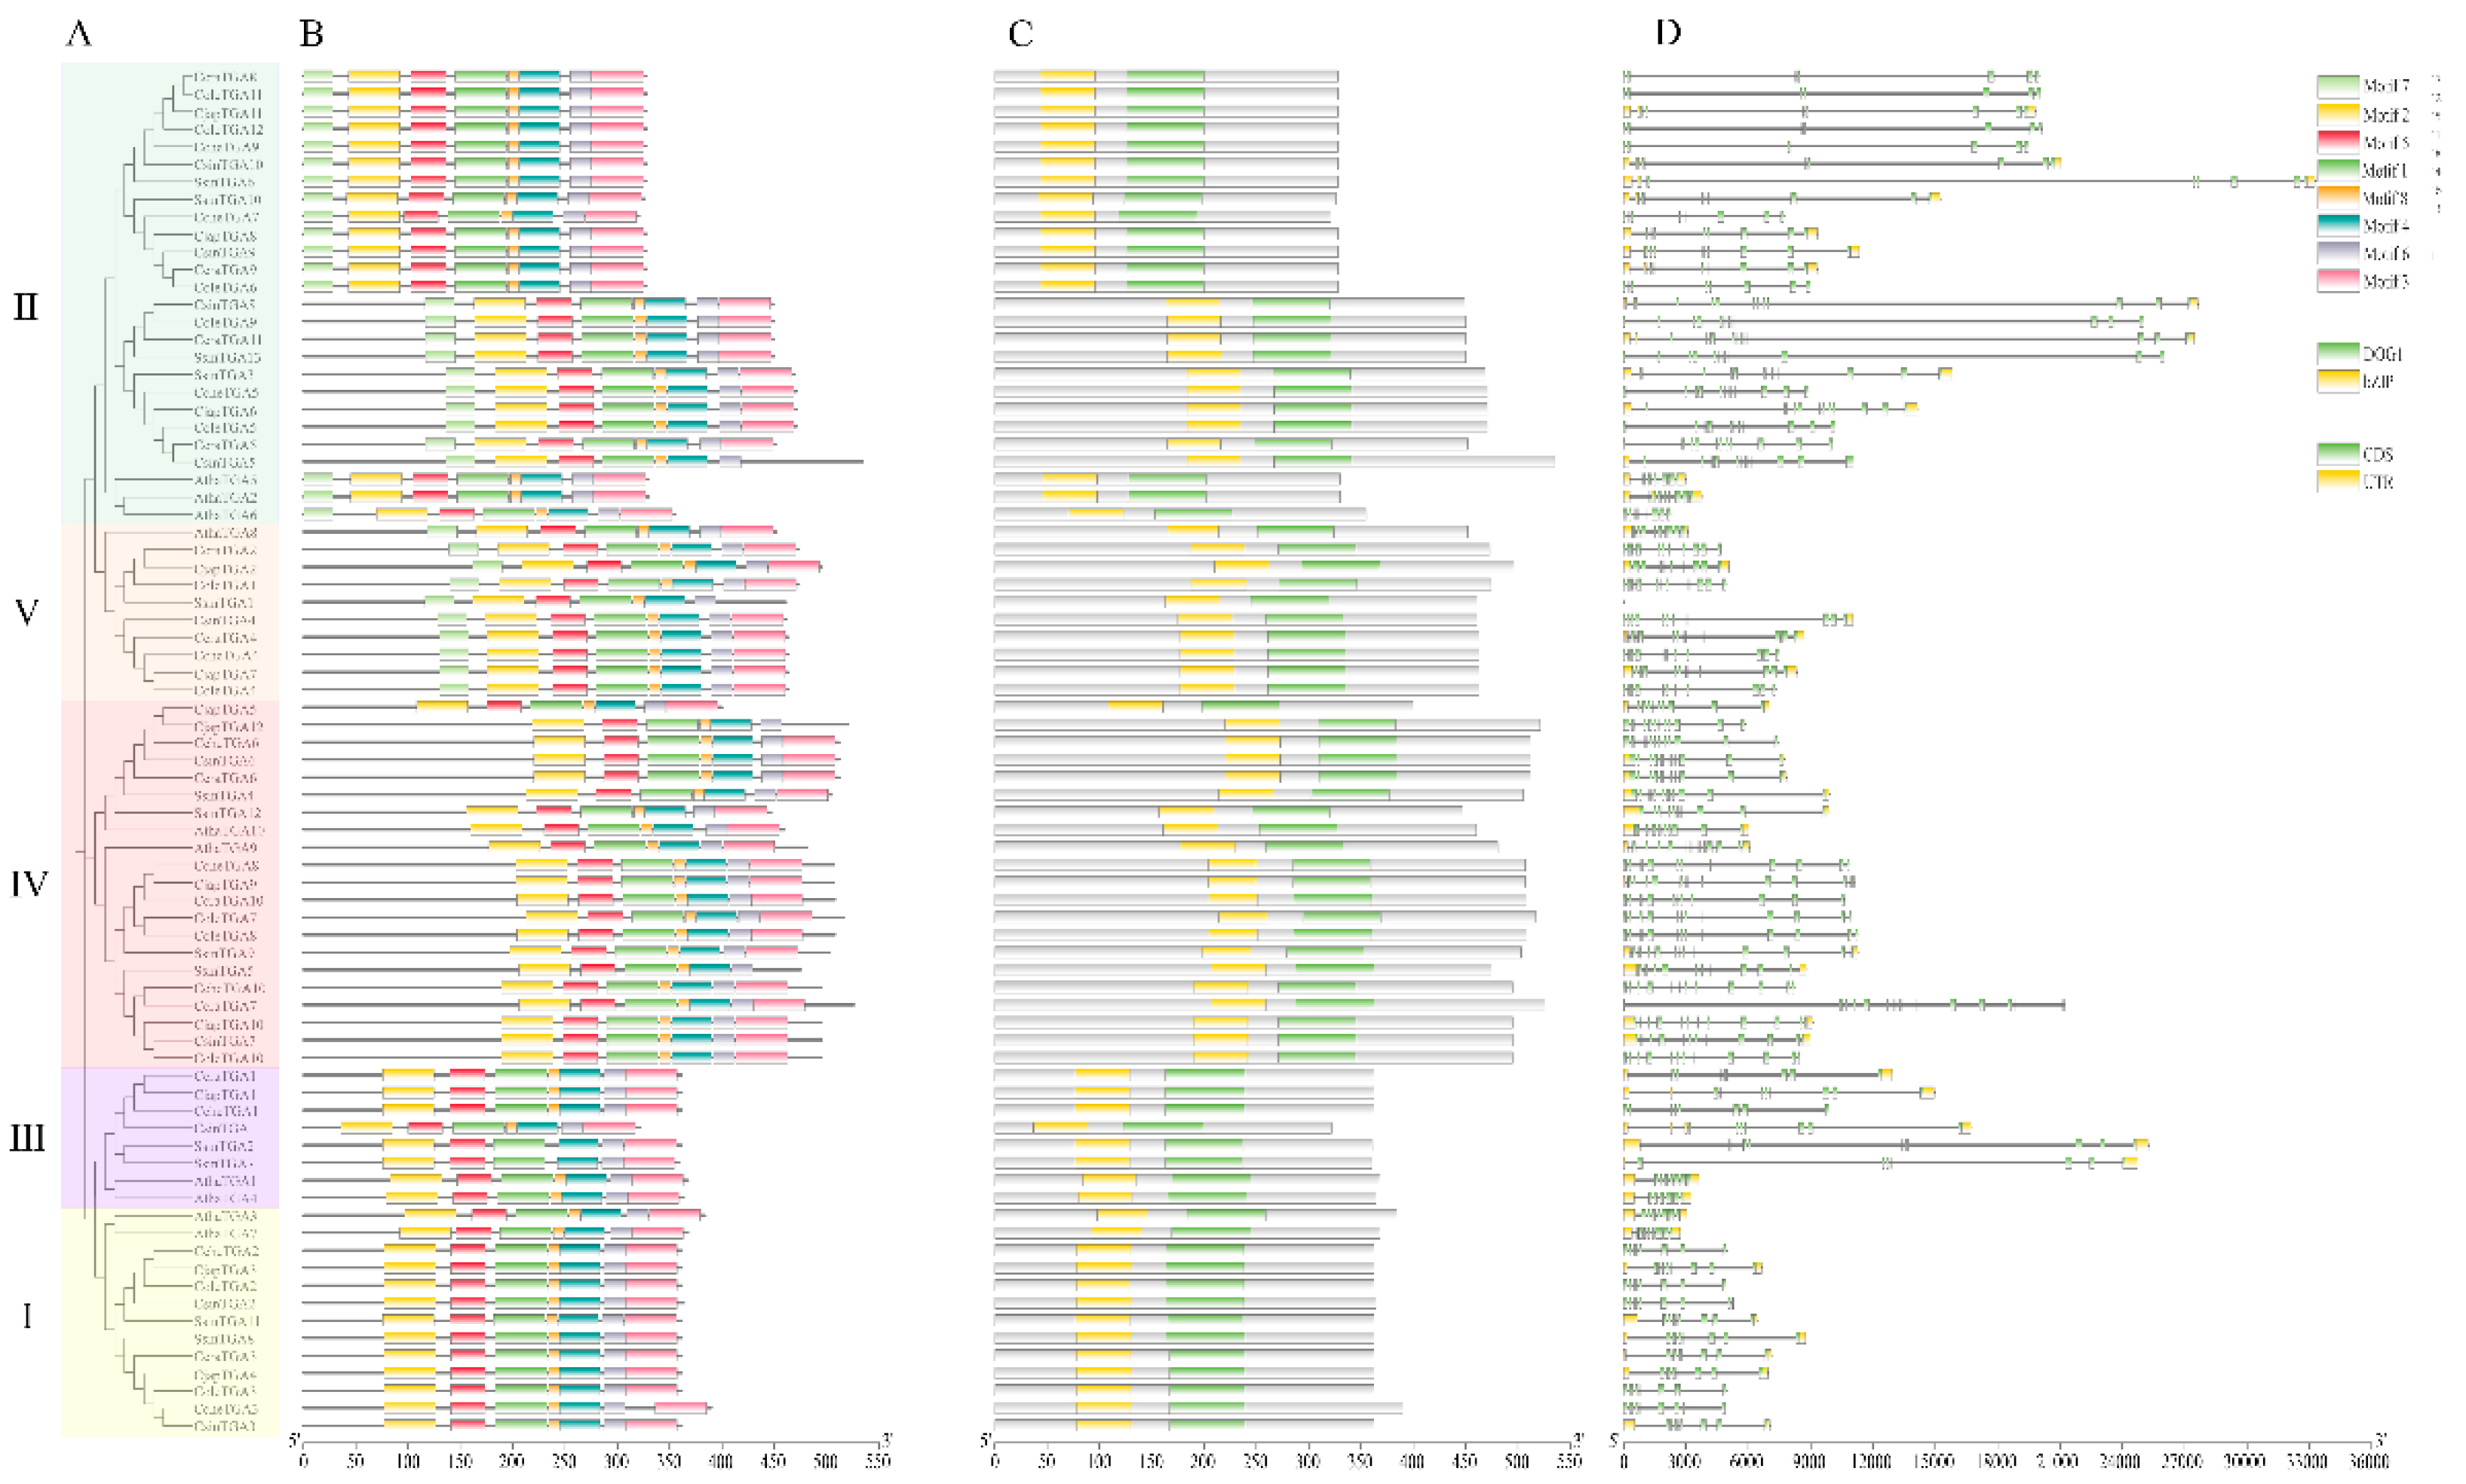
Figure 4.
Collinearity analyses of TGA gene family in six Theaceae plants. Red links highlight segmental duplication of TGA gene pairs.
Figure 4.
Collinearity analyses of TGA gene family in six Theaceae plants. Red links highlight segmental duplication of TGA gene pairs.
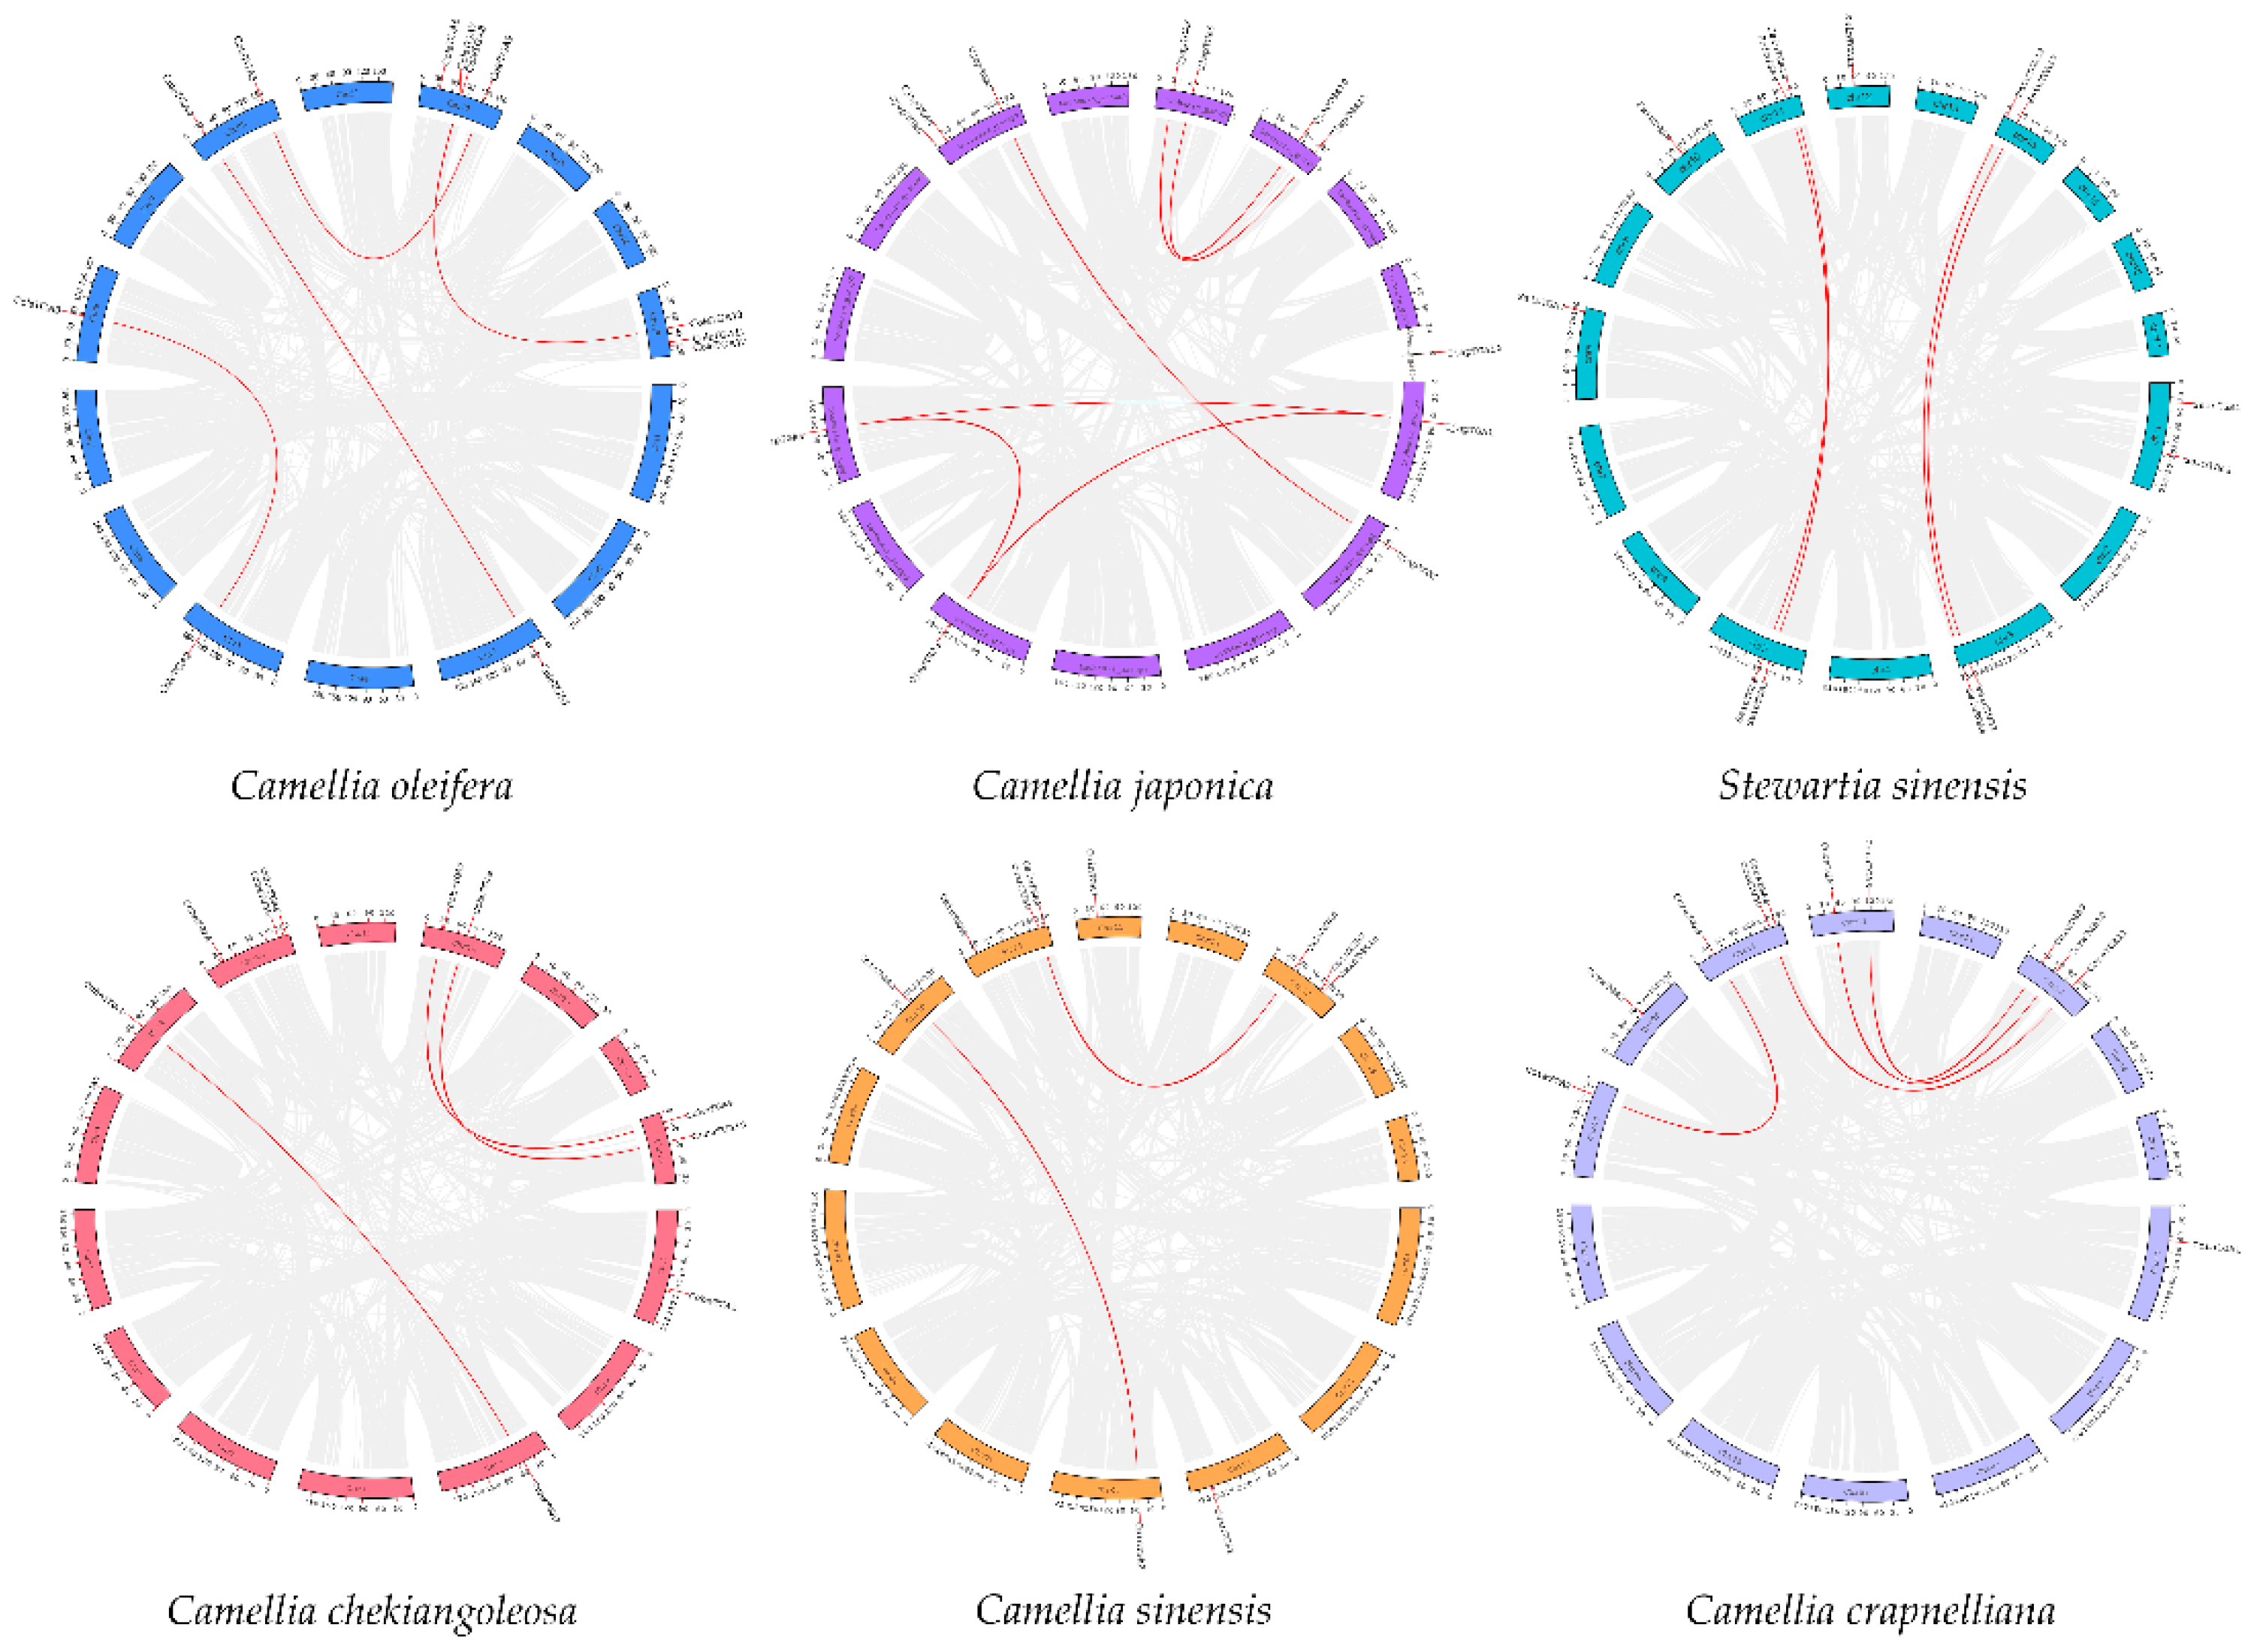
Figure 5.
The distribution of TGA genes derived from various duplication modes. The number (A) and percentage (B) distributions from TGA genes.
Figure 5.
The distribution of TGA genes derived from various duplication modes. The number (A) and percentage (B) distributions from TGA genes.
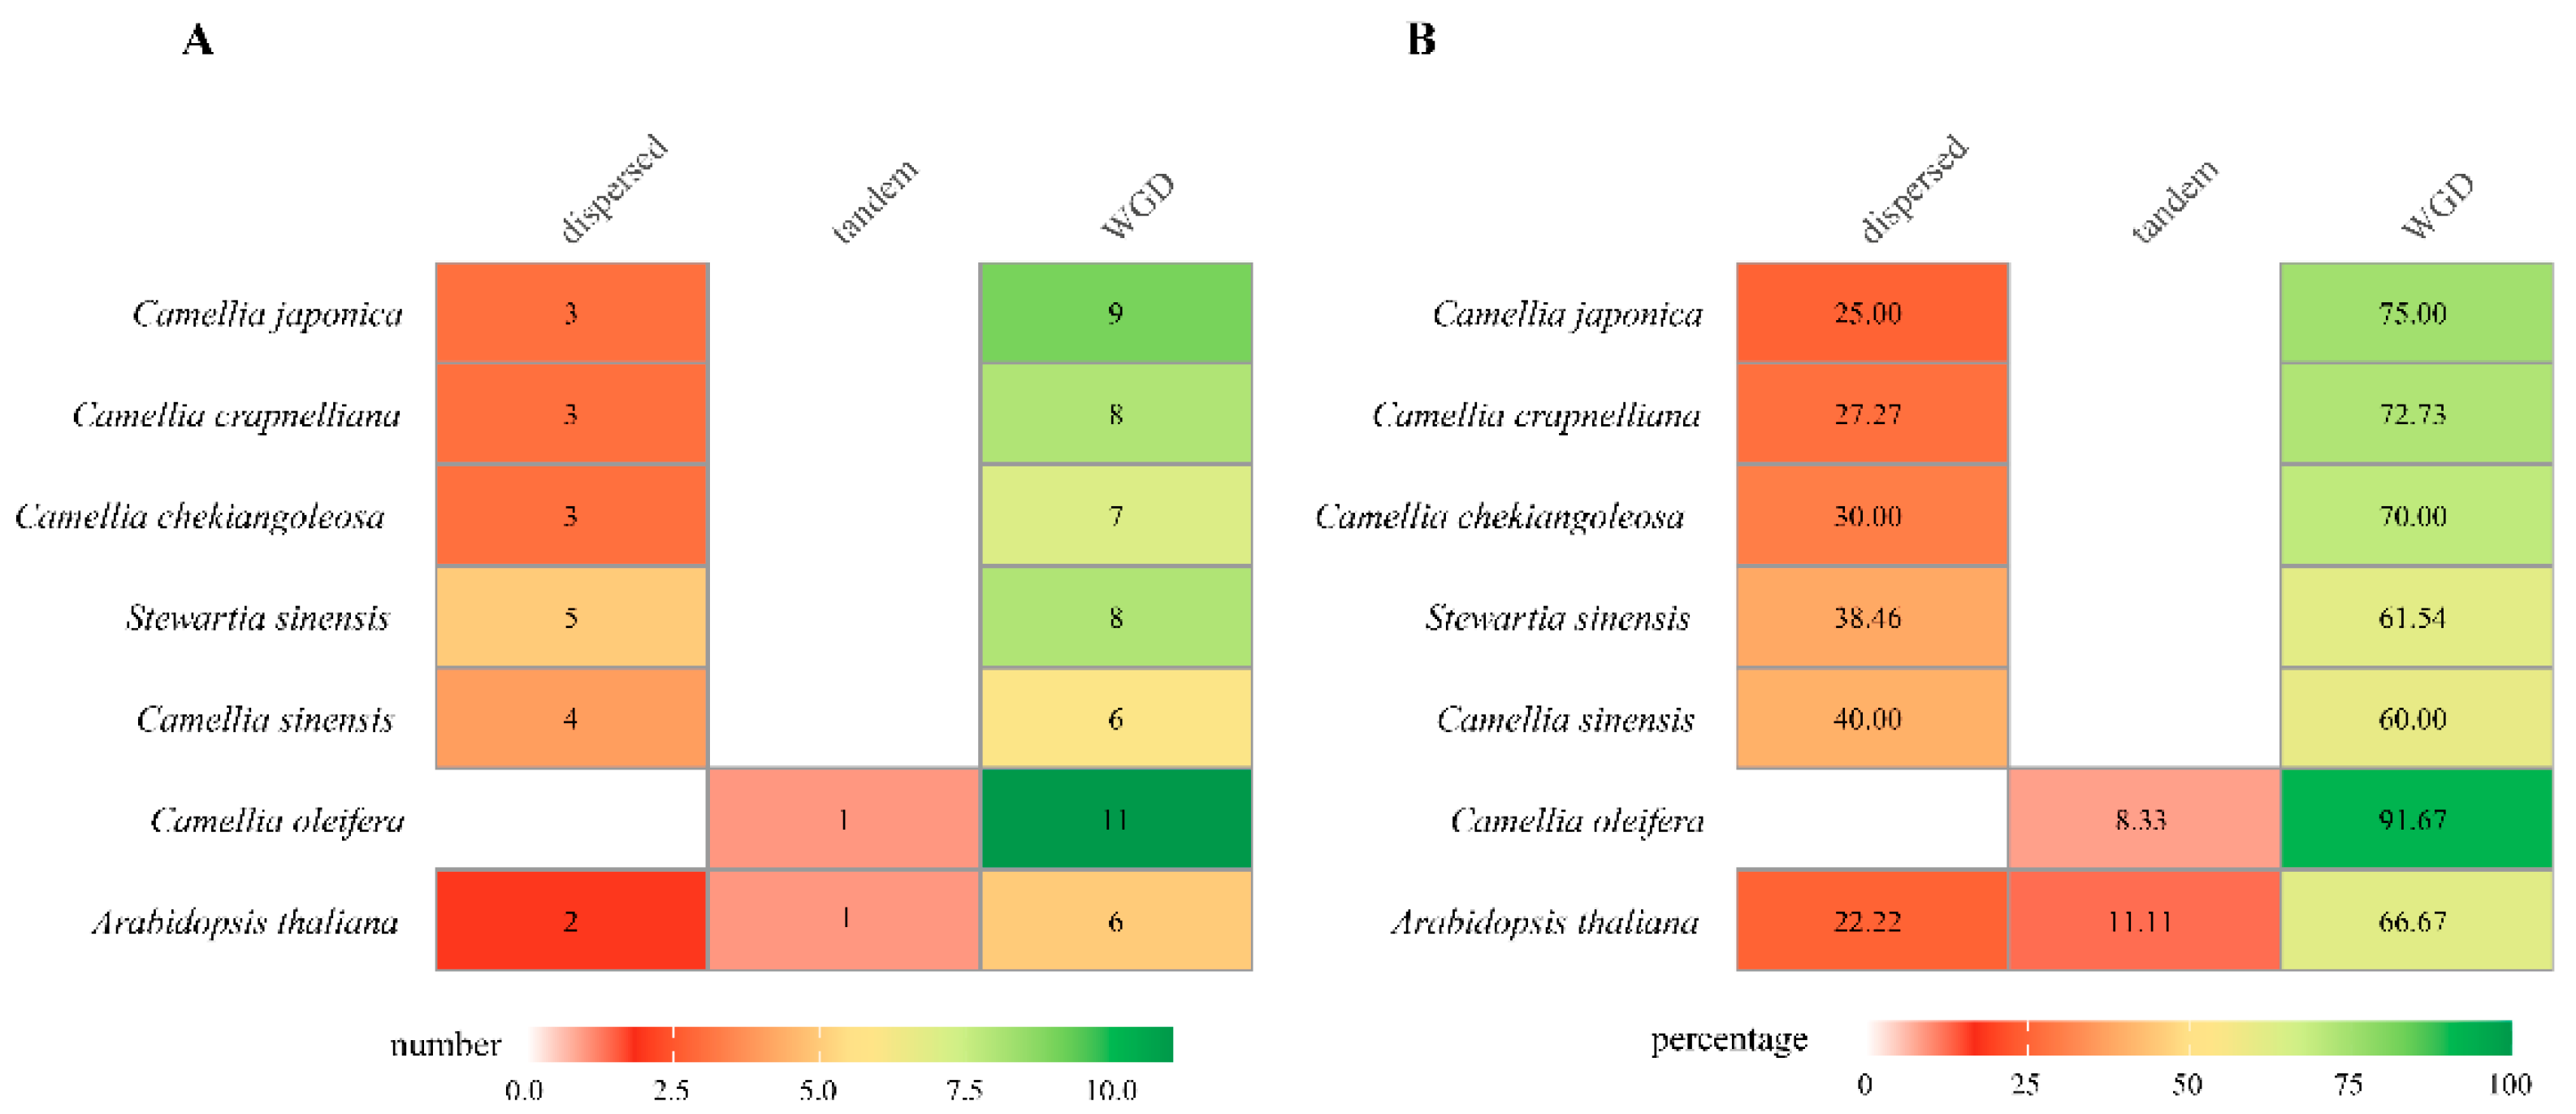
Figure 6.
The collinearity analysis of TGA family genes across six Theaceae and A. thaliana. Blue lines represent collinear TGA gene pairs between Theaceae and the other species.
Figure 6.
The collinearity analysis of TGA family genes across six Theaceae and A. thaliana. Blue lines represent collinear TGA gene pairs between Theaceae and the other species.
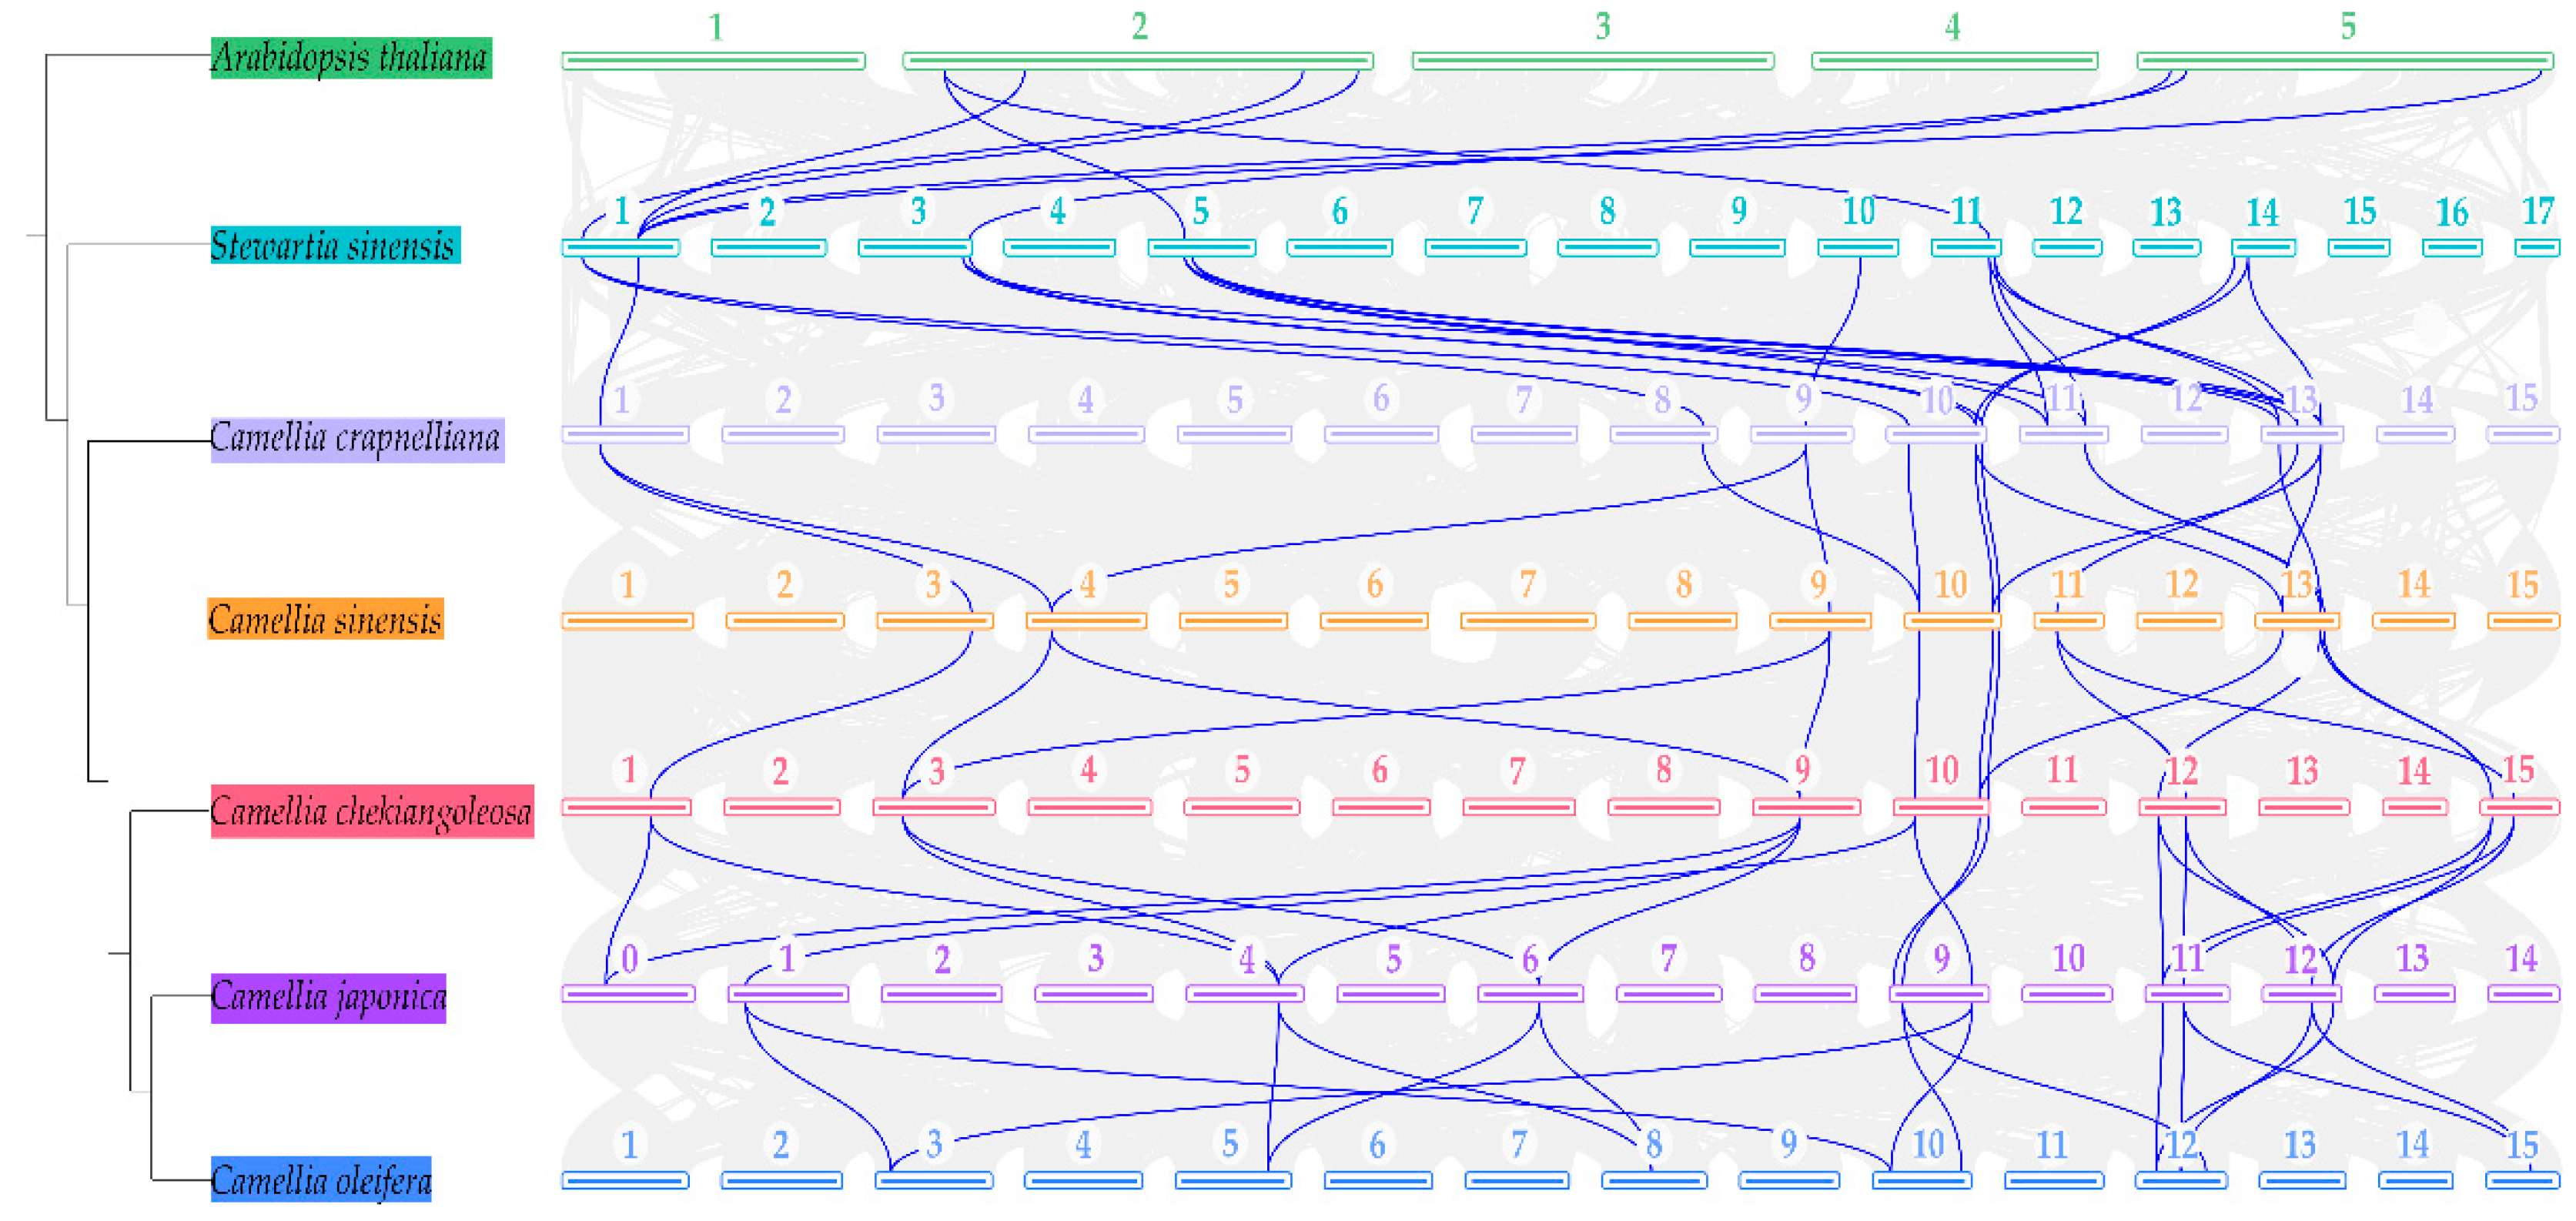
Figure 7.
Distribution of cis-elements in the promoters of TGA genes in both Theaceae. Gray lines indicate the promoters. Cis-elements differing in function are color-coded accordingly.
Figure 7.
Distribution of cis-elements in the promoters of TGA genes in both Theaceae. Gray lines indicate the promoters. Cis-elements differing in function are color-coded accordingly.
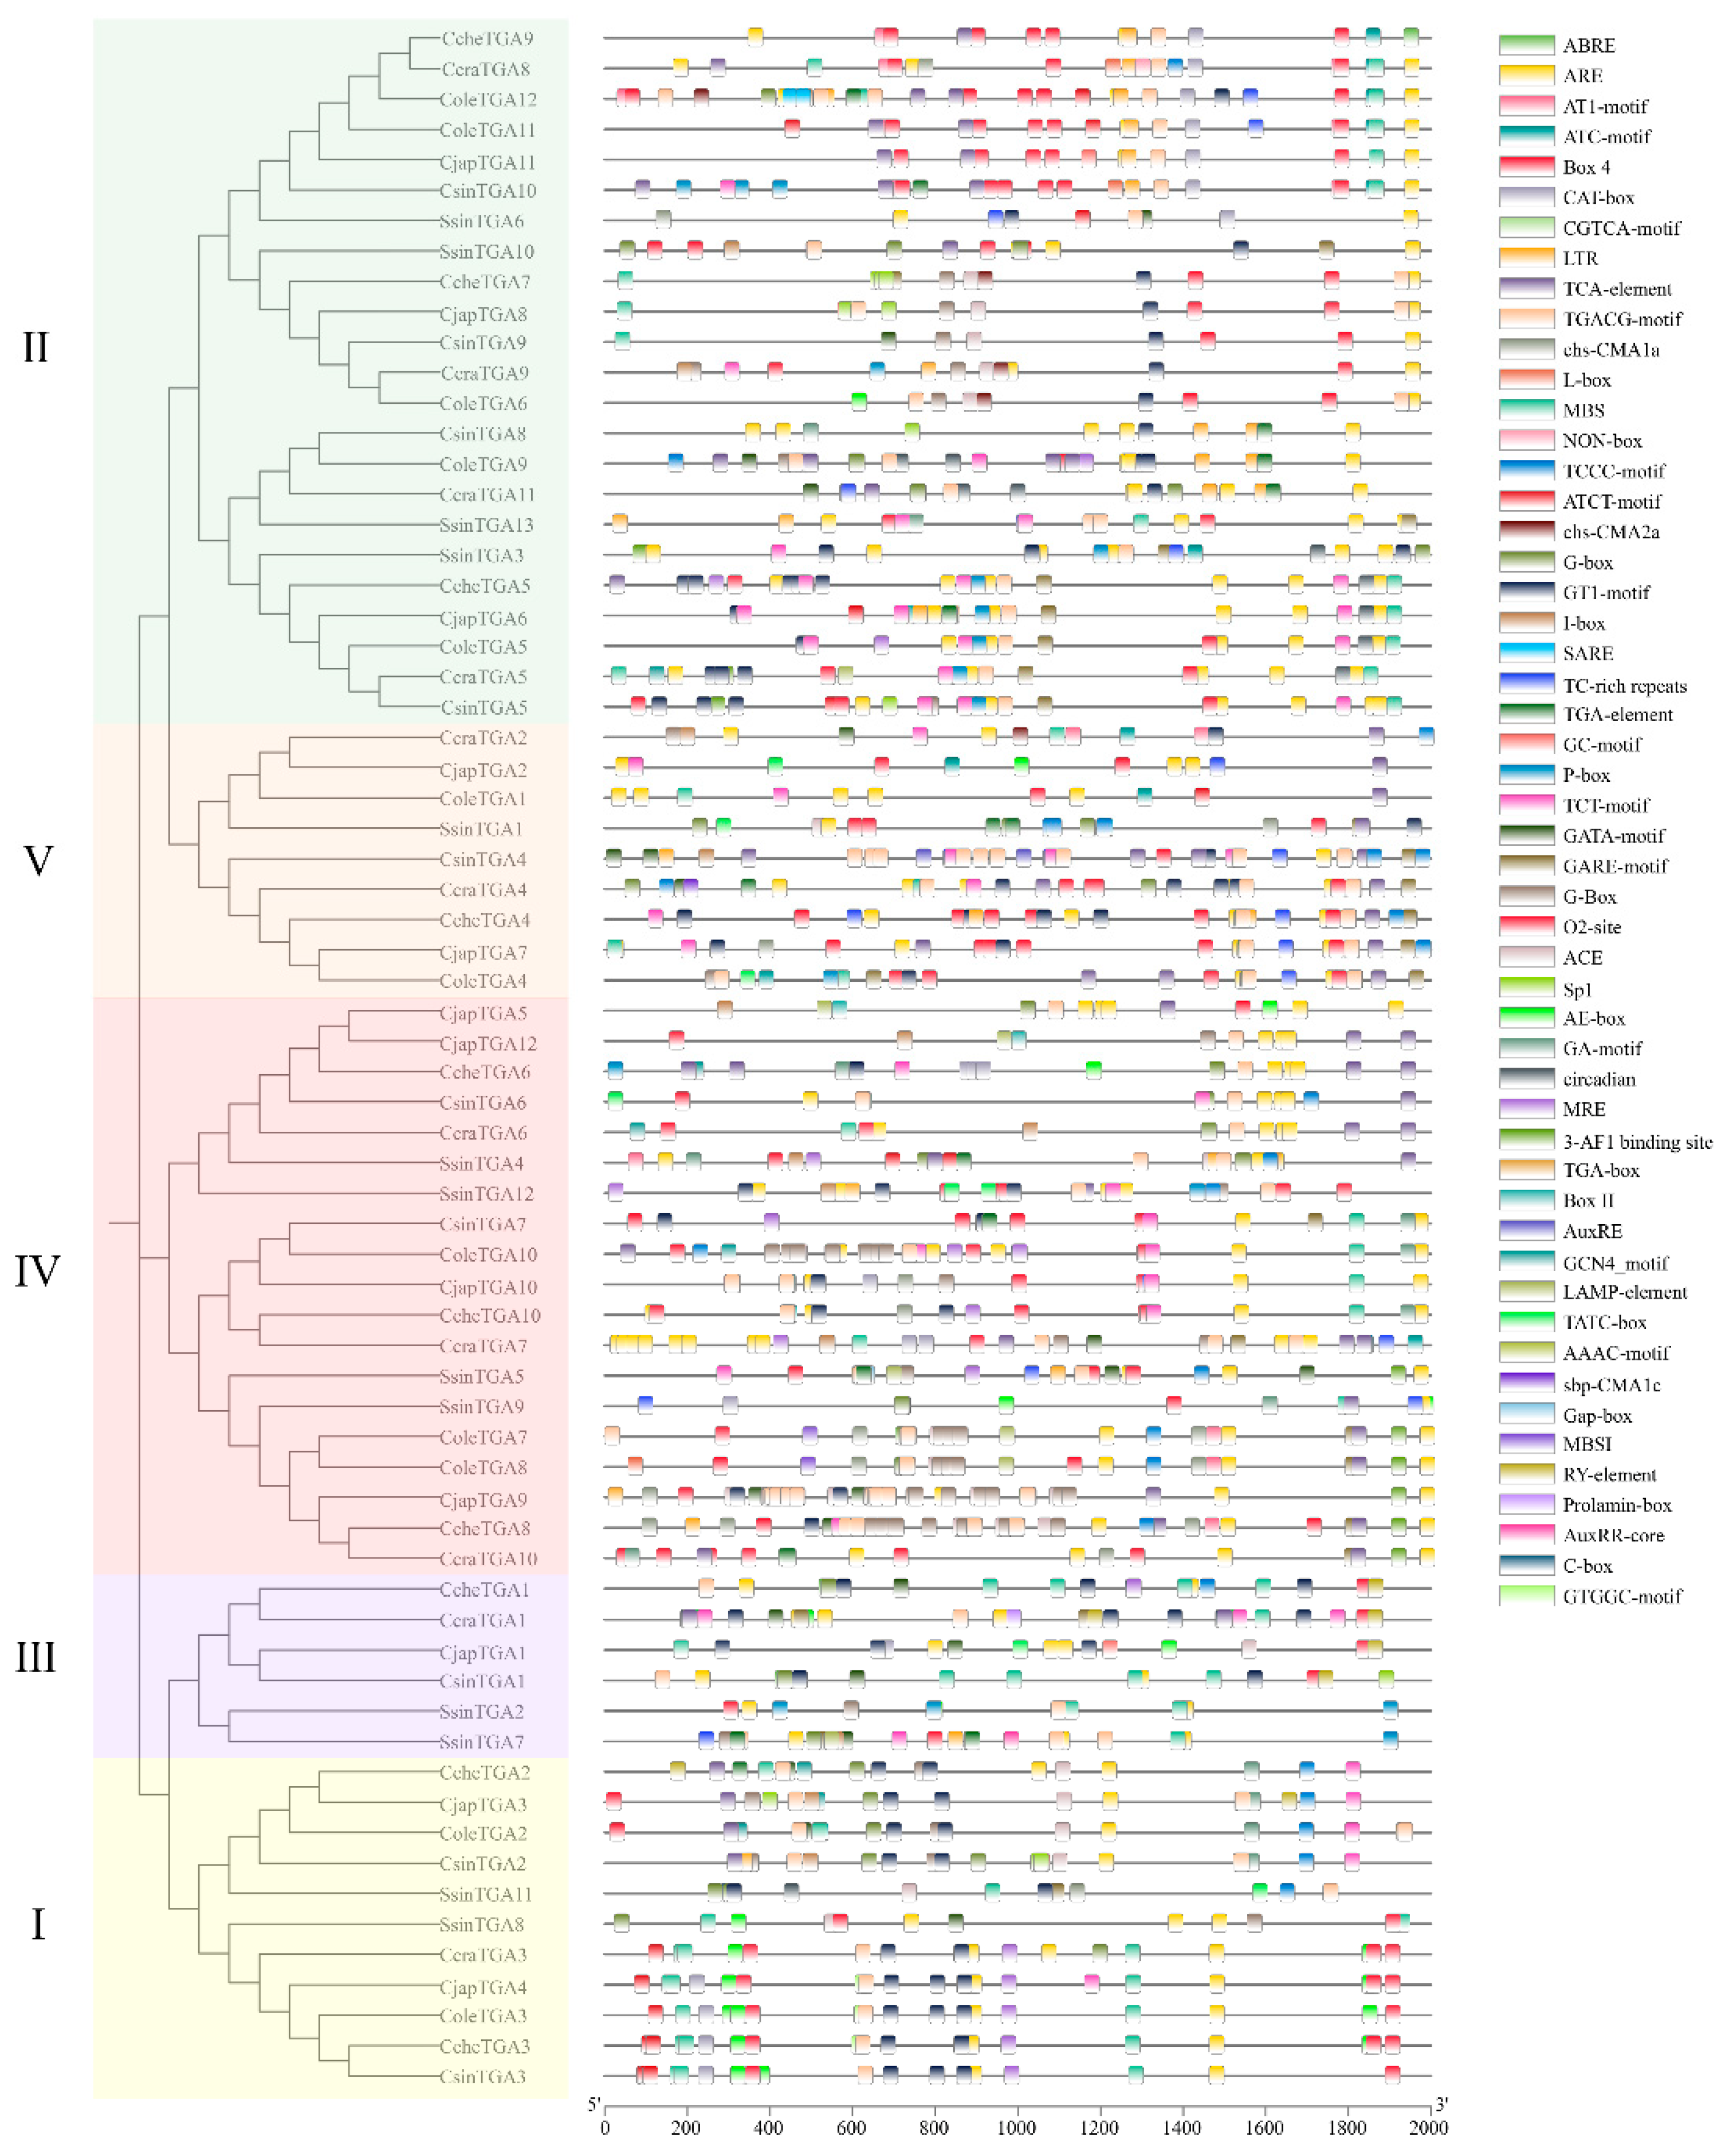
Figure 8.
Expression of TGA genes in under different tissues and abiotic stresses treatment in three Theaceae plants. The left side features an evolutionary tree, while the right side displays an expression heatmap. Genes designated with Cole prefix correspond to C. oleifera, Cche is C. chekiangoleos, Csin is C. sinensis. (A) for different tissues and (B) for different abiotic stress treatment.
Figure 8.
Expression of TGA genes in under different tissues and abiotic stresses treatment in three Theaceae plants. The left side features an evolutionary tree, while the right side displays an expression heatmap. Genes designated with Cole prefix correspond to C. oleifera, Cche is C. chekiangoleos, Csin is C. sinensis. (A) for different tissues and (B) for different abiotic stress treatment.
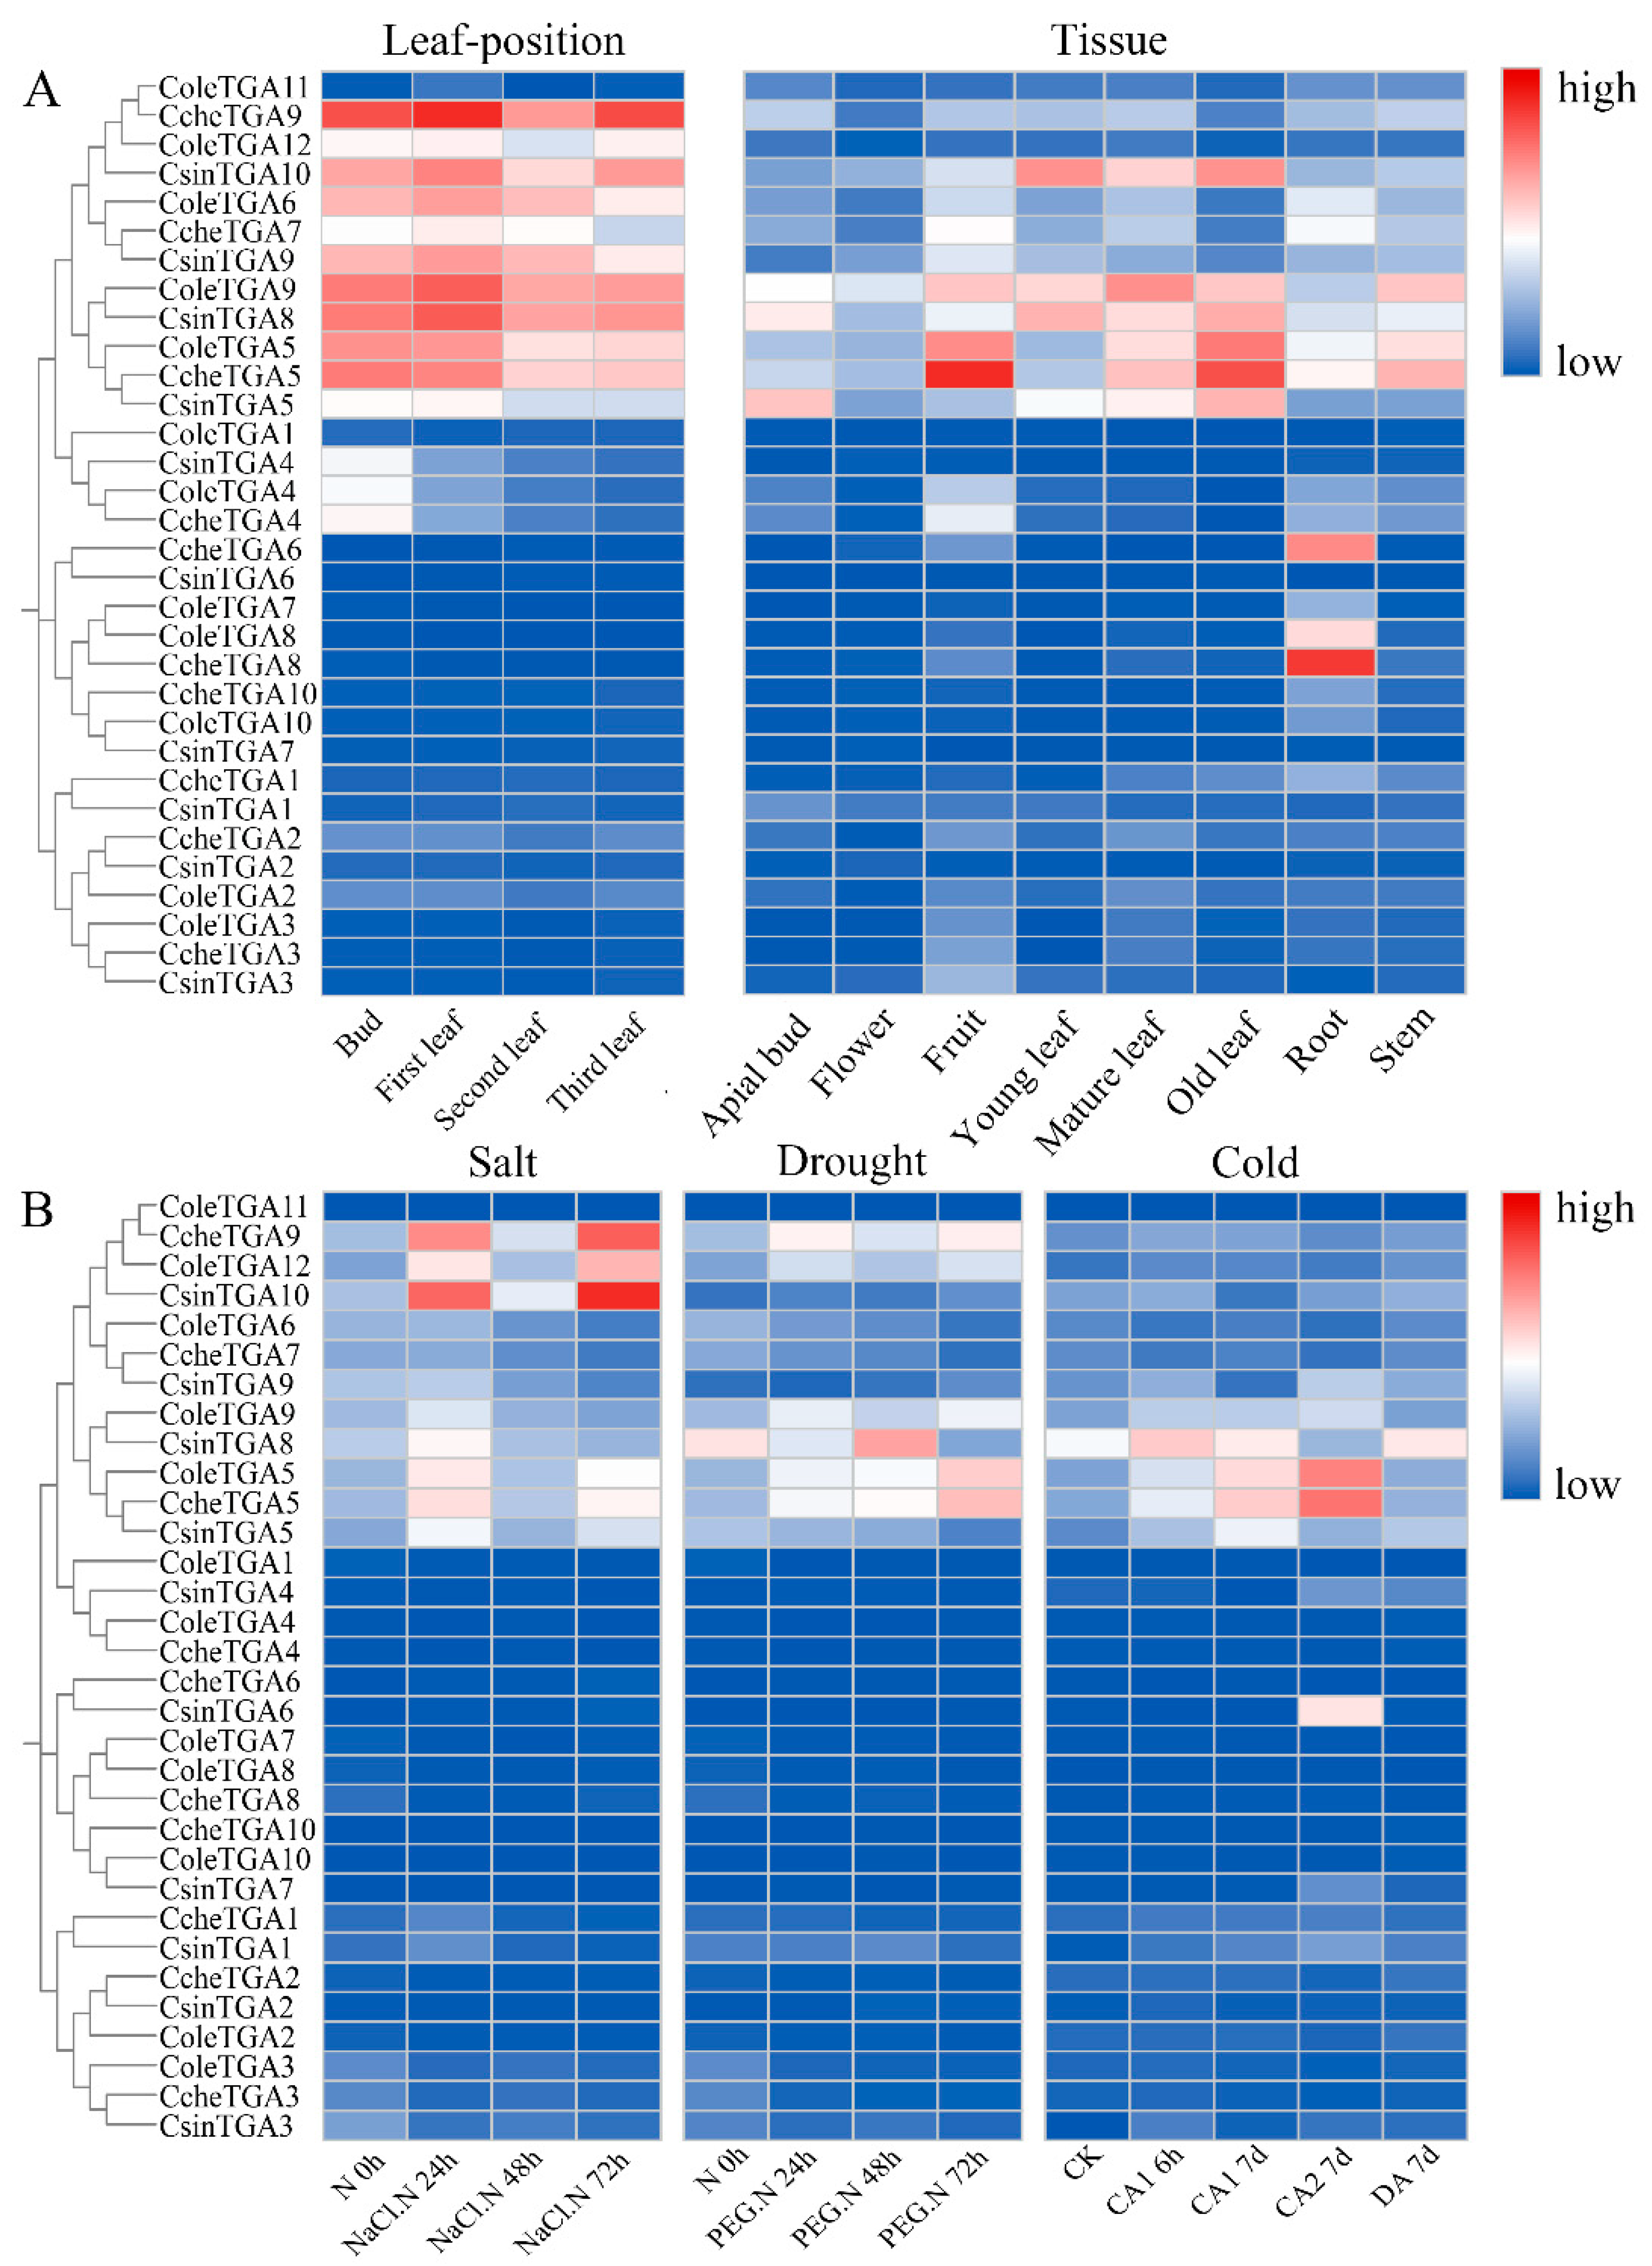
Figure 9.
Relative expression patterns of the TGA gene family responsive to C. fructicola in camellia oleifera. The bar chart represents the qRT-PCR quantification results. Data were the mean of 3 independent biological replicates. Significance analysis by Student's t-test. *, p < 0.05; **, p < 0.01. (Error bars indicate the standard deviation (SD) between three replicates).
Figure 9.
Relative expression patterns of the TGA gene family responsive to C. fructicola in camellia oleifera. The bar chart represents the qRT-PCR quantification results. Data were the mean of 3 independent biological replicates. Significance analysis by Student's t-test. *, p < 0.05; **, p < 0.01. (Error bars indicate the standard deviation (SD) between three replicates).
Disclaimer/Publisher’s Note: The statements, opinions and data contained in all publications are solely those of the individual author(s) and contributor(s) and not of MDPI and/or the editor(s). MDPI and/or the editor(s) disclaim responsibility for any injury to people or property resulting from any ideas, methods, instructions or products referred to in the content. |
© 2026 by the authors. Licensee MDPI, Basel, Switzerland. This article is an open access article distributed under the terms and conditions of the Creative Commons Attribution (CC BY) license (http://creativecommons.org/licenses/by/4.0/).
Copyright: This open access article is published under a Creative Commons CC BY 4.0 license, which permit the free download, distribution, and reuse, provided that the author and preprint are cited in any reuse.