

Submitted:
07 October 2026
Posted:
09 October 2026
You are already at the latest version
Abstract
Artificial intelligence (AI) is increasingly embedded in the workplace, yet less is known about how workers experience AI and whether these experiences differ across countries. The present work compared workplace AI use and attitudes in 225 workers in China and 198 workers in the United States. Participants completed measures describing their work practices, attitudes and motivation toward AI (GAAIS; Schepman & Rodway, 2020, 2023; TENS-Life; Peters et al., 2018; Schrepp et al., 2017; Jian et al., 2000). Using Self-Determination Theory, we also examined whether autonomy, competence, and relatedness were associated with weekly AI use through trust and mistrust in AI. Chinese workers reported using AI more hours per week and reported greater organizational support for AI use than U.S. workers. They also reported more positive and more negative attitudes toward AI, as well as greater mistrust. Chinese workers reported lower AI-supported autonomy and competence but greater AI relatedness than U.S. workers. Mediation analyses indicated that relatedness was indirectly associated with greater weekly AI use through greater trust in AI in both samples. The findings suggest that understanding workplace AI use requires attention not only to the technology itself, but also to workers’ psychological and social experiences with AI.
Keywords:
artificial intelligence
; self-determination theory
; user experience
; trust
; automation
1. Introduction
The explosive rise of AI use in business is occurring faster than anyone might have predicted. Bonney et al. (2024) reported in a survey of over 164,000 U.S. businesses that 5.4% were using AI, with that use anticipated to increase to over 6% in the subsequent six months. As might be expected, a higher use rate was found in information technology businesses than other sectors. Fast forward to 2026, and Yotzov et al. (2026) found that in a survey of businesses across the U.S. England, Canada and Germany, 69% of companies reported using AI. CEOs of those companies report using AI for a small percentage of worktime. They also reported they have seen no effects of AI use on employment or productivity in their firms, yet they still anticipate an increase in AI implementation, optimistically foreseeing increases in productivity resulting from AI use. Bick et al. (2026) did report that levels of AI adoption in businesses vary across countries. Adoption at U.S. firms outpaces adoption across European countries, in terms of overall AI adoption, as well as adoption for production of goods and services. These large-scale surveys provide a high-level examination of AI use in businesses; however, they do not fully address other areas of interest in how AI is adopted.
First, while we do have some idea of which workers use AI, we do not yet have sufficient data to understand how workers perceive AI use within their work domain. Bonney et al. (2026) found that workers in sales, marketing, and business development used AI most often on tasks such as information and document search, writing and editing. Only a small number of employees reported extensive use of AI in their work, and most used AI to augment rather than supplant work tasks. Surveys like this describe how workers use AI, but they do not present information about how workers perceive AI from a psychological standpoint. Are workers motivated to use AI? How do workers perceive the usability of AI programs and systems? What is the level of trust in AI systems in the workers who use them? These and similar questions still need to be addressed.
Second, the U.S. seems to be the baseline for comparison in studies of AI use in work environments. Studies so far have focused primarily on AI use in the U.S. compared to other Western countries. However, AI use is also occurring in Asian countries notably China. According to the International Monetary Fund [IMF] (2026), the gross domestic product of China is $21b USD second only to the U.S. at $32b USD, and far exceeding the 3rd largest GDP of $5.5b USD occurring in Germany. Schmid et al. (2026) reports AI use developing rapidly in China, just as it is in the U.S. Differences occur between the two countries in terms of focus of AI application with the U.S. AI being more software-based, with application in research, health care and security while China’s AI focuses more heavily on robotics, transportation, and manufacturing. This information addresses what AI is used for, in a U.S.-China comparison, but again does not delve into differences in how workers in the two countries perceive AI in their daily work environments.
The purpose of the present study is to focus on the environment of workers and to provide understanding of how they perceive AI integration into their work tasks. The work explores general practices and attitudes toward AI, usability ratings of AI and trust in automation toward AI as reported by workers across various fields of employment. Using Self-Determination Theory, we also examine the type of motivation workers exhibit toward AI. Last, we propose and test a model that links motivation for AI-to-AI usage, mediated by trust and mistrust of AI. This work compares these variables across a sample of Chinese versus U.S. workers.
1.1. Overview of AI Use at Work
Artificial intelligence is increasingly becoming part of everyday work. Recent studies show that the use of AI in the workplace has increased rapidly, particularly since generative AI programs became widely available. Kemp (2026) reported that 52% of U.S. employees were using AI in their work, compared with 40% in 2025 (Pendell, 2025). Approximately 30% of U.S. employees reported using AI several times per week or more, while 15% reported using it daily (Kemp, 2026). AI use continues to be more common among employees in professional and knowledge-based occupations, particularly in technology, professional services, and finance (Pendell, 2025). These findings indicate that AI is becoming more common in the workplace, although its use continues to differ across occupations and industries.
Research at the organizational level shows a similar pattern. Bonney et al. (2026) examined nationally representative data from U.S. businesses and found that approximately 18% of firms used AI in at least one business function between November 2025 and January 2026. AI use was often concentrated in sales and marketing, business strategy, and information technology. At the worker level, common uses included writing, document analysis, and information searches. Most organizations also reported using AI primarily to support or augment employee tasks rather than replace employees (Bonney et al., 2026).
China has also experienced rapid growth in AI adoption. Recent international data suggest that workplace AI use may be particularly high among Chinese employees. Gillespie et al. (2025), in a survey of more than 48,000 individuals across 47 countries, found that 58% of employees globally reported intentionally using AI at work. In comparison, 93% of employees surveyed in China reported using AI for work. The 2026 Stanford AI Index reported a similar pattern, finding that workplace AI use exceeded 80% in China (Stanford Institute for Human-Centered Artificial Intelligence, 2026). These findings suggest that the rate at which workers incorporate AI into their work may differ considerably among countries.
One important difference between the U.S. and China is the AI tools available to workers. In the U.S., workers have access to a wide range of generative AI platforms, including ChatGPT, Google Gemini, Microsoft Copilot, Claude, and other AI applications integrated into commonly used workplace software. The AI environment in China is different. Many major U.S.-based AI services are not officially available or have more limited availability in mainland China. At the same time, China has developed a large domestic AI ecosystem that includes platforms such as ByteDance’s Doubao, DeepSeek, and Alibaba’s Qwen. Those Chinese AI tools provide functions similar to Western generative AI tools, including writing, information search, data analysis, coding, document processing, and other workplace tasks. These differences suggest that Chinese and U.S. workers perform similar tasks with AI but may use different AI platforms and operate within different technological and regulatory environments.
The policy environment surrounding AI use also differs between China and the U.S. China has made AI development and implementation an important part of its national economic and technology strategy. Through its “AI Plus” initiative, the Chinese government has encouraged extensive application of large-scale AI models and the development of smart manufacturing equipment, intelligent vehicles, AI-enabled devices, and intelligent robots (State Council of the People’s Republic of China, 2025). In 2026, China further expanded this initiative by encouraging large-scale commercial applications of AI across key industries and fields (State Council of the People’s Republic of China, 2026). In the United States, federal policy has emphasized expanding AI use, with a strong focus on innovation, economic competitiveness, AI literacy, and workforce skill development. The U.S. AI Action Plan specifically identifies AI training and skill development as important for helping workers adapt to changes associated with AI (The White House, 2025).
Differences are also found in workers’ attitudes toward AI. Gillespie et al. (2025) found that Chinese respondents reported relatively high levels of acceptance, optimism, and trust toward AI. Sixty-eight percent of Chinese respondents indicated a willingness to trust AI, while 92% accepted or approved of AI use. U.S. respondents were more cautious. Only 54% of U.S. respondents reported accepting or approving of AI, and many reported limited knowledge or training related to AI. These findings suggest that workers in the two countries may differ not only in how often they use AI, but also in how they perceive and evaluate the technology. Recent research with Chinese employees provides evidence that psychological factors may be important. Lin et al. (2025) found that trust in generative AI was related to employee innovation among Chinese workers. An and Hu (2025) also found that employees’ appraisal of AI as a career challenge was associated with job crafting and career sustainability. These studies demonstrate that workers may consider whether AI is trustworthy, useful, manageable, and potentially beneficial or threatening to their work.
AI use is expanding rapidly in both the U.S. and China. However, much of the existing research has focused on adoption rates, organizational implementation, work tasks, and productivity. Less is known about workers’ psychological experiences with AI, particularly across cultural environments. There is still limited research examining why workers are motivated to use AI, how they evaluate their experience with AI systems, and the extent to which they trust these technologies. Comparing workers in China and the U.S. may therefore provide a better understanding of how motivation, user experience, and trust are related to workplace AI use.
1.2. SDT and AI Use
Self-Determination Theory (SDT; Deci & Ryan, 2000; Ryan & Deci, 2017) provides a useful framework for moving beyond whether employees use artificial intelligence (AI) to better understand the underlying motivation for its use. A central premise of SDT is that the type of motivation underlying behavior is as important as how motivated someone is (Ryan & Deci, 2000, 2017; Ryan & Vansteenkiste, 2023). Individuals may engage in a behavior because they find it interesting, valuable, or personally meaningful, reflecting more autonomous forms of motivation. In contrast, individuals may engage in the same behavior because of external expectations, rewards, or pressure, reflecting more controlled forms of motivation. SDT also proposes that motivation and functioning are influenced by the satisfaction of three basic psychological needs: autonomy, competence, and relatedness. Autonomy refers to feeling a sense of choice and ownership over one’s actions, competence refers to feeling capable and effective, and relatedness refers to feeling connected to and supported by others (Ryan & Deci, 2017; Vansteenkiste et al., 2023). Importantly, the environment can either support or frustrate these needs (Vansteenkiste et al., 2020, 2023). When these needs are supported, individuals are more likely to experience greater psychological well-being, sustained motivation, and resilience (Chen et al., 2015; Vansteenkiste et al., 2020, 2023). However, these needs can also be frustrated. When individuals feel controlled, ineffective, or disconnected from others, need frustration can contribute to poorer well-being, disengagement, and more controlled forms of motivation (Chen et al., 2015; Vansteenkiste et al., 2020, 2023).
These distinctions are important when considering AI use in the workplace. Knowing whether an employee uses AI, or even how frequently they use it, does not necessarily tell us why they are using it. For example, an employee may use AI because they find that it helps them work more effectively or because they value what the technology allows them to accomplish. Another employee may use AI just as frequently but does so because their organization expects them to use it or because they feel pressure to keep up with their coworkers. The amount of AI use may look the same, but the motivation underlying the use may be very different. Zhang et al. (2026) recently examined this distinction among employees in China. They found two different pathways linking AI use with task performance. AI use was positively related to task performance through autonomous motivation and promotion-focused job crafting, while a separate pathway through controlled motivation and prevention-focused job crafting was negatively associated with task performance.
Beyond the motivation underlying AI use, AI may also influence employees’ basic psychological needs. How AI is incorporated into work may shape employees’ experiences of autonomy, competence, and relatedness. For example, AI could provide employees with greater flexibility in how they complete their work, help them complete difficult tasks, or make it easier to communicate and collaborate with others. Rasheed et al. (2026), for example, found that perceived AI-supported autonomy was positively related to service job performance and work innovation among hotel employees in China.
At the same time, the use of AI may not always support employees’ needs. Employees may experience less autonomy when they are expected to rely on AI-generated recommendations or have little choice in whether or how they use the technology. Competence may be challenged when employees become increasingly reliant on AI to complete tasks they previously completed on their own or begin to question their own knowledge and abilities. Diebel et al. (2026), for example, found that proactive AI assistance resulted in greater losses in competence-based self-esteem compared with reactive AI assistance, which was subsequently associated with lower satisfaction with the system. Relatedness may also be affected if AI replaces opportunities to collaborate with coworkers, ask others for help, or engage in social interactions that are typically a part of completing work.
Basic psychological needs may also be related to how individuals view AI. Bergdahl et al. (2023) examined psychological need fulfillment and attitudes across six European countries. Competence and relatedness were associated with more positive attitudes toward AI across all six countries, while autonomy was associated with more positive attitudes in Finland. Autonomy, competence, and relatedness were also associated with lower negative attitudes toward AI across countries. In their longitudinal study in Finland, increases in autonomy and relatedness were associated with increases in positive attitudes and decreases in negative attitudes toward AI over time. Bergdahl et al. assessed these experiences using a nine-item version of the Technology Effects on Need Satisfaction in Life Scale (TENS-Life; Peters et al., 2018), which examines the extent to which technology supports users’ experiences of autonomy, competence, and relatedness. The measure is particularly relevant for examining AI because it focuses on how interactions with a technology may support basic psychological needs rather than assessing need satisfaction more generally. The way AI is introduced and incorporated into the workplace may shape how employees respond to it. For example, among U.S. employees whose organizations provided generative AI training, organizational listening was positively associated with perceived autonomy and competence, which were then associated with more favorable attitudes toward adopting generative AI at work (Dong et al., 2024).
Employees’ experiences with AI may also be related to how much they trust the technology. In a cross-sectional study, Watermann et al. (2026) found that employees who used AI for problem-solving reported greater trust in AI, and greater trust was associated with higher autonomy, competence, and technology-related relatedness. However, these needs were not related to employees’ workplace well-being or work engagement.
Although research examining SDT and AI is growing, there is still much we do not know about what motivates employees to use AI and how they experience its use. Current research has examined autonomous and controlled motivation, basic psychological needs, attitudes toward AI, and trust, but these factors have often been examined separately and within specific countries and work contexts (Bergdahl et al., 2023; Dong et al., 2024; Watermann et al., 2026; Zhang et al., 2026). Less is known about whether these relationships differ across cultural contexts, particularly within workplace settings.
1.3. Human Factors, User Experience, Trust, and AI Use
The discipline of Human Factors focuses on understanding how people interact with systems, technologies, and environments in order to improve performance, safety, and the overall quality of the interaction. Within human factors, user experience (UX) refers to users’ perceptions and responses that result from the use or anticipated use of a product, system, or service. UX extends beyond whether a technology is easy to use. It includes perceptions of efficiency, usefulness, control, satisfaction, stimulation, and the overall quality of the interaction. As AI becomes more common in the workplace, UX is increasingly important because successful AI use depends not only on the technical capabilities of the system, but also on how workers understand, evaluate, and interact with it (Amershi et al., 2019; Shneiderman, 2020).
AI creates several UX challenges that are different from those associated with many traditional computer applications. Traditional applications generally produce relatively predictable responses when users provide the same input. AI systems, particularly generative AI, may produce different responses to similar prompts and can generate incomplete, inaccurate, or unexpected information. AI systems can also be difficult for users to understand because the process used to generate a recommendation or response may not be visible for the users. These characteristics make it more difficult for users to develop accurate expectations or trust in what the system can and cannot do.
Amershi et al. (2019) identified predictability, feedback, error correction, and user control as important considerations in human-AI interaction. Similarly, Liao et al. (2020) found that users have different explanation needs when interacting with AI, including wanting to understand why the system produced a particular result and what factors influenced that result. Shneiderman (2020) further argued that effective AI systems should maintain meaningful human control rather than simply increasing automation. Together, these studies suggest that a positive AI user experience depends partly on whether users can understand the system, recognize its limitations, and maintain appropriate control over the interaction.
Trust in automation is also an important part of this interaction. Prior research suggests that trust may be related to whether individuals are willing to rely on an automated system, particularly when the system is complex or when users cannot fully understand how it reaches a decision (Jian et al., 2000; Lee & See, 2004). Importantly, more trust is not always better. Instead, trust should be appropriate for the actual capabilities and limitations of the system. Too little trust may be associated with users ignoring useful recommendations or avoiding the technology, while too much trust may be associated with overreliance or acceptance of incorrect information without verification. For example, Ling et al. (2024) found that providing users with explanations about how the system arrived at its output was associated with greater trust and preference, while information about how certain the system was about its output did not significantly affect trust or preference. In the present study, trust and mistrust in automation are assessed in relation to the AI system participants use most frequently using the Trust in Automation Scale (Jian et al., 2000).
These concerns may be especially important with generative AI because these systems can produce responses that sound confident and reasonable even when the information is inaccurate. Qian and Wexler (2024) observed that the performance, satisfaction, and trust differed depending on users’ expertise and the type of task being completed. They also found evidence of automation complacency and increased reliance on AI over the course of the task. Prior research also suggests that trust may be related to how employees respond to generative AI. For example, Marimon et al. (2025) found that generative AI use was not directly related to employee performance. Instead, their model illustrated that an optimal level of user trust was related to greater work engagement, which then in turn was associated with performance. Similarly, Huynh and Aichner (2025) reported that a user’s cognitive trust in generative AI was positively related to the user’s attitudes and perceived performance, which were also related to the user’s behavioral intentions toward using the technology. These findings suggest that understanding AI use requires more than just looking at whether employees use the technology. We need to consider how they experience it and how much they trust it.
One way to examine these perceptions is through the User Experience Questionnaire-Short Version (UEQ-S; Schrepp et al., 2017). This questionnaire assesses both the practical qualities of the user experience, such as whether the system is supportive and efficient, and the more experiential qualities such as whether the system is exciting and interesting. These distinctions may be especially useful when examining AI because users may experience the same system differently across these dimensions. For example, an employee may find an AI system efficient and easy to use without necessarily finding it interesting or innovative. Another employee may find the technology exciting or inventive while also finding it more difficult to use.
1.4. Current Study
The current study adds to the knowledge on how working adults utilize AI in their everyday environments. In addition, it provides a comparison of the AI use patterns between US workers and Chinese workers. Since AI has been implemented differently in China versus the U.S. (Schmid et al., 2026), it provides a unique look at how that may translate into workplace practices.
Beyond strictly demographic comparisons, the present work also utilizes Self-Determination Theory and Human Factors issues to more deeply understand AI usage in the two populations studied. First, we will examine group differences in AI-related basic psychological need satisfaction using the TENS-Life survey, along with positive and negative attitudes toward AI using the General Attitudes toward Artificial Intelligence Scale (Schepman & Rodway, 2020, 2023). Human factors concerns are added to the study by comparing groups on their user experience attitudes toward AI (Schrepp et al., 2017) and their trust in automation (Jian et al., 2000). Last, we test a model that examines how motivational antecedents of behavior predict usage, mediated by trust in automation.
Specifically, the study explored the following research questions:
- Do Chinese and U.S. workers differ in their AI-use in the workplace?
- Do Chinese and US workers differ in their positive/negative attitudes toward AI use in the workplace?
- Do Chinese and US workers differ in their user experience about AI in the workplace?
- Do Chinese and US workers differ in their trust in automation related to AI in the workplace?
- Do Chinese and U.S. workers differ in how AI affects their basic psychological needs in the workplace?
- Are AI-related autonomy, competence, and relatedness associated with AI use in the workplace through trust and mistrust in AI?
2. Materials and Methods
2.1. Participants and Data Collection
Two groups of participants were included in the present study. The first group was a sample of 198 adult workers living in the United States. This sample was collected using Prolific, with safeguards put in place to lessen the possibility of AI use in responding. The mean age of this sample was 42.01 years. The sample consisted of 77 female and 120 male identifying individuals with 1 person reporting non-binary gender identity. The second sample consisted of 225 adult workers based in China. The mean age of this sample was 35.90 years and included 99 female and 126 male identifying individuals. The Chinese sample was collected through Tencent Questionnaire (wj.qq.com), a Chinese-based online survey and participant recruitment platform similar to Prolific. The survey was originally developed in English. A member of our research team who is fluent in Chinese translated the survey from English to Chinese for administration to the Chinese sample. Participants in each country completed the survey in the language appropriate for their sample.
Participants in both samples reported working in a variety of job categories with Business/Management/Finance, Creative/Design/Media and Customer Service/Retail/Hospitality being the most common categories for both samples.
A small number of participants had missing responses on selected study variables, resulting in slightly different sample sizes across some descriptive and group-comparison analyses. The mediation models were estimated using full-information maximum likelihood (FIML), allowing all 198 U.S. participants and 225 Chinese participants to contribute to model estimation.
2.2. Measures
Demographic Information: Demographic information was collected for both samples. Items in the demographic portion of the survey included: age, gender, career field, education level, years in current position, leadership role (yes/no), Years AI has been used in work, hours per week of AI use, what AI at work is used for, percentage of time AI is used for each work activity, AI platform utilized, organizational support for AI use (yes/no) and whether or not the organization provides AI tools for work use (yes/no). Responses to each of these items, broken down by country, are provided in Table 1.
General Attitudes toward AI Scale (GAAIS: Schepman & Rodway, 2020, 2023). This scale is an 8-item scale measuring positive and negative attitudes toward AI. Items are anchored on a Likert scale with 1 = strongly disagree to 7 = strongly agree. Reliabilities for the two dimensions of the scale are strong with reported reliabilities across different samples ranging from .82 to .90.
User Experience Survey - Shortened Version (Schrepp et al., 2017). This 8-item survey measures items reflecting how users experience AI. Items addressed factors including supportiveness, ease, efficiency, clarity, excitement, interest, inventiveness and leading edge/novelty of the AI used. Items responses were anchored on a 7-point Likert scale with 1 representing the most negative perception of the quality and 7 representing the most positive dimension of the quality. Based on the recommended scoring of the UEQ-S, the Likert scale items were transformed into a scale ranging from -3 for the most negative perception of the dimension to +3 for the most positive perception. Although the UEQ-S is commonly scored using broader pragmatic and hedonic quality dimensions, the present study examined the eight item-level qualities individually. This approach was used because we were interested in identifying whether Chinese and U.S. workers differed on specific aspects of their experience with AI, rather than only on broader composite evaluations of user experience.
Trust in Automation Scale (Jian et al., 2000): The trust in automation scale is a 12-item scale examining levels of mistrust with 5 items measuring mistrust of the system and 7 items measuring trust in a system. Items are anchored on a 7-point Likert scale with 1=not at all and 7- extremely. Validation and reliability for the scale are strong and reported in Jian et al. (2000). In the present study, during questionnaire development, one item measuring trust in AI was inadvertently left off the scale. In order to verify that the scale was still reliable for use in the study, we calculated the inter-item reliability of 6 remaining trust items, which, using a Cronbach alpha, was .94. This strategy is supported by Ellis & Sijtsma (2025). We additionally correlated the 6-item mean trust score to the distrust score composite. The correlation between trust and mistrust for this sample was -.52, p < .001. These are both comparable to scores reported by Jian et al. (2000), so we are confident in using the 6-item trust score in this study.
Technology Effects on Need Satisfaction in Life (TENS-Life: Peters et al., 2018). This scale measures how technology supports the three basic psychological needs of autonomy, competence and relatedness and is based on Self-Determination Theory. The present study used a 9-item version of the scale validated by Bergdahl et al. (2023). Participants were directed to respond to the questions as they related to their AI use at work. Reliabilities of the scale dimensions ranged from .81 to .93 across various samples.
3. Results
3.1. Descriptives on AI Use Variables Across Both Groups
Table 1 below presents means and frequencies for both groups sampled on demographic variables of interest. Significant differences between groups when they occur are also denoted within the table.
3.2. Group Differences in Attitudes Toward AI
A one-way MANOVA was conducted to examine whether Chinese and U.S. workers differed in positive and negative attitudes toward AI using GAAIS dimensions. Box’s test of equality of covariance matrices was significant, Box’s M = 71.88, p < .001, indicating that the assumption of equal covariance matrices was violated. Therefore, Pillai’s Trace was used to evaluate the multivariate effect.
There was a significant multivariate effect of the country on attitudes toward AI, Pillai’s Trace = .176, F(2, 416) = 44.41, p < .001, partial η² = .176. Follow-up univariate analyses indicated a significant country difference in positive attitudes toward AI, F(1, 417) = 25.35, p < .001, partial η² = .057. Chinese workers reported higher positive attitudes toward AI (M = 4.07, SD = 0.58) than U.S. workers (M = 3.67, SD = 1.03). A significant country difference was also found for negative attitudes toward AI, F(1, 417) = 15.22, p < .001, partial η² = .035. Chinese workers reported higher negative attitudes toward AI (M = 2.79, SD = 0.92) than U.S. workers (SD 2.39, SD = 1.19).
Levene’s tests were significant for both positive and negative attitudes (p < .001), indicating unequal variances. Robust Welch tests confirmed both country differences. The difference in positive attitudes remained significant, Welch’s F(1, 296.49) = 23.61, p < .001, as did the negative attitudes, Welch’s F(1, 366.09) = 15.22, p < .001.
3.3. Group Differences in Specific AI User Experience Qualities
A one-way MANOVA was conducted to examine whether Chinese and U.S. workers differed across eight item-level qualities of AI user experience: supportiveness, ease, efficiency, clarity, excitement, interest, inventiveness, and leading edge/novelty. Box’s test of equality of covariance matrices was significant, Box’s M = 85.15, p < .001, indicating that the assumption of equal covariance matrices was violated. Therefore, Pillai’s Trace was used to evaluate the multivariate effect.
There was a significant multivariate effect of country on the eight user experience dimensions, Pillai’s Trace = .057, F(8,411) = 3.10, p = .002, partial η² = .057. Follow-up univariate analyses indicated that the country significantly predicted ratings of excitement F(1,418) = 9.06, p =.003, partial η² = .021. Chinese workers reported greater excitement regarding their AI experience (M = 1.30, SD = 1.25) than U.S. workers (M = 0.91, SD = 1.41). No significant Country differences were found for supportiveness, ease, efficiency, clarity, interest, inventiveness, or leading-edge perceptions (See Table 2).
3.4. Group Differences in Trust in Automation
Two one-way ANOVAs were conducted to examine the differences between Chinese and American workers in their ratings of trust and mistrust in AI systems. Levene’s test for equality of variances was conducted and for both trust in AI and mistrust in AI, the test was not significant, indicating the group variances were equal. For the variable trust in AI, there was no significant difference between Chinese and U.S. workers, F(1,419) = 1.30, p > .05. For mistrust in AI, there was a significant difference between Chinese and U.S. workers, with Chinese workers reporting greater mistrust in AI than U.S. workers, F(1, 420) = 8.42, p < .01. Reports are presented in Table 3.
3.5. Group Differences in SDT-Related AI Attitudes
A one-way MANOVA was conducted to examine whether Chinese and U.S. workers differed in the extent to which AI technology was associated with autonomy, competence, and relatedness using TENS-Life dimensions. Box’s test of equality of covariance matrices was significant, Box’s M = 44.94, p < .001; therefore, Pillai’s Trace was used to evaluate the multivariate effect.
There was a significant multivariate effect of country on the three TENS-Life dimensions, Pillai’s Trace = .293, F(3, 418) = 57.83, p < .001, partial η² = .293. Follow-up univariate analyses showed a significant country difference in autonomy, F(1, 420) = 16.65, p < .001, partial η² = .038. Because higher scores represented less autonomy, Chinese workers (M = 7.50, SD = 2.50) reported lower AI-supported autonomy than U.S. workers (M = 6.50, SD = 2.55). A significant country difference was also found for competence, F(1, 420) = 69.05, p < .001, partial η² = .141. Because higher scores represented less competence, Chinese workers (M = 7.22, SD = 3.01) reported lower AI-supported competence than U.S. workers (M = 4.92, SD = 2.62). Country also had a significant effect on relatedness, F(1, 420) = 95.23, p < .001, partial η² = .185. Chinese workers reported greater AI-related relatedness (M = 10.06, SD = 2.80) than U.S. workers (M = 7.13, SD = 3.37). Levene’s test was significant for relatedness, p < .001, indicating unequal variances. The Welch test confirmed that the country difference remained significant, Welch’s F(1, 384.87) = 93.86, p < .001.
3.6. Mediation Analyses: Are AI-Related Autonomy, Competence, and Relatedness Associated with AI Use Through Trust and Mistrust?
Parallel mediation analyses were conducted separately for the U.S. and Chinese samples to examine whether trust and mistrust in AI mediated the relationship between autonomy, competence, and relatedness and weekly AI use. AI-use experience was included as a categorical covariate using dummy coding, with less than six months of AI experience serving as the reference category. Standardized estimates are reported and indirect effects were evaluated using 5,000 bootstrap samples and 95% confidence intervals. Because inference regarding indirect effects was based on the bootstrapped confidence intervals, an indirect effect was considered supported when the 95% bootstrap confidence interval excluded zero. For the Chinese sample, one bootstrap resample was unsuccessful; therefore, the confidence intervals were based on 4,999 successful bootstrap samples. Higher autonomy and competence scores reflected lower need satisfaction; therefore, coefficients involving these variables should be interpreted in the context of their specific scoring direction.
In the U.S. sample, autonomy was negatively associated with trust, β = -.208, p = .002, and positively associated with mistrust, β = .385, p < .001. Competence was positively associated with mistrust β = .168, p = .016, but was not associated with trust β = -.098, p = .146. Relatedness was positively associated with trust, β = .375, p < .001, and negatively associated with mistrust, β = -.143, p = .018. Additionally, trust in AI was positively associated with weekly AI use, β = 0.232, p = .014, while mistrust was not significantly associated with AI use, β = .173, p = .074. The direct effects of autonomy, competence, and relatedness on weekly AI use were not statistically significant when trust and mistrust were included in the model (autonomy: β = .004, p = .96; competence: β = .001, p = .994; relatedness: β = .096, p = .178).
The clearest indirect effect emerged for relatedness through trust. Greater relatedness was associated with greater trust in AI, which in turn was associated with greater AI use, β = .087, 95% CI [.02, .17], p = .023. The indirect effect of relatedness through mistrust was not supported, β = -.025, 95% CI [-.07, .001], p = .182. The combined indirect effect of relatedness through trust and mistrust was significant β = .062, 95% CI [.005, .129], p = .046. Relatedness also demonstrated a total effect on AI use, β = .158, 95% CI [.029, .272], p = .010. The indirect effect for autonomy through trust was also supported by the bootstrap confidence interval, β = -.048, 95% CI [-.119, -.01]. The indirect effect of autonomy through mistrust was not supported, β = .066, 95% CI [-.002, .154], p = .092, and the combined indirect effect of autonomy was nonsignificant, β = .018, 95% CI [-.039, .089], p = .57. Neither indirect pathway involving competence was supported (trust: β = -.023, 95% CI [-.070, .004], p = .203; mistrust: β = .029, 95% CI [<-.001, .091]), p = .197 and the combined indirect effect of competence was also nonsignificant, β = .006, 95% CI [-.027, .054], p = .757. See Figure 1 for a visual summary of the standardized path coefficients for the U.S. mediation model.
In the Chinese sample, autonomy was positively associated with mistrust, β = .346, p < .001, but was not significantly associated with trust, β = −.043, p = .650. Competence was negatively associated with trust, β = −.246, p = .006, and positively associated with mistrust, β = .340, p < .001. Relatedness was positively associated with trust, β = .506, p < .001, and negatively associated with mistrust, β = −.223, p < .001. Additionally, trust in AI was positively associated with weekly AI use, β = .148, p = .034, while mistrust was not significantly associated with AI use, β = −.069, p = .380.
Similar to the U.S. sample, none of the direct effects of the three basic psychological needs on weekly AI use were significant after including trust and mistrust (autonomy: β = −.042, p = .69; competence: β = .130, p = .28; relatedness: β = .058, p = .443). Relatedness demonstrated a significant indirect effect through trust, β = .075, 95% CI [.007, .148], p = .04. The indirect effect through mistrust was not supported, β = .015, 95% CI [-.018, .053], p = .39. The combined indirect effect of relatedness was significant β = .09, 95% CI [.006, .169], p = .03. Relatedness also demonstrated a significant total effect on weekly AI use, β = .148, 95% CI [.019, .271], p = .02. The indirect effect of competence through trust was supported by the bootstrap confidence interval, β = -.036, 95% CI [-.097, -.004]. The indirect effect of competence through mistrust was not supported, β = -.023, 95% CI [-.092, .025], p = .41. The combined indirect effect of competence was nonsignificant, β = -.06, 95% CI [-.148, .006] p = .12. Neither indirect pathway from autonomy to AI use was supported (trust: β = -.006, 95% CI [-.049, .018], p = .688; mistrust: β = -.024, 95% CI [-.093, .027], p = .415). Finally, the combined indirect effect was also not significant, β = -.03, 95% CI [-.108, .025], p = .36. See Figure 2 for a visual summary of the standardized path coefficients for the Chinese mediation model.
Overall, the two models showed several similar patterns. Relatedness demonstrated a significant combined indirect association with AI use in both samples, with it primarily operating through greater trust in AI. Trust, rather than mistrust, was also significantly associated with weekly AI use in both samples. Full indirect effects are presented in Table 4, and the standardized path coefficients are presented in Table 5.
4. Discussion
This study explored how working adults in China versus the United States use and experience AI in their workplaces. With the increase in AI implementation in workplaces across the world (Yotzov, 2026), understanding employees’ experiences with these technologies is becoming increasingly important. The present study contributes to this area by examining not only differences in AI use, but also attitudes toward AI, user experience, trust and mistrust, and the extent to which AI use affects workers’ basic psychological needs. We chose to focus on workers within the two largest global economies to understand this phenomenon.
Several differences emerged between the Chinese and U.S. samples. First, Chinese workers reported using AI for more hours each week at work and were more likely to report greater support from their organizations for the AI use. These findings are consistent with prior research suggesting relatively high levels of workplace AI adoption in China (Gillespie et al., 2025).
The research also illuminated differences in attitudes, user experiences and trust in AI between Chinese and U.S. workers. Chinese workers reported more positive feelings toward AI, but also more negative feelings toward AI than U.S. workers. Chinese workers also reported a higher level of mistrust in AI than the U.S. sample. Considered together, this set of findings is interesting and worthy of further exploration. No data was collected in this study that can adequately explain these findings, but several interesting explanations could be tested. Do Chinese workers have a more nuanced view of both the positive and negative benefits of AI use, perhaps because they use it more in their daily work tasks and see its facilitative effects? In China, AI software is overseen and monitored by the government, rather than being privatized by software companies. Does this increase negative feelings and lead to greater mistrust in AI? Or are Chinese workers seeing more flaws in AI applied to their work, thereby creating greater mistrust? Future research can certainly address these outstanding questions.
Perhaps surprising was the general lack of difference in user experience for AI across the two groups. The scale used to measure user experience asks participants to rate their satisfaction with 8 different dimensions related to use of a product including ease, efficiency, clarity, excitement, interest, inventiveness, and novelty. Although the overall multivariate analysis indicated a country difference across the user experience dimensions, excitement was the only individual dimension that significantly differed between the two samples, with Chinese workers reporting greater excitement toward their AI experience. Overall, these findings suggest that workers in the U.S. and China may experience many of the practical and experiential aspects of AI in similar ways, even while differing in how much they use AI and how they evaluate the technology.
A key aspect of this study was to examine motivational differences related to AI across groups. This study used Self-Determination Theory to examine these differences, focusing specifically on the basic psychological needs of autonomy, competence and relatedness. Univariate comparison found that Chinese workers reported significantly lower levels of autonomy and competence for AI, while reporting higher levels of relatedness for AI. How can these findings be interpreted? Surveillance of AI use could potentially be one explanation for lowered levels of autonomy. Public-facing generative AI services in China are subject to government filing, security assessment, content management, and other regulatory requirements, creating a more formally supervised AI environment than in many other countries (Cyberspace Administration of China, 2023, 2025). May competence be greater in U.S. workers because they can directly see the positive effects AI may have on task outcomes? Or because learning to use AI effectively provides a sense of challenge and satisfaction? These are reasonable explanations that can be explored in future studies.
The difference in relatedness for AI is particularly intriguing. Higher AI-based relatedness reflects the perception that AI has somehow brought workers closer to other people and created a sense of belongingness with a larger group. However, the present measure does not indicate where that sense of relatedness comes from. Does the higher level of relatedness in Chinese workers refer to their work groups and teams or do they feel belongingness with the AI as an anthropomorphized team member? In human factors, research in human-AI teaming (Schmutz et al., 2024) found that adding an AI team member led to lower trust, communication and underperformance. It may be the case that Chinese workers are changing how human-AI teaming is viewed and that a higher sense of relatedness toward AI will also result in greater trust and potentially better AI-human team performance.
Finally, we tested models linking the basic psychological needs to AI usage, using trust and mistrust as mediating variables. Support for basic psychological needs drives outcomes (Vansteenkiste et al., 2023), and the present findings suggest that trust may be one mechanism linking employee’s experiences with AI to how much they use the technology. Perhaps the most consistent finding across the two samples was the role of relatedness. In both the U.S. and Chinese samples, workers who reported that AI use contributed more to feelings of connection and belonging also reported greater trust in AI. In turn, greater trust was associated with more hours of AI use per week. The indirect relationship between relatedness and AI use through trust was supported in both samples, even after accounting for prior AI-use experience. These findings suggest that the social experience surrounding AI use may be important in shaping whether employees come to trust and use AI in their work. This pattern is consistent with previous literature linking basic psychological needs with attitudes toward AI and trust in AI. For example, Bergdahl et al. (2023) found that relatedness was associated with more positive attitudes toward AI across multiple countries. Additionally, Watermann et al. (2026) illustrated that trust in AI was associated with technology-related relatedness. Our findings extend this work by demonstrating that relatedness was indirectly associated with the amount of AI use through trust in both the U.S. and Chinese samples. Although AI implementation is often discussed in terms of efficiency, technical capability, or employee skill, these findings suggest that employees’ social experiences surrounding AI may also play an important role in how they respond to and use these technologies.
Another interesting finding was the role of trust compared with mistrust. Across both samples, trust in AI was positively associated with weekly AI use, while mistrust was not significantly associated with use. Rather than functioning as opposites, trust and mistrust may reflect different aspects of employees’ experiences with AI. Workers may recognize the limitations or have concerns about AI and still continue to use it, particularly if they also believe that the technology is useful or reliable enough to support their work. This finding is consistent with previous research showing that trust is important in how individuals respond to AI. Huynh and Aichner (2025) found that cognitive trust in generative AI was positively related to users’ attitudes, perceived performance, and behavioral intentions toward using the technology. Marimon et al. (2025) also found that trust played an important role in the relationship between generative AI use and employee outcomes.
At the same time, greater trust should not be automatically viewed as better. Research on trust in automation has emphasized the importance of calibrated trust, where the level of trust should match the actual capabilities and limitations of the system (Jian et al., 2000; Lee & See, 2004). Too little trust may result in employees avoiding useful technology, while too much trust may lead to overreliance or accepting inaccurate information without verification. The goal then may not simply be to increase employees’ trust in AI, but to help employees develop an appropriate level of trust in the systems they are using.
Autonomy and competence also showed some interesting patterns, although they were less consistent across the two samples. In the U.S. sample, lower AI-supported autonomy was associated with lower trust, and autonomy showed an indirect relationship with AI use through trust. In the Chinese samples, lower AI supported competence was associated with lower trust, and competence showed an indirect relationship with AI use through trust. These findings are consistent with the broader SDT literature, which emphasizes the importance of feeling a sense of choice and ownership over one’s behavior and feeling capable and effective in one’s work (Ryan & Deci, 2017; Vansteenkiste et al., 2023). Similar patterns have also emerged in research examining AI use, with autonomy and competence being associated with more favorable attitudes toward adopting generative AI at work and autonomy, competence, and technology-related relatedness associated with greater trust in AI (Dong et al., 2024; Watermann et al., 2026).
Our findings suggest that these needs may matter not only for how employees feel about AI but for how they develop trust in these systems. However, the autonomy and competence findings should be interpreted cautiously. The mediation models were tested separately, so the fact that autonomy emerged as an indirect pathway, while competence emerged in the Chinese sample does not mean that these pathways are statistically different across countries. Relatedness, on the other hand, appeared to play a more consistent role across the samples. This may suggest that feeling socially connected and supported in the context of AI is broadly important for trust, while autonomy and competence may be more dependent on the context in which the employees are using AI. For example, employees may differ in how much choice they have over whether and how they use AI, the level of training and support they receive, and whether AI is viewed as supporting or replacing their own capabilities. Broader organizational and cultural expectations could also shape an employee’s experience with AI.
Limitations and Future Research
The present study has several limitations that also provide important directions for future research. First, the data was cross-sectional, which limits conclusions about the direction of the relationships among the basic psychological needs, trust, and AI use. Although the mediational models are consistent with the proposed relationships among AI-related basic psychological needs, trust, and AI use, longitudinal and experimental research is needed to determine how these relationships develop over time. For example, employees’ experiences of autonomy, competence, and relatedness when using AI may contribute to the trust they develop in the technology, but continued AI use may also shape these psychological experiences.
Second, the U.S. and Chinese mediation models were estimated separately. As a result, differences in which indirect pathways emerged across the samples should not be interpreted as evidence that the effects themselves were statistically different across countries. Future research could use multi-group analyses to test these relationships directly.
Third, the study also relied primarily on self-reported perceptions and estimates of AI use. Employees’ reported hours of AI use may not fully reflect how often or in what ways they actually interact with the AI systems. Future studies could incorporate behavioral measures, system usage data, or organizational records to provide a more objective assessment of AI use.
Fourth, the study focused on full-time workers over the age of 25 in only two countries. We did not explore gender differences or occupational differences in AI use.
Fifth, the AI platforms most commonly used differed across the two samples. Chinese workers most often reported using Doubao, DeepSeek, Yuanbao, and ChatGPT, while U.S. workers most often reported using ChatGPT, Gemini, Copilot, and Claude. Some country differences in attitudes, trust, or user experience may therefore partly reflect differences in the AI systems used. Future research may compare users of the same AI platforms across countries.
Finally, one item from the original Trust in Automation Scale was inadvertently omitted during questionnaire development. Although the six remaining trust items demonstrated strong internal consistency, replication using the complete scale would provide additional confidence in the findings.
AI is fast becoming a tool and/or a team member across the world. Future research examining global differences in AI use would be a valuable addition to the literature. Another important area for future research is understanding human-AI teaming. As AI products become more prevalent, more accurate and more embedded in work, understanding how humans view their AI teammates and how to create effective human-AI teams will be a critical need.
5. Conclusions
The present study compared workplace AI use, attitudes toward AI, user experience, trust and mistrust, and AI-related basic psychological needs among workers in China and the United States. Several differences emerged in AI use, attitudes, mistrust, and employees’ experiences of autonomy, competence, and relatedness, while the two groups were relatively similar across most dimensions of AI user experience.
Perhaps most importantly, the mediation models showed a consistent role for relatedness and trust across both samples. Workers who reported greater feelings of connection and belonging associated with AI use, also reported greater trust in AI, and greater trust was associated with more weekly AI use. Trust rather than mistrust was consistently related to AI use across both samples. These findings suggest that understanding AI use in the workplace requires looking beyond whether employees have access to the technology or the skills to use it. How employees experience AI psychologically and socially may also be an important part of understanding whether they trust and continue to use these technologies.
Author Contributions
Conceptualization (TZ, VL and CF), Methodology (TZ, VL and CF), Formal Analysis (TZ, VL and CF), Investigation (TZ, VL and CF), Resources (TZ, VL and CF), Data Curation (TZ, VL and CF), Writing (TZ, VL and CF), Visualization (VL), Project Administration (TZ, VL, and CF).
Funding
This article received no external funding from any organization or institution.
Ethics
The research was approved by the Institutional Review Board of Florida Southern College.
Conflicts of Interest
None.
Abbreviations
The following abbreviations are used in this manuscript:
| AI | Artificial Intelligence |
| SDT | Self Determination Theory |
| IMF | International Monetary Fund |
| GDP UX GAAIS UEQ-S TENS-Life StDev. MANOVA ANOVA |
Gross Domestic Product User Experience General Attitudes toward AI Scale User Experience Questionnaire-Short Technology Effects on Need Satisfaction in Life Standard Deviation Multivariate Analysis of Varience Analysis of Variance |
References
- Amershi, S.; Weld, D.; Vorvoreanu, M.; Fourney, A.; Nushi, B.; Collisson, P.; Suh, J.; Iqbal, S.; Bennett, P. N.; Inkpen, K.; Teevan, J.; Kikin-Gil, R.; Horvitz, E. Guidelines for human-AI interaction. In Proceedings of the 2019 CHI Conference on Human Factors in Computing Systems, 2019; Association for Computing Machinery; pp. 1–13. [Google Scholar] [CrossRef]
- An, W.; Hu, L. Will AI replace me? The mechanism of employee AI challenge appraisal on Chinese employee career sustainability. Int. Commun. Chin. Cult. 2025, 12, 205–224. [Google Scholar] [CrossRef]
- Bergdahl, J.; Latikka, R.; Celuch, M.; Savolainen, I.; Soares Mantere, E.; Savela, N.; Oksanen, A. Self-determination and attitudes toward artificial intelligence: Cross-national and longitudinal perspectives. Telemat. Inform. 2023, 82, 102013. [Google Scholar] [CrossRef]
- Bick, A.; Blandin, A.; Deming, D. J.; Fuchs-Schündeln, N.; Jessen, J. 2026. Mind the Gap: AI Adoption in Europe and the US (NBER Working Paper No. w34995). National Bureau of Economic Research. Available online: http://www.nber.org/papers/w34995.
- Bonney, K.; Breaux, C. L.; Buffington, C.; Dinlersoz, E.; Foster, L. S.; Goldschlag, N.; Haltiwanger, J.C.; Kroff, Z.; Savage, K. Tracking firm use of AI in real-time: A snapshot from the business trends and outlook survey; National Bureau of Economic Research, 2024; Available online: http://www.nber.org/papers/w32319.
- Bonney, K.; Breaux, C. L.; Dinlersoz, E.; Foster, L. S.; Haltiwanger, J. C.; Pande, A. A. The microstructure of AI diffusion: Evidence from firms, business functions, and worker tasks; (NBER Working Paper No. 35141); National Bureau of Economic Research, 2026. [Google Scholar] [CrossRef]
- Chen, B.; Vansteenkiste, M.; Beyers, W.; Boone, L.; Deci, E. L.; Van der Kaap-Deeder, J.; Duriez, B.; Lens, W.; Matos, L.; Mouratidis, A.; Ryan, R. M.; Sheldon, K. M.; Soenens, B.; Van Petegem, S.; Verstuyf, J. Basic psychological need satisfaction, need frustration, and need strength across four cultures. Motiv. Emot. 2015, 39(2), 216–236. [Google Scholar] [CrossRef]
- Cyberspace Administration of China. Interim measures for the management of generative artificial intelligence services. 2023, July 13. [Google Scholar]
- Cyberspace Administration of China. Measures for labeling AI-generated synthetic content. 2025. [Google Scholar] [CrossRef]
- Cyberspace Administration of China. 2026. Announcement on registered generative artificial intelligence services. [Google Scholar]
- Deci, E. L.; Ryan, R. M. The “what” and “why” of goal pursuits: Human needs and the self-determination of behavior. Psychol. Inq. 2000, 11(4), 227–268. [Google Scholar] [CrossRef]
- Diebel, C.; Goutier, M.; Adam, M.; Benlian, A. When AI-based agents are proactive: Implications for competence and system satisfaction in human-AI collaboration. Bus. Inf. Syst. Eng. 2026, 68(2), 259–278. [Google Scholar] [CrossRef]
- Dong, E.; Liu, H.; Li, J.-Y.; Lee, Y. Motivating employee voicing behavior in optimizing workplace generative AI adoption: The role of organizational listening. Public Relat. Rev. 2024, 50(5), 102509. [Google Scholar] [CrossRef]
- Ellis, J. L.; Sijtsma, K. Proof of reliability convergence to 1 at rate of Spearman–Brown formula for random test forms and irrespective of item pool dimensionality. Psychometrika 2025, 89, 774–795. [Google Scholar] [CrossRef]
- Gillespie, N.; Lockey, S.; Ward, T.; Macdade, A.; Hassed, G. Trust, attitudes and use of artificial intelligence: A global study 2025; The University of Melbourne and KPMG, 2025. [Google Scholar] [CrossRef]
- Huynh, M.-T.; Aichner, T. In generative artificial intelligence we trust: Unpacking determinants and outcomes for cognitive trust. AI Soc. 2025, 40, 5849–5869. [Google Scholar] [CrossRef]
- International Monetary Fund. World economic outlook: GDP current prices; International Monetary Fund, April 2026; Available online: https://www.imf.org/external/datamapper/NGDPD@WEO/CHN/USA.
- Jian, J.-Y.; Bisantz, A. M.; Drury, C. G. Foundations for an empirically determined scale of trust in automated systems. Int. J. Cogn. Ergon. 2000, 4(1), 53–71. [Google Scholar] [CrossRef]
- Kemp, A. Organizational AI adoption jumps six points. Gallup 2026. [Google Scholar]
- Lee, J. D.; See, K. A. Trust in automation: Designing for appropriate reliance. Hum. Factors 2004, 46(1), 50–80. [Google Scholar] [CrossRef]
- Liao, Q. V.; Gruen, D.; Miller, S. Questioning the AI: Informing design practices for explainable AI user experiences. In Proceedings of the 2020 CHI Conference on Human Factors in Computing Systems, 2020; Association for Computing Machinery; pp. 1–15. [Google Scholar] [CrossRef]
- Lin, X.; Wang, T.; Sheng, F. Exploring the dual effect of trust in GAI on employees’ exploitative and exploratory innovation. Humanit. Soc. Sci. Commun. 2025, 12, 663. [Google Scholar] [CrossRef]
- Ling, S.; Zhang, Y.; Du, N. More is not always better: Impacts of AI-generated confidence and explanations in human-automation interaction. Hum. Factors 2024, 66(12), 2606–2620. [Google Scholar] [CrossRef]
- Marimon, F.; Mas-Machuca, M.; Akhmedova, A. Trusting in generative AI: Catalyst for employee performance and engagement in the workplace. Int. J. Hum.-Comput. Interact. 2025, 41(11), 7076–7091. [Google Scholar] [CrossRef]
- Pendell, R. AI use at work has nearly doubled in two years. Gallup 2025. [Google Scholar]
- Peters, D.; Calvo, R. A.; Ryan, R. M. Designing for motivation, engagement and wellbeing in digital experience. Front. Psychol. 2018, 9, 797. [Google Scholar] [CrossRef]
- Qian, C.; Wexler, J. Take it, leave it, or fix it: Measuring productivity and trust in human-AI collaboration. In Proceedings of the 29th International Conference on Intelligent User Interfaces, 2024; Association for Computing Machinery; pp. 370–384. [Google Scholar] [CrossRef]
- Rasheed, M. I.; Hameed, Z.; Singh, S. K.; Cooke, F. L. Thriving or drained? The dual effects of AI-autonomy on workers’ performance outcomes. Br. J. Manag. 2026, e70090. [Google Scholar] [CrossRef]
- Ryan, R. M.; Deci, E. L. Self-determination theory and the facilitation of intrinsic motivation, social development, and well-being. Am. Psychol. 2000, 55(1), 68–78. [Google Scholar] [CrossRef]
- Ryan, R. M.; Deci, E. L. Self-determination theory: Basic psychological needs in motivation, development, and wellness; Guilford Press, 2017. [Google Scholar]
- Ryan, R. M.; Vansteenkiste, M. Self-determination theory: Metatheory, methods, and meaning. In The Oxford handbook of self-determination theory; Ryan, R. M., Ed.; Oxford University Press, 2023; pp. 3–30. [Google Scholar] [CrossRef]
- Schepman, A.; Rodway, P. Initial validation of the general attitudes towards Artificial Intelligence Scale. Comput. Hum. Behav. Rep. 2020, 1, 100014. [Google Scholar] [CrossRef]
- Schepman, A.; Rodway, P. The General Attitudes towards Artificial Intelligence Scale (GAAIS): Confirmatory validation and associations with personality, corporate distrust, and general trust. Int. J. Hum.-Comput. Interact. 2023, 39(13), 2724–2741. [Google Scholar] [CrossRef]
- Schmid, J.; Puri, P.; Haim, A. AI development in the United States and China: Evidence from a new dataset of AI developer firms. RAND Research Report. 2026. Available online: https://www.rand.org/pubs/research_reports/RRA5043-1.html.
- Schmutz, J. B.; Outland, N.; Kerstan, S.; Georganta, E.; Ulfert, A. S. AI-teaming: Redefining collaboration in the digital era. Curr. Opin. Psychol. 2024, 58, 101837. [Google Scholar] [CrossRef]
- Schrepp, M.; Hinderks, A.; Thomaschewski, J. Design and evaluation of a short version of the User Experience Questionnaire (UEQ-S). Int. J. Interact. Multimed. Artif. Intell. 2017, 4(6), 103–108. [Google Scholar] [CrossRef]
- Shneiderman, B. Human-centered artificial intelligence: Reliable, safe & trustworthy. Int. J. Human–Computer Interact. 2020, 36(6), 495–504. [Google Scholar] [CrossRef]
- Stanford Institute for Human-Centered Artificial Intelligence. The 2026 AI index report; Stanford University, 2026. [Google Scholar]
- State Council of the People’s Republic of China. Report on the work of the government; The State Council of the People’s Republic of China, 2025. [Google Scholar]
- State Council of the People’s Republic of China. Report on the work of the government; The State Council of the People’s Republic of China, 2026. [Google Scholar]
- The White House. Winning the AI race: America’s AI action plan. 2025. [Google Scholar] [CrossRef]
- Vansteenkiste, M.; Ryan, R. M.; Soenens, B. Basic psychological need theory: Advancements, critical themes, and future directions. Motiv. Emot. 2020, 44(1), 1–31. [Google Scholar] [CrossRef]
- Vansteenkiste, M.; Soenens, B.; Ryan, R. M. Basic psychological needs theory: A conceptual and empirical review of key criteria. In The Oxford handbook of self-determination theory; Ryan, R. M., Ed.; Oxford University Press, 2023; pp. 84–123. [Google Scholar] [CrossRef]
- Watermann, L.; Lermer, E.; Kubowitsch, S. From AI use to positive functioning: The roles of trust and need satisfaction. Gr. Interaktion. Organ. Z. Für Angew. Organ. 2026, 57, 375–387. [Google Scholar] [CrossRef]
- Yotzov, I.; Barrero, J. M.; Bloom, N.; Bunn, P.; Davis, S.J.; Foster, K.M. Firm data on AI. (NBER Working Paper No. w34836).; Wang, B.Z., Ed.; National Bureau of Economic Research, 2026; Available online: http://www.nber.org/papers/w34836.
- Zhang, W.; Chang, P.-C.; Geng, X. When AI enables and undermines: Dual mechanisms linking AI usage to task performance. Humanit. Soc. Sci. Commun. 2026, 13, 1274. [Google Scholar] [CrossRef]
Figure 1.
Parallel Mediation Model for the U.S. Sample.
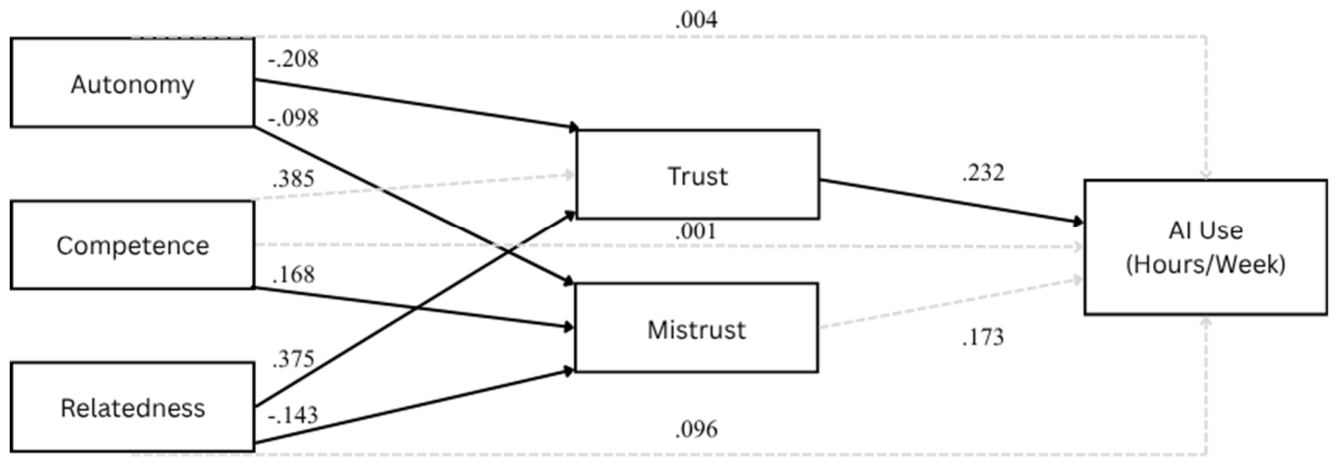
Figure 2.
Parallel Mediation Model for the Chinese Sample.
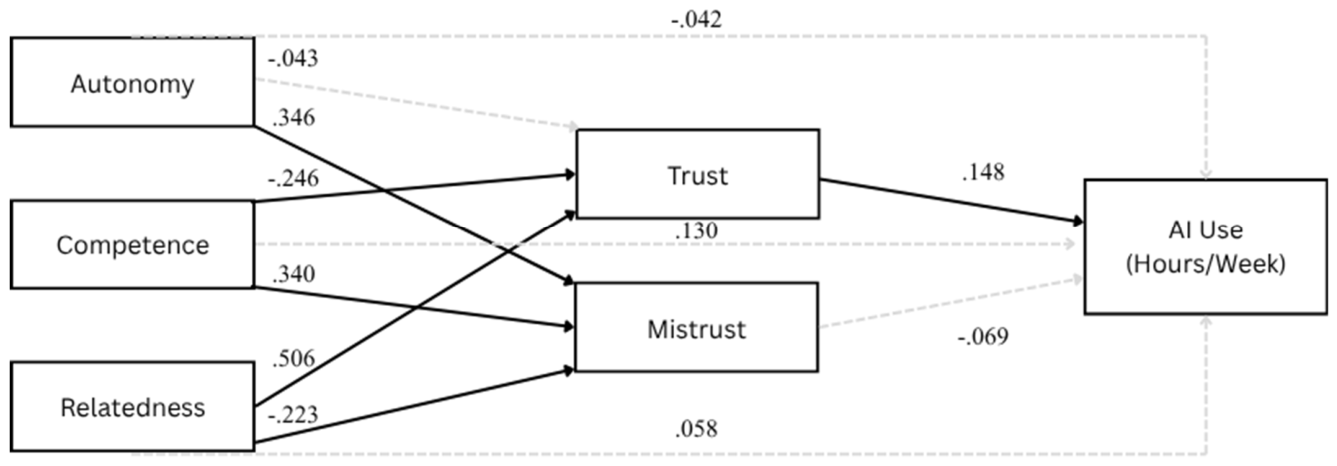

Table 1.
Differences between Chinese and U.S. Workers on Demographic Variables.
| Variable |
Mean/Frequency (StDev.) Chinese Group |
Mean/Frequency (StDev.) U.S. Group |
Significance |
| Age | 35.90 (9.30) | 42.01 (10.66) |
F(1,421) = 39.59 p < 0.01 |
| Hours Per Week of AI Use | 11.00 (11.85) | 7.67 (7.67) |
F(1,421) = 11.34, p < 0.01 |
| Gender | 126 male 99 female |
120 male 77 female 1 non-binary |
X2 = 2.18, ns |
| Career Field: Education/Academia Healthcare Technology/Eng. Business Creative Design Customer Service Government/Non-profit Manufacturing Other Retired |
26 2 14 51 32 48 8035 10 1 |
12020 48 45 31 18019 50 |
X2 = 23.21, p < 0.01 |
| Education Level: High school or less Some College AA/AS Degree BA/BS Degree MS Degree Post secondary Degree (LLd, Phd, Doctorate) |
13 17 128 59 80 |
17 35 19 91 32 4 |
X2 = 111.55, p < 0.01 |
| Leader/Manager: Yes No |
113 112 |
112 86 |
X2 = 1.70, ns |
| Years in Current Position | 9.25 (7.57) | 6.46 (6.09) |
F(1,420) = 17.12, p < 0.01 |
| Organization Approves of AI Yes No |
221 4 |
183 12 |
X2 = 5.45, p < 0.05 |
| Organization provides AI tools for work Yes No |
167 58 |
136 62 |
X2 = 1.59, ns |
Note: In addition to the differences reported above, Chinese workers reported that they used doubao, DeepSeek, Yuanbao (Tencent) and ChatGpt AI platforms most frequently, while U.S. workers reported using ChatGPT, Gemini, CoPilot and Claude most frequently.
Table 2.
Country Differences in AI User Experience Dimensions.
| User Experience Dimension | China M (SD) | U.S. M (SD) | F | p | Partial η2 |
| Supportiveness | 1.61 (1.26) | 1.39 (1.21) | 3.30 | 0.070 | 0.008 |
| Ease | 1.22 (1.25) | 1.34 (1.25) | 0.90 | 0.342 | 0.002 |
| Efficiency | 1.67 (1.17) | 1.60 (1.29) | 0.31 | 0.578 | 0.001 |
| Clarity | 1.38 (1.28) | 1.39 (1.27) | 0.01 | 0.919 | < 0.001 |
| Excitement | 1.30 (1.25) | 0.91 (1.41) | 9.06 | 0.003 | 0.021 |
| Interest | 1.43 (1.36) | 1.37 (1.38) | 0.15 | 0.695 | < 0.001 |
| Inventiveness | 1.28 (1.26) | 1.21 (1.36) | 0.30 | 0.586 | 0.001 |
| Leading Edge/Novelty | 1.38 (1.28) | 1.33 (1.24) | 0.13 | 0.719 | < 0.001 |
Table 3.
Country Differences in AI Trust and Mistrust.
| Variable | Chinese Mean | U.S. Mean | F-Value |
| Trust in AI | 4.81 (1.28) | 4.67 (1.32) | 1.30, ns |
| Mistrust in AI | 2.88 (1.29) | 2.49 (1.45) | 8.42* |
* p < 0.01.
Table 4.
Standardized Indirect Effects of Basic Psychological Needs on Weekly AI Use Through Trust and Mistrust in the U.S. and Chinese Samples.
Table 4.
Standardized Indirect Effects of Basic Psychological Needs on Weekly AI Use Through Trust and Mistrust in the U.S. and Chinese Samples.
| Predictor | Mediator | U.S. β | U.S. 95% CI | China β | China 95% CI |
| Specific Indirect Effects | |||||
| Autonomy | Trust | -0.048 | [-0.119, -0.010] | -0.006 | [−0.049, 0.018] |
| Autonomy | Mistrust | 0.07 | [-0.002, 0.154] | -0.024 | [−0.093, 0.027] |
| Competence | Trust | -0.023 | [-0.070, 0.004] | -0.036 | [−0.097, −0.004] |
| Competence | Mistrust | 0.03 | [<-0.001, 0.091] | -0.023 | [−0.092, 0.025] |
| Relatedness | Trust | 0.09 | [0.020, 0.173] | 0.075 | [0.007, 0.148] |
| Relatedness | Mistrust | -0.025 | [-0.073, 0.001] | 0.015 | [−0.018, 0.053] |
| Total Indirect Effects | |||||
| Autonomy | Combined | 0.018 | [−.039, .089] | -0.030 | [−.108, .025] |
| Competence | Combined | 0.006 | [−.027, .054] | -0.060 | [−.148, .006] |
| Relatedness | Combined | 0.062 | [.005, .129] | 0.09 | [.006, .169] |
Note: β = standardized indirect effect. Confidence intervals are 95% percentile-bootstrap confidence intervals; intervals excluding zero indicate a supported indirect effect.
Table 5.
Standardized Path Coefficients for the Parallel Mediation Models.
| Path | U.S. β | U.S. p | China β | China p |
| Autonomy -> Trust | -0.208 | 0.002 | -0.043 | 0.65 |
| Competence -> Trust | -0.098 | 0.146 | -0.246 | 0.006 |
| Relatedness -> Trust | 0.375 | < 0.001 | 0.506 | < 0.001 |
| Autonomy -> Mistrust | 0.385 | < 0.001 | 0.346 | < 0.001 |
| Competence -> Mistrust | 0.168 | 0.016 | 0.34 | < 0.001 |
| Relatedness -> Mistrust | -0.143 | 0.018 | -0.223 | < 0.001 |
| Trust -> Weekly AI Use | 0.232 | 0.014 | 0.148 | 0.034 |
| Mistrust -> Weekly AI Use | 0.173 | 0.074 | -0.069 | 0.38 |
| Autonomy -> Weekly AI Use | 0.004 | 0.964 | -0.042 | 0.687 |
| Competence -> Weekly AI Use | 0.001 | 0.994 | 0.13 | 0.277 |
| Relatedness -> Weekly AI Use | 0.098 | 0.178 | 0.058 | 0.443 |
Note: β = standardized path coefficient. Models controlled for AI-use experience, entered as a categorical covariate using dummy coding with less than six months as the reference category. Higher autonomy and competence scores represented lower need satisfaction; higher relatedness scores represented greater relatedness.
Disclaimer/Publisher’s Note: The statements, opinions and data contained in all publications are solely those of the individual author(s) and contributor(s) and not of MDPI and/or the editor(s). MDPI and/or the editor(s) disclaim responsibility for any injury to people or property resulting from any ideas, methods, instructions or products referred to in the content. |
© 2026 by the authors. Licensee MDPI, Basel, Switzerland. This article is an open access article distributed under the terms and conditions of the Creative Commons Attribution (CC BY) license.
Copyright: This open access article is published under a Creative Commons CC BY 4.0 license, which permit the free download, distribution, and reuse, provided that the author and preprint are cited in any reuse.