
Submitted:
05 October 2026
Posted:
09 October 2026
You are already at the latest version
Abstract
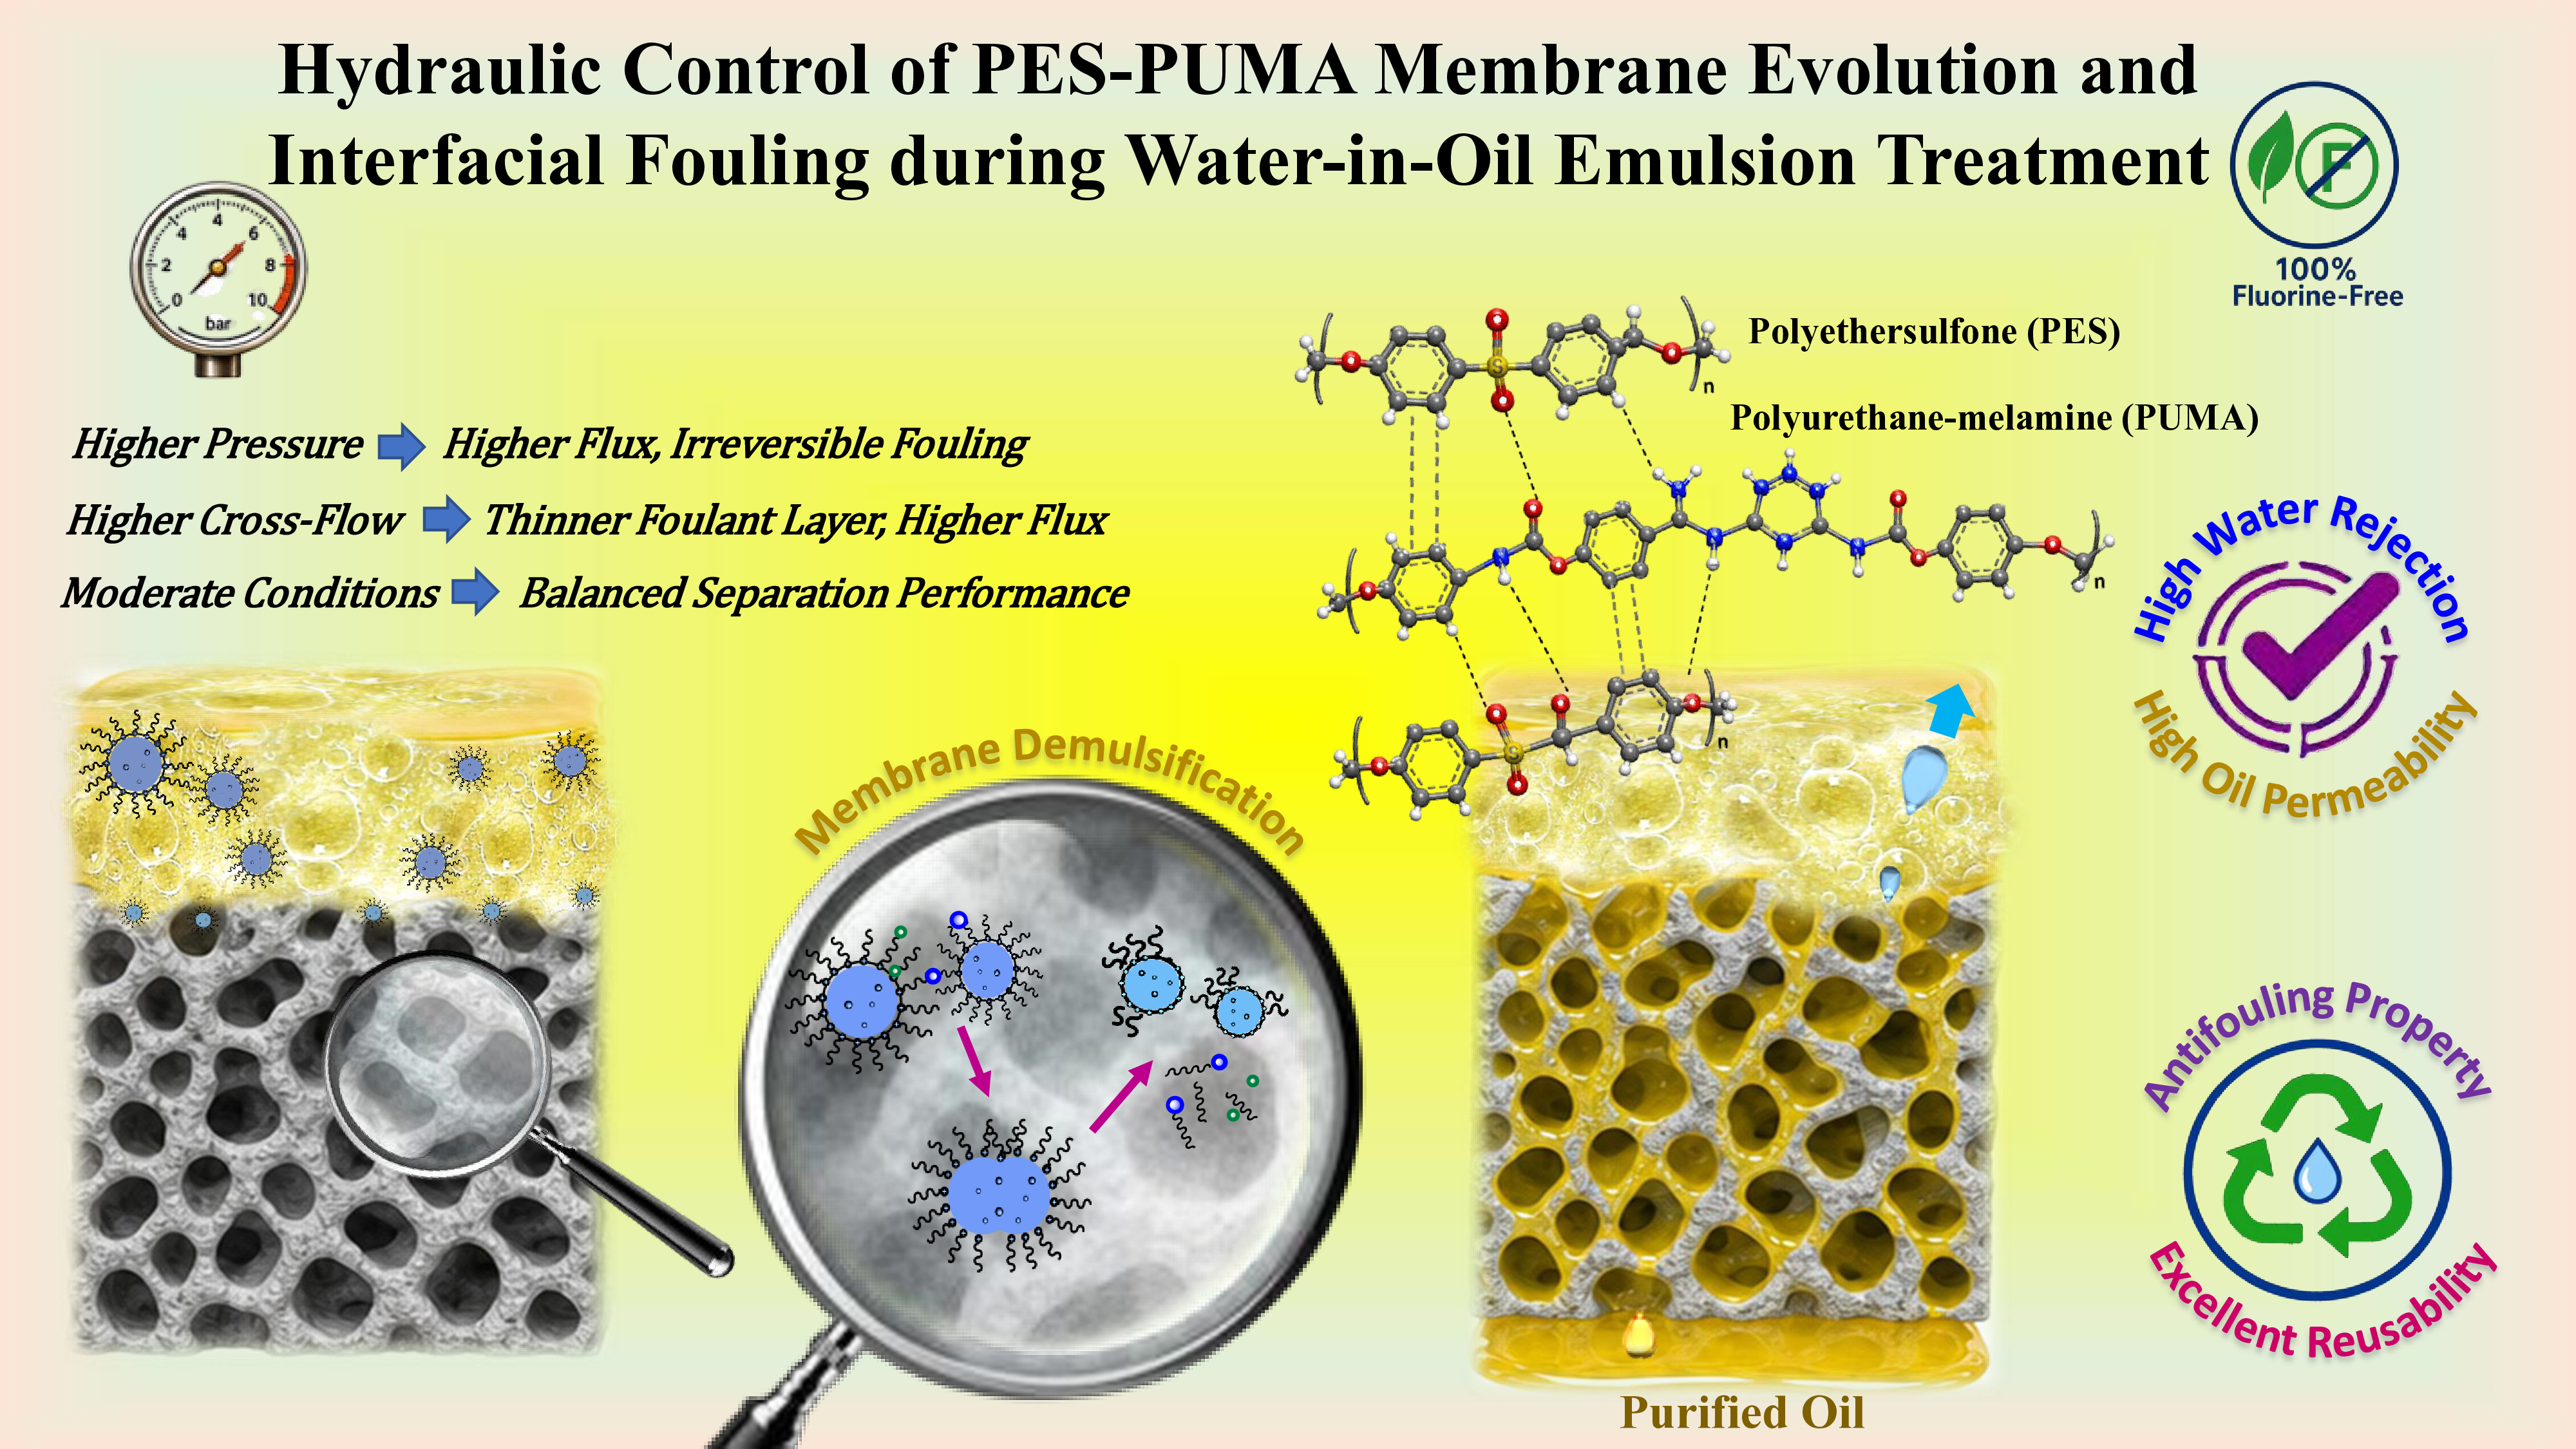
Water-in-oil (W/O) emulsion treatment is challenging because efficient membrane separation requires simultaneous control of oil transport, water rejection, interfacial interactions, and fouling resistance. However, the coupled effects of operating pressure and cross-flow hydrodynamics on membrane pore accessibility, foulant-layer evolution, and the permeability-rejection trade-off during cyclic W/O emulsion treatment remain insufficiently understood. In this study, a novel electrospun mesoporous polyurethane-melamine/polyethersulfone (PES-PUMA) membrane was evaluated for the separation of stabilized W/O emulsions under different operating pressures and feed flow rates. At an ultra-low pressure of 20 kPa, the membrane achieved an oil permeate flux of 36.5 ± 2.7 L m⁻² h⁻¹ and a water rejection of 93.1 ± 2.1%. Increasing the operating pressure to 100 kPa increased the oil permeate flux to 87.6 ± 3.5 L m⁻² h⁻¹, while decreasing water rejection to 78.2 ± 1.8%. Increasing the cross-flow from 0.05 to 0.5 mL s-1 increased the oil permeate flux from 23.4 ± 0.7 to 90.7 ± 2.1 L m⁻² h⁻¹, while decreasing water rejection from 95.3 ± 2.1% to 78.4 ± 1.2%. Although higher cross-flow reduced foulant-layer thickness and favored more reversible fouling, increasing operating pressure promoted pore constriction and compact foulant deposition. These findings establish a direct pressure-cross-flow-structure-fouling relationship, showing that hydraulic operating conditions regulate membrane transport pathways and fouling reversibility. This study provides a mechanistic insight into the interfacial and fouling behavior of mesoporous PES-PUMA membranes and establishes a basis for balancing permeability, water rejection, and fouling resistance during W/O emulsion separation.
Keywords:
modified polyethersulfone membrane
; mesoporous hydrophobic hybrid structure
; operating pressure and cross-flow effects
; water-in-oil emulsion
; interfacial fouling
1. Introduction
Membrane-based separation has emerged as an attractive engineering strategy for oily wastewater treatment, particularly in applications that require the simultaneous achievement of efficient phase separation, oil recovery, and sustainable process operation [1,2,3]. Conventional separation methods, including oil skimming, adsorption-filtration, gravity settling, coagulation-flotation, and centrifugation, enable preliminary separation but are generally constrained by low efficiency, high energy consumption, secondary pollution, and limited oil recovery capacity.
However, these conventional methods are generally ineffective for treating stable emulsions with small droplet sizes and complex interfacial interactions. Subsequently, hydrophobic membranes have been developed using various engineering strategies, including structural optimization [4], formation of nanoscale hierarchical structures [5], incorporation of multifunctional polymers [6,7], and advanced surface modification techniques [8,9]. These advancements aim to enhance the interfacial affinity, surface wettability, and antifouling properties of the membranes [10]. Accordingly, the development of green, energy-efficient, and scalable separation technologies for complex W/O emulsions and resource recovery is an urgent priority.
The high kinetic stability of surfactant-stabilized emulsions, primarily caused by high interfacial tension and droplet coalescence resistance, adversely affects the separation of W/O emulsions [11]. Consequently, synthesizing membranes capable of stable W/O emulsion separation remains a significant challenge.
The effect of operating pressure on the separation of W/O emulsions has been highlighted in the literature [12]. The high viscosity of the oil phase can adversely affect mass transport and permeate flux in the absence of operating pressure [12]. Hydraulic pressure plays a critical role in accelerating permeation and overcoming the critical capillary entry pressure (Laplace pressure) of dispersed phase. However, excessive pressure can cause two major problems: droplet deformation and pore blockage, which result in reduced oil permeability and water rejection, respectively. Despite this, the relationship among membrane structure, pressure, and separation performance in W/O separation remains poorly understood in the literature [13,14,15]. In addition, the dispersed phase content significantly influences the stability of W/O emulsions. Higher water content increases droplet–droplet and droplet–membrane interactions, which promote droplet coalescence and pore blockage at higher water contents, ultimately reducing separation stability. Therefore, evaluating membrane performance across a broad range of water contents is essential for understanding its practical applicability under realistic W/O conditions [16].
Polymers are widely used in membrane formulations because of film-forming ability, multi functional groups, mechanical stability, and adjustable surface properties [17]. PES has attracted considerable interest because of its hydrophobic nature, excellent chemical stability, and mechanical strength. However, currently available PES-based membranes reported to date are limited by inadequate pore structures, fouling, and insufficient mechanical robustness. The lack of hierarchical porous frameworks combining macropores and micropores increases oil transport resistance and restricts separation flux. Nevertheless, most PES membranes have been designed primarily for O/W emulsion separation, with relatively limited application to W/O emulsions. Therefore, the engineering of PES-based membranes with tailored hydrophobic and oleophilic structures for effective W/O separation remains a key research challenge.
Electrospun nanofibrous membranes are ideal for designing membranes with a high surface area, tunability, and interconnected channels [18]. To enhance surface properties such as wettability and functionality, blending functional nanofillers into the polymer matrix represents an effective and straightforward strategy [19,20]. However, weak interfacial interactions between the fillers and polymer matrix can lead to a reduced chemical stability and long-term durability [21,22,23].
Recent research has focused on developing robust and recyclable membranes capable of efficiently separating W/O emulsions under realistic operating conditions to address these limitations. Many high-performance membranes are based on poly(vinylidene fluoride) (PVDF) that exhibit excellent oil affinity. However, their application poses risks to marine ecosystems and freshwater resources because of the production of hazardous byproducts. Moreover, complex fabrication processes limit their scalability for treating oily wastewater in industrial settings [24]. Therefore, the development of fluorine-free membranes for W/O emulsion separation has become a critical research priority.
Porous organic polymers (POPs) have been extensively used for membrane modification. In particular, porous polyurethane-based materials have not been investigated as functional modifiers for PES membranes in W/O emulsion separation. Polyurethane–melamine (PUMA) structure is particularly attractive because of strong hydrogen-bonding interactions, structural flexibility, and enhanced thermal stability [12]. This combination could potentially improve the membrane robustness, oil transport pathways, and resistance to water intrusion.
Despite recent advances in membrane materials for emulsion separation, fluorine-free and scalable PES membranes specifically designed for stable W/O emulsion separation under realistic water content, hydraulic pressure, and thermal recovery conditions remain scarce. Notably, the incorporation of PUMA within electrospun PES membranes has not yet been explored. Additionally, membrane thickness is a critical factor influencing mass transport resistance, mechanical durability, and pressure tolerance of fibrous membranes.
To address these challenges, this study evaluated a novel fluorine-free electrospun PES membrane incorporating mesoporous PUMA for the efficient and sustainable separation of W/O emulsions. PUMA was synthesized and incorporated into the PES matrix, and the resulting PES–PUMA nanocomposite membranes were fabricated by electrospinning. The specific objectives of this study are to: (1) synthesize and fabricate PES–PUMA membranes with tailored surface roughness, interconnected porosity, and suitable hydrophobicity for selective oil transport; (2) systematically characterize their morphology, surface roughness, pore structure, porosity, and thermal stability; (3) evaluate W/O emulsion separation performance over a dispersed-water content of 10 vol%; (4) establish structure–property–performance relationships to elucidate how PUMA incorporation regulates membrane morphology, oil transport, and water intrusion; and (5) systematically investigate the effects of transmembrane pressure (20–100 kPa) and feed flow rate (0.05–0.50 mL s⁻¹) on oil permeate flux, water rejection, fouling evolution, and flux recovery, thereby identifying the hydraulic operating conditions that balance separation efficiency, permeability, and long-term fouling resistance. The overarching goal of these analyses is to establish a mechanistic framework linking membrane structure and hydraulic conditions with separation performance and fouling reversibility, thereby providing practical insights for the development of energy-efficient and sustainable membrane processes for oily wastewater treatment and resource recovery.
2. Materials and Methods
2.1. Materials
The synthesis of SiO2 NPs is based on hydrolysis and condensation reactions of tetraethyl orthosilicate (TEOS) in the presence of ammonia solution and ethanol. Porous PUMA was synthesized according to our previous work [12]. The stabilized W/O emulsion was prepared following our previously reported method [12]. A summary list of chemicals and materials, along with their purities, employed in membrane fabrication and emulsion preparation is presented in Supplementary Materials (Table S1).
2.2. Fabrication of PES–PUMA Membrane
Morphological characterization of the SiO2 nanoparticles, synthesized according to the Stöber method 25, is presented in the Supplementary Material (Figure S1). The presence of spherical particles (20–80 nm) provides a tunable framework, enabling the precise engineering of nanoscale pores within the PUMA scaffold after the etching process.
SiO2/PUMA nanocomposite (0.5 g ) was treated with an equal-volume mixture of DI water and HF solution (20 mL) to dissolve the silica template and synthesize the porous PUMA structure. The reaction was stirred for 6 hours to selectively remove the SiO2 template. The remaining polymeric framework was then washed several times with DI water and dried at 50 °C for 24 hours to obtain the mesoporous PUMA structure. Further experimental details of the synthesis and template-removal procedure have been transferred to the Supplementary Materials (Section 2.1).
The synthetic route for fabricating the hydrophobic PES and PES-PUMA membranes is illustrated in Scheme 1. For fiber collection, a rotating plate with a diameter of 15 cm was placed at a fixed distance from the needle tip, with a constant solution flow rate of 5 mL.h-¹. More information on membrane fabrication is provided in the literature [12].
For membrane fabrication, PES (0.3 g) was dissolved in DMF (5 mL) and magnetically stirred for 1 h to ensure complete dissolution of the polymer. Briefly, PUMA was incorporated into the PES solution to prepare PES-PUMA solutions. Each mixture was stirred for 2 h to obtain a homogeneous nanocomposite solution. The resulting materials were formulated as PES-PUMA(1.2), PES-PUMA(2.5), and PES-PUMA(4.7) membranes. The electrospinning setup consisted of four components including syringe, pump, high-voltage power supply, and a rotating cylindrical collector. The electrospinning parameters used in the membrane fabrication are presented in Supplementary Materials (Section 2.2, Table S2.).
2.3. Preparation of W/O Emulsion
W/O emulsions were formulated through the incorporation of Span 80 (nonionic surfactant) into a paraffin oil continuous phase. Initially, 100 mL of paraffin oil was mixed with 4 g Span 80. The mixture was vigorously mixed at 3000 rpm for 1 h using a high-shear homogenizer (Ultra-Turrax T25, IKA, Germany). Next, 10 mL of DI water was added dropwise to obtain an emulsion at a 10% (v/v) concentration. To improve the long-term stability of the W/O emulsions, sodium carbonate (0.7 g) and sodium chloride (0.5 g) were incorporated as stabilizing and ionic additives, respectively, and the resulting solution was mixed slowly for 4 h. The prepared W/O emulsions remained uniform, demonstrating no macroscopic phase separation for at least 24 h [12]. The physicochemical properties of paraffin oil and the rheological behavior (dynamic viscosity) of the W/O emulsions are comprehensively provided in the Supplementary Materials (Table S3 and Table S4).
2.4. Separation Experiments
A schematic layout of the bench-scale cross-flow filtration setup utilized throughout the experiments is depicted in Figure 1. Permeate extraction was regulated using an adjustable peristaltic pump configured to deliver constant hydraulic pressures between 20 and 100 kPa, thereby maintaining a consistent mass-transfer driving force. The fabricated thin-film membranes (effective surface area: 28.3 cm2, average thickness: 60-70 µm) were securely positioned within the membrane module. The oil permeate flux and water rejection parameters were determined in each separation experiment. All separation tests were carried out at room temperature under an identical cross-flow rate of 9 cm/s on the membrane interface. To determine the oil permeate flux, membranes were evaluated under various applied hydraulic of 20-100 kPa and feed flow rates of 0.05-0.50 mL/s. Continuous cross-flow filtration (10 cycles) was conducted for 320 min to evaluate permeability, fouling tendency, and water rejection performance.
Membrane separation experiments were performed under continuous cross-flow conditions for 30 min. The oil permeation flux, separation efficiency, and flux-decline behavior were evaluated using the procedures and equations provided in the Supplementary Material (Equations S1-S2). Membrane reusability was examined over ten successive filtration cycles. After each cycle, the proposed membranes were washed with n-hexane and dried at 50 °C for 1 h. Comprehensive descriptions of membrane and W/O emulsion characterizations, including governing equations for surface roughness, porosity, antifouling indices, and cyclic stability, are provided in the Supplementary Materials (Equations S3-10).
3. Results and Discussion
3.1. Characterization of PUMA Structure and PES-PUMA Membrane
3.1.1. Chemical and Crystal Structure Study
The FT-IR spectra of (a) PUMA structure, (b) PES-PUMA(4.7) after oil permeation, and (c) W/O emulsion (10% v/v) are presented in Figure 2. In the FT-IR spectrum of PUMA structure (Figure 2a), broad absorption bands appearing in the range of 3300 and 3415 cm-1 corresponds to stretching modes of the amine and secondary amine moieties. The sharp absorption peaks observed at 1634, 1669, and 1692 cm-1 are attributed to the C=N stretching vibrations of melamine aromatic rings. Furthermore, the disappearance of the absorption band at 1161 cm-1 demonstrates complete chemical leaching of the sacrificial silica nanoparticles [12]. The PES-PUMA(4.7) spectrum exhibits characteristic PES backbone vibrations, notably the S=O bands at 1151 and 1242 cm-1. The successful integration of PUMA into the PES matrix is confirmed by the distinct band at 1688 cm-1 [12].
After the oil permeation, the FT-IR spectrum of the PES-PUMA highlights the interaction of the membrane structure with the W/O emulsion (10% v/v)—is shown in Figure 2b. The intense peaks at 2856-2939 cm-1 are characteristic of the aliphatic C-H stretching vibrations from the paraffin oil retained within the membrane structure. The bands at 442 cm-1 are attributed to the NH and NH2 stretching vibrations, while the peaks at around 3071-3097 cm-1 are assigned to aromatic C-H vibrations of PES matrix. The existence of characteristic peaks associated with the aliphatic groups of the W/O emulsion confirms successful oil permeation and retention within the membrane structure. In FT-IR of W/O emulsion, a broad band centered around 3409 cm−1 is attributed to water droplets dispersed within the contineous phase, while the peaks at 2856-2942 cm-1 correspond to the aliphatic groups of the paraffin oil (Figure 2c).
The crystallographic characteristics of the synthesized PUMA structure and the PES-PUMA(4.7) membrane are shown in Figure 3. The diffraction pattern represents the multiple overlapping phases or a partially ordered PUMA structure. The XRD pattern of the PUMA structure exhibits a semi-crystalline nature, characterized by the combination of broad and sharp diffraction peaks (Figure 3a). The sharp and well-defined peaks in the 2θ range of 15-32o are attributed to the semi-crystalline domains, while the broad peaks beyond roughly 35° suggest an amorphous or less ordered phase of the PUMA structure, which may be ascribed to the disordered arrangement of long-chain segments in the polymer material. The broad diffraction features observed in the 2θ range of 25-29o can be attributed to the characteristic scattering of MA functional groups. This result is in good agreement with the XRD pattern of the MA (2ɵ : 21.74o, 22.14o, 26.28o, 26.51o, 28.90o, 29.89o and 35.91o [26] and PU (2ɵ: 19.0o, 21.35o, and 43.0o [27]. Furthermore, the absence of silica nanoparticle reflections (2ɵ: 36.5°, 39.5°,40.3°, 42.5°, 45.8°, and 56.9° [28] confirms the effective removal of the SiO2 template after etching process.
The XRD pattern of the PES-PUMA(4.7) membrane shows a broad diffraction peak located at 2θ of 18.1o (Figure 3b), which is characteristic of amorphous nature of PES matrix [29]. Compared with the pure PUMA structure, the disappearance of the sharp crystalline reflections suggests that the crystalline PUMA structure has been effectively dispersed within the amorphous PES matrix. These results indicate a high degree of compatibility between the PUMA structure and the PES matrix. This high degree of compatibility makes the membrane suitable for maintaining both structural integrity and stable permeability during the filtration process.
3.1.2. Surface Morphology Study
The surface morphology of the (a-e) PES and (f-j) PES-PUMA(4.7) membranes was studied by FE-SEM analysis, and the results are shown in Figure 4. Low-and high-magnification images were presented to provide an overview of the overall morphology and surface details, respectively. The low-magnification SEM image of the PES membrane exhibits a homogeneous and smooth surface without visible macroscopic defects, cracks, or delamination, indicating good membrane structural integrity (Figure 4a). The presence of PES nanofibers with diameters of approximately 400 nm, extending to micrometer-scale lengths, is clearly visible on the membrane surface (Figure 4b and Figure 4c). In addition, the membrane surface is predominantly populated with irregularly shaped pores, exhibiting an average pore diameter of approximately 380 nm (Figure 4d and Figure 4e).
The SEM image of the PES-PUMA(4.7) membrane revealed a highly rough and heterogeneous surface composed of aggregated nodules, bead-like domains, and interconnected fibrous features, indicating that the incorporation of PUMA substantially modified the membrane microstructure and promoted the formation of a heirarchical surface morphology (Figure 4f-h). High-magnification images confirmed the presence of localized, hollow, and donut-shaped particles on the PES-PUMA(4.7) membrane (Figure 4i and Figure 4j). In our previous study [12], the membrane surface was only described as inhomogeneous structure with partially aggregated features. However, the present images show new structural details of the heterogeneous membrane surface.
The SEM images of PES-PUMA (1.2 and 2.5) membranes are presented in the Supplementary Materials (Figure S2). These images show that increasing the PUMA content from 1.2% to 2.5% causes a marked alterations in the surface morphology. The density of irregular structures progressively increases with higher PUMA content, reaching its maximum in the PES-PUMA(4.7) membrane. The presence of discrete particles and interconnected electrospun nanofibers suggests a complex micro/nanostructure rather than a simple, smooth surface layer. This structure may be caused by phase separation and partial polymer aggregation during rapid solvent evaporation and solidification [30,31].
The cross-sectional SEM images of the (a and b) PES and (c and d) PES-PUMA(4.7) membranes are shown in Figure 5. Indexes “a” and “c” represent low-magnification images, while “b” and “d” denote the high-magnification images. Depending on the incorporation of PUMA into the structure of the PES membrane, the thickness of the resulting films varies within the range of 65 ± 7 μm. The surface structure of the resulting membrane is composed of a well-defined, multilayered porous structure associated with interconnected nanofibrous networks and submicron pores formed by the PES matrix (Figure 5a, c). The formation of a hierarchical framework with abundant hollow structures is linked to numerous interaction sites and continuous channels (Figure 5b, d). These structures provide effective pathways for fluid transport through the layered porous network. Therefore, the mesoporous structure and the hydrophobic nature of PUMA lead to increased oil permeability across the PES–PUMA(4.7).
FE-SEM cross-sectional of PES-PUMA(1.2) and PES-PUMA(2.5) membranes are provided in the Supplementary Materials (Figure S3). The structure of the PES membrane was markedly altered with increasing PUMA content in the PES matrix. The incorporation of higher PUMA concentrations promoted the formation of a greater number of pores and interconnected hollow channels, resulting in a porous structure. This morphological evolution is expected to facilitate fluid transport and improve membrane permeability through the membrane by reducing hydraulic resistance and enhancing pore connectivity.
3.1.3. Thermal Stability Study
The thermogravimetric behavior of the (a) PES membrane, (b) PUMA structure, and (c) PES-PUMA(4.7) membrane is shown in Figure 6. The TGA curves indicate that the samples undergo multi-step thermal decomposition. The PES membrane exhibits a cumulative weight loss of 79.1%, primarily attributed to solvent evaporation and the thermal decomposition of the PES matrix (Figure 6a). An initial weight loss of approximately 5.8% was observed in the temperature range of 30–244 °C. This phase is mainly associated with the desorption of physically adsorbed molecules and the removal of residual DMF solvent trapped within the membrane pores. These findings are in good agreement with the FT-IR analyses. The thermal degradation of the polymeric framework then proceeds through three distinct stages. The first decomposition stage was observed between 277 and 517 °C, yielding a weight loss of approximately 19.0% due to the initial polymer degradation. The second and most significant degradation stage occurred between 517 and 586 °C, with a mass loss of 30.2% and an inflection temperature at 560.26 °C, corresponding to the main cleavage of the ether and sulfone linkages. The final stage (586 to 800 °C), with a 24.1% weight loss, was related to the slow pyrolysis of the residues.
The PUMA structure exhibited a multi-step decomposition profile, beginning with an initial weight loss of 5% between 25 and 200 °C due to the evaporation of physically adsorbed DMF solvent (Figure 6b). Subsequently, the polymer underwent three distinct degradation stages. The first stage, occurring between 200 and 450 °C, showed a 17.1% mass loss corresponding to the cleavage of urethane and urea linkages. The second stage occurred between 450 and 600 °C, with a significant mass loss of 40.4% and a derivative maximum at 557.59 °C, reflecting the high thermal resistance of the aromatic backbone and melamine rings. The final pyrolytic decomposition stage (600–800 °C) resulted in a cumulative loss of 78.43%, leaving a 21.57% solid residue at 800 °C. This high thermal stability (557.59 °C) is primarily attributed to the restricted segmental mobility within the cross-linked network.
As illustrated in Figure 6c, the PES-PUMA(4.7) membrane exhibited a total weight loss of 98.9%. The thermal decomposition process began with a 5.0% weight loss in the temperature range of 30–240 °C, corresponding to the evaporation of residual solvents used during synthesis. Compared to the PES membrane, the incorporation of PUMA decreased the temperature of the main degradation stage from 560.26 °C to 443.50 °C. This major degradation stage, with 41.7% weight loss, indicates a reduction in thermal stability relative to the PES membrane, due to structural heterogeneity and interfacial stress between the PES and PUMA strucrures. An additional decomposition step of 11.3% was observed between 240 and 400 °C. Overall, the total weight loss of PES-PUMA(4.7) was 19.8% higher than that of the PES membrane, reflecting the lower thermal resistance of PES-PUMA(4.7) while still maintaining sufficient stability for low-to-moderate temperature membrane separations [46]. The PES-PUMA(4.7) blend exhibited improved thermal stability compared to the PUMA structure. This shift results from the rigid aromatic structure of PES and the restricted segmental mobility of the PUMA structure [46].
The thermal stability follows the order PES > PES–PUMA > PUMA, which agrees with the structural interactions observed in the TGA curves. The thermal shift and single-peak behavior suggest interfacial compatibility and molecular interactions between the PES matrix and the PUMA structure. These findings are in good agreement with the FT-IR and XRD analyses.
The thermal characteristics of the (a) PES membrane, (b) PUMA structure, and (c) PES-PUMA(4.7) membrane were evaluated by DSC analysis at a heating rate of 20 °C.min−¹, and the results are shown in Figure 7. No significant differences were observed for the three samples in the temperature range of 25–60 °C, which can be attributed to the removal of residual DMF and water molecules. The PES membrane, PUMA structure, and PES–PUMA(4.7) membrane exhibited distinct glass transition temperatures (Tg) at 222.1 °C, 237.1 °C, and 225.5 °C, respectively. The difference in Tg between the PES and PES–PUMA(4.7) membranes suggests that the incorporation of the PUMA structure affects the chain mobility and the thermal response of the membrane. In general, a decrease in cross-link density shifts the glass transition to lower temperatures, while the plasticizing effect of the PES matrix can further enhance the segmental motion of the polymer chains [48]. In addition, the presence of a single Tg in the PES–PUMA(4.7) membrane indicates good interfacial compatibility and possible intermolecular interactions between the PES matrix and the PUMA structure. The PES membrane exhibited two thermal degradation stages at 517.08–549.93 °C and 615.35–725.22 °C, with enthalpies of 471.1 J/g and 50941 J/g, respectively. The PUMA structure showed thermal degradation at 523–563 °C and 641.59–730.75 °C, with enthalpies of 436.2 J/g and 35628 J/g, respectively. The PES-PUMA(4.7) membrane displayed a single decomposition stage at 613.45–725.01 °C, with an enthalpy of 28732 J/g. These results suggest that incorporating the PUMA structure alters the membrane’s degradation behavior through two intermolecular interactions: hydrogen bonding and π–π stacking 12.
3.2. Characterization of Membrane After Separation Cycle
3.2.1. Pore Size Distribution and Porosity Determineation
The mean pore size, pore size distribution, and porosity of the PES–PUMA(4.7) membrane after different filtration and cleaning cycles are presented in Figure 8. As presented in Figure 8a, the pore size distribution of the PES-PUMA(4.7) membrane ranges from approximately 50 to 1000 nm, consistent with our previous study. After ten cycles, the membrane exhibited a narrower pore size distribution (~20–420 nm) and the main peak shifted from 360 to 310 nm, indicating pore constriction caused by foulant deposition and preferential blockage of larger pores (>500 nm). These changes suggest the formation of a cake layer on the membrane surface during separation cycles.
The mean pore size and porosity of the PES–PUMA(4.7) membrane decreased as the number of cycles increased (Figure 8b). The mean pore size after two and ten cycles was 387 nm and 278 nm, respectively, with corresponding porosities of 70% ± 6.0% and 54% ± 5.0%. These results indicate that the pore size range of interfiber voids within the PES-PUMA(4.7) membrane decreases due to the accumulation of water droplets and residual surfactant, leading to local structural inhomogeneity and pore blockage. Although the changes after two cycles were minor, a significant decline in porosity was observed after ten cycles. This reduced porosity restricts the permeation of the continuous oil phase. The narrowed pore size distribution and reduced mean pore size enhance the oil-phase selectivity of the PES–PUMA(4.7) membrane, whereas the loss of porosity may adversely affect long-term oil permeate flux.
3.2.2. Topography and Surface Roughness Study
The AFM images of the PES–PUMA(4.7) membrane after successive filtration cycles followed by cleaning are presented in Figure 9, including (a) the fresh membrane and the recycled membranes after (b) 2, (c) 4, (d) 6, (e) 8, and (f) 10 cycles. The roughened structure can markedly enhance the surface wettability, imparting excellent oleophilicity and hydrophobicity. The oil phase can rapidly penetrate into interior with low resistance under capillary action. In contrast, aqueous droplets retain a spherical shape with a high water contact angle, effectively preventing water penetration. Thus, the oil phase continuously permeates through the material as the filtrate, while dispersed aqueous droplets are retained above the surface, enabling efficient oil-water separation. The dark grooves visible in the AFM images indicate localized surface non-uniformities. The surface roughness of proposed membrane depends on the interplay between the characteristic size and morphology of the surface features and the size distribution of foulant particles and their aggregates. The deepest grooves in the PES–PUMA(4.7) membrane reached 365 nm (Figure 9a), which is significantly smaller than the membrane thickness (60 ± 7 μm). Moreover, the successful application of the electrospinning method resulted in a relatively smooth membrane surface.
The 3D and 2D AFM images reveal significant changes in membrane surface morphology after separation cycles. The fresh membrane exhibited a relatively rough and heterogeneous surface, whereas the recycled membranes showed progressive alterations, consistent with surface modifications induced by fouling and subsequent cleaning. Notably, the decrease in surface depth range from 365 nm to 124 nm suggests a reduction in surface roughness. This result is mainly due to (i) pore blocking and valley filling and (ii) the formation of a foulant-covered layer. It should be noticed that the membrane surface changes from a rough morphology to a relatively smoother, foulant-covered topography as separation progresses [32].
The interaction between the W/O emulsion and the PES-PUMA(4.7) membrane during the separation process can significantly alter the surface topography through multiple mechanisms, including oil adsorption, pore blockage, residual surfactant accumulation, deposition of fine impurities, and the formation of a heterogeneous fouling layer. It is important to note that membrane roughness is influenced by several factors, such as emulsion stability, droplet size distribution, surfactant concentration, the number of separation cycles, transmembrane hydraulic pressure, surface wetting, and the cleaning protocol [33,34]. The transition to a relatively smooth, foulant-covered morphology is associated with a progressive decline in oil permeate flux during W/O emulsion separation. However, the effect of surface roughness on oil permeate flux ultimately depends on the membrane structure and operating conditions [35].
Surface roughness plays a crucial role in modulating membrane fouling by influencing interfacial properties such as the contact area, the wetting state, and the accessibility of surface defects [36]. An increase in surface roughness can increase the effective surface area of the membrane and accelerate fouling [37,38]. Nevertheless, our results show that the separation operation can itself modify the membrane surface morphology and roughness over repeated cycles, which subsequently affects separation [39].
The surface roughness parameters of the PES–PUMA(4.7) membrane, obtained from AFM analysis after various separation and cleaning cycles, are presented in Table 1. The error in these measurements was evaluated by averaging high-precision profile measurements from at least three distinct scan lines. Based on the results, a consistent reduction in all roughness parameters including Rp, Rv, Ra, and Rq is observed as the number of separation cycles increases. Notably, Rp decreased from 235.65 nm for the fresh sample to 88.51 nm after ten cycles, while the Rv decreased from 129.35 nm to 35.49 nm. The decrease in peak heights and valley depths provides quantitative evidence for the “valley filling” effect, wherein deposited foulants, residual surfactants, and water droplets accumulate within the surface voids.
A comparison of these results confirms a significant smoothing of the membrane surface compared to the fresh sample, as indicated by the substantial decline in Ra (from 26.11 nm to 6.48 nm) and Rq (from 29.83 nm to 8.65 nm) values. The rough hydrophobic surface of the fresh membrane initially promotes a Cassie–Baxter wetting state by trapping air pockets within surface asperities, which reduces the solid–liquid contact area [40]. However, the accumulation of foulants within surface voids and the formation of a uniform cake layer on the membrane structure lead to reduced surface roughness. This correlation between decreasing Ra values and declining oil permeate flux, suggests that the initial surface irregularity enhances the capture of emulsified droplets, thereby accelerating pore blockage and cake layer formation.
3.3. Characterization of W/O Emulsion
3.3.1. Droplet Size Distribution
The droplet size distribution of the W/O emulsion (10% v/v water) before and after separation was analyzed by dynamic light scattering (DLS) (Figure 10). The primary emulsion exhibited a broad size distribution, ranging from 580 to 948 nm, with a mean diameter of 754 ± 37 nm (Figure 10a). The mean pore diameters of the PES membrane (468 ± 21 nm) and the PES-PUMA(4.7) membrane (374 ± 27 nm) were smaller than the average droplet size of the W/O emulsion.
The separation process is likely attributed to a synergistic combination of size-sieving, coalescence, and demulsification effects [41,42]. After separation, a significant reduction in both the range and average droplet size was observed for the filtrates. The mean droplet size of the filtrate decreased from 754.4 nm ± 24.6 to 72.8 ± 8.3 nm for the PES membrane and to 50.6 ± 9.1 nm for the PES-PUMA(4.7) membrane. The permeate of the PES membrane indicated the presence of smaller water droplets (Figure 10a). PES-PUMA(4.7) membrane yielded a highly transparent permeate (Figure 10b). These results indicate the high potential of PES-PUMA(4.7) membrane separation efficiency and enhanced demulsification performance compared to PES membrane.
3.4. Operating Parameters of Membrane Performance
3.4.1. Operating Pressure Effect
The influence of operating pressure on the oil permeate flux and water rejection efficiency of the PES-PUMA(4.7) membrane is presented in Figure 11. Increasing the operating pressure (from 20 to 100 kPa) led to an increase in oil permeate flux (from 36.5 ± 2.7 to 87.6 ± 3.5 L.m⁻².h⁻¹) and a reduction in water rejection (from 93.1 ± 2.1% to 78.2 ± 1.8%). This behavior indicates that higher pressure enhances oil permeation but slightly compromises rejection efficiency. Based on these results, an operating pressure of 60 kPa can be considered the most appropriate condition, as it provides a favorable compromise between flux and rejection performance.
Furthermore, a regression analysis confirmed this trend, showing that while flux increases with pressure, the rate of enhancement diminishes at higher levels. Analysis of the flux data reveals that in the 20–40 kPa range, the correlation is J = 1.415P + 10.15 (R² = 0.9461), shifting to J = 0.35361P + 53.34 (R² = 0.9615) as the pressure increases to 60 kPa. This drop in slope at higher pressures points to the limiting effects of concentration polarization and membrane compaction [43]. The decrease in rejection at higher pressures can be attributed to the increased compressive force on water droplets, which may facilitate droplet deformation and partial penetration into the membrane pores. The membrane maintained high rejection at all tested pressures and showed acceptable separation performance even at low operating pressure [44].
Notably, the PES-PUMA(4.7) membrane maintained high rejection efficiencies across all tested conditions, demonstrating effective separation even at an ultra-low pressure of 20 kPa. This stability up to 60 kPa highlights the membrane’s mechanical robustness for practical applications, although comprehensive assessments of its long-term durability remain a priority for future investigations. The superior performance is associated with the moderate hydrophobicity of the PUMA structure, which effectively hinders the transport of water droplets and surfactants through the membrane matrix
Statistical evaluation indicated that the uncertainty in the oil permeate flux increased slightly with rising pressure, whereas the uncertainty in water rejection remained nearly constant. Such variations suggest that the oil permeate flux increased slightly as the operating pressure rose from 20 to 100 kPa, whereas the uncertainty in water-rejection efficiency remained nearly constant throughout the investigated pressure range. You et al. (2020) reported that lower flux values in canola oil emulsion treatment are often linked to the presence of relatively smaller oil droplets [45].
The effect of operating pressure on the porosity of the PES-PUMA(4.7) membrane after each separation of a 10% (v/v) W/O emulsion is presented in Figure 12. The results indicate that the membrane porosity decreases with increasing operating pressure. This trend is primarily governed by membrane compaction and fouling effects. At ultra-low pressure (20 kPa), the hydraulic stress exerted on the membrane is relatively low, allowing the membrane to retain most of its pores, leading to a reduction of ~6.5% in mean pore size and ~10.0% in structural porosity. As the operating pressure increases, the greater compressive stress imposed on the membrane matrix induces partial pore deformation, thereby reducing the effective pore volume. At 100 kPa, the reduction in porosity becomes more pronounced owing to the combined influence of membrane compaction, pore blocking, and irreversible fouling effects [46,47].
To evaluate the effect of operating pressure on fouling behavior, the calculated reversible and irreversible flux decline rates for the PES-PUMA(4.7) membrane after ten separation cycles are presented in the Supplementary Materials (Figure S3). The flux decline became more pronounced as operating pressure increased, leading to a higher irreversible and a lower reversible component. This result indicates that the higher pressure enhanced foulant deposition and layer compaction on the membrane surface, making a greater portion of the flux loss difficult to recover by physical cleaning. The reversible component was more evident at low to moderate pressures (20–60 kPa), where deposited foulants were more easily removed by hydraulic cleaning. Although, the modified membrane structure effectively suppresses excessive foulant accumulation and maintains relatively good pore accessibility, these beneficial characteristics cannot completely prevent pressure-induced membrane compaction, internal pore blockage, and irreversible fouling at high operating pressures.
The cross-sectional morphology of the PES-PUMA(4.7) membrane is compared in Figure 13 before and after oil permeation at 20 kPa. The membrane exhibits a typical asymmetric structure with interconnected finger-like macrovoids beneath a thin layer (Figure 13a,b). However we showed a finger-like macrovoids in our previous study [12], which confirmed a layered and fibrous porous structure. This difference can be due to the FE-SEM image magnification. After oil permeation within the membrane structure, the cross-sectional morphology remains largely unchanged, indicating that the membrane maintains its structural integrity (Figure 13c,d). However, pores and hollow spaces were found to be filled with foulants (Figure 13c,d).
Additionally, the membrane surface is covered by a compact foulant layer containing numerous retained water droplets and surfactant-stabilized aggregates. The foulants partially block the pores and reduce the effective pore volume, leading to the observed decline in membrane porosity. Notably, no significant deformation or collapse of the finger-like support structure is observed, suggesting that the reduction in porosity primarily results from surface fouling and partial pore blockage rather than permanent structural damage, as supported by the fouling trends in the Supplementary Materials (Figure S3).
3.4.2. Feed Flow Rate Effect
The oil permeate flux and water rejection efficiency of the PES-PUMA(4.7) membrane as a function of feed flow rate during the separation of a W/O emulsion (10% v/v) water in paraffin oil are presented in Figure 14. The results show that increasing the feed flow rate significantly enhances the oil permeate flux, particularly at low flow rates, while causing a gradual decrease in water rejection efficiency. This reflects the trade-off between improved mass transfer and reduced separation performance. Increasing the feed flow rate in the range of 0.05 - 0.12 mL/s led to an increase in oil permeate flux from 23.4 ±0.7 to 46.5 ± 0.9 L·m⁻²·h⁻¹. The oil permeate flux increased from 85.9 ± 2.0 to 90.7 ± 2.1 L·m⁻²·h⁻¹ in the range of 0.35 - 0.50 mL/s.
The curves show a distinct transition from a steep to a more gradual increase in oil permeate flux at a feed flow rate of 0.28 mL/s. These results indicated a shift from a concentration-polarization-controlled regime to one dominated by membrane-intrinsic resistance. This behavior is attributed to the reduction of concentration polarization, as the increased crossflow velocity enhances convective mass transfer and shear stress, thereby decreasing the thickness of the polarization layer.
The tendency of the oil permeate flux to approach a plateau with further increases in feed flow rate indicates that concentration polarization is no longer the primary resistance to mass transport and that additional increases in crossflow provide only limited improvement in oil permeate flux. This behavior is consistent with the literature [48], in which enhanced crossflow hydrodynamics were shown to suppress concentration polarization, reduce external mass transfer resistance, and improve membrane permeation performance.
A decline in water rejection, from ~95% to ~78%, suggests that stronger hydrodynamic forces may also facilitate droplet deformation and possible partial penetration into surface pores, reducing rejection performance. Therefore, the feed flow rate should be optimized to balance the benefits of reduced concentration polarization and minimized fouling against the potential loss in water rejection. It should also be noted that the membrane’s hydrophilic/hydrophobic structure, the content of the dispersed phase, and the operating conditions can affect the results [49,50].
The effect of feed flow rate on the thickness of the deposited fouling layer was evaluated using cross-sectional and surface SEM images. The SEM images of PES-PUMA(4.7) membrane after the separation of W/O emulsion (10% v/v) at feed flow rates of (a) 0.05, (b) 0.20, (c) 0.35, and (d) 0.50 mL/s are shown in Figure 15. The left and right images represent the cross-sectional and surface views, respectively. The cross-sectional SEM images reveal a significant reduction in the thickness of the deposited fouling layer as the feed flow rate increases. The thickness of the foulant layer is 72.4 ± 8.5 μm at the feed flow rate of 0.05 mL/s (Figure 15a). As the feed flow rate increases to 0.20, 0.35, and 0.50 mL/s, the thickness of the foulant layer decreases to 65.6 ± 6.9 μm, 46.3 ± 5.8 μm, and 27.7 ± 4.3 μm, respectively. The observed decrease in thickness could be attributed to the increased hydrodynamic shear stress at higher flow rates [51]. The relatively weak shear force allows the foulants to accumulate more readily on the membrane surface, leading to the formation of a thick and compact cake layer at a low feed flow rate (0.05 mL/s),. This thick layer significantly increases the hydraulic resistance [52,53], which leads to a decline in the oil permeate flux. In contrast, increasing the feed flow rate generates higher shear stress at the membrane surface, which effectively removes the deposited foulants from the surface, resulting in a much thinner layer with lower hydraulic resistance. A rougher surface at lower flow rates is due to heavy deposition, whereas higher flow rates help maintain a cleaner membrane surface. In contrast, a thinner fouling layer observed at 0.50 mL/s minimizes the mass-transfer resistance near the membrane surface, leading to improved flux stability and reduced concentration polarization.
3.4.3. Separation Cycle Effects
The calculation results of (a) FRR and (b) Rt values for the PES-PUMA(4.7) membrane over successive separation cycles at various operating pressures are presented in Figure 16. The separation was performed using W/O emulsion (10% v/v) paraffin oil. PES-PUMA(4.7) was rinsed with n-hexane (10 mL) between cycles. The FRR decreased with increasing operating pressure, reaching 36.2% after ten cycles at 100 kPa, indicating severe irreversible fouling (Figure 16a). Whereas, the Rt values increased across the range of 20–100 kPa, demonstrating intensified membrane fouling (Figure 16b).
The relatively weak hydraulic driving force limited foulant transport, resulting in a thin, loosely attached, and largely reversible fouling layer at low operating pressures (20–40 kPa). This resulted in high FRR and low Rt values, indicating minimal flux loss. As the pressure increased to 40–60 kPa, the higher oil permeate flux promoted concentration polarization, which slightly reduced the FRR.
The observed decline in oil permeate flux at pressures of 60–80 kPa could be attributed to increased cake layer formation and hydraulic resistance. At operating pressures of 80–100 kPa, the fouling layer became increasingly compact due to pressure-induced compression, while foulants penetrated deeper into the membrane pores, resulting in the maximum Rt and lowest FRR values. These findings demonstrate that while higher pressures initially enhance oil permeate flux, they accelerate fouling and intensify flux decline. Another finding is that operating at moderate pressures may provide an optimal balance between oil permeate flux and fouling resistance.
The calculated values of (a) FRR and (b) Rt of PES-PUMA(4.7) of the PES-PUMA(4.7) membrane over successive separation cycles at various feed flow rates are presented in Figure 17. The FRR value slightly improved with increasing feed flow rate throughout the successive separation cycles (Figure 17a). Lower FRR values were observed at a low flow rate of 0.05 mL/s due to significant foulant accumulation, which reduced hydraulic cleaning. An increase in the feed flow rate led to an enhancement in the shear force at the membrane surface, thereby mitigating foulant deposition and facilitating the removal of loosely attached water foulants. A complementary trend was observed for the Rt (Figure 17b), which progressively decreased as the feed flow rate increased. The lower Rt values at higher flow rates indicate that the membrane experienced less overall flux decline during emulsion separation, owing to the suppression of concentration polarization and the reduced formation of a compact fouling layer. Although a slight increase in fouling was observed over repeated separation cycles, these results indicate that the PES–PUMA(4.7) membrane maintained stable separation performance and exhibited good resistance to irreversible fouling.
The normalized oil permeate flux and water rejection of the PES-PUMA(4.7) membrane during the separation of W/O emulsion (10% v/v) at an operating pressure of 60 kPa are shown in Figure 18. The normalized oil flux of the membrane gradually decreased over filtration time, where it lost 21% and 28% of its initial value after the third and fourth cycles, respectively. A notable decline in the normalized oil flux was seen after 10 cycles. This loss in the permeate flux is attributed to severe pore blockage. However, it is not possible to completely clog the membrane because the size of the water droplets (in the range of 50.6–72.8 nm) in the feed were significantly smaller compared to the pore size of the PES-PUMA (mean pore size of 374.4 ± 27 nm).
A similar trend was seen for the water rejection results, where a decline in the normalized water rejection was seen as the separation cycle increased. This behavior is attributed to the nano-sized water droplets, which may undergo partial deformation or localized coalescence at the membrane interface at moderate pressures, which fills the empty pores of the membrane. The increase in oil separation during successive cycles can be attributed to the formation of foulant layer on the membrane surface.
3.5. Comparative Study with the Literature
A comparison of the PES–PUMA(4.7) membrane’s performance with other polymeric membranes, including PES, POPs, polymeric, and ceramic membranes previously analyzed for water-in-oil (W/O) emulsion separation, is presented in Table 2. The membranes were produced through various methods such as phase inversion, electrospinning, and surface modification. Differences in method resulted in changes in membrane morphology and separation performance. Advanced electrospun and nanostructured membranes, including modified and unmodified polyethylene terephthalate (PET) [54], poly(vinylidene fluoride-co-hexafluoropropylene) (PVDF-HFP) [55], covalent organic frameworks/polyacrylonitrile (COF/PAN) [56], covalent microporous polymers (CMP) nanofibrous [57], and polyurethane/titanium carbide (Bio-PU/TiC) [58] exhibit excellent high oil permeate fluxes and water rejection. Nevertheless, multi-step fabrication strategies, the incorporation of hierarchical porous structures, and difficult fabrication method lead to challenges for large-scale production. Additionally, PES ultrafiltration and modified Si₃N₄ membranes have primarily focused on separation performance, with limited evaluation of long-term fouling behavior, cyclic filtration stability, and flux recovery.
The present study investigates the antifouling behavior and filtration resistance as a function of operating pressure during ten consecutive filtration cycles. The results demonstrate that increasing operating pressure progressively reduces the FRR because of membrane compaction and irreversible pore blockage under severe operating conditions. Furthermore, PES-PUMA membrane was fabricated through a simple electrospinning-assisted polymer blending strategy, avoiding complex post-modification procedures. To the best of our knowledge, systematic investigations of cyclic fouling dynamics under simultaneous variations in operating pressure and feed flow rate, and their influence on hydraulic stability and filtration resistance, remain scarce in the literature.
The schematic representation of the mechanism for W/O emulsion separation by the PES-PUMA(4.7) membrane is shown in Scheme 2. The proposed mechanism consists of (i) capillary pressure-driven oil transport, (ii) demulsification of the surfactant-stabilized W/O emulsion, and (iii) selective oil permeation facilitated by synergistic chemical interactions and capillary trapping of water droplets.
In the first step, the capillary pressure-driven transport of the oil phase is governed by the surface wettability and porous structure of the PES-PUMA (4.7) membrane. At moderate operating pressures (40–60 kPa), the applied hydraulic force facilitates the transport of the oil phase through the mesoporous pathways without exceeding the capillary entry pressure required for water intrusion. As the operating pressure increases, local deformation of water droplets and partial penetration at the pore entrance may occur, potentially affecting rejection performance.
In the second step, the presence of mesoporous PUMA within the PES matrix creates a rough micro- and nanoscale surface with interconnected channels. These features lead to demulsification, and increase droplet coalescence at the membrane interface. As water droplets grow through coalescence, the larger droplets exhibit lower Laplace pressure and phase separation. Additionally, interactions between Span 80 molecules and the functional groups present in PES and PUMA may contribute to weakening the stability of the surfactant layer, resulting in demulsification.
In the third step, the oil permeation process is enhanced by the chemical interactions between PES and PUMA, combined with the capillary trapping of residual water droplets within the porous structure. The aromatic segments present in both PES and PUMA create a chemically compatible environment for oil molecules through London dispersion forces. The integration of PUMA into the PES matrix via hydrogen bonding and π-π stacking interactions may facilitate oil permeation. Furthermore, the pore structure promotes efficient mass transfer while minimizing pore blockage, which enhances long-term separation performance.
4. Conclusions
This study demonstrates that the performance of the mesoporous PES-PUMA membrane during cyclic W/O emulsion separation is strongly governed by the coupled effects of operating pressure and cross-flow hydrodynamics on membrane structure, transport pathways, and fouling evolution. At 20 kPa, the membrane achieved an oil permeate flux of 36.5 ± 2.7 L m⁻² h⁻¹ with a high water rejection of 93.1 ± 2.1%. Increasing the pressure to 100 kPa enhanced the flux to 87.6 ± 3.5 L m⁻² h⁻¹, but reduced water rejection to 78.2 ± 1.8%, primarily because of membrane compaction, pore constriction, droplet deformation, and compact foulant deposition. In contrast, increasing the feed flow rate from 0.05 to 0.50 mL s⁻¹ increased the oil permeate flux from 23.4 ± 0.7 to 90.7 ± 2.1 L m⁻² h⁻¹, while decreasing water rejection from 95.3 ± 2.1% to 78.4 ± 1.2%. Higher cross-flow mitigated foulant accumulation and hindered the formation of a persistent foulant layer, thereby enhancing fouling reversibility; however, stronger hydrodynamic shear also intensified the permeability–selectivity trade-off by promoting higher flux at the expense of water rejection.
The combined pore-structure, surface-morphology, and flux-recovery analyses establish a direct pressure-cross-flow-structure-fouling relationship, indicating that hydraulic conditions actively regulate pore accessibility, foulant deposition, and the balance between reversible and irreversible flux loss. The principal significance of this work therefore extends beyond the performance evaluation of the PES-PUMA membrane by providing a mechanistic framework for understanding how hydraulic operating conditions govern separation behavior during cyclic W/O emulsion treatment. The findings of present study further show that increasing either operating pressure or cross-flow independently is insufficient to achieve optimal separation performance; rather, an appropriate pressure–cross-flow operating window is required to balance oil permeability, water rejection, and fouling resistance. This structure provides a rational basis for hydraulic optimization of hydrophobic membranes and supports the development of efficient, stable, and sustainable membrane processes for oily wastewater treatment and oil-water resource recovery.
Supplementary Materials
The following supporting information can be downloaded at the website of this paper posted on Preprints.org. The supplementary material includes the physical characteristics of paraffin oil, description of characterization procedure of membrane and W/O emulsion, cross-sectional SEM image of PES-based membranes, and the results of the reversible and irreversible components of PES-PUMA(4.7) membrane.
Author Contributions
The manuscript was written through the contributions of all authors. All authors have read and approved the final version of the manuscript.
Notes
The authors declare no competing financial interest.
Data Availability
The data supporting the findings of this study are available from the corresponding author upon reasonable request.
Acknowledgments
The authors gratefully acknowledge the financial support provided by the Iran National Science Foundation (INSF) under Grant No. 4040583. The author also would like to thank Hamedan University of Technology (Grant No. 404/10385).
Declaration of Competing Interest
The authors declare that they have no conflicts of interest.
References
- Bai, Z.; Deng, T.; Fang, Y.; Wang, P.; Jia, K.; Wang, Y.; Wu, T.; Yang, L.; Wei, J.; Yang, X. Fabrication of superwetting membranes with hierarchical rough interfaces via one-step phase inversion for oil/water separation. Sep. Purif. Technol. 2025, 383, 136182. [Google Scholar] [CrossRef]
- Wang, H.; Yang, R.; Wang, J.; Lou, K.; Fan, Y. β-FeOOH-Loaded polydopamine-modified halloysite nanotubes as a catalytic interlayer for enhanced water dissociation in bipolar membranes. Membranes 2026, 16, 296. [Google Scholar] [CrossRef]
- Li, M.; Wang, B.; Zhao, J.; Lv, L.; Xu, Z.; Xie, Z.; Wu, X.; Zhang, H.; Bai, G.; Lu, D. Effects of PVA/TiO2 composite hydrogel-modified PES ultrafiltration membranes on antibiotic removal performance and membrane fouling behavior. Membranes 2026, 16(9), 293. [Google Scholar] [CrossRef]
- Al-Ogaili, M. F. A.; Othman, M. H. D.; Rava, M.; Tai, Z. S.; Puteh, M. H.; Jaafar, J.; Rahman, M. A.; Kurniawan, T. A.; Samuel, O.; Imtiaz, A. Enhancing hydrophobic/hydrophilic dual-layer membranes for membrane distillation: the influence of polytetrafluoroethylene (PTFE) particle size and concentration. Sustainability 2023, 15(20), 14931. [Google Scholar] [CrossRef]
- Li, B.; Zhang, P.; Li, Z.; Xiang, S.; Li, C.; Zhang, A.; Guan, K.; Mai, Z.; Hu, M.; Yoshioka, T. Bioinspired hierarchical structure with intensified anti-scaling capacity for real seawater membrane distillation. Desalination 2025, 601, 118539. [Google Scholar] [CrossRef]
- Domke, A.; Woźniak-Budych, M.; Staszak, K. Enhancing hemodialysis through advanced polymeric membranes and improved material additives. Polym. Rev. 2025, 65(3), 735–776. [Google Scholar] [CrossRef]
- García, A.; Rodríguez, B.; Giraldo, H.; Quintero, Y.; Quezada, R.; Hassan, N.; Estay, H. Copper-modified polymeric membranes for water treatment: a comprehensive review. Membranes 2021, 11(2), 93. [Google Scholar] [CrossRef]
- Xu, X.; Cheng, S.; Lu, Z.; Li, P.; Xue, Y.; Yang, Y.; Ni, T.; Teng, J. Bioinspired multi-functional modified PVDF membrane for efficient oil-water separation. Sep. Purif. Technol. 2025, 358, 130410. [Google Scholar] [CrossRef]
- Cheng, L.; Xu, X.; Jiang, Y.; Zhang, S.; Xu, K.; Wang, H.; Zhang, X.; Zhang, R.; Jiang, Z. Antifouling membranes modified via chitosan derivatives for efficient oil-water separation. J. Membr. Sci. 2025, 727, 124082. [Google Scholar] [CrossRef]
- Li, Z.; Jin, R.; Gong, J.; Liu, W.; Li, J. Recent advances in anti-fouling oil–water separation membranes: a review focusing on active and passive anti-fouling strategies. J. Mater. Chem. A. 2025, 13(29), 23418–23438. [Google Scholar] [CrossRef]
- Yin, Q.; Liu, M.; Weng, H.; Zhang, Y.; Zhuang, X.; Xiao, A.; Xiao, Q. Fabrication and characterization of W/O emulsion stabilized by instantly soluble agar-leucine Maillard conjugates. Int. J. Biol. Macromol. 2025, 329, 147628. [Google Scholar] [CrossRef]
- Alavinia, S.; Bahramian, A. Highly efficient water-in-oil emulsion separation using hydrophobic mesoporous polyurethane–melamine / polyethersulfone membrane with enhanced chemical stability and antifouling properties. J. Membr. Sci. 2026, 757, 125849. [Google Scholar] [CrossRef]
- Guillen-Burrieza, E.; Servi, A.; Lalia, B. S.; Arafat, H. A. Membrane structure and surface morphology impact on the wetting of MD membranes. J. Membr. Sci. 2015, 483, 94–103. [Google Scholar] [CrossRef]
- Tomczak, W.; Gryta, M. Membrane distillation of saline water contaminated with oil and surfactants. Membranes 2021, 11(12), 988. [Google Scholar] [CrossRef]
- Al-Anzi, B. S.; Siang, O. C. Recent developments of carbon based nanomaterials and membranes for oily wastewater treatment. RSC Adv. 2017, 7(34), 20981–20994. [Google Scholar] [CrossRef]
- Zulkefli, N. F.; Alias, N. H.; Jamaluddin, N. S.; Abdullah, N.; Abdul Manaf, S. F.; Othman, N. H.; Marpani, F.; Mat-Shayuti, M. S.; Kusworo, T. D. Recent mitigation strategies on membrane fouling for oily wastewater treatment. Membranes 2021, 12(1), 26. [Google Scholar] [CrossRef]
- Wei, C.; Qiang, R.; Lin, L.; Gao, Y.; Ma, S.; Zhang, X.; Huang, X. Combing three-dimensional water channels and ultra-thin skin layer enable high flux and stability of loose polyimide/SiO2 nanofiltration membranes at low operating pressure via one step in-situ modification. J. Membr. Sci. 2021, 623, 118944. [Google Scholar] [CrossRef]
- Mousa, H. M.; Fahmy, H. S.; Ali, G. A. M.; Abdelhamid, H. N.; Ateia, M. Membranes for Oil/Water separation: a review. Adv. Mater. Interfaces 2022, 9(27). [Google Scholar] [CrossRef]
- Haider, A.; Haider, S.; Kang, I.-K. A comprehensive review summarizing the effect of electrospinning parameters and potential applications of nanofibers in biomedical and biotechnology. Arab. J. Chem. 2018, 11(8), 1165–1188. [Google Scholar] [CrossRef]
- Sarbatly, R.; Krishnaiah, D.; Kamin, Z. A review of polymer nanofibres by electrospinning and their application in oil–water separation for cleaning up marine oil spills. Mar. Pollut. Bull. 2016, 106(1-2), 8–16. [Google Scholar] [CrossRef]
- Yi, Z.; Zhu, L.-P.; Xu, Y.-Y.; Zhao, Y.-F.; Ma, X.-T.; Zhu, B.-K. Polysulfone-based amphiphilic polymer for hydrophilicity and fouling-resistant modification of polyethersulfone membranes. J. Membr. Sci. 2010, 365(1-2), 25–33. [Google Scholar] [CrossRef]
- Zhu, Y.; Wang, D.; Jiang, L.; Jin, J. Recent progress in developing advanced membranes for emulsified oil/water separation. NPG Asia Mater. 2014, 6(5), e101–e101. [Google Scholar] [CrossRef]
- Mousa, H. M.; Fahmy, H. S.; Ali, G. A. M.; Abdelhamid, H. N.; Ateia, M. Membranes for Oil/Water separation: a review. Adv. Mater. Interfaces 2022, 9(27), 2200557. [Google Scholar] [CrossRef]
- Peng, J.; Deka, B. J.; Wu, S.; Luo, Z.; Kharraz, J. A.; Jia, W. Rational design of PDA/P-PVDF@PP Janus membrane with asymmetric wettability for switchable emulsion separation. Membranes 2023, 13(1), 14. [Google Scholar] [CrossRef]
- Saldivar Ayala, D.; Namazu, T. Synthesis of SiO2 nanoparticles using the Stöber method and their self-assembly into liquid photonic crystals for surface stress sensing applications. MRS Adv. 2025, 10(3), 295–300. [Google Scholar] [CrossRef]
- Keshavarz, M.; Dekamin, M. G.; Mamaghani, M.; Nikpassand, M. Tetramethylguanidine-functionalized melamine as a multifunctional organocatalyst for the expeditious synthesis of 1,2,4-triazoloquinazolinones. Sci. Rep. 2021, 11(1), 14457. [Google Scholar] [CrossRef]
- Trovati, G.; Sanches, E. A.; Neto, S. C.; Mascarenhas, Y. P.; Chierice, G. O. Characterization of polyurethane resins by FTIR, TGA, and XRD. J. Appl. Polym. Sci. 2010, 115(1), 263–268. [Google Scholar] [CrossRef]
- Biradar, A. I.; Sarvalkar, P. D.; Teli, S. B.; Pawar, C.; Patil, P.; Prasad, N. R. Photocatalytic degradation of dyes using one-step synthesized silica nanoparticles. Mater. Today Proc. 2021, 43, 2832–2838. [Google Scholar] [CrossRef]
- Modi, R.; Mehta, R.; Brahmbhatt, H.; Bhattacharya, A. Tailor made thin film composite membranes: potentiality towards removal of hydroquinone from water. J. Polym. Environ. 2017, 25(4), 1140–1146. [Google Scholar] [CrossRef]
- Mulder, M. Basic principles of membrane technology; Springer science & business media, 2012. [Google Scholar]
- Guillen, G. R.; Pan, Y.; Li, M.; Hoek, E. M. Preparation and characterization of membranes formed by nonsolvent induced phase separation: a review. Ind. Eng. Chem. Res. 2011, 50(7), 3798–3817. [Google Scholar] [CrossRef]
- Chen, M.; Rietveld, L. C.; Heijman, S. G. J. Evaluation of membrane fouling at constant flux and constant transmembrane pressure conditions: Implications for membrane modification. J. Environ. Chem. Eng. 2025, 13(5), 117823. [Google Scholar] [CrossRef]
- Panda, S. R.; Bhandaru, N.; Mukherjee, R.; De, S. Ultrafiltration of oily waste water: Contribution of surface roughness in membrane properties and fouling characteristics of polyacrylonitrile membranes. Can. J. Chem. Eng. 2015, 93(11), 2031–2042. [Google Scholar] [CrossRef]
- Wu, J.; Wei, W.; Li, S.; Zhong, Q.; Liu, F.; Zheng, J.; Wang, J. The effect of membrane surface charges on demulsification and fouling resistance during emulsion separation. J. Membr. Sci. 2018, 563, 126–133. [Google Scholar] [CrossRef]
- Huang, S.; Ras, R. H.; Tian, X. Antifouling membranes for oily wastewater treatment: Interplay between wetting and membrane fouling. Curr. Opin. Colloid Interface Sci. 2018, 36, 90–109. [Google Scholar] [CrossRef]
- Zhao, D.; Chen, L.; Peng, M.; Xue, B.; Yao, Z.; Huang, W.; Wang, Z.; Liu, J. The complex influence of membrane roughness on colloidal fouling: A dialectical perspective. J. Membr. Sci. 2025, 725, 124014. [Google Scholar] [CrossRef]
- He, Z.; Lian, W.; Lv, Y.; Duan, Z.; Fan, Z. Review of the Mitigation Scale Performance of Anti-Fouling Coatings Surface Characteristics on Industrial Heat Exchange Surfaces. Coatings 2025, 16(1), 40. [Google Scholar] [CrossRef]
- Zaman, M. A.; Wang, S. Experimental investigation of surface roughness/wettability pattern effect on crystallization fouling over falling-film flow. Desalination 2024, 575, 117324. [Google Scholar] [CrossRef]
- Fu, L.; Li, M.; Wang, L.; Sun, J. Effects of membrane fouling, cleaning, and aging on ultrafiltration performance in water treatment systems. J. Clean. Prod. 2025, 533, 147030. [Google Scholar] [CrossRef]
- Roslee Ab Jamal, N. A. S.; Alias, N. H.; Othman, N. H.; Shahruddin, M. Z.; Shayuti, M. S. M.; Tan, Y. Z.; Jaafar, J.; Lau, W. J. A Mini Review on the limitations and challenges in membrane distillation: membrane wetting and fouling. J. Membr. Sci. Res. 2025, 11(3), e723747. [Google Scholar]
- Jin, K.; Ding, G.; Zhang, X.; Li, X.; Pei, L.; Zhang, H.; Yang, Q.; Liang, S.; Xu, L.; Wang, J. Dynamic demulsification coupling enhanced mass transfer effect enables efficient and stable oily wastewater separation. J. Environ. Chem. Eng. 2026, 14, 123288. [Google Scholar] [CrossRef]
- Wu, K.; Xu, J.; Jiang, Y.; Jiang, Y.; Yurekli, Y.; Yue, X.; Dai, Y.; Zhang, T.; Yang, D.; Qiu, F. In-situ self-assembly inverse beetle-like superhydrophobic ZIF-67-superhydrophilic/underwater superoleophobic membrane with efficient demulsification. Chem. Eng. J. 2026, 529, 172913. [Google Scholar] [CrossRef]
- Nguyen, T.-T.; Adha, R. S.; Field, R. W.; Kim, I. S. Extended performance study of forward osmosis during wastewater reclamation: Quantification of fouling-based concentration polarization effects on the flux decline. J. Membr. Sci. 2021, 618, 118755. [Google Scholar] [CrossRef]
- Hung, T.; Bilad, M.; Shamsuddin, N.; Suhaimi, H.; Ismail, N.; Jaafar, J.; Ismail, A. Confounding effect of wetting, compaction, and fouling in an ultra-low-pressure membrane filtration: a review. Polymers 2022, 14, 2073. [Google Scholar] [CrossRef]
- You, X.; Liao, Y.; Tian, M.; Chew, J. W.; Wang, R. Engineering highly effective nanofibrous membranes to demulsify surfactant-stabilized oil-in-water emulsions. J. Membr. Sci. 2020, 611, 118398. [Google Scholar] [CrossRef]
- Yang, L.; Zhao, F.; Lin, P.; Wang, C.; Li, Z.; Liu, W.; Wang, R.; Mei, Y.; Park, H.-D. Advanced membrane modifications for reverse osmosis fouling mitigation: mechanistic insights and practical applications. Desalination 2026, 638, 120526. [Google Scholar] [CrossRef]
- Hung, T. S.; Bilad, M. R.; Shamsuddin, N.; Suhaimi, H.; Ismail, N. M.; Jaafar, J.; Ismail, A. F. Confounding effect of wetting, compaction, and fouling in an ultra-low-pressure membrane filtration: A Review. Polymers 2022, 14(10), 2073. [Google Scholar] [CrossRef]
- Bacchin, P.; Aimar, P.; Field, R. W. Critical and sustainable fluxes: theory, experiments and applications. J. Membr. Sci. 2006, 281(1), 42–69. [Google Scholar] [CrossRef]
- Lee, A.; Elam, J. W.; Darling, S. B. Membrane materials for water purification: design, development, and application. Environ. Sci. Water Res. Technol. 2016, 2(1), 17–42. [Google Scholar] [CrossRef]
- Baker, R. W. Membrane technology and applications; John Wiley & Sons, 2023. [Google Scholar]
- Ladeg, S.; Moulai-Mostefa, N.; Ould-Dris, A.; Ding, L. Modeling of surface fouling on the surface of a rotating disk membrane using CFD and numerical study. Desalin. Water Treat. 2020, 190, 52–61. [Google Scholar] [CrossRef]
- Aslam, M.; Charfi, A.; Lesage, G.; Heran, M.; Kim, J. Membrane bioreactors for wastewater treatment: A review of mechanical cleaning by scouring agents to control membrane fouling. Chem. Eng. J. 2017, 307, 897–913. [Google Scholar] [CrossRef]
- Field, R. W.; Wu, J. J.; Fane, A. G. Revisiting the distinct concepts of critical flux and threshold flux. J. Membr. Sci. 2026, 741, 124961. [Google Scholar] [CrossRef]
- Dansawad, P.; Li, Y.; Cao, L.; Gao, H.; Yang, C.; Huang, E.; You, S.; Li, W. An unmodified recycled polyethylene terephthalate (PET) nanofibrous membrane for water-in-oil and oil-in-water emulsions separation. Colloids Surf. A Physicochem. Eng. Asp. 2024, 696, 134335. [Google Scholar] [CrossRef]
- Yang, X.; Zhang, X.; Wang, H.; Chase, G. G. Vibration assisted water-diesel separation by electrospun PVDF-HFP fiber mats. Sep. Purif. Technol. 2016, 171, 280–288. [Google Scholar] [CrossRef]
- Zhang, Z.; Han, N.; Tan, L.; Qian, Y.; Zhang, H.; Wang, M.; Li, W.; Cui, Z.; Zhang, X. Bioinspired superwettable covalent organic framework nanofibrous composite membrane with a spindle-knotted structure for highly efficient Oil/Water emulsion separation. Langmuir 2019, 35(50), 16545–16554. [Google Scholar] [CrossRef]
- Zhang, Y.; Yi, A.; Ren, Y.; Niu, C.; Jiang, J.; Zhu, Z.; Jiao, R.; Sun, H.; Li, A. In-situ preparation of CMPs based electrospun nanofibrous composite membranes for effective air filtration and oil–water separation. Chem. Eng. J. 2025, 512, 162316. [Google Scholar] [CrossRef]
- Zhang, Y.; Wang, D.; Huang, Z.; Zhang, H.; Li, L. An environment-friendly polyurethane composite membrane decorated by superhydrophobic modification of TiC as high efficient separator of oil-water emulsion. J. Membr. Sci. 2022, 662, 121000. [Google Scholar] [CrossRef]
- Akhmadiev, M.; Dryakhlov, V.; Shaikhiev, I. Modeling the process of ultrafiltration separation of water-oil emulsion by polyetsulfone membranes. Her. Technol. Univ. 2025, 28(1), 89–93. [Google Scholar] [CrossRef]
- Wang, J.-W.; Abadikhah, H.; Yin, L.-J.; Jian, X.; Xu, X. Multilevel hierarchical super-hydrophobic ceramic membrane for water-in-oil emulsion separation. Process Saf. Environ. Prot. 2023, 175, 361–368. [Google Scholar] [CrossRef]
- Chen, H.; Zuo, Z.; Tian, Q.; Xue, S.; Qiu, F.; Peng, X.; Zhang, T. Waste to treasure: A superwetting fiber membrane from waste PET plastic for water-in-oil emulsion separation. J. Clean. Prod. 2023, 396, 136502. [Google Scholar] [CrossRef]
- Khan, A. A.; Siyal, M. I.; Kim, J.-O. Fluorinated silica–modified anti–oil-fouling omniphobic F–SiO2@PES robust membrane for multiple foulants feed in membrane distillation. Chemosphere 2021, 263, 128140. [Google Scholar] [CrossRef]
Scheme 1.
Fabrication strategy and synthesis pathway for the PES-PUMA composite membrane.
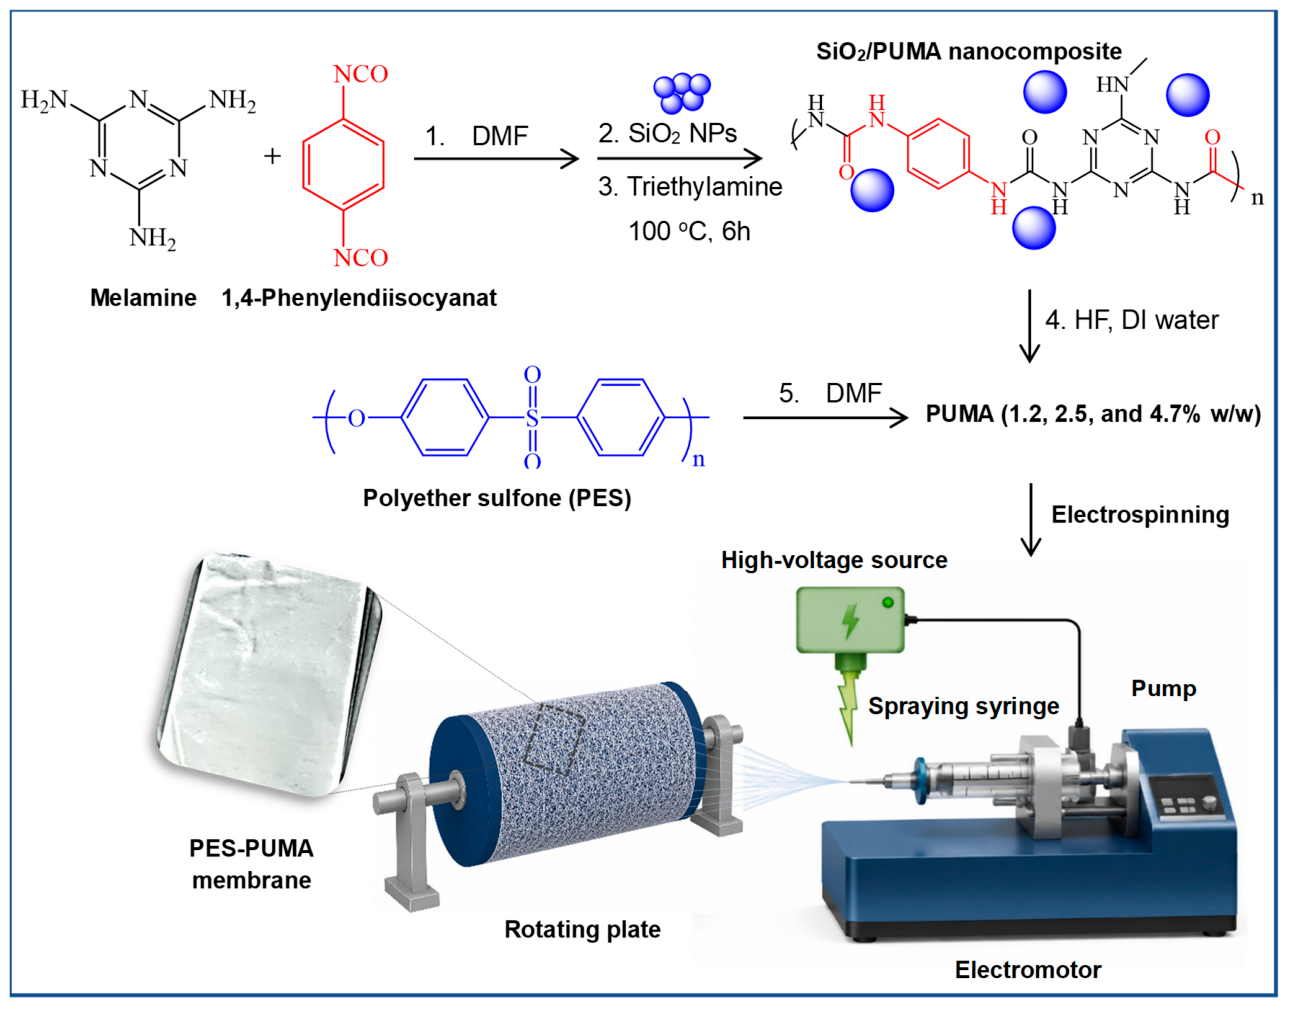
Figure 1.
The view of a laboratory-scale cross-flow separation unit [1: pump, 2: W/O emulsion, 3: pipes and fittings, 4: stainless steel membrane cell, cell outlet, 5: permeated oil, 6: pressure gauge, 7, discharge valve].
Figure 1.
The view of a laboratory-scale cross-flow separation unit [1: pump, 2: W/O emulsion, 3: pipes and fittings, 4: stainless steel membrane cell, cell outlet, 5: permeated oil, 6: pressure gauge, 7, discharge valve].
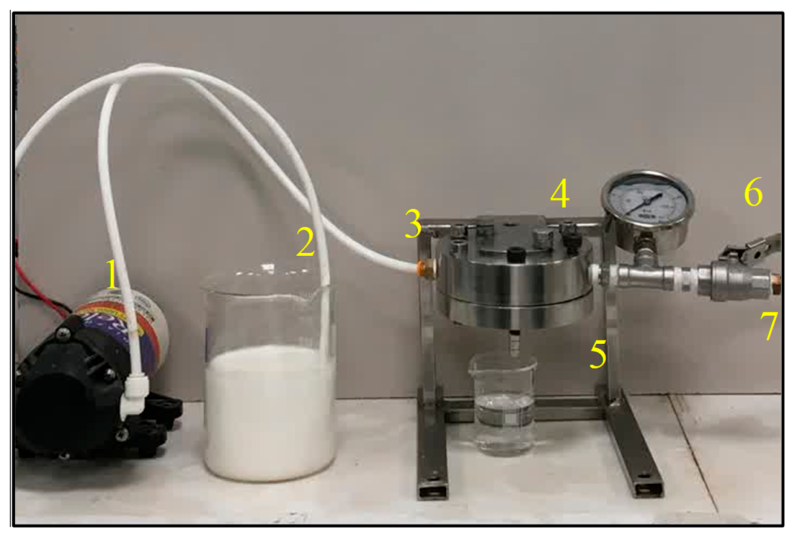
Figure 2.
FT-IR spectra of (a) PUMA structure 12, (b) PES-PUMA(4.7) membrane after oil permeation, and (c) W/O emulsion (10% v/v).
Figure 2.
FT-IR spectra of (a) PUMA structure 12, (b) PES-PUMA(4.7) membrane after oil permeation, and (c) W/O emulsion (10% v/v).
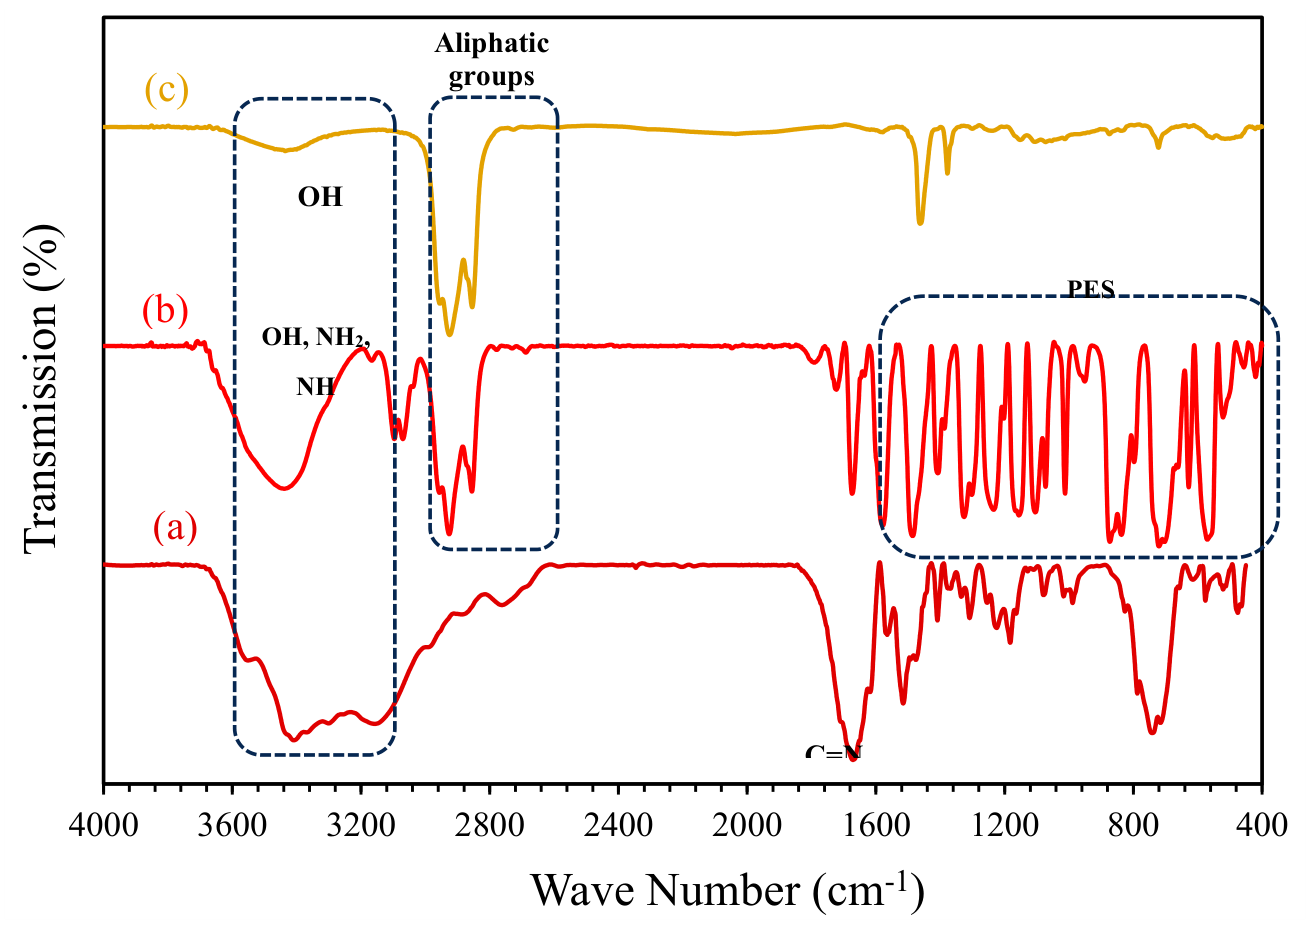
Figure 3.
XRD spectrum of (a) synthesized PUMA powder, and (b) PES-PUMA(4.7) membrane.
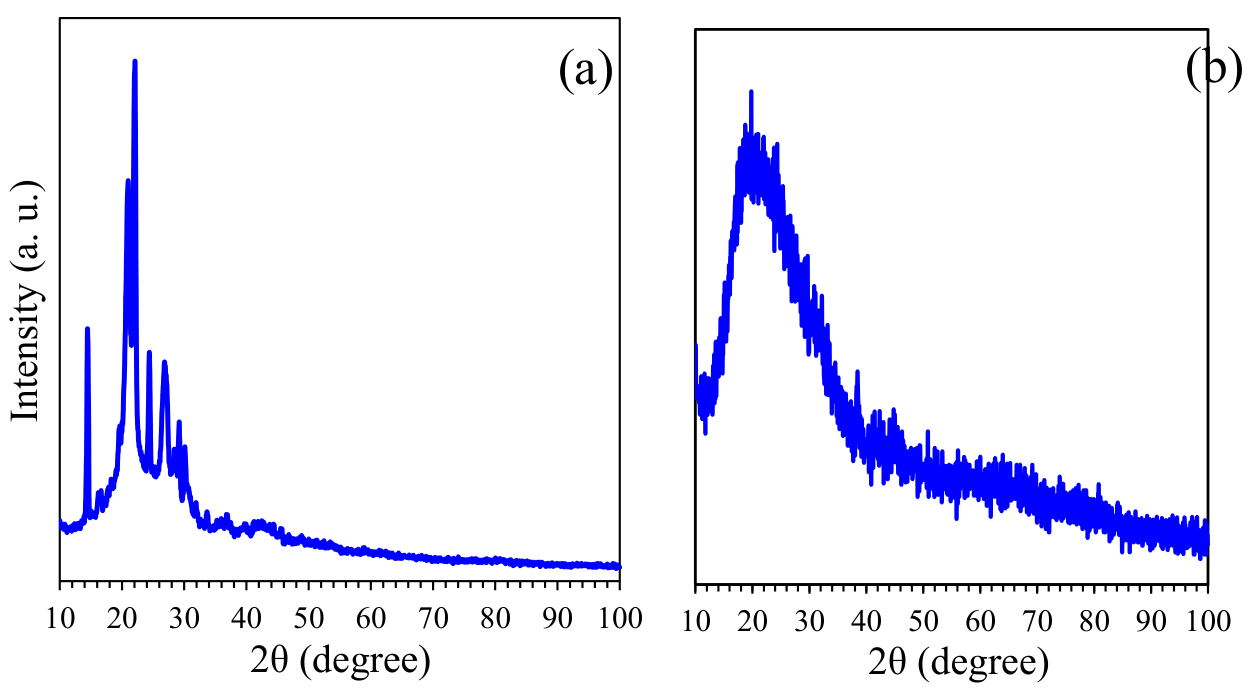
Figure 4.
FE-SEM images of (a-e) PES and (d-f) PES-PUMA(4.7) membrane under under low- and high-magnification views (left to right, respectively).
Figure 4.
FE-SEM images of (a-e) PES and (d-f) PES-PUMA(4.7) membrane under under low- and high-magnification views (left to right, respectively).
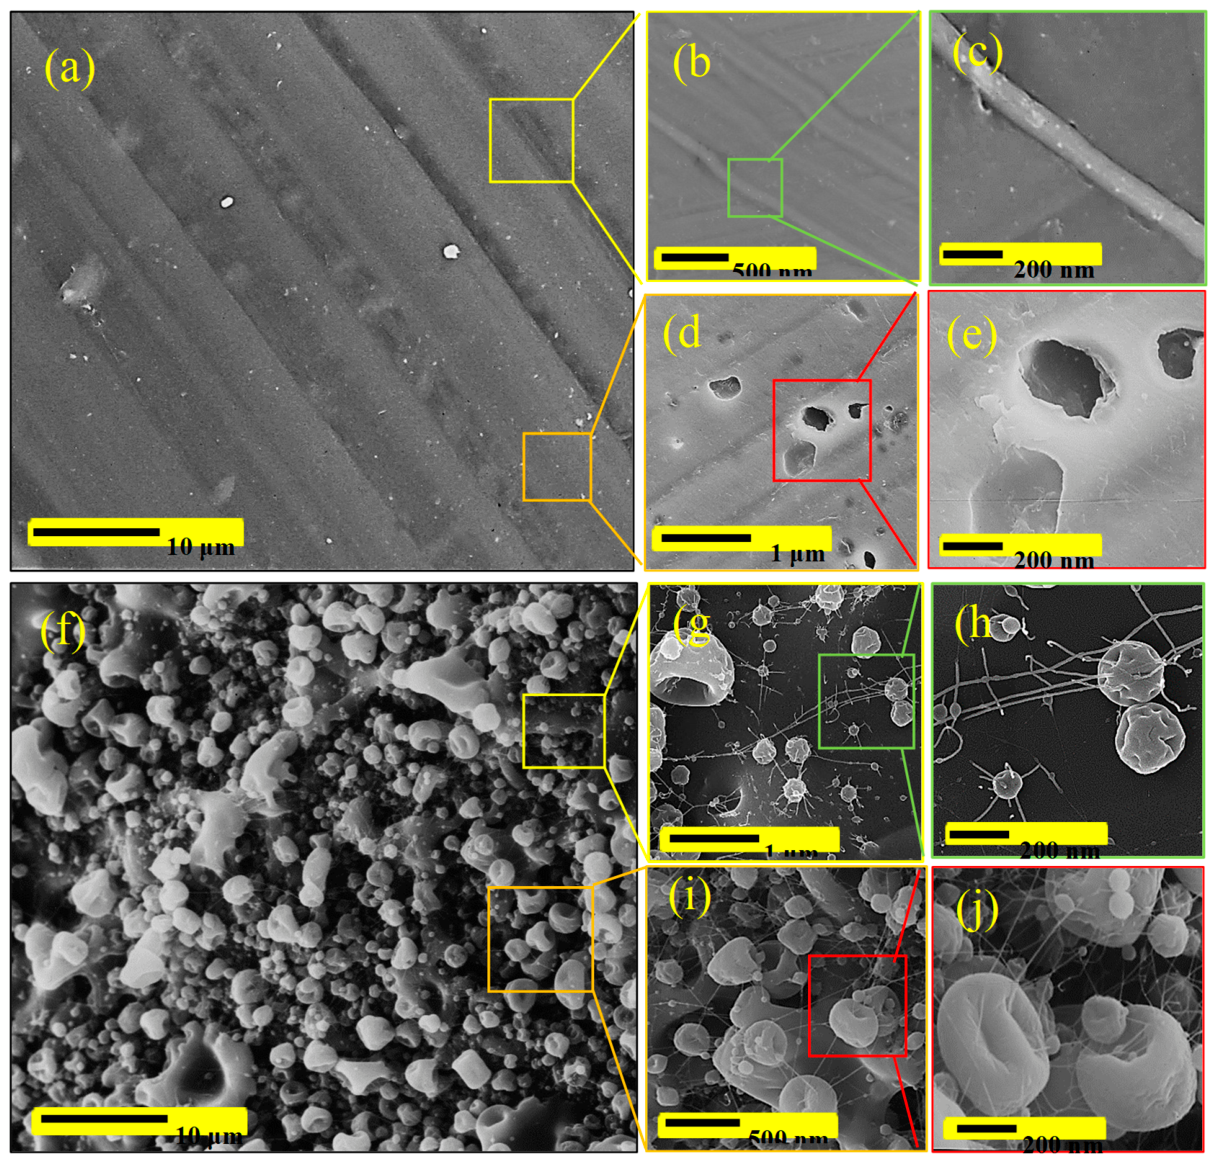
Figure 5.
The FE-SEM cross-sectional images of (a and b) PES and (c and d) PES-PUMA(4.7) membranes under low-magnification (a, c) and high-magnification (b, d) views.
Figure 5.
The FE-SEM cross-sectional images of (a and b) PES and (c and d) PES-PUMA(4.7) membranes under low-magnification (a, c) and high-magnification (b, d) views.
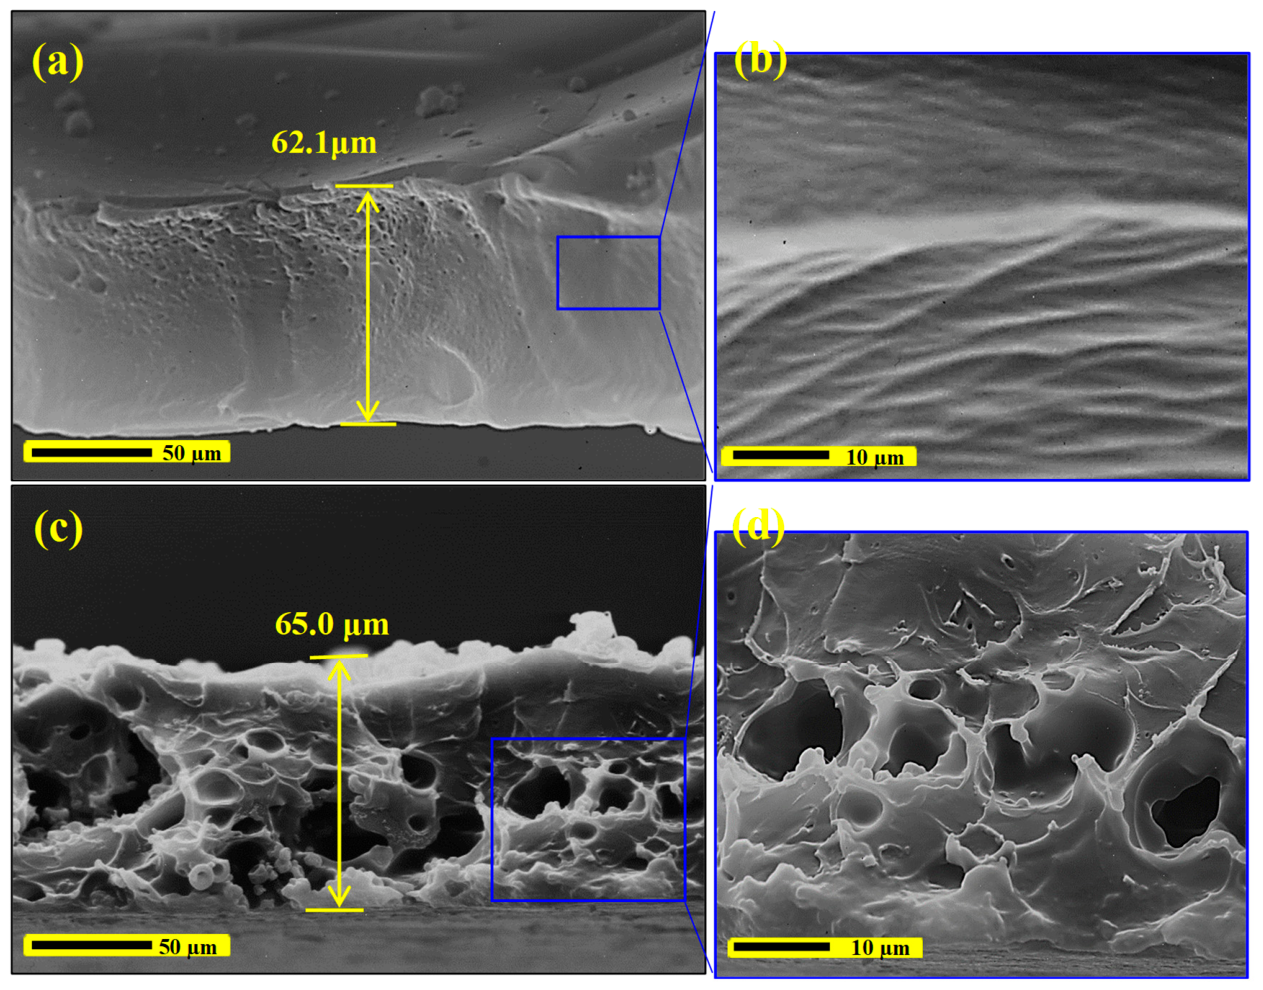
Figure 6.
TGA-DTA curves of (a) PES membrane, (b) PUMA structure and (c) PES-PUMA(4.7) membrane [12].
Figure 6.
TGA-DTA curves of (a) PES membrane, (b) PUMA structure and (c) PES-PUMA(4.7) membrane [12].
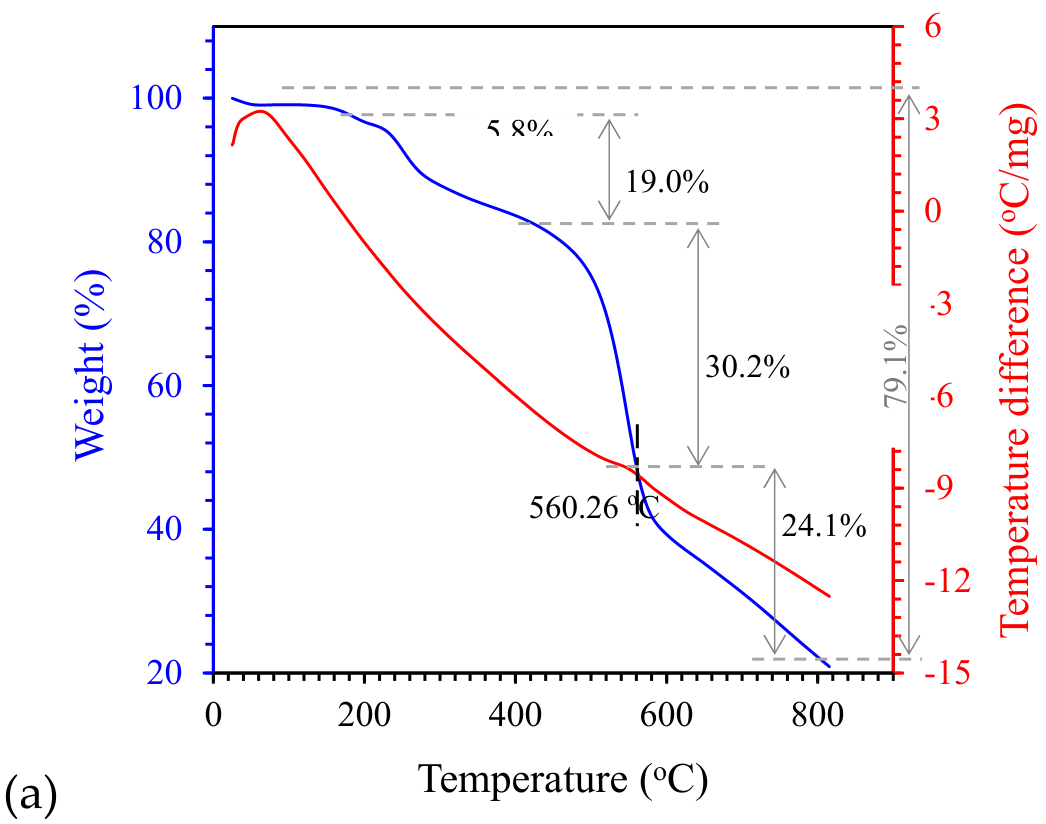
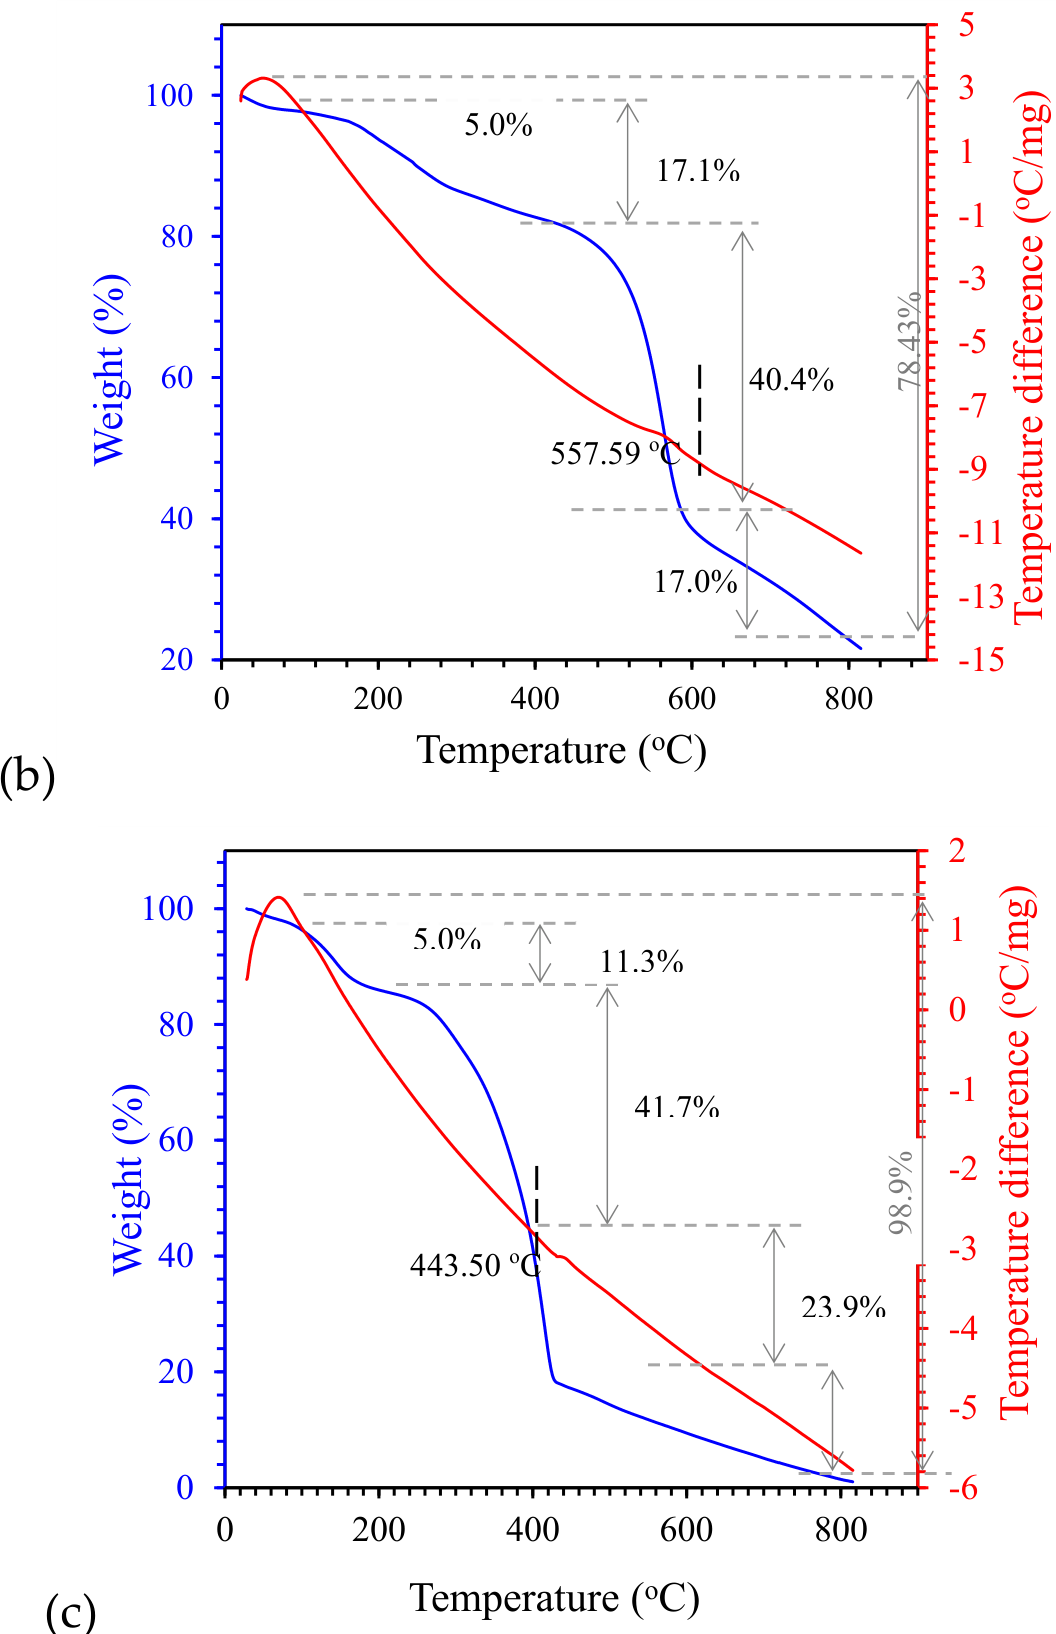
Figure 7.
The DSC curves of (a) PES membrane, (b) PUMA structure, and (c) PES-PUMA(4.7) membrane.
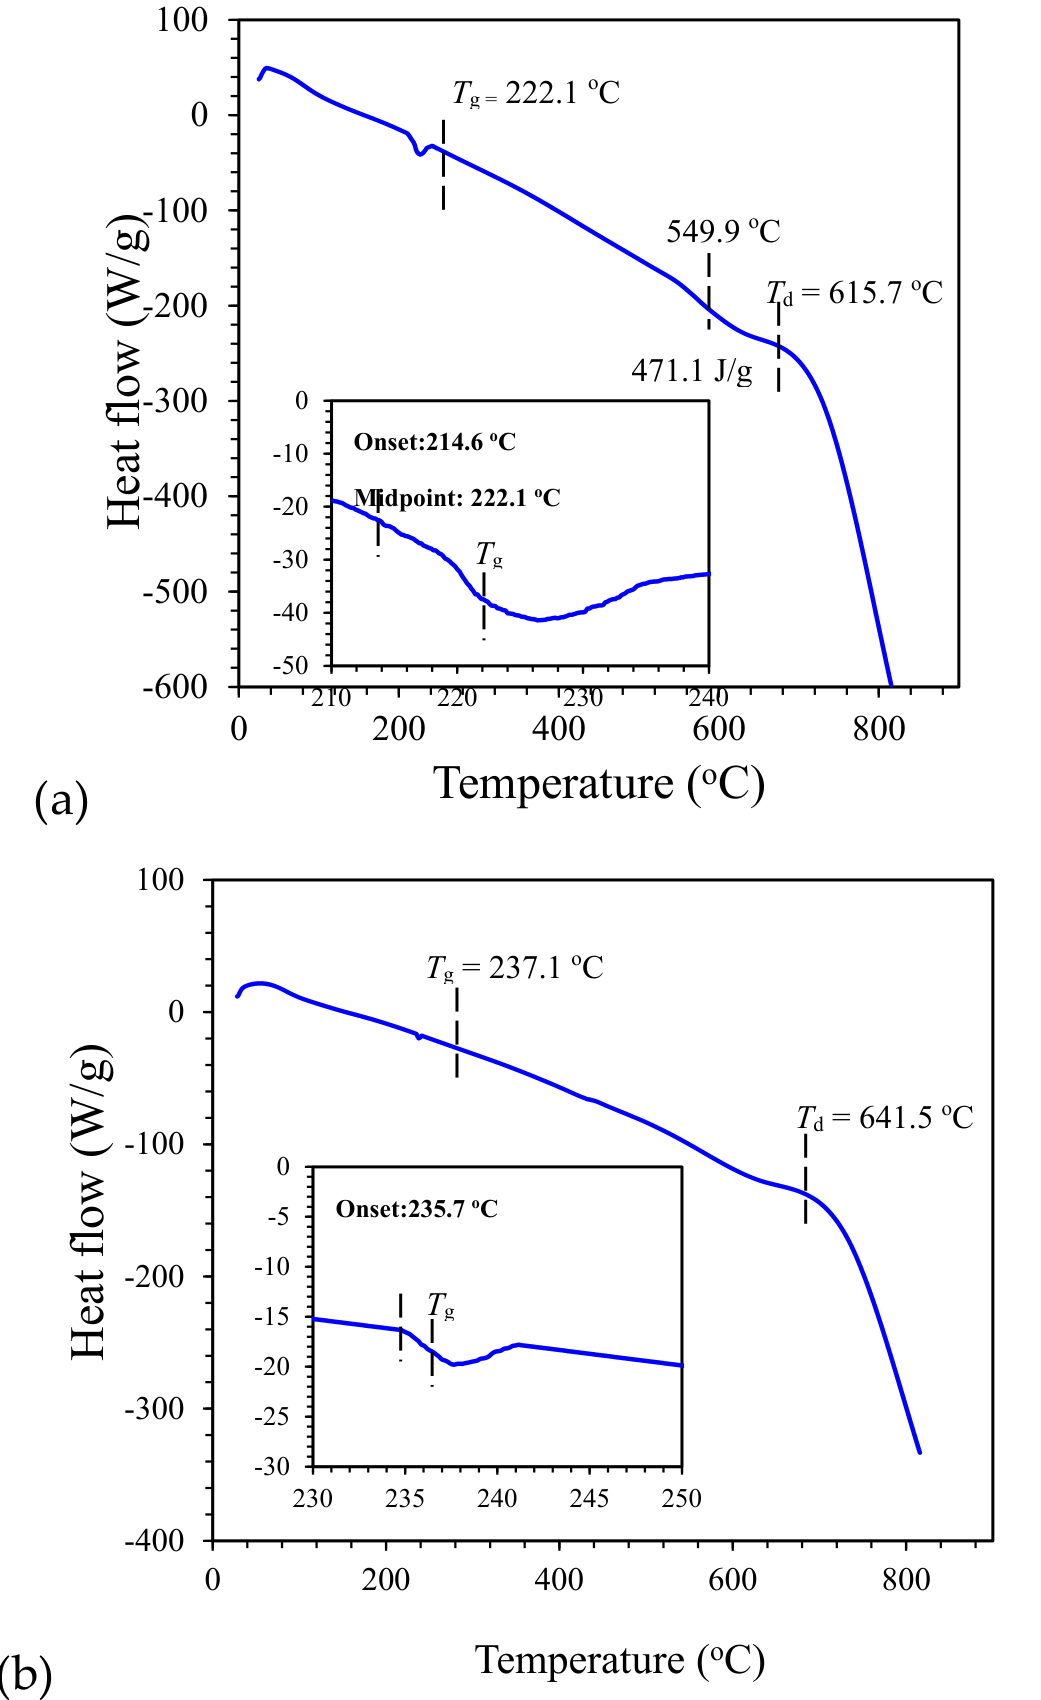
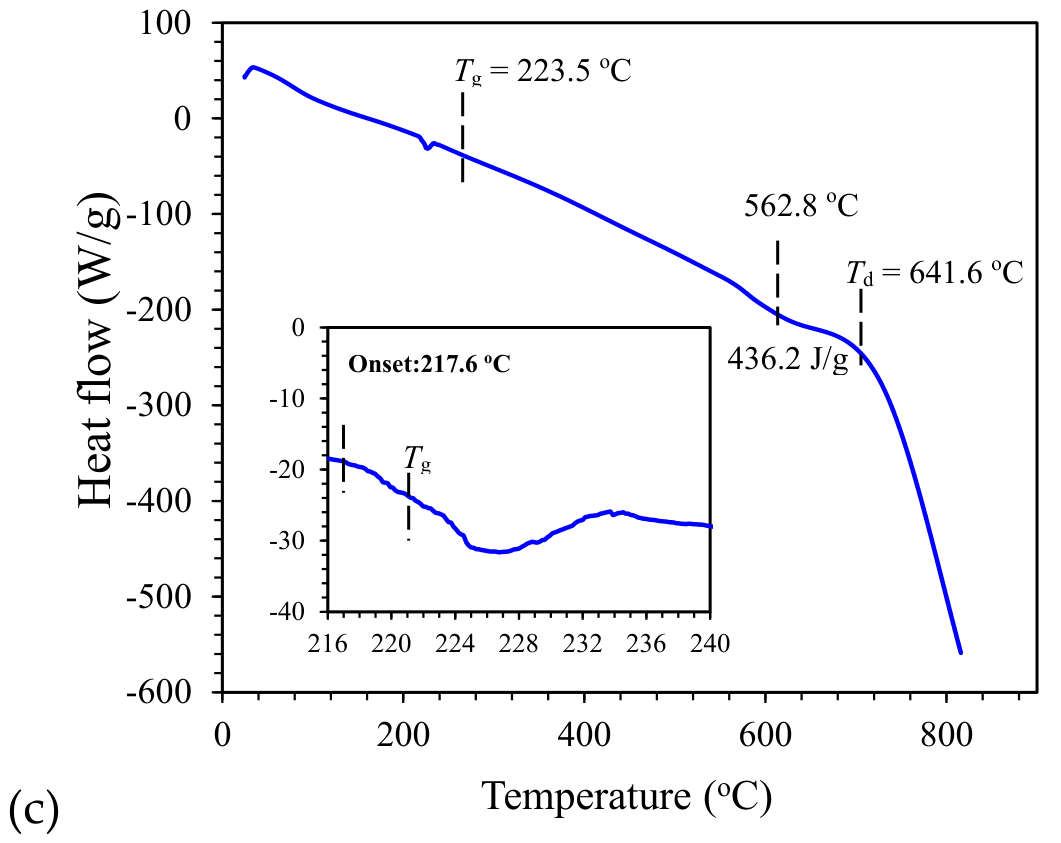
Figure 8.
(a) The pore size distribution, and (b) mean pore diameter and porosity of the PES-PUMA(4.7) membrane after different separation cycles with cleaning treatment operated at 60 kPa [Data are presented as mean ± SD (n=3)].
Figure 8.
(a) The pore size distribution, and (b) mean pore diameter and porosity of the PES-PUMA(4.7) membrane after different separation cycles with cleaning treatment operated at 60 kPa [Data are presented as mean ± SD (n=3)].
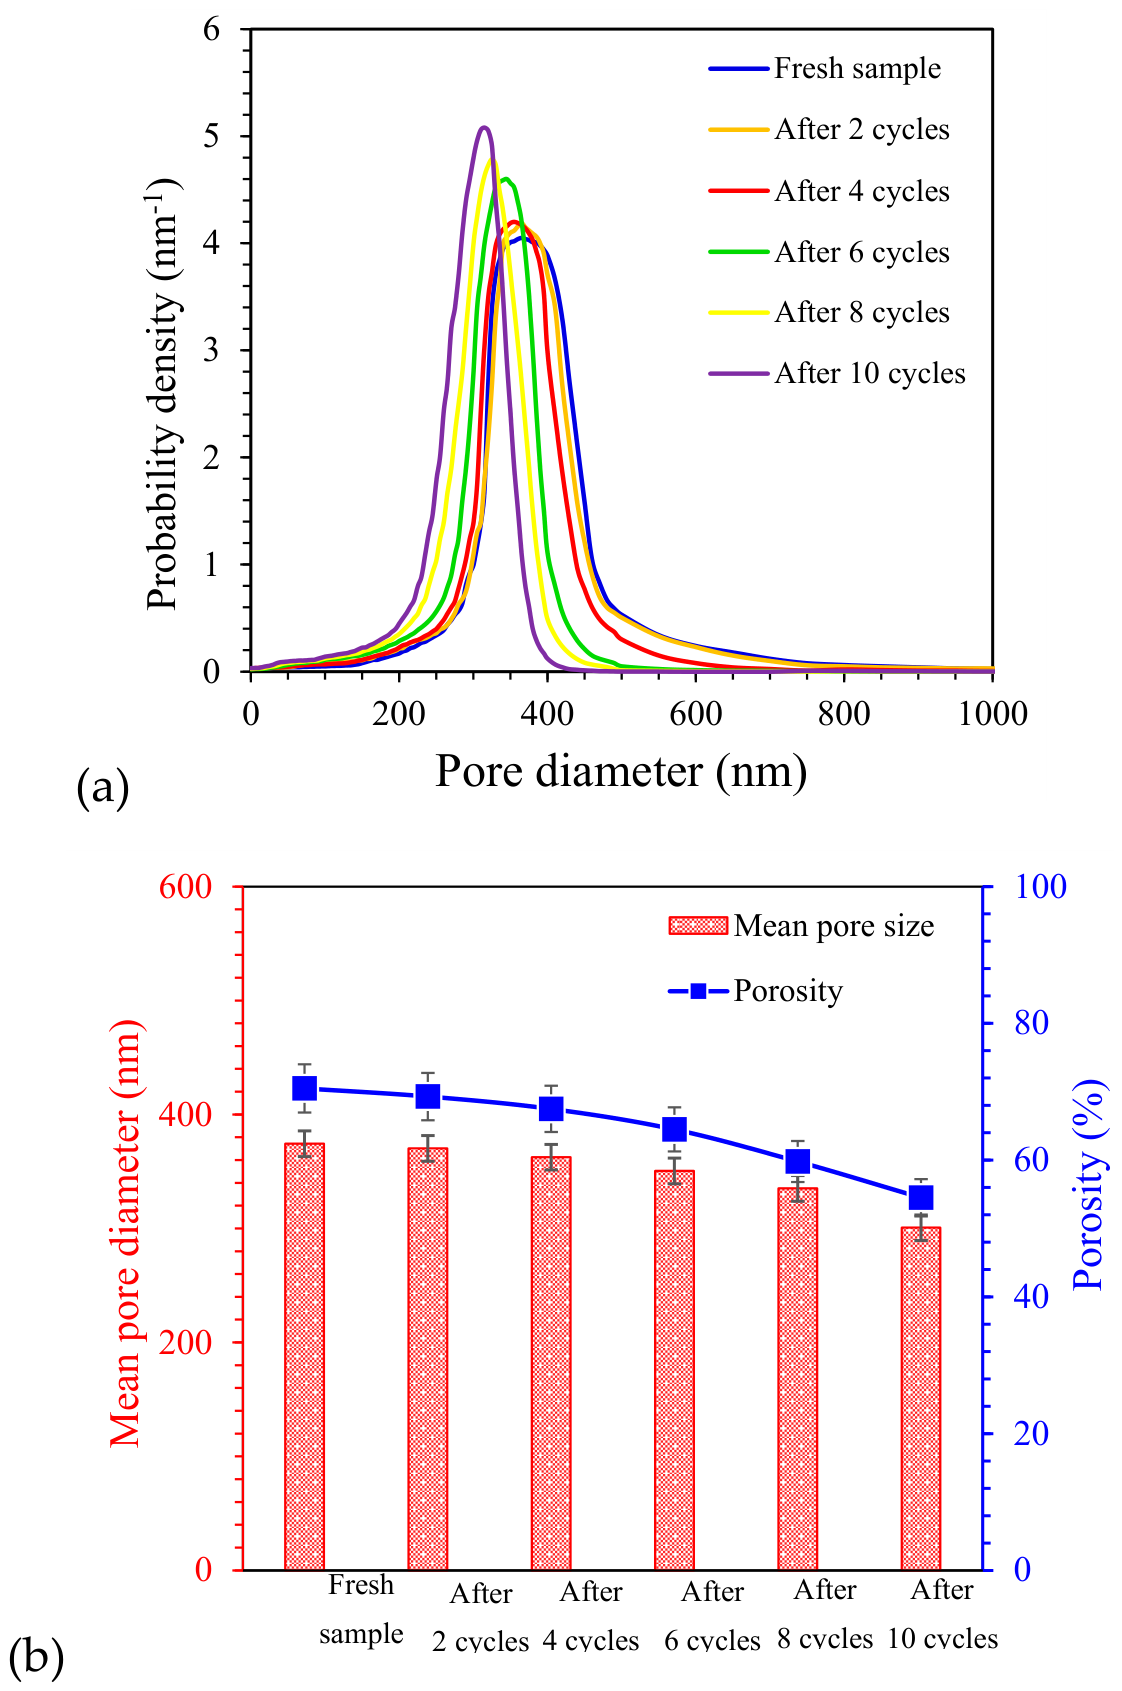
Figure 9.
The AFM (3D and 2D) images of the PES-PUMA(4.7) membrane obtained from different separation cycles (a): fresh sample 12, and after oil separation by (b) 2 cycles, (c) 4 cycles, (d) 6 cycles, (e) 8 cycles, and (f) 10 cycles.
Figure 9.
The AFM (3D and 2D) images of the PES-PUMA(4.7) membrane obtained from different separation cycles (a): fresh sample 12, and after oil separation by (b) 2 cycles, (c) 4 cycles, (d) 6 cycles, (e) 8 cycles, and (f) 10 cycles.
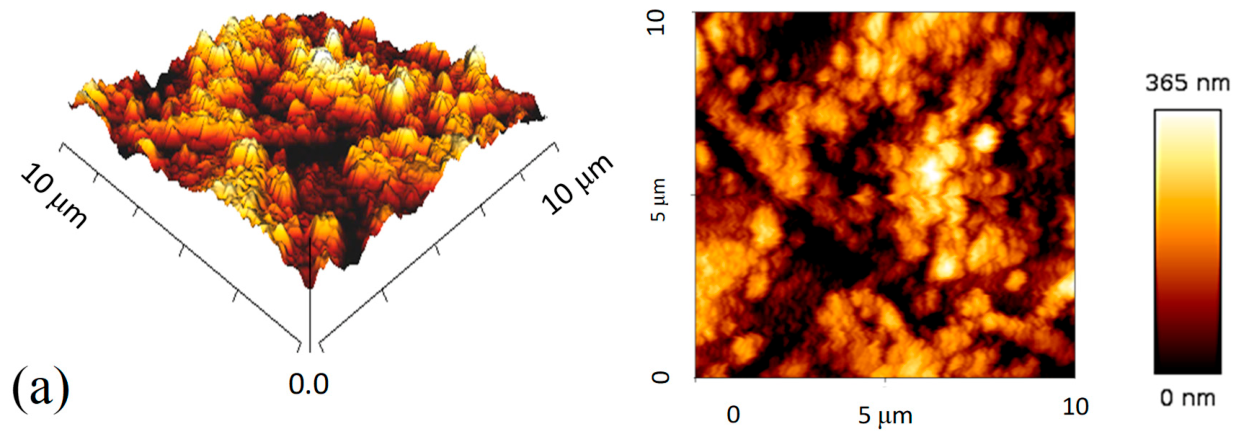
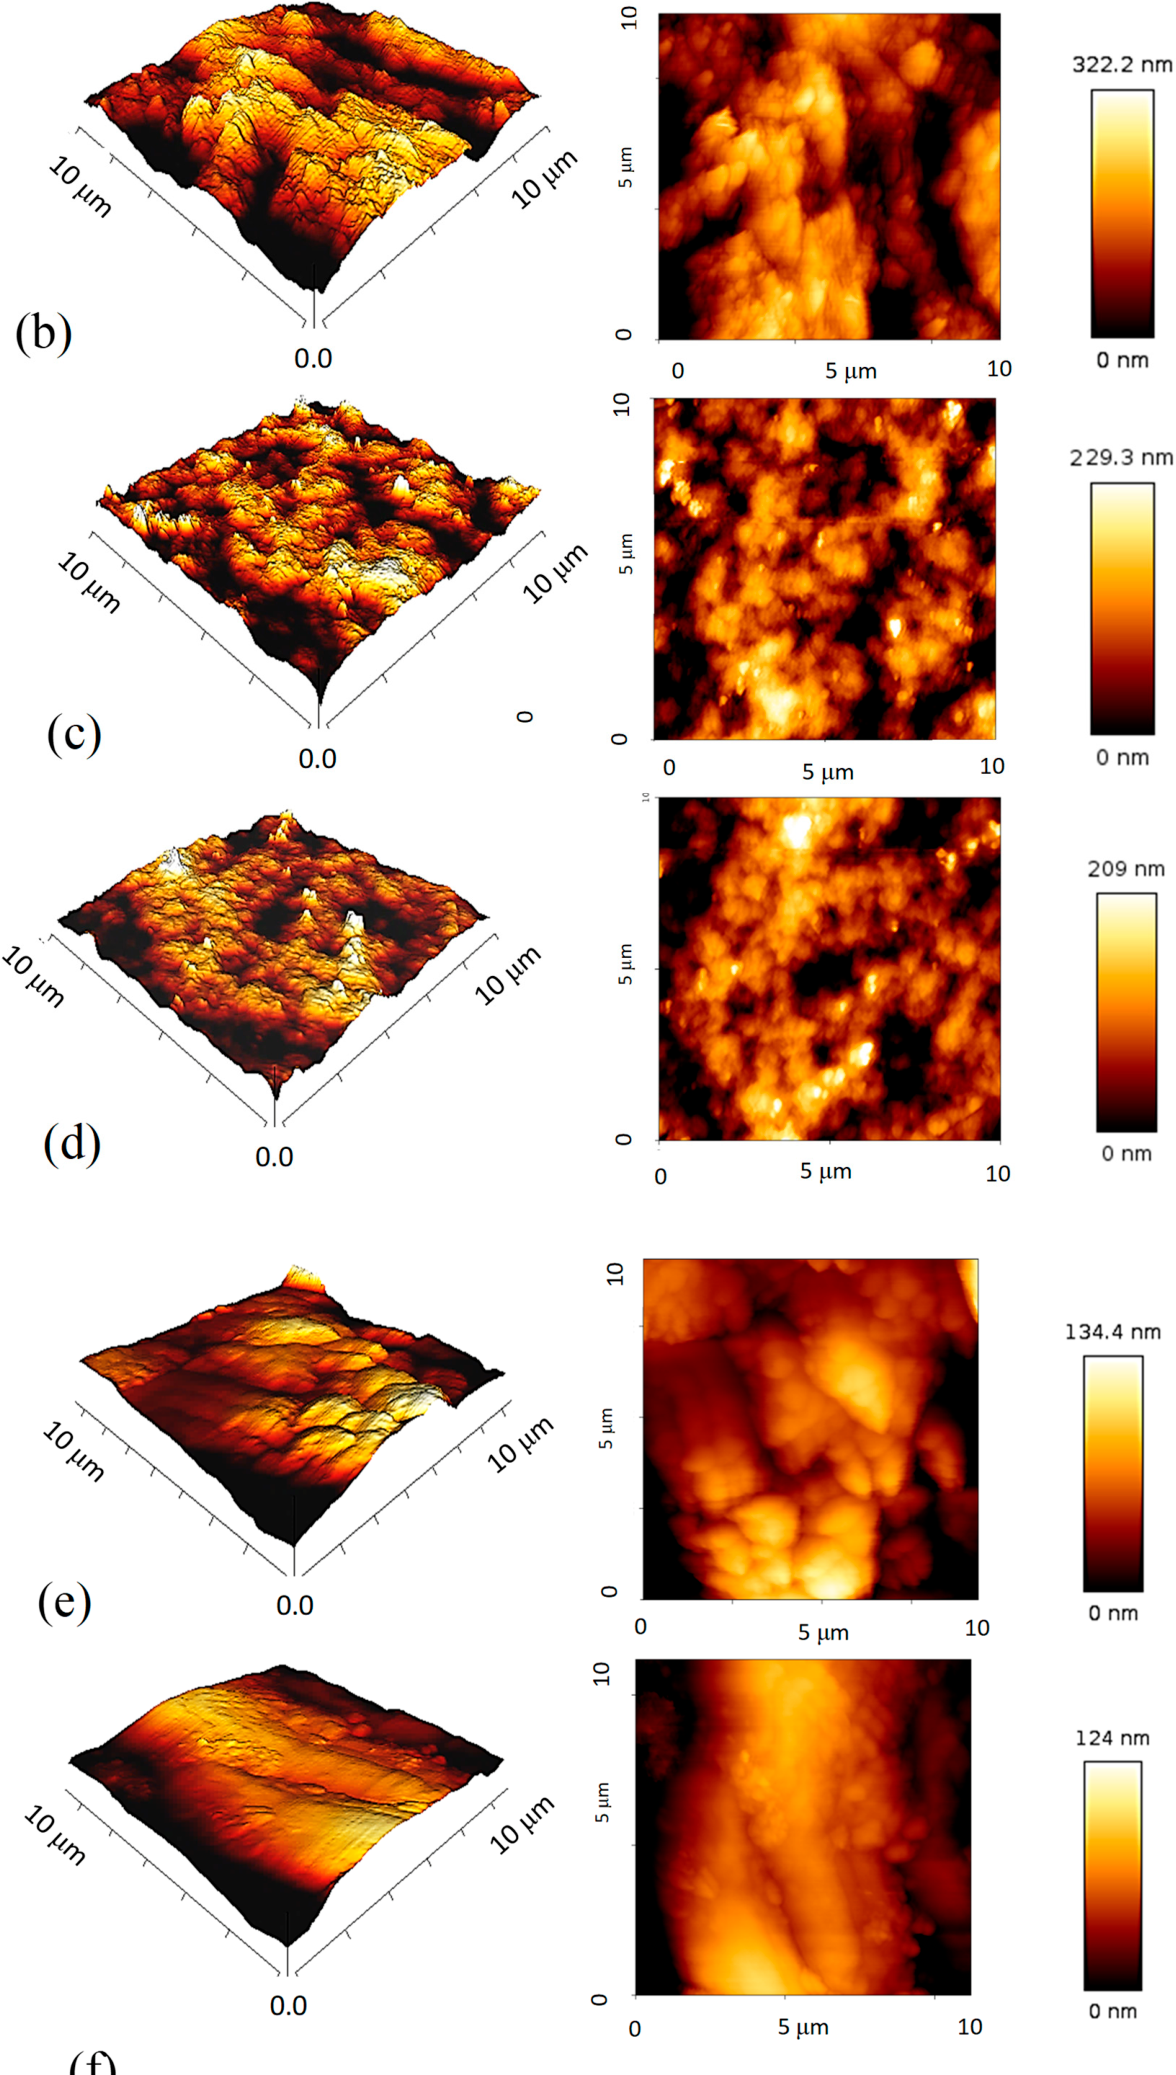
Figure 10.
The droplet size distribution of W/O emulsions (10% v/v) before and after separation by (a) PES and (b) PES-PUMA(4.7) membrane.
Figure 10.
The droplet size distribution of W/O emulsions (10% v/v) before and after separation by (a) PES and (b) PES-PUMA(4.7) membrane.
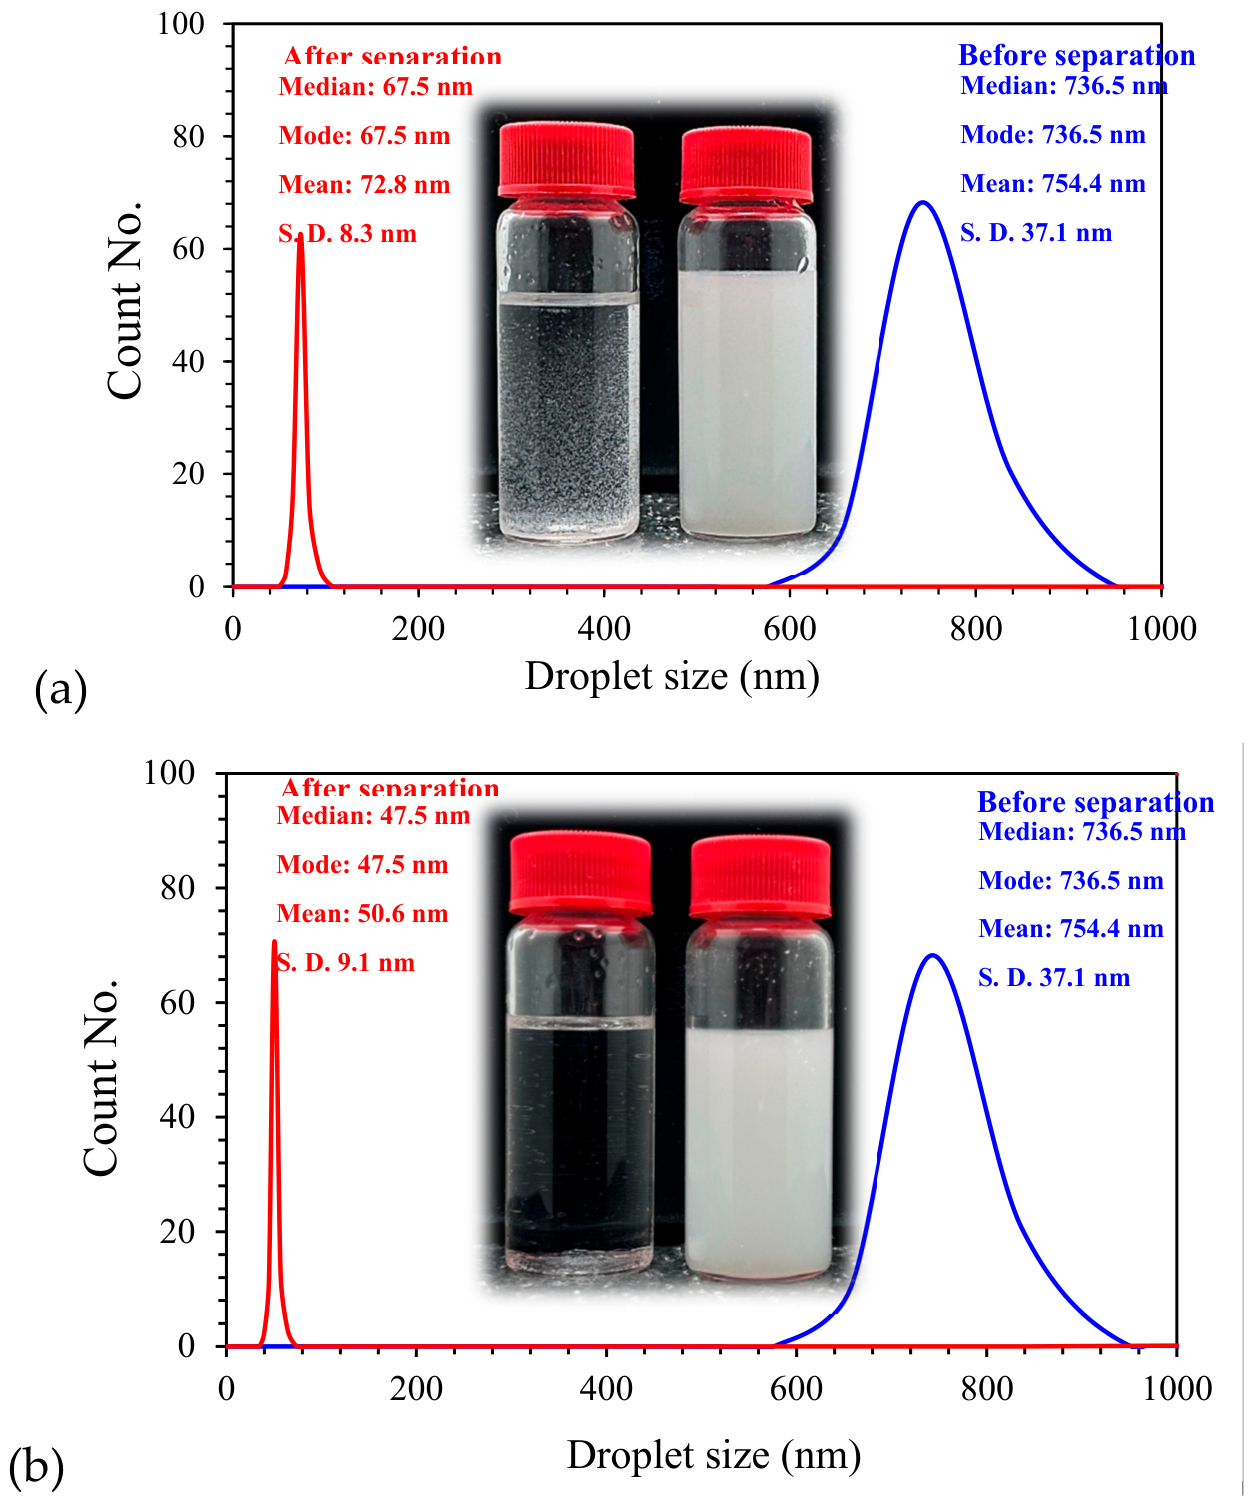
Figure 11.
Effect of operating pressure on the oil permeate flux and water rejection of PES-PUMA(4.7) membrane in separation of 10% (v/v) W/O emulsion [Error bars represent the SD of three measurements].
Figure 11.
Effect of operating pressure on the oil permeate flux and water rejection of PES-PUMA(4.7) membrane in separation of 10% (v/v) W/O emulsion [Error bars represent the SD of three measurements].
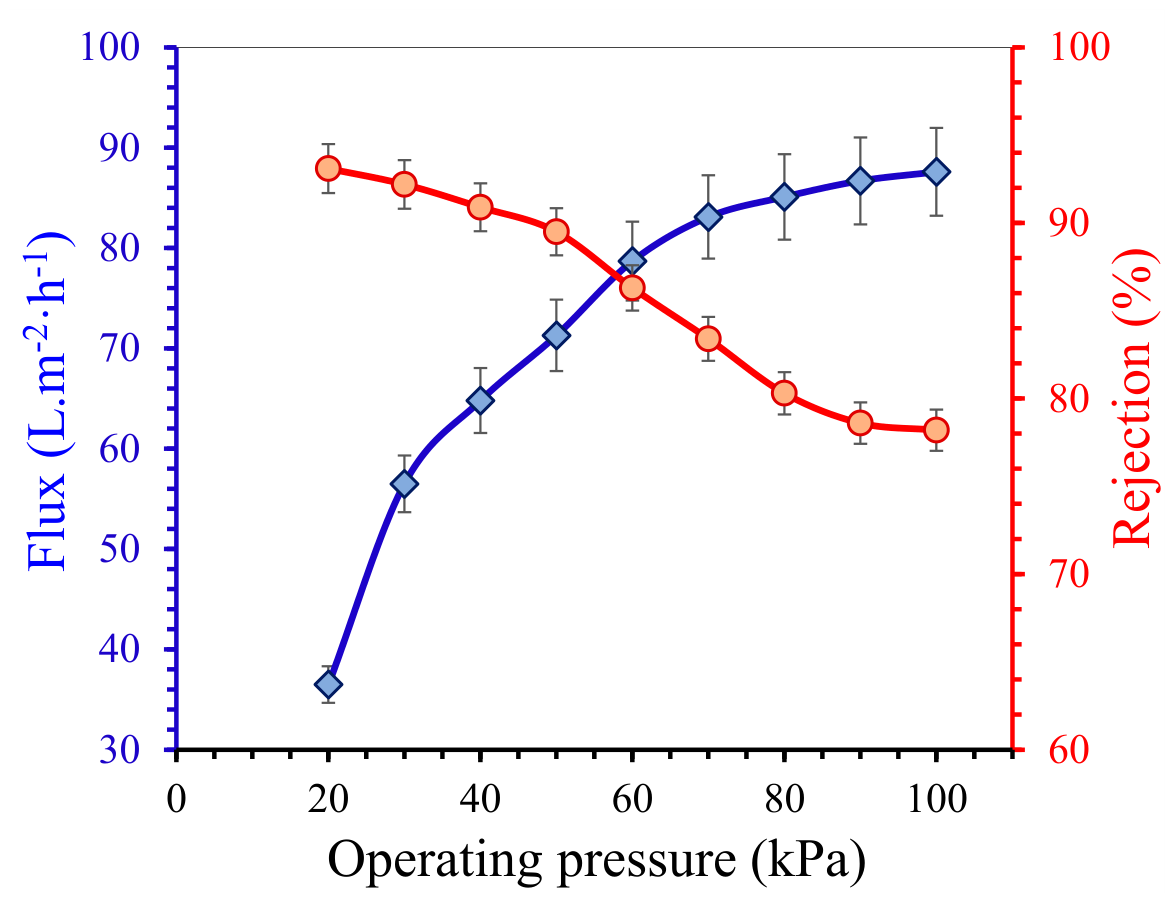
Figure 12.
The effect of operating pressure on the mean pore size and porosity of the PES-PUMA(4.7) membrane after each separation cycle of a 10% (v/v) W/O emulsion [Error bars represent the SD of three measurements].
Figure 12.
The effect of operating pressure on the mean pore size and porosity of the PES-PUMA(4.7) membrane after each separation cycle of a 10% (v/v) W/O emulsion [Error bars represent the SD of three measurements].
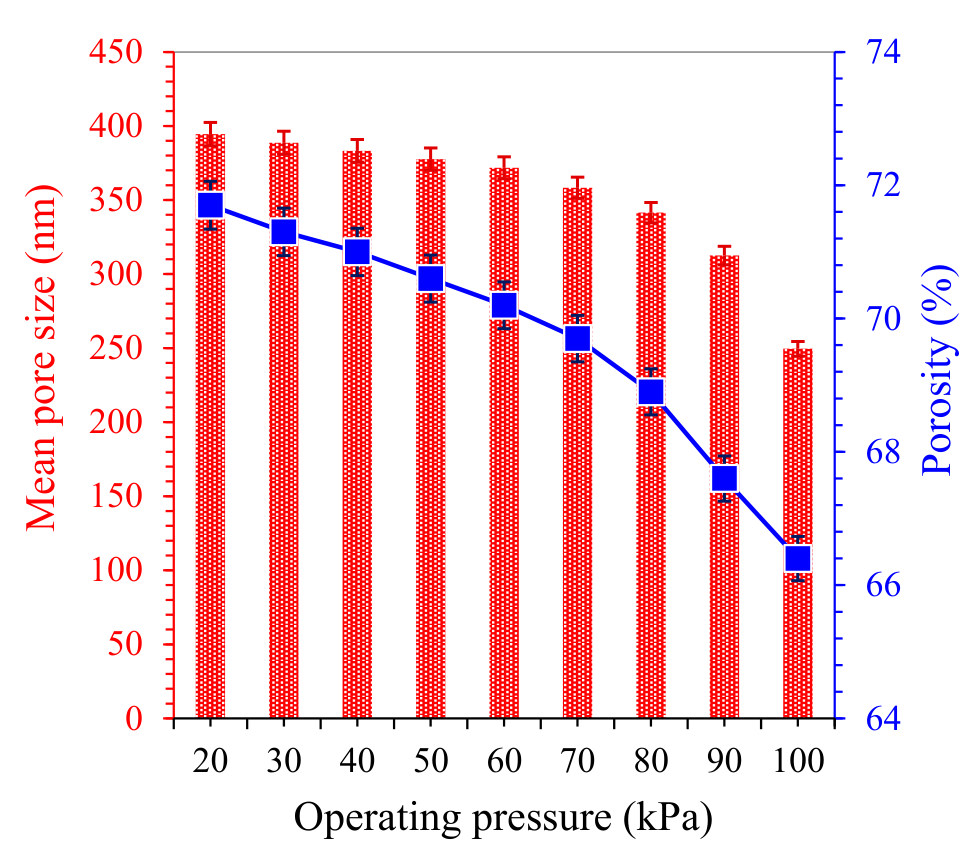
Figure 13.
The cross-sectional SEM images of the PES-PUMA(4.7) membrane (a and b) before, and (c and d) after oil permeation at an ultra-low pressure of 20 kPa. (a and c): low-magnification views; and (b and d) high-magnification views.
Figure 13.
The cross-sectional SEM images of the PES-PUMA(4.7) membrane (a and b) before, and (c and d) after oil permeation at an ultra-low pressure of 20 kPa. (a and c): low-magnification views; and (b and d) high-magnification views.
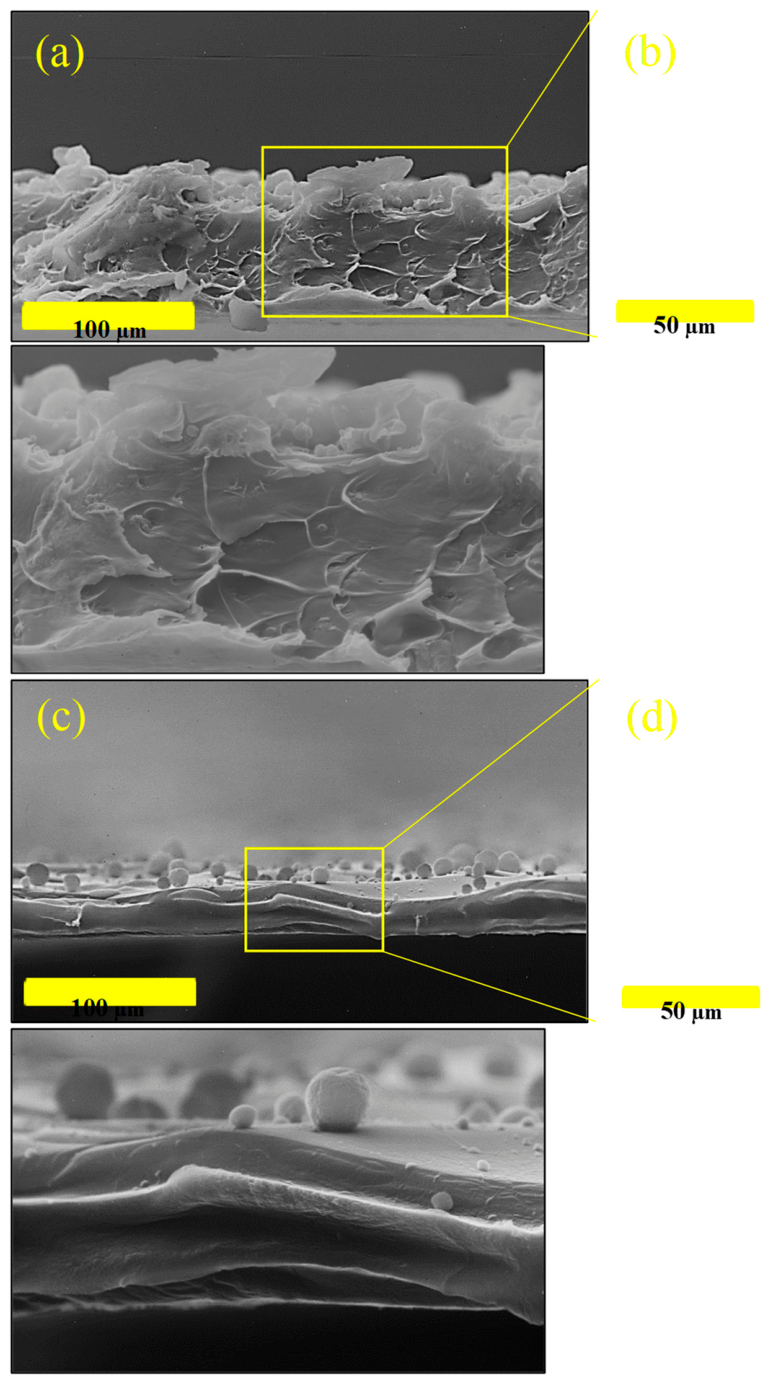
Figure 14.
Effect of feed flow rate on the oil permeate flux and water rejection rate of PES-PUMA(4.7) membrane in separation of 10% (v/v) W/O emulsion [Error bars represent the SD of three measurements].
Figure 14.
Effect of feed flow rate on the oil permeate flux and water rejection rate of PES-PUMA(4.7) membrane in separation of 10% (v/v) W/O emulsion [Error bars represent the SD of three measurements].
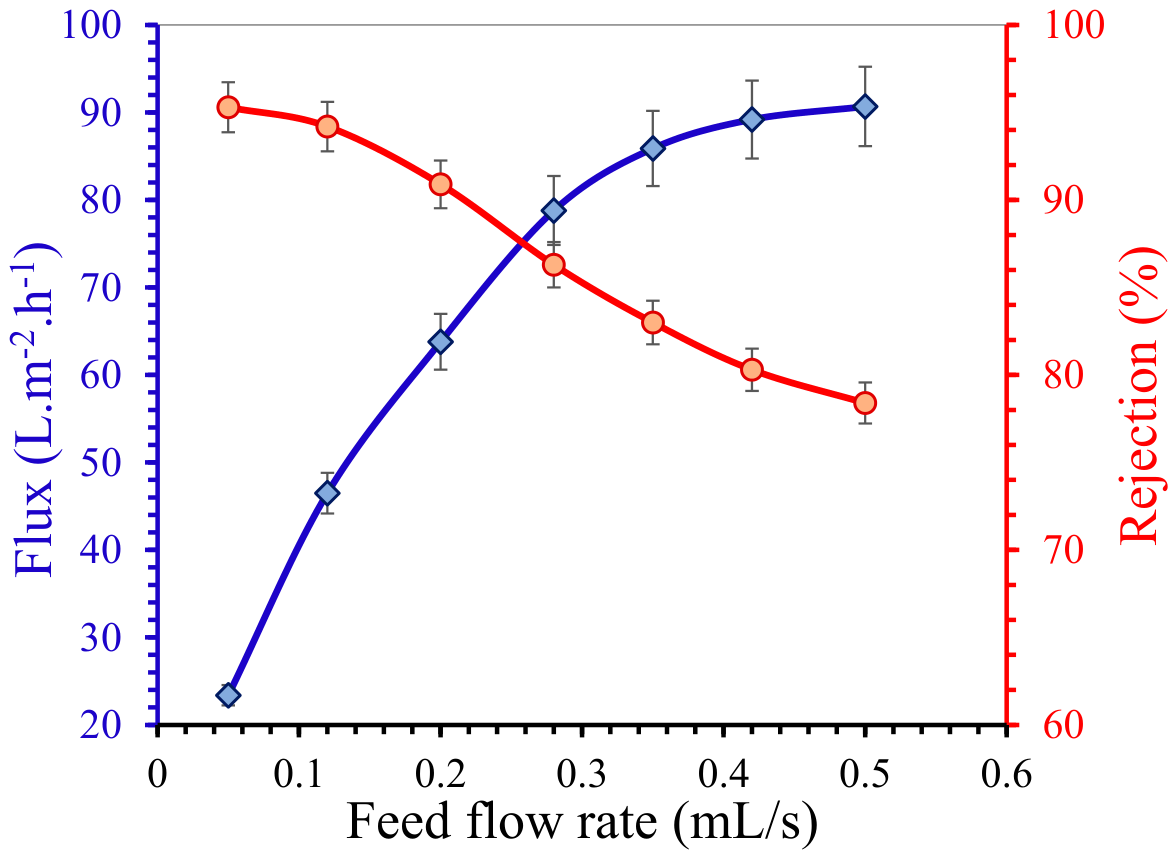
Figure 15.
SEM images of PES-PUMA(4.7) membrane after the separation of W/O emulsion (10% v/v) at feed flow rates of (a) 0.05, (b) 0.20, (c) 0.35, and (d) 0.50 mL/s (left and right images represent the cross-sectional, and surface views, respectively).
Figure 15.
SEM images of PES-PUMA(4.7) membrane after the separation of W/O emulsion (10% v/v) at feed flow rates of (a) 0.05, (b) 0.20, (c) 0.35, and (d) 0.50 mL/s (left and right images represent the cross-sectional, and surface views, respectively).
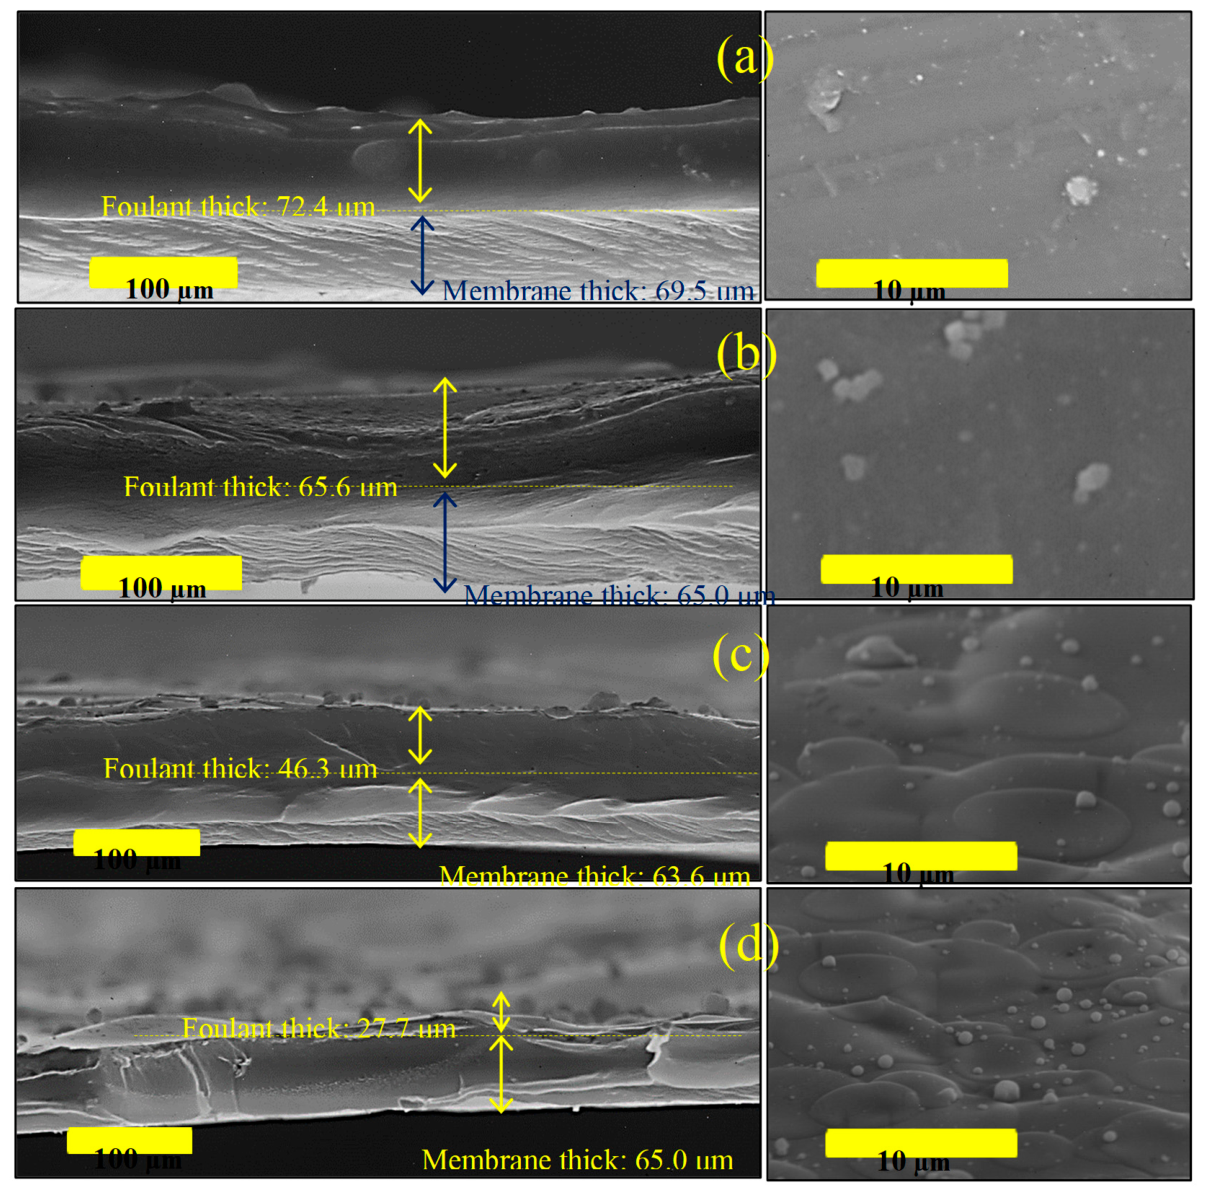
Figure 16.
The calculated results of (a) FRR and (b) Rt of PES-PUMA(4.7) membrane during different separation cycles as a function of operating pressures.
Figure 16.
The calculated results of (a) FRR and (b) Rt of PES-PUMA(4.7) membrane during different separation cycles as a function of operating pressures.
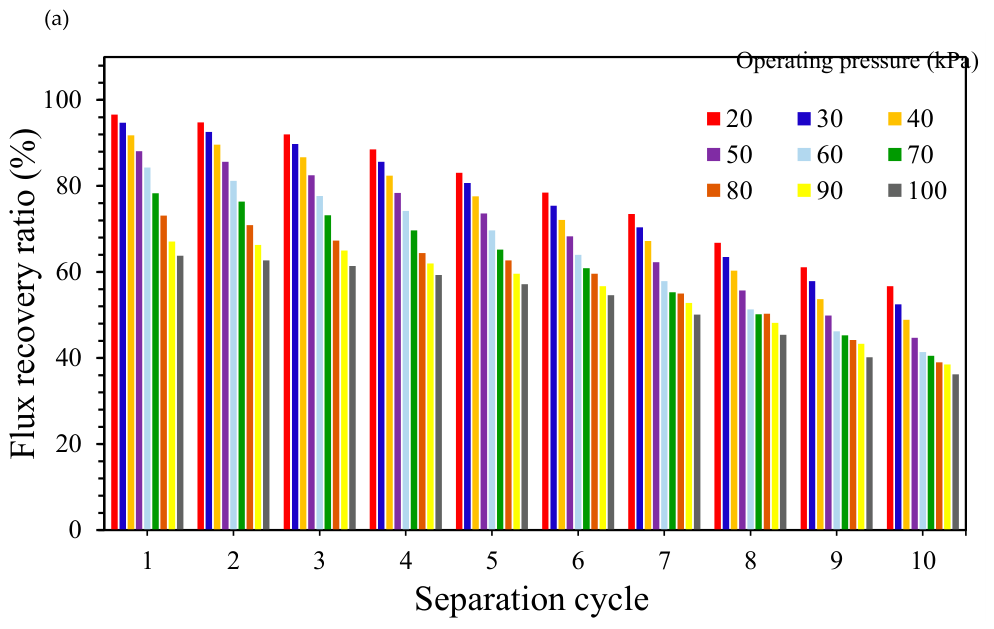
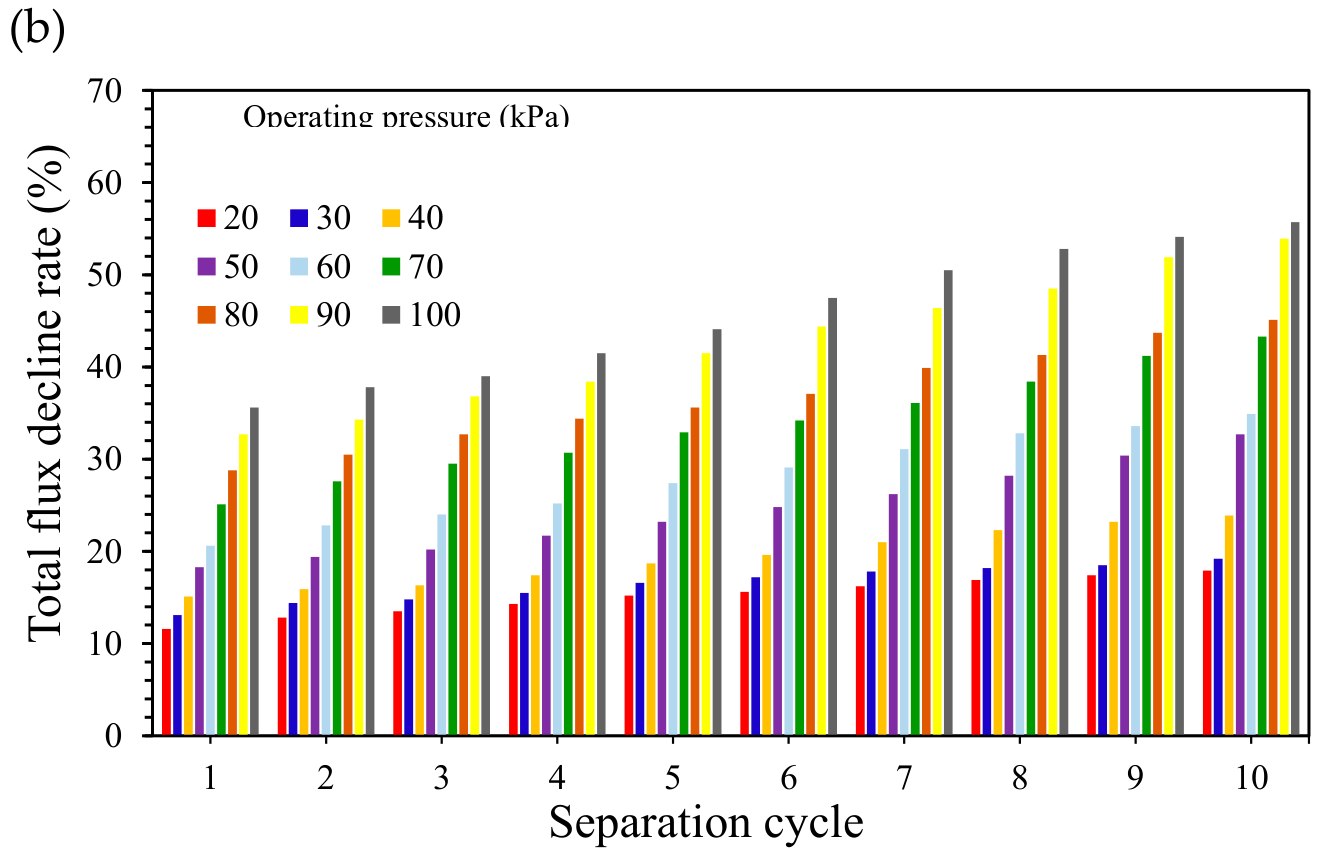
Figure 17.
The calculated results of (a) FRR and (b) Rt of PES-PUMA(4.7) membrane over successive separation cycles at various feed flow rates.
Figure 17.
The calculated results of (a) FRR and (b) Rt of PES-PUMA(4.7) membrane over successive separation cycles at various feed flow rates.
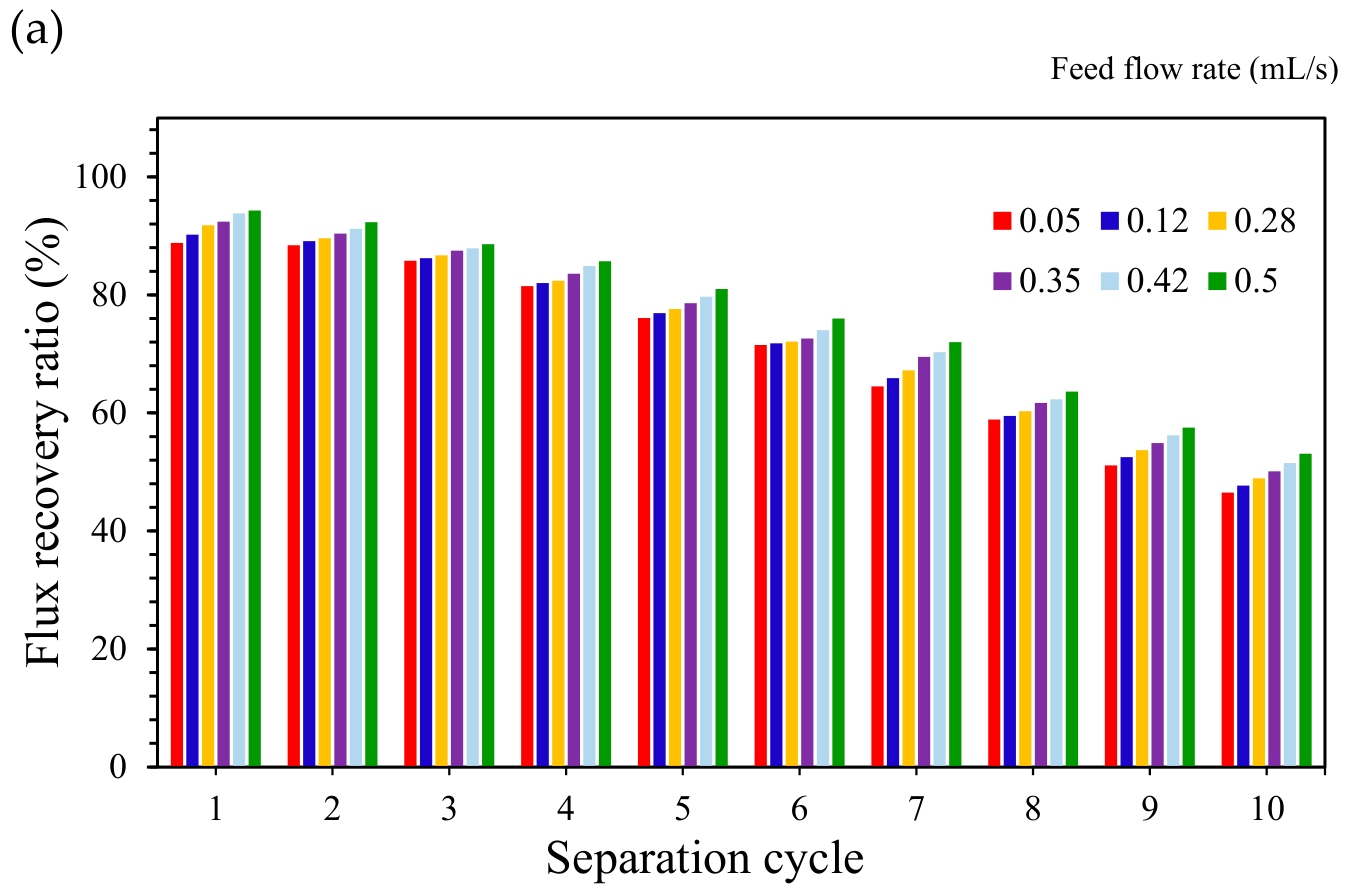
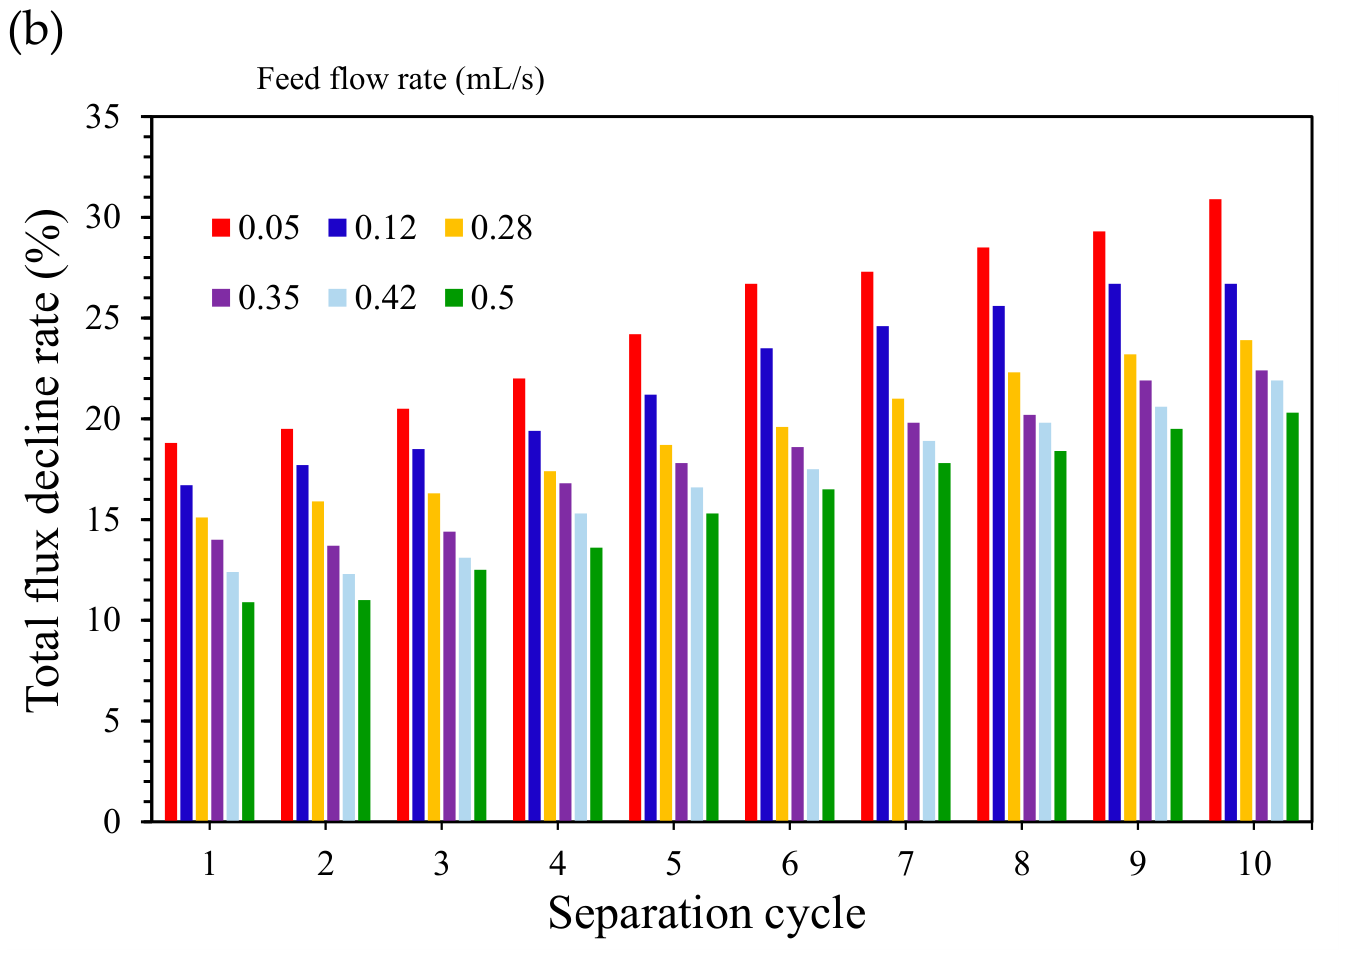
Figure 18.
(a) Normalized permeate flux and (b) normalized water rejection of the PES-PUMA(4.7) membrane during the filtration of W/O emulsion under an operating pressure of 60 kPa.
Figure 18.
(a) Normalized permeate flux and (b) normalized water rejection of the PES-PUMA(4.7) membrane during the filtration of W/O emulsion under an operating pressure of 60 kPa.
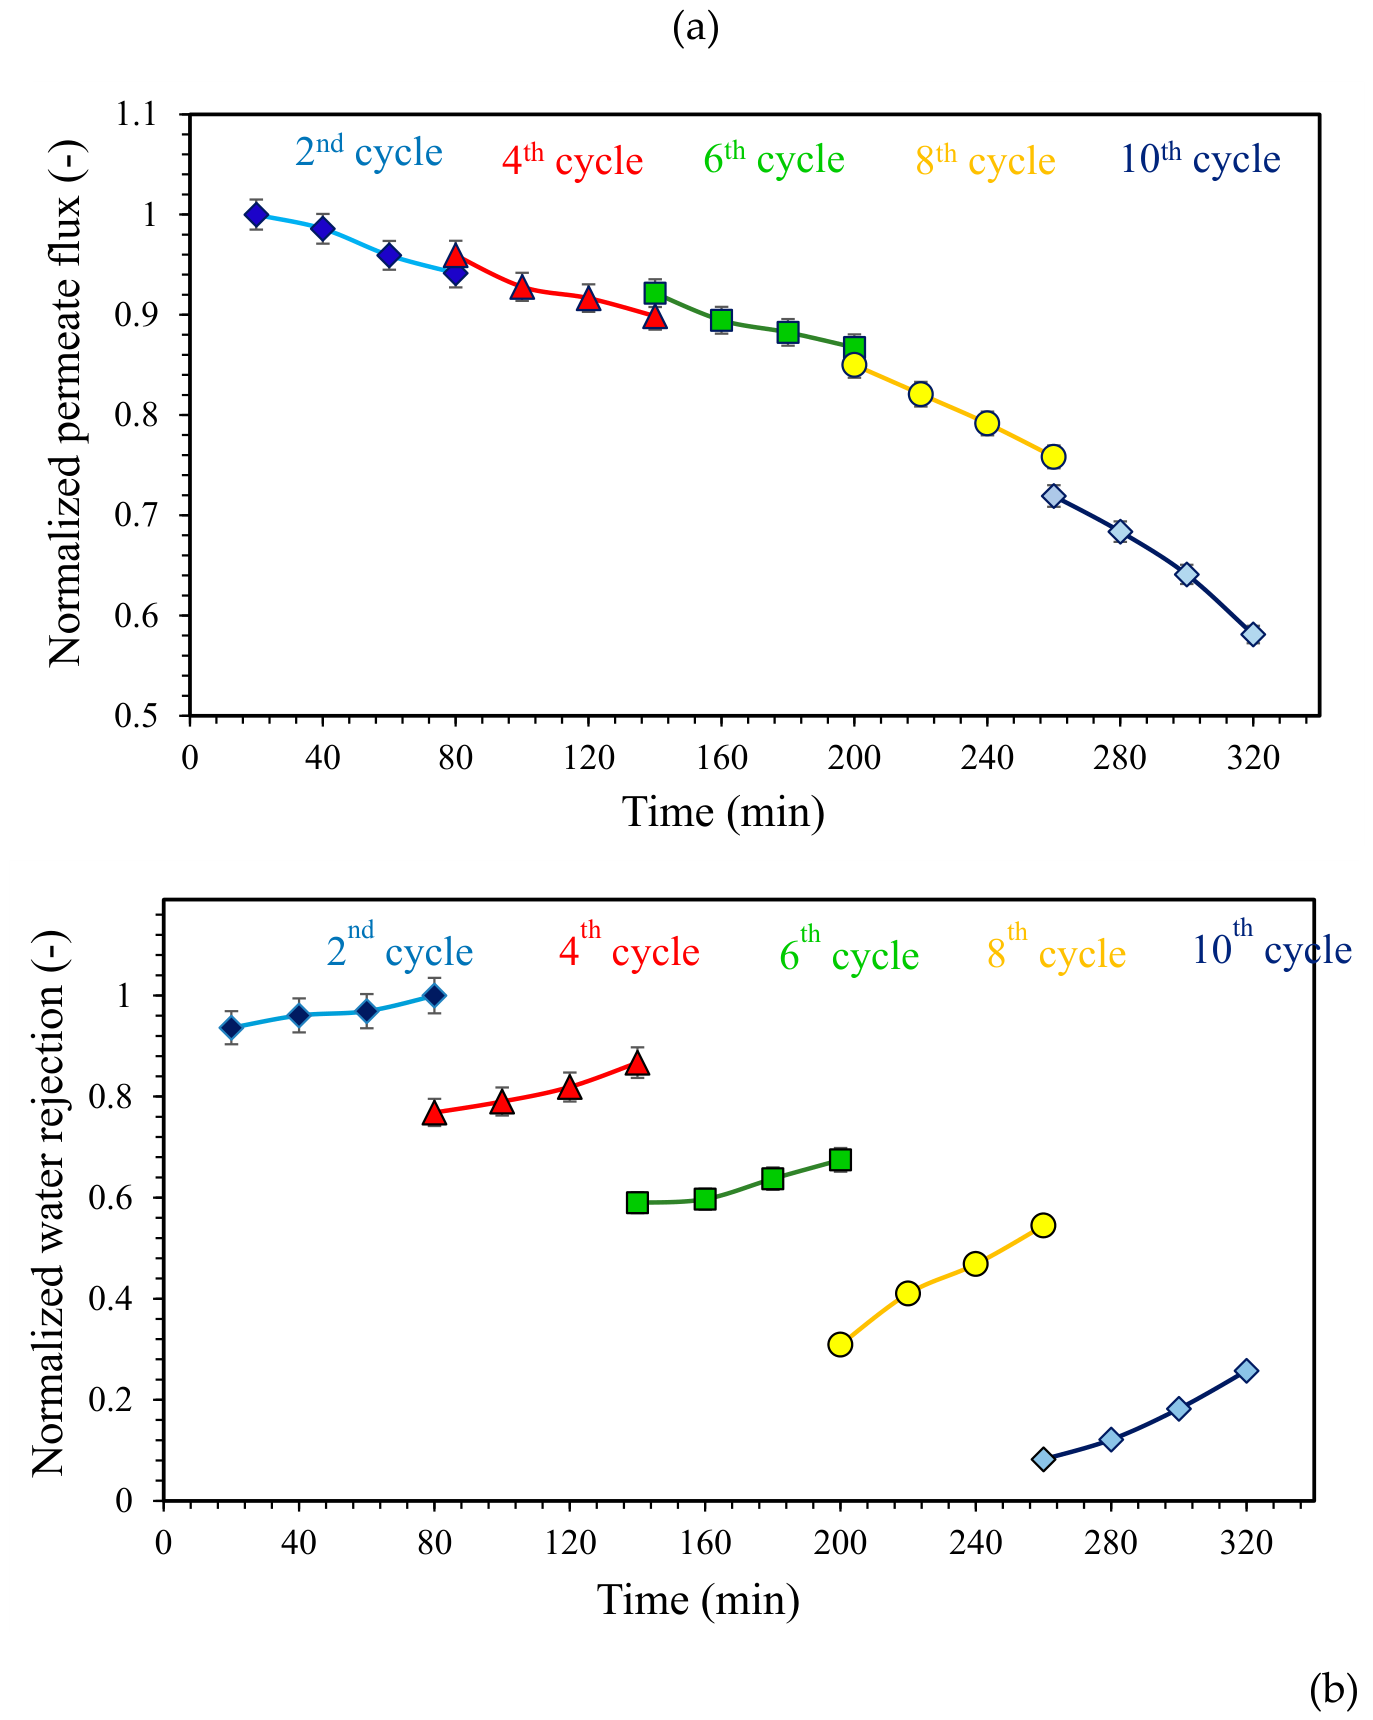
Scheme 2.
The schematic representation of the mechanism of the W/O emulsion separation by the PES-PUMA membrane.
Scheme 2.
The schematic representation of the mechanism of the W/O emulsion separation by the PES-PUMA membrane.
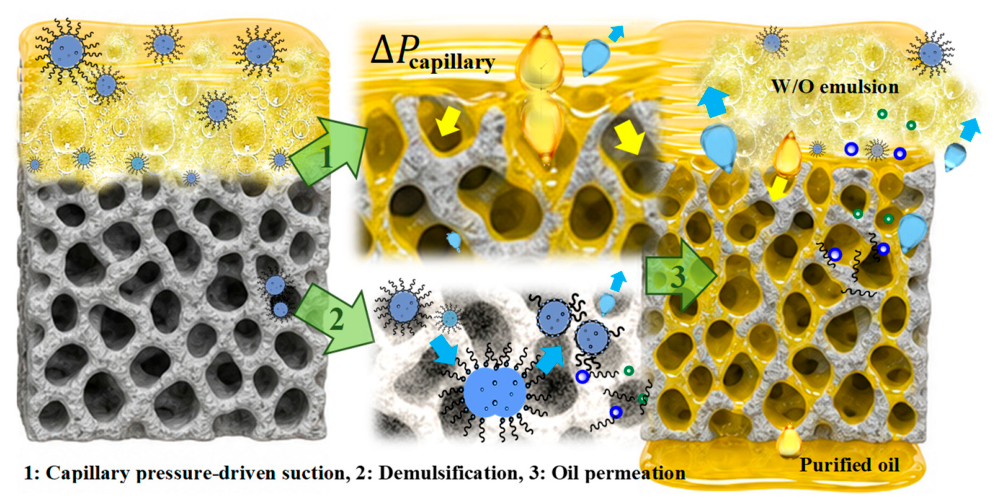

Table 1.
The results of surface roughness parameters for the PES-PUMA(4.7) membrane after different filtration cycles.
Table 1.
The results of surface roughness parameters for the PES-PUMA(4.7) membrane after different filtration cycles.
| Separation stage | Roughness parameters | |||
| Rp (nm) | Rv (nm) | Ra (nm) | Rq (nm) | |
| Fresh sample | 235.6487 | -129.3511 | 26.1088 | 29.8253 |
| After 2 cycles | 208.0070 | -114.1930 | 22.8075 | 26.0071 |
| After 4 cycles | 153.0336 | -76.2664 | 12.6752 | 16.7542 |
| After 6 cycles | 139.4854 | -69.5145 | 10.3421 | 14.2521 |
| After 8 cycles | 93.7684 | -40.6316 | 8.8647 | 10.2973 |
| After 10 cycles | 88.5129 | -35.4871 | 6.4810 | 8.6544 |
Table 2.
Comparison of the performance of PES membranes, POPs, polymers and inorganic materials for separation of W/O emulsions.
Table 2.
Comparison of the performance of PES membranes, POPs, polymers and inorganic materials for separation of W/O emulsions.
| Entry |
Membrane/ Material |
Fabrication method/ Emulsion type |
Operational parameters | Flux (L.m⁻².h⁻¹) | Rejection (%) |
FRR (-) |
Antifouling; Chemical stability | Ref |
| 1 | PES ultrafiltration membrane (10–300 kDa) | Phase inversion/ 20% mineral oil, 2% Span, 78% DI water | 0.05–0.30 MPa, 0.1–2.0 L.min⁻¹ | NR | NR | NR | NR | [59] |
| 2 | Ceramic membrane modified with α-Si3N4 nanowires / organosilane NPs | Surface modification/ 1 vol% DI water, Span 80, Kerosene |
0.02, 0.05, 0.1, 0.15 and 0.20 MPa, 0.1–2.0 L.min⁻¹ | NR | >95 | NR | Good; NR | [60] |
| 3 | PET fibrous membrane | Electrospinning followed by surface modification/ 5% water, 1% Span 80, 94% CCl4 | 0.0008 MPa 0.0012 MPa |
4395 >1100 (gravity-driven) |
>92 99.0–99.9 (gravity-driven) |
NR | >95% after 40 cycles; Good | [61] |
| 4 | Unmodified recycled PET nanofibrous membrane | Electrospinning/ 95 vol% hexadecane, 5 vol% DI water, Span 80 (1 wt% ) |
Vacuum-assisted filtration | >6500 | >98 fresh >95 after 3 cycles |
NR | 3 cycles; High stability in acidic/alkaline media | [54] |
| 5 | Bio-PU/TiC | Electrospinning/ 10 vol% water, Span 80 and 90 vol% hexane) | Pressure-assisted/ gravity-assisted | 2464.79 | 99.65 | NR | NR; Good | [58] |
| 6 | PVDF/HFP | Electrospinning/ water: 1 wt%, 99% n-hexane and disel oil | Vacuum: -0.08 MPa |
2436-25000 | 99.63-99.95 | NR | Good; NR | [55] |
| 7 | COF-haTab/PAN | Electrospinning/ Span 80, 1–10 wt% water, 90 vol% n-hexane) | Gravity-driven filtration | 4229 | >99.9 | NR | Excellent; Good | [56] |
| 8 | CMPs | Electrospinning/ Span 80, 1 vol% water, 99 vol% Dichloromethane | Vacuum-assisted filtration | 865.8 | 99.9 | NR | NR; Good resistance to dichloromethane | [57] |
| 9 | PES modified with fluorinated SiO₂ NPs | Phase inversion/ 10 vol% water, 90 vol% n-hexane | Dead-end vacuum | 1020.4 | 97.4 | NR | 5 cycles | [62] |
| 10 | PES–PUMA(4.7) | Electrospinning / water: 10 vol%, 90 vol% oil | 0.02-0.1 MPa, 0.05-0.5 mL/s |
36.5–87.6 23.4-90.7 |
78.2-93.1 78.4-95.3 |
63.8-96.6 | 10 cycles; Excellent (Acid/Alkali) | This work |
NR: Not reported3.6. Proposed mechanism for W/O emulsion separation by the PES-PUMA membrane.
Disclaimer/Publisher’s Note: The statements, opinions and data contained in all publications are solely those of the individual author(s) and contributor(s) and not of MDPI and/or the editor(s). MDPI and/or the editor(s) disclaim responsibility for any injury to people or property resulting from any ideas, methods, instructions or products referred to in the content. |
© 2026 by the authors. Licensee MDPI, Basel, Switzerland. This article is an open access article distributed under the terms and conditions of the Creative Commons Attribution (CC BY) license.
Copyright: This open access article is published under a Creative Commons CC BY 4.0 license, which permit the free download, distribution, and reuse, provided that the author and preprint are cited in any reuse.