

Submitted:
04 October 2026
Posted:
08 October 2026
You are already at the latest version
Abstract
Botanical gardens are repositories of biodiversity and heritage, yet their sustainability is threatened by canopy closure and spatial saturation. This study analyzes 87 years (1939–2026) of structural dynamics in the Carlos Spegazzini Botanical Garden (La Plata, Argentina). We combined historical aerial photo interpretation, field censuses (535 trees), allometric modeling, and spatial competition analyses (Voronoi polygons, nearest-neighbor distances, Clark-Evans index). Tree density decreased from 185.0 to 119.5 ind/ha, while canopy cover increased from 44.6% to 102.4%, with estimated crown cover peaking at 202.2%, well above the 70% saturation threshold. Crown radii increased significantly (Kruskal-Wallis χ² = 492.95, p < 0.001), and the Clark-Evans index confirmed a clustered distribution (R = 0.620, p < 0.001). Of the 535 individuals, 218 (40.7%) were heritage trees, with 78.9% in good sanitary condition and 46 requiring urgent care. Despite intense crown overlap, the 5.6% mortality (2022–2026) was not explained by spatial variables (pseudo-R² = 0.0038; AUC = 0.481). Pathogens, mechanical damage, or senescence would be the primary drivers. We recommend selective thinning, priority phytosanitary care, a necropsy protocol, gradual renewal, and density targets of 120–150 ind/ha to balance ecological functioning with heritage preservation.
Keywords:
botanical garden
; spatial saturation
; canopy cover
; heritage trees
; long-term monitoring
; GIS
1. Introduction
The Botanical gardens began as collections of medicinal plants in the 16th century but today serve scientific, educational, cultural, and conservation efforts at global levels [1,2,3]. Approximately 2,500 botanical gardens preserve almost 80,000 species, 25% of all known vascular plants [4,5]. Their living collections serve as both genetic repositories and heritage assets, particularly when specimens have survived for centuries [6,7].
Managing tree collections in historical botanical gardens constitutes challenges that distinguish them from natural forests [8,9]. In wild ecosystems, disturbances such as fire, windthrow, and senescence are integral parts of the ecological dynamics. Botanical gardens typically maintain dense plantings with minimal intervention to preserve aesthetic and scientific value [10]. This management often triggers a cascade of effects: progressive canopy closure, intense above- and belowground competition, and ultimately, a spatial saturation where crown overlap restricts light penetration and growing space [9,11,12]. Tree saturation can push tree density beyond critical thresholds, driving intense resource competition for light, water, and nutrients, crown overlap, physiological stress, and elevated mortality risk [9,11,13]. Soil compaction, air pollution, and the urban heat island effect further predispose trees to pathogen attack and premature decline [13,14]. Maintaining the historical and aesthetic integrity of these sites while ensuring their ecological viability demands an evidence-based management [1,15,16].
The “Carlos Spegazzini” Botanical Garden and Arboretum was founded in 1891 within the Facultad de Ciencias Agrarias y Forestales of the Universidad Nacional de La Plata. It holds a unique place in history as the first botanical garden in Argentina and a pioneer in South America [22,23]. It was founded by the renowned Italian-Argentine naturalist Carlos Spegazzini, who initially planted native Argentine tree species collected during his extensive expeditions across the country [22,24]. Over the subsequent 135 years, this initial collection has been enriched through successive additions of both native and exotic taxa, resulting in a heterogeneous arboreal assemblage that has grown with minimal documented pruning or structural intervention [22,25]. This long history of passive management now raises critical questions about the long-term sustainability of the collection, particularly for its centenary heritage trees.
Despite its historical and scientific importance, systematic studies of the Spegazzini Garden’s spatial dynamics, canopy development, and competition patterns remain scarce. Here, we combined historical aerial photography, field inventories, and spatial analysis to address this gap. Specifically, our study pursues four interrelated objectives over an 87-year period (1939-2026), following the availability of aerial photos. First, we quantified tree density and canopy cover changes from 1939 to 2026 using nine aerial photographs. Second, we identify the proportion of heritage trees and evaluate their sanitary status as indicators of senescence and risk. Third, we analyze current spatial competition patterns and identify overcrowded sectors. Finally, we evaluate mortality drivers between 2022 and 2026, testing whether spatial competition variables explain tree death in the current collection. By integrating historical remote sensing, field inventories, and spatial statistics, we generated actionable knowledge to guide the management of centenary urban tree collections.
2. Materials and Methods
We combined two complementary approaches to quantify spatio-temporal changes in tree density and canopy structure [17,18]. First, we combined aerial photograph interpretation with geographic information systems (GIS) to reconstruct historical vegetation dynamics and quantify long-term trends in canopy cover, crown dimensions, and spatial distribution patterns [19,20]. Second, we complement this historical perspective with detailed field inventories that provide high-resolution data on species composition, diameter distribution, tree health, and mortality [16,21]. Together, these approaches enabled evidence-based assessments and targeted management design.
2.1. Study Area
We conducted this study in the “Carlos Spegazzini” Botanical Garden and Arboretum (34°54’47”S, 57°55’58”W), which belongs to the Facultad de Ciencias Agrarias y Forestales of the Universidad Nacional de La Plata, Argentina.
2.2. Field Data Collection (2022–2026)
We recorded a total of 535 trees within the garden. For each tree, we recorded the following variables: diameter at breast height (DBH, cm) in both 2022 and 2026, geographic coordinates (WGS84, later converted to UTM Zone 21S, EPSG:32721), sanitary status, vital status (live or dead, to assess mortality between 2022 and 2026), planting year (when available), number of stems (for multi-stemmed trees), and heritage status (yes/no).
We classified heritage (patrimonial) trees following the methodological framework of Benito & Palermo [26], who define a tree as patrimonial when it is linked to historical, cultural, or environmental events, or when it exhibits outstanding botanical, educational, or monumental characteristics. We classified trees as patrimonial if they met any of the following: age >100 years, DBHeq >100 cm, height >30 m, or crown diameter >25 m.
Sanitary status was assessed using a three-level scale adapted from standard arboricultural protocols: I—Good: vigorous tree without dead branches ≥20 cm in diameter; II—Regular: alive trees with dead branches ≥20 cm in diameter in less than 50% of the crown; and III—Poor: trees showing cavities, wood decay, or with dead branches ≥20 cm in diameter in more than 50% of the crown.
2.3. Aerial Photointerpretation and Canopy Dynamics (1939–2026)
To reconstruct long-term changes in tree density and canopy structure, we analysed a time series of nine georeferenced aerial photographs (1939, 1957, 1966, 1972, 1978, 1984, 1992, 1997, and 2026). For each year, we manually digitized the garden boundary, buildings, and individual tree canopies using QGIS (projection: UTM Zone 21S). From these digitizations, we derived two key structural metrics. We measured canopy radii from trunks to crown edges, generated circular buffers, and calculated total cover as the union of all circles divided by the effective green area (garden minus buildings). We then computed tree density and canopy cover for each year.
All spatial processing and statistical analyses were performed in R (version 4.3.2). To test for differences in crown radius distributions across years, we used the Kruskal-Wallis rank sum test, and we calculated bootstrap 95% confidence intervals for median crown radii based on 1,000 resamples. These analyses enabled us to quantify canopy structure changes and detect periods of significant shift.
2.4. Spatial Competition and Statistical Analyses
To characterize spatial competition among trees, we calculated nearest-neighbor distances from UTM coordinates using the k-nn algorithm (k = 1) with the FNN package in R. We also generated Voronoi polygons for all trees, clipped to the effective green area using the sf package, and took the area of each polygon as the available growing space for that individual. We calculated the equivalent DBH (DBHeq) as the quadratic mean of stem diameters for multi-stemmed trees. We then estimated crown radius (CR) from DBHeq using a generalized allometric equation fitted from 53 field measurements (Mean Absolute Error: 1.2046, R² : 0.8093):
CR (m) = 0.674682 + 0.201023 × DBHeq ^ 0.836587,
As a proxy for local crown overlap and competition intensity, we used the crown area / Voronoi area ratio, where values >1 indicate that the estimated crown area exceeds the available growing space, implying potential competition with neighbouring trees.
We calculated the Clark-Evans index (R) using the spatstat package with Donnelly’s correction for edge effects to assess the overall spatial pattern. This index compares observed and expected mean nearest-neighbor distances under complete spatial randomness, where R < 1 indicates aggregation, R ≈ 1 randomness, and R > 1 regularity.
We compared live and dead trees using Mann-Whitney U tests for DBHeq, nearest-neighbor distance, number of stems, and Voronoi area to assess mortality drivers between 2022 and 2026. We then fitted a logistic regression model (glm, binomial family) with mortality as the binary response and the same variables as standardized predictors. Model performance was evaluated using McFadden’s pseudo-R² and the area under the ROC curve (AUC), calculated with the pROC package.
All spatial processing and statistical analyses were performed in R (version 4.3.2) using the following main packages: sf, ggplot2, FNN, spatstat, deldir, and pROC. The R scripts and complete dataset are openly available in an open repository (see Data Availability Statement). Generative AI (GenAI) tools were used to assist in the development and debugging of the R scripts for spatial and statistical analyses. The authors reviewed, validated, and take full responsibility for the final code and all results presented in this manuscript.
3. Results
3.1. Objective 1: Changes in Tree Density and Canopy Cover (1939-2026)
Our 87-year analysis reveals a structural transformation: tree numbers peaked in the mid-20th century but declined thereafter, reducing stand density towards the end of the study period (Table 1).
Simultaneously, crown radii increased with a notable acceleration in recent years (Figure 1). This expansion of individual crowns drove a sustained rise in tree cover, from 44.6% in 1939 to 102.4% in 2026, an indicator of spatial saturation. The expansion of built infrastructure throughout the study period further reduced the effective green area, intensifying spatial constraints.
The Kruskal-Wallis test shows highly significant differences in crown radius distributions among years (χ² = 492.95, df = 8, p < 0.001), with the 2026 distribution standing out as structurally distinct from earlier periods. This temporal shift is illustrated in the mosaic of histograms and violin plots (Figure 2). The 1939 survey shows a narrow, right-skewed distribution in small size classes, which progressively widens and shifts towards larger crowns over time, culminating in 2026 with a broad dispersion and trees exceeding earlier maxima. The violin plots suggest increasing medians (red diamonds) and spread, while bootstrap letters indicate a clear progression, confirming a statistically significant structural shift. The 2026 panel visually captures the crown overlap, consistent with canopy cover exceeding 100% (Table 1).
3.2. Objective 2: Heritage (Centenary) Trees and Sanitary Status
We identified 218 heritage trees, representing 40.7% of the 535 censused individuals. The majority of these specimens (78.9%) were classified in sanitary condition I (Good), indicating that, despite the spatial competition documented above, most heritage trees remain vigorous. However, 17.0% were in II (Regular) and 4.1% in III (Poor), representing 46 trees that require urgent management attention.
The distribution of sanitary categories by DBHeq class (Table 2) reveals a striking U-shaped pattern across the entire population. The highest proportions of trees in Good condition occur in the smallest (<10 cm) and largest (>80 cm) size classes, while trees in the intermediate 20-50 cm range show the highest percentages of Regular and Poor status.
3.3. Objective 3: Spatial Competition (DBHeq vs. Neighbor Distance)
Our spatial analysis reveals a complex pattern of competition, where trunk spacing and crown overlap tell contrasting stories. The current tree population (2026) within the effective green area (2.42 ha) showed a mean nearest-neighbor distance of 3.32 m (SD = 2.09 m). Spearman correlation between equivalent DBHeq and nearest-neighbor distance was positive and significant (ρ = 0.210, p < 0.001), indicating that larger trees tend to be more separated from their neighbours (Figure 3). We confirmed significant differences in nearest-neighbor distance across DBHeq classes (Kruskal-Wallis, χ² = 22.25, df = 10, p = 0.014). Despite this apparent spacing advantage, the overall spatial distribution was highly clustered (Clark-Evans R = 0.6198, p < 0.001), indicating that trees tend to form groups.
Competition becomes evident when we consider crown overlap rather than trunk spacing. The crown-to-Voronoi area ratio exceeded 1.0 starting from the 20-30 cm DBHeq class and increased sharply with tree size, reaching a median of 11.2 in trees with DBHeq > 100 cm (Table 3). Crown area exceeded available growing space for most trees above 20 cm DBHeq, confirming intense local competition. Consequently, the estimated total crown cover reached 202.2% of the effective green area -substantially above the 70% saturation threshold commonly used for urban forests [17]. This extreme crown overlap is consistent with the canopy cover >100% observed in our aerial analysis (Section 3.1).
3.4. Mortality Rates
Despite the extreme spatial saturation documented above, mortality between 2022 and 2026 was relatively low (5.6%, 30 trees) and was not explained by any of the spatial competition variables we analyzed. The logistic regression model showed no significant predictors among DBHeq, nearest-neighbor distance, number of stems, and Voronoi area (all p > 0.30), with very low explanatory power (McFadden’s pseudo-R² = 0.0038; AUC = 0.481). Univariate comparisons between live and dead trees using Mann-Whitney U tests corroborated this finding, showing no significant differences in DBHeq (p = 0.433), nearest-neighbor distance (p = 0.788), number of stems (p = 0.507), or Voronoi area (p = 0.459).
Despite the intense crown overlap and spatial saturation we documented, these factors did not explain recent tree mortality. The observed deaths were more likely driven by pathogens, mechanical damage, or senescence, which our spatial metrics failed to capture. Competition effects may also operate with a time lag beyond our four-year field observation window. These findings highlight the need for systematic necropsy protocols to identify actual mortality causes.
4. Discussion
4.1. Severe Spatial Saturation and Canopy Dynamics (Objective 1)
Our 87-year analysis reveals a transformation of the garden’s canopy structure, characterized by increasing canopy cover and crown radii despite declining tree density. This pattern is consistent with global observations in minimally thinned urban and botanical collections [9,11,13]. The highly significant Kruskal-Wallis test and bootstrap confidence intervals confirm that crown sizes in 2026 represent a structurally distinct assemblage compared to earlier decades. The Clark-Evans index further indicates a clustered spatial pattern, likely reflecting the original planting design established by Spegazzini and subsequent additions [22,23]. This clustered pattern is consistent with observations in other historical botanical gardens, where original planting layouts persist despite decades of growth [15,18].
The estimated crown cover using the fitted allometric equation reached 202.2% of the green area, far above the 70% saturation threshold commonly used for urban forests [9,13]. The discrepancy with observed aerial cover (102.4%) reflects both methodological limitations and a positive ecological feature: the existence of multiple vertical strata and shade-tolerant understory species captured in the field inventory but invisible in aerial photographs. This layered structure that enhances habitat diversity and resilience [9,11].
The fluctuating tree density, peaking in 1966 and declining thereafter, likely reflects active management decisions (species replacement, pruning, removals) rather than natural self-thinning [27]. Bootstrap grouping (Figure 2) reveals a stable period from 1957 to 1984 (group ‘b’), indicating sustained management with relatively small-crowned trees and continuous turnover. From 1992 onward, we observed a progressive shift toward larger crowns, which is consistent with group ‘c’, culminating in the 2026 saturation (group ‘d’) (Figure 3). The positive correlation between larger trees and greater neighbour distances supports the interpretation that valuable specimens historically received greater spacing and care [11,24] or that smaller trees have colonized interstices over time through natural regeneration.
However, after 1984, reduced personnel, shifting institutional priorities, and declining budgets likely decreased active interventions -a trend consistent with broader institutional and national budgetary constraints documented for Argentine universities in the late 1980s and 1990s [23]. This reduced management intensity initiated the slow canopy closure that ultimately resulted in extreme spatial saturation. The crown-to-Voronoi area ratio exceeding 1.0 from the 20-30 cm DBHeq class onward confirms that, regardless of management history, the garden now requires active intervention to restore ecological balance and preserve its heritage value.
4.2. Resilience of Heritage (Centenary) Trees (Objective 2)
We identified 218 heritage trees (40.7% of the 535 censused individuals), with 78.9% in Good sanitary condition. This apparent resilience despite extreme spatial saturation suggests that long-lived species can tolerate chronic competition once established [1,28]. Similar patterns of centenary tree persistence under high density have been reported in European historical gardens [1,15]. However, we must interpret this with caution, as a survivorship bias likely operates here: the trees we observe today have survived decades of competition, while less vigorous individuals have already been lost, so the “resilience” we document may reflect past mortality as much as inherent tolerance.
The U-shaped distribution of sanitary status across DBHeq classes supports this interpretation, with Good condition predominating in the smallest (<10 cm) and largest (>80 cm) classes, while intermediate classes (20-50 cm) show the highest Regular and Poor status and mortality rates. This pattern suggests that legacy specimens received greater spacing and care [23,24], while intermediate-sized trees experience the most acute competitive stress. These individuals are precisely the most vulnerable to the survivorship filter, mirroring findings in other densely planted historical gardens [9,13].
The 46 heritage trees (21%) in Regular or Poor condition represent a priority for management. These irreplaceable trees, often associated with historical, cultural, or botanical significance [26], require urgent attention. Similar concerns in other historical gardens have prompted proactive conservation strategies [15,29], including annual phytosanitary inspections to detect early decline and structural weakness. Our findings underscore the need for targeted interventions to safeguard these specimens, with particular focus on the intermediate size class, which represents the next generation of potential heritage trees and is most vulnerable to future mortality.
4.3. Patterns of Spatial Competition (Objective 3)
We found a positive correlation between DBHeq and nearest-neighbor distance, indicating that larger trees are more widely spaced -a pattern that likely reflects the original planting design, where valuable specimens were intentionally given greater room to grow [3,11]. This practice is consistent with Spegazzini’s personal selection of many of the garden’s founding trees [22,24]. However, this greater trunk spacing does not translate into reduced crown competition. The crown-to-Voronoi area ratio reveals that even the most separated individuals experience extreme canopy overlap due to their sheer size, indicating that competition in the garden is primarily mediated by crown expansion rather than trunk proximity. This pattern is further exacerbated by the clustered spatial distribution (Clark-Evans R < 1), particularly in the intermediate size classes (20-50 cm DBHeq), where competition is most intense. Our findings align with studies in other botanical gardens, where crown competition is identified as a key driver of tree decline, even when trunk spacing appears adequate [12,13].
4.4. Mortality Drivers (Objective 4)
One of the most striking findings is that mortality between 2022 and 2026 (5.6%, 30 trees) was not explained by any spatial competition variable. Several factors may account for this result. First, many species in the garden may possess high tolerance to competition, particularly after decades of coexistence, through traits such as shade tolerance or efficient resource use [3,9,11,28]. Second, the critical competition threshold that triggers mortality may not yet have been reached, especially for long-lived trees.
This mortality period coincided with one of the most severe multi-year droughts recorded in the La Plata Basin in recent decades (2021-2023), associated with a prolonged La Niña event. This extreme drought, combined with high temperatures, drove widespread water stress and elevated tree mortality in urban and peri-urban forests [30]. Local observations within the garden and surrounding areas -including complete loss of Acer palmatum specimens and extensive dieback of Viburnum spp.- support the role of drought as a major contributing factor. In addition, reduced maintenance intensity during the COVID-19 pandemic (2020-2022), including limited personnel and restricted access to essential tools, likely exacerbated tree stress and delayed sanitary interventions [31].
Thus, the observed deaths were most likely driven by a combination of extreme climatic stress (particularly the 2022-2023 drought), pathogens, mechanical damage, and senescence, rather than by spatial competition alone [13,29]. Competition effects may also manifest with a significant time lag, and our four-year observation window may be too short to fully detect them [9,12]. Without systematic records on causes of death, we cannot distinguish between these drivers, highlighting the urgent need for a formal forest necropsy protocol [29].
5. Conclusions
The extreme spatial saturation documented in this study poses significant challenges for the long-term sustainability of the garden, yet it also provides a clear evidence base for management action. Based on our findings, we propose five priority strategies. First, selective thinning should target the 20-50 cm DBHeq range, where we observed the highest density and mortality rates. Removing suppressed or poor-condition individuals would reduce competition and release resources for retained trees, particularly in areas of severe crown overlap [9,11]. Second, we recommend intensive phytosanitary monitoring of the 46 heritage trees (21%) currently in Regular or Poor condition. Annual inspections and timely interventions -including sanitary pruning, fertilization, and pest control- are essential to safeguard these irreplaceable specimens [15,26,29]. Third, a formal forest necropsy protocol should be implemented to identify the primary drivers of mortality (pathogens, water stress, mechanical damage), enabling more precise and effective management actions [9,29]. Fourth, a gradual renewal plan is urgently needed. Given the lack of space for natural regeneration, dead or declining trees should be substituted with historically documented and climate-adapted species, preserving the garden’s identity and taxonomic diversity [3,13,17,32]. Fifth, we recommend long-term density targets of 120-150 ind/ha and canopy cover below 70%, to be achieved through gradual thinning and renewal [1,9,11,19].
These strategies align with adaptive management frameworks for historical botanical gardens facing density and climate challenges [1]. Ultimately, management must balance ecological sustainability with the preservation of cultural and historical values [15,33], honoring the legacy of Carlos Spegazzini and the irreplaceable heritage trees that define this garden.
Author Contributions
Conceptualization: J.M.C. and P.C., Methodology: J.M.C., P.C. and G.D., Software: J.M.C. and P.C., Validation: L.P.P., Formal analysis: J.M.C. and P.C., Investigation: P.C., G.D., J.M.C., L.P.P., L.M., F.C., and M.M., Resources: J.M.C., Data curation: L.P.P., L.M., F.C., and M.M., Writing original draft preparation: J.M.C. Writing, review and editing: P.C., G.D., and J.M.C., Visualization: J.M.C. and P.C., Supervision: J.M.C., Project administration: G.D.
Funding
This research received no external funding.
Institutional Review Board Statement
Not applicable. This study did not involve human participants or animals.
Data Availability Statement
The historical aerial photographs, forest structure datasets, GIS files, and R scripts generated and analyzed during this study are openly available in [XXX] at xxx.xxxxx.
Acknowledgments
We gratefully acknowledge the General Directorate of Cadastre and Geodesy of Buenos Aires Province and Lic. Gabriela Novak for providing the historical aerial photographs (1939–1997) essential to this study. We thank Lic. María Agustina Alvaro Grand and photographer Pablo Bremec for facilitating access to the 1939 image. Special thanks to the Historical Archive of the Universidad Nacional de La Plata, its Director Lic. Arch. Laura Mariana Casareto and her team, for granting access to valuable historical documents and photographs. We also thank the Julio Ocampo Museum (FCAyF) for preserving and making available key institutional heritage materials. We are grateful to Marcelo Taffarel and his IT team for recovering and sharing important historical photographs. Finally, we thank Nadia P. Kastelanovich and Marcelo P. Hernández for his expert assistance in the taxonomic identification of heritage trees. During the preparation of this study, the authors used DeepSeek-V3 for the purpose of generating and debugging the R scripts used for spatial and statistical analyses. The authors have reviewed and edited the output and take full responsibility for the content of this publication.
Conflicts of Interest
The authors declare no conflicts of interest.
Abbreviations
The following abbreviations are used in this manuscript:
| AUC | Area Under the ROC Curve |
| CR | Crown Radius |
| DBH | Diameter at Breast Height |
| DBHeq | Equivalent Diameter at Breast Height |
| FCAyF | Facultad de Ciencias Agrarias y Forestales |
| GenAI | Generative Artificial Intelligence |
| GIS | Geographic Information System |
| LIMAD | Laboratorio de Investigaciones en Madera |
| ROC | Receiver Operating Characteristic |
| SD | Standard Deviation |
| UNLP | Universidad Nacional de La Plata |
| UTM | Universal Transverse Mercator |
References
- Bartoli, F.; Pontrandolfi, M.A.; Hosseini, Z.; Caneva, G. A Floristic Analysis and Reconstruction for the Renewal of Botanical Memory: The “Experimental Agricultural Garden of Villa Santa Maria in Potenza” (Southern Italy) as a Model. J. Zool. Bot. Gard. 2026, 7, 12. [Google Scholar] [CrossRef]
- Li, Y.; Li, S.; Zhao, G. Spatiotemporal development of national botanic gardens worldwide and their contributions to plant diversity conservation from 1593 to 2023. Front. For. Glob. Change 2023, 6, 1310381. [Google Scholar] [CrossRef]
- Heywood, V.H. The role of botanic gardens as resource and introduction centres in the face of global change. Biodivers. Conserv. 2011, 20, 221–239. [Google Scholar] [CrossRef]
- Mounce, R.; Smith, P.; Brockington, S. Ex situ conservation of plant diversity in the world’s botanic gardens. Nat. Plants 2017, 3, 795–802. [Google Scholar] [CrossRef]
- O’Donnell, K.; Sharrock, S. The contribution of botanic gardens to ex situ conservation through seed banking. Plant Divers. 2017, 39, 373–378. [Google Scholar] [CrossRef]
- Westwood, M.; Cavender, N.; Meyer, A.; Smith, P. Botanic garden solutions to the plant extinction crisis. Plants People Planet 2021, 3, 22–32. [Google Scholar] [CrossRef]
- Faraji, L.; Karimi, M. Botanical gardens as valuable resources in plant sciences. Biodivers. Conserv. 2022, 31, 2905–2926. [Google Scholar] [CrossRef]
- Martin, S. Climate ready? Exploring the impacts and lessons from recent extreme events at Royal Botanic Garden Edinburgh for climate change adaptation in the horticulture sector. Sibbaldia 2014, 12, 155–170. [Google Scholar] [CrossRef]
- Carrari, E.; Aglietti, C.; Bellandi, A.; Dibari, C.; Ferrini, F.; Fineschi, S.; Galeotti, P.; Giuntoli, A.; Manganelli Del Fa, R.; Moriondo, M.; et al. The management of plants and their impact on monuments in historic gardens: Current threats and solutions. Urban For. Urban Green. 2022, 76, 127727. [Google Scholar] [CrossRef]
- Ignatieva, M.E.; Stewart, G.H. Homogeneity of urban biotopes and similarity of landscape design language in former colonial cities. In Ecology of Cities and Towns: A Comparative Approach; McDonnell, M.J., Hahs, A.K., Breuste, J.H., Eds.; Cambridge University Press: Cambridge, UK, 2009; pp. 399–421. [Google Scholar]
- Kendal, D.; Williams, N.S.G.; Williams, K.J.H. A cultivated environment: Exploring the global distribution of plants in gardens, parks and streetscapes. Urban Ecosyst. 2012, 15, 637–652. [Google Scholar] [CrossRef]
- Esperon-Rodriguez, M.; Rymer, P.D.; Power, S.A.; Barton, D.N.; Carinanos, P.; Dobbs, C.; Eleuterio, A.A.; Escobedo, F.J.; Hauer, R.; Hermy, M.; et al. Assessing climate risk to support urban forests in a changing climate. Plants People Planet 2022, 4, 201–213. [Google Scholar] [CrossRef]
- D’Antraccoli, M.; Weiger, N.; Cocchi, L.; Peruzzi, L. The trees of the Pisa Botanic Garden under climate change scenarios: What are we walking into? Sustainability 2023, 15, 4585. [Google Scholar] [CrossRef]
- Cinar, H.; Guzel, M. Investigation on rational use of water in a palace garden: A case of Dolmabahce Palace (Mabeyn Garden). Fresenius Environ. Bull. 2020, 29, 6469–6478. [Google Scholar]
- Tikhonova, O. Gardens as architectural heritage of the bastion castle ensemble. Heritage 2023, 6, 1713–1731. [Google Scholar] [CrossRef]
- Liu, T.; Mi, B.; Yan, H.; Bao, Z.; Wu, R.; Wang, S. Spatiotemporal Distribution Analysis of Spatial Vitality of Specialized Garden Plant Landscapes during Spring: A Case Study of Hangzhou Botanical Garden in China. Forests 2024, 15, 208. [Google Scholar] [CrossRef]
- Li, Y.; Li, S.; Wang, C. Spatiotemporal evolution of Chinese botanical gardens over the last 5000 years. Sustainability 2022, 14, 15806. [Google Scholar] [CrossRef]
- Almeida, D.M.; Freire, F.J.; Silva, M.V.; Barbosa, U.N.; Cavalcante, D.M.; Silva, E.A. Geospatial distribution of forest species in the Botanical Garden of Recife, Pernambuco, Brazil. Floresta 2023, 53, 145–154. [Google Scholar] [CrossRef]
- Oznamets, V.V.; Belokonev, G.V. Environmental spatial survey of the Nikitsky Botanical Garden. IOP Conf. Ser. Earth Environ. Sci. 2021, 677, 052032. [Google Scholar] [CrossRef]
- Wang, R.; Jiang, W.; Lu, T. Landscape characteristics of university campus in relation to aesthetic quality and recreational preference. Urban For. Urban Green. 2021, 66, 127389. [Google Scholar] [CrossRef]
- Mu, B.; Liu, C.; Mu, T.; Xu, X.; Tian, G.; Zhang, Y.; Kim, G. Spatiotemporal fluctuations in urban park spatial vitality determined by on-site observation and behavior mapping: A case study of three parks in Zhengzhou City, China. Urban For. Urban Green. 2021, 64, 127246. [Google Scholar] [CrossRef]
- Katinas, L.; Gutiérrez, D.G.; Torres Robles, S.S. Carlos Spegazzini (1858-1926): Travels and botanical work on vascular plants. Ann. Mo. Bot. Gard. 2000, 87, 183–202. [Google Scholar] [CrossRef]
- Arambarri, A.M. Los profesores que conformaron la historia de la Cátedra de Botánica de la Facultad de Agronomía de la Universidad Nacional de La Plata (1883-1994). Rev. Fac. Agron. 2016, 115, 273–292. [Google Scholar]
- Molfino, J.F. El “Arboretum” de la Facultad de Agronomía de La Plata. Physis 1938, 12, 431–433. [Google Scholar]
- Cátedra de Botánica Especial. El arboretum de la Facultad de Agronomía: Patrimonio de la Universidad. Rev. Univ. 1982, 28, 139–150. [Google Scholar]
- Benito, G.N.; Palermo, M. El árbol en la ciudad: Manual de arboricultura urbana; Editorial de la Facultad de Agronomía: La Plata, Argentina, 2021; Available online: http://ri.agro.uba.ar/greenstone3/library/collection/libros/document/L9789873738357 (accessed on 15 September 2026).
- Yoda, K.; Kira, T.; Ogawa, H.; Hozumi, K. Intraspecific competition among higher plants. XI. Self-thinning in overcrowded pure stands under cultivated and natural conditions. J. Biol. Osaka City Univ. 1963, 14, 107–129. [Google Scholar]
- Gillner, S.; Bräuning, A.; Roloff, A. Dendrochronological analysis of urban trees: Climatic response and impact of drought on frequently used tree species. Trees 2014, 28, 1079–1093. [Google Scholar] [CrossRef]
- Kopylova, T.; Rumanikov, Y.; Porokhniava, O.; Muzyka, H.; Vitenko, V.; Bayura, O.; Hrynyk, H.; Hrynyk, O. Phytosanitary condition of age-old trees of the V.V. Pashkevych arboretum of the National Dendrological Park “Sofiyivka” of the National Academy of Sciences of Ukraine. Folia For. Pol. Ser. A 2025, 67, 61–75. [Google Scholar] [CrossRef]
- Naumann, G.; Podesta, G.; Marengo, J.; Luterbacher, J.; Bavera, D.; Acosta Navarro, J.; Arias-Muñoz, C.; Barbosa, P.; Cammalleri, C.; Cuartas, L.A.; et al. Extreme and Long-Term Drought in the La Plata Basin: Event Evolution and Impact Assessment until September 2022; EUR 31381 EN; Publications Office of the European Union: Luxembourg, 2023. [Google Scholar] [CrossRef]
- Hodor, K.; Przybylak, Ł.; Kuśmierski, J.; Wilkosz-Mamcarczyk, M. Identification and Analysis of Problems in Selected European Historic Gardens during the COVID-19 Pandemic. Sustainability 2021, 13, 1332. [Google Scholar] [CrossRef]
- Entwisle, T.J.; Cole, C.; Symes, P. Adapting the botanical landscape of Melbourne Gardens (Royal Botanic Gardens Victoria) in response to climate change. Plant Divers. 2017, 39, 338–347. [Google Scholar] [CrossRef]
- Hosseini, Z.; Bartoli, F.; Pontrandolfi, M.A.; Caneva, G. Identity of a historic garden: The view of the international literature and committees on the role of the botanical elements. Urban For. Urban Green. 2024, 101, 128501. [Google Scholar] [CrossRef]
Figure 1.
Aerial photographs (1939–2026) showing progressive canopy filling (3×3 mosaic).
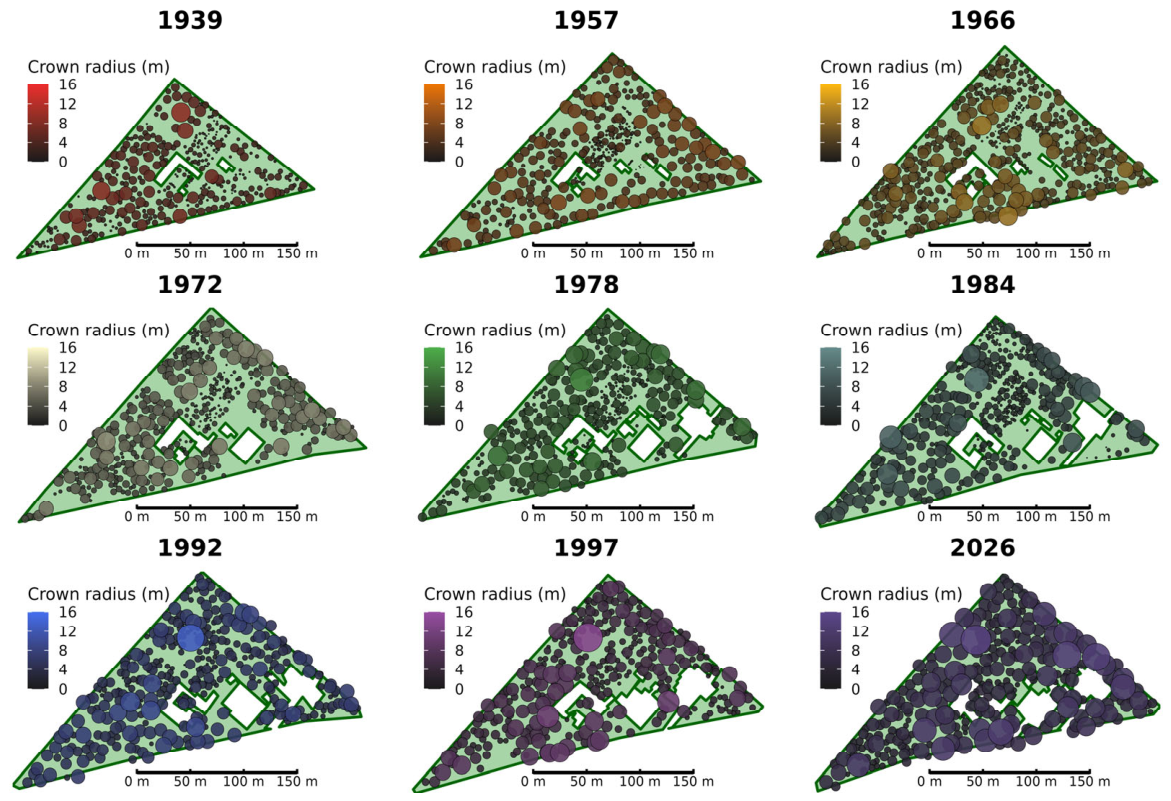
Figure 2.
Temporal evolution of crown radius distribution in the Carlos Spegazzini Botanical Garden and Arboretum (1939-2026). Upper panels: crown radius frequency distribution by year. Lower panels: Violin plots with quasirandom points and boxplots illustrating the distribution and median crown radius (red diamond). Letters indicate homogeneous groups based on bootstrap confidence intervals of the median.
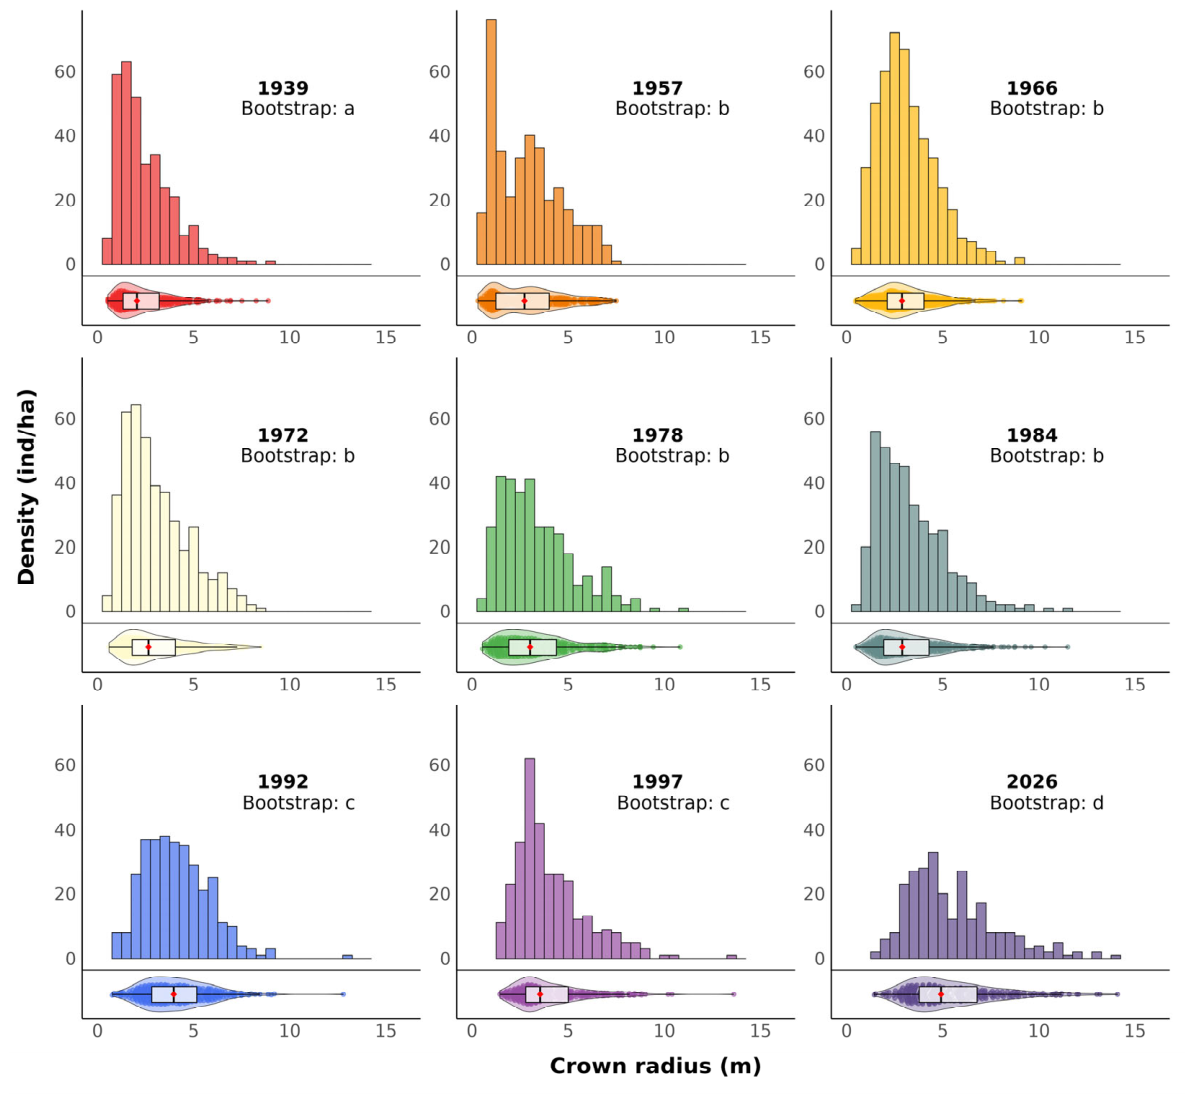
Figure 3.
Relationship between equivalent DBHeq and nearest neighbor distance in the Carlos Spegazzini Botanical Garden. Points: vitality status (green: alive, red: dead), size by stem number; heritage trees (black border). Blue line: loess trend with 95% confidence band.
Figure 3.
Relationship between equivalent DBHeq and nearest neighbor distance in the Carlos Spegazzini Botanical Garden. Points: vitality status (green: alive, red: dead), size by stem number; heritage trees (black border). Blue line: loess trend with 95% confidence band.
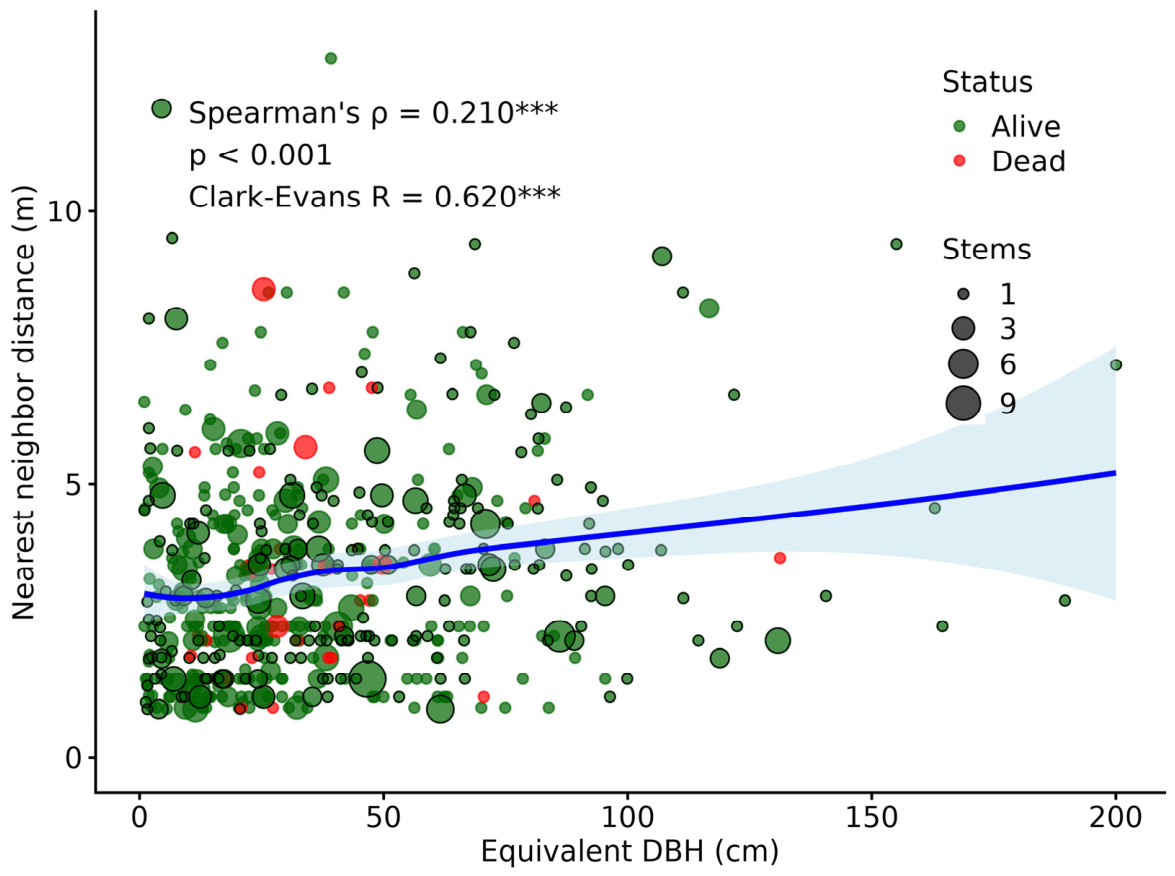

Table 1.
Temporal evolution of structural parameters in the Carlos Spegazzini Botanical Garden (1939–2026).
Table 1.
Temporal evolution of structural parameters in the Carlos Spegazzini Botanical Garden (1939–2026).
| Year | n trees | Density (ind/ha) | Canopy cover (union, %) | Median crown radius (m) | Overlap (m²) | Buildings (ha) | Year |
| 1939 | 328 | 185.0 | 44.6 | 2.05 | 437 | 0.06 | 1939 |
| 1957 | 361 | 155.4 | 51.5 | 2.72 | 983 | 0.09 | 1957 |
| 1966 | 473 | 196.4 | 60.4 | 2.88 | 3,376 | 0.11 | 1966 |
| 1972 | 419 | 168.4 | 54.0 | 2.65 | 2,600 | 0.15 | 1972 |
| 1978 | 336 | 144.4 | 58.8 | 3.02 | 1,968 | 0.28 | 1978 |
| 1984 | 379 | 164.6 | 58.1 | 2.89 | 3,312 | 0.27 | 1984 |
| 1992 | 333 | 141.8 | 71.2 | 3.96 | 3,923 | 0.34 | 1992 |
| 1997 | 316 | 138.3 | 70.3 | 3.54 | 3,832 | 0.33 | 1997 |
| 2026 | 266 | 119.5 | 102.4 | 4.91 | 6,960 | 0.37 | 2026 |
Table 2.
Sanitary status (2022-2026) and mortality by DBHeq class in the Carlos Spegazzini Botanical Garden. Values are percentages of trees in each category. n = number of trees per DBHeq class.
Table 2.
Sanitary status (2022-2026) and mortality by DBHeq class in the Carlos Spegazzini Botanical Garden. Values are percentages of trees in each category. n = number of trees per DBHeq class.
| Group | DBHeq class (cm) | n | Good% | Regular% | Poor% | Mortality% |
| Heritage | <10 | 36 | 94.4 | 5.6 | 0.0 | |
| Heritage | 10-20 | 23 | 82.6 | 13.0 | 4.3 | |
| Heritage | 20-30 | 21 | 71.4 | 23.8 | 4.8 | |
| Heritage | 30-40 | 26 | 80.8 | 19.2 | 0.0 | |
| Heritage | 40-50 | 26 | 73.1 | 23.1 | 3.8 | |
| Heritage | 50-60 | 13 | 61.5 | 38.5 | 0.0 | |
| Heritage | 60-70 | 23 | 65.2 | 21.8 | 13.0 | |
| Heritage | 70-80 | 9 | 55.6 | 22.2 | 22.2 | |
| Heritage | 80-90 | 13 | 100 | 0.0 | 0.0 | |
| Heritage | 90-100 | 12 | 91.7 | 8.3 | 0.0 | |
| Heritage | >100 | 16 | 75.0 | 18.8 | 6.2 | |
| Heritage | Total | 218 | 78.9 | 17.0 | 4.1 | |
| Total | <10 | 82 | 87.8 | 11.0 | 1.2 | 0.0 |
| Total | 10-20 | 98 | 77.6 | 12.2 | 5.2 | 5.1 |
| Total | 20-30 | 95 | 69.5 | 13.7 | 7.4 | 9.4 |
| Total | 30-40 | 69 | 68.1 | 17.4 | 4.3 | 10.2 |
| Total | 40-50 | 51 | 70.6 | 15.7 | 2.0 | 11.7 |
| Total | 50-60 | 27 | 77.8 | 18.5 | 3.7 | 0.0 |
| Total | 60-70 | 40 | 77.5 | 15.0 | 7.5 | 0.0 |
| Total | 70-80 | 21 | 71.4 | 14.3 | 9.5 | 4.8 |
| Total | 80-90 | 20 | 95.0 | 0.0 | 0.0 | 5.0 |
| Total | 90-100 | 14 | 92.9 | 7.1 | 0.0 | 0.0 |
| Total | >100 | 18 | 66.7 | 22.2 | 5.6 | 5.5 |
| Total | Total | 535 | 76.3 | 13.6 | 4.5 | 5.6 |
Table 3.
Nearest-neighbor distance, mortality, and crown/Voronoi area ratio by DBHeq class.
| DBHeq class (cm) | n | Mean neighbor distance (m) | Mortality (%) | Crown/Voronoi ratio (median) |
| <10 | 82 | 3.07 | 0.0 | 0.17 |
| 10–20 | 98 | 2.84 | 5.1 | 0.52 |
| 20–30 | 95 | 3.11 | 9.5 | 1.22 |
| 30–40 | 69 | 3.37 | 10.1 | 1.81 |
| 40–50 | 51 | 3.43 | 11.8 | 2.39 |
| 50–60 | 27 | 3.41 | 0.0 | 4.81 |
| 60–70 | 40 | 3.82 | 0.0 | 5.68 |
| 70–80 | 21 | 3.97 | 4.8 | 6.00 |
| 80–90 | 20 | 3.93 | 5.0 | 4.86 |
| 90–100 | 14 | 3.41 | 0.0 | 4.66 |
| >100 | 18 | 4.68 | 5.6 | 11.2 |
Disclaimer/Publisher’s Note: The statements, opinions and data contained in all publications are solely those of the individual author(s) and contributor(s) and not of MDPI and/or the editor(s). MDPI and/or the editor(s) disclaim responsibility for any injury to people or property resulting from any ideas, methods, instructions or products referred to in the content. |
© 2026 by the authors. Licensee MDPI, Basel, Switzerland. This article is an open access article distributed under the terms and conditions of the Creative Commons Attribution (CC BY) license.
Copyright: This open access article is published under a Creative Commons CC BY 4.0 license, which permit the free download, distribution, and reuse, provided that the author and preprint are cited in any reuse.