

Submitted:
06 October 2026
Posted:
08 October 2026
You are already at the latest version
Abstract
Changes in radionuclide composition can bias seawater tritium measurements under fixed calibration. We evaluate dual-diameter scintillating fiber arrays combining 1 mm sensing fibers with a separately read out reference cluster. Geant4 responses for seven layouts are coupled to a scintillation–silicon photomultiplier model. Calibration transfer is assessed using 19 literature-matched Sr/Cs pairs in a fixed natural matrix, with composition withheld from the estimator. At baseline optical collection, the 5 mm central cluster reduces absolute concentration bias by 35.5–59.0% across these compositions. For the strongest-interference composition at 100 Bq L−1 tritium, the predicted mean decreases from 133.7 to 113.8 Bq L−1, and the 4 h root mean squared error decreases from 37.0 to 21.9 Bq L−1. The cluster retains 88.8% of the conventional effective response and achieves the lowest calibrated minimum detectable activity concentration (MDA) among the dual-diameter candidates: 47.3–50.6 Bq L−1 at 4 h for the calibration and strongest-interference compositions. Its high-interference error advantage persists under alternative readout assumptions. The conventional array retains lower calibrated MDA and better precision near calibration. These simulations identify a design compromise between tolerance of changing interference and retention of tritium sensitivity.
Keywords:
tritium
; seawater
; scintillating fiber
; dual-diameter array
; radionuclide interference
; minimum detectable activity concentration
1. Introduction
Tritium (3H), the only radioactive isotope among the three naturally occurring hydrogen isotopes, is monitored in nuclear-facility discharges. Marine tritium derives from cosmogenic production, historical weapons testing and nuclear activities, whose relative contributions vary in space and time [1,2,3]. It commonly occurs as tritiated water and follows water transport. Online monitoring can track concentration changes in effluents and receiving waters during a release, provided that the detector distinguishes tritium from other radionuclides entering the measurement cell.
Nie et al. investigated coastal tritium dispersion in Hangzhou Bay [4], and Qu et al. examined coupled transport in water and the atmosphere [5]. Fukushima observations likewise reveal variable marine tritium distributions [6,7]. These findings motivate timely measurements without assuming proportional changes in tritium and interfering radionuclides.
Liquid scintillation counting provides sensitive laboratory measurements of aqueous tritium [8]. With electrolytic enrichment, Lin et al. reported a minimum detectable activity concentration (MDA) of 0.10 Bq L−1 for 350 mL seawater samples [9]. Zhang et al. developed a 700 mL enrichment method with a reported detection limit of 0.45 tritium units and applied it to the East China Sea [10]. These values depend on each study’s preparation conditions and statistical conventions. Sample preparation, enrichment and counting delay the availability of results. Automated liquid scintillation enables online analysis but requires reagents, sample conditioning and waste handling [8].
Solid scintillators allow repeated measurements without mixing each sample with a liquid scintillation cocktail. Granulated flow cells and plastic scintillation microspheres have been investigated [11,12]. The TRITIUM project developed modular fiber detectors through design, transport studies and field installation [13,14]. Sanada et al. combined a pellet flow cell with coincidence measurement, a veto detector and shielding, using spectral information to identify non-tritium interference qualitatively [15]. Interference assessment is thus an established requirement for scintillation-based tritium instruments.
Cheng et al. developed a plastic scintillating fiber array with a measured efficiency of 1.6 × 10⁻³ and an unshielded MDA of 3165 Bq L−1 over 1600 s [16]. Subsequent work examined array geometry [17] and simulated geometric optimization with suppression of external γ rays and cosmic muons [18]. These studies motivate an internal reference channel. Their source, shielding and readout conditions differ from those used here: published MDAs provide application context, whereas the present structural comparison uses common conditions.
Dissolved interference remains inside the measurement cell even with effective external shielding. Surveys around Chinese coastal nuclear facilities identify natural 40K and 226Ra and artificial 90Sr and 137Cs alongside tritium [19,20]. Coastal 90Sr also reflects transport and groundwater inputs [21,22], while observations off Japan show changing radiostrontium-to-radiocesium ratios [23,24]. Energetic electrons and photon-generated secondary electrons can cross a thin sensing fiber while depositing energy within the tritium window. A low-energy counting window therefore cannot identify the radionuclide responsible for every accepted event.
The proposed structure combines 1 mm sensing fibers with larger, independently read out fibers. Fine fibers provide the water–scintillator interface for short-range tritium electrons; larger fibers collect energy from penetrating interference. Coincident reference signals reject candidate events, while reference counts estimate the residual sensing-window background. We test whether this arrangement improves tritium measurement when sample composition is withheld, while retaining most of the fine-fiber response. Both structures use simultaneous background information: the conventional array retains its above-endpoint reference.
We examine this structural concept through radiation-transport simulation and matched performance comparisons. Seven layouts share a source library and readout model. Literature-based seawater compositions test calibration transfer as interfering activity concentrations and radionuclide ratios change. The estimator receives channel counts but no sample-specific interference composition. Concentration bias and root mean squared error (RMSE) quantify model-predicted measurement error; composition-calibrated MDA characterizes retained counting sensitivity. We compare conventional and dual-diameter arrays, then assess reference diameter, placement and optical collection to identify a suitable configuration for integrated tritium monitoring under variable interference.
2. Materials and Methods
2.1. Array Geometry
Figure 1 compares the conventional array with Inner and Outer arrays containing 5 mm reference fibers at the center and periphery, respectively. The cylindrical measurement chamber has a 25 mm inner radius; the chamber and fibers are 250 mm long. The 1 mm sensing fibers follow a hexagonal lattice with 1.3 mm pitch. The conventional array, Old, contains 1285 sensing fibers. Inner arrays contain seven large fibers; the illustrated Outer 5 mm array contains 26. These layouts differ in both reference-fiber placement and number. The transport model represents the fibers as homogeneous polystyrene in direct contact with water.
The single-fiber simulations in Figure 2 compare mean energy deposition from monoenergetic electrons and photons at diameters of 1, 2, 3, 5, 7.5 and 10 mm. Tritium-energy electron deposits vary little with diameter. The 546 keV response approaches a plateau, and the 1310 keV response shows diminishing gains near 7.5–10 mm, whereas responses to 2280 keV electrons and to photons continue to increase. Larger reference fibers therefore improve energy collection from penetrating radiation, with gains that depend on particle type and energy. The 5, 7.5 and 10 mm candidates span these response regimes and are evaluated in complete arrays to balance interference response against the loss of sensing-fiber area.
All layouts share the chamber envelope. Large fibers change the sensing-fiber count, exposed lateral area and water volume (Table 1). Comparisons hold activity concentration and counting time constant while retaining each layout’s water volume. Before optical readout, tritium count-rate sensitivity per unit concentration is G = Vw εH, where Vw is water volume and εH the acceptance probability per tritium decay.
2.2. Source Compositions and Radiation Transport
The emission library comprises tritium β decay and eight interference cases (Table 2). The 40K β and γ branches represent the abundant natural seawater component; 90Sr–90Y represents penetrating anthropogenic β interference, and the 137Cs daughter γ line represents radiocesium-induced secondary electrons. Selected 226Ra, 214Pb and 214Bi γ lines represent natural-series interference documented in coastal surveys [19,20,23]. Each history contains one primary emission and its transport-generated secondaries. Emission yields are applied once to the corresponding parent activity concentration.
Calibration composition L uses Ningde regional mean activity concentrations of 40K, 226Ra, 90Sr and 137Cs [19]. Transfer samples use literature Sr/Cs pairs. All 27 surface samples at 2 m in Casacuberta et al.’s Table 1 [23] were screened for matches in the updated cesium dataset by station, local sampling date and nominal depth [25]. Coordinates were converted to decimal degrees and required to agree within 0.001° in each coordinate, consistent with the reported cesium-position precision. This yielded 19 unique pairs: two records lacked corresponding cesium samples and six failed the coordinate criterion. Selection used neither activity thresholds nor detector performance. Cesium activity concentrations were corrected from 6 April 2011 to each sampling date using a 30.018 y half-life [26], converted from Bq m−3 to Bq L−1 and rounded to three significant digits. The modeled pairs span 0.0011–0.085 Bq L−1 90Sr and 0.00226–3.46 Bq L−1 137Cs (Table 3).
All 19 pairs are combined with the Yantai natural matrix: 9.99 Bq L−1 40K and 0.00930 Bq L−1 226Ra [20]. These controlled computational compositions do not reconstruct the original field samples. Identifiers follow the KOK stations; H29 denotes station 29, with the largest cesium input. The near-calibration sample Mref combines the Fuqing natural matrix [19] with 0.0037 Bq L−1 90Sr and 0.100 Bq L−1 137Cs from a separate cruise at station 20 on 26 August 2011 [24]. Together, L, Mref and the 19 station-based compositions give 21 modeled conditions. Five stations summarize the cesium-sorted range through the minimum, nearest-rank quartiles, median and maximum; all stations remain in the comparison.
Equal activity concentrations are assigned within 90Sr–90Y and 226Ra–214Pb–214Bi. These equilibrium assumptions give consistent daughter contributions across layouts. All comparisons use the selected emissions in Table 2, rather than complete decay schemes.
Radiation transport is simulated in Geant4 11.2.2 [27,28] with G4EmStandardPhysics_option4. Production range cuts are 0.5 μm for electrons and 1 μm for photons and positrons. The modeled seawater comprises 96.5% water and 3.5% NaCl by mass and has a density of 1.025 g cm−3. Polystyrene and PTFE use the corresponding Geant4 NIST materials. Primary positions are uniformly distributed throughout the water volume, with isotropic emission directions. Each of the 63 layout–emission combinations contains 106 histories.
For complete-array transport, electron energies follow the approximate allowed β spectrum
Here T is kinetic energy, T0 the endpoint, W = T + mec2 and pc = [T(T + 2mec2)]1/2. The Coulomb factor is F = x/[1 − exp(−x)], with x = 2π αfs Z W/(pc); αfs is the fine-structure constant and Z the daughter atomic number. The approximation omits transition-specific forbidden shape factors [29]. Photon cases use the discrete energies and yields in Table 2. Source definitions are identical across geometries.
2.3. Deposited Energy and SiPM Response
Let Es and El denote the energy deposited during one history, summed over all fibers in the small- and large-fiber channels, respectively. The raw small-fiber window is 0 < Es ≤ 18.6 keV. In dual-diameter arrays, accepted channel A additionally requires El < 18.6 keV; reference channel C includes every history with El ≥ 18.6 keV, regardless of Es. Old uses the raw window as A and Es > 18.6 keV as C:
For Old, reference counts equal the number of histories with positive small-fiber energy deposition minus the raw-window count. Both channel pairs are disjoint; neither deposited-energy reference accepts tritium events.
For emission i, PA,i and PC,i are the accepted and reference counts divided by the number of generated histories. The dual-diameter veto fraction is ηv,i = 1 − PA,i/PR,i, where PR,i is the raw-window probability. This fraction quantifies coincident-candidate rejection, separately from the reference-channel efficiency used for statistical correction.
For an energy deposit E in MeV at axial position z, the mean number of primary photoelectrons at end e is
Yγ is scintillation yield, Q relative low-energy light yield, ftrap,e the fraction guided toward end e, ℓe propagation distance, Λ attenuation length, and ce effective coupling and photosensor coverage. The overbar denotes spectrum-averaged photon-detection efficiency (PDE). SP101 parameters follow Cheng et al.’s optimization study, published online in 2025 and assigned to the 2026 journal volume [18]: Yγ = 9500 photons MeV−1, refractive index nPS = 1.58, emission peak 423 nm and Λ = 2.10 m. Q = 1 defines proportional light production. The axial coordinate spans 0 ≤ z ≤ L, where L is the fiber length, ℓ1 = z and ℓ2 = L − z.
Mean SiPM PDE is set to 0.50 following the optical study [18]; the S14161-4050HS-06 datasheet specifies 0.50 at 450 nm and 2.7 V overvoltage [30]. Effective coupling and photosensor coverage are represented by ce = 0.50, with 0.75 used to test improved collection. This factor describes delivery to the active photosensor area, separately from PDE. For the bare polystyrene–water interface, nwater = 1.34 and ftrap,e = (1 − nwater/nPS)/2 in the meridional approximation. Trapping, attenuation, coupling and detection remain separate factors, with identical settings and channel cuts across layouts.
With Poisson scintillation, independent photon detection and low SiPM occupancy, the two end counts are independent conditional on deposited energy and axial position. Requiring at least one primary photoelectron per end gives the signal-only trigger probability
For general thresholds, trigger probabilities follow from Poisson tails. The summed primary-photoelectron distribution is averaged over deposited energy and axial position. SiPM gain converts avalanches to charge; optical crosstalk and afterpulsing modify the avalanche distribution [31]. The baseline excludes correlated avalanches and describes the radiation-only primary-photoelectron response without a measured electronics model.
Let fi(x) describe the joint deposited-energy and axial-position distribution for emission i, and R(n|x) the conditional readout response, with n the vector of end-specific primary-photoelectron counts. For disjoint readout selections ΩA and ΩC, source probabilities are
The distribution fi covers all primary histories, including zero-deposit histories. Ns and Nl are the primary-photoelectron counts summed over both ends of the small- and large-fiber channels, respectively. The small-channel window requires 2 ≤ Ns ≤ 6 PE with both ends triggered. Old C requires Ns ≥ 7 PE and both ends triggered. Dual-diameter C requires Nl ≥ 7 PE with both large-channel ends triggered; A excludes C. The 6 PE upper boundary is the baseline mid-fiber mean response at 18.6 keV rounded down; it remains fixed across layouts and coupling tests. These selections include interference migration into A and tritium leakage into C.
For readout integration, the (Es, El) grid distribution minimizes relative entropy subject to transport constraints [32]:
Here pm and wm are cell probabilities and reference weights; A p = b encodes the tallies. Constraints preserve normalization, zero/positive-deposit probabilities, accepted and reference fractions, seven joint probabilities P(0 < Es ≤ 18.6 keV, El < Tk), with Tk = 1, 5, 10, 18.6, 30, 50 and 100 keV, and the first two energy moments. The support satisfies Es + El ≤ E0, where E0 is the β endpoint or photon energy; β-source inequalities P(Es + El ≥ u) ≤ P(T ≥ u) also constrain the grid. These constraints retain the supplied transport information while leaving the unrecorded energy distribution model dependent. The baseline uses a uniform measure over positive-energy cells with explicit zero-deposit atoms and a grid of 74 linear intervals below 18.6 keV and 66 logarithmic intervals above, including all selection thresholds. Half-resolution grids and the reference measure dE/(E + 0.1 keV) test discretization and shape sensitivity. Baseline deposits share a uniformly distributed axial position; independent channel positions are tested separately. This constrained distribution supports readout integration without generating additional Geant4 histories. Variation across assumptions is reported as model sensitivity, not a confidence interval.
2.4. Tritium Measurement with Fixed Calibration
In either response domain, the expected background count and total mean count in channel j are
Here j denotes A or C, t is acquisition time in seconds, Vw is water volume in litres, ai is parent activity concentration in Bq L−1, and bi is the selected emission yield per decay. AH is tritium concentration and Pj,H its channel response probability; the interference sum excludes tritium. Each calculation consistently uses either deposited-energy or PE probabilities. Residual rates rj (s−1) represent additional backgrounds after channel selection. They are zero in both baseline domains; specified nonzero rates test background sensitivity.
The background conversion coefficient is κ = BA/BC. In the absence of additional backgrounds, scaling all interfering activity concentrations by the same factor leaves κ unchanged. With the calibration coefficient κ0 held fixed, the effective tritium concentration sensitivity is G = Vw(PA,H − κ0PC,H). For G > 0 and independent Poisson channel counts, the tritium concentration estimator and its counting variance are:
The count difference is not truncated. In the deposited-energy benchmark, PC,H = 0 and G = Vw εH; the PE model includes tritium leakage into the reference channel in both G and μC. For each layout and readout setting, κ0 and G are determined from the modeled L calibration and then held fixed. The estimator uses only A and C counts, acquisition time and these parameters. Within the specified response library, test compositions, true background ratios and true tritium concentrations are used to define the computational samples and evaluate performance; they are withheld from the estimator. L tests calibration consistency, whereas the other compositions test calibration transfer.
A change in composition introduces the following systematic bias in the tritium concentration result:
The contributions of individual source changes can be expressed as
Here Δai is the change in activity concentration from calibration, and di is the tritium-equivalent response per unit source activity concentration. Branches of the same parent share its change in activity concentration. Assuming stable readout and residual background, the expression separates changes in radionuclide concentrations from geometry-dependent response ratios. Because each source contribution is weighted separately, different Sr/Cs pairs need not produce proportional biases. The expression also provides a consistency check on the multinuclide calculation.
2.5. Measurement Error and MDA
MDA is evaluated separately from concentration measurement error under fixed calibration. It denotes minimum detectable activity concentration in Bq L−1, written AD in the equations, rather than total activity in the cell. We use a nominal one-sided false-positive probability α = 0.05 and detection probability 0.95 [33]. Each composition’s correct background ratio defines a composition-calibrated sensitivity benchmark. For independent Poisson counts in the disjoint channels, conditioning on their total yields the binomial upper-tail test [34]
A detection is declared when the upper-tail probability is at most 0.05. Averaging the conditional rejection probability over the Poisson distribution of the total count gives the detection power, with omitted tails below 10−13; AD corresponds to power 0.95. The 5% false-positive bound holds for independent Poisson null counts when the coefficient equals the true background ratio treated as known. The test is also conservative if the applied ratio is higher. With a transferred κ0, actual false-positive probabilities are evaluated from each sample’s true background means rather than assumed to satisfy the nominal bound. These evaluation inputs remain withheld from the estimator. Detection-power calculations include tritium leakage into C.
Measurement performance is assessed by the expected measurement result E[ÂH], absolute bias, counting standard deviation and RMSE. Here E[ÂH] is the model-predicted mean of the statistical estimator over repeated acquisitions under the Poisson model, not an experimental reading. Absolute bias is |E[ÂH] − AH|, with overestimation or underestimation stated explicitly. A mean closer to the true concentration need not imply smaller error in an individual acquisition. RMSE combines squared bias and counting variance:
Primary calculations assess measurement performance at true tritium concentrations of 0 and 100 Bq L−1 over matched acquisition times of 600, 3600 and 14400 s (10 min, 1 h and 4 h). A separate 4 h test uses approximately logarithmically spaced concentrations of 30, 100 and 300 Bq L−1 with interference held fixed. These prescribed tritium levels vary independently of the literature-based interference activity concentrations. The time comparison tests when the reduction in squared bias outweighs the counting-variance penalty; 4 h is an evaluated interval, not a fitted optimum. Within each comparison, response parameters remain fixed, and test-sample truth is not used to adjust selections or calibration.
Wilson intervals characterize individual transport probabilities [35]. Performance rankings are point estimates with response parameters held fixed; each layout has hundreds to approximately one thousand accepted tritium histories. Grid refinement, alternative energy and position models, coupling changes and neighboring integer cuts assess model sensitivity. Calibration uncertainty is distinct from Poisson counting error [36]. For the deposited-energy estimator, an unbiased estimate of κ with variance u2(κ), independent of sample counts, adds u2(κ)(BC2 + BC) to the null numerator variance. In the PE model, κ enters both G and the correction, so their calibration uncertainties are correlated. Reported RMSE includes counting variation and interference-transfer bias under fixed calibration; it does not represent the combined uncertainty from all response and calibration assumptions.
Design selection uses the equally weighted mean RMSE across the 19 matched station-based compositions, calculated separately for each readout setting, acquisition time and tritium concentration. The primary ranking uses 100 Bq L−1 and 4 h, excluding L and the separate Mref check. This criterion is considered alongside retained tritium response and composition-calibrated MDA in L and H29. It selects one fixed layout for the tested range, without using an individual sample’s unknown composition to choose the layout with the lowest error for that sample.
Post-processing was implemented in Python, and figures were rendered with Matplotlib 3.10.8 from the input and calculated numerical tables. ChatGPT (OpenAI; accessed September 2026; model version not recorded) assisted with preparation of the analysis and plotting code. The calculations follow the equations, selections and reconstruction constraints specified above; the numerical figures are deterministic visualizations of their underlying data.
3. Results
3.1. Tritium Measurement Performance Across Seawater Interference Compositions
In the baseline optical model at a true tritium concentration of 100 Bq L−1, Inner 5 mm reduces absolute bias by 35.5–59.0% across all 19 station-based compositions (Table 4). For S18, the median-cesium case, the predicted mean concentrations are 102.10 Bq L−1 for Old and 100.90 Bq L−1 for Inner 5 mm. The corresponding values are 105.77 and 102.40 Bq L−1 for the upper-quartile case S25, and 133.75 and 113.85 Bq L−1 for H29. Both layouts predict a mean of 100.00 Bq L−1 in L, where calibration and evaluation compositions coincide. Bias is therefore suppressed consistently across the Sr/Cs pairs, despite differences in the magnitude of the transfer error.
For Inner 10 mm, the predicted mean concentration in H29 is 99.00 Bq L−1, closer to the true concentration than for either Old or Inner 5 mm. However, enlarging the reference cluster removes sensing fibers and increases counting uncertainty. Bias suppression must therefore be assessed alongside total measurement error. Across the 19 compositions, mean absolute bias decreases from 4.30 Bq L−1 for Old to 1.79 for Inner 5 mm, while the equally weighted mean 4 h RMSE rises from 15.72 to 16.12 Bq L−1. Inner 5 mm has lower 4 h RMSE only in S23 and H29; Old has lower RMSE in the other 17 compositions. The reduction is only 0.6% in S23 but substantial in H29. Reduced sensitivity to interference thus does not imply lower total error in every composition.
In H29 at 100 Bq L−1 tritium, the 600 s RMSE is 81.8 Bq L−1 for Old, 84.6 for Inner 5 mm and 102.1 for Inner 10 mm. At this duration, bias reduction does not offset the added counting uncertainty. After 3600 s, Inner 5 mm reduces RMSE from 45.4 to 36.8 Bq L−1, or 19.1%. After 14400 s, the reduction is from 37.02 to 21.95 Bq L−1, or 40.7%; the corresponding zero-tritium RMSE reduction is 44.8%. For this stationary composition at 100 Bq L−1, the Old–Inner 5 mm RMSE crossover occurs at approximately 888 s. This behavior follows from a persistent bias and counting variance that decreases as 1/t.
Figure 3 compares performance across the full composition set and its time dependence in H29. Most station pairs produce much smaller transfer errors than H29, so extending integration to 4 h need not compensate for the loss of sensing response. In the separate near-calibration composition Mref, biases are 0.97 Bq L−1 for Old and 0.40 for Inner 5 mm, with Old retaining lower 4 h RMSE. Within the tested set, the dual-diameter geometry offers its greatest measurement benefit when composition changes cause appreciable bias under the retained calibration.
Varying tritium concentration at fixed interference composition provides a further test of modeled measurement performance (Table 5). In H29 at 4 h and ce = 0.50, true concentrations of 30, 100 and 300 Bq L−1 give predicted means of 43.85, 113.85 and 313.85 Bq L−1 for Inner 5 mm, compared with 63.75, 133.75 and 333.75 Bq L−1 for Old. Inner 5 mm reduces RMSE by 43.5%, 40.7% and 34.3%, respectively. The additive interference bias is independent of tritium concentration, whereas signal counting variance increases with concentration. RMSE relative to the true concentration therefore decreases as concentration rises, even though absolute RMSE increases. The benefit thus extends across the three prescribed tritium levels.
3.2. Interference Rejection and Background Reference Response
Table 6 gives emission-normalized channel probabilities. For Inner 5 mm, the 40K β reference probability is 3.1019%, compared with 0.6701% in the accepted channel, yet the same-event veto removes only 1.41% of its raw 40K β candidates. Outer 7.5 mm rejects 34.13% of 40K γ candidates and 20.78% of 137Cs γ candidates, but only 4.53% of 40K β candidates. The independent reference provides background information even when a tritium-like deposit has no simultaneous large-fiber trigger (Figure 4). The measurement benefit therefore depends on statistical background tracking as well as event rejection.
Reference counts alone do not determine correction quality. In L at 600 s, the deposited-energy model predicts 1051.68 reference counts and 11.03 accepted background counts for Old, compared with 48.07 and 10.17 for Inner 5 mm. Old therefore has lower relative counting uncertainty in the reference channel. Correction quality also depends on how consistently each reference predicts the accepted background as radionuclide weights change.
The accepted-to-reference ratios explain the differing composition sensitivities. For Old, PA/PC is 0.01026 for 40K β and 0.05819 for the selected 137Cs γ line; Inner 10 mm gives 0.07346 and 0.08593. The closer ratios reduce sensitivity to changes in the relative contributions of these emissions. From L to H29, deposited-energy κ changes by 30.0% for Old, 14.7% for Inner 5 mm and 4.3% for Inner 10 mm (Figure 5). With the L calibration retained, H29 biases are 21.3, 12.2 and 4.2 Bq L−1, respectively. These direct transport results support the interference mechanism identified in the PE calculation.
Holding the natural matrix fixed across the 19 station-based compositions isolates variation in the Sr/Cs pair. Equation (10) weights each change in activity concentration by its tritium-equivalent response. Proportional increases in all background components leave κ unchanged; changes in their relative contributions cause the transfer error examined here. In L, accepted interference is dominated by 40K β, whose small same-event veto fraction explains why background-reference tracking remains essential even when gamma-event rejection is effective.
Bias suppression in H29 is accompanied by lower false-positive probabilities. At ce = 0.50, the actual probabilities after 600 s are 12.3%, 5.7% and 3.5% for Old, Inner 5 mm and Inner 10 mm; after 4 h, they are 88.2%, 24.7% and 4.1%. Table 7 lists the station-based compositions satisfying the 5% criterion at 4 h, with zero tritium and each layout’s L coefficient retained. Old meets the criterion in S14, S2, S17, S28 and S20. Inner 5 mm meets it in those five compositions plus S24, S9 and S11; Inner 10 mm meets it in all 19. L and Mref are excluded from these totals. These finite-count results apply to the stated optical setting, duration and backgrounds. With composition-correct coefficients, all evaluated conditional tests satisfy the nominal bound under the assumptions in Section 2.5. Lower measurement RMSE and false-positive control remain distinct criteria.
3.3. Retained Tritium Response and MDA
Reference fibers displace part of the fine sensing array. Inner 5 mm retains 87.32% of Old’s small-fiber lateral area and 88.25% of its deposited-energy concentration sensitivity G. Inner 10 mm retains 57.06% of G, while Outer 7.5 mm retains 43.53%. Old has a tritium response probability of 0.1021%. Figure 2 relates these full-array responses to the single-fiber trends and geometric costs. The design objective is to limit signal loss while obtaining a reference less sensitive to changing interference.
At baseline coupling, the mid-fiber photoelectron yield is 0.1700 primary PE keV−1 per end. A 5.7 keV deposit produces a mean total of 1.94 PE and a two-ended trigger probability of approximately 0.385. Integration over the deposited-energy distribution gives tritium acceptance probabilities of 0.03715%, 0.03332% and 0.02422% for Old, Inner 5 mm and Inner 10 mm (Table 8). Including reference leakage, their effective concentration sensitivities are in the ratio 1:0.8881:0.5763. The 5 mm cluster thus preserves considerably more tritium response than the larger-diameter alternative.
Inner 5 mm has the lowest composition-calibrated MDA among the six dual-diameter candidates. At 600 s, its deposited-energy MDA is 120.5 Bq L−1 in L and 131.8 Bq L−1 in H29 (Table 9), compared with 152.9 and 161.7 Bq L−1 for Inner 10 mm and 97.7 and 105.9 Bq L−1 for Old. The 5 mm central cluster therefore offers the best counting sensitivity within the tested dual-diameter family. Its lower interference-induced bias provides a separate measurement advantage over the conventional array.
The PE calculation preserves this MDA ordering (Table 8). At 600 s, Inner 5 mm gives 296.6 Bq L−1 in L and 314.3 Bq L−1 in H29, compared with 248.3 and 261.9 Bq L−1 for Old: an increase of approximately 20%, with 88.8% of the effective response retained. At 4 h, the corresponding values are 47.3 and 50.6 Bq L−1 for Inner 5 mm, compared with 40.7 and 43.3 Bq L−1 for Old. The calculation includes photon fluctuations, two-ended selection and reference leakage, with the correct background coefficient applied to each composition. These values quantify composition-calibrated counting sensitivity, not detection limits for an uncorrected change in interference.
With PE cuts fixed, increasing common coupling ce from 0.50 to 0.75 reduces the 600 s L MDA from 248.3 to 164.8 Bq L−1 for Old, from 296.6 to 192.4 for Inner 5 mm, and from 377.8 to 252.2 for Inner 10 mm. Separately, an assumed accepted-channel residual rate of 0.01 s−1, with rC = 0 and recalibrated coefficients, raises baseline L MDA to 304.0, 389.2 and 508.3 Bq L−1, respectively. The residual rate is a sensitivity-analysis input, not an experimentally measured background. Figure 6 compares MDA under the common readout conditions.
3.4. Readout Sensitivity and Design Selection
All 189 source–geometry reconstructions reproduce the transport probability constraints within 4.36 × 10⁻⁸. Grid refinement changes representative L MDA values by less than 0.2%. Replacing the uniform energy measure with a log-energy measure gives L MDA values of 257.9, 310.4 and 384.5 Bq L−1 for Old, Inner 5 mm and Inner 10 mm, compared with baseline values of 248.3, 296.6 and 377.8 Bq L−1. These checks distinguish discretization error from sensitivity to the assumed energy distribution. Figure 7 identifies the transport and readout stages and the common optical settings.
Measurement bias is more sensitive to energy reconstruction than calibrated MDA. In H29, the baseline PE model overestimates the concentration by 33.7 and 13.8 Bq L−1 for Old and Inner 5 mm, and underestimates it by 1.0 Bq L−1 for Inner 10 mm. With log-energy reconstruction, Old overestimates by 20.2 Bq L−1, whereas Inner 5 mm and Inner 10 mm underestimate by 1.6 and 15.3 Bq L−1. The near-zero baseline bias of Inner 10 mm therefore depends on cancellation among source contributions. At 4 h and 100 Bq L−1, the log-energy model gives H29 RMSE values of 25.36 and 17.25 Bq L−1 for Old and Inner 5 mm, retaining a 32.0% reduction. Among the three inner layouts evaluated under this reconstruction, Inner 5 mm has the lowest mean RMSE across the 19 compositions, although Old retains the lower ensemble mean.
Increasing common coupling to ce = 0.75 lowers MDA while keeping the selection cuts fixed (Table 10). Inner 5 mm retains 87.8% of Old’s effective response and gives composition-calibrated 4 h MDAs of 28.9 Bq L−1 in L and 31.5 Bq L−1 in H29. Its absolute bias in H29 is 10.5 Bq L−1, compared with 19.8 Bq L−1 for Old. At 100 Bq L−1 tritium and 4 h, its RMSE is 16.12 Bq L−1, compared with 22.72 Bq L−1 for Old, a 29.1% reduction. Across the 30, 100 and 300 Bq L−1 tests, the reductions are 33.5%, 29.1% and 20.6%. Improved collection thus lowers measurement RMSE while the reference cluster continues to suppress interference bias.
Among the six dual-diameter layouts, a 5 mm central reference cluster with ce = 0.75 is preferred for the combined objectives of low ensemble-mean RMSE and retained counting sensitivity. At 100 Bq L−1 and 4 h, its mean RMSE across the 19 compositions is 11.72 Bq L−1, compared with 12.69 and 14.21 Bq L−1 for Inner 7.5 and Inner 10 mm; the three Outer layouts give 14.18, 16.30 and 17.39 Bq L−1. Inner 5 mm also has the lowest composition-calibrated MDA among the new layouts in L and H29. Old’s ensemble mean remains slightly lower at 11.27 Bq L−1. For the sole objective of minimum H29 RMSE, Inner 7.5 mm gives 14.66 Bq L−1, below Inner 5 mm at 16.12 Bq L−1, but its calibrated MDA increases from 31.5 to 34.6 Bq L−1. These comparisons use identical optical settings and counting times. The 5 mm choice does not establish 5% false-positive control for arbitrary compositions under frozen calibration. Composition-calibrated MDA and the actual false-positive probabilities in Section 3.2 concern different calibration conditions. Coupling and energy-reconstruction changes remain separate sensitivity tests.
4. Discussion
4.1. Structural Basis of Improved Tritium Measurement
The structural benefit arises from closer correspondence between the reference response and the interference entering the tritium window. An energetic electron can deposit little energy in a fine sensing fiber without triggering a coincident veto; the independent reference channel still estimates the remaining interference statistically. Performance therefore depends on both event rejection and the stability of the accepted-to-reference ratio. This explains why modest same-event beta rejection can accompany substantial bias suppression. The conventional array also uses simultaneous reference counts, so the comparison assesses the effect of geometry on reference response, rather than the presence or absence of background correction.
4.2. Interference Tolerance and Retained Sensitivity
The 5 mm central cluster retains approximately 89% of the effective tritium response while reducing sensitivity to composition changes. At baseline collection, its 600 s calibrated MDA is approximately 20% higher than Old’s, but the largest 4 h RMSE across the 19 station-based compositions at 100 Bq L−1 falls from 37.02 to 21.95 Bq L−1. The ensemble mean rises by 2.6%, from 15.72 to 16.12 Bq L−1. A modest increase in mean RMSE therefore accompanies a substantially smaller error in the most perturbed case. Equal weighting describes the tested set, not environmental occurrence frequencies. Under the modeled conditions, this geometry is useful when tolerance of appreciable interference changes is needed alongside counting sensitivity, but offers little measurement benefit when calibration remains representative.
The intended application is seawater tritium measurement under variable radionuclide interference. The computational matrix represents seawater and the specified dissolved radionuclides, without covering the full range of water chemistry or optical turbidity. Absolute predictions remain conditional on the simplified emission library, constrained energy-response reconstruction and radiation-only primary-PE model. Prototype validation of the low-energy response, instrumental background and calibration transfer is needed to establish operational performance. The prescribed concentrations of 30, 100 and 300 Bq L−1 test modeled measurement performance; they do not define the detector’s application range. Concentration results must be interpreted with their MDA, counting time and calibration conditions. Four-hour integration improves counting precision when composition and detector response remain approximately stationary. The acquisition interval should therefore reflect the acceptable concentration error and required update rate.
5. Conclusions
The dual-diameter design provides a separate interference reference while preserving the fine-fiber tritium interface. Within the specified simulation model, Inner 5 mm reduces concentration bias across all 19 literature-based Sr/Cs compositions. In the case with the greatest interference, it lowers 4 h RMSE by 40.7% at 100 Bq L−1 and by 34.3–43.5% across the 30–300 Bq L−1 tests. It retains 88.8% of the baseline effective response and has the lowest calibrated MDA among the new layouts. At a common coupling of 0.75, its 4 h MDAs are 28.9 Bq L−1 in L and 31.5 Bq L−1 in H29, and its ensemble-mean RMSE is the lowest among the tested dual-diameter layouts. At this coupling, the 7.5 mm central cluster minimizes H29 RMSE at 100 Bq L−1 and 4 h, with a higher calibrated MDA. Old retains lower calibrated MDA and better precision for small composition changes. Geometry selection therefore depends on the measurement objective, with measurement error, counting sensitivity and false-positive control assessed under their respective calibration conditions.
Author Contributions
Conceptualization, W.C., Q.Z. and J.Y.; methodology, W.C., X.H., H.W. and S.S.; software, W.C. and W.Q.; validation, W.Q., X.H., H.W. and S.S.; formal analysis, W.C.; investigation, W.C., W.Q., X.H., H.W. and S.S.; resources, Z.G.; data curation, W.C.; writing—original draft preparation, W.C.; writing—review and editing, W.Q., X.H., H.W., S.S., Z.G., Q.Z. and J.Y.; visualization, W.C.; supervision, Z.G., Q.Z. and J.Y.; project administration, Z.G., Q.Z. and J.Y. All authors have read and agreed to the submitted version of the manuscript.
Funding
This research received no external funding.
Institutional Review Board Statement
Not applicable.
Informed Consent Statement
Not applicable.
Data Availability Statement
The computational sample compositions and numerical results supporting the reported comparisons are provided in this article. Sources of the external radionuclide data are identified in the text and reference list.
Acknowledgments
During manuscript preparation, the authors used ChatGPT (OpenAI; accessed September 2026) for manuscript review. The authors reviewed and edited the output and take full responsibility for the content of this publication.
Conflicts of Interest
The authors declare no conflicts of interest.
References
- Eyrolle, F.; Ducros, L.; Le Dizès, S.; Beaugelin-Seiller, K.; Charmasson, S.; Boyer, P.; Cossonnet, C. An updated review on tritium in the environment. J. Environ. Radioact. 2018, 181, 128–137. [Google Scholar] [CrossRef] [PubMed]
- Nie, B.; Fang, S.; Jiang, M.; Wang, L.; Ni, M.; Zheng, J.; Yang, Z.; Li, F. Anthropogenic tritium: Inventory, discharge, environmental behavior and health effects. Renew. Sustain. Energy Rev. 2021, 135, 110188. [Google Scholar] [CrossRef]
- Hou, X. Tritium and 14C in the Environment and Nuclear Facilities: Sources and Analytical Methods. J. Nucl. Fuel Cycle Waste Technol. 2018, 16, 11–39. [Google Scholar] [CrossRef]
- Nie, B.; Yang, J.; Wang, W.; Gu, Z.; Yuan, Y.; Li, F. Numerical study on tritium dispersion in coastal waters: The case of Hangzhou Bay, China. J. Hydrol. 2020, 590, 125532. [Google Scholar] [CrossRef]
- Qu, Z.; Nie, B.; Wang, X.; Periáñez, R.; Lyu, M.; Chen, X.; Wang, L.; Xie, F. Numerical simulation of evaporation and dispersion of tritium released in Hangzhou Bay. J. Hazard. Mater. 2025, 498, 139912. [Google Scholar] [CrossRef] [PubMed]
- Povinec, P.P.; Aoyama, M.; Biddulph, D.; Breier, R.; Buesseler, K.; Chang, C.C.; Golser, R.; Hou, X.L.; Ješkovský, M.; Jull, A.J.T.; Kaizer, J.; Nakano, M.; Nies, H.; Palcsu, L.; Papp, L.; Pham, M.K.; Steier, P.; Zhang, L.Y. Cesium, iodine and tritium in NW Pacific waters—a comparison of the Fukushima impact with global fallout. Biogeosciences 2013, 10, 5481–5496. [Google Scholar] [CrossRef]
- Takahata, N.; Tomonaga, Y.; Kumamoto, Y.; Yamada, M.; Sano, Y. Direct tritium emissions to the ocean from the Fukushima Dai-ichi nuclear accident. Geochem. J. 2018, 52, 211–217. [Google Scholar] [CrossRef]
- Parker, A.; Aspinall, M.; Boxall, C.; Cave, F.; Joyce, M. Radiometric techniques for the detection and assessment of tritium in aqueous media—a review. Prog. Nucl. Energy 2023, 162, 104733. [Google Scholar] [CrossRef]
- Lin, F.; Yu, T.; Yu, W.; Ni, J.; Lin, L. Electrolytic enrichment method for tritium determination in the Arctic Ocean using liquid scintillation counter. Acta Oceanol. Sin. 2020, 39, 73–77. [Google Scholar] [CrossRef]
- Zhang, T.; Jiang, H.; Chen, N.; Wang, Y.; Zhang, M.; Hou, X. Determination of tritium in large volume of seawater using electrolytic enrichment and LSC and its application for the East China Sea water. J. Radioanal. Nucl. Chem. 2023, 332, 981–987. [Google Scholar] [CrossRef]
- Dixon, N.E.J.; Monk, S.D.; Graham, J.; Cheneler, D. Laminated Flow-Cell Detector with Granulated Scintillator for the Detection of Tritiated Water. Radiation 2023, 3, 211–225. [Google Scholar] [CrossRef]
- Tarancón, A.; Novella, O.; Pujadas, M.; Batlle, M.; Cros, J.; García, J.F. Development of an equipment for real-time continuous monitoring of alpha and beta radioactivity in river water. Appl. Radiat. Isot. 2022, 187, 110322. [Google Scholar] [CrossRef] [PubMed]
- Azevedo, C.D.R.; Baeza, A.; Chauveau, E.; Corbacho, J.A.; Díaz, J.; Domange, J.; Marquet, C.; Martínez-Roig, M.; Piquemal, F.; Veloso, J.F.C.A.; Yahlali, N. Simulation results of a real-time in water tritium monitor. Nucl. Instrum. Methods Phys. Res. Sect. A 2020, 982, 164555. [Google Scholar] [CrossRef]
- Azevedo, C.D.R.; Baeza, A.; Chauveau, E.; Corbacho, J.A.; Díaz, J.; Domange, J.; Marquet, C.; Martínez-Roig, M.; Piquemal, F.; Prado, D.; Veloso, J.F.C.A.; Yahlali, N. Development of a real-time tritium-in-water monitor. J. Instrum. 2023, 18, T12008. [Google Scholar] [CrossRef]
- Sanada, Y.; Oshikiri, K.; Kanno, M.; Abe, T. Development of a practical tritiated water monitor to supervise the discharge of treated water from Fukushima Daiichi Nuclear Power Plant. Nucl. Instrum. Methods Phys. Res. Sect. A 2024, 1062, 169208. [Google Scholar] [CrossRef]
- Cheng, W.Y.; Deng, K.; Zeng, Y.S.; Liu, W.; Zhang, Q. Development of an enhanced online tritium monitoring system using plastic scintillation fiber array. Nucl. Sci. Tech. 2024, 35, 173. [Google Scholar] [CrossRef]
- Cheng, W.; Zeng, L.; Zhou, H.; Liang, J.; Deng, K.; Zhang, Q.; Liu, W. Feasibility Analysis of Tritium Measurement in the Aqueous Medium Based on a Plastic Scintillating Fiber Array. Nucl. Technol. 2025, 211, 500–512. [Google Scholar] [CrossRef]
- Cheng, W.; Liang, J.; Wang, L.; Liang, Y.; Shi, S.; Zou, L.; Yang, J.; Guo, Z. Optimized simulation research of a plastic scintillation fiber array tritium detector in water. J. Environ. Radioact. 2026, 291, 107833. [Google Scholar] [CrossRef] [PubMed]
- Sun, J.; Men, W.; Wang, F.; Wu, J. Activity Levels of 210Po, 210Pb and Other Radionuclides (134Cs, 137Cs, 90Sr, 110mAg, 238U, 226Ra and 40K) in Marine Organisms From Coastal Waters Adjacent to Fuqing and Ningde Nuclear Power Plants (China) and Radiation Dose Assessment. Front. Mar. Sci. 2021, 8, 702124. [Google Scholar] [CrossRef]
- Ni, J.; Chen, D.; Qian, Z.; Lin, J.; Lin, F.; Ji, J.; Huang, D.; Yu, T. A study on the transfer of radionuclides and of the resulting radiation dose assessment for marine organisms on the eastern coast of Yantai city. Front. Mar. Sci. 2024, 11, 1377411. [Google Scholar] [CrossRef]
- Zhang, F.; Wang, J.; Bi, Q.; Du, J. 90Sr in seawater of the East China Sea: Inventory, new potential source, and environmental implications. Sci. Total Environ. 2021, 764, 144266. [Google Scholar] [CrossRef] [PubMed]
- Zhang, F.; Wang, J.; Huang, D.; Zhong, Q.; Yu, T.; Du, J. Fresh Groundwater Discharge as a Major Source of 90Sr into the Coastal Ocean. Environ. Sci. Technol. 2023, 57, 12033–12041. [Google Scholar] [CrossRef] [PubMed]
- Casacuberta, N.; Masqué, P.; Garcia-Orellana, J.; Garcia-Tenorio, R.; Buesseler, K.O. 90Sr and 89Sr in seawater off Japan as a consequence of the Fukushima Dai-ichi nuclear accident. Biogeosciences 2013, 10, 3649–3659. [Google Scholar] [CrossRef]
- Oikawa, S.; Takata, H.; Watabe, T.; Misonoo, J.; Kusakabe, M. Distribution of the Fukushima-derived radionuclides in seawater in the Pacific off the coast of Miyagi, Fukushima, and Ibaraki Prefectures, Japan. Biogeosciences 2013, 10, 5031–5047. [Google Scholar] [CrossRef]
- Buesseler, K. Cesium-134 and cesium-137 concentrations from underway samples taken during R/V Ka’imikai-o-Kanaloa cruise KOK1108 off the coast of Japan, June 5–18, 2011 (Fukushima Radionuclide Levels project). Biological and Chemical Oceanography Data Management Office (BCO-DMO). Version 18 December 2012. [CrossRef]
- Leblond, S. DDEP re-evaluation of the radioactive decay scheme of 137Cs. Appl. Radiat. Isot. 2024, 206, 111191. [Google Scholar] [CrossRef] [PubMed]
- Agostinelli, S.; Allison, J.; Amako, K.; Apostolakis, J.; Araujo, H.; Arce, P.; Asai, M.; Axen, D.; Banerjee, S.; Barrand, G.; et al. Geant4—a simulation toolkit. Nucl. Instrum. Methods Phys. Res. Sect. A 2003, 506, 250–303. [Google Scholar] [CrossRef]
- Allison, J.; Amako, K.; Apostolakis, J.; Arce, P.; Asai, M.; Aso, T.; Bagli, E.; Bagulya, A.; Banerjee, S.; Barrand, G.; et al. Recent developments in Geant4. Nucl. Instrum. Methods Phys. Res. Sect. A 2016, 835, 186–225. [Google Scholar] [CrossRef]
- Mougeot, X. BetaShape: A new code for improved analytical calculations of beta spectra. EPJ Web Conf. 2017, 146, 12015. [Google Scholar] [CrossRef]
- Hamamatsu Photonics K.K. MPPC (Multi-Pixel Photon Counter) S14160/S14161 series. Technical data sheet, KAPD1064E. Available online: https://www.hamamatsu.com/content/dam/hamamatsu-photonics/sites/documents/99_SALES_LIBRARY/ssd/s14160_s14161_series_kapd1064e.pdf (accessed on 23 September 2026).
- Klanner, R. Characterisation of SiPMs. Nucl. Instrum. Methods Phys. Res. Sect. A 2019, 926, 36–56. [Google Scholar] [CrossRef]
- Jaynes, E.T. Information Theory and Statistical Mechanics. Phys. Rev. 1957, 106, 620–630. [Google Scholar] [CrossRef]
- Currie, L.A. Limits for qualitative detection and quantitative determination. Application to radiochemistry. Anal. Chem. 1968, 40, 586–593. [Google Scholar] [CrossRef]
- Cousins, R.D.; Linnemann, J.T.; Tucker, J. Evaluation of three methods for calculating statistical significance when incorporating a systematic uncertainty into a test of the background-only hypothesis for a Poisson process. Nucl. Instrum. Methods Phys. Res. Sect. A 2008, 595, 480–501. [Google Scholar] [CrossRef]
- Wilson, E.B. Probable inference, the law of succession, and statistical inference. J. Am. Stat. Assoc. 1927, 22, 209–212. [Google Scholar] [CrossRef]
- Rolke, W.A.; López, A.M.; Conrad, J. Limits and confidence intervals in the presence of nuisance parameters. Nucl. Instrum. Methods Phys. Res. Sect. A 2005, 551, 493–503. [Google Scholar] [CrossRef]
Figure 1.
Array geometry and channel definitions. (a–c) Equal-scale cross-sections of Old, Inner 5 mm and Outer 5 mm, drawn from the supplied placement coordinates. The large reference fibers occupy a central cluster in (b) and a peripheral ring in (c). Blue and orange circles denote 1 mm sensing fibers and 5 mm reference fibers, respectively; the remaining chamber area is water. The Inner and Outer layouts contain seven and 26 reference fibers, respectively, so the comparison includes differences in fiber count and sensing area as well as placement. The chamber radius is 25 mm; the chamber and fibers are 250 mm long. (d) Deposited-energy selections for accepted channel A and reference channel C, with Es and El denoting total energies deposited in the small and large fibers. The conventional high-energy reference is retained. Both channel pairs are disjoint and provide simultaneous background information; primary-photoelectron selections are defined separately in Section 2.3.
Figure 1.
Array geometry and channel definitions. (a–c) Equal-scale cross-sections of Old, Inner 5 mm and Outer 5 mm, drawn from the supplied placement coordinates. The large reference fibers occupy a central cluster in (b) and a peripheral ring in (c). Blue and orange circles denote 1 mm sensing fibers and 5 mm reference fibers, respectively; the remaining chamber area is water. The Inner and Outer layouts contain seven and 26 reference fibers, respectively, so the comparison includes differences in fiber count and sensing area as well as placement. The chamber radius is 25 mm; the chamber and fibers are 250 mm long. (d) Deposited-energy selections for accepted channel A and reference channel C, with Es and El denoting total energies deposited in the small and large fibers. The conventional high-energy reference is retained. Both channel pairs are disjoint and provide simultaneous background information; primary-photoelectron selections are defined separately in Section 2.3.
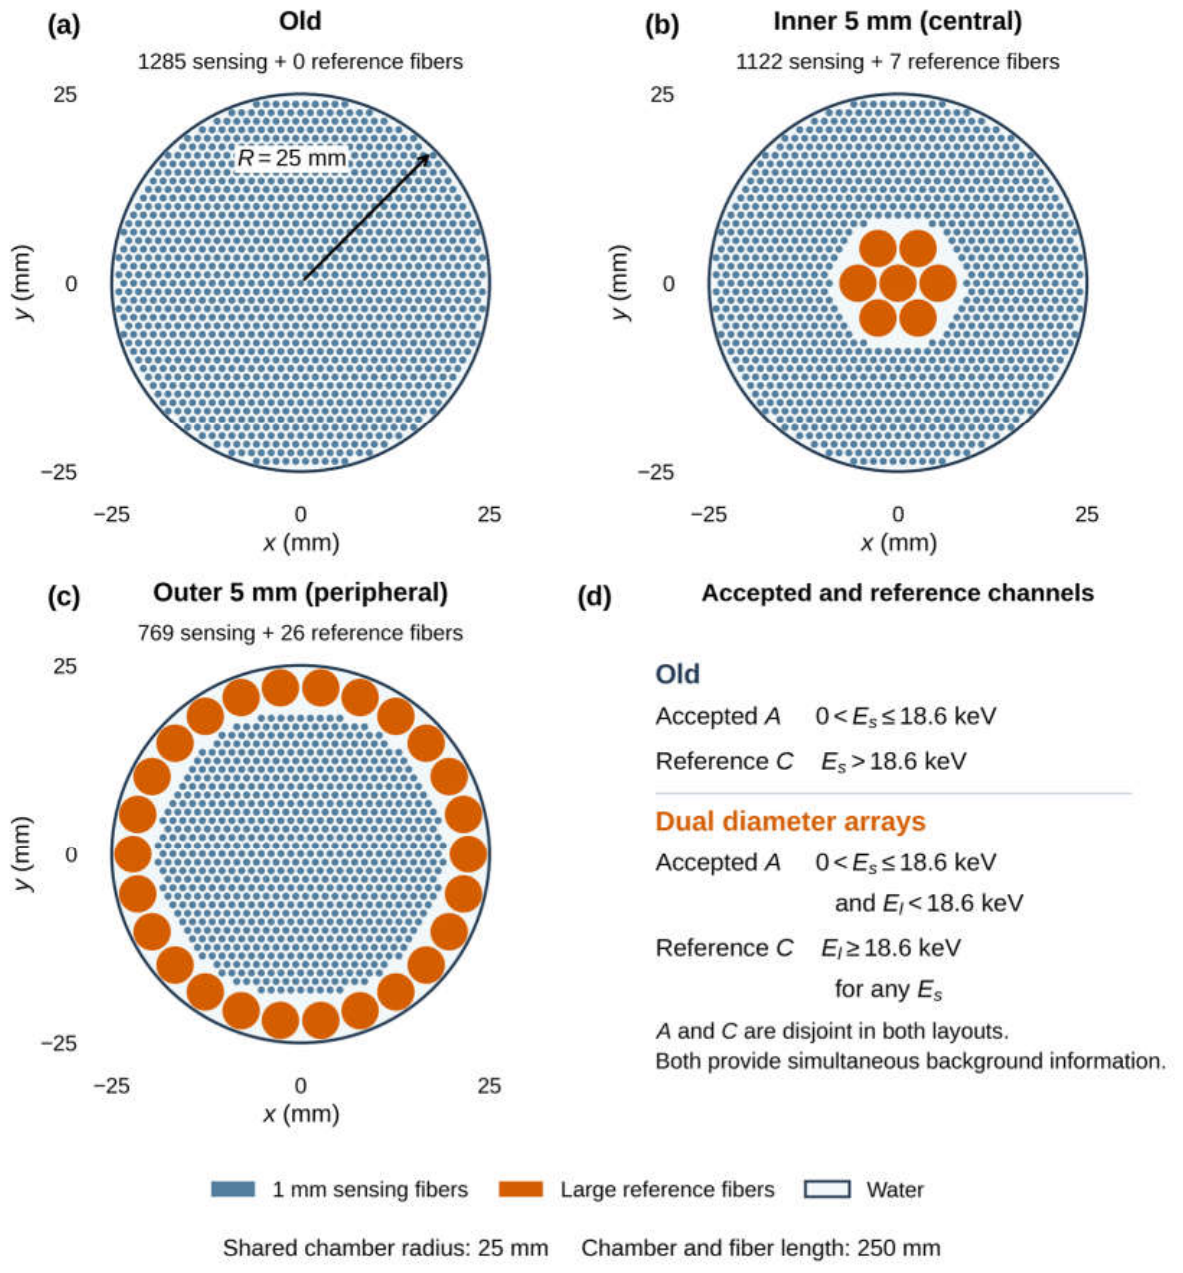
Figure 2.
Reference-fiber diameter response and full-array geometric trade-offs. (a,b) Mean core energy deposition for monoenergetic electrons and photons, respectively, over fiber diameters of 1–10 mm. The 5.7 and 18.6 keV electron responses vary little with diameter. The 546 keV response approaches a plateau, and the increase for 1310 keV electrons slows at 7.5–10 mm, whereas responses to 2280 keV electrons and to photons continue to rise. Shaded bands mark the 5, 7.5 and 10 mm candidates. (c) Deposited-energy tritium concentration sensitivity G normalized to Old. (d) Fine-fiber lateral surface area and water volume, each normalized to its corresponding Old value. Panels (c,d) describe full arrays with sources distributed uniformly in the water volume; horizontal dashed lines mark unity. Increasing reference-fiber diameter reduces the retained tritium response, sensing interface and water volume. Inner retains a higher tritium response than Outer at each diameter. The Outer layouts contain 26, 16 and 11 reference fibers at 5, 7.5 and 10 mm, respectively, so their comparison includes changes in both diameter and fiber count. These trends motivate comparison of the three candidate diameters as a trade-off between higher-energy response and retained tritium sensitivity. Connecting lines guide the eye.
Figure 2.
Reference-fiber diameter response and full-array geometric trade-offs. (a,b) Mean core energy deposition for monoenergetic electrons and photons, respectively, over fiber diameters of 1–10 mm. The 5.7 and 18.6 keV electron responses vary little with diameter. The 546 keV response approaches a plateau, and the increase for 1310 keV electrons slows at 7.5–10 mm, whereas responses to 2280 keV electrons and to photons continue to rise. Shaded bands mark the 5, 7.5 and 10 mm candidates. (c) Deposited-energy tritium concentration sensitivity G normalized to Old. (d) Fine-fiber lateral surface area and water volume, each normalized to its corresponding Old value. Panels (c,d) describe full arrays with sources distributed uniformly in the water volume; horizontal dashed lines mark unity. Increasing reference-fiber diameter reduces the retained tritium response, sensing interface and water volume. Inner retains a higher tritium response than Outer at each diameter. The Outer layouts contain 26, 16 and 11 reference fibers at 5, 7.5 and 10 mm, respectively, so their comparison includes changes in both diameter and fiber count. These trends motivate comparison of the three candidate diameters as a trade-off between higher-energy response and retained tritium sensitivity. Connecting lines guide the eye.
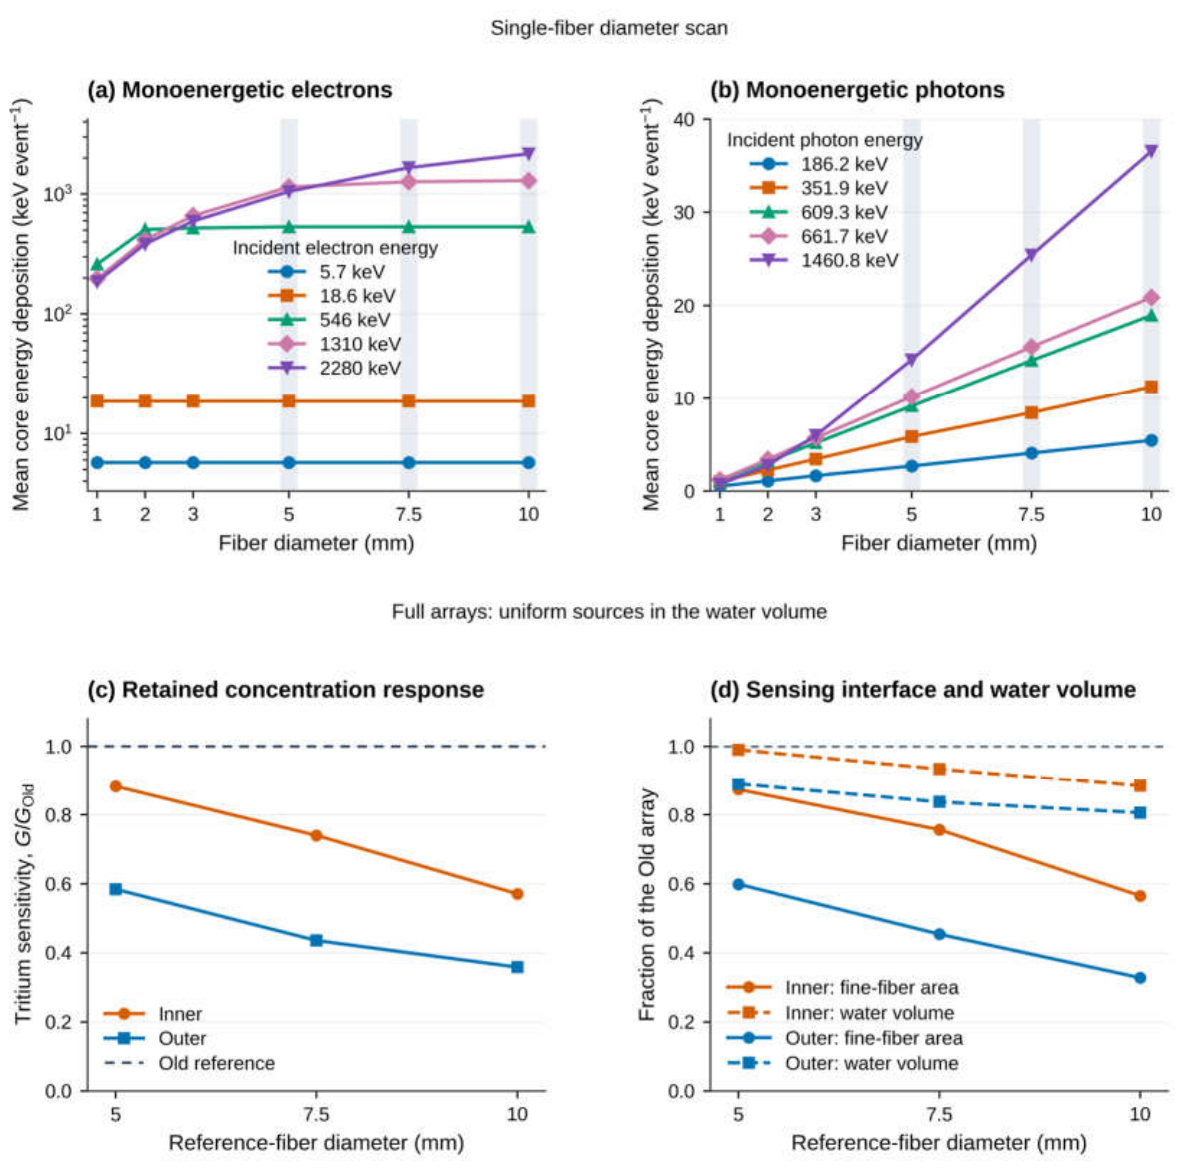
Figure 3.
Expected tritium measurement results and counting error across modeled seawater compositions. (a) Model-predicted mean concentration results for Old and Inner 5 mm across L, Mref and the 19 literature-based station-pair compositions, at a true tritium concentration of 100 Bq L−1, ce = 0.50 and 14400 s. The horizontal dashed line marks the true concentration. Error bars show ±1 standard deviation of one acquisition, not confidence intervals for the mean or model parameters. (b) H29 RMSE for Old, Inner 5, Inner 7.5 and Inner 10 mm from 600 to 14400 s at ce = 0.50. Solid and dashed lines indicate true tritium concentrations of 100 and 0 Bq L−1, respectively. Curves use stationary-response variance scaling; markers identify the calculated 600, 3600 and 14400 s values. (c) H29 RMSE for Old and Inner 5 mm at 14400 s and true concentrations of 30, 100 and 300 Bq L−1, comparing ce = 0.50 and 0.75. The concentration axis is logarithmic; connecting lines guide the eye between the specified test levels. All panels retain each layout’s L calibration and fixed readout cuts.
Figure 3.
Expected tritium measurement results and counting error across modeled seawater compositions. (a) Model-predicted mean concentration results for Old and Inner 5 mm across L, Mref and the 19 literature-based station-pair compositions, at a true tritium concentration of 100 Bq L−1, ce = 0.50 and 14400 s. The horizontal dashed line marks the true concentration. Error bars show ±1 standard deviation of one acquisition, not confidence intervals for the mean or model parameters. (b) H29 RMSE for Old, Inner 5, Inner 7.5 and Inner 10 mm from 600 to 14400 s at ce = 0.50. Solid and dashed lines indicate true tritium concentrations of 100 and 0 Bq L−1, respectively. Curves use stationary-response variance scaling; markers identify the calculated 600, 3600 and 14400 s values. (c) H29 RMSE for Old and Inner 5 mm at 14400 s and true concentrations of 30, 100 and 300 Bq L−1, comparing ce = 0.50 and 0.75. The concentration axis is logarithmic; connecting lines guide the eye between the specified test levels. All panels retain each layout’s L calibration and fixed readout cuts.
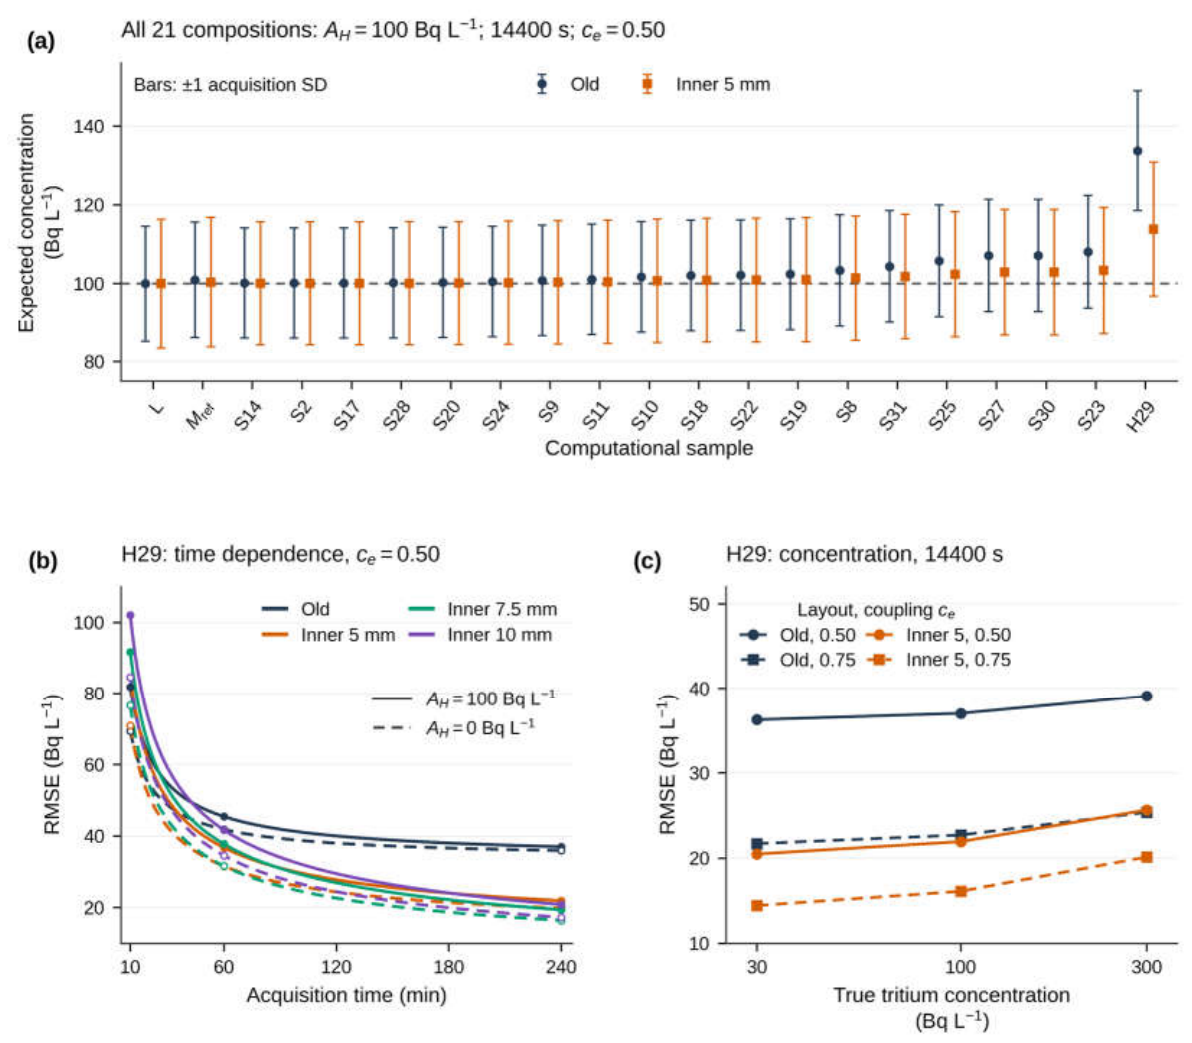
Figure 4.
Direct deposited-energy transport responses for eight modeled background emissions. (a) Fraction of small-fiber tritium-window candidates rejected by a coincident large-fiber energy deposit of at least 18.6 keV for Inner 5 mm and Outer 7.5 mm. Points show (nROI − nafter)/nROI, with two-sided 95% Wilson score intervals using nROI as the binomial denominator. (b) Accepted-channel and reference-channel probabilities per emitted primary for Old, Inner 5 mm and Inner 10 mm; open circles denote PA and filled squares denote PC. Each source–layout simulation contains n = 106 primary histories. For Old, A is 0 < Es ≤ 18.6 keV and C is Es > 18.6 keV; for the dual-diameter layouts, A additionally requires El < 18.6 keV and C is El ≥ 18.6 keV. Es and El are the event-level energies deposited in the small- and large-fiber channels. Panel (b) uses a logarithmic probability axis and reports point estimates without activity-concentration or emission-yield weighting. These results are taken directly from transport tallies, without photoelectron reconstruction; the tritium signal is not included in these background panels.
Figure 4.
Direct deposited-energy transport responses for eight modeled background emissions. (a) Fraction of small-fiber tritium-window candidates rejected by a coincident large-fiber energy deposit of at least 18.6 keV for Inner 5 mm and Outer 7.5 mm. Points show (nROI − nafter)/nROI, with two-sided 95% Wilson score intervals using nROI as the binomial denominator. (b) Accepted-channel and reference-channel probabilities per emitted primary for Old, Inner 5 mm and Inner 10 mm; open circles denote PA and filled squares denote PC. Each source–layout simulation contains n = 106 primary histories. For Old, A is 0 < Es ≤ 18.6 keV and C is Es > 18.6 keV; for the dual-diameter layouts, A additionally requires El < 18.6 keV and C is El ≥ 18.6 keV. Es and El are the event-level energies deposited in the small- and large-fiber channels. Panel (b) uses a logarithmic probability axis and reports point estimates without activity-concentration or emission-yield weighting. These results are taken directly from transport tallies, without photoelectron reconstruction; the tritium signal is not included in these background panels.
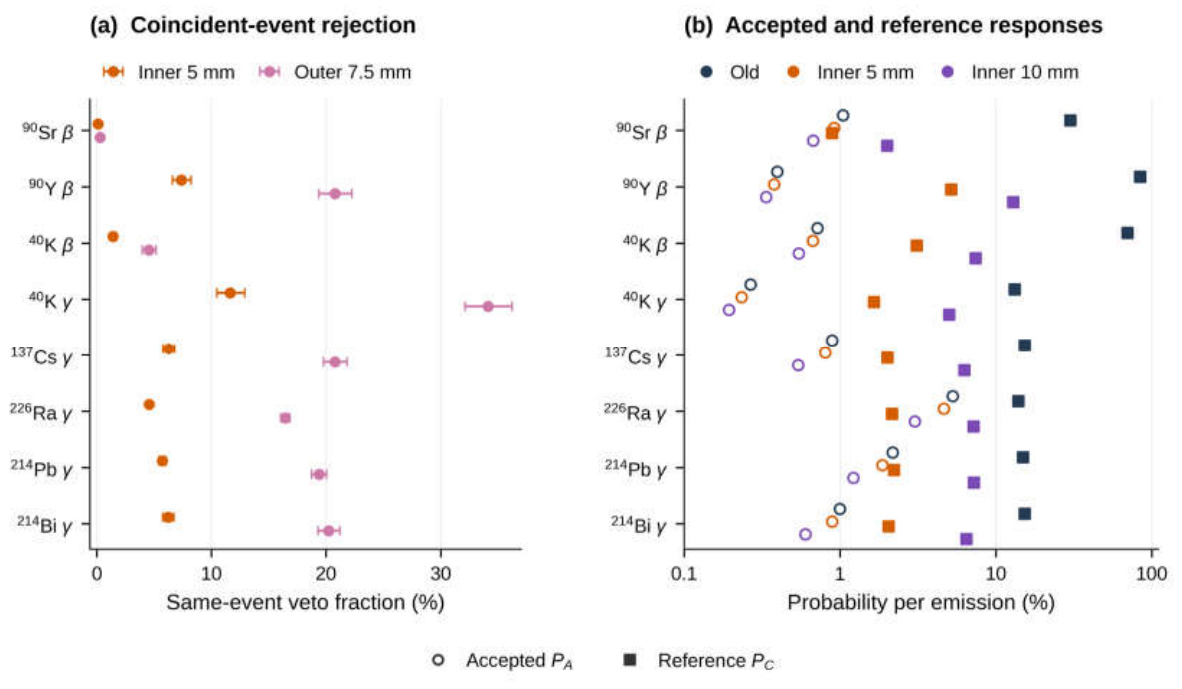
Figure 5.
Deposited-energy response ratios and composition dependence of background conversion. (a) PA/PC for the eight modeled background emissions in Old, Inner 5 mm and Inner 10 mm, on a logarithmic axis. Shading identifies the 40K β and 137Cs γ components discussed in the text. (b) Background conversion coefficient κ normalized to each layout’s own L value for all seven layouts and all 21 compositions, ordered as in Table 3: L, Mref and the 19 station-based compositions ending with H29. Symbols are horizontally offset for readability; each position denotes a separate composition and no interpolation between samples is implied. The dashed line marks κ/κL = 1. For each composition, κ is obtained by weighting the background responses by activity concentration and emission yield, with tritium excluded. Probabilities are derived directly from n = 106 primary transport histories per source–layout combination using the deposited-energy channel definitions in Figure 4. Ratios and normalized coefficients are point estimates; transport uncertainty has not been propagated into these plotted quantities. No photoelectron reconstruction is used in this figure.
Figure 5.
Deposited-energy response ratios and composition dependence of background conversion. (a) PA/PC for the eight modeled background emissions in Old, Inner 5 mm and Inner 10 mm, on a logarithmic axis. Shading identifies the 40K β and 137Cs γ components discussed in the text. (b) Background conversion coefficient κ normalized to each layout’s own L value for all seven layouts and all 21 compositions, ordered as in Table 3: L, Mref and the 19 station-based compositions ending with H29. Symbols are horizontally offset for readability; each position denotes a separate composition and no interpolation between samples is implied. The dashed line marks κ/κL = 1. For each composition, κ is obtained by weighting the background responses by activity concentration and emission yield, with tritium excluded. Probabilities are derived directly from n = 106 primary transport histories per source–layout combination using the deposited-energy channel definitions in Figure 4. Ratios and normalized coefficients are point estimates; transport uncertainty has not been propagated into these plotted quantities. No photoelectron reconstruction is used in this figure.
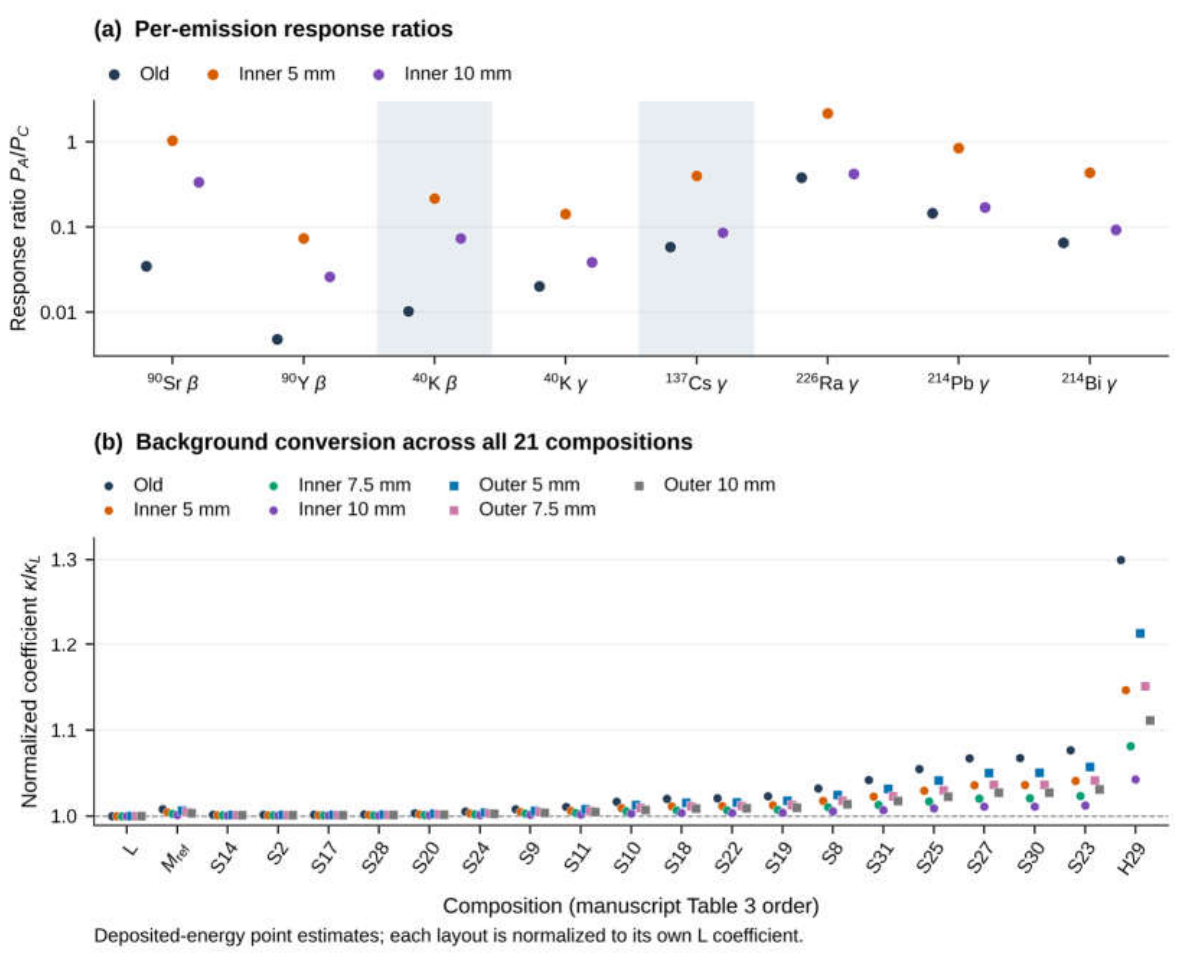
Figure 6.
Minimum detectable activity concentration with the background composition correctly specified. (a) Deposited-energy MDAs for all seven layouts in L and H29 at 600 s; each linked pair refers to one layout. (b,c) Primary-photoelectron MDAs in L and H29, respectively, with logarithmic vertical axes. Filled and open markers denote 600 and 14400 s; circles and triangles denote common coupling ce = 0.50 and 0.75. Layout colors are consistent across panels, and readout cuts remain fixed. Every MDA uses the corresponding composition-specific background coefficient, the exact conditional-binomial test with nominal one-sided α = 0.05, and a target detection power of 0.95. Coupling comparisons are model-sensitivity calculations, not confidence intervals. These composition-correct sensitivity benchmarks use a different calibration premise from the expected concentration measurement results obtained with the frozen L calibration in Figure 3.
Figure 6.
Minimum detectable activity concentration with the background composition correctly specified. (a) Deposited-energy MDAs for all seven layouts in L and H29 at 600 s; each linked pair refers to one layout. (b,c) Primary-photoelectron MDAs in L and H29, respectively, with logarithmic vertical axes. Filled and open markers denote 600 and 14400 s; circles and triangles denote common coupling ce = 0.50 and 0.75. Layout colors are consistent across panels, and readout cuts remain fixed. Every MDA uses the corresponding composition-specific background coefficient, the exact conditional-binomial test with nominal one-sided α = 0.05, and a target detection power of 0.95. Coupling comparisons are model-sensitivity calculations, not confidence intervals. These composition-correct sensitivity benchmarks use a different calibration premise from the expected concentration measurement results obtained with the frozen L calibration in Figure 3.
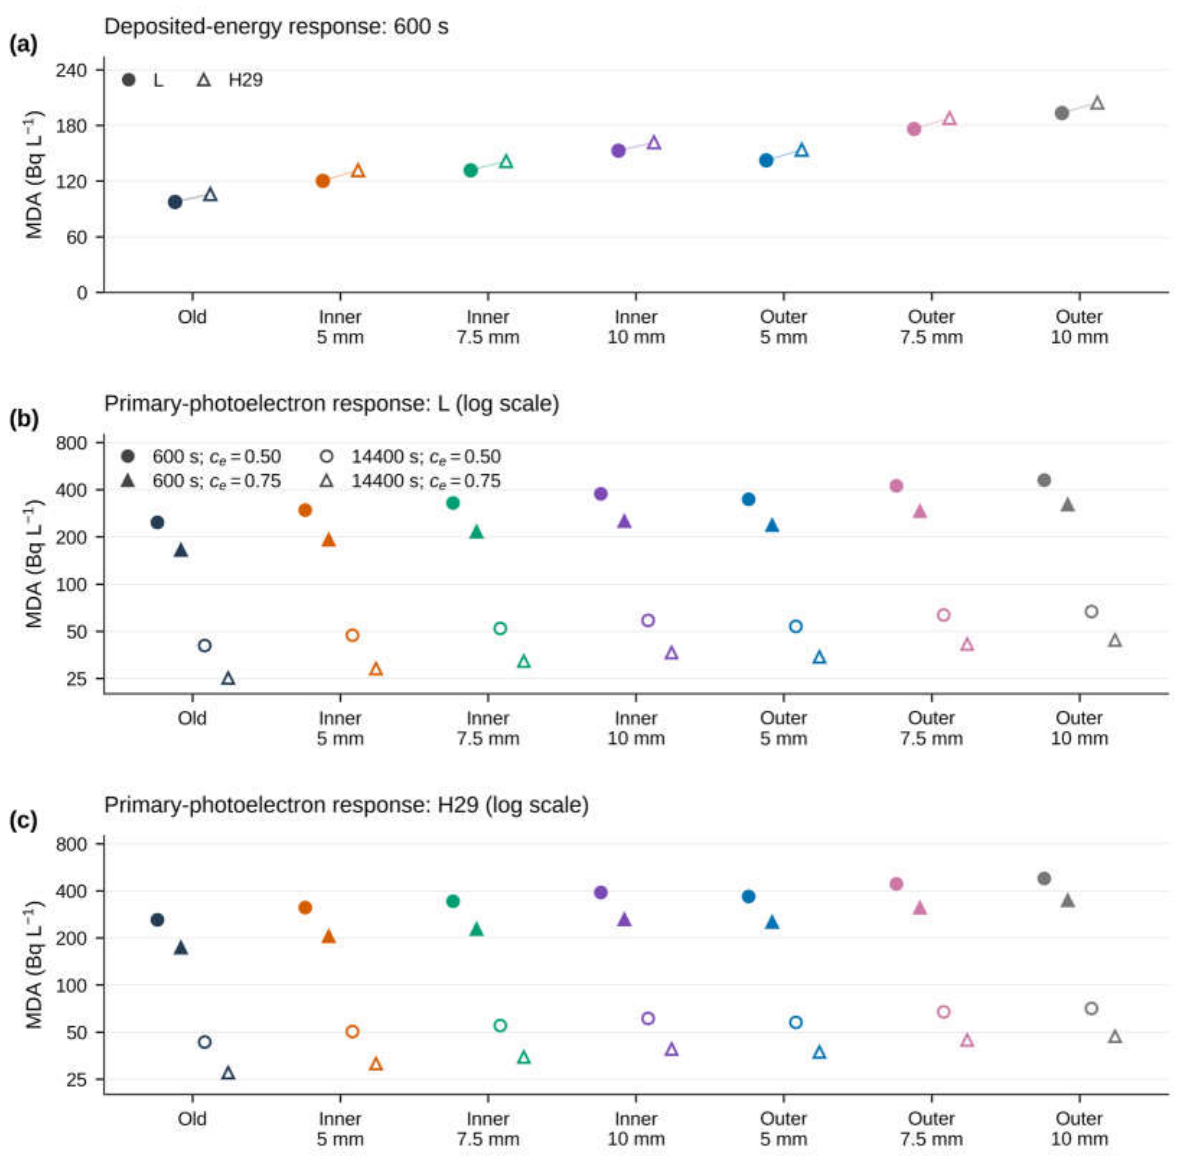
Figure 7.
Optical response closure and source-integrated tritium acceptance. (a) Calculation workflow linking transport constraints, maximum-relative-entropy reconstruction of the deposited-energy response, scintillation and SiPM conversion, fixed primary-photoelectron selections, and averaging over source response and axial position. (b) Source-integrated tritium acceptance probability PA,H for all seven layouts at effective coupling coverage ce = 0.50 (baseline) and 0.75 (sensitivity calculation). Common parameters are Yγ = 9500 photons MeV−1, PDE = 0.50, attenuation length Λ = 2.10 m and relative light yield Q = 1. The two channel ends must each register at least one primary photoelectron. The small-channel acceptance window is 2–6 PE; the reference threshold is 7 PE in the small-fiber channel for Old and in the large-fiber channel for the dual-diameter layouts. Accepted and reference events are disjoint. All cuts remain fixed between coupling settings. Gray segments connect the two conditional predictions for each layout and do not represent uncertainty. The probabilities include zero-deposit histories and the uniform axial-position average. They are conditional model predictions, without additional transport simulations or measured optical spectra.
Figure 7.
Optical response closure and source-integrated tritium acceptance. (a) Calculation workflow linking transport constraints, maximum-relative-entropy reconstruction of the deposited-energy response, scintillation and SiPM conversion, fixed primary-photoelectron selections, and averaging over source response and axial position. (b) Source-integrated tritium acceptance probability PA,H for all seven layouts at effective coupling coverage ce = 0.50 (baseline) and 0.75 (sensitivity calculation). Common parameters are Yγ = 9500 photons MeV−1, PDE = 0.50, attenuation length Λ = 2.10 m and relative light yield Q = 1. The two channel ends must each register at least one primary photoelectron. The small-channel acceptance window is 2–6 PE; the reference threshold is 7 PE in the small-fiber channel for Old and in the large-fiber channel for the dual-diameter layouts. Accepted and reference events are disjoint. All cuts remain fixed between coupling settings. Gray segments connect the two conditional predictions for each layout and do not represent uncertainty. The probabilities include zero-deposit histories and the uniform axial-position average. They are conditional model predictions, without additional transport simulations or measured optical spectra.
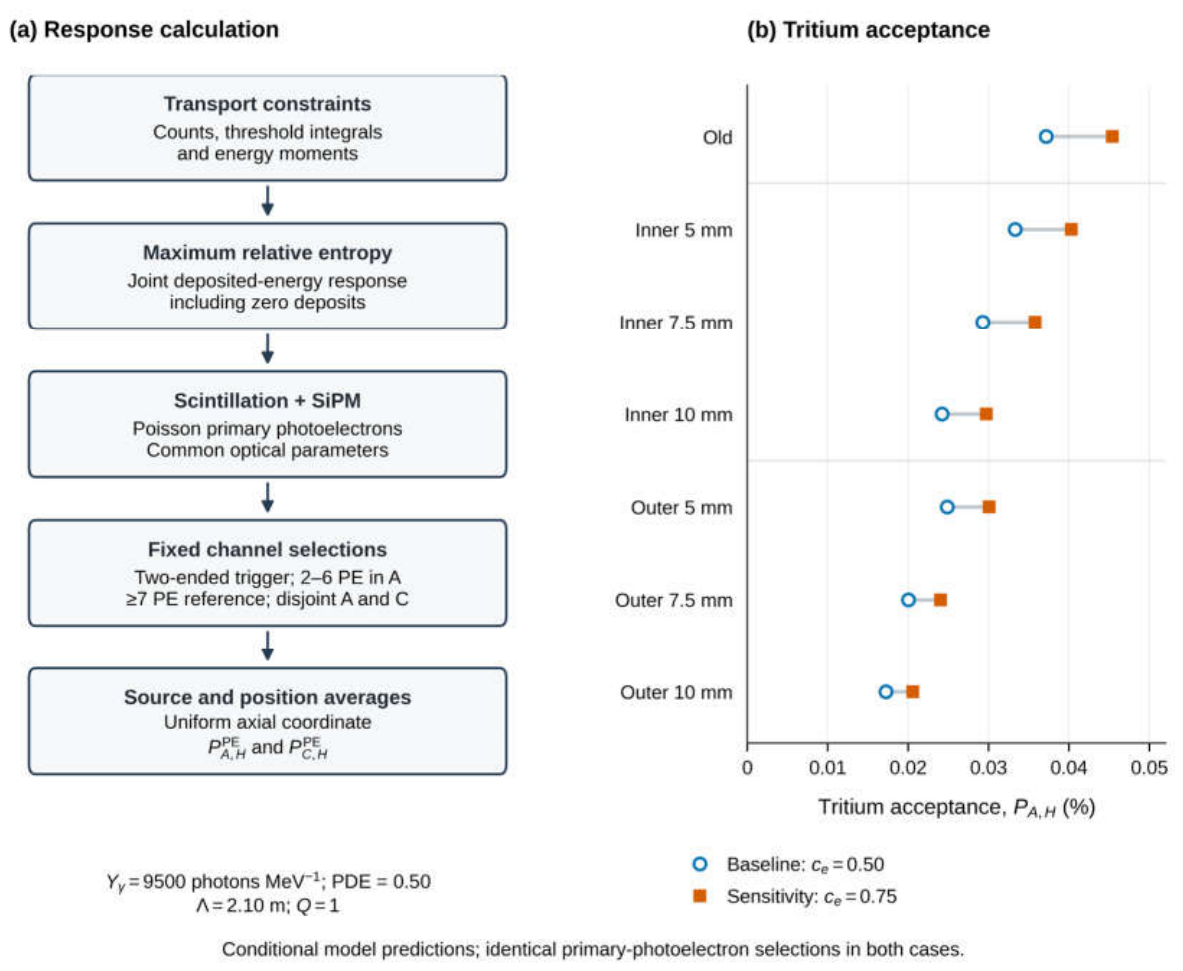

Table 1.
Geometry and tritium response of the tested arrays.
| Layout | Large d (mm) |
Small fibers |
Large fibers |
Water volume (L) |
Sensing surface (m2) |
εH (%) |
|---|---|---|---|---|---|---|
| Old | — | 1285 | 0 | 0.23858 | 1.0092 | 0.1021 |
| Inner 5 | 5 | 1122 | 7 | 0.23623 | 0.8811 | 0.0910 |
| Inner 7.5 | 7.5 | 972 | 7 | 0.22273 | 0.7633 | 0.0809 |
| Inner 10 | 10 | 726 | 7 | 0.21090 | 0.5702 | 0.0659 |
| Outer 5 | 5 | 769 | 26 | 0.21228 | 0.6039 | 0.0670 |
| Outer 7.5 | 7.5 | 583 | 16 | 0.19971 | 0.4579 | 0.0531 |
| Outer 10 | 10 | 421 | 11 | 0.19225 | 0.3306 | 0.0454 |
The small-fiber diameter is 1 mm; the chamber and fibers are 250 mm long. Reported areas are lateral surface areas. εH is the deposited-energy acceptance probability per tritium decay.
Table 2.
Radiation-emission inputs for the transport model.
| Emission | Energy type | Energy (keV) |
Yield bi (per decay) |
Daughter Z |
|---|---|---|---|---|
| 3H β | β endpoint | 18.6 | 1.0000 | 2 |
| 90Sr β | β endpoint | 546 | 1.0000 | 39 |
| 90Y β | β endpoint | 2280 | 1.0000 | 40 |
| 40K β | β endpoint | 1310 | 0.8928 | 20 |
| 40K γ | γ line | 1460.82 | 0.1066 | — |
| 137Cs γ | γ line | 661.657 | 0.8510 | — |
| 226Ra γ | γ line | 186.211 | 0.0359 | — |
| 214Pb γ | γ line | 351.932 | 0.3580 | — |
| 214Bi γ | γ line | 609.312 | 0.4610 | — |
Each emission yield is applied once to the corresponding parent activity concentration. The discrete γ lines and approximate β spectra represent the input library, rather than complete decay schemes.
Table 3.
Literature-based computational sample compositions for the structural comparison (Bq L−1).
| Sample | Sr/Cs date | 40K | 226Ra | 90Sr | 137Cs |
|---|---|---|---|---|---|
| L | — | 11.51 | 0.00275 | 0.00074 | 0.00146 |
| Mref | 2011-08-26 | 11.55 | 0.00336 | 0.0037 | 0.1 |
| S14 | 2011-06-11 | 9.99 | 0.0093 | 0.0011 | 0.00226 |
| S2 | 2011-06-07 | 9.99 | 0.0093 | 0.0014 | 0.00258 |
| S17 | 2011-06-12 | 9.99 | 0.0093 | 0.0011 | 0.00328 |
| S28 | 2011-06-16 | 9.99 | 0.0093 | 0.0011 | 0.0079 |
| S20 | 2011-06-13 | 9.99 | 0.0093 | 0.0017 | 0.0221 |
| S24 | 2011-06-14 | 9.99 | 0.0093 | 0.0025 | 0.043 |
| S9 | 2011-06-09 | 9.99 | 0.0093 | 0.0032 | 0.0712 |
| S11 | 2011-06-10 | 9.99 | 0.0093 | 0.0078 | 0.0991 |
| S10 | 2011-06-10 | 9.99 | 0.0093 | 0.0093 | 0.166 |
| S18 | 2011-06-12 | 9.99 | 0.0093 | 0.0061 | 0.203 |
| S22 | 2011-06-13 | 9.99 | 0.0093 | 0.0069 | 0.21 |
| S19 | 2011-06-12 | 9.99 | 0.0093 | 0.0088 | 0.235 |
| S8 | 2011-06-09 | 9.99 | 0.0093 | 0.0056 | 0.335 |
| S31 | 2011-06-17 | 9.99 | 0.0093 | 0.015 | 0.438 |
| S25 | 2011-06-15 | 9.99 | 0.0093 | 0.017 | 0.58 |
| S27 | 2011-06-15 | 9.99 | 0.0093 | 0.033 | 0.713 |
| S30 | 2011-06-17 | 9.99 | 0.0093 | 0.028 | 0.717 |
| S23 | 2011-06-14 | 9.99 | 0.0093 | 0.026 | 0.818 |
| H29 | 2011-06-16 | 9.99 | 0.0093 | 0.085 | 3.46 |
L is the Ningde calibration composition [19]. Mref combines the Fuqing natural matrix with the 26 August 2011 station-20 Sr/Cs pair [19,24]. S labels identify KOK 2011 stations; H29 denotes station 29, whose matched pair has the highest Cs activity concentration. All 19 uniquely matched pairs are retained in increasing sampling-date-corrected Cs order [23,25,26]. Their K/Ra values are the independent Yantai regional-mean model matrix [20], not KOK measurements. Dates identify Sr/Cs samples. 90Y = 90Sr and 214Pb = 214Bi = 226Ra are model assumptions. These are computational compositions, not new full-composition field measurements.
Table 4.
Expected tritium measurement results and 4 h errors with the L calibration retained for all compositions.
Table 4.
Expected tritium measurement results and 4 h errors with the L calibration retained for all compositions.
| Sample | Old E[ÂH] | Inner 5 E[ÂH] | Old RMSE 4 h |
Inner 5 RMSE 4 h |
|---|---|---|---|---|
| L | 100.00 | 100.00 | 14.59 | 16.35 |
| Mref | 100.97 | 100.40 | 14.67 | 16.41 |
| S14 | 100.15 | 100.10 | 13.97 | 15.61 |
| S2 | 100.16 | 100.10 | 13.97 | 15.61 |
| S17 | 100.16 | 100.10 | 13.97 | 15.61 |
| S28 | 100.21 | 100.12 | 13.97 | 15.62 |
| S20 | 100.35 | 100.18 | 13.98 | 15.62 |
| S24 | 100.55 | 100.26 | 14.00 | 15.63 |
| S9 | 100.82 | 100.37 | 14.02 | 15.65 |
| S11 | 101.11 | 100.48 | 14.05 | 15.67 |
| S10 | 101.76 | 100.75 | 14.14 | 15.71 |
| S18 | 102.10 | 100.90 | 14.20 | 15.72 |
| S22 | 102.17 | 100.92 | 14.22 | 15.73 |
| S19 | 102.42 | 101.02 | 14.27 | 15.75 |
| S8 | 103.37 | 101.42 | 14.49 | 15.82 |
| S31 | 104.40 | 101.83 | 14.80 | 15.91 |
| S25 | 105.77 | 102.40 | 15.32 | 16.04 |
| S27 | 107.12 | 102.92 | 15.93 | 16.20 |
| S30 | 107.14 | 102.94 | 15.93 | 16.19 |
| S23 | 108.10 | 103.34 | 16.42 | 16.31 |
| H29 | 133.75 | 113.85 | 37.02 | 21.95 |
True tritium concentration: 100 Bq L−1; expected measurement results and errors are in Bq L−1. Values below or above 100 indicate underestimation or overestimation. The baseline PE model uses ce = 0.50, fixed L calibration and 14400 s. Entries are analytical model predictions. L checks calibration consistency; Mref is an external small-perturbation composition. The 19 station compositions are reported without a performance filter. RMSE combines bias and counting variance.
Table 5.
Tritium measurement performance at different true concentrations in H29 at 4 h.
| ce | True 3H (Bq L−1) |
Old E[ÂH] | Inner 5 E[ÂH] | Old RMSE | Inner 5 RMSE |
|---|---|---|---|---|---|
| 0.50 | 30 | 63.75 | 43.85 | 36.27 | 20.49 |
| 0.50 | 100 | 133.75 | 113.85 | 37.02 | 21.95 |
| 0.50 | 300 | 333.75 | 313.85 | 39.08 | 25.66 |
| 0.75 | 30 | 49.82 | 40.54 | 21.71 | 14.44 |
| 0.75 | 100 | 119.82 | 110.54 | 22.72 | 16.12 |
| 0.75 | 300 | 319.82 | 310.54 | 25.39 | 20.15 |
Concentrations and errors are in Bq L−1. The background composition H29, PE cuts and 14400 s acquisition are fixed. Each coupling setting retains its corresponding L calibration. Only the specified true tritium concentration changes within each coupling series. These are model-based concentration estimates, not experimental sample measurements.
Table 6.
Accepted-channel and reference-channel probabilities per emission (%).
| Emission | Old PA |
Old PC |
Inner 5 PA |
Inner 5 PC |
Inner 10 PA |
Inner 10 PC |
|---|---|---|---|---|---|---|
| 3H β | 0.1021 | 0.0000 | 0.0910 | 0.0000 | 0.0659 | 0.0000 |
| 90Sr β | 1.0433 | 30.0791 | 0.9163 | 0.8905 | 0.6727 | 2.0070 |
| 90Y β | 0.3953 | 84.0775 | 0.3783 | 5.1705 | 0.3354 | 12.9245 |
| 40K β | 0.7171 | 69.9045 | 0.6701 | 3.1019 | 0.5448 | 7.4159 |
| 40K γ | 0.2664 | 13.1867 | 0.2340 | 1.6534 | 0.1941 | 5.0102 |
| 137Cs γ | 0.8894 | 15.2840 | 0.8031 | 2.0173 | 0.5394 | 6.2769 |
| 226Ra γ | 5.2686 | 13.9389 | 4.6326 | 2.1576 | 3.0172 | 7.1939 |
| 214Pb γ | 2.1741 | 14.9484 | 1.8676 | 2.2266 | 1.2183 | 7.2108 |
| 214Bi γ | 0.9984 | 15.2966 | 0.8905 | 2.0536 | 0.5998 | 6.4716 |
Each emission case uses 106 histories. Channel C is defined by Es > 18.6 keV for Old and El ≥ 18.6 keV for the dual diameter layouts. Channels A and C are disjoint within each layout. The entries are not weighted by activity concentration or emission yield.
Table 7.
Station compositions with actual false-positive probability at most 5% in the baseline 4 h test.
Table 7.
Station compositions with actual false-positive probability at most 5% in the baseline 4 h test.
| Layout | Count (out of 19) |
Qualifying sample IDs | FP in listed cases (%) |
|---|---|---|---|
| Old | 5/19 | S14, S2, S17, S28, S20 | 4.792–4.976 |
| Inner 5 | 8/19 | S14, S2, S17, S28, S20, S24, S9, S11 | 4.681–4.991 |
| Inner 10 | 19/19 | S14, S2, S17, S28, S20, S24, S9, S11, S10, S18, S22, S19, S8, S31, S25, S27, S30, S23, H29 | 4.068–4.599 |
True tritium concentration is zero, ce = 0.50 and t = 14400 s. Each layout retains its own L-calibrated κ0 for every tested composition. The denominator excludes L and Mref; station IDs follow Table 3 and are listed in increasing Cs order. A composition qualifies when its unrounded actual null rejection probability is ≤ 0.05. The last-column range applies only to the qualifying compositions listed in that row. These are model-based false-positive probabilities under frozen calibration, distinct from composition-correct MDA; passing at 4 h does not guarantee control at every counting time.
Table 8.
Source-integrated primary-photoelectron response and conditional MDAs at 600 s and 4 h.
| Layout |
3H PA (%) |
G/GOld in L |
L MDA 600 s |
H29 MDA 600 s |
L MDA 4 h |
H29 MDA 4 h |
|---|---|---|---|---|---|---|
| Old | 0.0371 | 1.0000 | 248.3 | 261.9 | 40.7 | 43.3 |
| Inner 5 | 0.0333 | 0.8881 | 296.6 | 314.3 | 47.3 | 50.6 |
| Inner 7.5 | 0.0293 | 0.7360 | 329.8 | 344.4 | 52.3 | 55.2 |
| Inner 10 | 0.0242 | 0.5763 | 377.8 | 391.1 | 58.7 | 61.4 |
| Outer 5 | 0.0248 | 0.5952 | 349.1 | 369.1 | 53.9 | 57.7 |
| Outer 7.5 | 0.0200 | 0.4513 | 424.2 | 443.6 | 63.6 | 67.6 |
| Outer 10 | 0.0172 | 0.3735 | 461.2 | 482.1 | 67.0 | 71.0 |
MDA units: Bq L−1. Nominal ce = 0.50 and mean PDE = 0.50; radiation-only baseline. The reconstructed deposited-energy distribution is convolved with Poisson primary-photoelectron statistics and averaged over axial position. Each MDA uses its composition-specific correct background coefficient. G includes tritium leakage into the reference channel.
Table 9.
Deposited-energy MDAs in L and H29 at 600 s with composition-specific calibration.
| Layout | G/GOld | L BC (counts) |
κ in L | L MDA (Bq L−1) |
H29 MDA (Bq L−1) |
|---|---|---|---|---|---|
| Old | 1.0000 | 1051.68 | 0.01048 | 97.7 | 105.9 |
| Inner 5 | 0.8825 | 48.07 | 0.21165 | 120.5 | 131.8 |
| Inner 7.5 | 0.7397 | 73.99 | 0.12445 | 131.9 | 141.5 |
| Inner 10 | 0.5706 | 104.26 | 0.07089 | 152.9 | 161.7 |
| Outer 5 | 0.5839 | 173.51 | 0.03927 | 142.4 | 153.8 |
| Outer 7.5 | 0.4353 | 181.07 | 0.03050 | 176.2 | 188.0 |
| Outer 10 | 0.3583 | 178.58 | 0.02309 | 193.6 | 204.4 |
Each layout uses a simultaneous reference. MDA is evaluated with the correct coefficient for each composition, a nominal α = 0.05 and a detection probability of 0.95. Optical response, residual instrumental background and calibration uncertainty are excluded.
Table 10.
Comparison of all layouts at ce = 0.75 and 4 h.
| Layout | G retained (%) |
Mean RMSE (19 cases) |
H29 RMSE |
L MDA | H29 MDA | H29 FP (%) |
|---|---|---|---|---|---|---|
| Old | 100.0 | 11.27 | 22.72 | 25.2 | 27.5 | 85.32 |
| Inner 5 | 87.8 | 11.72 | 16.12 | 28.9 | 31.5 | 33.26 |
| Inner 7.5 | 73.6 | 12.69 | 14.66 | 32.3 | 34.6 | 14.75 |
| Inner 10 | 57.8 | 14.21 | 15.25 | 36.7 | 38.9 | 7.51 |
| Outer 5 | 58.9 | 14.18 | 21.27 | 34.4 | 37.4 | 45.97 |
| Outer 7.5 | 44.3 | 16.30 | 20.81 | 41.4 | 44.6 | 25.37 |
| Outer 10 | 36.5 | 17.39 | 19.90 | 44.1 | 47.2 | 14.67 |
RMSE and MDA units: Bq L−1. All columns use 14400 s and identical coupling and PE cuts. The mean gives equal weight to all 19 matched station compositions and does not represent their frequency of occurrence in the environment. RMSE assumes 100 Bq L−1 true tritium and frozen L calibration. False-positive probabilities assume zero tritium with the same frozen calibration. Each MDA instead uses its composition-specific correct coefficient. Tritium response is normalized to Old in L. All values are conditional model predictions.
Disclaimer/Publisher’s Note: The statements, opinions and data contained in all publications are solely those of the individual author(s) and contributor(s) and not of MDPI and/or the editor(s). MDPI and/or the editor(s) disclaim responsibility for any injury to people or property resulting from any ideas, methods, instructions or products referred to in the content. |
© 2026 by the authors. Licensee MDPI, Basel, Switzerland. This article is an open access article distributed under the terms and conditions of the Creative Commons Attribution (CC BY) license (http://creativecommons.org/licenses/by/4.0/).
Copyright: This open access article is published under a Creative Commons CC BY 4.0 license, which permit the free download, distribution, and reuse, provided that the author and preprint are cited in any reuse.