

Submitted:
04 October 2026
Posted:
08 October 2026
You are already at the latest version
Abstract
How much physiological information does the geometry of a cortical neuron's dendritic arbor carry, and does the answer differ between mouse and human? We re-derived arborization morphometrics for all 701 three-dimensional reconstructions in the Allen Cell Types Database (537 mouse, 164 human), validated the re-derivation against the released summaries, and linked morphology to intrinsic physiology cell by cell, treating the donor - not the cell - as the unit of inference. Coupling between total dendritic length and input resistance was negative in both released samples but far stronger among the human reconstructions (rho = -0.87, 95% CI -0.91 to -0.80; n = 162 cells, 35 donors) than among the mouse reconstructions (rho = -0.25, CI -0.38 to -0.12; n = 236 cells, 163 donors). Distribution matching and common-support restriction attenuate roughly half of the species contrast in Fisher-z units, while direct donor-aware contrasts at the shared restriction confirm that a substantial residual difference remains (Fisher-z difference -0.42 to -0.57; all intervals exclude zero), with wide uncertainty at the strictest restriction (human -0.67; n = 49 cells, 18 donors). Under comparable sampling distributions, the mouse gain in prediction from arbor geometry beyond size (+0.34) fell to +0.03 to +0.06 within mouse excitatory cells, and the human value (-0.05) was not stable under restriction; apical predominance was not supported. These findings quantify how sampling composition and morphological range shape species differences in this release; the residual coupling-magnitude contrast remains an observational comparison between released samples that differ in preparation and size range. Reproducible analysis code is openly archived with the study.
Keywords:
Allen Cell Types Database
; neuronal morphology
; electrophysiology
; dendritic arborization
; Sholl analysis
; morphoelectric coupling
; computational neuroscience
1. Introduction
Cortical computation depends on two classical single-cell modalities: the geometry of a neuron’s dendritic and axonal arbors, and the intrinsic membrane properties that shape its input-output behaviour. The Allen Cell Types Database released standardized whole-cell recordings for 2,336 mouse and human cortical neurons together with 701 three-dimensional reconstructions and downloadable SWC tracings, making a whole-release, cross-modal analysis possible without new tissue [1,2]. Established work on this resource produced transcriptomic cell taxonomies [3,4], integrated morphoelectric and transcriptomic classifications [5], and demonstrated that cell identity is partially predictable across modalities [1,6]; human morphoelectric typing [7], human-mouse physiological contrasts [8], whole-brain atlases of single human cortical neurons [9], and a 2026 multimodal Patch-seq reference of human neocortical glutamatergic neurons [10] followed. The latter reports pronounced mouse-human differences in apical dendrite arborization, a finding we re-examine at the compartment level here.
What has remained scattered is the arborization-level view. The database’s released morphometric summaries are dendrite-only; per-cell Sholl profiles and axon-level geometry are not part of the released tables, and, to our knowledge, no public, validated, scripted pipeline links arborization-scale features to the released electrophysiological features across the full reconstruction set in both species (cf. standard morphology tooling [11,12]). Whether such coupling differs between mouse and human cells has been addressed only for narrow populations, notably layer 2/3 pyramidal neurons with Bayesian-network dependency modelling [13], while cross-species classification from electrophysiology alone has also been explored [14]; human-mouse intrinsic differences are well documented for h-channel-dependent properties [8]. Two deeper questions have not been quantified on the full release: whether the coupling survives making the donor - the actual sampling unit in both species - the unit of inference; and, if it does, whether any apparent difference in the kind of morphological information that carries physiological predictability survives comparable sampling distributions and composition.
We therefore re-derived arborization morphometrics for the full reconstruction set, adding axon-level geometry, per-cell Sholl profiles and an apical/basal compartment split, and made the donor the unit of inference for the primary morphology-physiology coupling analyses: delete-one-donor jackknife p-values, donor-cluster bootstrap confidence intervals, Benjamini-Hochberg false-discovery-rate control within each species’ family of 150 feature pairs, and a minimum-inference rule of at least 10 donors and 20 cells. Donor metadata (age, sex, surgical etiology) were extracted from public release records only. Controls covered cortical area, class composition, range restriction and donor strata, and a nested restriction ladder decomposes how much of the species contrast each control removes. Because a species difference can also take the form of what morphology predicts rather than how strongly it correlates, the prediction decomposition was additionally evaluated under comparable sampling distributions: within the common-support restriction, across 2,000 range-matched human samples, and within a composition-restricted mouse subset; the residual species contrast was estimated directly with donor-aware resampling rather than read from a ladder transition; and compartment interpretation was tested by a paired apical-versus-basal contrast. We ask: (i) does the species coupling contrast survive donor-aware inference and the control ladder; (ii) how much of it reflects the human sample’s wider size distribution; and (iii) which parts of the apparent information-structure asymmetry survive comparable distributions and composition restriction?
2. Results
2.1. Cohort: The Full Release, Reconciled
The electrophysiological feature table contains 2,336 rows, all unique specimens (no duplicate specimens exist in the released table; Table 1). The reconstruction table contains 701 rows referring to 668 unique specimens: 33 specimens carry two tracings each, which we resolve by retaining the tracing with more parsed nodes; 398 rows (368 unique specimens) are axon-bearing ‘full’ reconstructions (537 mouse rows: 236 axon-bearing, 301 dendrite-only; 164 human rows: 162 axon-bearing, 2 dendrite-only). All 701 SWC files downloaded and parsed successfully. Human donor metadata were assembled from the public release records only (no restricted data): 42 human donors, ages 18-83 years (median 36), 23 male / 19 female, surgical etiologies 34 epilepsy / 8 tumor, and a recorded tissue source for 26 of the 42 donors (Swedish Medical Center 15, Harborview 11; 16 unreported in the public release fields) (Table 1; donor-level table in the supplement). The primary coupling samples comprise 236 mouse axon-bearing cells (163 donors) and 162 human axon-bearing cells (35 donors; 118 cells from middle temporal gyrus across 25 donors).
2.2. A validated, Open Re-Derivation of the Released Reconstructions
We recomputed compartment-specific lengths, branch points, tips, radial extents, path distances, mean branch diameters and 3-D Sholl profiles (10-micrometre bins, sphere-crossing counts on dendritic segments) from every released SWC file (Figure 1), separating apical from basal dendrites via the SWC structural-type codes (type 4 = apical, type 3 = basal), a dimension absent from the released summary tables. Recomputed dendritic metrics agree with the database summaries at Spearman rho = 0.9999 (total length), 0.995 (branch count) and 1.000 (max radial extent; n = 701) - a parsing-consistency check demonstrating that our parser reproduces the release’s computation, not an independent biological validation.
2.3. Arborization Complexity Varies with Class and Layer, Within Classes as Well as Between
Group dendritic Sholl profiles separated the broad classes in the expected directions (Figure 2a): Pvalb cells show narrow, steep profiles; Sst cells sustain broader profiles shifted outward; Vip-like cells show the lowest near-soma crossing density. The excitatory curve (n = 8 axon-bearing cells in the released set) is shown with a wide confidence interval and read as descriptive. By layer (Figure 2b), near-soma crossing density is highest in L4 and declines toward deeper layers while far-field crossings rise. Because layer and class are entangled in the released pool, we computed gradients within class: among excitatory reconstructed cells (all reconstruction types, n = 154), total dendritic length increases with layer order (rho = 0.42, q = 2.5e-7) and max radial extent more strongly (rho = 0.65, q = 3.6e-19), whereas Pvalb cells show no length gradient (rho = -0.12, n.s.). The laminar association is therefore not explained solely by class mixture (Figure 3).
2.4. Canonical Class Signatures Replicate in the Released Features
All 15 primary electrophysiological features separate the broad classes in the mouse sample (n = 1,922 QC-passed; Kruskal-Wallis, all BH-FDR q < 0.05), with the largest effect sizes for the upstroke-downstroke ratio (epsilon-squared = 0.42), fast-trough voltage (0.39) and membrane time constant (0.35) (Figure 4). The Pvalb signature is canonical: near-zero adaptation (median 0.002), short membrane tau (median 7 ms) and low upstroke-downstroke contrast (median 1.28 versus 1.9-3.5 in the other classes). Input resistance overlaps heavily between classes (median Pvalb 161 versus excitatory 172 MOhm), so class differences were more pronounced in spike-dynamic features than in input resistance, as expected from the literature.
2.5. Morphology-Physiology Coupling with the Donor as the Inference Unit
The central analysis asks how much single-cell morphology carries intrinsic-physiology information (Figure 5). Because cells are clustered within donors (163 mouse donors, 1.4 cells/donor; 35 human donors, 4.6 cells/donor), all inference treats the donor as the sampling unit: delete-one-donor jackknife p-values, donor-cluster bootstrap confidence intervals (2,000 resamples), and Benjamini-Hochberg control within each species’ family of 150 feature pairs. The headline pair - total dendritic length versus input resistance - is donor-robust in both species: mouse rho = -0.25 (jackknife p = 2.0e-4, family-adjusted q = 6.4e-4, 95% CI -0.38 to -0.12), human rho = -0.87 (q < 1e-15, CI -0.91 to -0.80) (Figure 6). Donor-aware inference trims the significance counts modestly rather than reordering them: of 150 mouse pairs, 82 were significant using cell-level BH-FDR and 78 remained significant under donor-aware inference (4 lost, 0 gained); of 150 human pairs, 94 were significant using cell-level BH-FDR and 85 were significant under donor-aware inference (84 retained, 10 lost, 1 gained). At the level of donor means (one value per donor, the most conservative aggregation), the headline association persists in both species (mouse -0.18, p = 0.021, n = 163 donors; human -0.88, p = 3.5e-12, n = 35 donors).
No single donor drives any headline estimate: leave-one-donor-out screening across both species and both headline outcomes (396 exclusions) changed no headline rho by more than 0.05 (maximum absolute change 0.023 mouse, 0.016 human; zero flags). Donor-level aggregated sensitivity preserves direction for all headline outcomes in both species (supplement). We conclude that the coupling structure is a property of the sampled populations, not of a few prolific donors or outlier cells (Figure S1).
2.6. Cortical-Area and Class-Composition Restrictions Do Not Eliminate the Coupling-Magnitude Contrast
The species contrast bundles species with cortical area (mouse V1 versus human temporal/frontal cortex) and class composition (the mouse axon-bearing sample is dominated by non-excitatory classes). Neither restriction eliminated the contrast. Restricting the human sample to middle temporal gyrus (118 cells, 25 donors) leaves the headline coupling essentially unchanged (rho = -0.87, CI -0.92 to -0.77; 63 of 150 pairs donor-aware significant), and the ladder transition from all-human (rho = -0.87) to MTG-only shifts the Fisher-z by only +0.03 (95% CI -0.32 to +0.37), an interval that includes zero (Figure 9, Table 2). Restricting the mouse sample to its excitatory cells using all reconstruction types (n = 171), the composition-matched contrast remains: mouse -0.46 versus human -0.87 (Fisher-z = 7.46; donor-cluster bootstrap of the z-difference 0.56 to 1.08), and -0.46 versus MTG-only human -0.87 (z = 6.99, bootstrap 0.51 to 1.14).
Human donor strata of age, sex and surgical etiology do not reverse the coupling: epilepsy stratum -0.86 (130 cells, 27 donors, donor-aware significant), tumor stratum -0.86 (32 cells, 8 donors - below the 10-donor minimum-inference rule, hence descriptive), age at or above the donor median -0.85 versus below -0.89, male -0.89 versus female -0.84. Every inferential stratum agrees with the pooled estimate; the tumor stratum and small area strata are reported as descriptive only. Etiology (epilepsy versus tumor resection) remains an uncontrolled characteristic of surgical-resection data - a limitation we return to in the Discussion.
2.7. Range Restriction: Three Claims, Separately Estimated
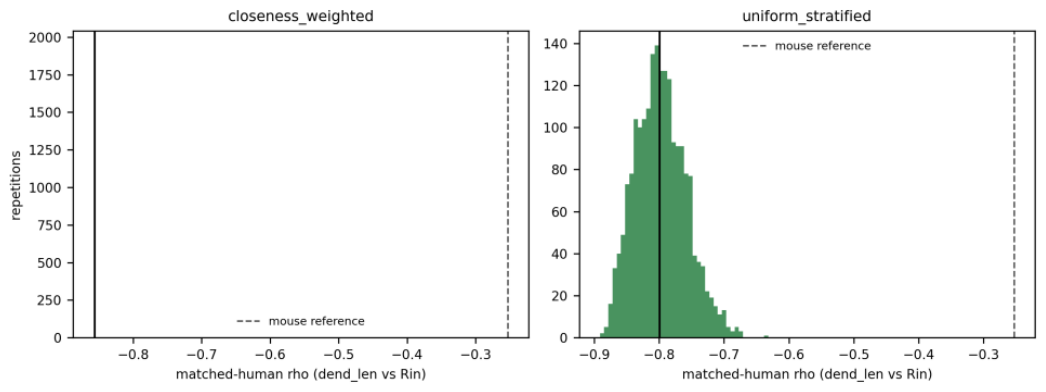
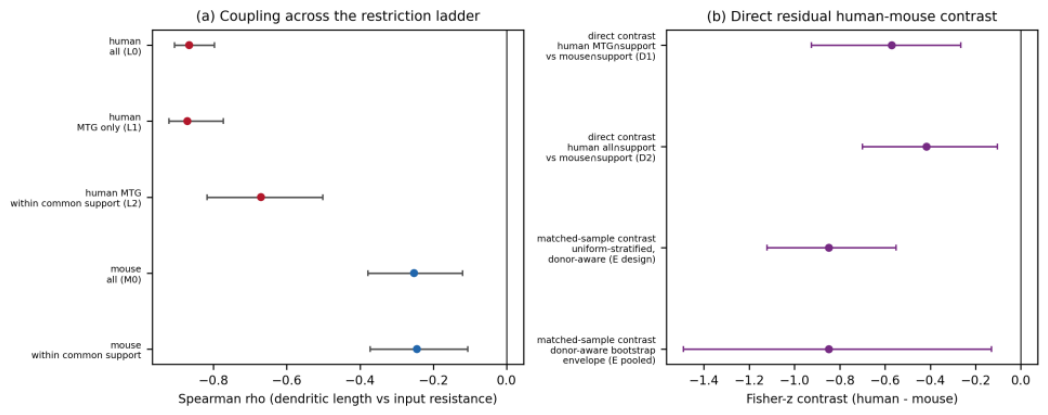
The human sample spans a dendritic-length standard deviation of 4,045 micrometres versus 908 in the axon-bearing mouse sample (4.5x), so part of the stronger human coupling could reflect the wider size range; we therefore separate three distinct claims and estimate each directly. Claim A - restriction changes the human estimate: moving from MTG-only (rho = -0.87) to MTG within the shared common support shifts the Fisher-z by -0.51 (95% CI -0.89 to -0.10), an interval excluding zero: restriction does attenuate the human estimate. Claim B - the human coupling remains negative under restriction: at the strictest rung the human estimate is -0.67 (n = 49 cells, 18 donors; donor-cluster bootstrap 95% CI -0.82 to -0.50), and at the shared-support rung without the area restriction -0.58 (n = 65 cells, 25 donors; CI -0.72 to -0.37). Claim C - a residual human-mouse contrast remains after restriction: this rests on direct donor-aware contrasts at the shared restriction, not on the ladder transition. Under the common-support restriction the direct Fisher-z difference is -0.57 (95% CI -0.93 to -0.27) against MTG-restricted human and -0.42 (CI -0.70 to -0.10) against all-restricted human, with raw rho differences -0.43 and -0.33; under the 2,000-sample no-replacement range-matching design the matched-human versus placebo-mouse z-difference is -0.85 (donor-aware 95% interval -1.49 to -0.13; like-for-like uniform-stratified design median -0.85, 2.5-97.5 percentile interval -1.12 to -0.55). Every interval excludes zero: a residual human-mouse coupling-magnitude contrast remains after both restriction designs (Figure 9).
A nested restriction ladder decomposes the controls’ joint effect (each rung compared with the previous rung, so rung effects are non-additive by construction): all-human -0.87 (162 cells, 35 donors), then MTG-only -0.87 (Fisher-z delta +0.03, CI -0.32 to +0.37), then MTG within common support -0.67 (n = 49 cells, 18 donors; delta -0.51, CI -0.89 to -0.10). The ladder answers Claim A (restriction changes the estimate); Claims B and C are supported by the restricted estimates and the direct contrasts above (Table 2).
Figure 7.
| Range-restriction control: matched-human coupling under 2,000 no-replacement draws matching the mouse dendritic-length distribution. (a) Closeness-weighted matching (nearly deterministic; shown for transparency; mean matched n 158). (b) Uniform stratified matching (primary variant; mean matched n 75). Dashed line: mouse full-sample reference (-0.25). The matched-human distribution stays far below the mouse reference in both variants; the placebo (matching applied to mouse itself) reproduces the mouse estimate (text).
Figure 7.
| Range-restriction control: matched-human coupling under 2,000 no-replacement draws matching the mouse dendritic-length distribution. (a) Closeness-weighted matching (nearly deterministic; shown for transparency; mean matched n 158). (b) Uniform stratified matching (primary variant; mean matched n 75). Dashed line: mouse full-sample reference (-0.25). The matched-human distribution stays far below the mouse reference in both variants; the placebo (matching applied to mouse itself) reproduces the mouse estimate (text).
2.8. Prediction Benchmarks Under Comparable Distributions: The Information-Structure Asymmetry Is Largely Composition and Range
If the human coupling is strong because size alone tracks membrane leak, then size should nearly saturate human predictability, and geometry beyond size should be redundant; if the mouse coupling is weak in magnitude but structurally rich, geometry beyond size should still carry information. In the full within-species samples this pattern holds (mouse 0.23 to 0.57, paired +0.34, 95% partition interval 0.31-0.39; human 0.86 to 0.82, paired -0.05, 95% partition interval -0.07 to -0.03). A stress test asks whether it survives comparable sampling distributions. First, re-running the identical prediction protocol inside the common-support restriction leaves the mouse gain unchanged (0.22 to 0.57, paired +0.35, 95% partition interval 0.31-0.39) but removes the human negative delta (0.56 to 0.59, paired +0.01, 95% partition interval -0.06 to +0.09): the human full-sample value was partly a product of the wide human size range, not a stable structural property. Second, under 2,000 range-matched human samples (no replacement, donor-grouped evaluation), the human delta persists only weakly: median -0.05 (2.5-97.5 percentile interval -0.10 to -0.005). Third, restricting the mouse sample to its excitatory-compatible cells (all reconstruction types, n = 171, 121 donors - the only excitatory-compatible mouse subset large enough for donor-grouped evaluation) collapses the mouse gain from +0.34 to +0.03 (full 10-feature model, 95% partition interval -0.02 to +0.07; dendritic-feature model +0.06, 95% partition interval 0.02-0.08): the mouse geometry-beyond-size gain is largely carried by the non-excitatory-dominated composition of the mouse axon-bearing sample (7 of 236 cells classified as excitatory), not by a species property of excitatory cells. Fourth, the compartment prediction decomposition shows that neither compartment adds unique predictive information beyond total dendritic size in human (apical-only 0.68, basal-only 0.64, apical+basal 0.86 versus size-only 0.86; full-10 0.82): apical morphology is redundant with size there. The consistent conclusion across all four tests: the apparent species asymmetry in what morphology predicts is strongly shaped by sample composition (which cells enter each species’ prediction sample) and morphological range, and does not support a simple species-level physiological interpretation (Figure 8).
Which compartments carry the human coupling? Separating apical from basal dendritic length (SWC structural types 4 and 3), the human input-resistance coupling is strong in both compartments (apical -0.72, basal -0.65, pooled reconstruction types) and the paired apical-minus-basal contrast is -0.13 with a 95% interval of -0.34 to +0.09 that includes zero: we therefore do not claim apical predominance. Within cells that bear an apical dendrite (n = 118, 31 donors), the basal association is numerically at least as strong as the apical one (-0.77 versus -0.65; paired +0.24, CI -0.06 to +0.54). In mouse, the pooled apical association is moderate (-0.40) and the basal association is absent (-0.05; paired -0.37, CI -0.52 to -0.21, excluding zero), but within apical-bearing mouse cells both compartments associate moderately and the contrast includes zero (-0.40 versus -0.36; paired -0.05, CI -0.23 to +0.15): the mouse compartment dissociation is also largely a presence/absence (composition) effect. The compartment-level agreement with independently reported mouse-human apical arborization differences [10] stands at the descriptive level, not as a predominant-carrier claim.
Figure 8.
| Prediction stress test (input resistance). (a) Leave-one-donor-out ridge prediction rho for size-only versus full 10-feature morphology across the comparability configurations: full within-species samples, common-support restriction, mouse excitatory-compatible subset (composition-matched), and the 2,000-sample range-matched human design. (b) Paired size-beyond-size deltas (full minus size-only) with 95% partition intervals (2.5-97.5 percentiles across 100 random 5-fold donor-grouped partitions); the mouse-excitatory point estimate carries no interval in this panel (single design median; interval in Supplementary Table S4). The mouse gain persists under range restriction but collapses under composition restriction; the human gain is not stable under either restriction.
Figure 8.
| Prediction stress test (input resistance). (a) Leave-one-donor-out ridge prediction rho for size-only versus full 10-feature morphology across the comparability configurations: full within-species samples, common-support restriction, mouse excitatory-compatible subset (composition-matched), and the 2,000-sample range-matched human design. (b) Paired size-beyond-size deltas (full minus size-only) with 95% partition intervals (2.5-97.5 percentiles across 100 random 5-fold donor-grouped partitions); the mouse-excitatory point estimate carries no interval in this panel (single design median; interval in Supplementary Table S4). The mouse gain persists under range restriction but collapses under composition restriction; the human gain is not stable under either restriction.
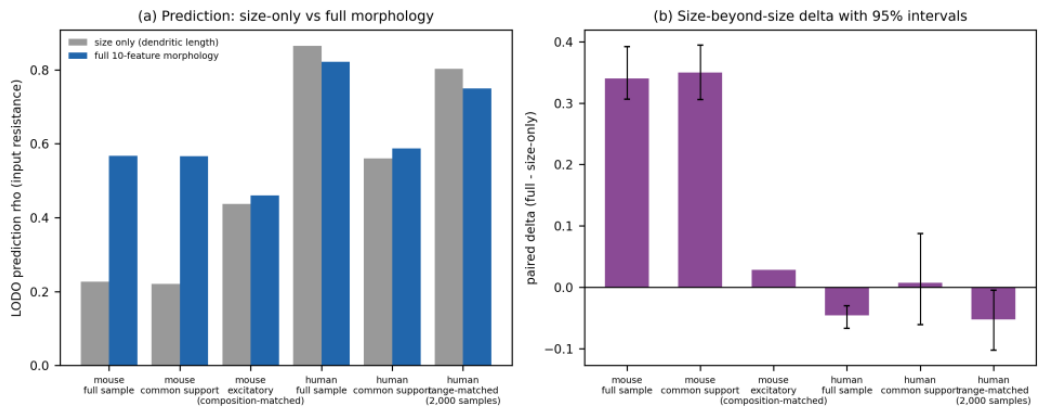
Figure 9.
| Direct residual species-sample contrast after restriction. (a) Coupling (dendritic length vs input resistance) across the restriction ladder with donor-cluster bootstrap 95% CIs: human all, human MTG, human MTG within common support; mouse all, mouse within common support. (b) Direct Fisher-z contrasts (human minus mouse): D1 (human MTG within common support vs mouse within common support), D2 (human all within common support), and the matched-sample donor-aware contrast (E). All direct-contrast intervals exclude zero.
Figure 9.
| Direct residual species-sample contrast after restriction. (a) Coupling (dendritic length vs input resistance) across the restriction ladder with donor-cluster bootstrap 95% CIs: human all, human MTG, human MTG within common support; mouse all, mouse within common support. (b) Direct Fisher-z contrasts (human minus mouse): D1 (human MTG within common support vs mouse within common support), D2 (human all within common support), and the matched-sample donor-aware contrast (E). All direct-contrast intervals exclude zero.
2.9. The Electrophysiological Feature Space (Supplement)
The global structure of the released mouse physiology is visualized by a UMAP embedding of the 15 primary features (supplement Figure S3; hyperparameters n_neighbors = 30, min_dist = 0.25, seed 42; deterministic given the seed [15]). Broad classes occupy separable territories, cortical layer shows a systematic gradient within the excitatory territory, and the reconstructed subset overlays as graded, class-consistent structure (a descriptive overlay, not an inferential claim).
2.10. Robustness and Sensitivity
Additional sensitivity analyses (each specified before its execution): (i) Reconstruction-completeness screens do not drive the human coupling - a tip-truncation screen and a branch-completeness screen move the headline estimate by at most 0.03 (human: -0.84 to -0.87 across screens; mouse: -0.25 to -0.25), and 33 doubly-traced specimens were deduplicated by retaining the denser tracing (headlines unchanged). (ii) Morphometric redundancy is confined to geometric quantities (16 of 342 within-block pairs with |rho| > 0.9: branch count with tip count, max extent with max path distance, surface with volume, and axon length with axon extent and path distance); the effective dimensionality of the morphometric block is 10 principal components (mouse) and 9 (human) to 95% variance, so the prediction benchmark is not dominated by a single size axis. (iii) The sag dissociation appeared across several analyses but was not stable under common-support restriction and is therefore retained as exploratory: within mouse excitatory cells dendritic length correlates positively with sag (rho = +0.44, n = 171) and in human it does not (rho = -0.01; composition-matched Fisher-z = 4.36, bootstrap CI 0.22 to 0.75; MTG-only restriction strengthens the point estimate, z = 5.51, CI 0.37 to 0.95); human sag is also unpredicted from morphology in the LODO benchmark (-0.46 to -0.03), and the common-support test shows this human sag exception does not persist under restriction (-0.06, CI -0.27 to +0.11) while the tau exception does (+0.30, CI 0.19 to 0.44). Consistent with h-channel-dependent species differences [8], we retain this as hypothesis-generating, not a headline. (iv) The first canonical correlation (morphometric vs physiological block, complete cases, no imputation) is 0.727 (mouse, n = 208) and 0.894 (human, n = 116), reported as descriptive structure with upward bias under correlated blocks.
3. Discussion
Four conclusions are supported. First, the released reconstructions admit an open, validated arborization-level re-derivation whose dendritic metrics reproduce the database summaries (a parsing-consistency result, not an independent biological validation), adding axon-level geometry, per-cell Sholl profiles and an apical/basal compartment split that the release tables do not provide. Second, single-cell coupling between arborization and intrinsic physiology is sign-consistent across the two released species samples - larger arbors, lower input resistance - and this sign invariance survives donor-aware inference, cortical-area restriction, age/sex/etiology strata, reconstruction-completeness screens and leave-one-donor-out influence screening. Third, the magnitude of the coupling differs between the released human and mouse samples, and approximately half of the raw Fisher-z contrast was attenuated after restricting the observed dendritic-length range - a contribution measured twice over (the ladder attenuation, and direct donor-aware contrasts at the shared restriction: Fisher-z difference -0.42 to -0.57, all intervals excluding zero; matched-sample donor-aware contrast -0.85, interval -1.49 to -0.13) rather than asserted as a caveat. Fourth, the apparent species asymmetry in the kind of morphological information that carries physiology is strongly shaped by sampling composition and morphological range and does not support a simple species-level physiological interpretation. In the full within-species samples, arbor geometry beyond total size added +0.34 of predicted-versus-observed rho in mouse and -0.05 in human; under comparable distributions the mouse gain collapses to +0.03 to +0.06 within mouse excitatory cells (7 of the 236 cells in the axon-bearing mouse prediction sample are classified as excitatory), the human value is not stable under restriction (0.00, 95% partition interval -0.06 to +0.09, under common support; weakly negative under range matching), and neither compartment adds unique predictive information beyond total size in human. What survives is the coupling-magnitude difference itself, quantified directly.
What the results do not support: a species-level biological principle about cortical neurons in general. The contrast bundles species with cortical area (which does not materially change the estimated coupling here, by direct measurement), preparation (acute mouse recordings versus surgical-resection human tissue), donor structure (35 human patients versus 163 mouse donors) and etiology (epilepsy and tumor resections) - and, as the comparability tests show, with sample composition and morphological range. Because human morphoelectric work on this same release [7] and human-mouse comparisons [8] already anticipated larger, physiologically distinct human pyramidal cells, and the 2026 multimodal reference [10] independently reports pronounced mouse-human apical dendrite differences, we read the compartment-level agreement as external consistency, not confirmation of a novel species principle.
What survives, and what does not. The sign invariance and the headline pair remained directionally consistent across the examined controls on released data. The magnitude contrast is halved under range restriction, and the residual estimate rests on 49 cells from 18 donors - small enough that we present the restricted endpoint as the honest uncertainty floor of this dataset rather than as a refined effect size. The prediction asymmetry (+0.34 versus -0.05) does not survive the comparable-distribution and composition tests as a species property: the mouse gain is largely composition-driven and the human saturation is not stable under restriction. The strongest defensible statement about information content is therefore negative and methodological - in these released samples, apparent species differences in what morphology predicts are dominated by who is in the sample and over what range, a confound that donor-aware, distribution-controlled designs are needed to detect.
Alternative explanations that remain open. Surgical etiology cannot be controlled (8 tumor donors fall below the minimum-inference rule; the tumor-stratum point estimate matches the epilepsy stratum but stays descriptive). Preparation differences (in vivo-style mouse versus resected human tissue, post-mortem intervals, clinical pharmacology) are untestable with released data. Spine exclusion in automated tracing makes absolute arbor sizes release-specific. The Fisher-z machinery is applied to rank correlations as an approximation. And prediction benchmarks describe these released samples; they are not calibrated population statements.
Relative to prior work, the contribution is scoped as quantification, decomposition and resource: (i) validated open analysis code that re-derives axonal geometry, Sholl profiles and apical/basal splits for all 701 released reconstructions; (ii) whole-release coupling quantification with the donor as the inference unit, which we present as validity hardening rather than methodological novelty - the estimators are standard; (iii) a quantified attenuation of the cross-sample contrast under range restriction in this release, now with a direct donor-aware residual contrast; and (iv) a stress-tested decomposition showing that the apparent information-structure asymmetry is largely composition- and range-shaped, illustrating a caution relevant to cross-sample morphoelectric comparisons. We do not claim a new taxonomy [1-5], and we do not interpret the Sst within-class null (power-limited).
Limitations. This is a single-database secondary analysis with the release’s own preprocessing; reconstruction completeness cannot be certified (no truncation flags exist in the release; our screens are conservative); human donor metadata are limited to the public release fields (age, sex, etiology, tissue source) and tumor/epilepsy etiologies are unbalanced as in the source population; the composition-matched mouse comparison uses all reconstruction types because excitatory axon-bearing mouse cells number 7 (below the minimum-inference rule), so that subset’s axon features carry a reconstruction-type artefact we document rather than hide; no compatible external validation dataset exists to our knowledge - the candidate resources (NeuroMorpho, NeuroElectro) lack the paired per-cell morphology-plus-physiology design, and the remaining compatible datasets are the same cells. An analysis plan was maintained during the project, but the complete final analysis set was not prospectively registered.
4. Methods
4.1. Data Source and Snapshot
We used the Allen Cell Types Database [2] via the public Allen Brain Map API (api.brain-map.org), accessed 2026-09-17 without credentials. The release state at the access date defines the analysis snapshot. Components: electrophysiological feature table (model::EphysFeature, 2,336 rows, 56 fields), reconstruction table (model::NeuronReconstruction, 701 rows), per-specimen metadata (model::Specimen batched identifier queries with structure and donor joins; batched queries require explicit num_rows=all, otherwise the API caps responses at 50 rows) and the Age lookup table (899 rows, exact ages in days), used to convert donor age metadata to years. No credentials or data-use agreements are required; no participant-level restricted data were used or submitted to any external service. Duplicate-tracing semantics were verified directly from the tables: 701 reconstruction rows refer to 668 unique specimens, 33 specimens carrying two tracings each; analyses deduplicate by retaining the tracing with more parsed nodes.
4.2. Human Donor Metadata (Public Records Only)
Donor-level fields present in the public release (sex, age in years via the Age lookup, condition description giving the surgical etiology category, tissue source, post-mortem interval where present) were extracted from the public release records - no additional scraping, no restricted data. All 42 human donors have age (18-83 years, median 36) and sex (23 M / 19 F); condition descriptions classify 34 epilepsy and 8 tumor resections; a tissue source is recorded for 26 of the 42 donors (Swedish Medical Center 15, Harborview 11), and the remaining 16 donors carry no tissue-source value in the public release fields. The assembled donor-level metadata are summarized in Supplementary Table S1.
4.3. Cohort, Species, Class and Layer Assignment
Species: donor organism_id (human = 1, mouse = 2), with a specimen-name fallback (names beginning ‘H<digit>’ classified as human); verified to introduce no misassignment in the archived snapshot. Broad classes (mouse): Pvalb, Sst, Vip-like (Vip, Htr3a, Ndnf), excitatory (Cux2, Emx1, Nr5a1, Rorb, Scnn1a, Rbp4, Tlx3, Tle4, Slc17a7, Ntsri1, Glt25d2 detected in the specimen name), no-cre/other. Human cells are reported as a single stratum dominated by middle temporal gyrus (118/162 axon-bearing cells). Layers parsed from structure acronyms (VISp1-6); human structures carry no layer assignment. QC (2,335/2,336 pass; the excluded cell is mouse): finite primary features, input resistance > 0, membrane time constant > 0, resting potential between -90 and -40 mV. Primary coupling analyses use axon-bearing reconstructions, with dendrite-only inclusion as a sensitivity analysis.
4.4. Class Signatures and Laminar Gradients
Class signatures were tested on the QC-passed mouse electrophysiology cohort (n = 1,922; the full released ephys sample, independent of reconstruction): for each of the 15 primary electrophysiological features, a Kruskal-Wallis test compared the five broad classes (Pvalb, Sst, Vip-like, excitatory, no-cre/other; groups with at least 5 cells), with epsilon-squared as the effect size, class medians reported, and Benjamini-Hochberg false-discovery-rate control applied across the family of 15 tests. Laminar gradients were computed within the mouse reconstructed sample: Spearman correlations of four dendritic morphometrics (total dendritic length, maximum radial extent, branch count and Sholl peak) with layer order (VISp layers 1-6 as an ordinal variable), computed across all reconstructed cells and within class (excitatory cells across all reconstruction types; Pvalb axon-bearing cells), with Benjamini-Hochberg control across the family of scope-by-feature tests in this analysis.
4.5. Morphometric Re-Derivation from SWC
SWC files parsed with explicit id-to-row parent resolution. Coordinates recentered on the soma centroid; compartments defined by SWC structural type (1 = soma, 2 = axon, 3 = basal dendrite, 4 = apical dendrite). Per compartment: total length (sum of parent-child segment norms), branch points (nodes with >= 2 children), tips, max radial extent, max path distance, mean branch diameter. The apical/basal split uses the structural-type codes directly, without assuming the standard three-plane convention of manual tracings - the released automated tracings carry explicit type-4 annotations, enabling the compartment analysis. In the full-sample prediction scope, apical length is non-zero for 10 of the 236 mouse axon-bearing rows and for 117 of the 162 human axon-bearing rows (Supplementary Table S6); in the pooled all-reconstruction-type mouse scope, 236 cells from 172 donors bear an apical compartment, and the paired apical-versus-basal contrast uses 118 human apical-bearing cells from 31 donors (Supplementary Table S5); apical length zero denotes no apical dendrite in the reconstruction. 3-D Sholl profiles on dendritic segments (soma-rooted): counts of parent-child segments crossing spheres of radius 10-600 micrometres in 10-micrometre steps. Parsing-consistency validation against the released summaries: Spearman rho = 0.9999 (total dendritic length), 0.995 (branch count), 1.000 (max radial extent), n = 701.
4.6. Donor-Aware Statistical Inference (Primary)
Estimand: Spearman rank correlation per morphometric-by-physiological feature pair per species (150 pairs per species; axon-bearing reconstructions; listwise deletion per test; no imputation). Inference: delete-one-donor jackknife (pseudo-values over donors, standard error sqrt((G-1)/G * sum (theta_g - theta_bar)^2), t-test with G-1 degrees of freedom) as the primary p-value; donor-cluster bootstrap percentile 95% confidence intervals (2,000 resamples, donors sampled with replacement, cells travelling with their donor); Benjamini-Hochberg false-discovery-rate control within each species’ family of 150 jackknife p-values. Minimum-inference rule: p-values and CIs are reported only for strata with at least 10 donors and 20 cells; smaller strata are labelled DESCRIPTIVE. Leave-one-donor-out influence: each headline estimate recomputed 396 times (all donor exclusions, both species, headline outcomes); a flag is |delta rho| > 0.05. Donor-level sensitivity: per-donor means as the observational unit, Pearson correlation across donors. Cell-level BH inference is retained alongside for comparison; 4 of 82 mouse and 10 of 94 human cell-level significant pairs do not survive donor-aware inference (1 human pair is gained).
4.7. Range-Restriction Controls (Two Complementary Designs)
Design 1, no-replacement distribution matching: the mouse dendritic-length distribution is divided into 20 quantile strata; in each of 2,000 repetitions human cells are drawn without replacement from the corresponding strata (closeness-weighted variant: probability proportional to exp(-distance/tau); uniform-stratified variant: uniform within stratum), the headline Spearman is recomputed per repetition, and the matched-human distribution is summarized by median and 2.5-97.5 percentile interval. A placebo applies the identical procedure within mouse to verify the estimator is not distorted by matching itself. Design 2, common support: the mouse 0.5th-99.5th percentile of dendritic length intersected with the human support (719-5,603 micrometres), retaining all cells in the intersection, with the retained-human estimate labelled descriptive when the minimum-inference rule fails.
4.8. Nested Restriction Ladder and Direct Restricted Contrasts
Rung definitions: L0 human all; L1 human MTG only; L2 human MTG within common support; M0 mouse all; M1 mouse excitatory (axon-bearing cells only - 7 cells from 7 donors, hence descriptive). Each rung is compared with the previous rung by the Fisher-z difference with a donor-cluster bootstrap 95% interval (2,000 resamples); because rungs nest, deltas are per-transition and non-additive by construction, and we report them as such. The ladder supports only the claim that restriction changes the human estimate (Claim A); the residual species-sample contrast (Claim C) is estimated directly: donor-cluster bootstrap of each restricted species’ Fisher-z (2,000 draws, donors resampled within species, independently per draw), the contrast being the difference of the two z distributions, reported as median and 2.5-97.5 percentile interval, with the raw rho difference reported descriptively. The matched-sample contrast re-runs the no-replacement matching design (2,000 repetitions, seed 43) with donor-aware uncertainty: within each repetition, a donor-cluster bootstrap (100 draws, donors of that repetition’s matched-human and placebo-mouse samples resampled with replacement, cells travelling) brackets the matched rho; the reported interval pools the per-repetition bootstrap envelopes, and the like-for-like design-based (per-repetition) distribution is reported alongside.
4.9. Prediction Benchmark and Comparability Stress Tests
Primary benchmark: ridge regression (alpha = 1) predicting six canonical electrophysiological features from morphometric features, standardized within each training fold (no leakage), evaluated by leave-one-donor-out cross-validation (each held-out fold is one donor’s cells; performance as Spearman correlation between predicted and observed values on held-out cells; mouse complete-case n = 236, human n = 162 for the primary outcomes; adaptation 208/116). Decomposition: baseline model B2 uses total dendritic length only; model M uses all ten morphometric features. The reported model-performance values (size-only and full-model rho) are leave-one-donor-out estimates: leave-one-donor-out cross-validation fixes the held-out cells (each donor’s cells in turn) and yields one estimate per model. Uncertainty in the paired model difference was summarized separately using 100 repeated random 5-fold donor-grouped cross-validation partitions (fixed seed sequence, 999 + repetition index); within each repetition, the same donor-to-fold assignment was used for both models, so the paired delta (M - B2) compares the models on exactly the same training and held-out cells. The paired interval is the 2.5-97.5 percentile of the 100 per-repetition deltas (hereafter ‘95% partition interval’); it quantifies the spread of the model difference across random partitions and is not a donor-bootstrap confidence interval. The comparability stress tests reuse the identical protocol (same estimator, same alpha, no re-tuning, no model selection): (i) common-support prediction - the same prediction sample restricted to the shared common-support interval, per species, with the paired delta over the same 100-repetition paired-partition convention; (ii) range-matched prediction - for each of the 2,000 no-replacement range-matched human samples, both size-only and full-morphology LODO prediction inside the matched sample with folds at donor level, the paired delta summarized across samples; (iii) composition sensitivity - the mouse excitatory-compatible subset (all reconstruction types, n = 171, 121 donors) with size-only, dendritic-feature (7 features valid across reconstruction types) and full-10 models, plus the full within-species mouse and human samples with the same dendritic-feature model for like-for-like comparison; the 7-cell axon-bearing excitatory subset is reported as inadequate (no unstable CV estimates are forced); (iv) compartment prediction - models using total dendritic length, apical length only, basal length only, apical plus basal, and the full 10-feature set (human full sample; the mouse apical-only model is unstable, 10 of 236 cells apical-bearing, and is reported as such); and (v) the paired apical-versus-basal contrast per species on pooled reconstruction types, with a donor-cluster bootstrap (2,000 draws) applied to both correlations on the same resamples, and an apical-bearing sensitivity analysis. All prediction benchmarks describe the released samples; they are not tuned, model-selected, or calibrated population statements.
4.10. Statistical Software
Analyses were executed in Python 3.12.10 using NumPy [16], SciPy [17], pandas, scikit-learn [18], matplotlib [19] and umap-learn [15]. All resampling procedures used fixed random seeds (seed 42 for primary analyses, seeds 1-3 for transparency re-runs, seed 43 for the range-matching design); the number of bootstrap and matching repetitions is stated for each analysis above.
Author Contributions
P.S. conceived the study, designed and conducted the analyses, interpreted the results, prepared the figures, and wrote and revised the manuscript.
Funding
This research received no specific grant from any funding agency in the public, commercial, or not-for-profit sectors.
Competing interests
The author declares no competing interests.
Data availability
All data used in this study are publicly released by the Allen Institute through the Allen Cell Types Database (Allen Brain Map portal, https://portal.brain-map.org) and can be obtained directly from the Allen Institute; no credentials or data-use agreements are required. The source data are not redistributed with the code repository; the repository documentation (docs/DATA.md) describes the required source components, the API query patterns used, and the local data layout the pipeline expects.
Code availability
Reproducible analysis code is publicly available at https://github.com/ItsTongKung/allen-morphophysiology and archived as version 1.0.0 on Zenodo (https://doi.org/10.5281/zenodo.23135429). The pipeline reproduces the reported analyses from the public source data; the repository contains no source or derived data.
Ethics statement
This study used only publicly released, de-identified data from the Allen Cell Types Database. No new human participants or animals were recruited, sampled, or experimentally studied as part of this work.
Use of generative AI
During the preparation of this work, the author used generative AI tools to assist with coding, checking and refining English language, readability, and minor translation. All analyses, results, interpretations, and manuscript content were reviewed and verified by the author, who takes full responsibility for the content of the work.
References
- Gouwens, N. W., Sorensen, S. A., Berg, J., et al. Classification of electrophysiological and morphological neuron types in the mouse visual cortex. Nat. Neurosci. 22, 1182-1195 (2019).
- Allen Institute for Brain Science. Allen Cell Types Database, electrophysiology and morphology releases (accessed 2026-09-17 via https://api.brain-map.org).
- Tasic, B., Menon, V., Nguyen, T. N., et al. Adult mouse cortical cell taxonomy revealed by single cell transcriptomics. Nat. Neurosci. 19, 335-346 (2016).
- Tasic, B., Yao, Z., Graybuck, L. T., et al. Shared and distinct transcriptomic cell types across neocortical areas. Nature 563, 72-78 (2018).
- Gouwens, N. W., Sorensen, S. A., Bizup, J., et al. Integrated morphoelectric and transcriptomic classification of cortical GABAergic cells. Cell 183, 935-953.e19 (2020).
- Lipovsek, M., Bardile, A., Ito, T., et al. Patch-seq: Past, Present, and Future. J. Neurosci. 41, 937-946 (2021).
- Berg, J., Sorensen, S. A., Miller, J., et al. Human neocortical expansion involves glutamatergic neuron diversification. Nature 598, 151-158 (2021).
- Kalmbach, B. E., Buchanan, J., Sorensen, S. A., et al. h-Channels Contribute to Divergent Intrinsic Membrane Properties of Supragranular Pyramidal Neurons in Human versus Mouse Cerebral Cortex. Neuron 100, 1194-1208.e5 (2018).
- Lee, S., Huang, Z. J., et al. Whole human-brain mapping of single cortical neurons for profiling morphological diversity and stereotypy. Sci. Adv. 9, eadf3771 (2023).
- Dalley, R., Walling-Bell, S., Miller, J. A., et al. Human neocortical glutamatergic neurons revealed through multimodal profiling. bioRxiv 2026.01.08.698257 (2026). PMID 41542430. [CrossRef]
- Wilson, C. J. Valid statistical approaches for analyzing sholl data: Mixed effects versus simple linear models. J. Neurosci. Methods 279, 33-43 (2017).
- Lopez-Cabrera, J. A. & Lopez-Aguado, D. New morphological features based on the Sholl analysis for automatic classification of traced neurons. J. Neurosci. Methods 343, 108835 (2020).
- Mihaljevic, B., Dyrba, M., Bjaalie, J. G. & Leergaard, T. B. Comparing the Electrophysiology and Morphology of Human and Mouse Layer 2/3 Pyramidal Neurons With Bayesian Networks. Front. Neuroinform. 15, 580873 (2021).
- Ophir, E., et al. Classifying Neuronal Cell Types Based on Shared Electrophysiological Information from Humans and Mice. Neuroinformatics 22, 473-486 (2024).
- McInnes, L., Healy, J. & Melville, J. UMAP: Uniform Manifold Approximation and Projection for dimension reduction. arXiv:1802.03426 (2018).
- Harris, C. R., Millman, K. J., van der Walt, S. J., et al. Array programming with NumPy. Nature 585, 357-362 (2020).
- Virtanen, P., Gommers, R., Oliphant, T. E., et al. SciPy 1.0: fundamental algorithms for scientific computing in Python. Nat. Methods 17, 261-272 (2020).
- Pedregosa, F., Varoquaux, G., Gramfort, A., et al. Scikit-learn: Machine Learning in Python. J. Mach. Learn. Res. 12, 2825-2830 (2011).
- Hunter, J. D. Matplotlib: A 2D Graphics Environment. Comput. Sci. Eng. 9, 90-95 (2007).
Figure 1.
| Real neuronal reconstructions from the released SWC files. Top row: mouse visual-cortex exemplars by broad class (median-rank total dendritic length among axon-bearing reconstructions). Bottom row: human exemplars (MTG-dominant temporal cortex). Axon red, dendrites blue, soma black; xy projections, soma-centered; 100-micrometre scale bars.
Figure 1.
| Real neuronal reconstructions from the released SWC files. Top row: mouse visual-cortex exemplars by broad class (median-rank total dendritic length among axon-bearing reconstructions). Bottom row: human exemplars (MTG-dominant temporal cortex). Axon red, dendrites blue, soma black; xy projections, soma-centered; 100-micrometre scale bars.
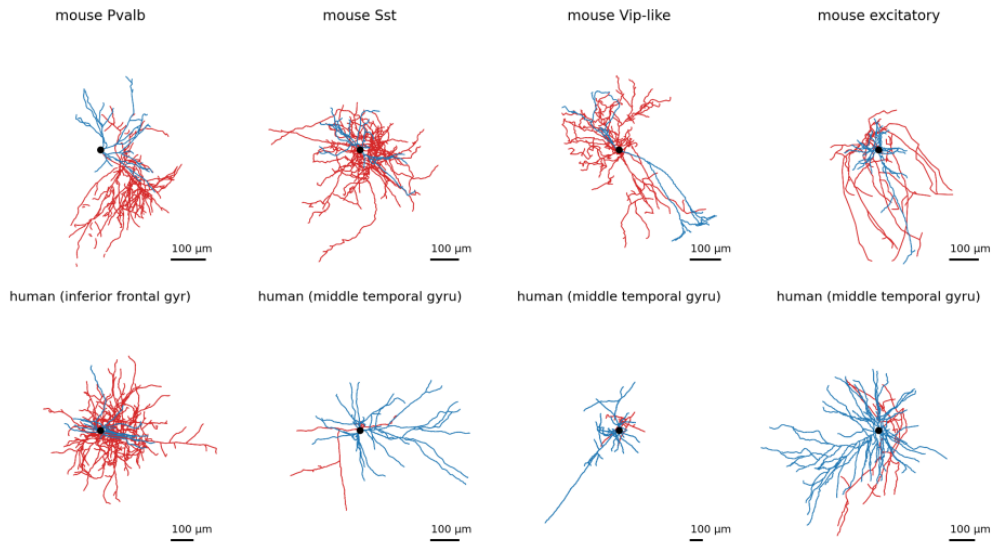
Figure 2.
| Dendritic Sholl profiles of reconstructed mouse neurons (mean with 95% CI bands). (a) By broad class; the excitatory curve rests on n = 8 axon-bearing cells - interpret as descriptive. (b) By cortical layer (all reconstructed cells with assigned layer); layer and class are entangled in the released pool (see within-class analysis in text).
Figure 2.
| Dendritic Sholl profiles of reconstructed mouse neurons (mean with 95% CI bands). (a) By broad class; the excitatory curve rests on n = 8 axon-bearing cells - interpret as descriptive. (b) By cortical layer (all reconstructed cells with assigned layer); layer and class are entangled in the released pool (see within-class analysis in text).
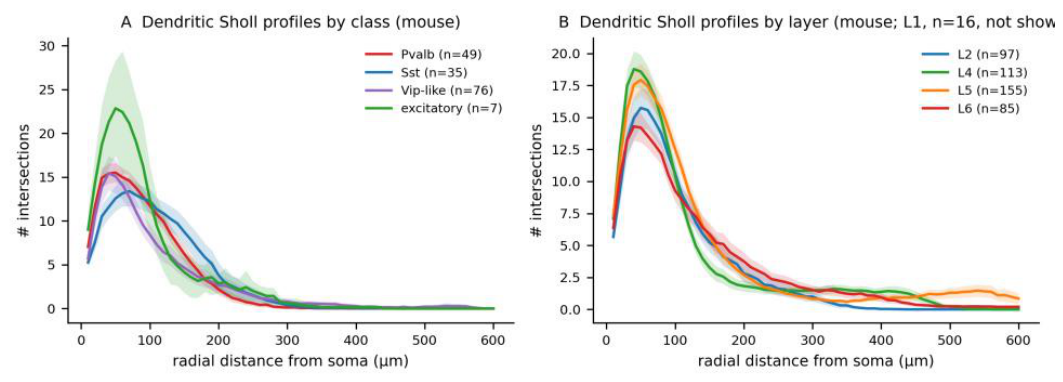
Figure 3.
| Laminar arborization gradients, cell-by-cell, mouse V1 (box plots with individual cells; all reconstructed cells with assigned layer). (a) Total dendritic length. (b) Maximum dendritic extent. (c) Total axon length (affected by reconstruction-selection bias; not interpreted as a biological gradient).
Figure 3.
| Laminar arborization gradients, cell-by-cell, mouse V1 (box plots with individual cells; all reconstructed cells with assigned layer). (a) Total dendritic length. (b) Maximum dendritic extent. (c) Total axon length (affected by reconstruction-selection bias; not interpreted as a biological gradient).
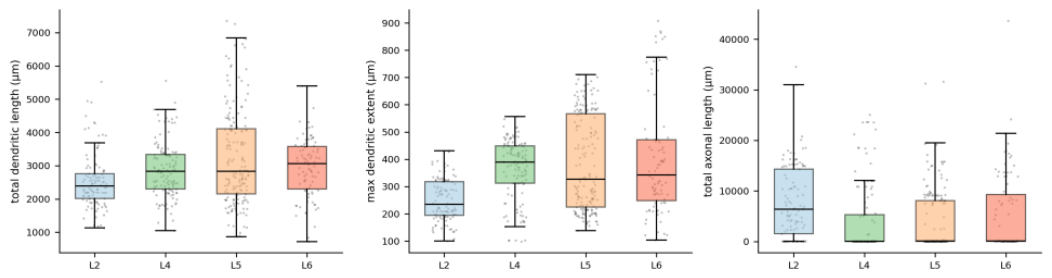
Figure 4.
| Canonical class signatures of intrinsic physiology, mouse (box plots with individual cells; n = 1,922 QC-passed). Pvalb non-adaptation and narrow, high-contrast spikes replicate; input resistance overlaps across classes (medians in the supplement).
Figure 4.
| Canonical class signatures of intrinsic physiology, mouse (box plots with individual cells; n = 1,922 QC-passed). Pvalb non-adaptation and narrow, high-contrast spikes replicate; input resistance overlaps across classes (medians in the supplement).
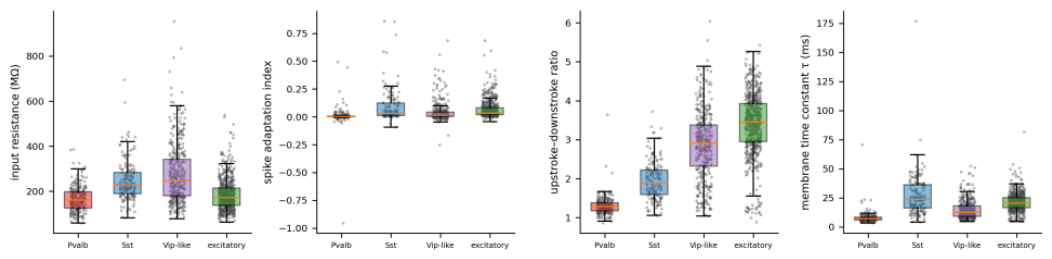
Figure 5.
| Morphology-physiology coupling matrices (Spearman rho, axon-bearing reconstructions). Left: mouse; right: human. Colour encodes rho (scale -1 to +1); asterisks mark donor-aware family-adjusted significance (q < 0.05, delete-one-donor jackknife with Benjamini-Hochberg correction within each species’ family of 150 tests; family membership and per-test sample sizes in the supplement). Headline-pair estimates, jackknife p-values and confidence intervals are reported in the text and in Supplementary Note 2.
Figure 5.
| Morphology-physiology coupling matrices (Spearman rho, axon-bearing reconstructions). Left: mouse; right: human. Colour encodes rho (scale -1 to +1); asterisks mark donor-aware family-adjusted significance (q < 0.05, delete-one-donor jackknife with Benjamini-Hochberg correction within each species’ family of 150 tests; family membership and per-test sample sizes in the supplement). Headline-pair estimates, jackknife p-values and confidence intervals are reported in the text and in Supplementary Note 2.
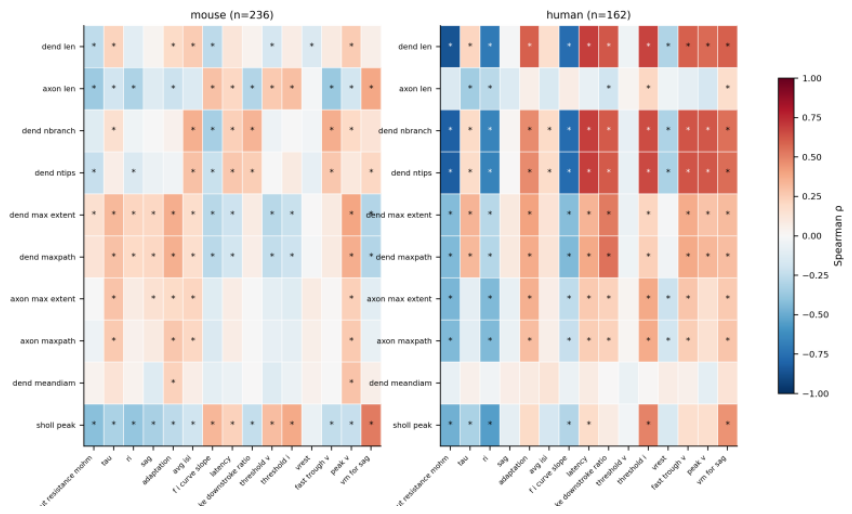
Figure 6.
| The headline coupling, cell-by-cell: total dendritic length versus input resistance. Mouse (blue) and human (red) axon-bearing reconstructions; lines are least-squares trends. The human slope is steep and tightly clustered; the mouse slope is shallow with wide scatter - the qualitative pattern that all subsequent controls quantify.
Figure 6.
| The headline coupling, cell-by-cell: total dendritic length versus input resistance. Mouse (blue) and human (red) axon-bearing reconstructions; lines are least-squares trends. The human slope is steep and tightly clustered; the mouse slope is shallow with wide scatter - the qualitative pattern that all subsequent controls quantify.
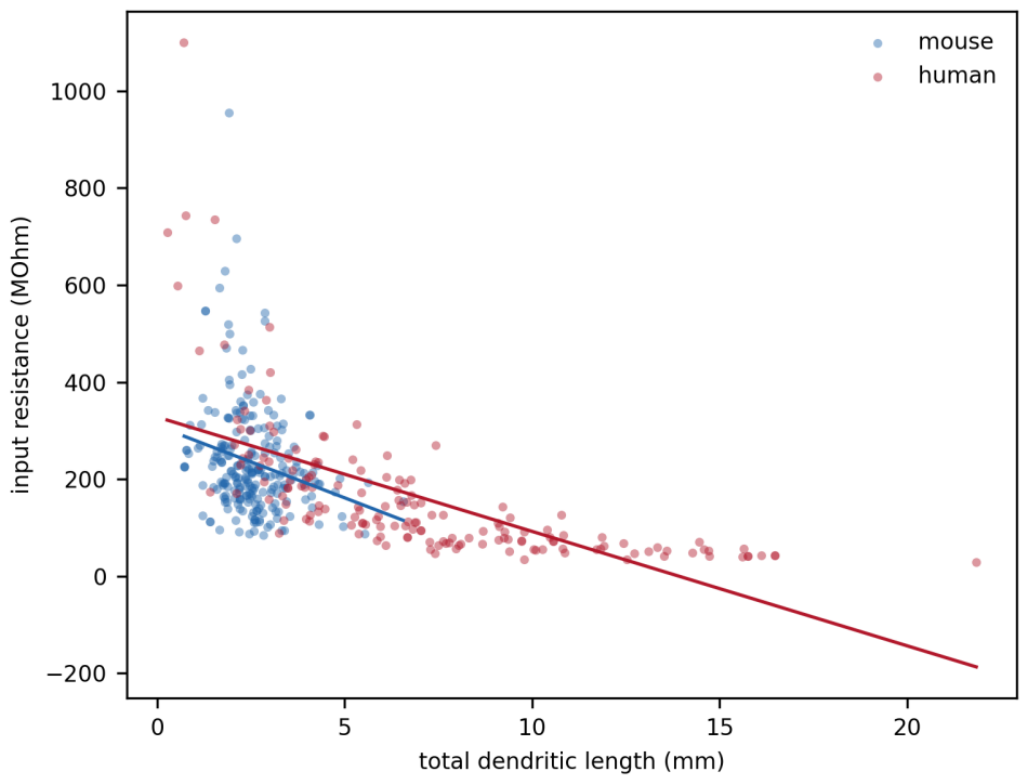

Table 1.
| Cohort composition of the database snapshot (accessed 2026-09-17).
| Group | n | Notes |
| Electrophysiology (released) | 2,336 rows | 56 feature fields; all specimen IDs unique |
| mouse / human (donor organism) | 1,923 / 413 | donor join |
| QC-passed (specified rules) | 2,335 | 1 mouse cell excluded |
| Reconstructions (released) | 701 rows | SWC tracings, all parsed |
| unique specimens | 668 | 33 specimens carry two tracings |
| axon-bearing (‘full’) rows / unique | 398 / 368 | primary samples drawn from these |
| Human donors (public metadata) | 42 | ages 18-83 (median 36); 23 M / 19 F |
| etiology: epilepsy / tumor | 34 / 8 | surgical resections; public records only |
| Primary coupling samples | mouse 236 / human 162 | 163 / 35 donors |
Primary coupling analyses use pairwise-complete features per test (listwise per pair); prediction analyses use fully complete cases (mouse n = 236, human n = 162 for the six primary outcomes; adaptation 208/116). Donor metadata assembled exclusively from public release records.
Table 2.
| Nested restriction ladder and direct restricted contrasts for the headline coupling (dendritic length vs input resistance).
Table 2.
| Nested restriction ladder and direct restricted contrasts for the headline coupling (dendritic length vs input resistance).
| Rung / contrast | Sample | n cells / donors | rho | Estimate (95% CI) |
| L0 | human, all | 162 / 35 | -0.87 | - |
| L1 | human, MTG only | 118 / 25 | -0.87 | +0.03 (-0.32 to +0.37) |
| L2 | human, MTG within common support | 49 / 18 | -0.67 | -0.51 (-0.89 to -0.10) |
| M0 | mouse, all | 236 / 163 | -0.25 | - |
| M1 | mouse, excitatory | 7 / 7 | -0.32 | wide CI (descriptive) |
| D1 | direct contrast: human MTG∩support vs mouse∩support | 49/18 vs 232/162 | -0.67 vs -0.24 | delta-z -0.57 (-0.93 to -0.27) |
| D2 | direct contrast: human all∩support vs mouse∩support | 65/25 vs 232/162 | -0.58 vs -0.24 | delta-z -0.42 (-0.70 to -0.10) |
| E | matched-sample contrast, donor-aware | 2,000 matched samples | - | -0.85 (-1.49 to -0.13) |
Ladder deltas are per-rung (non-additive) and answer Claim A only. Claims B and C rest on the restricted estimates (with donor-cluster bootstrap CIs) and on the direct donor-aware contrasts D1, D2 and E, which do not reuse the ladder transition. All direct-contrast intervals exclude zero.
Disclaimer/Publisher’s Note: The statements, opinions and data contained in all publications are solely those of the individual author(s) and contributor(s) and not of MDPI and/or the editor(s). MDPI and/or the editor(s) disclaim responsibility for any injury to people or property resulting from any ideas, methods, instructions or products referred to in the content. |
© 2026 by the authors. Licensee MDPI, Basel, Switzerland. This article is an open access article distributed under the terms and conditions of the Creative Commons Attribution (CC BY) license (http://creativecommons.org/licenses/by/4.0/).
Copyright: This open access article is published under a Creative Commons CC BY 4.0 license, which permit the free download, distribution, and reuse, provided that the author and preprint are cited in any reuse.