

Submitted:
02 October 2026
Posted:
07 October 2026
You are already at the latest version
Abstract
The present study focuses on the preparation and comprehensive characterization of HgSr₁.₆Y₀.₄Ca₂Cu₃O₈₊δ superconductors synthesized via the solid-state reaction method. The structural and surface characteristics of the prepared material were examined using X-ray diffraction (XRD), atomic force microscopy (AFM), and scanning electron microscopy (SEM). XRD analysis established the formation of a tetragonal crystal structure associated with the Hg-1223 phase, from which the lattice parameters, density, and superconducting phase volume fraction were determined. AFM and SEM investigations revealed a heterogeneous surface morphology characterized by dome-like and flake-like grains with different dimensions. The electrical resistivity was evaluated using the four-probe technique within the temperature range of 100–300 K, yielding Tc (onset) = 136 K and Tc (offset) = 121 K. Thermal conductivity measurements performed by Lee’s disc method between 300 and 560 K demonstrated a progressive increase with temperature. Additionally, the dielectric response was examined at room temperature over the frequency range of 50 Hz–1 MHz using an LCR meter. The real and imaginary dielectric constants, dielectric loss coefficient, and AC electrical conductivity were determined and exhibited distinct frequency-dependent behavior. These findings confirm the successful formation of the Hg-1223 phase and demonstrate its promising superconducting, thermal, and dielectric properties.
Keywords:
high-Tc superconductor
; Hg-1223 phase
; thermal conductivity
; electrical resistivity
; dielectric constant
1. Introduction
Mercury-based superconductors, represented by the general formula HgBa₂Caₙ₋₁CuₙO₂ₙ₊₂+δ (where n = 1–8, denoting the number of Cu–O layers), constitute one of the most prominent families of high-temperature superconductors. This series is notable for its remarkably high critical temperatures (Tc), with reported values of 94 K for Hg-1201 (n=1), 127 K for Hg-1212 (n=2), and 135 K for Hg-1223 (n=3) [1,2]. Under high-pressure synthesis, Tc can be further enhanced to 150–160 K. All phases in this series crystallize in a tetragonal structure composed of layered perovskite blocks.
Structurally, Hg-based superconductors resemble Tl- and Cu-based compounds, but with the Hg–O layer exhibiting reduced oxygen content. This difference strongly influences the structural stability and electronic properties. In particular, the Cu–O planes play a decisive role in mediating high-Tc superconductivity [3]. The oxygen atoms in Hg-based compounds are only weakly bonded to Hg, and their concentration is highly sensitive to synthesis conditions, often leading to instability of the high-valence Hg-1223 phase in ambient environments.
Several studies have demonstrated that cation substitution can stabilize the Hg-1223 phase and improve its superconducting performance [4]. For example, partial replacement of Hg with Pb, Re, or other dopants enhances phase formation, lattice stability, and the critical current density [5,6,7]. Among the physical properties of superconductors, electrical resistivity is particularly important, as it is the primary means of determining Tc [8,9,10].
The novelty of this study lies in the comprehensive characterization of the Y-substituted Hg-1223 superconductor, HgSr₁.₆Y₀.₄Ca₂Cu₃O₈₊δ, using structural, electrical, thermal, and dielectric analyses.The synthesized compound exhibited a high superconducting onset temperature of 136 K, while its thermal conductivity and frequency-dependent dielectric properties were systematically investigated.The integrated characterization provides valuable experimental insight into the multifunctional physical properties of Y-substituted Hg-1223 superconducting materials.
Despite the extensive investigation of Hg-based high-temperature superconductors, particularly the Hg-1223 phase, the stabilization of this phase and the systematic understanding of how cation substitution affects its structural, superconducting, thermal, and dielectric behavior remain important research issues. Previous studies have mainly emphasized the enhancement of phase stability and superconducting performance through substitutions such as Pb and Re, while comparatively limited attention has been given to Y substitution in the Hg-1223 system and, in particular, to its combined structural, microstructural, electrical, thermal, and frequency-dependent dielectric characteristics. The present work addresses this gap by investigating the Y-substituted compound HgSr₁.₆Y₀.₄Ca₂Cu₃O₈+δ synthesized through a solid-state reaction route and correlating its crystal structure and surface morphology with its superconducting and electrical responses. The novelty of the study lies in the integrated characterization of this specific Y-substituted Hg-1223 composition, including XRD, SEM, AFM, four-probe electrical resistivity, thermal conductivity, and frequency-dependent dielectric measurements, rather than focusing solely on its superconducting transition.
In this study, HgSr₁.₆Y₀.₄Ca₂Cu₃O₈+δ was synthesized via the solid-state reaction method. The structural, microstructural, and electrical properties of the samples were systematically investigated to evaluate the suitability of this system for superconducting applications. The synthesized material exhibited a tetragonal Hg-1223 phase with a calculated high-phase volume fraction of 79.43%, together with characteristic microstructural features, a superconducting onset temperature of 136 K and zero-resistance temperature of 121 K, and measurable temperature- and frequency-dependent thermal and dielectric responses. Thus, the main contribution of this work is to provide a combined experimental dataset linking the structural and surface characteristics of HgSr₁.₆Y₀.₄Ca₂Cu₃O₈+δ with its superconducting, thermal, and dielectric behavior, thereby providing additional experimental insight into the physical properties of Y-substituted Hg-1223 materials and establishing a basis for further optimization of composition and processing conditions.
2. Experimental Procedure
A sensitive balance was used to weigh pure powders in a solid state under the materials HgO, SrO, Y2O3, CaO and CuO, according to the corresponding General chemical: -
HgO + 1.6 SrO + 0.2 Y2O3 + +2CaO+ 3CuO → HgSr1.6Y0.4Ca2Cu3O8+δ
The synthesized compound had the nominal composition HgSr1.6Y0.4Ca2Cu3O8+δ. Each starting reagent was weighed separately, after which the powders were blended in an agate mortar for 30–50 minutes to achieve a uniform mixture. The prepared powder was then pressed into disc-shaped pellets, 15 mm in diameter and 2.5 mm thick, using a hydraulic press at 8 psi for 1 minute. The pellets were enclosed in a quartz glass capsule, which was evacuated to a pressure of 10-3 mbar. This sealed capsule was placed in a programmable electric (carbonite) furnace, heated at a rate of 5 °C/min to 860 °C, and held at that temperature for 26 hours. Once the heating stage was complete, the furnace was allowed to cool to room temperature, after which the capsule was opened and the sample collected.
Structural and surface characterizations of the prepared samples were performed using scanning electron microscopy (SEM), atomic force spectroscopy (AFS), and X-ray diffraction (XRD). The XRD measurements were carried out with a Shimadzu diffractometer using Cu Kα\alphaα radiation (λ=1.5405 Å) over a 2θ range of 10-80°, at an operating current of 30.0 mA, a voltage of 40.0 kV, and a scanning speed of 8°/min. The lattice constants a, b, and c were calculated using a computer program based on the FullProf Suite toolbar [11,12,13]. The volume fraction of the Hg-1223 high phase was estimated from the XRD peak intensities using the relation given in [14]:
where I0 is the identified phase's XD peak intensity, the peak intensities for all XRD are I1, I2, … In. The following equation [8] was used to compute the Mass densities (dm) of the ready samples:
In this expression, (Wm) denotes the molecular mass of the constituent material, measured in atomic mass units (amu). (NA) refers to Avogadro’s number, which corresponds to the number of particles contained in one gram-mole (g/mol). The symbol (V) indicates the volume occupied by one unit cell, with the volume measured in cubic centimeters (cm³).
The four-point probe method is one of the most common techniques for determining the critical temperature (Tc) of a superconductor over the temperature range of 77–300 K. In this arrangement, the sample is placed in a cryogenic chamber fitted with a rotary pump, enabling the chamber to reach an internal pressure of 10–3 mbar. A digital thermometer is positioned close to the sample for temperature monitoring. Copper wires, attached to the sample with silver paste, are used as current and voltage contacts (Figure 1). A constant direct current of 20 mA is applied from a D.C. power source, and the voltage drop is recorded using a nanovoltmeter with a sensitivity of about 1 µV.
The resistivity (ρ) can then be calculated using the following relation [13]:
where I and V are the variables that make up the sample's current, voltage drop between the electrodes, sample area (A(, and thickness (t).
The capacitance (C) of the HgSr1.6Y0.4Ca2Cu3O8+δ composite will be measured as a function of frequency using an LCR device within the frequency range of 50 Hz to 1 MHz, the dielectric characteristics of the material are determined through several parameters, including the real part of the dielectric permittivity (έ) , which describes the capacity of the material to accumulate and retain electrical energy, corresponding to its capacitive response [15], the dielectric loss coefficient (ε), which is the imaginary part of the permittivity, representing the energy lost as heat (resistive component) [16], the tangent of the loss angle (Tan δ), this coefficient measures the amount of electrical energy that is converted into heat within a material exposed to an alternating electric field, and the alternating electrical conductivity (σa.c ) using the following equations [17,18,19]:
έ = C d/Aε0
tan δ = ε"/ έ
σa.c = 2𝝅f ε0 ε"
Where: C: the capacitance, d: pellet thickness, A: the area of the sample, ε°: is the space permittivity and f: the frequency.
3. Results and Discussions
3.1. X-Ray Diffraction
X-ray diffraction (XRD) is a widely used analytical method for examining the crystal structure and determining the phases present within a material. In this study, XRD was used to investigate the structure of the synthesized HgSr1.6Y0.4Ca2Cu3O8+δ samples. The diffraction patterns obtained at room temperature are shown in Figure 2. Multiple sharp peaks are observed, indicating that the material is multiphase [14]. The profile clearly shows the coexistence of a high-grade Hg-1223 phase (H-phase) together with a lower-grade Hg-1212 phase (L-phase), along with additional minor phases present in other regions of the spectrum.
The crystal lattice parameters were determined computationally using software implemented within the FullProf Suite package, which were a = 3.8361 Å, b = 3.8359 Å, and c = 15.319 Å, confirming that the crystal structure is tetragonal [20,21,22]. The volume fraction Vph(1223) of Hg-1223 high phase was calculated using Equation (1), which was 79.43%. The mass density (dM) was calculated using Equation (2) and found to be 1.5.3 (g/cm3). Variations in the lattice parameters can be attributed to the removal of oxygen atoms from the copper–oxygen chains along the b-axis. As oxygen is removed, the strain energy that maintains chain alignment along the b-axis decrease[23,24]. Consequently, the difference between the a and b axes becomes progressively smaller until the structure fully adopts a tetragonal symmetry [25].
3.2. Scanning Electron Microscope (SEM)
Examining crystal structures with a scanning electron microscope (SEM) plays a crucial role in materials characterization. SEM enables a detailed analysis of a sample’s external surface, providing insight into the size, shape, and composition of individual crystals. Such information is fundamental in various disciplines, including materials science and geology [22,25,26,27]. In the context of superconductors, SEM investigation of structural properties is particularly important, as it reveals surface features that influence superconducting performance [28,29]. The high magnification capability of SEM allows for the observation of fine structural details, such as grain dimensions, pore distribution, and surface defects, that can significantly affect superconducting behavior.
In this study, the superconducting compound HgSr1.6Y0.4Ca2Cu3O8+δ was examined using SEM. Backscattered electron images of the sample, presented in Figure 3, reveal a largely homogeneous microstructure composed of stone-like grains with typical sizes in the micron range. Additionally, the micrographs indicate the coexistence of stone-like and sponge-like grains on the sample’s surface [30]. The prepared sample also exhibits a flake-like morphology with a hexagonal arrangement, accompanied by some agglomeration. This morphology is associated with enhanced crystallinity and alterations in surface structure. The observations are consistent with XRD results, which indicated a reduction in grain size and an increase in lattice potential [3,7,31].
3.3. Atomic Force Microscopy (AFM)
Atomic force microscopy (AFM) provides nanoscale characterization of material surfaces by mechanically scanning them with a fine-tipped probe to obtain detailed information about their surface morphology and properties.This method provides detailed information on surface topography, roughness, adhesion, elasticity, and other mechanical characteristics [32]. AFM is highly versatile and applicable to a wide range of materials, including biological specimens, metals, polymers, and ceramics. In this work, AFM was employed to investigate the surface morphology of the superconducting compound HgSr1.6Y0.4Ca2Cu3O8+δ. The analysis revealed notable variations in the geometric parameters of the sample’s surface. As illustrated in Figure 4, the results suggest that oxides of chemically reactive elements exert a distinct influence on the structural features of the material [32,33]. This can be attributed primarily to differences in their sizes. This difference is not limited to the surface of the sample but also partially penetrates its interior, altering the osmotic state, lattice size, and grain size. Using the more sensitive atomic energy microscopy method, the organization of stable nanostructures in the form of different-sized domes can be observed [32,34]. This is due to the bonds between the oxide surfaces, as the sample has a perovskite composition, and possibly due to non-covalent interactions caused by the additional d oxygen atoms. The obtained data represent a step towards understanding the structured activity about the active sites of the grains that have an affinity for molecular oxygen atoms (O2), which are widespread in the crystal structure of the sample [33].
3.4. Electrical Resistivity Measurements
The electrical resistivity of the sample was experimentally determined through a four-point probe measurement method, where the voltage and current across the sample were recorded for each temperature value. The electrical resistivity values were calculated using Equation (3). Figure 5 illustrates the variation of electrical resistivity as a function of temperature. The figure also shows the temperature dependence of the electrical resistivity for HgSr1.6Y0.4Ca2Cu3O8+δ, in the range of 100–300 K. The results show that the sample exhibits nonlinear electrical conductivity that decreases with decreasing temperature [35,36,37]. This behavior is characteristic of metallic systems, where the electrical resistivity decreases with decreasing temperature. Consistent with previous reports [38,39], the electrical resistivity gradually decreases until it reaches zero upon transition to superconductivity[40]. There is a gradual decrease in resistance values until they reach zero at a certain value called the critical temperature Tc(offset) [41,42]. The critical temperature for the onset of the resistance decrease (the point at which the superconducting state transitions from the vertical state), Tc (onset) was determined to be 136 K. The critical temperature for zero resistance Tc(offset) = 121 K) was calculated from the intersection of the resistance curve with the x-axis. The change in the transition width was (13).
3.5. Thermal Conductivity
The heat transfer values of the prepared compound were measured, and the thermal changes were clarified by taking a sample of the compound in the form of a disc and placing it in a thermal conductivity testing device, and heating was carried out at a rate of 5 degrees Celsius per minute using the (Lee’s Disk) technique
The results for the HgSr1.6Y0.4Ca2Cu3O8+δ compound include readings of thermal conductivity values and their relationship to temperatures taken within the temperature range of 300-560 K. Figure 6 presents the temperature-dependent behavior of the compound’s thermal conductivity, revealing a progressive rise in thermal conductivity as the temperature increases.
Based on the results obtained, we find that the thermal conductivity of the compound ranges between 13.1 x 10⁻³ W/cm² K at 303 K and 87.4 x 10⁻³ W/cm² K at 560 K. This increase can be attributed to an increase in the kinetic energy of the electrons, leading to the release of some electrons that contribute to thermal conductivity. Furthermore, the increased thermal energy supplied to the material leads to an increase in the vibrational energy of the atoms, resulting in an increased number of phonons that contribute to the increased thermal conductivity of the studied samples.
3.6. Dielectric Properties
Studying the dielectric properties of materials is a fundamental way to obtain information about their internal structure and associated defect states. Analyzing the behavior of the dielectric constant and dielectric loss helps to elucidate charge transport mechanisms in materials. The effect of frequency on the dielectric response allows for the identification of the nature and source of various losses, whether due to electronic states, interpolar polarization, or charge carrier transition mechanisms between energy levels [43]. Furthermore, investigating frequency-dependent electrical conductivity is essential for elucidating charge transport pathways in the studied alloys. These frequency measurements reveal the nature of charge carrier transitions between local states within the forbidden energy gap, helping to explain the prevailing electronic conductivity mechanisms in these systems[43]. In this context, many studies have focused on alternating electrical conductivity and dielectric properties to understand the mechanisms of conductivity and the types of polarization phenomena [23]. This knowledge contributes to the possibility of determining its physical and electrical properties, which allows for controlling its areas of use and developing its technological applications [19,44].
3.6.1. Dielectric Constant Test
Insulating molecules consist of positive and negative charges. Normally, the centers of positive and negative charges in these molecules are aligned. However, When subjected to an applied electric field, the molecular charges become displaced, with the positive charges shifting in the direction of the field and the negative charges moving against it.
As a result, the centers of positive and negative charges are no longer aligned but are separated by a small distance, forming an electric dipole. We then say that the molecules have become polarized and have acquired a dipole moment. The molecules of an insulating material exhibit this property and are called polar-nonpolar molecules. However, there are molecules in other insulating materials in which the center of negative charge is permanently separated from the center of positive charge. These polar molecules possess a permanent dipole moment, but the directions of these moments are random. If they are exposed to an external alternating electric field, this causes these dipoles to rotate in the direction of the field [45].
To complete the picture provided by the preceding information about electrically insulating materials, the values of the dielectric constant (ε′) of the molecule were calculated. This sample was prepared for this purpose by varying the frequency of the applied voltage, as shown in Figure 7. Increasing the frequency of the applied electric field leads to a decrease in the dielectric constant (ε). This behavior can be explained by the polarization of the dielectric molecules when they are subjected to an alternating electric field, causing the formation of induced dipole moments. At the same time, charge carriers may accumulate near the electrode surface, producing a screening effect. The presence of vacuum charge can also reduce the effective capacitance of the material, which subsequently influences the real component of the dielectric permittivity ε′ and results in a lower measured dielectric constant[46].
Polarity, whether polar or nonpolar, significantly influences the dielectric properties of a superconductor. It has been observed that the values of ε' for a sample are high at low frequencies and then decrease markedly as the frequency increases as shown in Table 1. The pronounced values of the real dielectric permittivity (ε') observed at lower frequencies are primarily associated with interfacial polarization. This phenomenon arises from the localization of charge carriers at internal boundaries within the material. In heterogeneous systems, differences in electrical conductivity between neighboring regions promote charge accumulation at their interfaces, thereby enhancing the polarization response. A similar effect occurs at the contact regions between the specimens and the electrodes, where charges can accumulate and produce electrode polarization, contributing to the measured dielectric behavior
The presence of accumulated space charges introduces an extra capacitive contribution to the electrical response of the material [47]. In contrast, the real part of the dielectric permittivity ε' decreases as the frequency of the applied electric field becomes higher. At frequencies above approximately 50 kHz, the reduction in ε' can be associated with the limited ability of dipoles to reorient rapidly enough in response to the alternating field. As the frequency increases, the bonded molecular groups progressively fail to respond synchronously with the field, resulting in a reduced polarization contribution and, consequently, a lower dielectric constant [34,38].
The dielectric response of a material is governed not only by its composition but also by the characteristics of the electrodes used for measurement. In particular, the imaginary component (ε'') of the complex relative permittivity (ε*) is influenced mainly by two factors. One is the electrical resistance associated with the electrode, which can be minimized by employing a highly conductive electrode material. The other is the intrinsic electrical behavior of the sample. Both the electrode contribution and the material response vary with the applied frequency, thereby affecting the measured dielectric properties.
Figure 8 illustrates the variation of ε″ as a function of frequency. The ε″ values decrease with increasing frequency.
As shown in Figure 9, this behavior is attributed to a slower polarization mechanism. However, slight fluctuations in the loss tangent (tan δ) values are observed at frequencies above 1 MHz.
This may be a result of increased relaxation loss of the dielectric material when a high frequency is applied. In addition, at higher frequencies, ionic polarization can occur, which encourages charge carriers to cross the composite surface immediately.
This study discusses the theoretical and experimental aspects of superconductor properties in the microwave, ultrasonic, and infrared ranges. Electrodynamics can provide information about superconductors, as well as about quasiparticles. The goal is to understand the complex frequency dependence of conductivity and its variation with temperature.
The conductivity of a superconductor depends on frequency at room temperature. The real part shown in Figure 10 exhibits a sharp drop at 100,000 Hz, then gradually increases until it reaches its highest value at 500,000 Hz, after which it begins to decrease as the frequency increases and disappears at 1,000,000 Hz.
A change in the alternating conductivity of superconductors occurs as the applied frequency increases. This is due to the conduction mechanism shifting from a static state with no resistance to a reactive state where losses increase with frequency. While superconductors exhibit zero DC resistance, the situation changes at high frequencies (such as microwaves or radio frequencies) due to several key factors:
1. Cooper Pair Breaking
At very low frequencies, Cooper pairs remain dominant. However, as the frequency increases, the energy of the applied photons increases. When the photon energy becomes sufficient, it breaks the Cooper pairs, transforming them into ordinary electrons ("quasiparticles"). These ordinary electrons introduce resistance, altering the conductivity and resulting in energy loss.
2. Frequency-induced losses (AC losses): Alternating current conductivity is a complex quantity, where the imaginary part represents the inductive impedance of Cooper pairs, while the real part represents losses. As the frequency increases, the real part increases, resulting in an increase in normal conductivity. With increasing frequency, eddy currents increase, generating an electric current and causing energy dissipation. This phenomenon increases with increasing frequency. These factors combined lead to this fluctuation in the values of alternating current conductivity.
4. Conclusions
In this study, the high-Tc superconducting compound HgSr₁.₆Y₀.₄Ca₂Cu₃O₈+δ was successfully synthesized using the solid-state reaction method. The investigation focused on the relationship between the superconducting performance and the microscopic characteristics of the material.
X-ray diffraction (XRD) analysis confirmed that the sample exhibited a polycrystalline structure corresponding to the Hg-1223 phase. Scanning electron microscopy (SEM) and atomic force microscopy (AFM) revealed the presence of nanoparticles and indicated that variations in oxygen content (δ) influence the surface morphology and oxide phases.
Electrical resistivity measurements showed an onset critical temperature Tc(onset) of 136 K and a zero-resistance critical temperature, Tc(offset) , of 121 K. These results confirm the superconducting behavior of the synthesized Hg-1223 compound.
Lee’s disk method was used to measure the thermal conductivity and investigate its temperature dependence over the range of 300–560 K. The results indicated that thermal conductivity increased with increasing temperature.
The dielectric properties of the compound were investigated as a function of frequency over the range of 50 Hz–1 MHz using an LCR meter. The measured dielectric properties included AC electrical conductivity, dielectric loss coefficient, and the real and imaginary parts of the dielectric constant. The results demonstrated that these dielectric properties exhibited a clear frequency dependence.
Author Contributions
Hawbash H. Karim and Kareem A. Jasim: Conceptualization, experiment, data measurement and analysis, writing. Nawal Hassan Khudhair and Kassim Mahdi Wadi: writing, discuss, Visualization, review & editing. Chanar Abiden Zaynel and Fahmi F Muhammadsharif : writing, discuss & review.
Funding
The authors declare that this research was conducted independently and without any commercial, financial, or external funding support that could have influenced the study.
Data Availability Statement
The datasets generated and analyzed in this study can be obtained from the corresponding author upon reasonable request.
Acknowledgments
The authors would like to thank the Department of Physics, University of Baghdad, College of Education for Pure Science, Ibn Al-Haitham, for their support and cooperation and the department of physics at Koya University for their support and cooperation.
Conflicts of Interest
The authors declare that they have no known competing financial interests or personal relationships that could have appeared to influence the work reported in this paper.
References
- Schilling, A.; Cantoni, M.; Guo, J.D.; Ott, H.R. Superconductivity above 130 K in the Hg–Ba–Ca–Cu–O system. Nature 1993, 363, 56–58. [Google Scholar] [CrossRef]
- Zhou, S.-M. Photoluminescence of Hg-doped CdS nanowires. Physica Status Solidi (a) 2006, 203, R45–R47. [Google Scholar] [CrossRef]
- Hamadneh, I.; Kuan, Y.W.; Hui, L.T.; Abd-Shukor, R. Formation of Tl0.85Cr0.15Sr2CaCu2O7−δ superconductor from ultrafine co-precipitated powders. Mater. Lett. 2006, 60, 734–736. [Google Scholar] [CrossRef]
- Ismail, M.; Abd-Shukor, R.; Hamadneh, I.; Halim, S.A. Transport current density of Ag-sheathed superconductor tapes using Bi-Sr-Ca-Cu-O powders prepared by the co-precipitation method. J. Mater. Sci. 2004, 39, 3517–3519. [Google Scholar] [CrossRef]
- Jahil, S.S.; Khazaal, A.R.; Mahdi, S.H.; Jasim, K.A. Superconductor enhancements by laser irradiations. AIP Conf. Proc. 2019, 2190, 020048. [Google Scholar] [CrossRef]
- Wadi, K.M.; Chillab, R.K.; Abdulateef, A.N.; Jasim, K.A.; Shaban, A.H.; Hassan, M.A.; Jahil, S.S. The effect of potassium substitution on the properties of HgBa2Ca2Cu3O8+δCompound. J. Phys. Conf. Ser. 2021, 1879, 032064. [Google Scholar] [CrossRef]
- Kareiva, A.; Barkauskas, J.; Mathur, S. Oxygen content and superconducting properties of Hg-based superconductors synthesized by sol–gel method. J. Phys. Chem. Solids 2000, 61, 789–797. [Google Scholar] [CrossRef]
- Kresin, V.Z.; Wolf, S.A. Superconducting Films. In Fundamentals of Superconductivity; Kresin, V.Z., Wolf, S.A., Eds.; Springer US: Boston, MA, 1990; pp. 93–108. [Google Scholar]
- Jasim, K.A.; Alwan, T.J. Effect of Oxygen Treatment on the Structural and Electrical Properties of Tl0.85Cd0.15Sr2CuO5−δ, Tl0.85Cd0.15Sr2Ca2Cu2O7−δand Tl0.85Cd0.15Sr3Ca2Cu3O9−δSuperconductors. J. Supercond. Nov. Magn. 2017, 30, 3451–3457. [Google Scholar] [CrossRef]
- Jasim, K.A.; Wadi, K.M.; Karim, H.H.; Qader, I.N. Impact of partial sulfur substitution with gallium on the structural and electrical properties of Ge₃₅S65-xGax semiconductor alloys. J. Mater. Sci. Mater. Electron. 2025, 36, 639. [Google Scholar] [CrossRef]
- Passos, C.A.C.; Orlando, M.T.D.; Oliveira, F.D.C.; Cruz, P.C.M.d.; J. L. Passamai, J.; Orlando, C.G.P.; Elói, N.A.; Correa, H.P.S.; Martinez, L.G. Effects of oxygen content on the properties of the Hg0.82Re0.18Ba2Ca2Cu3O8+d superconductor. Supercond. Sci. Technol. 2002, 15, 1177. [Google Scholar] [CrossRef]
- Passos, C.A.C.; Passamai, J.L.; Orlando, M.T.D.; Correa, H.P.S.; de Medeiros, E.F.; Martinez, L.G.; Rossi, J.L.; Garcia, F.; Tamura, E.; Ferreira, F.F.; et al. Phase segregation of (Hg,Re)-1223 superconductor. Physica C Supercond. 2007, 460-462, 1182–1183. [Google Scholar] [CrossRef]
- Passos, C.A.C.; Orlando, M.T.D.; Passamai, J.L., Jr.; Medeiros, E.F.; Oliveira, F.D.C.; Fardin, J.F.; Simonetti, D.S.L. Superconducting fault current limiter device based on (Hg,Re)-1223 superconductor. Appl. Phys. Lett. 2006, 89, 242503. [Google Scholar] [CrossRef]
- Jasim, K.A.; Makki, S.A.; Almohsin, A.a. Comparison Study of Transition Temperature between the Superconducting Compounds Tl0.9 Pb0.1 Ba2Ca2Cu3O9-δ, Tl0.9Sb0.1Ba2Ca2Cu3O9-δ and Tl0.9Cr0.1Ba2Ca2Cu3O9-δ. Phys. Procedia 2014, 55, 336–341. [Google Scholar] [CrossRef]
- Kumar, A.; Saraswat, V.; Dahshan, A.; Elsaeedy, H.; Mehta, N. Exploring dielectric and AC conduction characteristics in elemental selenium glass modified with silver halides. RSC Adv. 2024, 14, 20933–20950. [Google Scholar] [CrossRef]
- Shukla, N.; Dwivedi, D. Dielectric relaxation and AC conductivity studies of Se90Cd10− x In x glassy alloys. J. Asian Ceram. Soc. 2016, 4, 178–184. [Google Scholar] [CrossRef]
- Afify, I.H.; Farag, E.-S.M.; Abo-Ghazala, M.; El-Zaidia, M. AC conductivity and dielectric properties of In x Te20− x Se80 chalcogenides: IH Afify et al. Indian J. Phys. 2024, 98, 967–973. [Google Scholar]
- Muthana Ghazi, M.; Ali Jasim, K. A study of the Electrical and Dialectical proprieties of S60-Se40-X-PbX Chalcogenide Compound. In Proceedings of the Journal of Physics: Conference Series, 2024; p. 012027. [Google Scholar]
- Mahdi, Z.A.A.-H.; Jasim, K.A. Effect partial replacement of germanium by cadmium on dielectrically properties of Ge35-S65-X-CdX chalcogenide compound. In Proceedings of the AIP Conference Proceedings, 2023; p. 020025. [Google Scholar]
- Wesche, R. Physical Properties of High-Tc Superconductors. In High-Temperature Superconductors: Materials, Properties, and Applications; Wesche, R., Ed.; Springer US: Boston, MA, 1998; pp. 133–222. [Google Scholar]
- Omar, B.A.; Fathi, S.J.; Jassim, K.A. Effect of Zn on the structural and electrical properties of high temperature HgBa2Ca2Cu3O8+δ superconductor. AIP Conf. Proc. 2018, 1968, 030047. [Google Scholar] [CrossRef]
- Tranquada, J.M.; Heald, S.M.; Moodenbaugh, A.R.; Xu, Y. Mixed valency, hole concentration, and Tc in YBa2Cu3O6+x. Phys. Rev. B 1988, 38, 8893–8899. [Google Scholar] [CrossRef]
- Wadi, K.M.; Jasim, K.A.; Shaban, A.H.; Kamil, M.K.; Nsaif, F.K. The effects of sustainable manufacturing pressure on the structural properties of the pb2ba2ca2cu3o9+ σ compound. J. Green Eng. 2020, 10, 6052–6062. [Google Scholar]
- Karim, H.H.; Jasim, K.A.; Alwan, T.B.; Qader, I.N.; Baker, A.G. Impact of thermal neutron radiation doses on the density of states in the Ge12Te80Sn8 alloy. Physica B Condens. Matter 2026, 725, 418162. [Google Scholar] [CrossRef]
- Biju, A.; Syamaprasad, U.; Rao, A.; Xu, J.G.; Sivakumar, K.M.; Kuo, Y.K. Structural and transport properties of Nd doped (Bi,Pb)-2212. Physica C Supercond. 2007, 466, 69–75. [Google Scholar] [CrossRef]
- Wadi, K.; Jasim, K.; Shaban, A.; Kamil, M.; Nsaif, F. The Effects of Sustainable Manufacturing Pressure on the Structural Properties of the Pb2Ba2Ca2Cu3O9+σ Compound. J. Green Eng. 2020, 10, 6052–6062. [Google Scholar]
- Watan, A.W.; Aleabi, S.H.; Risan, R.H.; Jasim, K.A.; Shaban, A.H. Preparation and Physical Properties of Doped CdBa2-x SrxCa2Cu3O8+δ Compound. Energy Procedia 2017, 119, 466–472. [Google Scholar] [CrossRef]
- Aljurani, B.A.; Hermiz, G.Y.; Alias, M.F. Superconductivity Measurements of (Hg,Tl)-1223 Compound Prepared in Capsule. Iraqi J. Sci. 2021, 62, 2934–2939. [Google Scholar] [CrossRef]
- Jasim, K.A.; Alwan, T.J.; Mahdi, K.H.; Mansour, H.L. The effect of neutron irradiation on the properties of Tl 0.6Pb0.3Cd0.1Ba2Ca2 Cu3 O9−δ superconductors. Turk. J. Phys. 2013, 37, 237–241. [Google Scholar] [CrossRef]
- Jasim, K.A.; ALwan, T.J.; Mahdi, K.H.; Mansour, H.L. The effect of neutron irradiation on the properties of Tl_ {0.6} Pb_ {0.3} Cd_ {0.1} Ba_2Ca_2Cu_ {3} O_ {9-delta} superconductors. Turk. J. Phys. 2013, 37, 237–241. [Google Scholar]
- Abad, M.M.; Haider, H.M.J. Study the effect of partial substitution of silver on the structural and electrical properties of HgBa2Ca2Cu2.8Cd0.2O8+δ superconducting compound. AIP Conf. Proc. 2023, 2830, 070030. [Google Scholar] [CrossRef]
- Baqi, A.S.; Khalid, A.d.M.; Abdullah, S.A. The Partial Substitution of Calcium with Zinc Oxide, and its Effect on the Structural, Electrical and Morphologic Properties of the Superconducting Compound, Hg0.9Ag0.1Ba2Ca2-x ZnxCu3O(8+δ). NeuroQuantology 2022, 20. [Google Scholar] [CrossRef]
- Kadhim, B.B.; Khaleel, I.H.; Hussein, B.H.; Jasim, K.A.; Shaban, A.H.; Al-Maiyaly, B.K.H.; Mahdi, S.H. Effect of gamma irradiation on the TlBa2Ca2Cu3O9-δ superconducting properties. AIP Conf. Proc. 2018, 1968, 030054. [Google Scholar] [CrossRef]
- Al-Khafaji, R.S.A.; Jasim, K.A. Dependence the microstructure specifications of earth metal lanthanum La substituted Bi 2 Ba 2 CaCu 2-X La X O 8+ δ on cation vacancies. AIMS Mater. Sci. 2021, 8. [Google Scholar]
- Mohammed, L.A.; Jasim, K.A. Improvement the Superconducting properties of TlBa2 Ca2 Cu3xNix O 9-δ superconducting compound by partial substitution of copper with nickel oxide on the. Energy Procedia 2019, 157, 135–142. [Google Scholar] [CrossRef]
- JASIM, K. Structure and electrical properties of lanthanum doped Bi_2Sr_2Ca_ {2-x} La_xCu_3O_ {10+\delta} superconductor. Turk. J. Phys. 2012, 36, 245–251. [Google Scholar]
- Abdulmajeed, M.A.; Fadil, R.A.A.-Z.; Mohammed, M.H.; Faraj, M.G.; Jasim, K.A. Effect of tellurium content on the structural and dielectric properties of Se100-xTex alloys. Can. Metall. Q. 2026, 1–11. [Google Scholar] [CrossRef]
- Kadhim, B.B.; Khaleel, I.H.; Hussein, B.H.; Jasim, K.A.; Shaban, A.H.; AL-Maiyaly, B.K.; Mahdi, S.H. Effect of gamma irradiation on the TlBa2Ca2Cu3O9-δ superconducting properties. In Proceedings of the AIP Conference Proceedings, 2018; p. 030054. [Google Scholar]
- Jasim, K.A.; Wadi, K.M.; Karim, H.H.; Qader, I.N. Impact of partial sulfur substitution with gallium on the structural and electrical properties of Ge₃₅S65-x Ga x semiconductor alloys. J. Mater. Sci. Mater. Electron. 2025, 36, 639. [Google Scholar] [CrossRef]
- Ahmed, M.M.; Mohammed, N.S.; Khaleel, I.H.; Jasim, K.A.; Faraj, M.G. Investigation of Te50Se50-xSnx alloys’ structural and electrical characteristics. Can. Metall. Q. 2026, 1–7. [Google Scholar] [CrossRef]
- Rusakov, V.A.; Volkov, M.P. Effect of Partial Substitution of Iron for Group IV Elements on the Structure and Superconducting Properties of the Fe (Se 0. 2 Te 0. 8) 0. 82 Compound. Tech. Phys. 2023, 68, 758–765. [Google Scholar]
- Sun, Y.; Zhu, L.; Song, X.; Yu, D.; Liu, Y. Superconducting Properties and Microstructure of Nanocrystalline MgB2 Bulk Prepared by Sintering of Ball-Milled Powders. J. Supercond. Nov. Magn. 2012, 25, 1735–1741. [Google Scholar] [CrossRef]
- Abad, M.M.; Haider, H.M. Study the effect of partial substitution of silver on the structural and electrical properties of HgBa2Ca2Cu2. 8Cd0. 2O8+ δ superconducting compound. In Proceedings of the 4TH INTERNATIONAL SCIENTIFIC CONFERENCE OF ENGINEERING SCIENCES AND ADVANCES TECHNOLOGIES, 2023; p. 070030. [Google Scholar]
- Jasim, K.A.; Makki, S.A.; abud Almohsin, A. Comparison study of transition temperature between the superconducting compounds Tl0. 9 Pb0. 1 ba2ca2cu3o9-δ, tl0. 9sb0. 1ba2ca2cu3o9-δ and tl0. 9cr0. 1ba2ca2cu3o9-Δ. Phys. Procedia 2014, 55, 336–341. [Google Scholar]
- Sathyamoorthy, R.; Narayandass, S.; Balasubramanian, C.; Mangalaraj, D. Structure, dielectric, and AC conduction studies on yttrium fluoride thin films. Physica Status Solidi (a) 1990, 117, 495–500. [Google Scholar] [CrossRef]
- AVVARD, I.S. outstanding contributions in the field of radiation protec-tion. The award will be presented at 11" International Con. Health Physics; 2003; p. 85. [Google Scholar]
- Goodman, I. Encyclopedia of Polymer Science and Technology; Interscience Publishers, 1969; p. 11. [Google Scholar]
Figure 1.
Schematic Diagram of the Resistivity (ρ) Measurement Circuit.
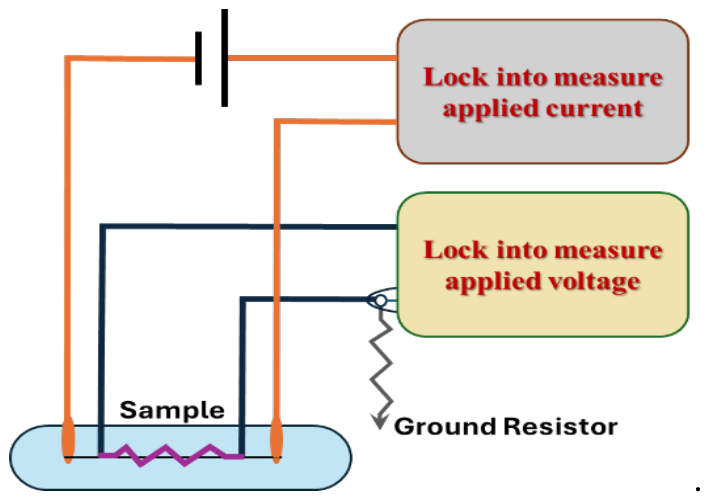
Figure 2.
X-ray Diffraction Pattern of the HgSr₁.₆Y₀.₄Ca₂Cu₃O₈+δ Superconductor.
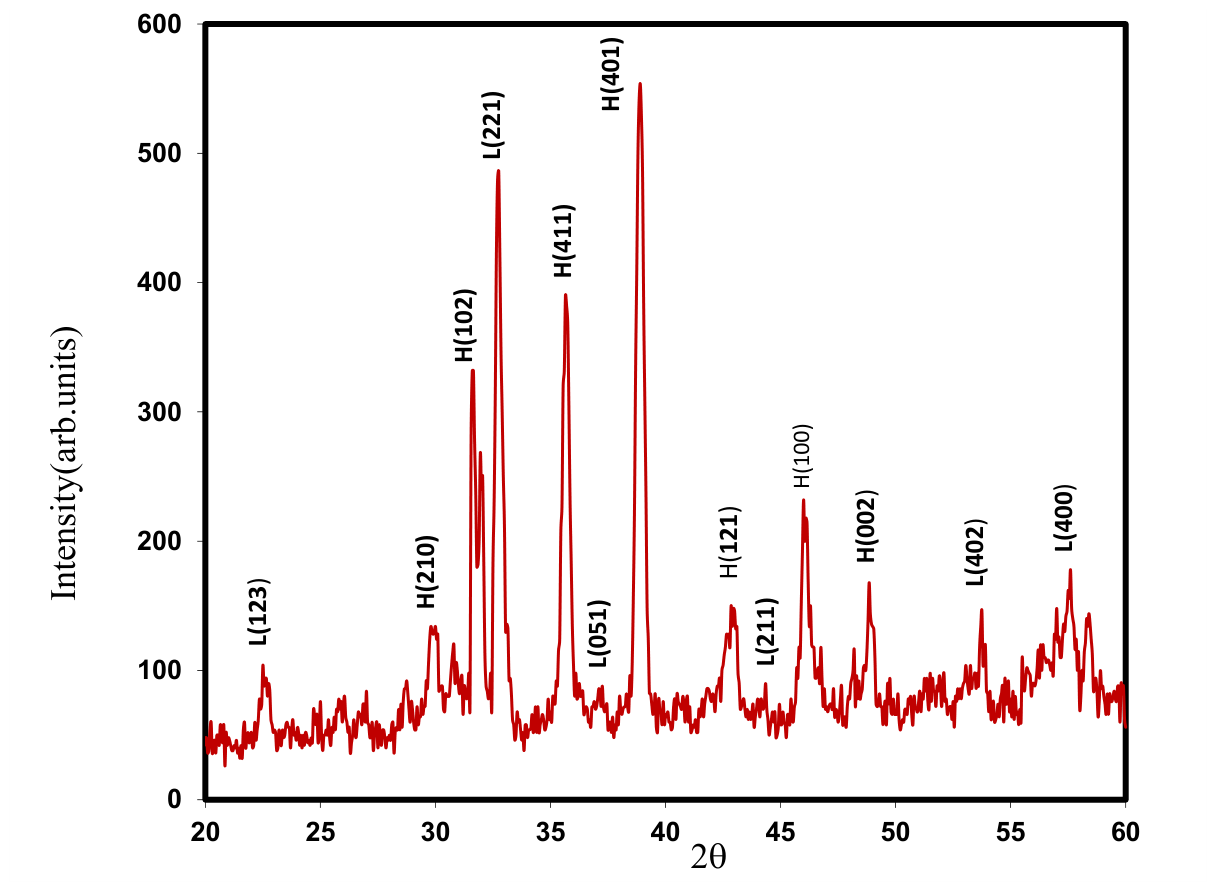
Figure 3.
SEM for HgSr1.6Y0.4Ca2Cu3O8+δ.
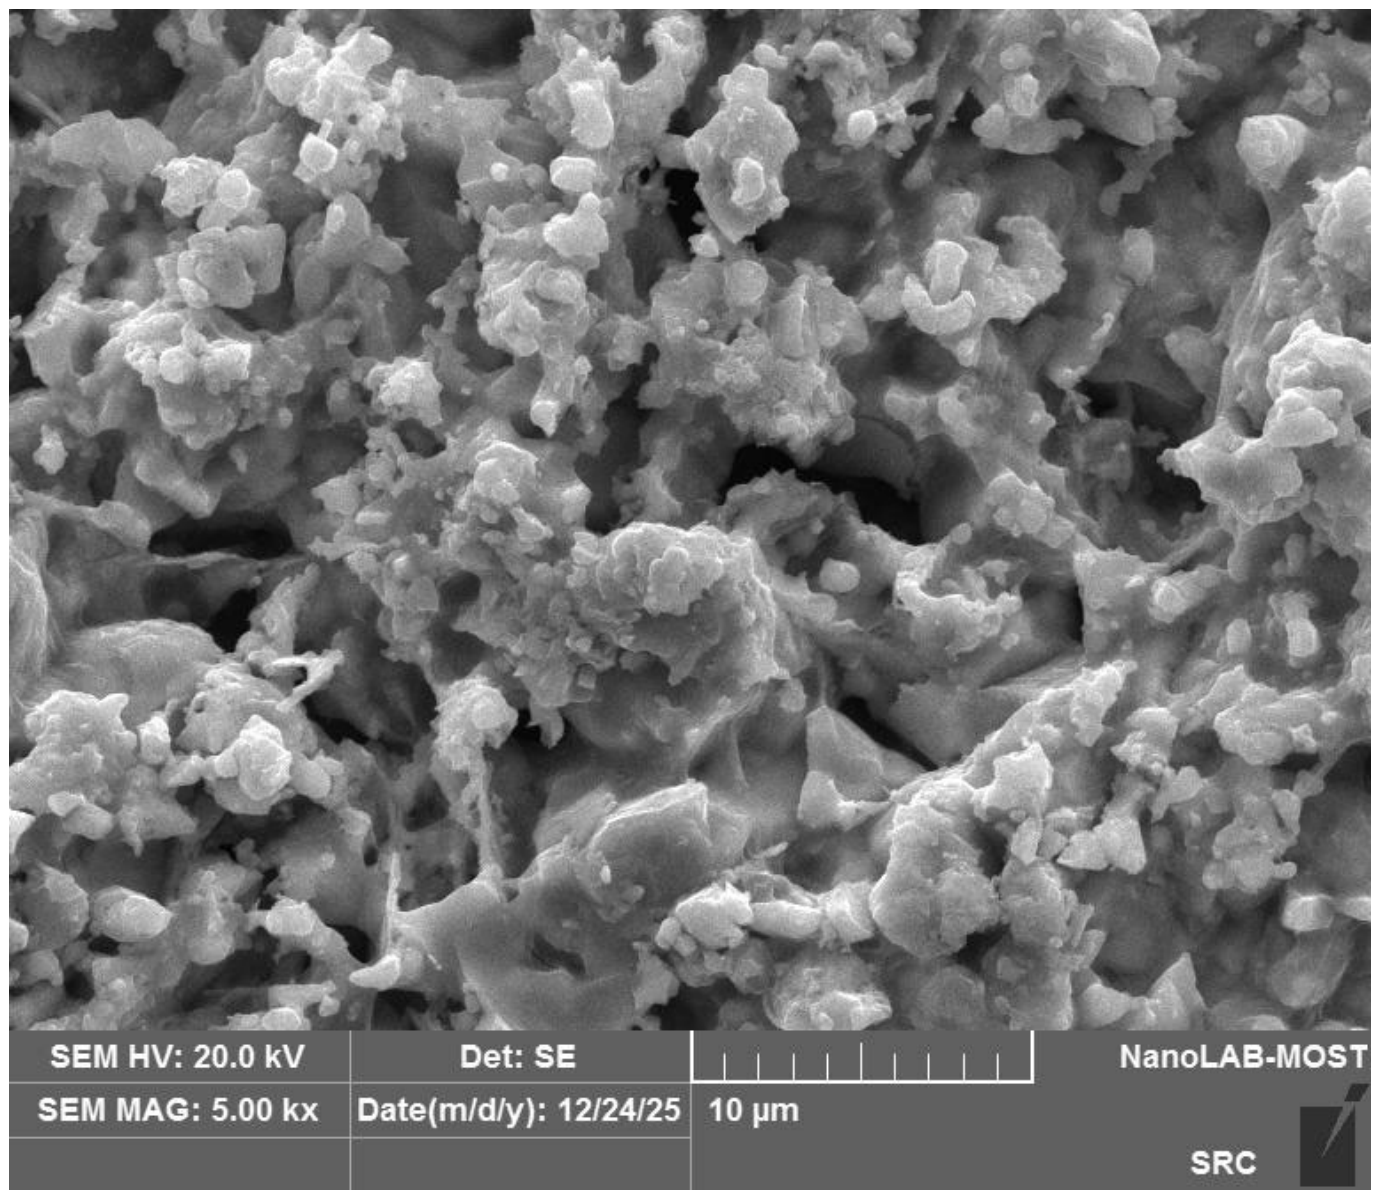
Figure 4.
Atomic force microscopy (AFM) for the HgSr1.6Y0.4Ca2Cu3O8+δ system's.
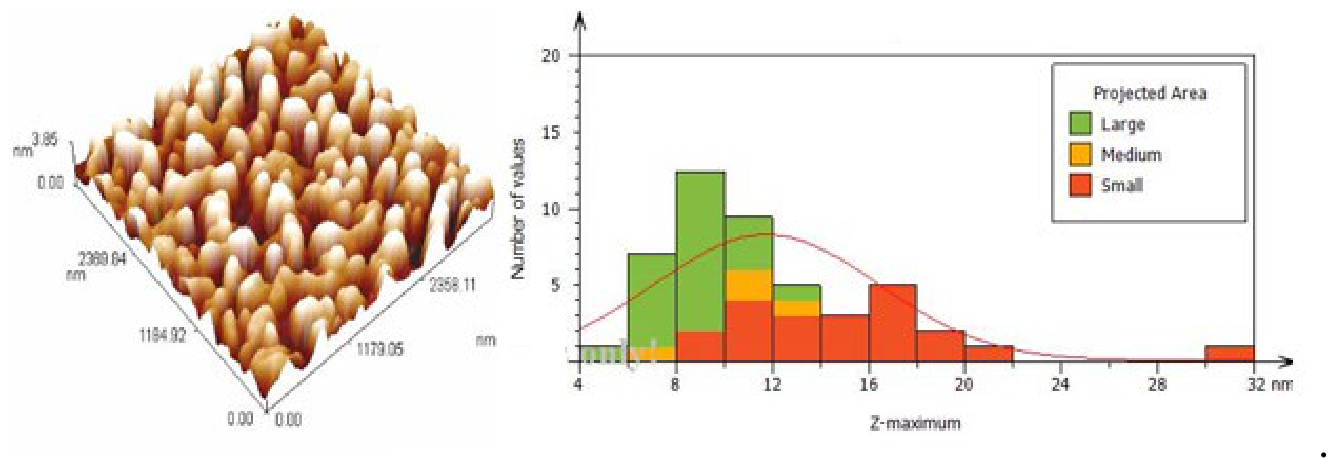
Figure 5.
Temperature Dependence of the Resistivity of HgSr1.6Y0.4Ca2Cu3O8+δ.
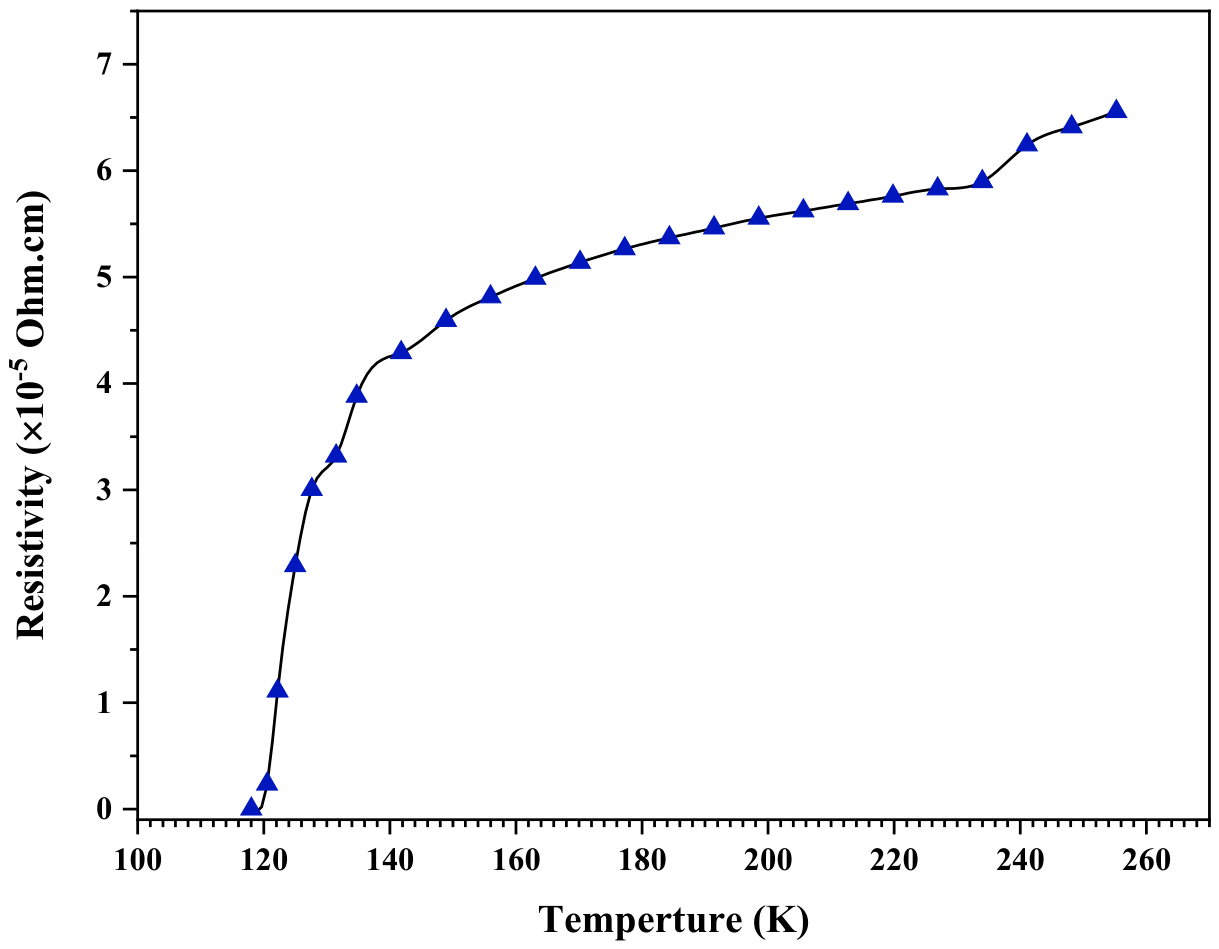
Figure 6.
Thermal conductivity dependence of the Temperature for HgSr1.6Y0.4Ca2Cu3O8+δ sample.
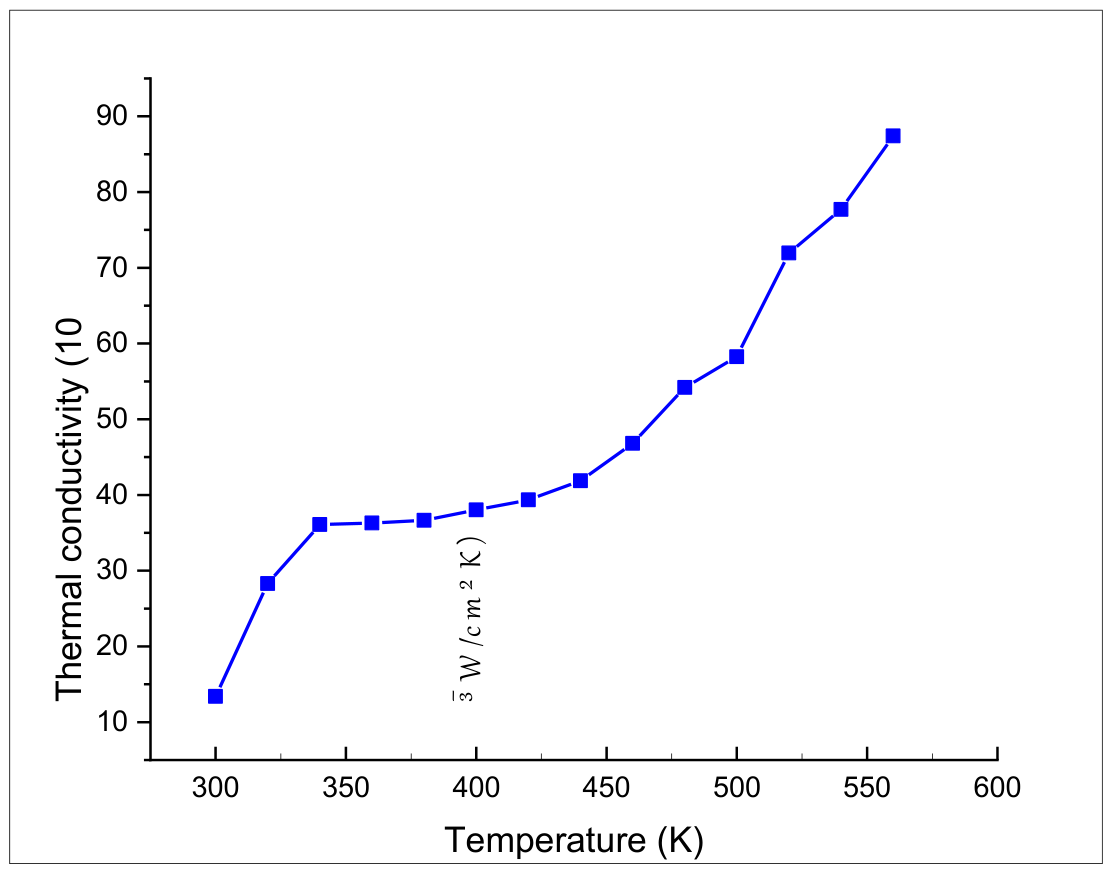
Figure 7.
Real dielectric constant (ε′) dependence of the frequency for HgSr1.6Y0.4Ca2Cu3O8+δ sample.
Figure 7.
Real dielectric constant (ε′) dependence of the frequency for HgSr1.6Y0.4Ca2Cu3O8+δ sample.
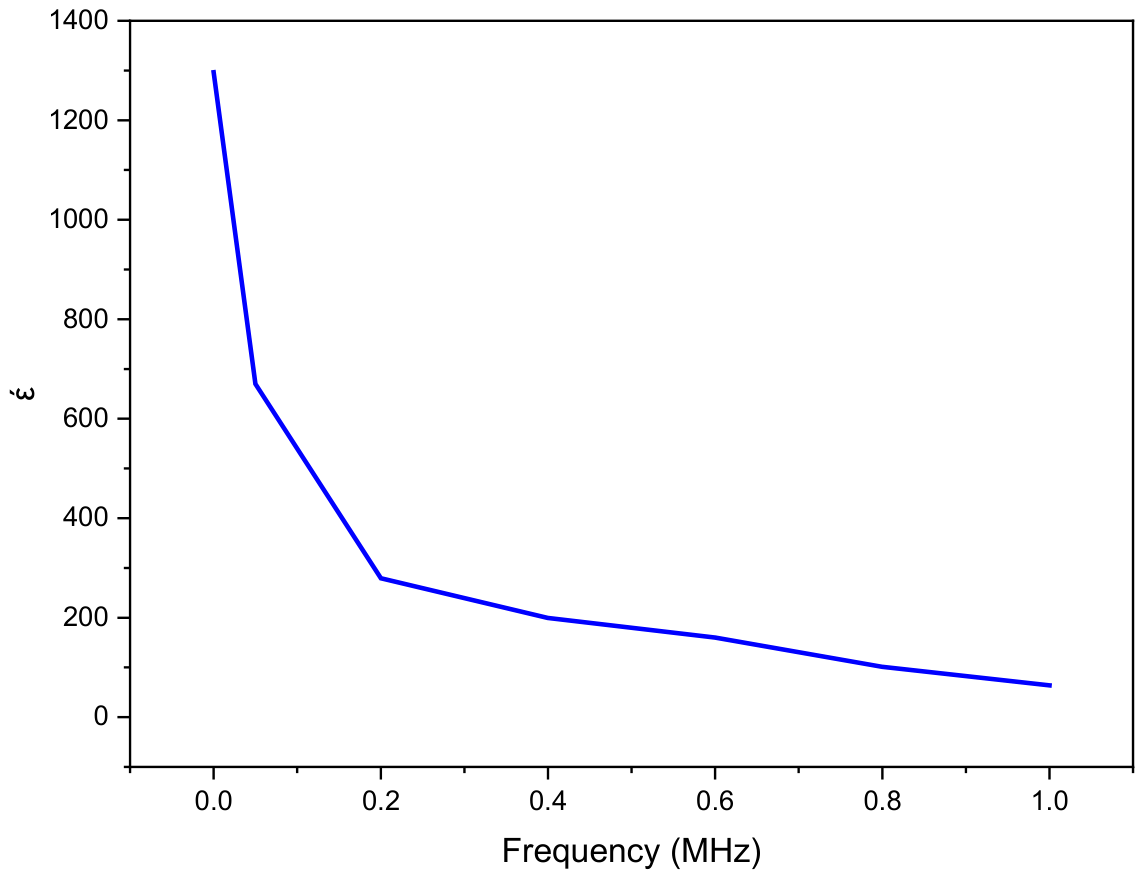
Figure 8.
Imaginary Dielectric Constant (ε″) dependence of the frequency for HgSr1.6Y0.4Ca2Cu3O8+δ sample.
Figure 8.
Imaginary Dielectric Constant (ε″) dependence of the frequency for HgSr1.6Y0.4Ca2Cu3O8+δ sample.
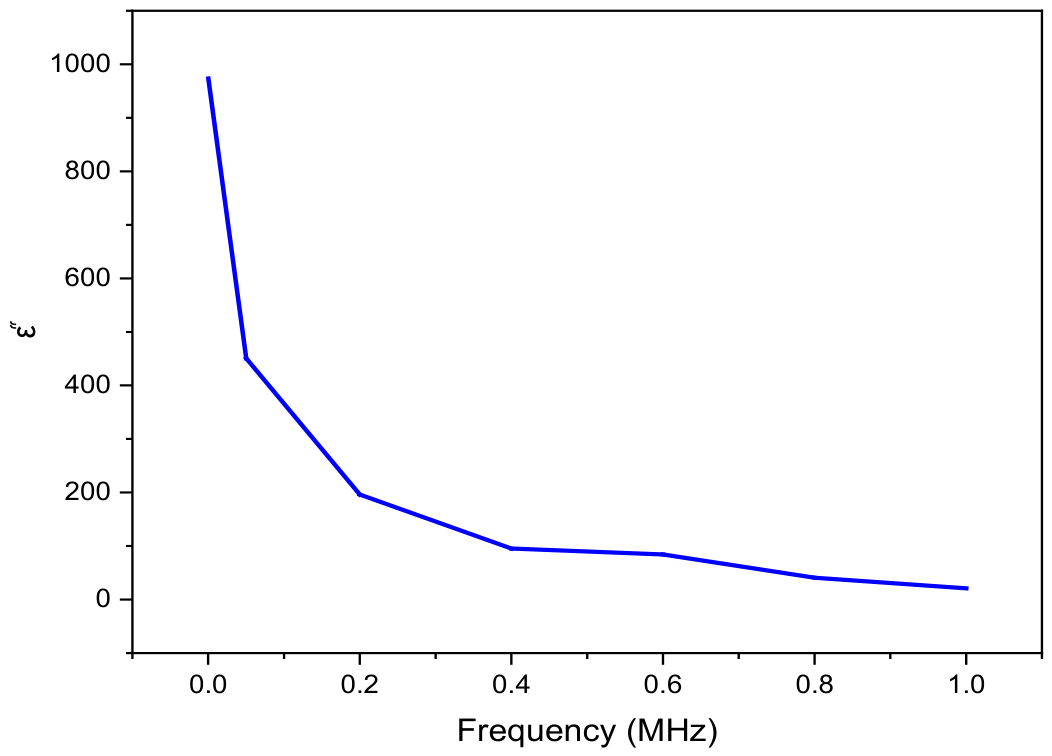
Figure 9.
Loss Tangent (tan δ) dependence of the frequency for HgSr1.6Y0.4Ca2Cu3O8+δ sample.
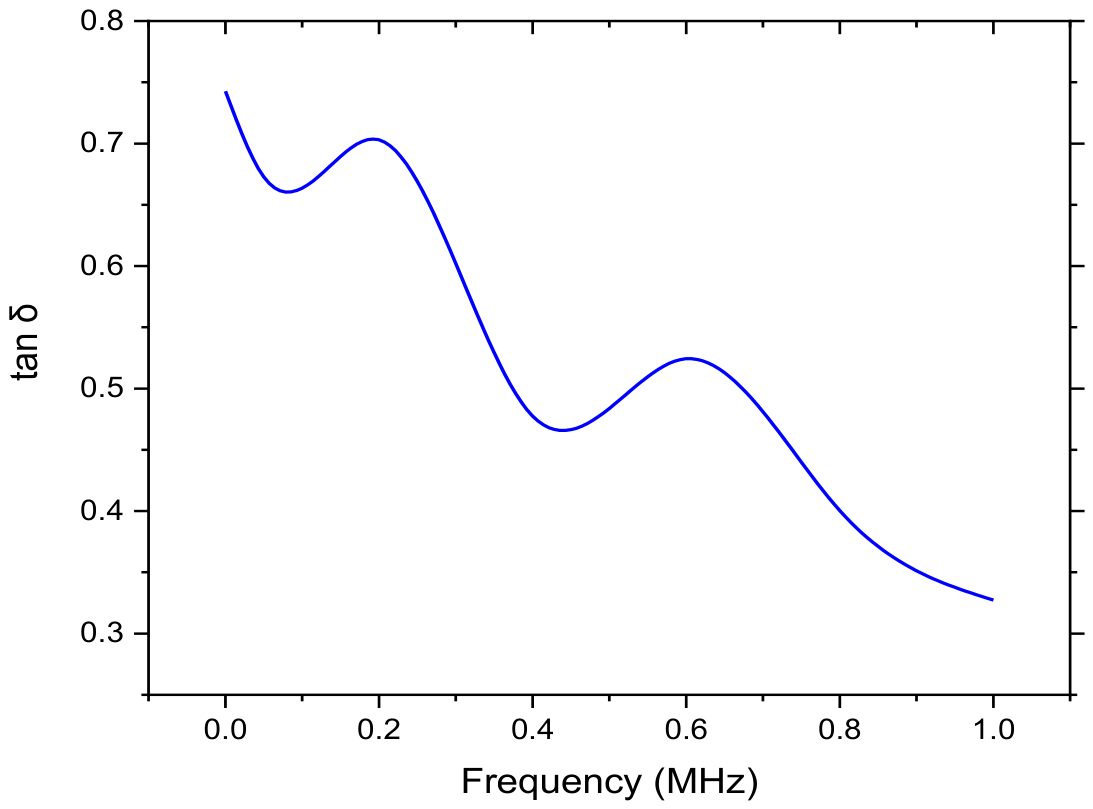
Figure 10.
A.C conductivity dependence of the frequency for HgSr1.6Y0.4Ca2Cu3O8+δ sample.
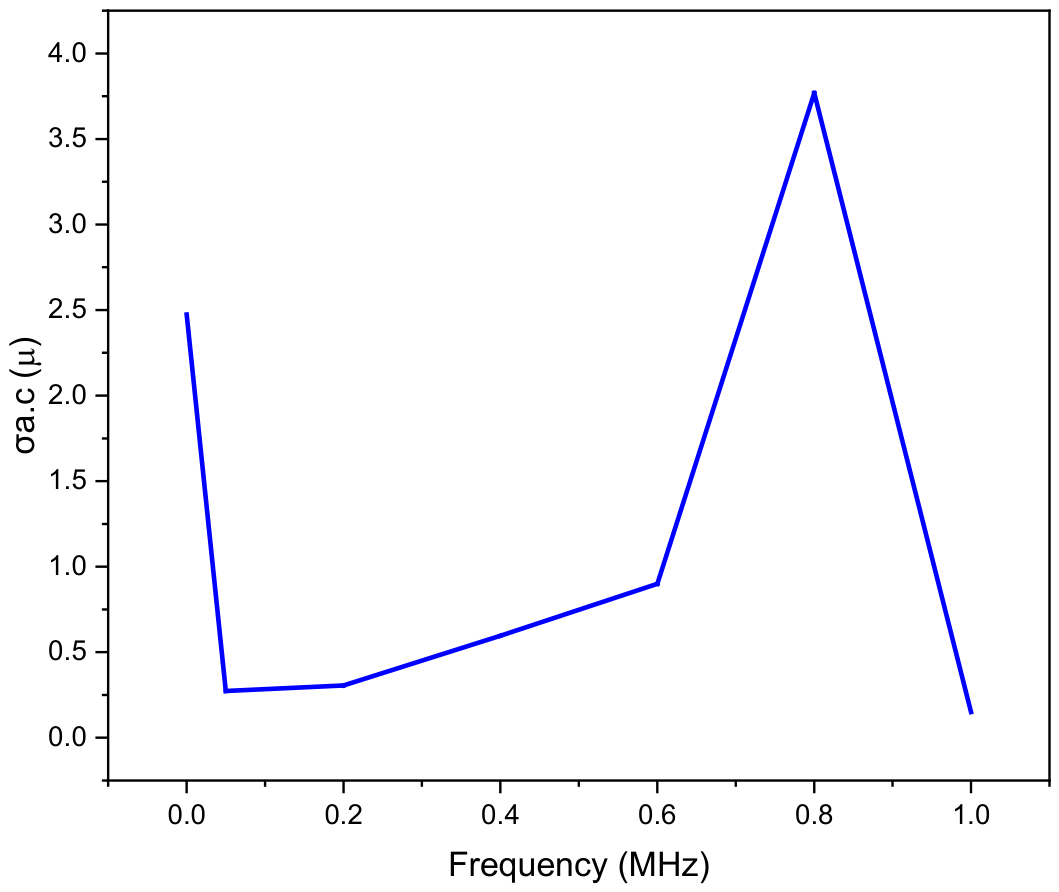

Table 1.
Real dielectric constant (ε′), Imaginary Dielectric Constant (ε″), Loss Tangent (Tan δ), and Alternating Conductivity (σa.c) at different frequencies.
Table 1.
Real dielectric constant (ε′), Imaginary Dielectric Constant (ε″), Loss Tangent (Tan δ), and Alternating Conductivity (σa.c) at different frequencies.
| Frequency (Hz) | έ | ε֞ | tan δ | σa.c |
|---|---|---|---|---|
| 50 | 1296.462 | 973.355 | 0.742709 | 2.48E-06 |
| 50000 | 670.1675 | 450.985 | 0.6729 | 2.73E-07 |
| 200000 | 279.1628 | 196.2753 | 0.70308 | 3.07E-07 |
| 400000 | 199.5149 | 95.2681 | 0.4775 | 5.91E-07 |
| 600000 | 160.1581 | 84.26943 | 0.5244 | 8.97E-07 |
| 800000 | 101.1162 | 40.84686 | 0.4004 | 3.74E-06 |
| 1000000 | 64.17546 | 21.0027 | 0.3273 | 1.51E-07 |
Disclaimer/Publisher’s Note: The statements, opinions and data contained in all publications are solely those of the individual author(s) and contributor(s) and not of MDPI and/or the editor(s). MDPI and/or the editor(s) disclaim responsibility for any injury to people or property resulting from any ideas, methods, instructions or products referred to in the content. |
© 2026 by the author. Licensee MDPI, Basel, Switzerland. This article is an open access article distributed under the terms and conditions of the Creative Commons Attribution (CC BY) license.
Copyright: This open access article is published under a Creative Commons CC BY 4.0 license, which permit the free download, distribution, and reuse, provided that the author and preprint are cited in any reuse.