

Submitted:
02 October 2026
Posted:
05 October 2026
You are already at the latest version
Abstract
Plastic pyrolysis performance depends not only on nominal reactor temperature but also on the actual temperature field established within the reacting bed and vapor phase. This study investigates how the heating-system configuration of a laboratory fixed-bed reactor affects product yields and pyrolysis-oil composition during waste polypropylene pyrolysis. Experiments were performed at 475 °C under N₂ at 0.1 L min⁻¹ for 60 min, comparing a single PID-controlled internal heater with a dual configuration using two independently controlled heating systems. Dual heating increased mean oil yield from 52.14 to 83.95% and reduced gas yield from 45.87 to 14.55%, while solid residue decreased from 1.99 to 1.50%. Temperature profiles showed pronounced overheating in the central vapor-phase region during single heating, whereas dual heating maintained a more homogeneous profile close to the set point. ATR-FTIR, ¹H NMR, and elemental analysis further showed that the dual-heating oil was more aliphatic, with the aliphatic proton fraction increasing from 80.8 to 88.7% and the mean atomic H/C ratio from 2.019 to 2.135. These results demonstrate that heating configuration can substantially alter both yield distribution and liquid-product chemistry even at the same nominal reactor temperature.
Keywords:
plastic pyrolysis
; fixed-bed reactor
; heating mode
; hot spots
; pyrolysis oil composition
1. Introduction
Pyrolysis is a process of thermochemical decomposition of organic material in an inert atmosphere or in environment with very small amount of oxygen in order to suspend char formation [1]. During the pyrolysis of plastic materials, macromolecular chains of polymers are broken down into relatively smaller and simpler gaseous products, whereby a relatively small amount of solid residue remains in the form of ash in the reactor. Part of the gaseous or steam products are separated on the condensation system in the form of a liquid product, i.e., pyrolysis (pyrolytic) oil, while the non-condensable part of the product passes through the system, i.e., it is separated into the form of gaseous products. The products can be used as fuels, raw materials in the petrochemical industry or monomers [2,3,4,5]. Polymers such as polystyrene and polymethyl methacrylate during pyrolysis produce initial monomers, other monoaromatic compounds, along with other hydrocarbons, while polyethylene and polypropylene yield only 0-2% of initial monomers, and are generally transformed into other hydrocarbons [6,7,8]. Furthermore, valuable products like phenols and aromatics are obtained from thermal and catalytic pyrolysis of polycarbonates and high impact polystyrene, respectively [9]. Thus, it is possible to say that pyrolysis is a waste-plastic recycling method that complements physical recycling. There is a consensus that pyrolysis might be a crucial technology in the years to come [10].
The process temperature is the most important parameter because it affects the amount of cracking of the polymer chains [11,12]. Low-temperature processes, generally up to 600 °C, are used to increase the relative proportion of the liquid phase, or pyrolytic oil, in the process products, while high-temperature processes, over 800 °C, are used if one wants to increase the volume of gas phase production [5,13]. At the same time, temperatures above 600 °C cause cyclic hydrocarbons, aromatics, coke formation and the dewaxing mechanism [14]. The relative share of individual phases in pyrolysis products, in addition to the applied temperature, is also determined by other process conditions such as reaction time, carrier gas flow, heating rate, product cooling rate, applied pressure, particle size of the starting raw material, as well as the nature of the raw material itself and the type of reactor [15,16,17,18,19]. Therefore, a large variation in the obtained results can be observed in the literature, both in terms of the yield of the pyrolysis process, the need for catalysts, as well as in terms of the kinetics of the process and the quality of the pyrolysis products [8,12,20,21,22]. Recent studies have also demonstrated the effectiveness of catalytic pyrolysis for the valorization of complex and heterogeneous plastic wastes. Catalytic pyrolysis of marine plastic litter collected during a beach-cleanup campaign proved to be a valuable route for the production of hydrocarbon-rich oils and gases [23]. Similarly, coal-fly-ash-derived zeolites have been successfully employed for the catalytic pyrolysis of residual plastic waste, promoting the conversion of low-value polymer residues into liquid oils and valuable chemicals [24]. Additionally, this is supported by the fact that most research is based on thermogravimetric tests [25,26,27,28,29,30]. These tests are carried out on relatively small samples and most often in autoclaves, dedicated devices for conducting TGA, i.e., conditions in which there are no restrictions in terms of heat transfer to the raw material particles. In one study of the pyrolysis of synthetic polymers and waste plastics with samples of only 15-75 mg, it is stated that the results obtained should be applied with caution to industrial processes [31]. Because plastics have low thermal conductivity, efficient heat transfer is essential to minimize temperature gradients within the polymer bed and promote a more uniform temperature distribution during pyrolysis [11,32,33]. Namely, it is necessary to provide an appropriate temperature drop through the layer of raw material, which is especially pronounced if the heating of the reactor is done through the outer walls of the reactor. Usually, reactors with a fixed bed are of the electric furnace type, in which the raw material is heated externally through reactor walls [34]. In other words, depending on the type of pyrolysis system, there may be a difference in the temperature of the reactor itself and the processed raw material, so that at higher temperatures, the overall reaction rate may be determined by the heat transfer rate rather than by the reaction kinetics [35]. Moreover, the layer temperatures are different in different layers [36]. The use of laboratory fixed-bed reactors has also been investigated for the pyrolysis of other waste streams. In a recent study, tire waste pyrolysis was performed in a laboratory-scale fixed-bed batch reactor, and suitable operating conditions in terms of reaction time, temperature, and inert-gas flow rate were identified to favor the production of pyrolysis oil [37].
In general, the temperature can be controlled either by the furnace temperature (usually a thermoprobe is located on or in the reactor wall) or by the bed temperature. This may certainly be one of the reasons for the difference in published results regarding the yield of pyrolysis products. ‘This raises the question of which temperature best represents pyrolysis conditions in a fixed-bed reactor: the reactor-wall temperature or the temperature within a specific feedstock layer? Therefore, the main objective of this study was to determine whether the heating method of a specific fixed-bed reactor affects the yield and distribution of plastic pyrolysis products, considering the different temperature profiles of the feedstock sample during different heating modes. The reactor examined in this study is heated by means of heaters located in the middle of the reactor. This design makes the entire system more energy efficient. The operation of this reactor has been proven through a series of published studies [11,18,19,37,38,39,40].
In a study by Darko et al. [41], it was proven that the improved heating control of a fixed-bed reactor with 6 independent heating zones leads to a higher pyrolytic oil yield and more valuable quality, primarily in terms of viscosity. However, the paper itself does not show the temperature change inside the reactor, i.e., the different layers of material, so the heating control is based on one thermoprobe located in the center of the raw material layer.
In an earlier paper by Papuga et al. [19], it was shown that during the operation of a reactor with a simple heating control system, based on the response of only one thermoprobe, local overheating still occurs in different layers of material. Therefore, it was suggested that an independent double heating system, i.e., a heating system independently controlled by the responses to two thermoprobes, would lead to a higher oil yield. This was especially noticed in the study by Papuga et al. [18] in which, among other things, it was proven that the oil yield increases with higher reactor loading as a result of reduced local overheating in the central zone of the reactor. Thus, for this study, the tested reactor was further improved in terms of the possibility of additional reactor temperature control regarding the dual heating method.
2. Materials and Methods
2.1. Description of the Pyrolysis Experiment
Waste polypropylene (PP) was used as a model sample. Sample preparation involved: washing, drying, crushing, and grinding on a laboratory mill. The average diameter of the sample particles was 1.40 mm, which was determined by granulometric analysis. The weight of each reactor feed was 100.00 g. Pyrolysis experiments were carried out in a laboratory fixed bed reactor (Figure 1). A detailed description of the experimental technique and the fixed-bed reactor can be accessed from previous studies [19,39,40].
All pyrolysis experiments were carried out at a temperature of 475 °C, as an optimal value for complete conversation of reactor’s feed and according to the results of the previous studies in the same reactor configuration [11,18]. The carrier gas flow rate was 0.1 Ln min-1, the reactor was inertized for 15 minutes before heating. The reactor was kept at 475 °C for 60 minutes. Nitrogen of 99.999% purity was used as carrier gas, i.e., inertization atmosphere. For the purposes of this study, pyrolysis oil was defined as the condensed pyrolysis products, which basically consist of pyrolytic liquids and waxes.
2.2. Analytical Techniques
2.2.1. ATR-FTIR Spectroscopy
ATR-FTIR spectra of pyrolysis oils A and T were recorded using a Bruker (Billerica, Massachusetts, USA) ALPHA II spectrometer equipped with a diamond attenuated-total-reflectance (ATR) accessory. Spectra were acquired over the 400–4000 cm−1 range using 64 scans at a spectral resolution of 4 cm−1. Two replicate measurements were collected for each oil. For comparative evaluation of selected functional-group regions, integrated band areas were normalized to the total C–H stretching region between 3100 and 2700 cm−1.
2.2.2. ¹H NMR Spectroscopy
Proton nuclear magnetic resonance (¹H NMR) spectra were acquired on a Bruker (Billerica, Massachusetts, USA) Ascend 400 MHz spectrometer. Samples were dissolved in CDCl3, and the residual solvent signal at 7.26 ppm was used as the chemical-shift reference. Spectra were processed and integrated using MestReNova 15 (Mestrelab Research, Santiago de Compostela, Spain). The hydrogen distribution was evaluated by integrating the following regions: 0.4–1.0 ppm (predominantly aliphatic CH3), 1.0–1.8 ppm (aliphatic CH2/CH), 1.8–3.3 ppm (deshielded aliphatic hydrogens adjacent to unsaturated/aromatic environments), 4.5–6.5 ppm (olefinic hydrogens), and 6.5–9.0 ppm (aromatic hydrogens), excluding the residual CDCl3 resonance. This regional approach follows established ¹H NMR characterization schemes for complex hydrocarbon and pyrolysis-oil matrices [42,43,44].
2.2.3. Elemental Analysis
Elemental C, H, N and S determinations were performed using an EA 1110 CHNS-O (CE Instruments, Milan, Italy) analyzer with EAGER 200 data processing. The analytical sequence involved combustion of the sample at approximately 1000 °C, catalytic oxidation/reduction of the combustion products, gas-chromatographic separation of N2, CO2 and H2O, and thermal-conductivity detection. The estimated uncertainty for an individual C or H determination was ±0.3 wt%. Nitrogen and sulfur were not detected in the analyzed aliquots. Because the oils are volatile and compositionally heterogeneous, absolute C and H values were interpreted together with the atomic H/C ratio [45].
2.3. Experimental Design and Statistical Analysis
The experimental design and associated statistical testing, as tools for drawing conclusions about the hypothesis, were carried out using the Design-Expert 11 software package (Stat-Ease, Inc., Minneapolis, USA).
To test the hypothesis of the influence of the reactor heating mode, as an independent variable, on the yield and distribution of pyrolysis products, as dependent variables, a factorial experimental design was adopted. Heating mode (Factor A) was tested as a categorical parameter with two levels (treatments) of influence:
- Level 1 (single heating mode) - heating of the reactor with the single PID-controlled heating system located inside of reactor, in middle of feedstock bed (Figure 2, a) and
- Level 2 (dual heating mode) - Simultaneous heating of the reactor with two PID independently controlled heating systems. The first heating system is located inside of reactor (heating system defined as Level 1), and second heating system is located on the outer bottom wall of reactor (Figure 2, b)
The PID control loop of the first heating system uses a thermoprobe located in the middle part of the reactor. The PID control loop of the second heating system uses a thermoprobe located at the bottom of the inner part of the reactor.
As dependent variables (measured responses), pyrolysis oil yields (R1), gas yield (R2) and solid residue (R3) in the reactor were monitored. Each level of influence was tested through three replicate experiments. According to the adopted experimental design, this enabled a statistically reliable assessment of the tested treatment (Table 1). As Table 1 shows, the statistical power of the chosen experimental design to detect the effect of interest, relative to the influence of factor A on all three dependent variables, is significantly above the recommended minimum of 80%. In general, the statistical power of an experimental design should be at least 80% [46,47].
The estimated standard deviations in oil (R1), gas (R2) and solids yield were adopted as: 0.67, 0.46 and 0.28%, respectively. Such low estimated values are based on experience from previous experiments on the same reactor and are certainly better for statistical power. The minimum changes that the design should detect as statistically significant were adopted at 2.5 in relation to R1 and R2, and 1% in relation to R3.
The statistical significance of the effect of Factor A on R1, R2, and R3 was tested in two ways:
- Model F-test, or Analysis of variance (ANOVA) of the hypothetical factorial model of influence, with the use of Fisher’s statistical test (F-test),
- Fisher’s LSD test, i.e., pairwise comparison of treatment means, was used as additional confirmation. This test evaluates the null hypothesis that the treatment means are equal.
3. Results and Discussion
As shown in Table 2, yields of pyrolysis oil (R1), pyrolysis gas (R2) and solid residue (R3), when applying different heating modes. As shown in the Table 2 there are large variations in individual values of responses R1 and R2 depending on the applied treatment. Significance of these variations is further statistically approved by analyzing variance of the hypothetical factorial model that describe the influence of Factor A (heating mode) on the responses in question, as well as by F-test (Table 3).
3.1. Statistical Testing
Table 3 shows that the model F-values, as well as the sum of squares for responses R1 and R2, are quite large compared to the model F-values for responses R3. For the case of response R1, the Model F-value of 6612.61 implies the model is not significant relative to the noise. There is only a 0.01% chance that an F-value this large could occur due to noise. For the case of response R2, the Model F-value of 4983.06 implies the model is significant relative to the noise. There is less than 0.01% chance that an F-value this large could occur due to noise. For the case of response R3, the Model F-value of 46.47 implies the model is significant relative to the noise. There is only a 0.24% chance that an F-value this large could occur due to noise. Analogous statements can be made based on the observation of p-values. Generally, p-values less than 0.0500 indicate model terms (Factor A) are significant. In this case, Factor A is significant model term, with respect to yields of all three responses. Values greater than 0.1000 indicate the model terms are not significant. Therefore, it is possible to conclude that the mode of fixed bed reactor heating has significant effect on the yield of pyrolysis products.
The above conclusions can be reached by comparing the corresponding I-beams on the graphs presented in Figure 3, as well. The graphs show the average values of the dependent variables with regard to the appropriate treatment (single or dual heating mode), as well as the corresponding LSD intervals, i.e., intervals of 95% least significant differences (Fisher’s LSD test), which are represented by vertical interval lines (I-beams). In order for the two treatments to differ significantly in terms of impact on the response of interest there must be no horizontal overlapping of the I-beams. All three graphs clearly show that the ranges of values included in the I-beams on the left side of a graph (bottom inertization) do not overlap with the corresponding I-beams on the right side of the graphs (top inertitation). Thus, it is possible to conclude that there is a significant difference between two modes of fixed-bed reactor heating with regard to yield of pyrolysis products.
3.2. Temperature-Profile Analysis
The significantly higher yield of pyrolytic oil in the dual heating mode is attributed to the change in temperature inside the reactor (Figure 4), which shows that this particular fixed-bed reactor suffers from local overheating in its middle section, i.e., temperatures exceed the set/desired value (475 °C bank set point, in Figure 4). A somewhat similar behavior of the temperature field inside a fixed-bed reactor was also recorded in the study by Swamardika et al. [33], during the pyrolysis of PP waste, as well as in previous studies of this particular reactor system [19,40]. Local overheating of the middle section of the reactor is more pronounced in the case of single heating mode, compared to dual heating mode. This occurrence leads to a more extensive cracking of volatile products from saturated aliphatic plastics, such as PP, and thus greater formation of non-condensable gases, i.e., a reduction in the yield of pyrolytic oil [41,48]. In general, higher pyrolysis temperatures promote the formation of gas at the expense of liquid products. Temperatures from 400 to 550 °C maximize liquid oil and wax yields, while temperatures above 600 °C shift yields toward C1–C4 gases and olefins through secondary cracking [48]. From Figure 4 it is quite obvious that in the single heating mode most of the time the middle section of the reactor is well above 500 °C, while the lower part of the reactor, where the plastic melts, decomposes, evaporates and enters the pyrolysis reaction, almost ideally maintains the desired temperature of 475 °C. In the case of dual heating mode, such a significant amount of overheating does not occur and most of the time the reactor is in the desired temperature range.
The above statement about excessive cracking of volatile products during a single heating mode is further supported by the chemical characterization of pyrolysis oils. Namely, it is well known that the distribution of pyrolysis oil products is strongly controlled by temperature. Increasing the pyrolysis temperature promotes thermal cracking, free radical reactions, depolymerization and polycondensation, creating aromatic and unsaturated compounds [49].
Lower temperatures (300 to 400 °C) retain or yield aliphatic structures, whereas high temperatures (>500 °C) break down aliphatic chains, eliminate hydrogen and oxygen, and form stable aromatic ring networks [50]. The results of chemical characterization of oils obtained during pyrolysis under single heating mode conditions (sample A) and during pyrolysis under dual heating mode conditions (sample T) are presented in the following section.
3.3. Chemical Characterization of the Pyrolysis Oil
The chemical composition of the liquid products obtained under the two reactor-heating configurations was investigated by ATR-FTIR spectroscopy, 1H NMR spectroscopy, and elemental analysis. Two pyrolysis-oil samples were selected for the comparative chemical characterization, each corresponding to one of the heating configurations investigated throughout this study. Sample A was the liquid product obtained from the pyrolysis of waste polypropylene under the single-heating configuration, whereas sample T was obtained from the same polypropylene feedstock under the dual-heating configuration. In both cases, the nominal operating conditions were those described above, namely a reactor temperature of 475 °C, a nitrogen flow rate of 0.1 L min−1, and a reaction time of 60 min. Thus, A and T provide a direct comparison between the liquid products generated under the two heating modes, while keeping the feedstock and nominal pyrolysis conditions unchanged. The sample labels A and T are used hereafter throughout the spectroscopic and elemental analyses.
FTIR and ¹H NMR spectroscopy are widely used as complementary techniques for the characterization of complex pyrolysis oils and hydrocarbon mixtures. They provide information on functional-group distributions and on the relative abundance of aliphatic, olefinic and aromatic environments [42,43,44].
As discussed in the preceding section, the single-heating configuration generated pronounced local overheating in the middle part of the fixed-bed reactor, whereas the dual-heating configuration produced a considerably more homogeneous temperature profile close to the nominal set point of 475 °C. Since the feedstock and nominal process conditions were otherwise unchanged, the chemical characterization of A and T was used to assess whether the different thermal histories experienced by the pyrolysis vapours were also reflected in the composition of the condensed liquid products.
3.3.1. ATR-FTIR Analysis
The ATR-FTIR comparison was performed using relative spectral indices. For each diagnostic spectral interval, the integrated absorbance of the selected band was divided by the integrated area of the broad C–H stretching region between 3100 and 2700 cm⁻¹, which was used as an internal spectral reference. This treatment reduces the influence of differences in overall spectral intensity and allows the relative contribution of the same functional-group region to be compared between oils A and T.
Iregion = Aregion / A3100–2700
where Iregion is the dimensionless normalized FTIR index, Aregion is the integrated absorbance of the selected wavenumber interval, and A3100–2700 is the integrated absorbance of the reference C–H stretching envelope. The results and spectra are shown in Table 4 and Figure 5.
Both oils are dominated by intense C–H stretching absorptions in the 2950–2850 cm⁻¹ region, confirming their predominantly aliphatic hydrocarbon character. This assignment is consistent with previous FTIR studies of pyrolysis oils. Yan et al. assigned bands near 2957, 2922, and 2870 cm⁻¹ to methyl and methylene stretching vibrations in oils from thermal cracking of PP and LDPE, while Banar et al. likewise associated the 2800–3000 cm⁻¹ region with alkane C–H stretching [42,44]. The carbonyl index was very small for both samples (0.0064 for A and 0.0053 for T), corresponding to only 0.64 and 0.53% of the respective C–H reference areas. This indicates that carbonyl-containing functionalities make only a minor relative contribution to the spectra of both oils. A clearer difference was observed in the 1395–1365 cm⁻¹ CH₃ symmetric-bending region, where the normalized index increased from 0.0741 for A to 0.0885 for T. This increase indicates a larger relative methyl contribution in oil T.
Overall, the ATR-FTIR results indicate that both oils retain a predominantly aliphatic hydrocarbon character, while the relative distribution of specific functional groups differs between the two heating configurations. In particular, the higher CH₃-related contribution observed for oil T is consistent with a more pronounced aliphatic character under dual-heating conditions.
3.3.2. ¹H NMR Analysis
The ¹H NMR spectra were evaluated by direct regional integration of the proton signal. Five chemical-shift intervals were defined on the basis of established pyrolysis-oil assignments: 0.4–1.0 ppm for highly shielded aliphatic CH₃ protons, 1.0–1.8 ppm for aliphatic CH₂/CH protons, 1.8–3.3 ppm for deshielded aliphatic protons located near unsaturated or aromatic functionalities, 4.5–6.5 ppm for olefinic protons, and 6.5–9.0 ppm for aromatic protons. The residual CDCl₃ signal at 7.26 ppm was excluded. Banar et al. use closely comparable hydrogen-type regions for pyrolytic oils, while Yan et al. [44] report analogous aliphatic, vinylic, and aromatic regions for PP- and LDPE-derived oils.
fi (%) = 100 × Ai / ΣAj
where Ai is the integrated ¹H NMR area of region i and ΣAj is the sum of the selected proton-region integrals after exclusion of the solvent resonance. The reported values therefore represent the percentage distribution of observed proton environments. Results and spectra are shown in Table 5 and Figure 6.
Both oils were predominantly aliphatic, but a clear difference was observed between the two heating configurations. For sample A, the 0.4–1.0 ppm and 1.0–1.8 ppm regions accounted for 37.6 and 43.2% of the integrated proton signal, respectively, resulting in a total aliphatic contribution of 80.8%. Deshielded aliphatic hydrogens represented 9.8%, olefinic hydrogens 7.9%, and aromatic hydrogens 1.5%.
In contrast, oil T showed a markedly greater aliphatic contribution. The CH3 and CH2/CH regions accounted for 43.5 and 45.2%, respectively, giving a total aliphatic fraction of 88.7%. At the same time, the deshielded aliphatic contribution decreased to 5.2% and the olefinic fraction decreased to 6.1%. No quantifiable aromatic-proton contribution was observed within the selected 6.5–9.0 ppm integration interval.
The change from single to dual heating therefore increased the total aliphatic hydrogen fraction from 80.8 to 88.7%, while the combined deshielded, olefinic and aromatic contribution decreased from 19.2 to 11.3%. The olefinic fraction decreased from 7.9 to 6.1%, and the aromatic contribution decreased from 1.5% to below the quantifiable level. These results are consistent with the predominantly aliphatic/olefinic products expected from polyolefin pyrolysis. In particular, Yan et al. [44] reported significant formation of unsaturated hydrocarbons during PP thermal cracking and identified intramolecular hydrogen transfer and β-scission as major degradation pathways.
The greater contribution of deshielded, olefinic and aromatic hydrogens in oil A is consistent with the more severe thermal history experienced by volatile products in the overheated central reactor zone. Conversely, suppression of this hotspot under dual-heating conditions is associated with an oil retaining a substantially larger proportion of aliphatic hydrogen environments.
3.3.3. Elemental Analysis
Elemental analysis was evaluated at the level of individual aliquots before calculation of descriptive statistics. Nitrogen and sulfur were not detected in any A or T aliquot. The atomic hydrogen-to-carbon ratio was calculated separately for each determination from the measured carbon and hydrogen mass fractions:
where wH and wC are the measured hydrogen and carbon mass fractions. Calculating H/C for each aliquot preserves the covariance of the paired C and H measurements and provides a more chemically meaningful descriptor than calculating a ratio from independently averaged C and H values. The residual quantity 100 − C − H was treated only as an unassigned mass balance; it was not interpreted as a direct oxygen determination because the method did not directly quantify oxygen and the oils may contain volatile or suspended fractions.
H/C = (wH / 1.008) / (wC / 12.011)
The results of the elemental analysis are reported in Table 6 and Table 7. Table 6 summarizes the individual C, H, N, and S determinations and the corresponding atomic H/C ratios for each aliquot, whereas Table 7 presents the descriptive statistics for oils A and T.
The mean atomic H/C ratio increases from 2.019 ± 0.029 for A to 2.135 ± 0.013 for T. Importantly, the observed H/C ranges do not overlap: all T aliquots fall between 2.126 and 2.150, whereas all A aliquots fall between 1.985 and 2.052. The absolute C and H values are more dispersed for A than for T, particularly for carbon. This dispersion should be interpreted in the context of the volatile and compositionally heterogeneous nature of pyrolysis oils, for which subsampling can contribute to analytical variability. The higher H/C ratio of T agrees with the ¹H NMR result: T has the largest aliphatic proton fraction and the smallest combined deshielded, olefinic, and aromatic contribution. Conversely, A has a lower H/C ratio and the larger relative contribution of unsaturated/aromatic hydrogen environments.
Under dual-heating conditions, the total aliphatic proton contribution rises from 80.8 to 88.7% and the atomic H/C ratio rises from 2.019 ± 0.029 to 2.135 ± 0.013. In parallel, the olefinic and aromatic proton contributions decrease. These changes are consistent with a lower effective thermal severity of the vapor phase when the central overheating observed in the single-heating configuration is suppressed.
4. Conclusions
This study demonstrates that the heating-system configuration of a fixed-bed reactor can substantially affect both the product distribution and the chemical characteristics of the liquid products obtained during waste polypropylene pyrolysis, even when the nominal operating conditions are kept unchanged. Switching from a single- to a dual-heating configuration increased the mean pyrolysis-oil yield from 52.14 to 83.95%, while the gas yield decreased from 45.87 to 14.55% and the solid residue decreased from 1.99 to 1.50%. The influence of the heating mode on all three product yields was statistically significant, as confirmed by ANOVA and Fisher’s LSD analysis.
Analysis of the internal temperature profiles provides a physical explanation for these differences. Under single-heating conditions, pronounced overheating developed in the central region of the reactor, whereas the dual-heating configuration maintained a considerably more homogeneous temperature profile close to the nominal set point of 475 °C. The greater thermal severity experienced by the evolving vapors under single heating is consistent with enhanced secondary cracking and, consequently, with the greater formation of non-condensable products.
The chemical characterization of the representative pyrolysis oils further supports this interpretation. Both oils were predominantly aliphatic; however, ATR-FTIR showed a greater relative CH₃ contribution for the oil obtained under dual heating. More clearly, ¹H NMR showed that the total aliphatic proton fraction increased from 80.8% under single heating to 88.7% under dual heating, while the combined deshielded, olefinic, and aromatic contribution decreased from 19.2 to 11.3%. Consistently, the mean atomic H/C ratio increased from 2.019 ± 0.029 to 2.135 ± 0.013. Together, these results indicate that suppression of the central reactor hotspot reduces the effective thermal severity experienced by the vapor phase and produces a more strongly aliphatic liquid product.
Overall, the results demonstrate that nominal reactor temperature alone is insufficient to fully describe fixed-bed plastic-pyrolysis conditions. The spatial temperature distribution and the thermal history of the evolving vapors must also be considered when interpreting product yields and oil composition. Improved control of the reactor temperature field can therefore simultaneously increase the recovery of condensable products and modify their chemical characteristics, providing a relevant design parameter for improving the reproducibility and performance of fixed-bed waste-plastic pyrolysis processes.
Author Contributions
Conceptualization, S.P. and S.V.C.; methodology, S.P. and S.V.C.; software, S.P.; validation, S.P., S.V.C. and O.A.Z.; formal analysis, S.P. and O.A.Z.; investigation, S.P., S.V.C. and O.A.Z.; resources, S.P.; data curation, S.P., S.V.C. and O.A.Z.; writing—original draft preparation, S.P., S.V.C. and O.A.Z.; writing—review and editing, S.P., S.B. and S.V.C.; visualization, S.P., S.V.C. and O.A.Z.; supervision, S.P., S.B. and S.V.C.; project administration, S.P.; All authors have read and agreed to the published version of the manuscript.
Funding
This research received no external fundings.
Data Availability Statement
The data is contained within the article.
Conflicts of Interest
The authors declare no conflicts of interest.
References
- Oliveux, G.; Dandy, L.O.; Leeke, G.A. Current Status of Recycling of Fibre Reinforced Polymers: Review of Technologies, Reuse and Resulting Properties. Progr. Mater. Sci. 2015, 72, 61–99. [Google Scholar] [CrossRef]
- Xue, Y.; Johnston, P.; Bai, X. Effect of Catalyst Contact Mode and Gas Atmosphere during Catalytic Pyrolysis of Waste Plastics. Energy Conver. Manag. 2017, 142, 441–451. [Google Scholar] [CrossRef]
- Panda, A.K.; Singh, R.K.; Mishra, D.K. Thermolysis of Waste Plastics to Liquid fuel: A Suitable Method for Plastic Waste Management and Manufacture of Value Added Products—A World Prospective. Renew. Sustain. Energy Rev. 2010, 14, 233–248. [Google Scholar] [CrossRef]
- Kaminsky, W.; Zorriqueta, I.-J.N. Catalytical and Thermal Pyrolysis of Polyolefins. J. Anal. Appl. Pyrol. 2007, 79, 368–374. [Google Scholar] [CrossRef]
- Buekens, A. Introduction to Feedstock Recycling of Plastics. In Feedstock Recycling and Pyrolysis of Waste Plastics; Scheirs, J., Kaminsky, W., Eds.; Wiley, 2006; pp. 1–41. ISBN 978-0-470-02152-1. [Google Scholar]
- Maafa, I. Pyrolysis of Polystyrene Waste: A Review. Polymers 2021, 13, 225. [Google Scholar] [CrossRef]
- Kaminsky, W.; Eger, C. Pyrolysis of Filled PMMA for Monomer Recovery. J. Anal. Appl. Pyrol. 2001, 58–59, 781–787. [Google Scholar] [CrossRef]
- Sprenkels, K. Plastic Waste Recycling and Valorisation via Dedicated Pyrolysis Approaches; University of Groningen: Netherlands, 2018. [Google Scholar]
- 9Antonakou, E.V.; Kalogiannis, K.G.; Stephanidis, S.D.; Triantafyllidis, K.S.; Lappas, A.A.; Achilias, D.S. Pyrolysis and catalytic pyrolysis as a recycling method of waste CDs originating from polycarbonate and HIPS. Waste Manag. 2014, 34, 2487–2493. [Google Scholar] [CrossRef] [PubMed]
- Soni, V.K.; Singh, G.; Vijayan, B.K.; Chopra, A.; Kapur, G.S.; Ramakumar, S.S.V. Thermochemical Recycling of Waste Plastics by Pyrolysis: A Review. Energy Fuels 2021, 35, 12763–12808. [Google Scholar] [CrossRef]
- Papuga, S.; Gvero, P.; Vukic, L. Temperature and Time Influence on the Waste Plastics Pyrolysis in the Fixed Bed Reactor. Therm. Sci. 2016, 20, 731–741. [Google Scholar] [CrossRef]
- Sharuddin, S.D.A.; Abnisa, F.; Daud, W.M.A.W.; Aroua, M.K. Pyrolysis of Plastic Waste for Liquid Fuel Production as Prospective Energy Resource. IOP Conf. Ser. Mater. Sci. Eng. 2018, 334, 012001. [Google Scholar] [CrossRef]
- Kiran, N.; Ekinci, E.; Snape, C.E. Recyling of Plastic Wastes via Pyrolysis. Resour. Conserv. Recycl. 2000, 29, 273–283. [Google Scholar] [CrossRef]
- Rahman, M.H.; Bhoi, P.R.; Menezes, P.L. Pyrolysis of Waste Plastics into Fuels and Chemicals: A Review. Renew. Sustain. Energy Rev. 2023, 188, 113799. [Google Scholar] [CrossRef]
- Hoang, A.T.; Ong, H.C.; Fattah, I.M.R.; Chong, C.T.; Cheng, C.K.; Sakthivel, R.; Ok, Y.S. Progress on the Lignocellulosic Biomass Pyrolysis for Biofuel Production toward Environmental Sustainability. Fuel Process. Technol. 2021, 223, 106997. Available online: https://. [CrossRef]
- Gebre, S.H.; Sendeku, M.G.; Bahri, M. Recent Trends in the Pyrolysis of Non-Degradable Waste Plastics. ChemistryOpen 2021, 10, 1202–1226. [Google Scholar] [CrossRef]
- Fadillah, G.; Fatimah, I.; Sahroni, I.; Musawwa, M.M.; Mahlia, T.M.I.; Muraza, O. Recent Progress in Low-Cost Catalysts for Pyrolysis of Plastic Waste to Fuels. Catalysts 2021, 11, 837. [Google Scholar] [CrossRef]
- Papuga, S.; Savković, J.; Djurdjevic, M.; Vecchio Ciprioti, S. Effect of Feed Mass, Reactor Temperature, and Time on the Yield of Waste Polypropylene Pyrolysis Oil Produced via a Fixed-Bed Reactor. Polymers 2024, 16, 1302. [Google Scholar] [CrossRef]
- Papuga, S.; Vecchio Ciprioti, S.; Djurdjevic, M.; Kolundzija, A. Effects of an Inertization System on Waste Plastic Pyrolysis in a Fixed Bed Reactor. Recycling 2025, 10, 2. [Google Scholar] [CrossRef]
- Olalo Joselito Characterization of Pyrolytic Oil Produced from Waste Plastic in Quezon City, Philippines Using Non-Catalytic Pyrolysis Method. Chem. Eng. Trans. 2021, 86, 1495–1500. [CrossRef]
- Butler, E.; Devlin, G.; McDonnell, K. Waste Polyolefins to Liquid Fuels via Pyrolysis: Review of Commercial State-of-the-Art and Recent Laboratory Research. Waste Biomass Valor 2011, 2, 227–255. [Google Scholar] [CrossRef]
- Al-Salem, S.M.; Lettieri, P.; Baeyens, J. Recycling and Recovery Routes of Plastic Solid Waste (PSW): A Review. Waste Manag. 2009, 29, 2625–2643. [Google Scholar] [CrossRef]
- Cocchi, M.; Cafiero, L.; De Angelis, D.; Falasconi, M.B.; Piemonte, V.; Tuffi, R.; Vecchio Ciprioti, S. Conversion of Marine Plastic Litter into Chemicals and Fuels through Catalytic Pyrolysis Using Commercial and Coal Fly Ash-Synthesized Zeolites. ACS Sustain. Chem. Eng. 2023, 11, 3644–3656. [Google Scholar] [CrossRef]
- Cocchi, M.; Angelis, D.D.; Mazzeo, L.; Nardozi, P.; Piemonte, V.; Tuffi, R.; Vecchio Ciprioti, S. Catalytic Pyrolysis of a Residual Plastic Waste Using Zeolites Produced by Coal Fly Ash. Catalysts 2020, 10, 1113. [Google Scholar] [CrossRef]
- Li, H.; Mašek, O.; Harper, A.; Ocone, R. Kinetic Study of Pyrolysis of High-density Polyethylene (HDPE) Waste at Different Bed Thickness in a Fixed Bed Reactor. Can. J. Chem. Eng. 2021, 99, 1733–1744. [Google Scholar] [CrossRef]
- Nguyen, L.T.; Poinern, G.E.J.; Le, H.T.; Nguyen, T.A.; Tran, C.M.; Jiang, Z. A LaFeO3 Supported Natural-clay-mineral Catalyst for Efficient Pyrolysis of Polypropylene Plastic Material. Asia-Pac. J. Chem. Eng. 2021, 16, e2695. [Google Scholar] [CrossRef]
- Zheng, Y.; Tao, L.; Yang, X.; Huang, Y.; Liu, C.; Zheng, Z. Study of the Thermal Behavior, Kinetics, and Product Characterization of Biomass and Low-Density Polyethylene Co-Pyrolysis by Thermogravimetric Analysis and Pyrolysis-GC/MS. J. Anal. Appl. Pyrolysis 2018, 133, 185–197. [Google Scholar] [CrossRef]
- Artetxe, M.; Lopez, G.; Elordi, G.; Amutio, M.; Bilbao, J.; Olazar, M. Production of Light Olefins from Polyethylene in a Two-Step Process: Pyrolysis in a Conical Spouted Bed and Downstream High-Temperature Thermal Cracking. Ind. Eng. Chem. Res. 2012, 51, 13915–13923. [Google Scholar] [CrossRef]
- Brems, A.; Baeyens, J.; Beerlandt, J.; Dewil, R. Thermogravimetric Pyrolysis of Waste Polyethylene-Terephthalate and Polystyrene: A Critical Assessment of Kinetics Modelling. Resour. Conserv. Recycl. 2011, 55, 772–781. [Google Scholar] [CrossRef]
- Kumar, S.; Singh, R.K. Recovery of Hydrocarbon Liquid from Waste High Density Polyethylene by Thermal Pyrolysis. Braz. J. Chem. Eng. 2011, 28, 659–667. [Google Scholar] [CrossRef]
- Encinar, J.M.; González, J.F. Pyrolysis of Synthetic Polymers and Plastic Wastes. Kinetic Study. Fuel Process. Technol. 2008, 89, 678–686. [Google Scholar] [CrossRef]
- Politeknik Negeri Bali; Putrawan, I.M.A.; Suarbawa, I.K.G.J.; Politeknik Negeri Bali; Rajendra, I.M.; Politeknik Negeri Bali; Winaya, I. Universitas Udayana Design and Fabrication of a Fixed Bed Pyrolysis with LDPE Plastic Waste. LOGIC 2021, 21, 179–183. [Google Scholar] [CrossRef]
- Swamardika, I.B.A.; Winaya, I.N.S.; Hartati, R.S. Utilization Plastic Waste Using Pyrolysis Fixed Bed. IOP Conf. Ser. Mater. Sci. Eng. 2019, 539, 012021. [Google Scholar] [CrossRef]
- Czajczyńska, D.; Anguilano, L.; Ghazal, H.; Krzyżyńska, R.; Reynolds, A.J.; Spencer, N.; Jouhara, H. Potential of Pyrolysis Processes in the Waste Management Sector. Therm. Sci. Eng. Prog. 2017, 3, 171–197. [Google Scholar] [CrossRef]
- Sadaka, S. Pyrolysis; Center for Sustainable Environmental Technologies, Department of Agricultural and Biosystems Engineering, Iowa State University: Nevada, IA, USA, 2007; pp. 1–25. [Google Scholar]
- Al-Salem, S.M. Feedstock and Optimal Operation for Plastics to Fuel Conversion in Pyrolysis. In Plastics to Energy; Elsevier, 2019; pp. 117–146. ISBN 978-0-12-813140-4. [Google Scholar]
- Papuga, S.; Djurdjevic, M.; Tomović, G.; Vecchio Ciprioti, S. Pyrolysis of Tyre Waste in a Fixed-Bed Reactor. Symmetry 2023, 15, 2146. [Google Scholar] [CrossRef]
- Kremer, I.; Tomić, T.; Katančić, Z.; Erceg, M.; Papuga, S.; Vuković, J.P.; Schneider, D.R. Catalytic Pyrolysis of Mechanically Non-Recyclable Waste Plastics Mixture: Kinetics and Pyrolysis in Laboratory-Scale Reactor. J. Environ. Manag. 2021, 296, 113145. [Google Scholar] [CrossRef]
- Kremer, I.; Tomić, T.; Katančić, Z.; Erceg, M.; Papuga, S.; Parlov Vuković, J.; Schneider, D.R. Catalytic Pyrolysis and Kinetic Study of Real-World Waste Plastics: Multi-Layered and Mixed Resin Types of Plastics. Clean Techn Environ. Policy 2022, 24, 677–693. [Google Scholar] [CrossRef]
- Djurdjevic, M.; Papuga, S.; Kolundzija, A. Analysis of the Thermal Behavior of a Fixed Bed Reactor during the Pyrolysis Process. Hem. Ind. 2024, 78, 29–40. [Google Scholar] [CrossRef]
- Darko, A.A.; Thulficar, M.; Whitty, K.J. Pyrolysis of Plastics in a Multi-Zone Reactor: System Performance and Characterization of Oil, Gas and Char. Energy Convers. Manag. 2026, 353, 121192. [Google Scholar] [CrossRef]
- Banar, M.; Akyıldız, V.; Özkan, A.; Çokaygil, Z.; Onay, Ö. Characterization of Pyrolytic Oil Obtained from Pyrolysis of TDF (Tire Derived Fuel). Energy Convers. Manag. 2012, 62, 22–30. [Google Scholar] [CrossRef]
- Kumar Mishra, R.; Mohanty, K. Co-Pyrolysis of Waste Biomass and Waste Plastics (Polystyrene and Waste Nitrile Gloves) into Renewable Fuel and Value-Added Chemicals. Carbon Resour. Convers. 2020, 3, 145–155. [Google Scholar] [CrossRef]
- Yan, G.; Jing, X.; Wen, H.; Xiang, S. Thermal Cracking of Virgin and Waste Plastics of PP and LDPE in a Semibatch Reactor under Atmospheric Pressure. Energy Fuels 2015, 29, 2289–2298. [Google Scholar] [CrossRef]
- D02 Committee ASTM International. Test Methods for Instrumental Determination of Carbon, Hydrogen, and Nitrogen in Petroleum Products and Lubricants. Accessed on. (accessed on 23 September 2026). [CrossRef]
- Anderson, M.J.; Whitcomb, P.J. Employing Power to ‘Right-Size’ Design of Experiments. TEA J. Test. Eval. 2014, 35, 40–44. [Google Scholar]
- Ledolter, J.; Kardon, R.H. Focus on Data: Statistical Design of Experiments and Sample Size Selection Using Power Analysis. Invest. Ophthalmol. Vis. Sci. 2020, 61, 11. [Google Scholar] [CrossRef]
- Chae, E.; Choi, S.-S. Influence of Molecular Weight and Temperature on the Pyrolysis Behavior of Polyethylene. Polymers 2025, 17, 576. [Google Scholar] [CrossRef]
- Auersvald, M.; Šiman, M.; Lyko Vachková, E.; Kroufek, J.; Straka, P.; Barzallo, G.; Vozka, P. A Comparative Study of Aromatic Content in Pyrolysis Oils from Waste Plastics and Tires: Assessing Common Refinery Methods. Fuel 2024, 369, 131714. [Google Scholar] [CrossRef]
- Kujawska, J.; Cel, W.; Charmas, B.; Szala, D. Effect of Pyrolysis Temperature on Chemical Structure and Thermal Stability of Digestate-Based Biochar. Energies 2026, 19, 1043. [Google Scholar] [CrossRef]
Figure 1.
Block diagram of the experimental fixed-bed pyrolysis reactor: (a) cylinder with nitrogen gas; (b) gas mass flow meter; (c) the pyrolysis reactor vessel; (d) thermal insulation; (e) steam condensation system; (f) separation system-vessels for receiving condensate; (g) discharge of non-condensable gases in the gas washing system; (h) control box; (i) PC.
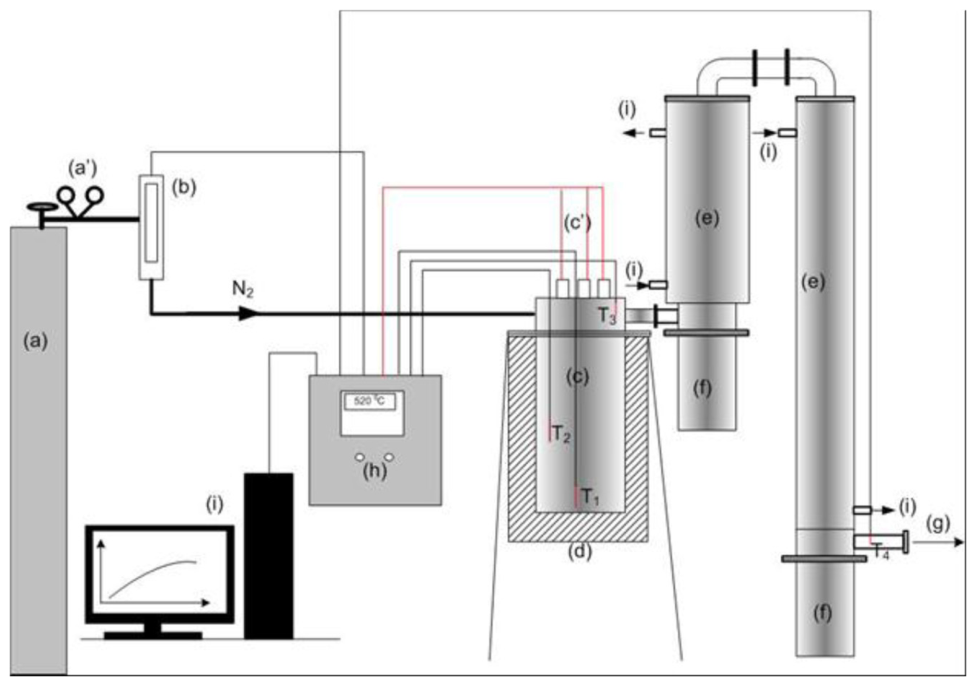
Figure 2.
Cross-section of the reactor: (a) single heating system (b) dual heating system. CH1 and CH2 indicate the bottom and middle sections of the reactor, respectively.
Figure 2.
Cross-section of the reactor: (a) single heating system (b) dual heating system. CH1 and CH2 indicate the bottom and middle sections of the reactor, respectively.
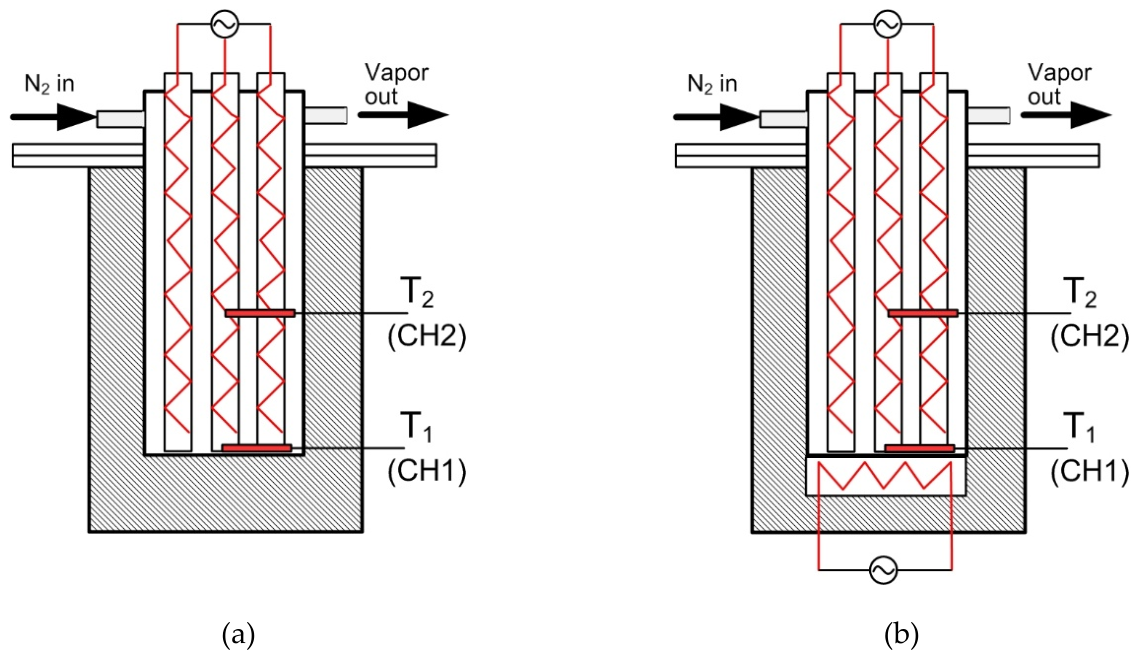
Figure 3.
LSD I-beams pairwise comparison of the average response values (significance level: α = 0.05).
Figure 3.
LSD I-beams pairwise comparison of the average response values (significance level: α = 0.05).
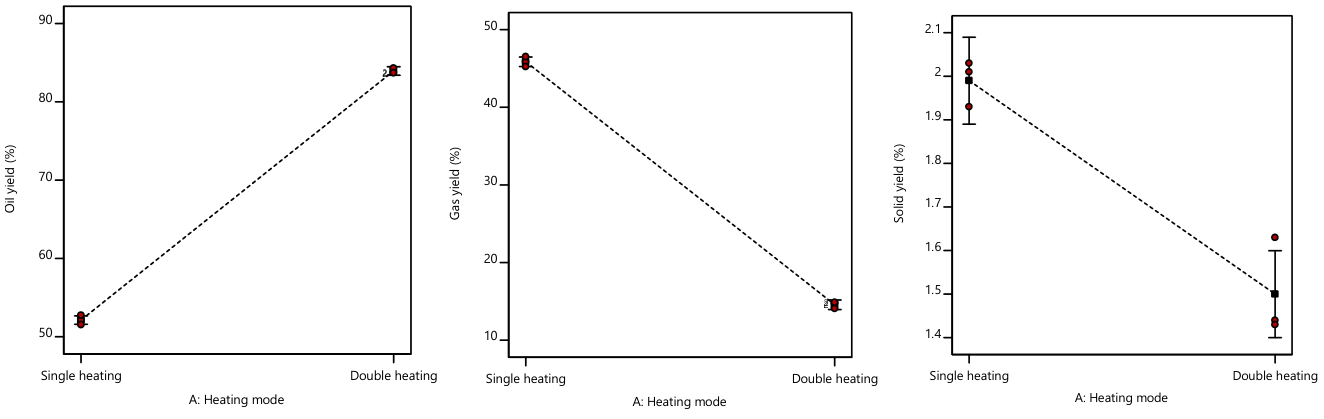
Figure 4.
Temperature changes in the bottom (CH1) and middle (CH2) sections of the reactor during single and dual heating modes.
Figure 4.
Temperature changes in the bottom (CH1) and middle (CH2) sections of the reactor during single and dual heating modes.
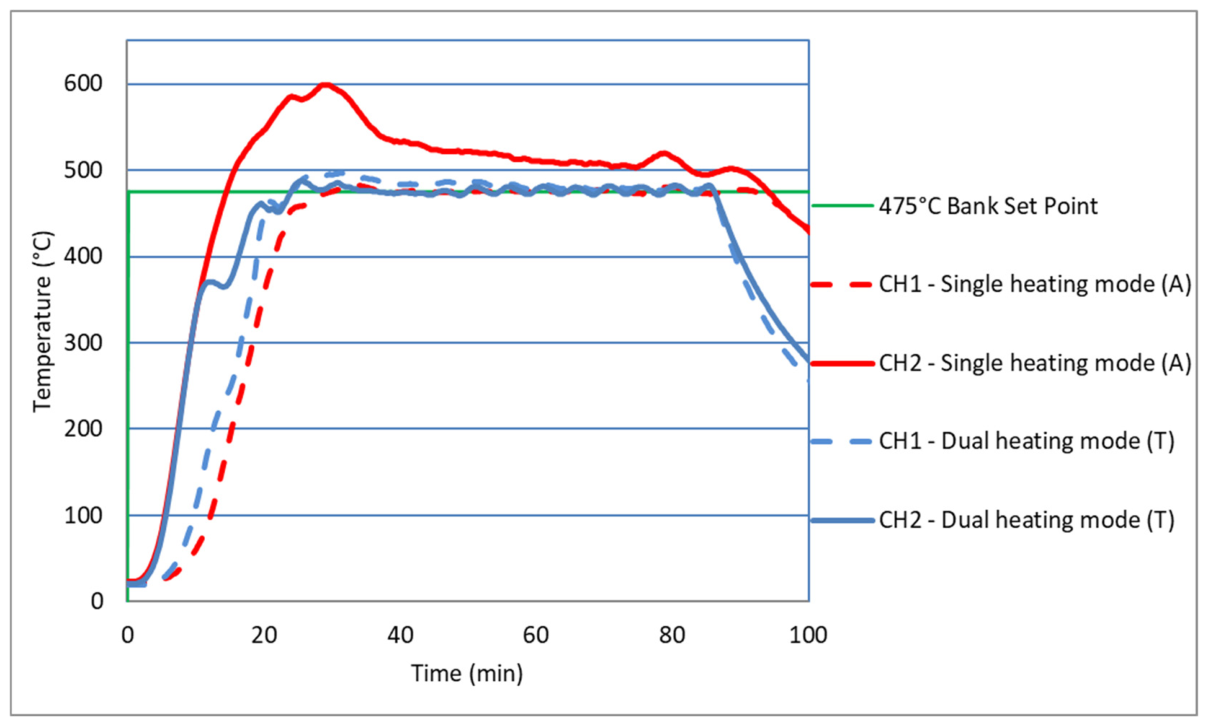
Figure 5.
ATR-FTIR spectra of pyrolysis oils obtained under (a) single-heating conditions (oil A) and (b) dual-heating conditions (oil T).
Figure 5.
ATR-FTIR spectra of pyrolysis oils obtained under (a) single-heating conditions (oil A) and (b) dual-heating conditions (oil T).
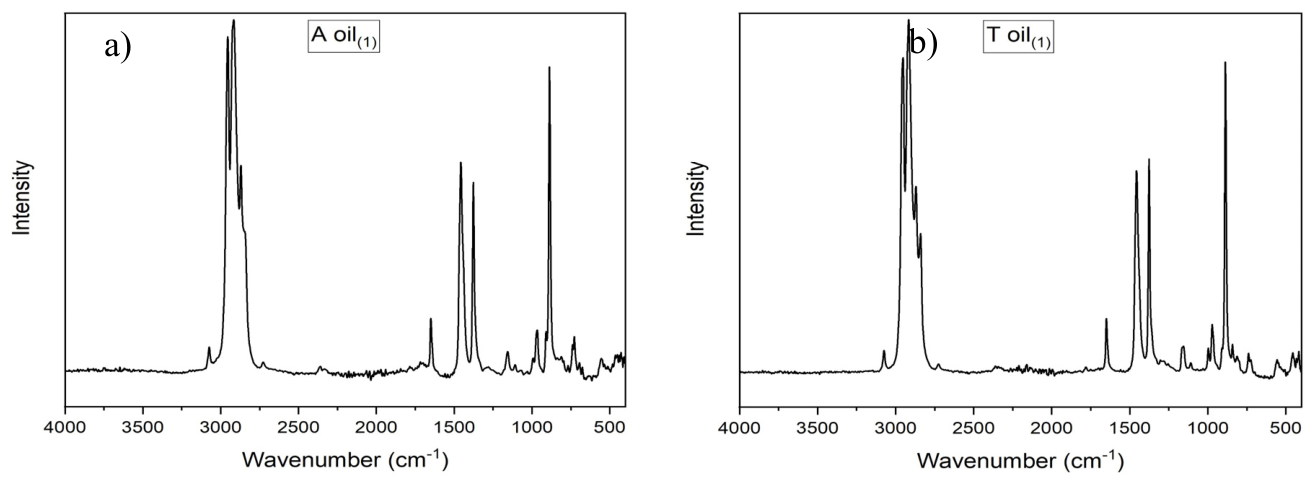
Figure 6.
¹H NMR spectra of pyrolysis oils obtained under (a) single-heating conditions (oil A) and (b) dual-heating conditions (oil T). CDCl3 was used as solvent and the residual solvent signal at 7.26 ppm was excluded from quantitative integration.
Figure 6.
¹H NMR spectra of pyrolysis oils obtained under (a) single-heating conditions (oil A) and (b) dual-heating conditions (oil T). CDCl3 was used as solvent and the residual solvent signal at 7.26 ppm was excluded from quantitative integration.
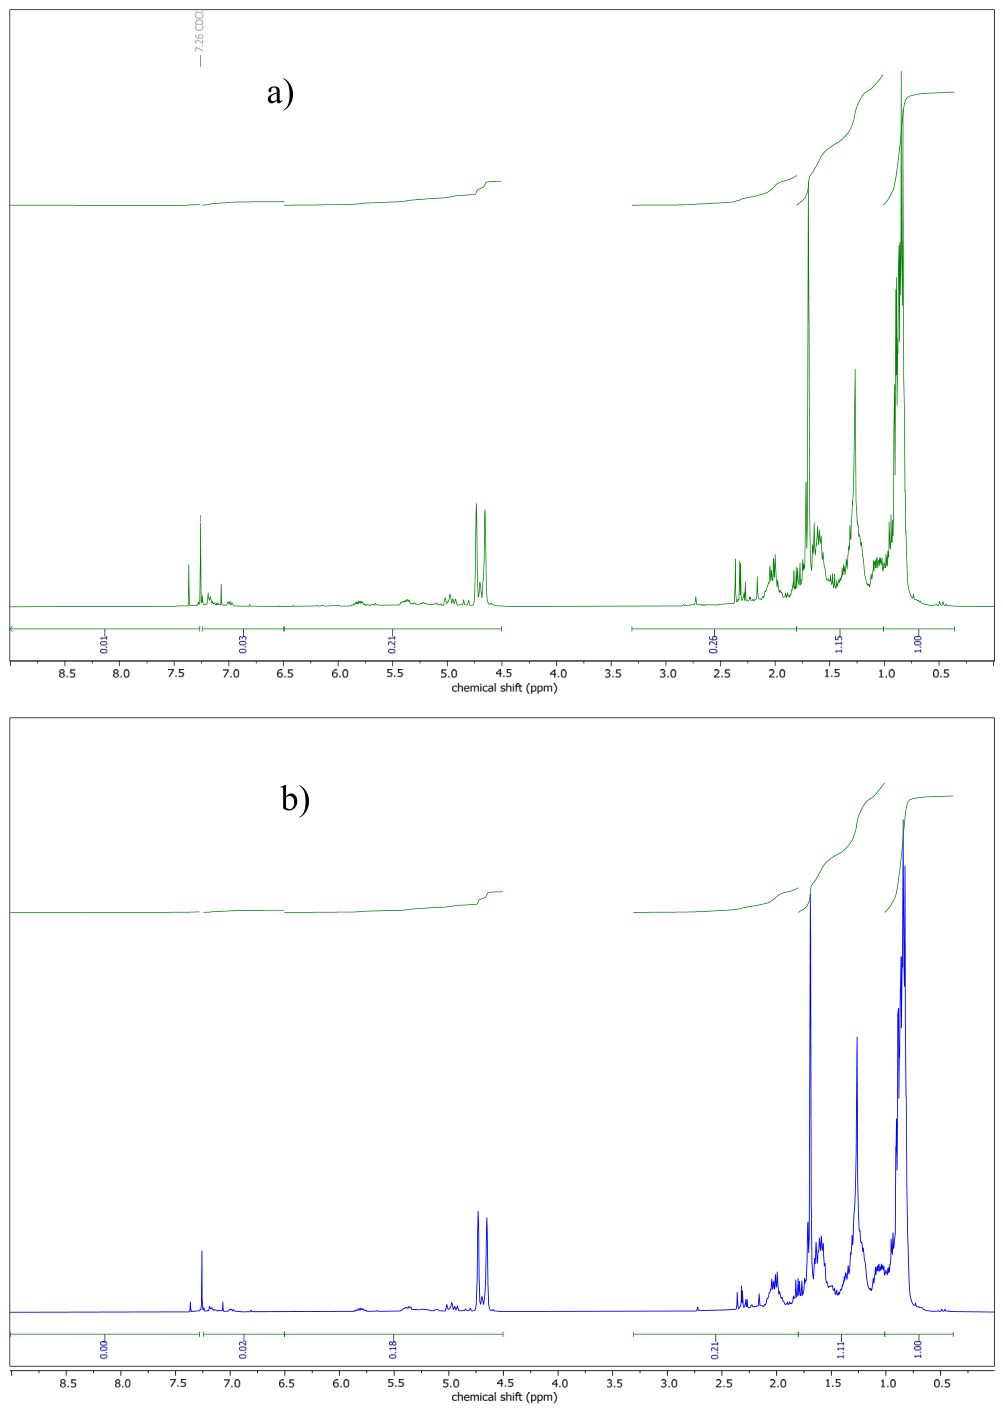

Table 1.
Statistical power of experimental design.
| Diff. to detect* | Est. Std. Dev.** | Delta/Sigma*** | Power**** | ||
|---|---|---|---|---|---|
| Responses | Units | Delta(“Signal”) | Sigma(“Noise”) | (Signal/Noise Ratio) | (for factors A) |
| Oil yield (R1) | % | 2.5 | 0.67 | 3.73134 | 91.9 |
| Gas yield (R2) | % | 2.5 | 0.46 | 5.43478 | 99.7 |
| Solid yield (R3) | % | 1 | 0.28 | 3.57143 | 89.7 |
* Diff. to Detect (Difference to Detect) or Delta “Signal” is the minimum change in the response considered large enough to be a practical change. ** Est. Std. Dev. (Estimated Standard Deviation) or Sigma “Noise” is an estimate for the run-to-run standard deviation of the response. *** The Delta/Sigma (Signal/Noise) ratio is used to determine the probability of detecting an effect. **** Power is reported at a 5.0% alpha level to detect the specified signal/noise ratio.
Table 2.
Yield of pyrolysis products (R1, R2, R3) with different heating modes of fixed-bed reactors.
Table 2.
Yield of pyrolysis products (R1, R2, R3) with different heating modes of fixed-bed reactors.
| Factor A | Response 1 | Response 2 | Response 3 |
|---|---|---|---|
| Heating mode | Oil yield (%) | Gas yield (%) | Solid yield (%) |
| Single heating | 52.11 | 45.86 | 2.03 |
| Single heating | 51.55 | 46.52 | 1.93 |
| Single heating | 52.75 | 45.24 | 2.01 |
| Arithmetic mean | 52.14 | 45.87 | 1.99 |
| Standard error | 0.2766 | 0.43137 | 0.0358 |
| Dual heating | 83.84 | 14.72 | 1.44 |
| Dual heating | 84.30 | 14.07 | 1.63 |
| Dual heating | 83.70 | 14.87 | 1.43 |
| Arithmetic mean | 83.95 | 14.55 | 1.50 |
| Standard error | 0.2766 | 0.3137 | 0.0508 |
Table 3.
ANOVA for selected factorial models (Factor A influence).
| Factor A | Response R1 | Response R2 | Response R3 |
|---|---|---|---|
| Sum of Squares | 1517.81 | 1471.41 | 0.3601 |
| Pure Error | 0.9181 | 1.18 | 0.0310 |
| Cor Total* | 1518.73 | 1472.59 | 0.3911 |
| Model F-value | 6612.61 | 4983.06 | 46.47 |
| p-value | <0.0001 | <0.0001 | 0.0024 |
*Corrected Total Sum of Squares.
Table 4.
Normalized ATR-FTIR indices for oils A and T. Each index is the integrated area of the indicated spectral region divided by the integrated 3100–2700 cm⁻¹ C–H reference area.
Table 4.
Normalized ATR-FTIR indices for oils A and T. Each index is the integrated area of the indicated spectral region divided by the integrated 3100–2700 cm⁻¹ C–H reference area.
| Region (cm⁻¹) | Main assignment | Oil A | Oil T | A → T trend |
|---|---|---|---|---|
| 1750–1680 | Carbonyl-containing species | 0.0064 | 0.0053 | slight decrease |
| 1680–1600 | C=C-containing / overlapping unsaturated region | 0.0250 | 0.0317 | increase |
| 1475–1430 | CH₂ / CH₃ deformation | 0.1647 | 0.1736 | slight increase |
| 1395–1365 | CH₃ symmetric bending | 0.0741 | 0.0885 | increase |
| 915–900 | Terminal olefins, RCH=CH₂ | 0.0142 | 0.0145 | unchanged |
| 892–882 | Terminal olefins, R₂C=CH₂ | 0.0706 | 0.0807 | increase |
| 870–650 | Fingerprint / out-of-plane region | 0.0463 | 0.0667 | increase |
Table 5.
¹H NMR proton distribution of oils A and T obtained by regional integration.
| ¹H region (ppm) | Assignment | Oil T (%) | Oil A (%) | Interpretation | |
|---|---|---|---|---|---|
| 0.4–1.0 | Aliphatic CH₃ | 43.5 | 37.6 | higher methyl contribution in T | |
| 1.0–1.8 | Aliphatic CH₂ / CH | 45.2 | 43.2 | slightly higher in T | |
| 1.8–3.3 | Deshielded aliphatic | 5.2 | 9.8 | markedly lower in T | |
| 4.5–6.5 | Olefinic protons | 6.1 | 7.9 | lower in T | |
| 6.5–9.0 | Aromatic protons | 0.0 | 1.5 | not quantifiable in T | |
| Total aliphatic (0.4–1.8 ppm) | 88.7 | 80.8 | higher in T | ||
| Deshielded + olefinic + aromatic | 11.3 | 19.2 | lower in T | ||
Table 6.
Individual elemental analysis determinations for oils A and T.
| Oil | Rep. | C (wt%) | H (wt%) | S | N | C+H (wt%) | 100−C−H | H/C | |
|---|---|---|---|---|---|---|---|---|---|
| A | 1 | 83.35 | 14.04 | ND | ND | 97.39 | 2.61 | 2.007 | |
| A | 2 | 73.47 | 12.65 | ND | ND | 86.12 | 13.88 | 2.052 | |
| A | 3 | 78.00 | 13.29 | ND | ND | 91.29 | 8.71 | 2.030 | |
| A | 4 | 82.24 | 13.70 | ND | ND | 95.95 | 4.05 | 1.985 | |
| T | 1 | 80.68 | 14.56 | ND | ND | 95.24 | 4.76 | 2.150 | |
| T | 2 | 79.56 | 14.20 | ND | ND | 93.75 | 6.25 | 2.126 | |
| T | 3 | 81.73 | 14.61 | ND | ND | 96.34 | 3.66 | 2.130 | |
ND = not detected. The 100−C−H column is an unassigned balance and must not be equated directly with oxygen content.
Table 7.
Descriptive elemental analysis summary for oils A and T.
| H/C mean ± SD | H mean ± SD (wt%) | C mean ± SD (wt%) | n | Oil |
|---|---|---|---|---|
| 2.019 ± 0.029 | 13.42 ± 0.60 | 79.27 ± 4.50 | 4 | A |
| 2.135 ± 0.013 | 14.45 ± 0.22 | 80.66 ± 1.09 | 3 | T |
Disclaimer/Publisher’s Note: The statements, opinions and data contained in all publications are solely those of the individual author(s) and contributor(s) and not of MDPI and/or the editor(s). MDPI and/or the editor(s) disclaim responsibility for any injury to people or property resulting from any ideas, methods, instructions or products referred to in the content. |
© 2026 by the authors. Licensee MDPI, Basel, Switzerland. This article is an open access article distributed under the terms and conditions of the Creative Commons Attribution (CC BY) license.
Copyright: This open access article is published under a Creative Commons CC BY 4.0 license, which permit the free download, distribution, and reuse, provided that the author and preprint are cited in any reuse.