Preprint
Article

This version is not peer-reviewed.

Exploring Toxoplasma gondii Allelic and Haplotypic Diversity in Wildlife from Panama Using the Alt. SAG2, GRA6, and Apico Markers

Submitted:

01 October 2026

Posted:

05 October 2026

You are already at the latest version

Abstract

Background: Panama is recognized as a global biodiversity hotspot; however, little is known about the genetic diversity patterns of Toxoplasma gondii in wildlife. This exploratory study evaluated the allelic and haplotypic diversity of the Alt. SAG2, GRA6, and Apico markers using wildlife tissue samples; additionally, it compared the genealogical relationships between the identified variants and a defined panel of reference sequences. Methods: Three cloned amplicons per tissue and locus were analyzed by bidirectional Sanger sequencing from 18 tissue samples collected from 13 wild animals. Locus-specific sequence relationships were examined using alignments, NeighborNet networks, and unrooted Neighbor-Joining trees based on p-distances. Results: A total of 162 clone sequences were generated, comprising 54 sequences for each locus. Alt.SAG2 variants clustered with reference alleles associated with T. gondii types II and III, whereas GRA6 variants clustered with reference alleles associated with type I, II, and III. The analyzed Apico fragment showed limited resolution among the three reference groups. Multiple sequence variants were recovered from some tissue-derived clone sets. Conclusions: The genetic variation detected in Panamanian wildlife comprises a heterogeneous set of T. gondii sequence variants associated with archetypal clonal variants and with sequence variants described in geographically distant regions. These findings suggest that the allelic variation present in the analyzed wildlife is not restricted to the regional context but is part of a broader pattern of T. gondii diversity in the Neotropics.

Keywords: 
;  ;  ;  ;  ;  ;  

1. Introduction

Toxoplasma gondii is one of the most widespread, successful and evolved parasites worldwide [1]. It can infect a wide range of vertebrate hosts and multiply in almost any nucleated cell of warm-blooded animals [2,3]. A recent study estimated the global prevalence of T. gondii in wildlife at 22% [4]. In Panama, this prevalence ranged from 58.94% to 71.85%, including bird, mammal, and reptile species [5]. Recent advances in the genetic characterization of T. gondii have revealed that the parasite exhibits greater genetic diversity, especially in regions such as South and Central America, Africa, and Asia, compared to countries located in the northernmost part of the Northern Hemisphere, where diversity is lower [6,7,8,9,10,11]. In French Guiana, strains of T. gondii with greater genetic diversity have been reported to cause severe pathologies in immunocompetent patients. These infections occurred in neotropical rainforest areas, likely due to the consumption of undercooked food, hunting wild animals, and ingestion of untreated river water [12]. In Brazil, a high rate of genetic cross-breeding between different T. gondii genotypes currently circulating in humans and poultry has also been observed [13,14,15]. On the other hand, it has been possible to genotype a large number of T. gondii isolates worldwide through multilocus analysis using the PCR-RFLP and microsatellite techniques [6,16]. This characterization made it possible to compare the genetic variability and distinguish between clonal and non-clonal isolates, to determine the most frequent genotypes in different regions of the world and to classify the isolates within the three main clonal lineages of T. gondii (I, II and III). For example, type I, II and III lineages appear to be widely distributed across all continents, but are most frequently observed in Europe, America, and Africa [6,16,17,18]. The allelic composition of the T. gondii population reported in Panama appears to be formed mainly of the ancestral alleles I, II, III, and Amazonian [6,19]. A recent genomic analysis of a Panamanian T. gondii strain isolated from a wild pigeon (Columbina talpacoti) revealed the presence of alleles I, II, III, and Amazonian; the latter showed a broad genomic distribution across eight of the thirteen chromosomes analyze.[19]. In a study on the genetic diversity of T. gondii and its geographic patterns, it was revealed that Genotype #2 (classified as type III) was one of the most frequent in Panama, Peru, and Granada [6]. However, a recent study on the genetic variability of T. gondii carried out on eighteen tissue samples from wild animals in Panama using the PCR-RFLP technique with five genes (SAG1, Alt. SAG2, SAG3, GRA6 and Apico) showed the presence of non-archetypal strains of T. gondii, composed mainly of alleles I and II. Interestingly, allele III was only identified in the APICO gene in two different tissues samples (heart and lung) from a reptile. Unfortunately, the Amazonian allele was not examined in that study [5]. The findings indicated that individuals that make up the T. gondii population and that circulate in the wild cycle have probably undergone multiple genetic crossings over time. It was also observed that two different tissues (liver and brain) extracted from the same animal revealed the presence of mixed infections with two different non-archetypal strains [5]. In Panama, the prevalence of T. gondii in humans and domestic animals is quite high. The latest epidemiological reports from the provinces of Panama and West Panama on the frequency of T. gondii infection in pregnant women showed a percentage of 44.41%, with an estimated incidence of 3.8 cases per thousand live births [20]. Other studies conducted only in the province of Panama on dogs and cats, both stray and pet, reported percentages of 23.73% and 30.73%, respectively [21,22]. High positivity rates (32.1%) were also reported in pork from different provinces of Panama [23]. The high frequencies of T. gondii infection observed in these different hosts reflect high environmental and food contamination by this parasite. These facts, together with the cases of congenital toxoplasmosis reported so far, highlight the need to understand the allelic variants that make up T. gondii population circulating in the wild and domestic cycle. The data presented in this study describe sequence variation in the Alt.SAG2, GRA6, and Apico markers within the T. gondii DNA detected in wildlife tissue samples from the Panama Canal Zone. Therefore, this study aimed to: (i) characterize the sequence variants of the Alt.SAG2, GRA6, and Apico markers; and (ii) compare the identified variants with a defined panel of reference sequences from different geographic regions.

2. Materials and Methods

2.1. Permission to Access Resources

This study was carried out with the permission and authorization of the Directorate of Protected Areas and Biodiversity of the Ministry of the Environment (SC/A-7-2020) for access to biological resources and the collection of samples in the Summit Municipal Park.

2.2. Geographic Regions Studied

The tissue samples analyzed in this study were obtained from thirteen wild animals that came from five forested regions located around the Panama Canal Zone and between the provinces of Panama, West Panama and Colón. These regions are called: Gatun Lake (GL), Camino de Cruces Natural Park (NPCC), Soberania Natural Park (SNP), Arraijan Protective Forest (APF) and Metropolitan Natural Park (PNM) (Figure 1). These animals were transferred to the Summit Municipal Park Zoo either because they were rescued or because they were convalescent. Those animals that cannot return to the wild are kept in the park under the care of veterinarians and animal welfare professionals until natural death. Most of the analyzed animals died within a few hours of being admitted to the zoo due to severe injuries caused by being hit by vehicles. Some birds died within a few days (3 or 4 days) because of collisions with windows, vehicles, and other structures.

2.3. Sample Collection

A total of eighteen tissue samples were collected from thirteen different wild animals at the Summit Municipal Park Zoo (Table 1). The samples were taken during the necropsy processes routinely performed on wild animals that have died naturally. The necropsies were performed by veterinary medical personnel on different days of the week, and in the case of more than one necropsy per day, these were performed on different worktables to avoid any type of cross contamination. Veterinary medical personnel from the park performed the necropsies and extracted approximately 20 mg of brain, liver, heart, lung, eyes and skeletal muscle for each sample, which were placed in an Eppendorf tube with 2ml of 95% ethanol and stored at -20ºC until further analysis.

2.4. DNA Extraction and Quantification

Tissue samples from different organs of wild animals were cut into 10 mg pieces. Subsequently, DNA extraction was performed using the commercial QIAGEN kit (Puregene Cell and Tissue Kit, Maryland, USA). The procedure was carried out following the methodology described in the manufacturer’s protocol. The DNAs were eluted in 100 μl of hydration solution and subsequently stored at 4ºC. After 24 hours, the DNA samples were quantified in a NanoDrop model 2000 (Thermo Scientific –Wilmington, USA) to obtain nucleic acid concentrations in nanograms per microliter (ng/μl).

2.5. Amplification and Purification of the Alt. SAG2, GRA6 and Apico Fragments of T. gondii

Each of the gene fragments (alt. SAG2 and GRA6) and the Apico marker were individually amplified by PCR and not by multiplex PCR. In each PCR, the primers and conditions previously described by several authors were used (Table 2) [24,25,26]. It is important to emphasize that the amplified regions correspond to the fragments widely used in the genotyping of T. gondii strains, which concentrate the canonical polymorphisms capable of defining T. gondii lineages [6,27]. The amplified fragment sizes for alt. SAG2, GRA6 and Apico were 546, 344 and 640 base pairs respectively (Table 2). The amplified PCR products for each molecular marker were subjected to electrophoresis separation and band purification techniques using the Wizard® SV Gel kit and PCR Clean-Up System (Madison, USA) according to the manufacturer’s instructions. The PCR products were cut based on the expected band size for each molecular marker.

2.6. Cloning and Sequencing of the Alt. SAG2, GRA6, and Apico Fragments of T. gondii

Purified PCR products for each of the genes were subjected to ligation processes using the pGEM®-T Easy Vector Systems cloning kit (Madison, USA). Briefly, the T4 ligation enzyme was used to optimize the ligation of the fragments, which were incubated overnight at 4ºC. Each of the ligation products was transformed using competent E. coli DH5α cells. The transformation procedure was carried out using thermal shock according to the manufacturer's instructions. The final product of the transformation was placed and spread in Petri dishes with LB agar and incubated at 37ºC for 16 hours. Subsequently, three colonies were randomly selected and placed in a tube with liquid LB medium and incubated for 16 hours at a temperature of 37ºC in a shaker. Then, the tubes were centrifuged, and the resulting pellet was subjected to purification processes using the Wizard® Plus Minipreps DNA Purification System (Madison, USA) to extract plasmid DNA. All purification processes were carried out according to the manufacturer's specifications. Selected clones were analyzed by bidirectional Sanger sequencing using a 3730x1 DNA Analyzer. Chromatograms were inspected in Geneious Prime 2023.2.

2.7. Genealogy and Genetic Distance, of the Alt. SAG2, GRA6, and Apico Fragments of T. gondii

An exhaustive search for homologous fragments for the Alt. SAG2 and GRA6 genes, and Apico marker was performed using BLAST in the NCBI, ToxoDB and ENA databases, as well as in the genomes deposited by Lokman Galal et al., (2022) [19]. The Panamanian sequences generated in this study were used as queries to retrieve sequences from these databases. Subsequently, the sequences from each fragment of the Alt. SAG2, GRA6, and Apico markers were aligned using the programs MEGA v.11, GeneDoc v.2.7, and Clustal 2 v2.1 software. Each alignment included approximately forty-four reference sequences from strains representative of the global diversity of T. gondii and all the Panamanian sequences generated in this study (Supplementary Table 1 and Table 2).
The genealogical relationships between the obtained sequences were inferred through Network analyses using the Splitstree v4.11.3 software [28]. This analysis included all Panamanian sequences generated in this study and reference sequences representative of the global diversity of T. gondii (Supplementary Table 1 and Table 2). The resulting network illustrates both cladistic and reticulate relationships among taxes. The reliability and robustness of the topology of the trees were estimated through bootstrap values, where 1000 tree replicas were used with the same parameters optimized by the Neighbor-net method. We reconstructed the phylogenetic tree using the Neighbor-Joining (NJ) method within the MEGA11 software [29]. We calculated evolutionary distances using the p-distance model. This model included both transitions and transversions. We applied the pairwise deletion option to handle gaps and missing data in the alignment. We assessed the statistical support for the phylogenetic tree topology by conducting a bootstrap analysis with 500 replicates. The analysis incorporated all codon positions, including the first, second and third positions, as well as noncoding sites. We assumed uniform rates among sites and a homogeneous evolutionary pattern among lineages. The Panamanian sequences obtained in this study were deposited in the gene bank of the National Center for Biotechnology Information (NCBI) (Supplementary Table 2).
In addition, a comparative alignment was performed for each fragment (Alt. SAG2 and GRA6) and Apico marker. Each alignment included reference sequences and were compared with the Panamanian sequences (Supplementary Figure 1, Figure 2 and Figure 3). Redundant sequences were removed, and a unique representation of each Panamanian sequence was maintained in the polymorphism analysis. The consensus sequence was inferred using phylogenetic reconstruction (maximum parsimony method). An ancestral reference sequence was selected from a set of reference sequences representing part of the global diversity of T. gondii haplotypes; representative strains from ancestral lineages I, II, III, Amazonian, Africa 1, Africa 3 y Africa 4 and relevant atypical genotypes from French Guiana, Brazil, Colombia, Uruguay, United State (Type 12), and Martinique (Caribbean 1, 2, and 3) (Supplementary Table 1) [19].

2.8. Statistical Analysis to Determine the Frequency of Allelic Detection and the Haplotypic and Nucleotidic Diversity of Alt. SAG2, GRA6 and Apico Markers of T. gondii

Allele detection frequencies for the thirteen sampled wild animals were estimated based on the presence of each identified allele for the SAG2, GRA6, and Apico markers. Sequences were aligned, and polymorphism and network analyses were performed to define the alleles; reference sequences representing part of the global diversity of T. gondii were also included (Supplementary Table 1). Since it was possible to obtain multiple cloned sequences from a single tissue and analyze various tissues from the same animal, the animal was considered the biological unit for estimating allele detection frequency; consequently, the repeated detection of the same allele in different clones or tissues from the same animal was counted only once (Table 3 and Supplementary Table 3). The detection frequency for each allele was calculated by dividing the number of animals in which the allele was detected by the total number of sampled animals (n = 13) and expressing the result as a percentage. Detection frequencies ranged from 7.69% (1/13 animals) to 100% (13/13 animals). Given that a single animal could harbor more than one allele for a specific marker, the sum of the allele detection frequencies was not expected to equal 100% (Table 3).
Haplotype and nucleotide diversity were calculated independently for each marker using the full aligned fragment available for each (Alt. SAG2, GRA6, and Apico). The DnaSP v6 software [30] was used to estimate haplotype diversity (Hd); the 54 sequences analyzed for each marker were compared across the entire aligned fragment. Sequences with identical nucleotide sequences within the analyzed fragment were considered a single haplotype, whereas those differing at one or more nucleotide positions were considered distinct haplotypes. The number of observed haplotypes (H) and the number of segregating sites (S) were determined for each marker. Haplotype diversity (Hd) was estimated as the probability that two randomly selected sequences would exhibit different haplotypes, using the estimator corrected for finite sample sizes proposed by Nei and Tajima (1981) [31].
Nucleotide diversity for each marker was estimated using MEGA 12.1, based on the number of nucleotide differences in all possible pairwise comparisons between sequences, and the mean number of nucleotide differences per pair (k) was calculated. Subsequently, nucleotide diversity (π) was estimated as the average number of nucleotide differences per site across all pairwise sequence comparisons, following Nei and Tajima (1981) [31]. Thus, π was calculated by dividing the mean number of nucleotide differences per pair (k) by the length of the aligned fragment for each marker. Given that the analyzed fragments differed in length (Alt. SAG2 = 471 bp, GRA6 = 285 bp, and Apico = 598 bp), this normalization expresses nucleotide diversity per site and allows for the comparison of relative levels of nucleotide variation across markers, regardless of differences in fragment length.

3. Results

3.1. Description of the Number of Sequences Analysed

In this study, a total of 162 sequences were generated corresponding to the three molecular markers analyzed (SAG2, GRA6, and Apico). For each marker, 54 sequences were obtained from tissue samples taken from thirteen wild animals infected with T. gondii (Table 1). The samples originated from thirteen different wild animal (including birds, mammals, and reptiles) inhabiting five distinct forests adjacent to the Panama Canal Zone (Figure 1). Since three clones per tissue were sequenced to capture intra-tissue heterogeneity, all allelic summaries presented here correspond to sequence-level counts based on the total of 162 sequences (54 per locus).

3.2. Genealogical Relationships and Genetic Distance Between Panamanian Variants and Reference Variants of Toxoplasma gondii for the Alt. SAG2, GRA6, and Apico Genes

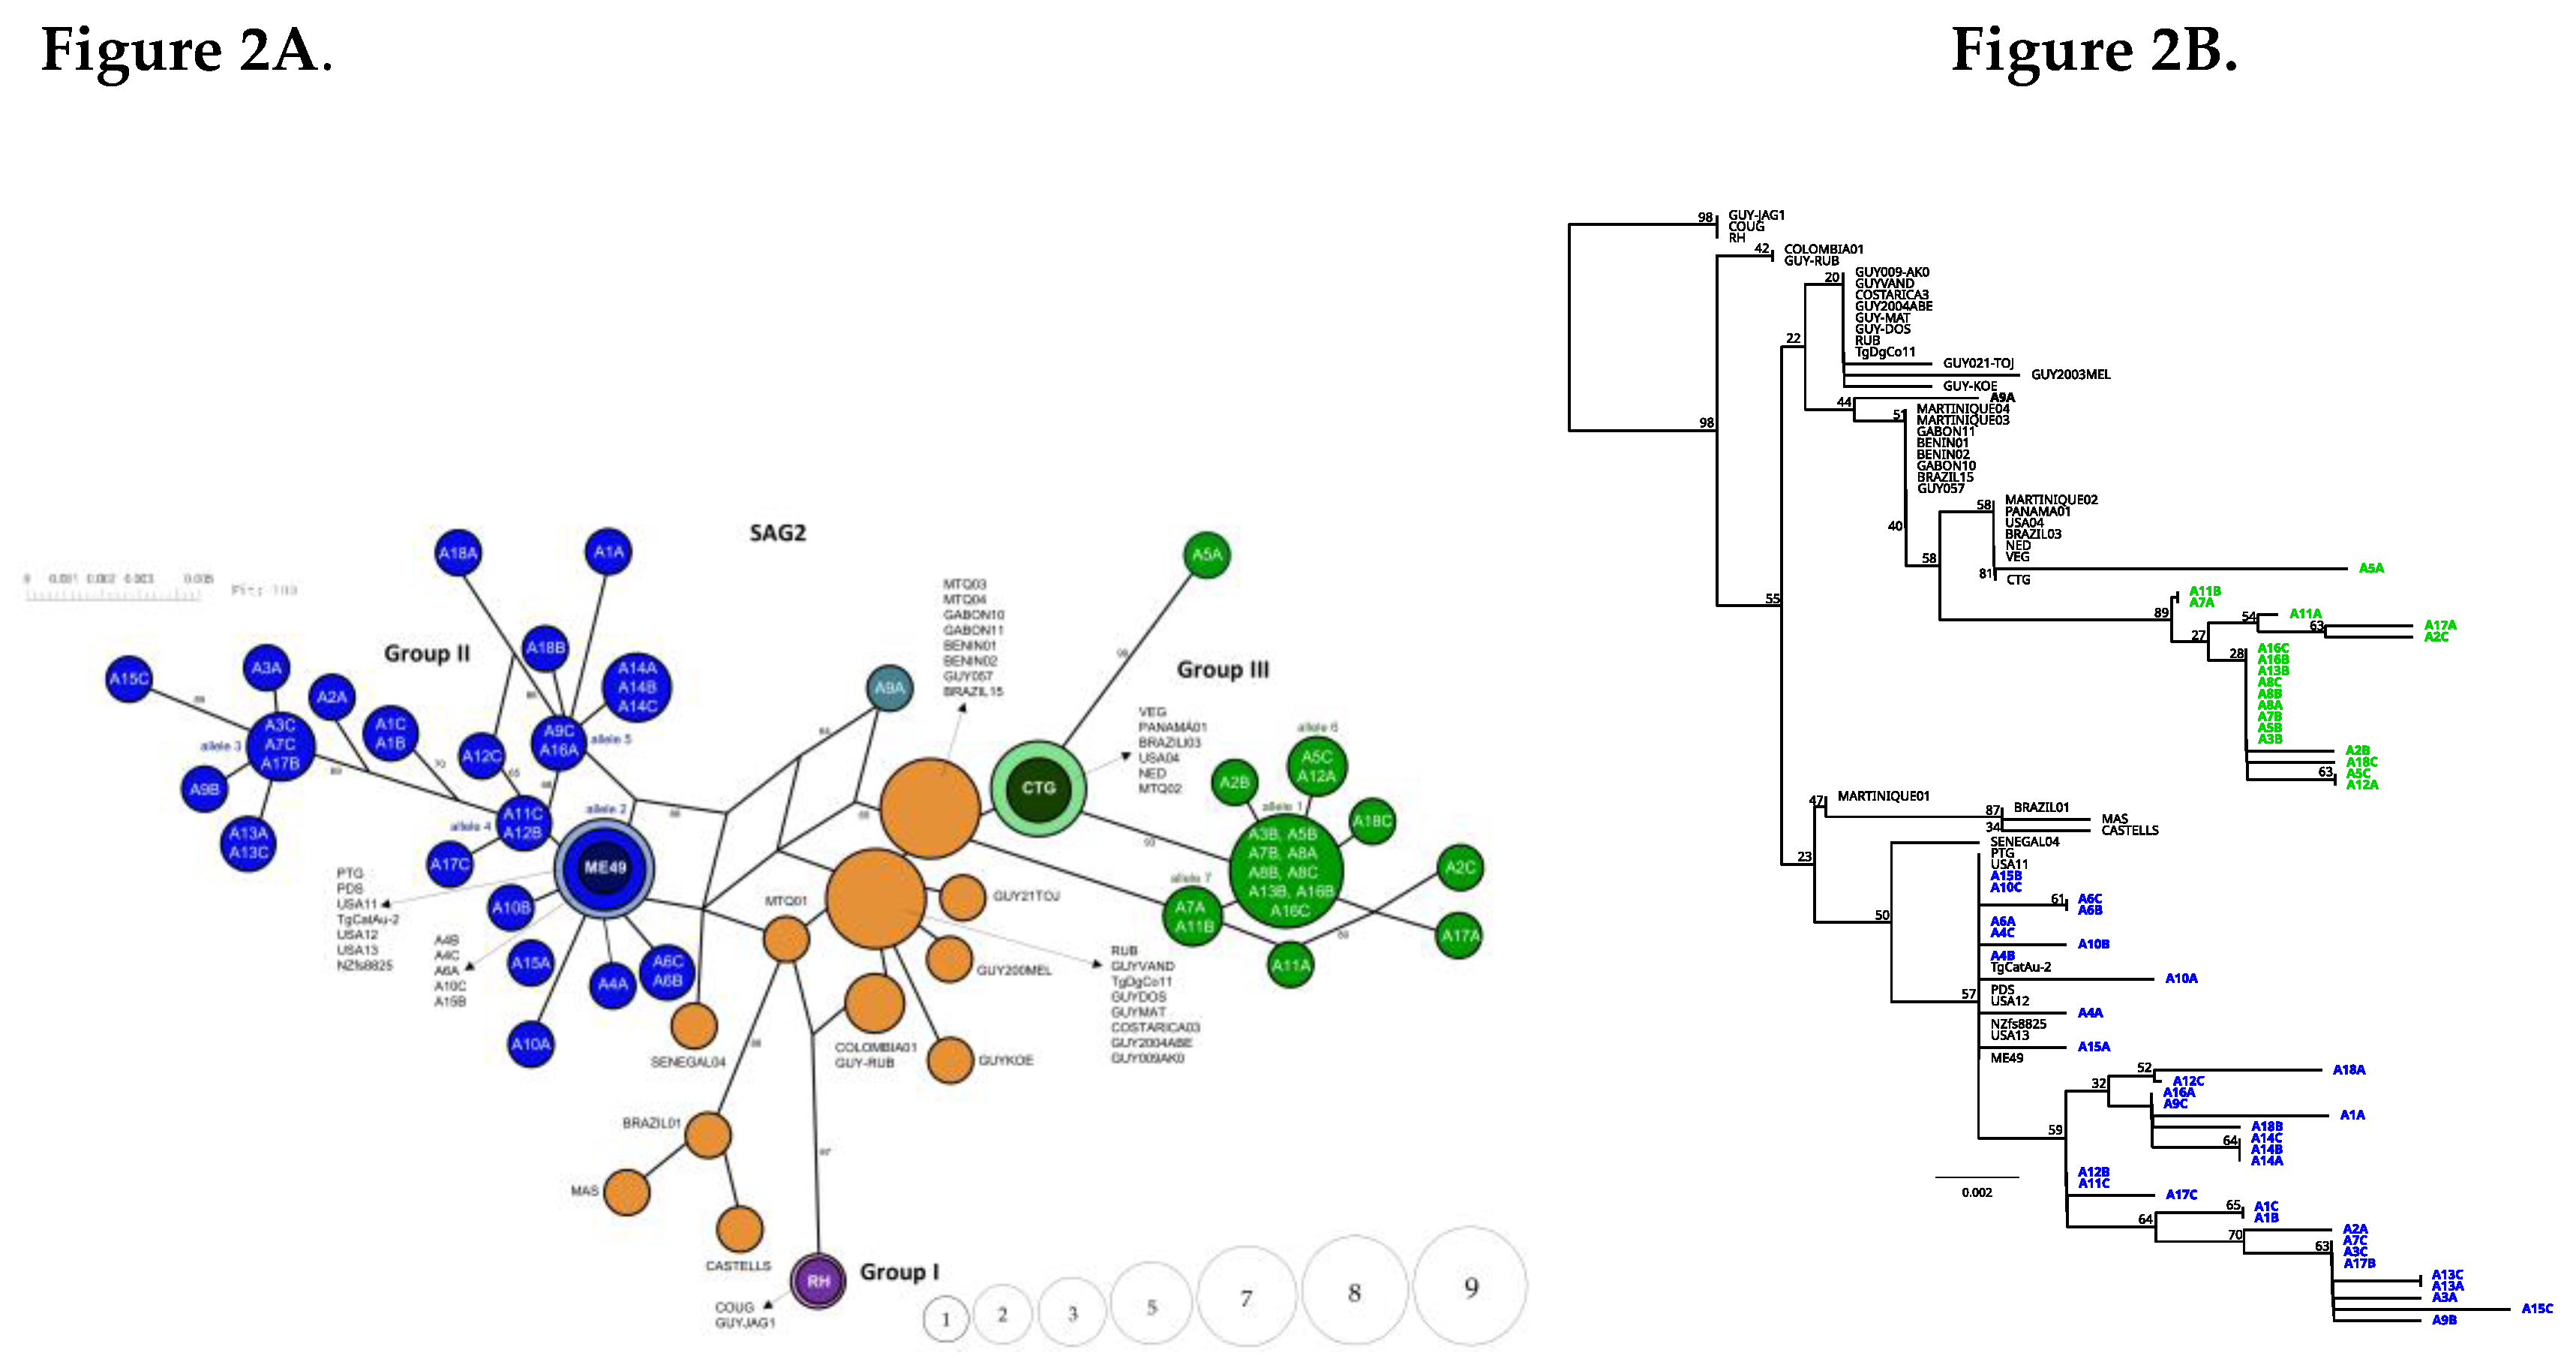
Network analysis based on the Alt SAG2 marker revealed the formation of two well-defined groups for the Panamanian alleles (Figure 2A). The larger group consisted of twenty-one alleles that clustered with the archetypal T. gondii type II allele (ME49); of these, only one allele comprising five sequences (A4B, A4C, A6A, A10C, A15B) was identical to the representative sequences of the type II archetype (ME49) and to other reference sequences (PTG, PDS, USA11, TgCatAu-2, USA12, USA13, and NZfs8825) obtained from various databases (Supplementary Table 1). This allele was located in the most central or inner zone of the network analysis . The rest of the Panamanian sequences were positioned at the most terminal nodes of the branch, showing a clear divergence with the most internal haplotype. Details regarding the sequences that make up each allele are shown in (Supplementary Table 3). On the other hand, nine Panamanian alleles clustered with the archetypal type III allele (CTG) and reference sequences (VEG, Panama01, Brazil03, USA04, NED and MTQ02) (Figure 2A). However, none of the Panamanian sequences generated in this study were identical to the corresponding reference alleles. The Panama01 reference sequence retrieved from the databases was the only sequence from Panama that was identical to the archetype alleles for type III, however, this sequence was not generated in this study. Almost all Panamanian sequences of this group were positioned at the periphery of the network. Remarkably, the A9A sequence was positioned in a separate branch of the network with a clear divergence from the other groups. This sequence was located at the most internal position observed in the network even more central than the reference sequences (Figure 2A). On the other hand, the reference sequences MTQ03, MTQ04, GABON 10, GABON 11, BENIN 01, BENIN 02, GUY057, BRAZIL 15 and RUB, GUYVAND, TgDgCo11, GUYDOS, GUYMAT, COSTARICA03, GUY2004ABE, GUY009AKO; formed two well-defined groups and showed a separation of the sequences that make up Group III, positioning themselves in the innermost part of the network (Figure 2A). The Martinique 01 (MTQ01) sequence was also positioned in the innermost part of the network, between the atypical groups and Group II. These analyses also included other atypical sequences from French Guiana, Colombia, Brazil and Africa; which located in the peripheral positions (Figure 2A). No Panamanian sequences clustered with the reference sequence for allele I were observed (Figura 2A).
Distance analyses, which included reference sequences representative of a portion of the global diversity of T. gondii, also showed that the majority of the Panamanian sequences were more closely related to reference sequences of archetypal alleles II and III than to sequences from Allele I, the Amazonian, Africa 1 and 3, South American atypical (French Guiana, Colombia, and Brazil), and Caribbean groups, or the United States Type 12 genotype (Figure 2B).
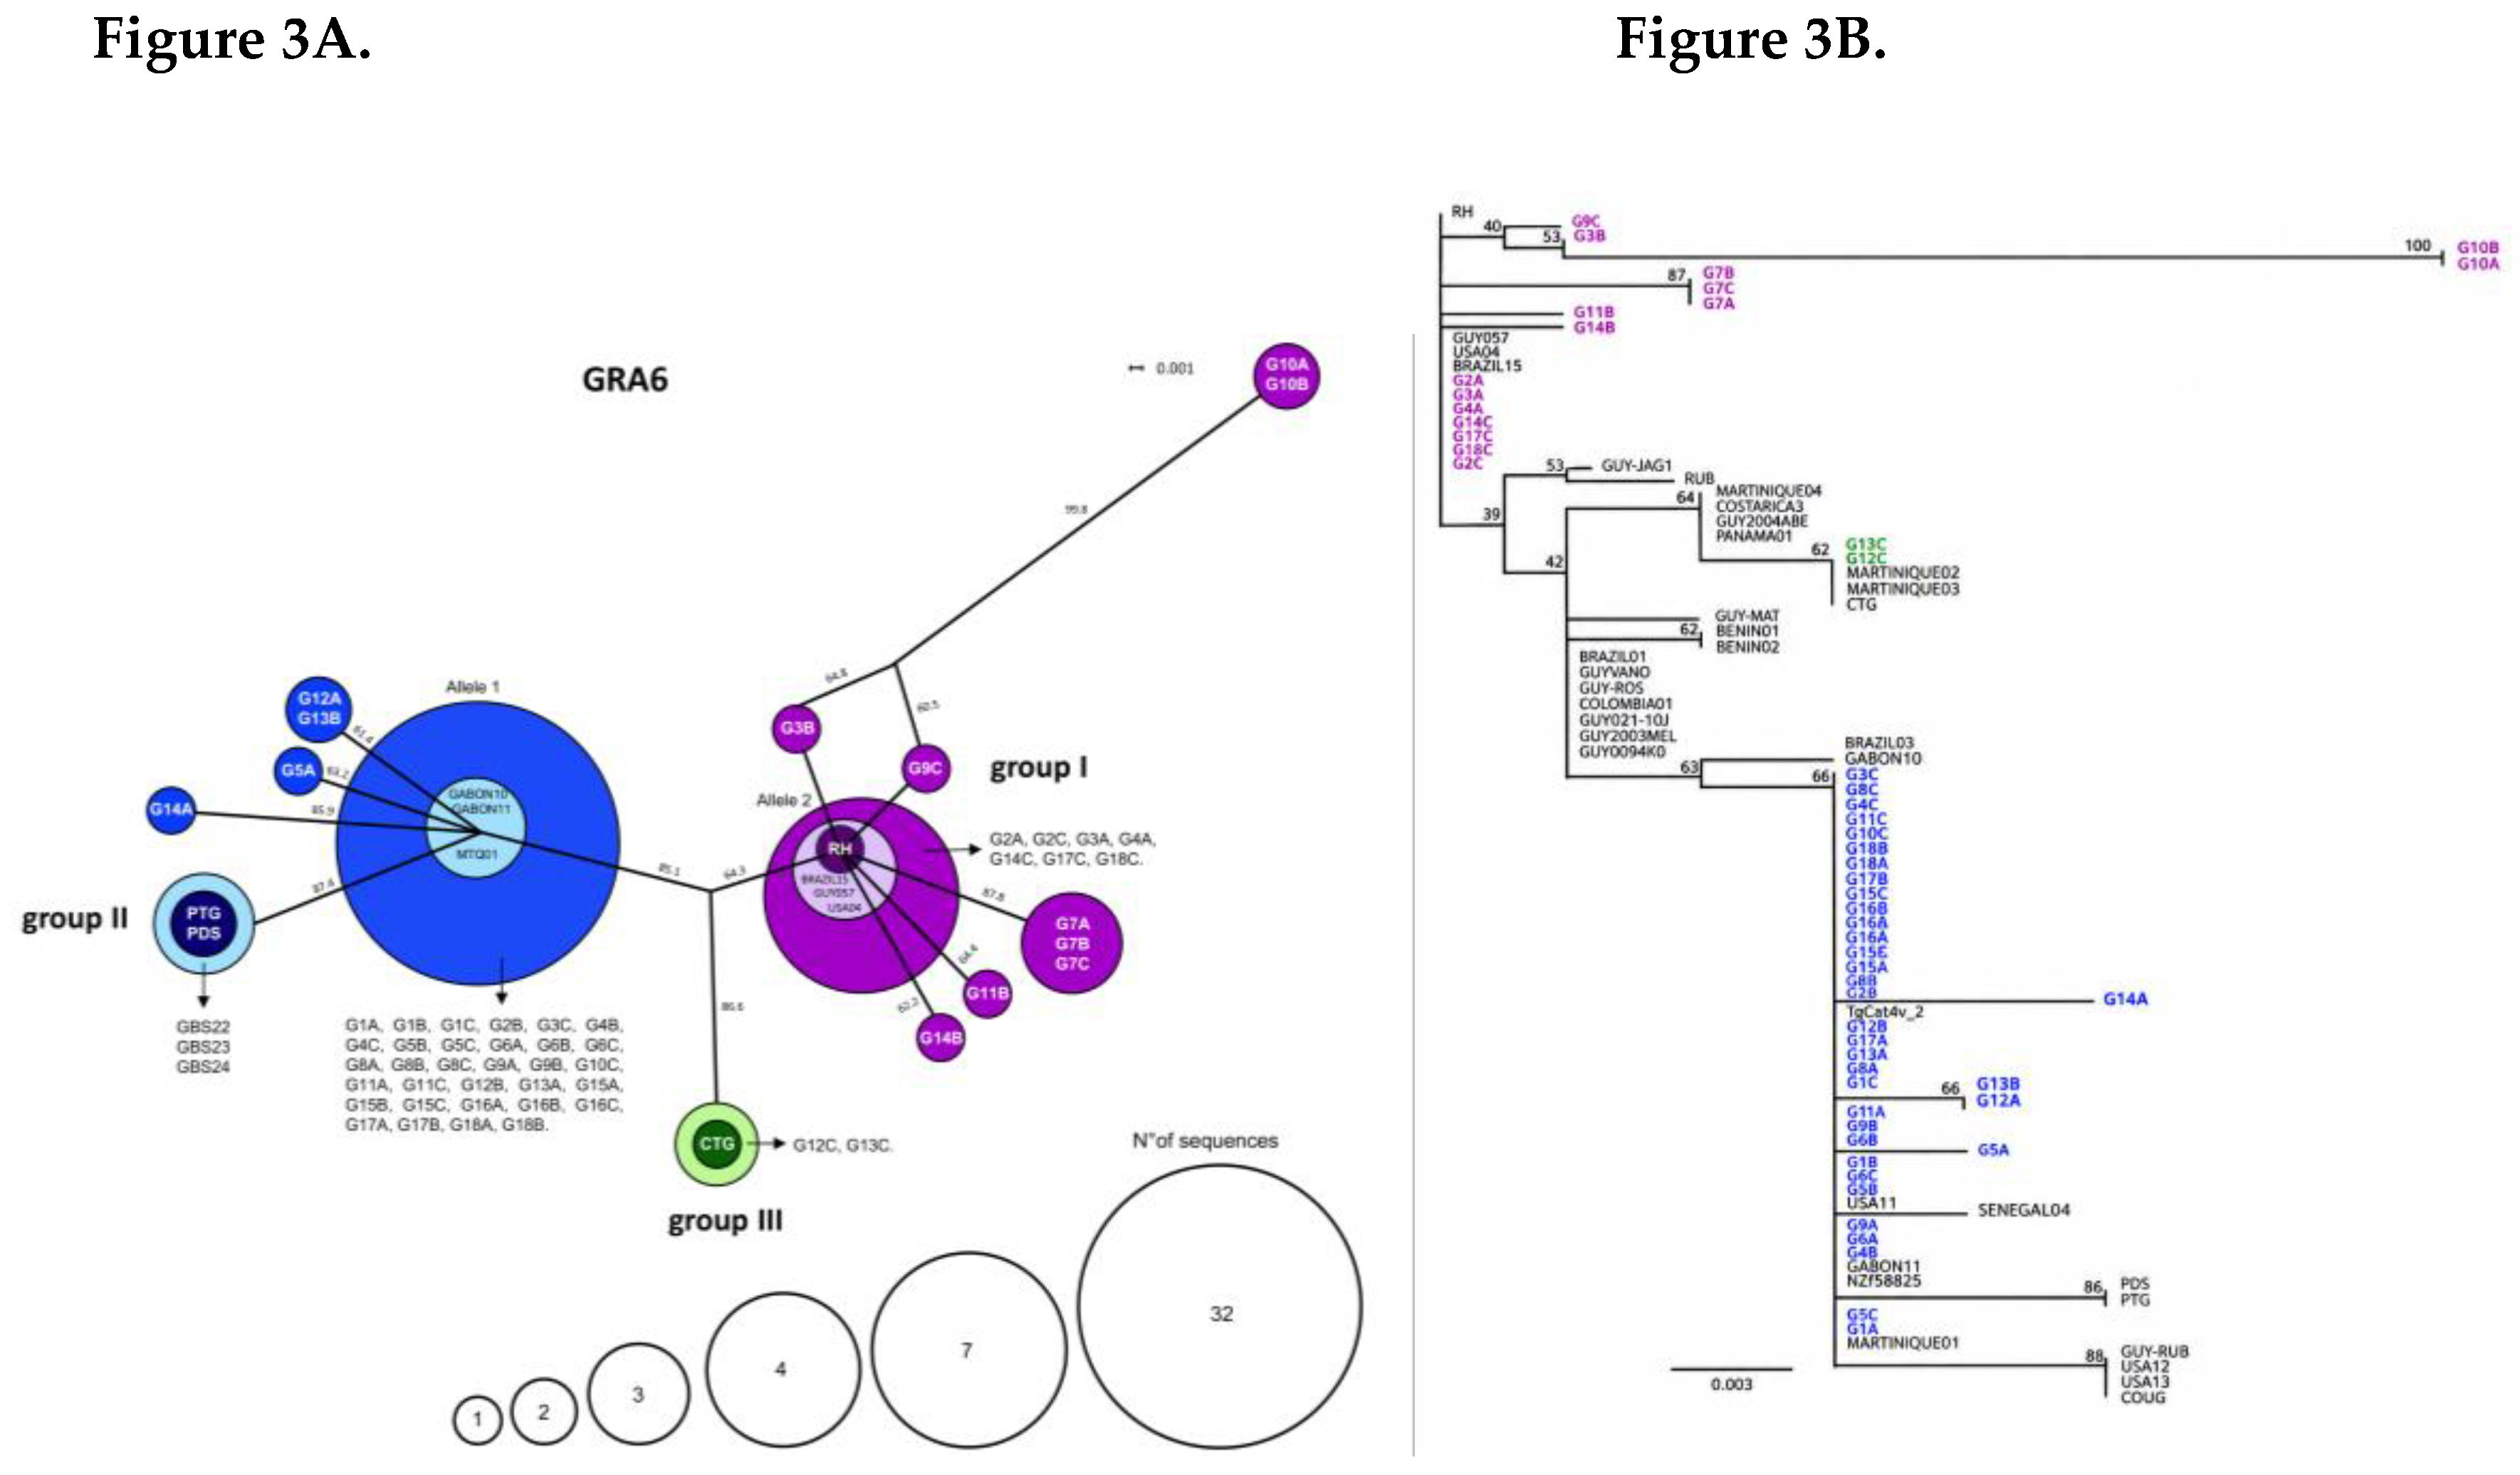
Network analysis based on the GRA6 marker revealed twelve alleles, seven of which clustered with the reference sequences representing the archetypal type I (RH) allele. One of these alleles, corresponding to one of the most abundant haplotypes, comprised seven Panamanian sequences (G2A, G2C, G3A, G4A, G14C, G17C y G18C) that were identical to the RH reference sequence as well as to reference sequences from Brazil (Brazil 15), French Guiana (GUY057), and the United States (USA04). This allele occupied a central position within the network, whereas the remaining six alleles diverged from it and were distributed toward the periphery of the network. A considerable number of Panamanian sequences (n = 32) clustered with reference sequences from strains previously classified as type II (Martinique 01) and Africa 3 (Gabon10 and Gabon11) (Figure 3A and Supplementary Table 1). This was the most abundant haplotype identified in the network analysis, from which four distinct alleles diverged. One of these alleles consisted of the sequences representing the type II archetype allele (PTG y PDS) and was positioned at the most peripheral part of the network. The remaining Panamanian alleles were also located at the terminal positions. On the other hand, two Panamanian sequences (G12C and G13C) grouped with the reference sequences for the type III archetypal allele (CTG).
The distance analysis based on the GRA6 marker was largely consistent with the network analyses regarding the genetic relationships between the groups. The genetic distance between the analyzed sequences appears to be low. Most Panamanian sequences clustered into a single large group, indicating low divergence in the analyzed GRA6 fragment (Figure 3B). These sequences were identical to reference sequences from Martinique (MTQ01), Africa (Gabon10 y Gabon11), Switzerland (NZfs8825), USA (USA11) and Australia (TgCatAu-2) showing slight divergence from the reference sequences of the archetypal Type II allele (PDS and PTG). On the other hand, not all sequences exhibited the same pattern of genetic divergence; a smaller proportion of the analyzed Panamanian sequences as well as G2A, G2C, G3A, G4A, G14C, G17C and G18C, showed no divergence from the RH reference sequence, which represents the archetypal Type I allele. This group also included sequences such as G9C and G3B, which appear closely related to RH, whereas G10B and G10A appear more distant. The G12C and G13C sequences were identical to the archetypal type III allele (CTG) (Figure 3B).
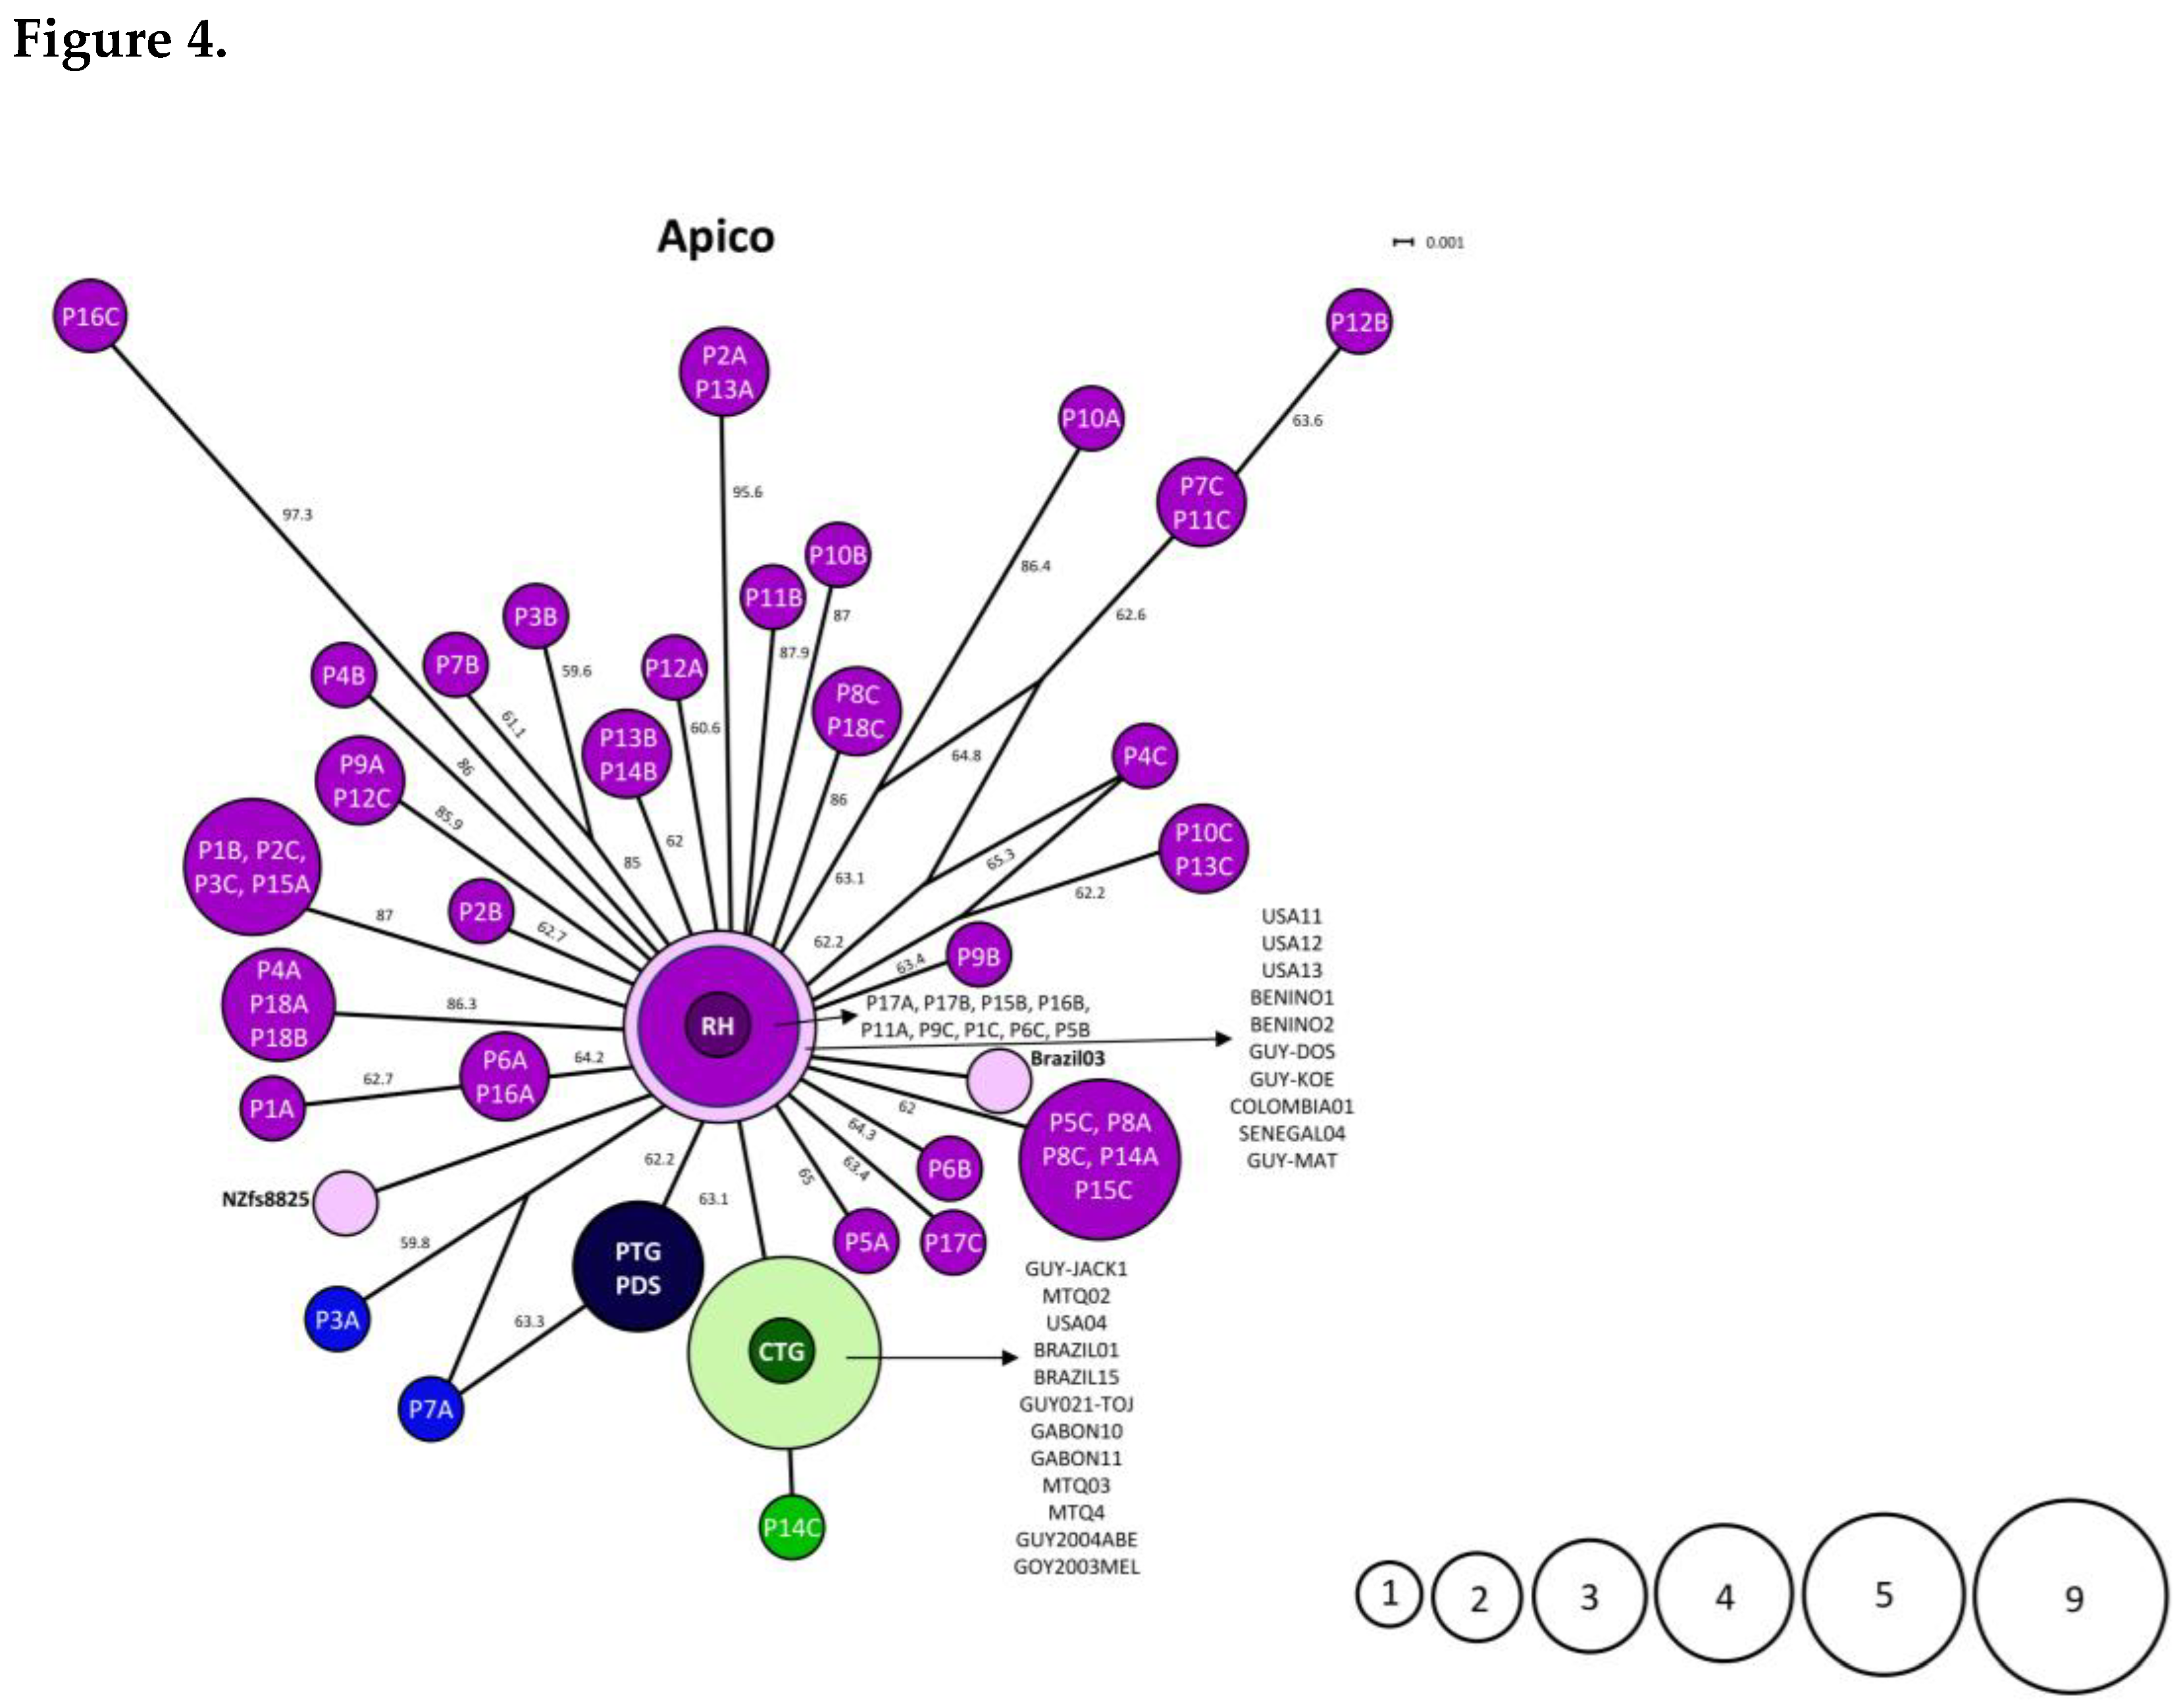
The network analysis performed for the Apico marker identified the formation of thirty Panamanian haplotypes; all originated from the same node, which was positioned at the center of the network and was widely represented by nine Panamanian sequences, the reference sequence for the archetypal type I (RH) allele, and reference sequences representing the global diversity of T. gondii (Figure 4). This analysis did not show a clear separation between the reference sequences for archetypal alleles II and III and the analyzed sequences; however, a closer relationship was observed between the Panamanian sequences P3B, P7A, and P14C and the reference sequences for alleles II and III, respectively.

3.3. Statistical Analyses to Determine the Frequency of Allelic Detection and the Haplotypic and Nucleotidic Diversity of SAG2, GRA6, and Apico

Allele detection frequencies varied considerably among the three genetic markers. For Alt. SAG2, allele 1 showed the highest detection frequency, identified in 6 of the 13 sampled animals (46.15%); this was followed by allele 2, detected in 4 animals (30.77%), and allele 3, detected in 3 animals (23.08%). Alleles 4 through 7 were detected in 2 animals each (15.38%), while the remaining alleles (8 through 31) were detected in a single animal each (7.69%). In the case of GRA6, allele 1 was detected in all 13 sampled animals (100%), making it the most widely distributed allele. Allele 2 was detected in 5 animals (38.46%), whereas alleles 3 through 12 were detected in a single animal each (7.69%). For Apico, allele 1 was detected in 8 of the 13 animals (61.54%). Alleles 2 and 3 were detected in 3 animals each (23.08%), while alleles 4 through 11 were detected in 2 animals each (15.38%). The remaining alleles (12 through 30) were detected in one animal each (7.69%). Overall, the three markers displayed different allelic distribution patterns: GRA6 exhibited a highly predominant allele, whereas Alt. SAG2 and Apico showed a broader distribution of alleles among the sampled animals (Table 3 and Supplementary Table 3).
The three genetic markers showed distinct patterns of haplotype and nucleotide diversity. For SAG2, thirty-one distinct haplotypes or sequences were identified from the 54 sequences analyzed. Analyses revealed high haplotype diversity (Hd = 0.9588) (Table 4). Higher nucleotide diversity was also observed compared to the other markers, with a value (π) of 0.01433 and an average of 6.75 nucleotide differences between pairs of sequences. GRA6 showed lower haplotype diversity compared to Alt. SAG2 and Apico. Twelve distinct haplotypes were identified among the 54 sequences analyzed, with a haplotype diversity of 0.6345. Nucleotide diversity was π = 0.00911, corresponding to an average of 2.60 nucleotide differences between pairs of sequences. Apico also exhibited high haplotype diversity, with 30 distinct haplotypes among the 54 sequences and a haplotype diversity of Hd = 0.9567. However, its nucleotide diversity was the lowest of the three markers (π = 0.00482), with an average of 2.88 nucleotide differences between pairs of sequences (Table 4).

4. Discussion

Sequencing of Alt.SAG2, GRA6, and Apico markers characterized specific sequence variation in the T. gondii DNA detected in 18 tissue samples from 13 wild animals. Within the clone sequence dataset, Alt.SAG2 and Apico yielded more distinct haplotypes than GRA6. In addition, the three markers showed different detection patterns at the animal level. Given that sampling was opportunistic, the quantity and types of tissues differed among some animals, and three clones were derived from each tissue-locus amplification; therefore, the dataset allowed for determining the detection frequency of each allele among the sampled animals, rather than establishing population-level allele frequencies or estimating T. gondii genetic diversity in Panamanian wildlife.
Diversity indices further illustrated the differences among loci within the clonal sequence dataset. Alt. SAG2 and Apico showed similar haplotype diversity values (Hd = 0.9588 and 0.9567, respectively), whereas GRA6 exhibited a lower value (Hd = 0.6345). Patterns observed in nucleotide diversity provided additional information regarding the variation detected for each marker. Nucleotide diversity was highest for Alt. SAG2 (π = 0.01433), intermediate for GRA6 (π = 0.00911), and lowest for Apico (π = 0.00482). The combination of high haplotype diversity and comparatively low nucleotide diversity observed for Apico is consistent with the presence of numerous locus variants (30 variants) that differ from one another by relatively few nucleotide substitutions. In contrast, the higher nucleotide diversity observed for Alt. SAG2 indicates greater average sequence divergence. These patterns show that a higher number of haplotypes does not necessarily imply greater divergence between sequences [32,33,34]. Therefore, haplotype and nucleotide diversities provide complementary measures of genetic variation, reflecting haplotype differentiation and the degree of sequence divergence, respectively. The higher level of genetic variation observed in the Alt. SAG2 region, compared with the corresponding regions of GRA6 and Apico, suggests that this marker may capture a broader spectrum of sequence variation within the analyzed T. gondii dataset. Previous studies have highlighted the utility of the entire SAG2 gene for distinguishing major T. gondii lineages, while also indicating that its discriminatory capacity may vary among geographic population; this underscores the importance of multilocus approaches for a comprehensive characterization of parasite diversity [35]. These data should be interpreted as descriptive indices of the recovered sequence set rather than as population genetics estimates. Other studies involving GRA6 and Apico have shown differences in haplotype and nucleotide diversity; however, direct comparisons with this study were not possible due to differences in sample size, hosts, geographic origin, and the size of the analyzed fragment [24,36,37].
The haplotype diversity observed at the Alt. SAG2 and Apico loci is particularly relevant given the exploratory nature of this study. Obtaining numerous distinct sequence variants from a relatively small set of wildlife samples indicates that the sampled material exhibited genetic heterogeneity detectable at these loci. Overall, the results demonstrate considerable sequence-level diversity among the T. gondii variants detected in the sampled wildlife particularly at the Alt. SAG2 and Apico loci whereas GRA6 exhibited a more restricted distribution of sequence haplotypes. Despite the relatively limited number of sampled animals, the three molecular markers displayed distinct patterns of genetic diversity, providing complementary information on the extent of sequence variation detected in the dataset. The contrasting diversity profiles among the three loci indicate that the magnitude and distribution of sequence variation differed depending on the genomic regions examined. Thus, not all loci provide equivalent information [35]. These results underscore the complementary nature of the markers used in this exploratory analysis. On the other hand, Panamanian sequence variants were identified that, within the analyzed fragments, proved identical to reference sequences obtained from other geographic regions. The recurrence of identical sequence variants in samples from different geographic origins indicates that some of the genetic variants detected in Panamanian wildlife are also present in other T. gondii populations. However, sequence identity in these fragments does not imply a common geographic origin, nor does it mean that the Panamanian parasite and the one from the other country represent the same strain or share the same multilocus genotype.
Multiple sequence variants were recovered from clones derived from certain tissue samples. This pattern is consistent with sequence heterogeneity within a single sample and could indicate infection by more than one parasite. However, given that the clones originated from the same amplification product, the observed variants could also stem from PCR or cloning artifacts. In this regard, the recurrence of identical sequence variants across multiple clones, independent tissue samples, and different host individuals suggests that at least a significant proportion of these recurring variants are unlikely to be isolated stochastic artifacts. Notably, several variants were detected repeatedly in biologically distinct samples and hosts, whereas others were observed in only a single clone. Consequently, we interpret the recurring variants as reproducible sequence variants, although we acknowledge that infrequent variants detected in only one clone should be interpreted with caution and may require independent amplification and sequencing for confirmation. Another important point is that the wild animals were analyzed at different times, as the samples corresponding to each individual were collected on different dates throughout the sampling period. Although these findings alone cannot confirm the existence of mixed infections, it is important to highlight the sequence variability observed among the clones (three) sequenced from a single sample, variants that were also reported in different tissues from other wild animals. For example, clones from Turdus grayi revealed two identical sequences (designated as allele 1) and one distinct sequence (designated as allele 5) in the analyzed lung tissue; the variant sequence (allele 5) proved to be identical to a sequence reported in the brain of a Potos flavus. Previous studies have described the presence of multiple T. gondii variants within a single host [38,39,40,41,42,43]; however, these findings do not replace the need to experimentally validate the identified variants through independent PCR amplifications, sequencing of additional clones, validated deep amplicon sequencing, and complementary multilocus analyses to confirm the reproducibility and authenticity. Consequently, clone combinations within a tissue should not be described as mixed infections, but rather as results requiring further analysis.
NeighborNet network and unrooted Neighbor-Joining tree analyses were used as distance-based representations to explore genetic relationships among the sequences. The relatively low bootstrap support and the limited number of informative sites within the analyzed fragments likely constrained the phylogenetic resolution of the markers. Accordingly, the internal, central, or terminal positions observed in the networks and trees should be interpreted as an initial indication of the resolving capacity of each locus for representing sequence relationships, rather than as evidence of ancestral, basal, ancient, or recently derived states. Collectively, these analyses allowed us to identify patterns of genetic association (the network structures observed for Alt.SAG2, GRA6, and Apico indicated that the three loci captured different patterns of genetic relationships among the analyzed T. gondii sequences) and sequence identity between the Panamanian variants and a panel of reference sequences representing a subset of the global genetic diversity of T. gondii. The Apico locus generated a star-like NeighborNet network with limited separation between the three reference groups, consistent with the low resolution of the analyzed fragment. Although the apicoplast is uniparentally inherited, the topology does not demonstrate that the Panamanian variants derive from the type I-associated reference sequence, nor that any of the observed sequences are ancestral [44]. A longer apicoplast sequence or whole-genome data would be required to draw more robust evolutionary inferences.
In distance-based analyses, Alt.SAG2 variants clustered with reference alleles associated with types II and III, whereas GRA6 variants clustered with references associated with types I, II, and III. These groupings apply only to the analyzed fragments and indicate sequence similarity to the selected reference alleles; they do not assign complete parasite classifications or specific clonal lineages.
These results provide a valuable initial characterization of the sequence-level genetic diversity of T. gondii detected in Panamanian wildlife. It should be noted that these findings must be interpreted within the exploratory scope of the study and do not represent an estimate of population-level genetic diversity in Panama. Rather, they offer an initial genetic snapshot identifying considerable diversity in the sampled material and lay the groundwork for future studies employing broader sampling, independent amplification and sequencing, and multilocus approaches.

5. Conclusions

This study revealed a heterogeneous composition of T. gondii variants at the sequence level within the sampled dataset. The genetic variants detected in Panamanian wildlife exhibit sequence similarities to variants representing archetypal clonal lineages of T. gondii, as well as to variants previously described in geographically distant regions. Consequently, the Panamanian variants may be part of a broader pattern of genetic diversity rather than being confined to the regional geographic context. These findings provide an initial genetic characterization of T. gondii diversity in wildlife samples and support further research, including broader sampling, independent sequence validation, and multilocus approaches.

Supplementary Materials

The following supporting information can be downloaded at https://www.mdpi.com/article/doi/s1, Figure S1: Nucleotide sequence diversity and polymorphism analysis for Alt. SAG2 marker; Figure S2: Nucleotide sequence diversity and polymorphism analysis for GRA6 marker and Figure S3: Nucleotide sequence diversity and polymorphism analysis for APICO marker; Table S1: Reference sequences representative of the global diversity of T. gondii used in genealogy and genetic distance analysis; Table S2: GenBank accession number assigned to the sequences obtained in this study; and Table S3: Detection frequency of SAG2, GRA6, and Apico alleles in tissue samples from thirteen wild animals.

Author Contributions

Conceptualization: Z.C.; methodology, Z.C., H.C., E.H., D.S., R. Ca., R.C., E.F. and L.R.M; validation, R.C, and R.Ca.; formal analysis, Z.C., H.C. and A.G.M.; investigation, Z.C., H.C., E.H., R. C., and R. Ca.; resources, Z.C., and H.C.; writing – original draft preparation, Z.C.; writing – review and editing, Z. C., A.G.M., A.C.P., H.C., R.C., D.V.C., and L.R.M; visualization, H.C., A.C.P, and D.V.C.; supervision, Z.C., and R.C.; project administration, Z.C., H.C., and R.C.; funding acquisition, Z.C. and H.C.

Funding

This project was funded by the National Secretariat of Science, Technology, and Innovation (SENACYT) under the coordination of the Directorate of Development of Scientific and Technological Capabilities with project number DDCCT No. 001-2023. We also received funding from the National Research System (SNI) 036 of 24 January 2024, the Master's Program in Parasitological Sciences of the University of Panama, funded by SENACYT with project code Pos-2020-Nue-A-007 and by the Faculty of Natural Sciences, Exact Sciences and Technology with fund number CUFI-2022-CNET-EP-001.

Data Availability Statement

The sequences supporting the findings of this study are available from the National Center for Biotechnology Information (NCBI). The accession numbers assigned to the sequences obtained in this study are listed in Supplementary Table 2.

Acknowledgments

We are very grateful to our collaborators at the Summit Municipal Park for supporting us with the infrastructure, equipment and human resources to carry out the necropsies. Also, to Dr. Nidia Sandoval for her invaluable support in the development of the Master's Program in Parasitological Sciences. To Dr. Carlos Restrepo and Laura Pineda for all the support to the students during the development of this project.

Conflicts of Interest

The authors declare no conflicts of interest. The funders had no role in the design of the study; in the collection, analyses, or interpretation of data; in the writing of the manuscript; or in the decision to publish the results”.

References

  1. Hill, D.; Dubey, J.P. Toxoplasma gondii: transmission, diagnosis and prevention. Clin. Microbiol. Infect. 2002, 8, 634–640. [Google Scholar] [CrossRef] [PubMed]
  2. Almeria, S.; Dubey, J.P. Foodborne transmission of Toxoplasma gondii infection in the last decade. An overview. Res. Vet. Sci. 2021, 135, 371–385. [Google Scholar] [CrossRef] [PubMed]
  3. Black, M.W.; Boothroyd, J.C. Lytic cycle of Toxoplasma gondii. Microbiol. Mol. Biol. Rev. 2000, 64, 607–623. [Google Scholar] [CrossRef] [PubMed]
  4. Wilson, A.G.; Lapen, D.R.; Provencher, J.F.; Wilson, S. The role of species ecology in predicting Toxoplasma gondii prevalence in wild and domesticated mammals globally. PLoS Pathog. 2024, 20, e1011908. [Google Scholar] [CrossRef] [PubMed]
  5. Henríquez-Carrizo, E.; Cruz, H.; Jurado, A.; Smith, D.; Villalobos-Cerrud, D.; Fábrega, L.; de la Guardia, C.; Cano, R.; Correa, R.; Frías, E.; et al. Infection Frequency and Allelic Variants of Toxoplasma gondii in Wildlife from the Panama Canal Zone. Microbiol. Res. 2024, 15, 2035–2047. [Google Scholar] [CrossRef]
  6. Shwab, E.K.; Zhu, X.Q.; Majumdar, D.; Pena, H.F.; Gennari, S.M.; Dubey, J.P.; Su, C. Geographical patterns of Toxoplasma gondii genetic diversity revealed by multilocus PCR-RFLP genotyping. Parasitology 2014, 141, 453–461. [Google Scholar] [CrossRef] [PubMed]
  7. Chaichan, P.; Mercier, A.; Galal, L.; Mahittikorn, A.; Ariey, F.; Morand, S.; Boumédiène, F.; Udonsom, R.; Hamidovic, A.; Murat, J.B.; et al. Geographical distribution of Toxoplasma gondii genotypes in Asia: A link with neighboring continents. Infect. Genet Evol. 2017, 53, 227–238. [Google Scholar] [CrossRef] [PubMed]
  8. Fernández-Escobar, M.; Schares, G.; Maksimov, P.; Joeres, M.; Ortega-Mora, L.M.; Calero-Bernal, R. Toxoplasma gondii Genotyping: A Closer Look Into Europe. Front Cell Infect. Microbiol. 2022, 12, 842595. [Google Scholar] [CrossRef] [PubMed]
  9. Galal, L.; Ajzenberg, D.; Hamidović, A.; Durieux, M.-F.; Dardé, M.-L.; Mercier, A. Toxoplasma and Africa: One Parasite, Two Opposite Population Structures. Trends Parasitol. 2018, 34, 140–154. [Google Scholar] [CrossRef] [PubMed]
  10. Jiang, T.; Shwab, E.K.; Martin, R.M.; Gerhold, R.W.; Rosenthal, B.M.; Dubey, J.P.; Su, C. A partition of Toxoplasma gondii genotypes across spatial gradients and among host species, and decreased parasite diversity towards areas of human settlement in North America. Int. J. Parasitol. 2018, 48, 611–619. [Google Scholar] [CrossRef]
  11. Dubey, J.P.; Velmurugan, G.V.; Rajendran, C.; Yabsley, M.J.; Thomas, N.J.; Beckmen, K.B.; Sinnett, D.; Ruid, D.; Hart, J.; Fair, P.A.; et al. Genetic characterisation of Toxoplasma gondii in wildlife from North America revealed widespread and high prevalence of the fourth clonal type. Int. J. Parasitol. 2011, 41, 1139–1147. [Google Scholar] [CrossRef] [PubMed]
  12. Carme, B.; Bissuel, F.; Ajzenberg, D.; Bouyne, R.; Aznar, C.; Demar, M.; Bichat, S.; Louvel, D.; Bourbigot, A.M.; Peneau, C.; et al. Severe Acquired Toxoplasmosis in Immunocompetent Adult Patients in French Guiana. J. Clin. Microbiol. 2002, 40, 4037–4044. [Google Scholar] [CrossRef] [PubMed]
  13. Ajzenberg, D.; Bañuls, A.L.; Su, C.; Dumètre, A.; Demar, M.; Carme, B.; Dardé, M.L. Genetic diversity, clonality and sexuality in Toxoplasma gondii. Int. J. Parasitol. 2004, 34, 1185–1196. [Google Scholar] [CrossRef] [PubMed]
  14. Khan, A.; Jordan, C.; Muccioli, C.; Vallochi, A.; Rizzo, L.; Belfort, R.; Vitor, R.W.A.; Silveira, C.; Sibley, L.D. Genetic Divergence of Toxoplasma gondii Strains Associated with Ocular Toxoplasmosis, Brazil. Emerg. Infect. Dis. J. 2006, 12, 942. [Google Scholar] [CrossRef] [PubMed]
  15. Lehmann, T.; Graham, D.H.; Dahl, E.R.; Bahia-Oliveira, L.M.G.; Gennari, S.M.; Dubey, J.P. Variation in the structure of Toxoplasma gondii and the roles of selfing, drift, and epistatic selection in maintaining linkage disequilibria. Infect. Genet. Evol. 2004, 4, 107–114. [Google Scholar] [CrossRef]
  16. Su, C.; Khan, A.; Zhou, P.; Majumdar, D.; Ajzenberg, D.; Dardé, M.L.; Zhu, X.Q.; Ajioka, J.W.; Rosenthal, B.M.; Dubey, J.P.; et al. Globally diverse Toxoplasma gondii isolates comprise six major clades originating from a small number of distinct ancestral lineages. Proc. Natl. Acad. Sci. U S A 2012, 109, 5844–5849. [Google Scholar] [CrossRef] [PubMed]
  17. du Plooy, I.; Mlangeni, M.; Christian, R.; Tsotetsi-Khambule, A.M. An African perspective on the genetic diversity of Toxoplasma gondii: A systematic review. Parasitology 2023, 150, 551–578. [Google Scholar] [CrossRef] [PubMed]
  18. Hataminejad, M.; Montazeri, M.; Tanzifi, A.; Galeh, T.M. Global geographical distribution of Toxoplasma gondii genotypes from dogs: A systematic review. Parasite Epidemiol. Control 2025, 30, e00433. [Google Scholar] [CrossRef] [PubMed]
  19. Galal, L.; Ariey, F.; Gouilh, M.A.; Dardé, M.L.; Hamidović, A.; Letourneur, F.; Prugnolle, F.; Mercier, A. A unique Toxoplasma gondii haplotype accompanied the global expansion of cats. Nat. Commun. 2022, 13, 5778. [Google Scholar] [CrossRef] [PubMed]
  20. Flores, C.; Villalobos-Cerrud, D.; Borace, J.; Fábrega, L.; Norero, X.; Sáez-Llorens, X.; Moreno, M.T.; Restrepo, C.M.; Llanes, A.; Quijada, R.M.; et al. Epidemiological Aspects of Maternal and Congenital Toxoplasmosis in Panama. Pathogens 2021, 10. [Google Scholar] [CrossRef] [PubMed]
  21. Fábrega, L.; Restrepo, C.M.; Torres, A.; Smith, D.; Chan, P.; Pérez, D.; Cumbrera, A.; Caballero, E.Z. Frequency of Toxoplasma gondii and Risk Factors Associated with the Infection in Stray Dogs and Cats of Panama. Microorganisms 2020, 8, 927. [Google Scholar] [CrossRef] [PubMed]
  22. Rengifo-Herrera, C.; Pile, E.; García, A.; Pérez, A.; Pérez, D.; Nguyen, F.K.; de la Guardia, V.; McLeod, R.; Caballero, Z. Seroprevalence of Toxoplasma gondii in domestic pets from metropolitan regions of Panama. Parasite 2017, 24, 9. [Google Scholar] [CrossRef] [PubMed]
  23. Correa, R.; Cedeño, I.; de Escobar, C.; Fuentes, I. Increased urban seroprevalence of Toxoplasma gondii infecting swine in Panama. Vet. Parasitol. 2008, 153, 9–11. [Google Scholar] [CrossRef] [PubMed]
  24. Fazaeli, A.; Carter, P.E.; Darde, M.L.; Pennington, T.H. Molecular typing of Toxoplasma gondii strains by GRA6 gene sequence analysis. Int. J. Parasitol. 2000, 30, 637–642. [Google Scholar] [CrossRef] [PubMed]
  25. Khan, A.; Su, C.; German, M.; Storch, G.A.; Clifford, D.B.; Sibley, L.D. Genotyping of Toxoplasma gondii Strains from Immunocompromised Patients Reveals High Prevalence of Type I Strains. J. Clin. Microbiol. 2005, 43, 5881–5887. [Google Scholar] [CrossRef] [PubMed]
  26. Su, C.; Zhang, X.; Dubey, J.P. Genotyping of Toxoplasma gondii by multilocus PCR-RFLP markers: A high resolution and simple method for identification of parasites. Int. J. Parasitol. 2006, 36, 841–848. [Google Scholar] [CrossRef] [PubMed]
  27. Su, C.; Zhang, X.; Dubey, J.P. Genotyping of Toxoplasma gondii by multilocus PCR-RFLP markers: a high resolution and simple method for identification of parasites. Int. J. Parasitol. 2006, 36, 841–848. [Google Scholar] [CrossRef] [PubMed]
  28. Huson, D.H.; Bryant, D. Application of Phylogenetic Networks in Evolutionary Studies. Mol. Biol. Evol. 2005, 23, 254–267. [Google Scholar] [CrossRef] [PubMed]
  29. Tamura, K.; Stecher, G.; Kumar, S. MEGA11: Molecular Evolutionary Genetics Analysis Version 11. Mol. Biol. Evol. 2021, 38, 3022–3027. [Google Scholar] [CrossRef] [PubMed]
  30. Rozas, J.; Ferrer-Mata, A.; Sánchez-DelBarrio, J.C.; Guirao-Rico, S.; Librado, P.; Ramos-Onsins, S.E.; Sánchez-Gracia, A. DnaSP 6: DNA Sequence Polymorphism Analysis of Large Data Sets. Mol. Biol. Evol. 2017, 34, 3299–3302. [Google Scholar] [CrossRef] [PubMed]
  31. Nei, M.; Tajima, F. DNA polymorphism detectable by restriction endonucleases. Genetics 1981, 97, 145–163. [Google Scholar] [CrossRef] [PubMed]
  32. Azimpour-Ardakan, T.; Fotouhi-Ardakani, R.; Hoghooghi-Rad, N.; Rokni, N.; Motallebi, A. Phylogenetic Analysis and Genetics Polymorphisms Evaluation of ROP8 and B1 Genes of Toxoplasma gondii in Livestock and Poultry Hosts of Yazd, Qom and Golestan Provinces of Iran. Iran. J. Parasitol. 2021, 16, 576–586. [Google Scholar] [CrossRef] [PubMed]
  33. Höglund, J. Evolutionary Conservation Genetics; Oxford University Press, 2009. [Google Scholar]
  34. Nei, M. The Molecular Approach to Evolution: Molecular Evolutionary Genetics; Nei, M., Ed.; 1987; Volume 237, pp. 782–782. [Google Scholar]
  35. Khan, A.; Jordan, C.; Muccioli, C.; Vallochi, A.L.; Rizzo, L.V.; Belfort, R., Jr.; Vitor, R.W.; Silveira, C.; Sibley, L.D. Genetic divergence of Toxoplasma gondii strains associated with ocular toxoplasmosis, Brazil. Emerg. Infect. Dis. 2006, 12, 942–949. [Google Scholar] [CrossRef] [PubMed]
  36. Hasanzadeh, M.; Ahmadpour, E.; Mahami-Oskouei, M.; Musavi, S.; Parsaei, M.; Sarafraz, N.; Spotin, A. Genetic diversity and seroprevalence of Toxoplasma gondii in COVID-19 patients; a first case-control study in Iran. BMC Infect. Dis. 2024, 24, 42. [Google Scholar] [CrossRef] [PubMed]
  37. Nzelu, I.N.; Kwaga, J.K.P.; Kabir, J.; Lawal, I.A.; Beazley, C.; Evans, L.; Blake, D.P. Detection and genetic characterisation of Toxoplasma gondii circulating in free-range chickens, pigs and seropositive pregnant women in Benue state, Nigeria. PLoS Neglected Trop. Dis. 2021, 15, e0009458. [Google Scholar]
  38. Aspinall, T.V.; Guy, E.C.; Roberts, K.E.; Joynson, D.H.; Hyde, J.E.; Sims, P.F. Molecular evidence for multiple Toxoplasma gondii infections in individual patients in England and Wales: public health implications. Int. J. Parasitol. 2003, 33, 97–103. [Google Scholar] [CrossRef] [PubMed]
  39. Brito, R.M.M.; de Lima Bessa, G.; Bastilho, A.L.; Dantas-Torres, F.; de Andrade-Neto, V.F.; Bueno, L.L.; Fujiwara, R.T.; Magalhães, L.M.D. Genetic diversity of Toxoplasma gondii in South America: occurrence, immunity, and fate of infection. Parasit. Vectors 2023, 16, 461. [Google Scholar] [CrossRef] [PubMed]
  40. Pan, S.; Thompson, R.C.; Grigg, M.E.; Sundar, N.; Smith, A.; Lymbery, A.J. Western Australian marsupials are multiply infected with genetically diverse strains of Toxoplasma gondii. PLoS ONE 2012, 7, e45147. [Google Scholar] [CrossRef] [PubMed]
  41. Valenzuela-Moreno, L.F.; Méndez-Cruz, S.T.; Rico-Torres, C.P.; Cedillo-Peláez, C.; Correa, D.; Caballero-Ortega, H. SAG3 Toxoplasma gondii cloning reveals unexpected fivefold infection in the blood of feral cats in the Mexican Caribbean. BMC Vet. Res. 2022, 18, 33. [Google Scholar] [CrossRef] [PubMed]
  42. Valenzuela-Moreno, L.F.; Rico-Torres, C.P.; Cedillo-Peláez, C.; Luna-Pastén, H.; Méndez-Cruz, S.T.; Lara-Martínez, G.; Correa, D.; Caballero-Ortega, H. Mixed Toxoplasma gondii infection and new genotypes in feral cats of Quintana Roo, México. Acta Trop. 2019, 193, 199–205. [Google Scholar] [CrossRef] [PubMed]
  43. Verma, S.K.; Sweeny, A.R.; Lovallo, M.J.; Calero-Bernal, R.; Kwok, O.C.; Jiang, T.; Su, C.; Grigg, M.E.; Dubey, J.P. Seroprevalence, isolation and co-infection of multiple Toxoplasma gondii strains in individual bobcats (Lynx rufus) from Mississippi, USA. Int. J. Parasitol. 2017, 47, 297–303. [Google Scholar] [CrossRef] [PubMed]
  44. Ferguson, D.J.P.; Henriquez, F.L.; Kirisits, M.J.; Muench, S.P.; Prigge, S.T.; Rice, D.W.; Roberts, C.W.; McLeod, R.L. Maternal Inheritance and Stage-Specific Variation of the Apicoplast in Toxoplasma gondii during Development in the Intermediate and Definitive Host. Eukaryot. Cell 2005, 4, 814–826. [Google Scholar] [CrossRef] [PubMed]
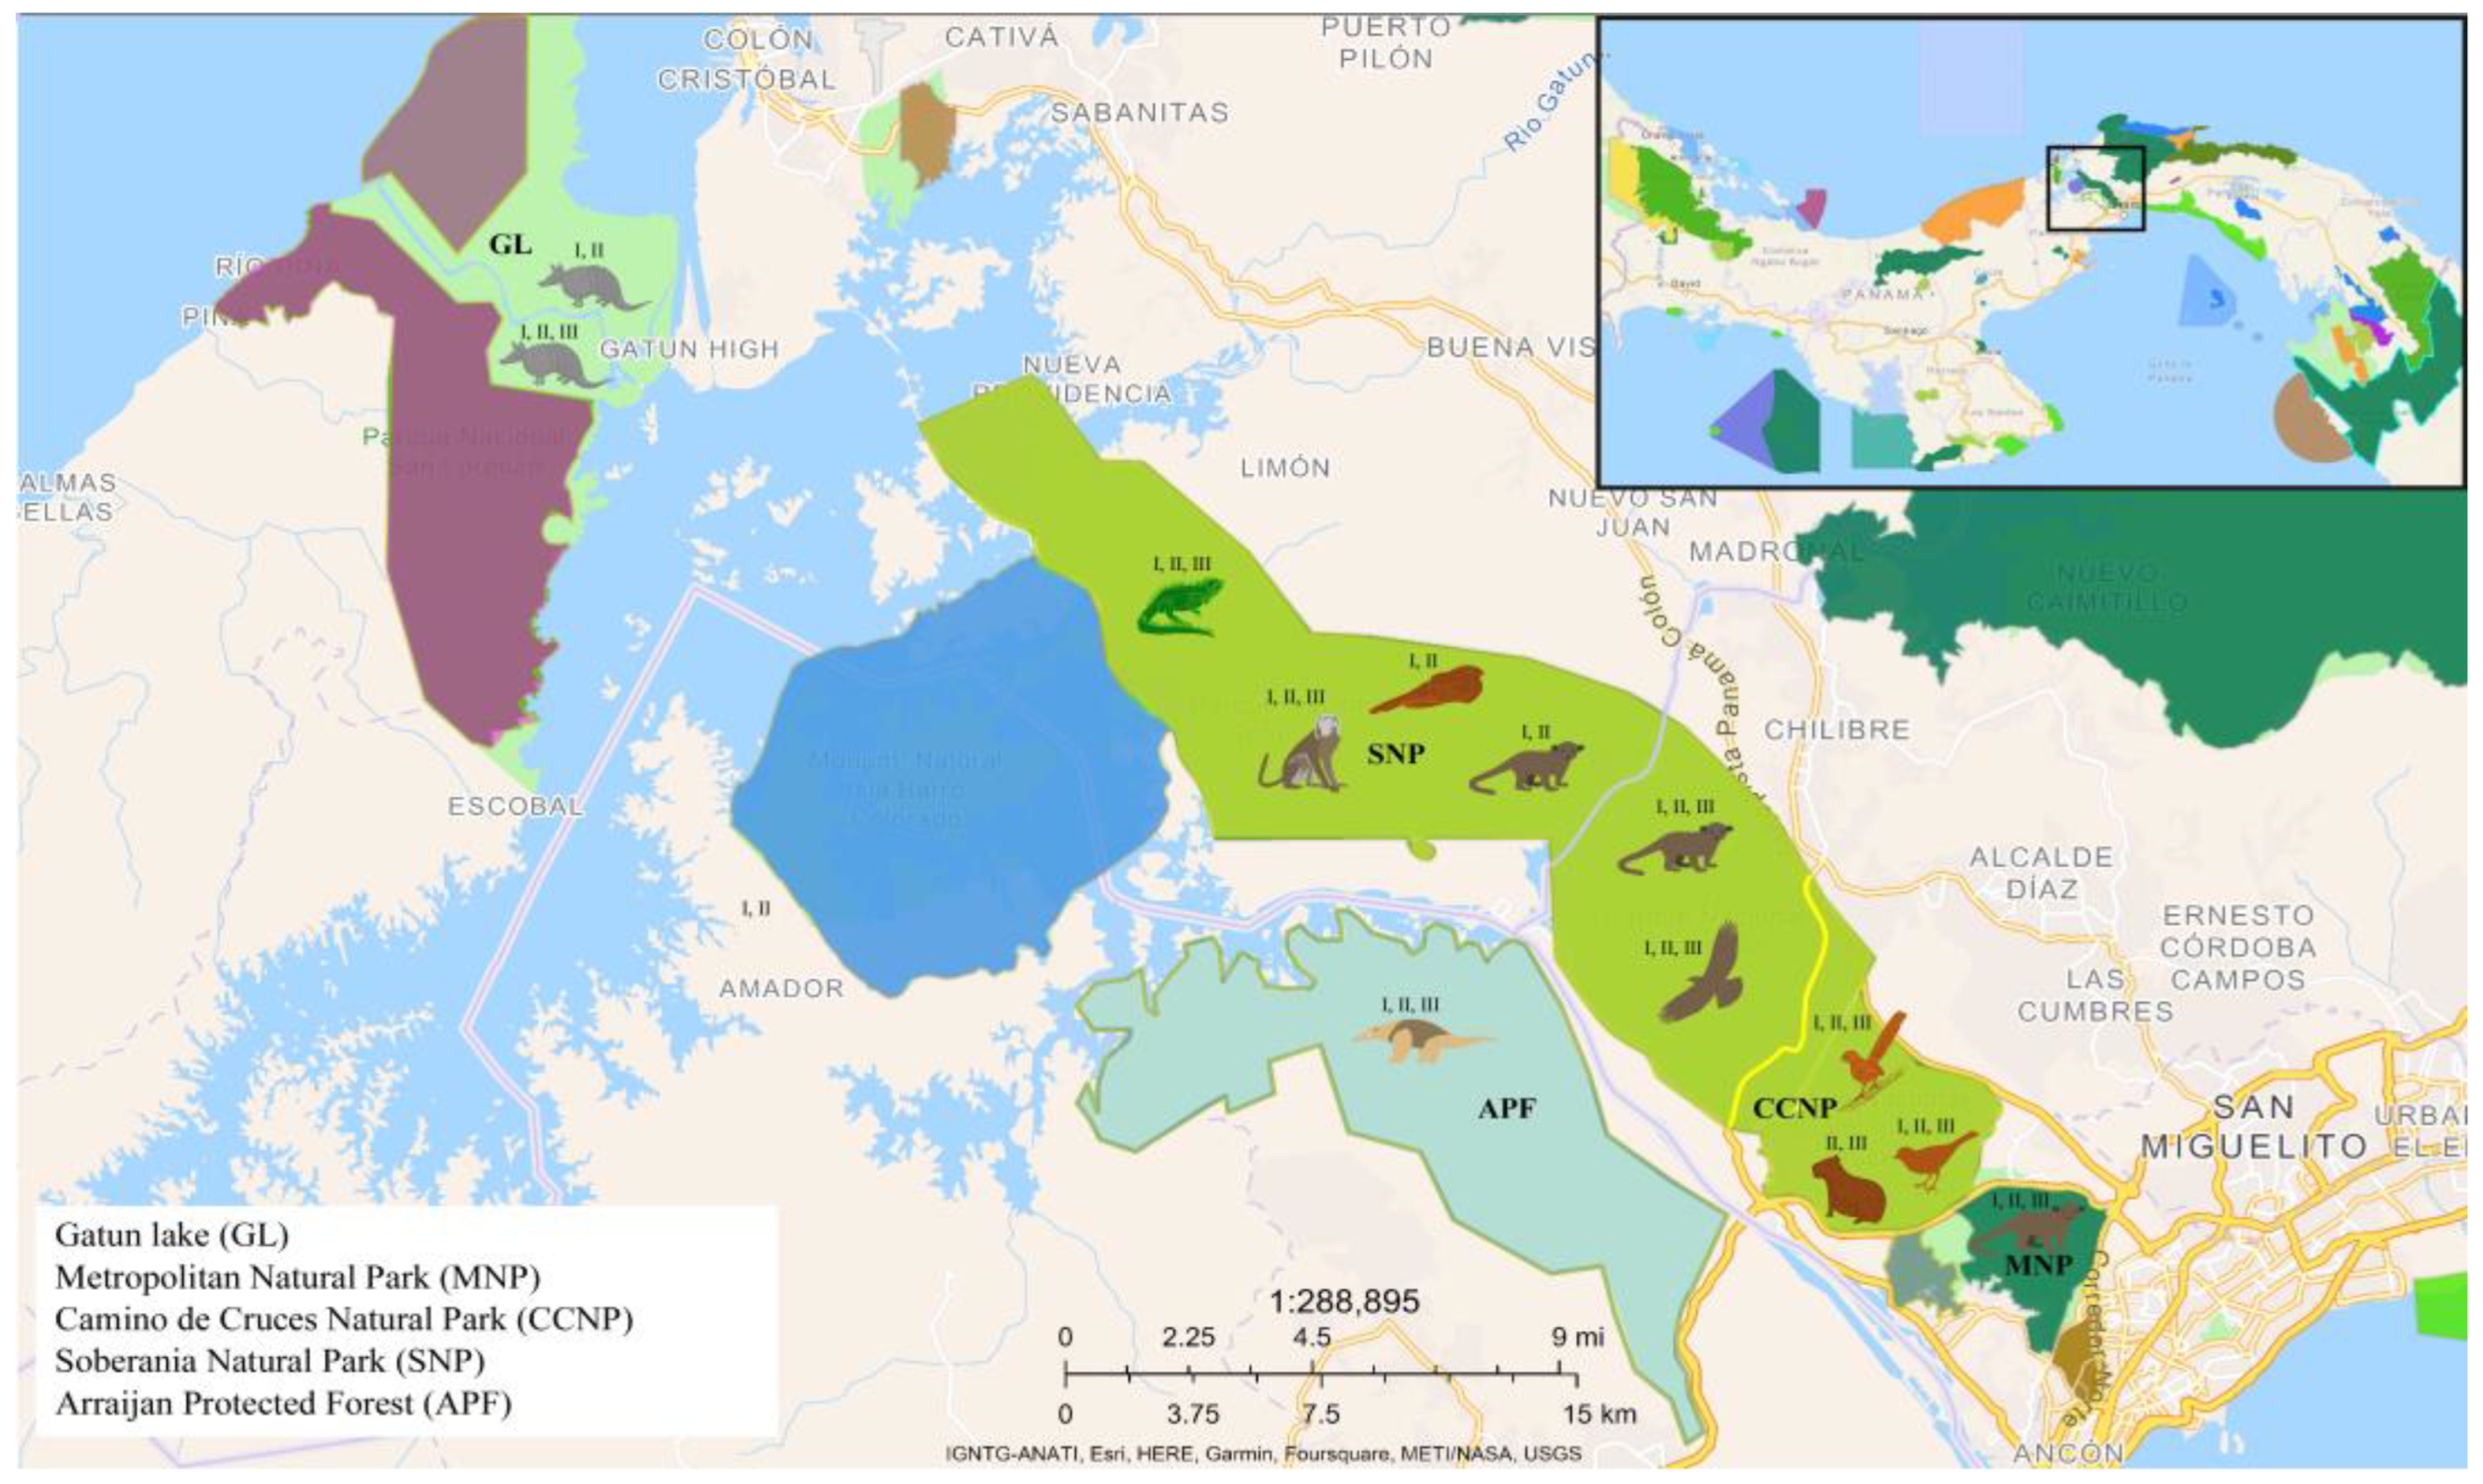
Figure 1. Origin the wild animals analyzed in this study and allelic of T. gondii found in the tissues of these animals and their geographical distribution. The regions are defined with the following abbreviations: Gatún Lake = GL, Metropolitan Natural Park = MNP, Camino de Cruces Natural Park = CCNP, Soberania Natural Park = SNP, Arraijan Protected Forest = APF.
Preprints 236218 g001
Figure 2. A. Genealogy analysis – Alt. SAG2. The circles shown in the lower right corner represent the number of sequences grouped within each haplotype in the network analysis. Group I (purple tones) consists of the RH reference sequence representing the archetypal type I allele and other reference sequences (COUG and GUYJAG1). Group II (shades of blue) comprises: the ME49 reference sequence, representing the archetypal type II allele (dark blue); other reference sequences USA11, TgCatAu-2, USA12, USA13, NZfs8825, GBS6 (light blue); and the Panamanian sequences generated in this study with codes starting with the letter A (medium blue). Group III (shades of green) comprises: the CTG reference sequence, representing the archetypal type III allele (dark green); other reference sequences VEG, Panama 01, Brazil03, USA04, NED, MTQ02 (light green); and the Panamanian sequences (medium green). Shown in dark turquoise is a Panamanian sequence(A9A) that did not cluster with any of the groups identified in this analysis. Shown in orange are sequences representing the Amazonian, Africa 1, Africa 3, and Africa 4 haplotypes, as well as relevant atypical genotypes from French Guiana, Brazil, Colombia, Uruguay, the United States (Type 12), and Martinique (Caribbean 1, 2, and 3). B. Genetic distance analysis Alt.SAG2. The Panamanian sequences are represented in blue and green, according to their genetic divergence with the archetypal T. gondii alleles II, and III. The other sequences, shown in black, represent part of the global diversity of T. gondii. MTQ01, MTQ02, MTQ03 y MTQ04 are the abbreviations for the reference sequences from Martinique.
Preprints 236218 g002
Figure 3. A. Genealogy analysis for the GRA6 marker. The circles shown in the lower right corner represent the number of sequences grouped within each haplotype in the network analysis. Group I (purple tones) consists of the RH reference sequence representing the archetypal type I allele, reference sequences (Brazil15, GUY057, USA04), and the Panamanian sequence with codes begin with the letter G. Group II (shades of blue) comprises: the PTG and PDS sequence representing the archetypal type II allele (dark blue); reference sequences MTQ01 (Martinique01), Gabon10 y Gabon11 (light blue); and the Panamanian sequences (medium blue). Group III (shades of green) comprises: the CTG reference sequence, representing the archetypal type III allele (dark green) and the Panamanian sequences (medium green). B. Genetic distance analysis Alt.SAG2. The Panamanian sequences are represented in purple, blue, and green, according to their genetic divergence with the archetypal T. gondii alleles I, II, and III. The other sequences, shown in black, represent part of the global diversity of T. gondii.
Preprints 236218 g003
Figure 4. Genealogical analysis of the Apico marker. The codes for the Panamanian sequences begin with the letter P. Allele I, is represented by the reference strain RH in dark purple, the middle purple circle represents the Panamanian sequences, and the lighter purple circle represents the reference sequences retrieved from different database. The dark blue circle represents the reference sequences for allele II (PTG, PDS, ME49), and the medium blue circles represent the Panamanian sequences. The reference sequences for allele III (CTG) are shown in dark green, the sequences retrieved from different database are shown in light green, and the Panamanian sequences are shown in medium green.
Preprints 236218 g004
Table 1.  
Table 1.  
Tissue samples from different wild animal species analyzed in this study
Type of animal Nº Species Code Origin Tissues
Mammals 1 Hydrochoerus hydrochaeris 135 CCNP Liver
Brain
2 Tamandua mexicana 103 APF S. muscle
3 Dasypus novemcinctus 1 139 GL Brain
4 Dasypus novemcinctus 2 141 GL Heart
5 Potos flavus 1 128 SNP Liver
Lung
6 Saguinus geoffroyi 111 SNP Brain
7 Potos flavus 2 98 MNP Brain
8 Potos flavus 3 159 SNP Liver
Birds 9 Nyctidromus albicolis 107 SNP Eye
10 Piaya cayana 150 CCNP Liver
Lung
11 Buteo platypterus 153 SNP S. muscle
Liver
12 Turdus grayi 167 CCNP Lung
Reptile 13 Iguana iguana 142 SNP Lung
Heart
S. muscle = Skeletal muscle
CCNP = Camino de Cruces Natural Park
APF = Arraijan Protected Forest
MNP = Metropolitan Natural Park
GL = Gatun Lake
SNP = Soberania National park
Table 2.  
Table 2.  
Molecular markers, primers and sizes of PCR-amplified products
Molecular markers External and internal primers Internal PCR product size Reference
alt.SAG2 (Chr. VIII) F:GGAACGCGAACAATGAGTTT
R:GCACTGTTGTCCAGGGTTTT
Fa:ACCCATCTGCGAAGAAAACG
Ra:ATTTCGACCAGCGGGAGCAC
546 pb
Khan et al. (2005)
C. Su et al. (2006)
GRA6 (Chr. X) F:ATTTGTGTTTCCGAGCAGGT
R:GCACCTTCGCTTGTGGTT F-1:TTTCCGAGCAGGTGACCT
R1x:TCGCCGAAGAGTTGACATAG
344 pb Fazaeli et al. (2000)
Khan et al. (2005)
C. Su et al. (2006)
Apico (Plastid) Apico-Fext:TGGTTTTAACCCTAGATTGTGG
Apico -Rext: AAACGGAATTAATGAGATTTGAA
Apico-F: TGCAAATTCTTGAATTCTCAGTT
Apico-R: GGGATTCGAACCCTTGATA
640 pb C. Su et al. (2006)
Table 3. Detection frequency of alleles in tissue samples from thirteen wild animals.
Alt. SAG2.
Alleles Nº of detected animals Frequency Percentage
Alelo 1 6 6/13 = 0.461 46.15%
Alelo2 4 4/13 = 0.307 30.77%
Alelo 3 3 3/13 = 0.230 23.08%
Alelos: 4,5,6,7. 2 2/13 = 0.153 15.38%
Alelos: 8, 9, 10, 11, 12, 13, 14, 15, 16, 17, 18, 19, 29, 21, 22, 23, 24, 25, 26, 27, 28, 29, 30, 31. 1 1/13 = 0.076 7.69%
GRA6.
Alelo 1 13 13/13 = 1.0 100%
Alelo 2 5 5/13 = 0.384 38.46%
Alelos: 3, 4, 5, 6. 7, 8, 9, 10, 11 y 12. 1 1/13 = 0.076 7.69%
Apico
Alelo 1 8 8/13 = 0.615 61.54%
Alelos: 2 y 3. 3 3/13 = 0.230 23.08%
Alelos: 4, 5, 6, 7, 8, 9, 10, 11. 2 2/13 = 0.153 15.38%
Alelos: 12, 13, 14, 15, 16, 17, 18, 19, 20, 21, 22, 23, 24, 25, 26, 27, 28, 29, y 30. 1 1/3 = 0.76 7.69%
Table 3. The bottom rows of the table for each marker (Alt. SAG2, GRA6, and Apico) list the alleles that were identified only once across the thirteen animals analyzed. Supplementary Table 3 provides details on the animals and species in which these alleles were identified.
Table 4. Haplotype and nucleotide diversity estimate for T. gondii sequences from Panamanian wildlife. 
Markers Nº Sequence length (bp) Haplotypes (H) Segregating sites (S) Haplotype diversity (Hd) Nucleotide diversity (π) Mean pairwise differences (k)
Alt. SAG2 54 546 31 42 0.9588 0.01433 6.75
GRA6 54 344 12 21 0.6345 0.00911 2.6
Apico 54 640 30 44 0.9567 0.00482 2.88
Disclaimer/Publisher’s Note: The statements, opinions and data contained in all publications are solely those of the individual author(s) and contributor(s) and not of MDPI and/or the editor(s). MDPI and/or the editor(s) disclaim responsibility for any injury to people or property resulting from any ideas, methods, instructions or products referred to in the content.
Copyright: This open access article is published under a Creative Commons CC BY 4.0 license, which permit the free download, distribution, and reuse, provided that the author and preprint are cited in any reuse.