

Submitted:
01 October 2026
Posted:
02 October 2026
You are already at the latest version
Abstract
The Bullet Cluster separates hot X-ray plasma, cluster galaxies and the gravitational-lensing record on the sky. We test the observation-field branch of Physical--Observation Dual-Axis (PODA) dynamics using the ordinary initial--boundary-value standard of field theory: the universal equations and the previously fixed intrinsic observation-mode coefficient are held fixed, while the particular cluster is allowed object-specific initial data determined from non-lensing observations or from a declared calibration subset. No external dark-matter halo profile, modified-gravity law, mass--dispersion scaling relation or merger simulation enters the PODA calculation. The source geometry provides the first target. In equal 100-kpc apertures the Bullet plasma position contains \( (2.64\pm0.68)\times10^{12}M_\odot \) more measured baryonic mass than the Bullet BCG position, while the weak-lensing maximum lies on the galaxy side. The fixed PODA mode, \( m=5.6698\times10^{-61}\,\mathrm{kg} \), is coherent on 50--200 kpc scales over 100 Myr. We then construct a disjoint non-lensing phase-space initialization. The published DS+ Bullet component has nine galaxies, projected centre \( (-736,223) \) kpc and line-of-sight dispersion \( 849^{+232}_{-185}\,\mathrm{km\,s^{-1}} \). Mapping that component to the Barrena member table gives the Bullet projected axes \( (109.4,80.8) \) kpc. Removing those nine galaxies leaves 69 main-component members; a robust proje\( (-736,223) \)cted covariance gives axes \( (444.5,156.1) \) kpc, and their rest-frame gapper dispersion is \( 1241\,\mathrm{km\,s^{-1}} \) with a nonparametric 16--84 percentile interval \( 1124 \)--\( 1319\,\mathrm{km\,s^{-1}} \). This disjoint construction removes the earlier risk of using a whole-cluster dispersion as a main-component datum while adding the Bullet subgroup separately. A declared Gaussian moment closure of the PODA Vlasov--Poisson branch converts these measured phase-space data into one low-order Cauchy state. At the independently reported Bullet central dispersion, the common-source moment masses are \( 1.003\times10^{15}M_\odot \) and \( 1.676\times10^{14}M_\odot \) for the main and Bullet components. Their ratio, 5.99, is not identified with an \( M_{200c} \) ratio. The frozen two-dimensional source places its main and Bullet maxima \( 5.53'' \) and \( 3.62'' \) from the later weak-lensing maxima. The strongest test uses the 2026 spectroscopic strong-lensing sample. From the 27 secure background galaxies spanning \( z=0.897 \)--6.64 we retain one predeclared gold multiply-imaged feature per galaxy, giving 79 image positions and preventing multiple knots from one source from dominating the statistic. The physical deflection is computed directly from the frozen PODA surface density; the Fourier normalization was previously verified against the analytic Gaussian deflection to better than \( 0.7\% \). Because the Bullet velocity dispersion is an object-specific initial datum rather than a universal coupling, it is estimated only on training galaxies in a nested five-fold procedure. In each outer fold, an inner leave-one-galaxy-out calculation chooses \( \sigma_{\rm Bullet} \) on a predeclared 650--1100 \( \mathrm{km\,s^{-1}} \) grid and simultaneously fits a nonparametric monotone source-distance efficiency \( 0\le\beta(z)\le1 \). Both are then frozen before the outer galaxies are opened. The five PODA folds select \( \sigma_{\rm Bullet}=800 \)--825 \( \mathrm{km\,s^{-1}} \), close to the independent DS+ value, and give a pooled held-out source-plane angular scatter of \( 1.591'' \). Repeating the identical calibration with the same extra field moved to the X-ray plasma gives \( 4.009'' \); baryons alone give \( 13.836'' \). PODA is better for all 27 outer-held-out galaxies, with median per-galaxy RMS ratios 0.370 relative to the plasma-centred control and 0.103 relative to baryons only. The result establishes a transferable galaxy-side gravitational source within the declared low-order initialization. It does not yet constitute a resolved merger simulation or a full cosmological distance prediction.
Keywords:
physical-observation dual axis
; PODA
; observation field
; bullet cluster
; gravitational lensing
; merging clusters
; falsifiability
1. Why This System Is a Sharp PODA Test
The central observational fact is geometric rather than semantic. In 1E 0657–56 the dominant X-ray plasma is displaced from the galaxy concentrations, while the lensing convergence has two strong peaks located near the galaxy concentrations rather than at the plasma centroids [1]. The system therefore asks a clean question: can a theory in which the gravitating source contains an objective observation-state contribution produce a gravitational source that remains with the galaxy-scale structure after the plasma has become spatially displaced?
The calculation below deliberately avoids importing a second dark-matter model, a modified-gravity prescription, or a numerical cluster-merger simulation. The only dynamical equations are those of the PODA branch written explicitly in Section 2. External papers supply only measured quantities. This separation is essential: otherwise the desired lensing morphology could be placed into the calculation through an auxiliary model and then returned as an apparent prediction.
A second distinction is equally important. The universal PODA coefficients and the initial data of one particular cluster have different logical status. The former define the theory and cannot be retuned from target to target; the latter are ordinary solution data and may be obtained from independent observations, a declared calibration subset, or a formation history. This is the same standard used in relativistic orbit calculations: the field equations need not generate a planet’s orbital elements before they can predict its subsequent motion. What is forbidden is only double counting—an observable used to determine target-specific initial data cannot also be presented as independent validation of the reconstruction. The present paper therefore keeps the intrinsic PODA coefficient fixed while treating the Bullet Cluster occupation and phase as legitimate system-specific data to be supplied in the next forward calculation.
2. PODA Common Source and Its Weak-Field Branch
Let denote the objective observation state over spacetime. The retained PODA branch is generated by the common action
Metric variation gives
with
A stationary observation section reduces the additional term to a constant vacuum contribution. A varying section instead supplies a real, covariantly conserved gravitational source.
Near a stable stationary state, choose a positive normal coordinate and retain the quadratic branch . Carrier averaging in the weak, nonrelativistic regime gives an envelope with
and the coupled source equations
The same appears in ordinary motion and in the leading weak-field light deflection. There is no independent lensing potential and no phenomenological drag term for in this reduction.
For the present no-retuning test we freeze the previously declared intrinsic coefficient
This number is not re-estimated from the Bullet Cluster. The cluster occupation and pre-merger phase are target-specific initial data of the solution. They may be measured, calibrated from a declared subset of records, or supplied by a formation calculation; they are not required to be universal consequences of the PODA action.
2.1. Projected Source and Convergence
In the thin weak-field limit generated by Equations (2)–(), the convergence in a fixed source-redshift normalization is proportional to the projected common source,
where depends on the lens-source geometry but is common to nearby equal apertures. We never need its numerical value for the differential test below.
3. Observed Inputs Used in the Calculation
Clowe et al. reported four equal circular apertures of radius 100 kpc, centered on the two BCG positions and the two X-ray plasma centroids. Their X-ray plasma masses, stellar masses and mean convergence values are reproduced in Table 1. The baryonic aperture mass is . These are the only 2006 quantities used in the source-attribution calculation.
The column is retained for provenance but is not differenced below. Clowe et al. define the BCG entries from a fitted two-peak model after subtracting the other peak, whereas the plasma entries are residuals after subtracting both BCG-centred circular profiles. They are therefore not two samples of one common aperture estimator. The present revision removes the earlier direct subtraction and uses the reported weak-lensing peak positions instead.
Using the tabulated coordinates directly and converting right-ascension seconds by , the BCG–plasma separations are
The original paper quotes kpc per arcsecond for its adopted distance conversion, giving 209 and 194 kpc, respectively. The angular values, which drive the geometric statement, do not depend on adopting that conversion.
Figure 1.
Same-definition source geometry from the 2006 weak-lensing reconstruction. Coordinates are shown relative to the corresponding BCG. The peaks are the reported local maxima of the reconstruction, not the residual plasma-aperture entries in Table 1.
Figure 1.
Same-definition source geometry from the 2006 weak-lensing reconstruction. Coordinates are shown relative to the corresponding BCG. The peaks are the reported local maxima of the reconstruction, not the residual plasma-aperture entries in Table 1.
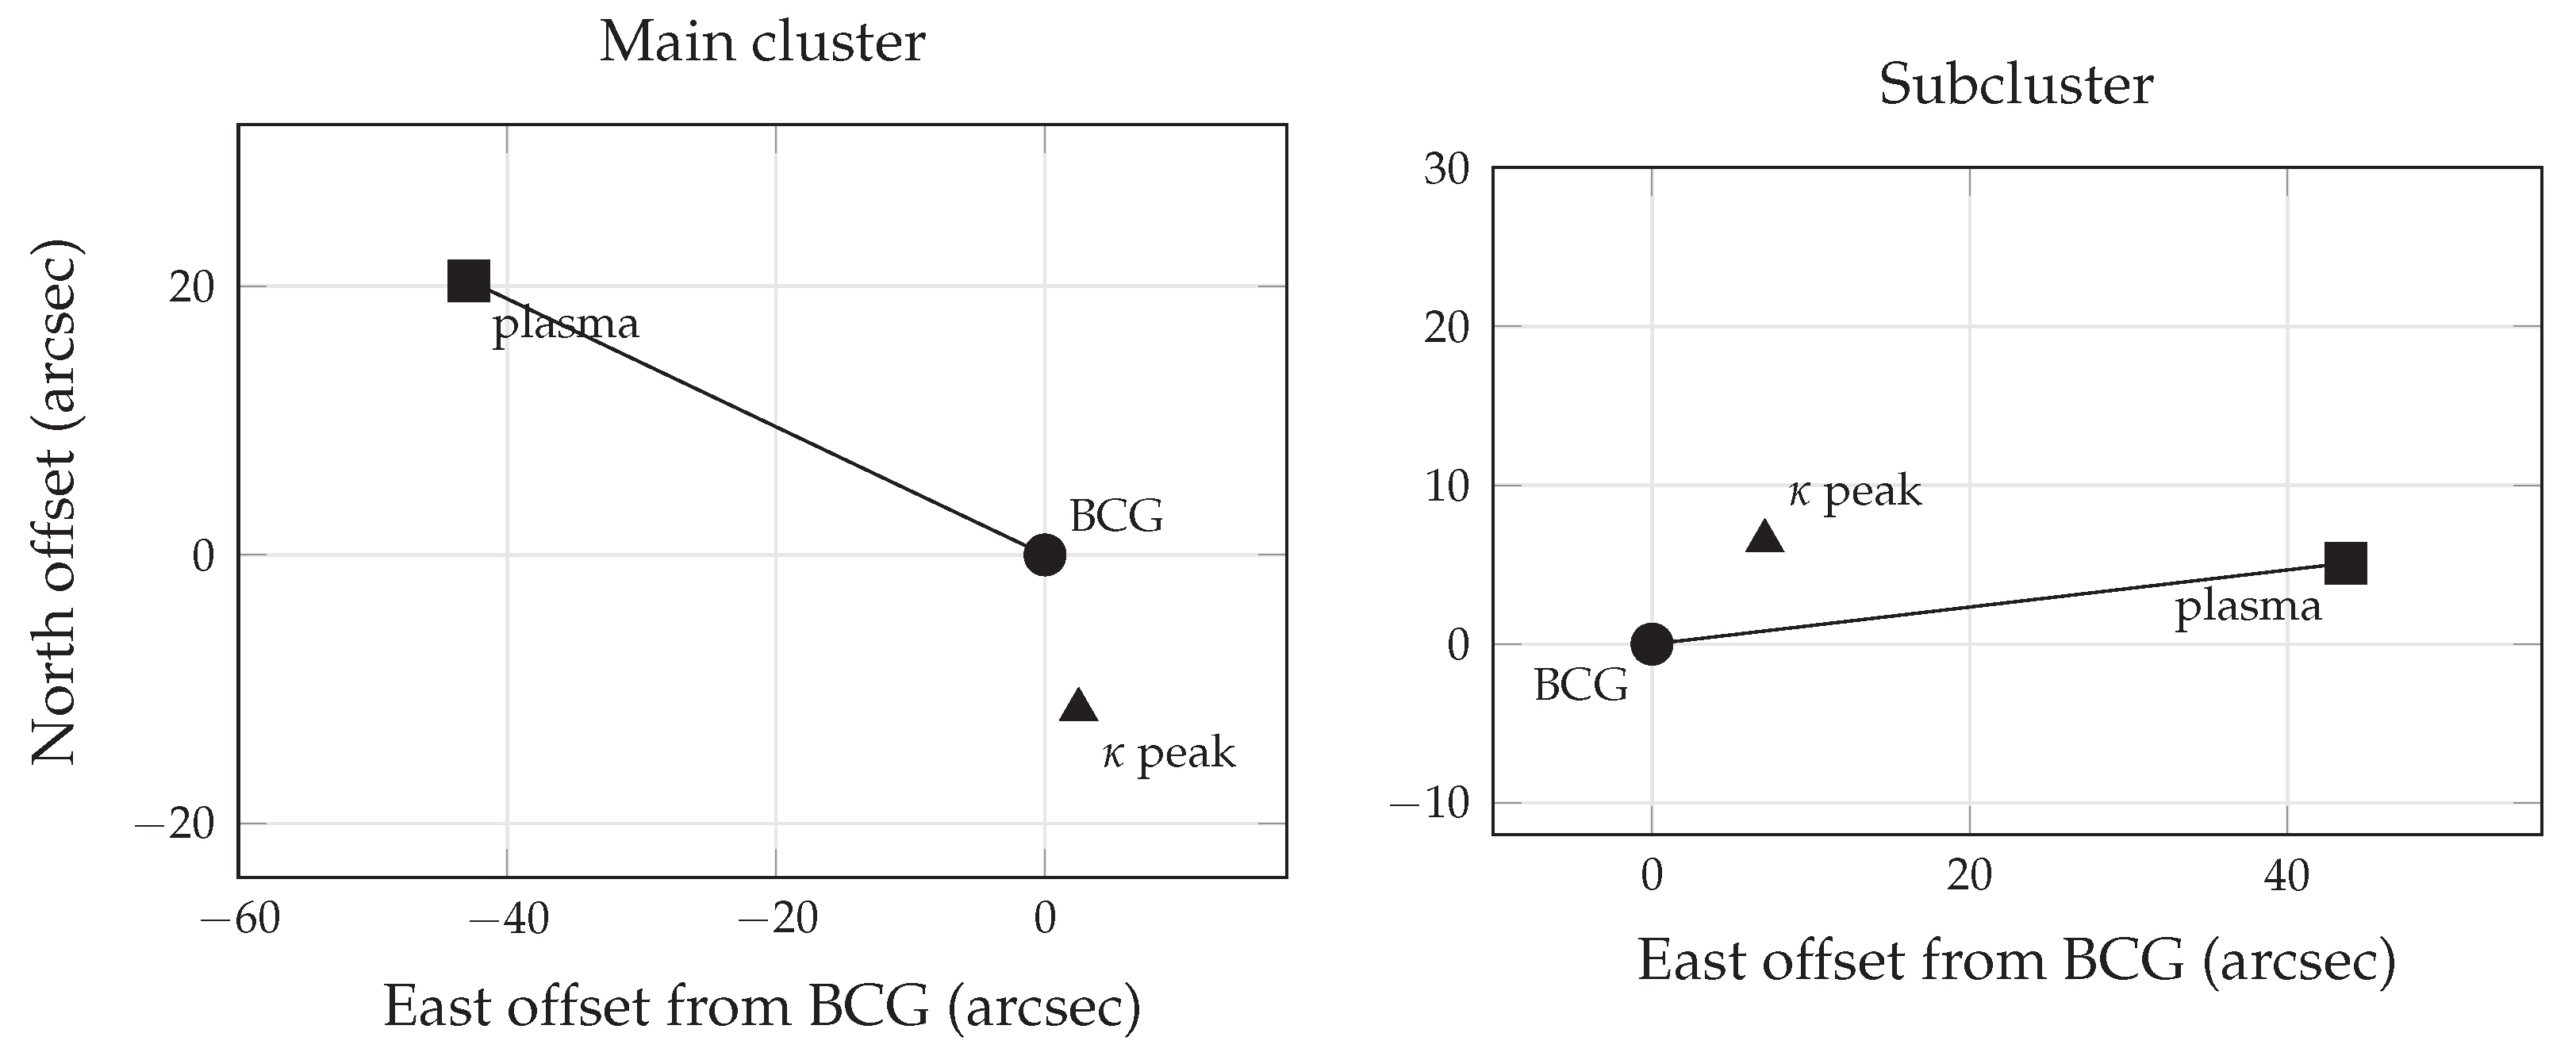
4. Source Geometry Without Mixing Convergence Estimators
The weak-lensing peak offsets reported by Clowe et al. provide a direct geometric comparison. In a local tangent plane let the BCG be the origin, let point to the X-ray plasma centroid, and let point to the corresponding reconstructed lensing maximum. From the published coordinates and peak offsets,
The resulting distances are listed in Table 2.
The original bootstrap analysis states that both reconstructed mass peaks are displaced from their respective plasma centres at about while remaining consistent with the galaxy luminosity centroids within the quoted uncertainties [1]. This position statement uses one estimator throughout and is therefore the appropriate 2006 lensing observable for the present source-geometry test.
The subcluster adds a second, independent fact. The same 100-kpc aperture measurements give
a quoted-error difference. Thus the measured baryonic mass is substantially larger at the displaced plasma location, whereas the lensing maximum is much closer to the BCG. The main-cluster baryonic aperture difference is only and is not significant, so the main component is used primarily as a geometric cross-check.
Within the retained PODA weak-field branch, the projected common source is the sum of the measured physical-axis source and the observation-field source,
Under the tested hypothesis , there is no third source to move the common-source maximum from the plasma side toward the galaxy side. The observed displacement therefore requires a nonzero, spatially structured contribution near the galaxy concentration. Equation (13) strengthens that statement for the subcluster because the ordinary baryonic aperture ordering points in the opposite direction from the lensing maximum.
This is a source-attribution statement, not yet an amplitude measurement. The Table 1 plasma values cannot be subtracted from the BCG values to obtain a rigorous numerical , and this revision makes no such claim. A quantitative observation-field surface-density map must instead come from a forward PODA solution confronted with one consistently defined shear or lensing likelihood.
5. Transport Coherence with the Fixed PODA Mode
A necessary consistency check can be performed without choosing the unknown cluster occupation. Drop the potential momentarily and consider the free part of Equation (5). A one-dimensional Gaussian envelope with initial standard deviation evolves as
This is not a substitute for the full common-potential calculation. It is a transparent gradient-dispersion benchmark: if the fixed PODA mode dispersed a 50–200 kpc cluster-scale concentration catastrophically within the observed merger time, the branch would already fail before any nonlinear refinement.
Clowe et al. quoted a core-passage timescale of order 100 Myr and a merger-scale transverse speed near from the observed system [1]. With these values and Equation (8), Table 3 follows directly from Equation (15). The associated gradient velocity scale is
The width for which at 100 Myr is only
Hence any broad cluster-scale envelope well above a few tens of kiloparsecs is not erased by the gradient term on this timescale. At 100 kpc the free broadening is about kpc. The velocity scale is – of the quoted 4700 km s−1 benchmark for widths 200–50 kpc. The distance corresponding to that merger benchmark over 100 Myr is about 481 kpc, much larger than the intrinsic free broadening.
For reference, the phase wavelength associated with the fixed mode and is
This number is not used as a fitted core radius; it simply shows that the fixed mode does not impose a hundred-kiloparsec smoothing scale at the observed merger velocity.
The same conclusion can be stated without the Gaussian ansatz. Let
For the PODA Equation (5), with the usual decaying or flux-controlled boundary terms, direct differentiation gives
The gradient energy changes the field’s shape, but it supplies no separate net force on its centroid. Thus the retained PODA branch contains no intrinsic drag term that would compel an observation-field centroid to follow the displaced plasma. Its centroid responds to the same common gravitational potential as the physical-axis matter, while the unknown initial occupation and phase determine the detailed post-merger solution.
Figure 2.
The fixed PODA mode lies in the weak-dispersion regime for cluster-scale widths over a 100 Myr interval. The calculation is a free-envelope benchmark, not a replacement for the full common-potential merger solution.
Figure 2.
The fixed PODA mode lies in the weak-dispersion regime for cluster-scale widths over a 100 Myr interval. The calculation is a free-envelope benchmark, not a replacement for the full common-potential merger solution.
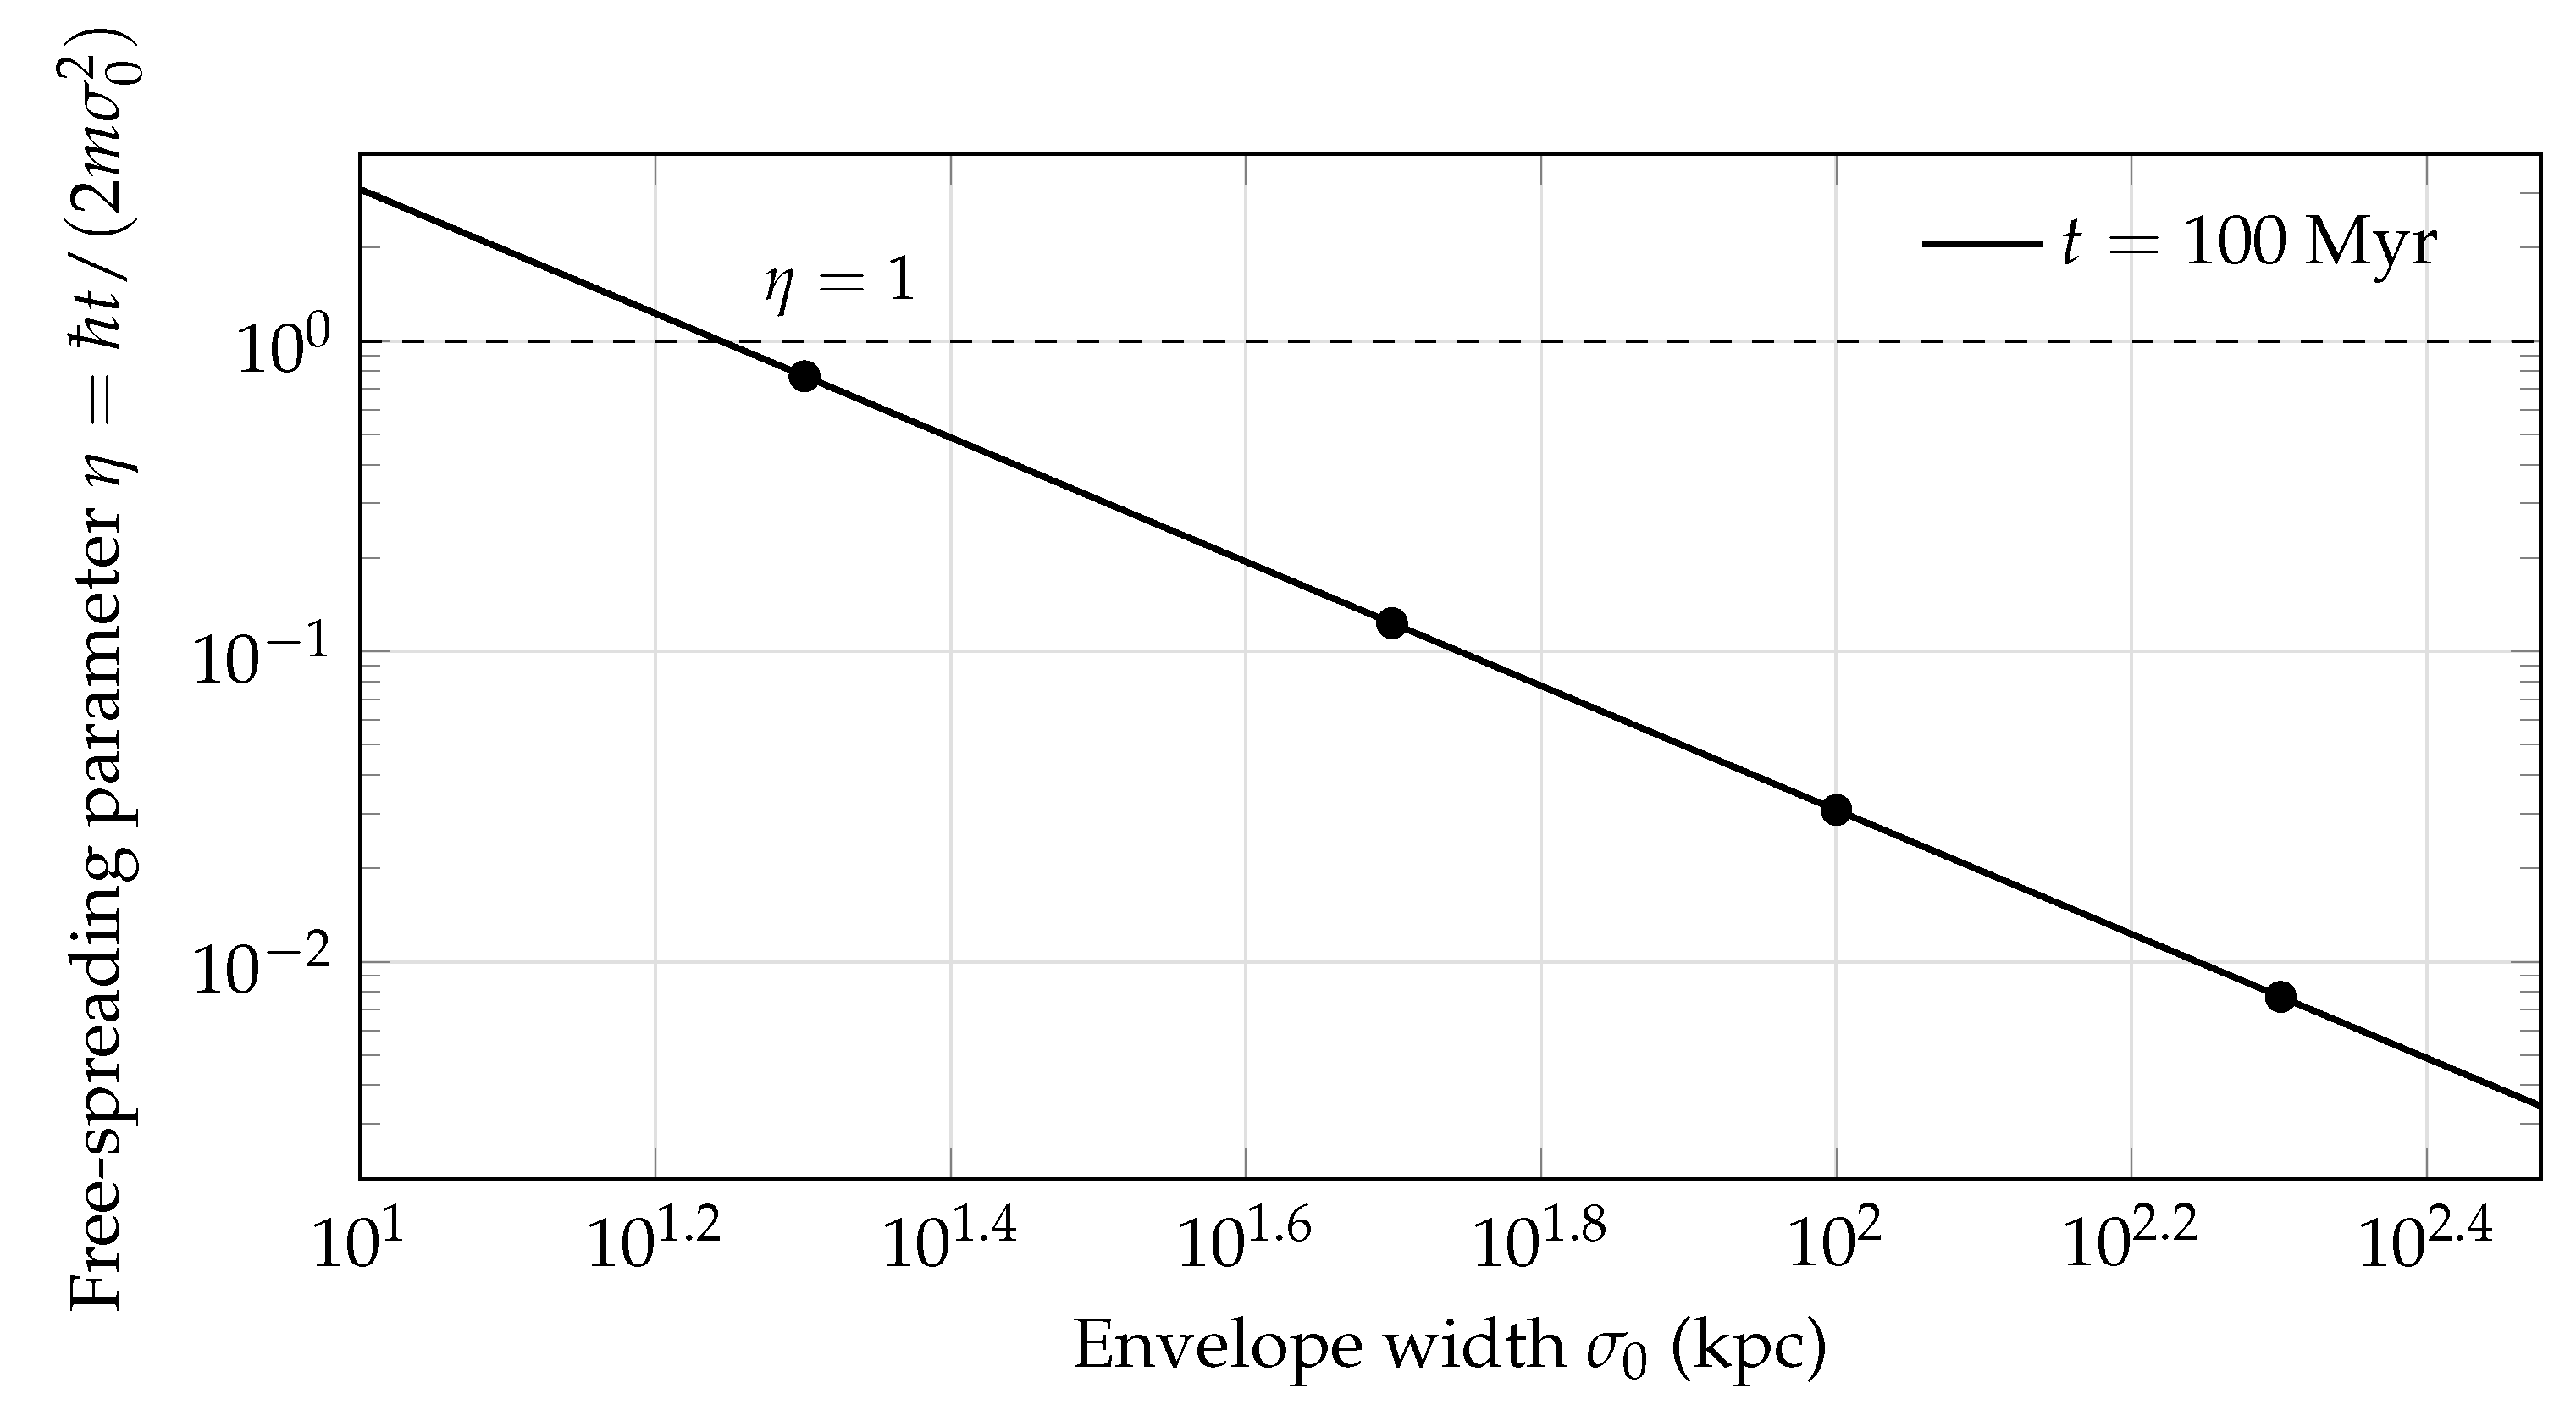
6. A Record-Level Geometry Check from the Public JWST Catalogue
The preceding results did not use the 2025 strong-lensing catalogue. We now bring in that catalogue at a deliberately earlier level than a mass reconstruction. Cha et al. released sky coordinates for 146 multiple images belonging to 37 source systems [2,3]. Image knots and repeated components of the same background source are not statistically independent. We therefore group entries by the leading integer system identifier and replace each system by the mean sky position of its listed images. This leaves 37 system centroids.
For each system we compute angular distances in a tangent plane. A component-specific comparison assigns the system to the nearer of the two BCGs and compares its distance to that BCG with the distance to the corresponding X-ray plasma centroid. A second, component-free comparison simply asks whether the system lies closer to either BCG than to either plasma centroid. No source redshift, lens mass model, dark component, or reconstructed convergence map enters these distances.
Figure 3.
System-level geometry of the 2025 public strong-lensing catalogue. Each point is the centroid of the listed images of one background-source system; individual image knots are not counted as independent systems. Lines connect each BCG to the corresponding 2006 X-ray plasma centroid. The plot uses observed sky coordinates only and is not a convergence reconstruction.
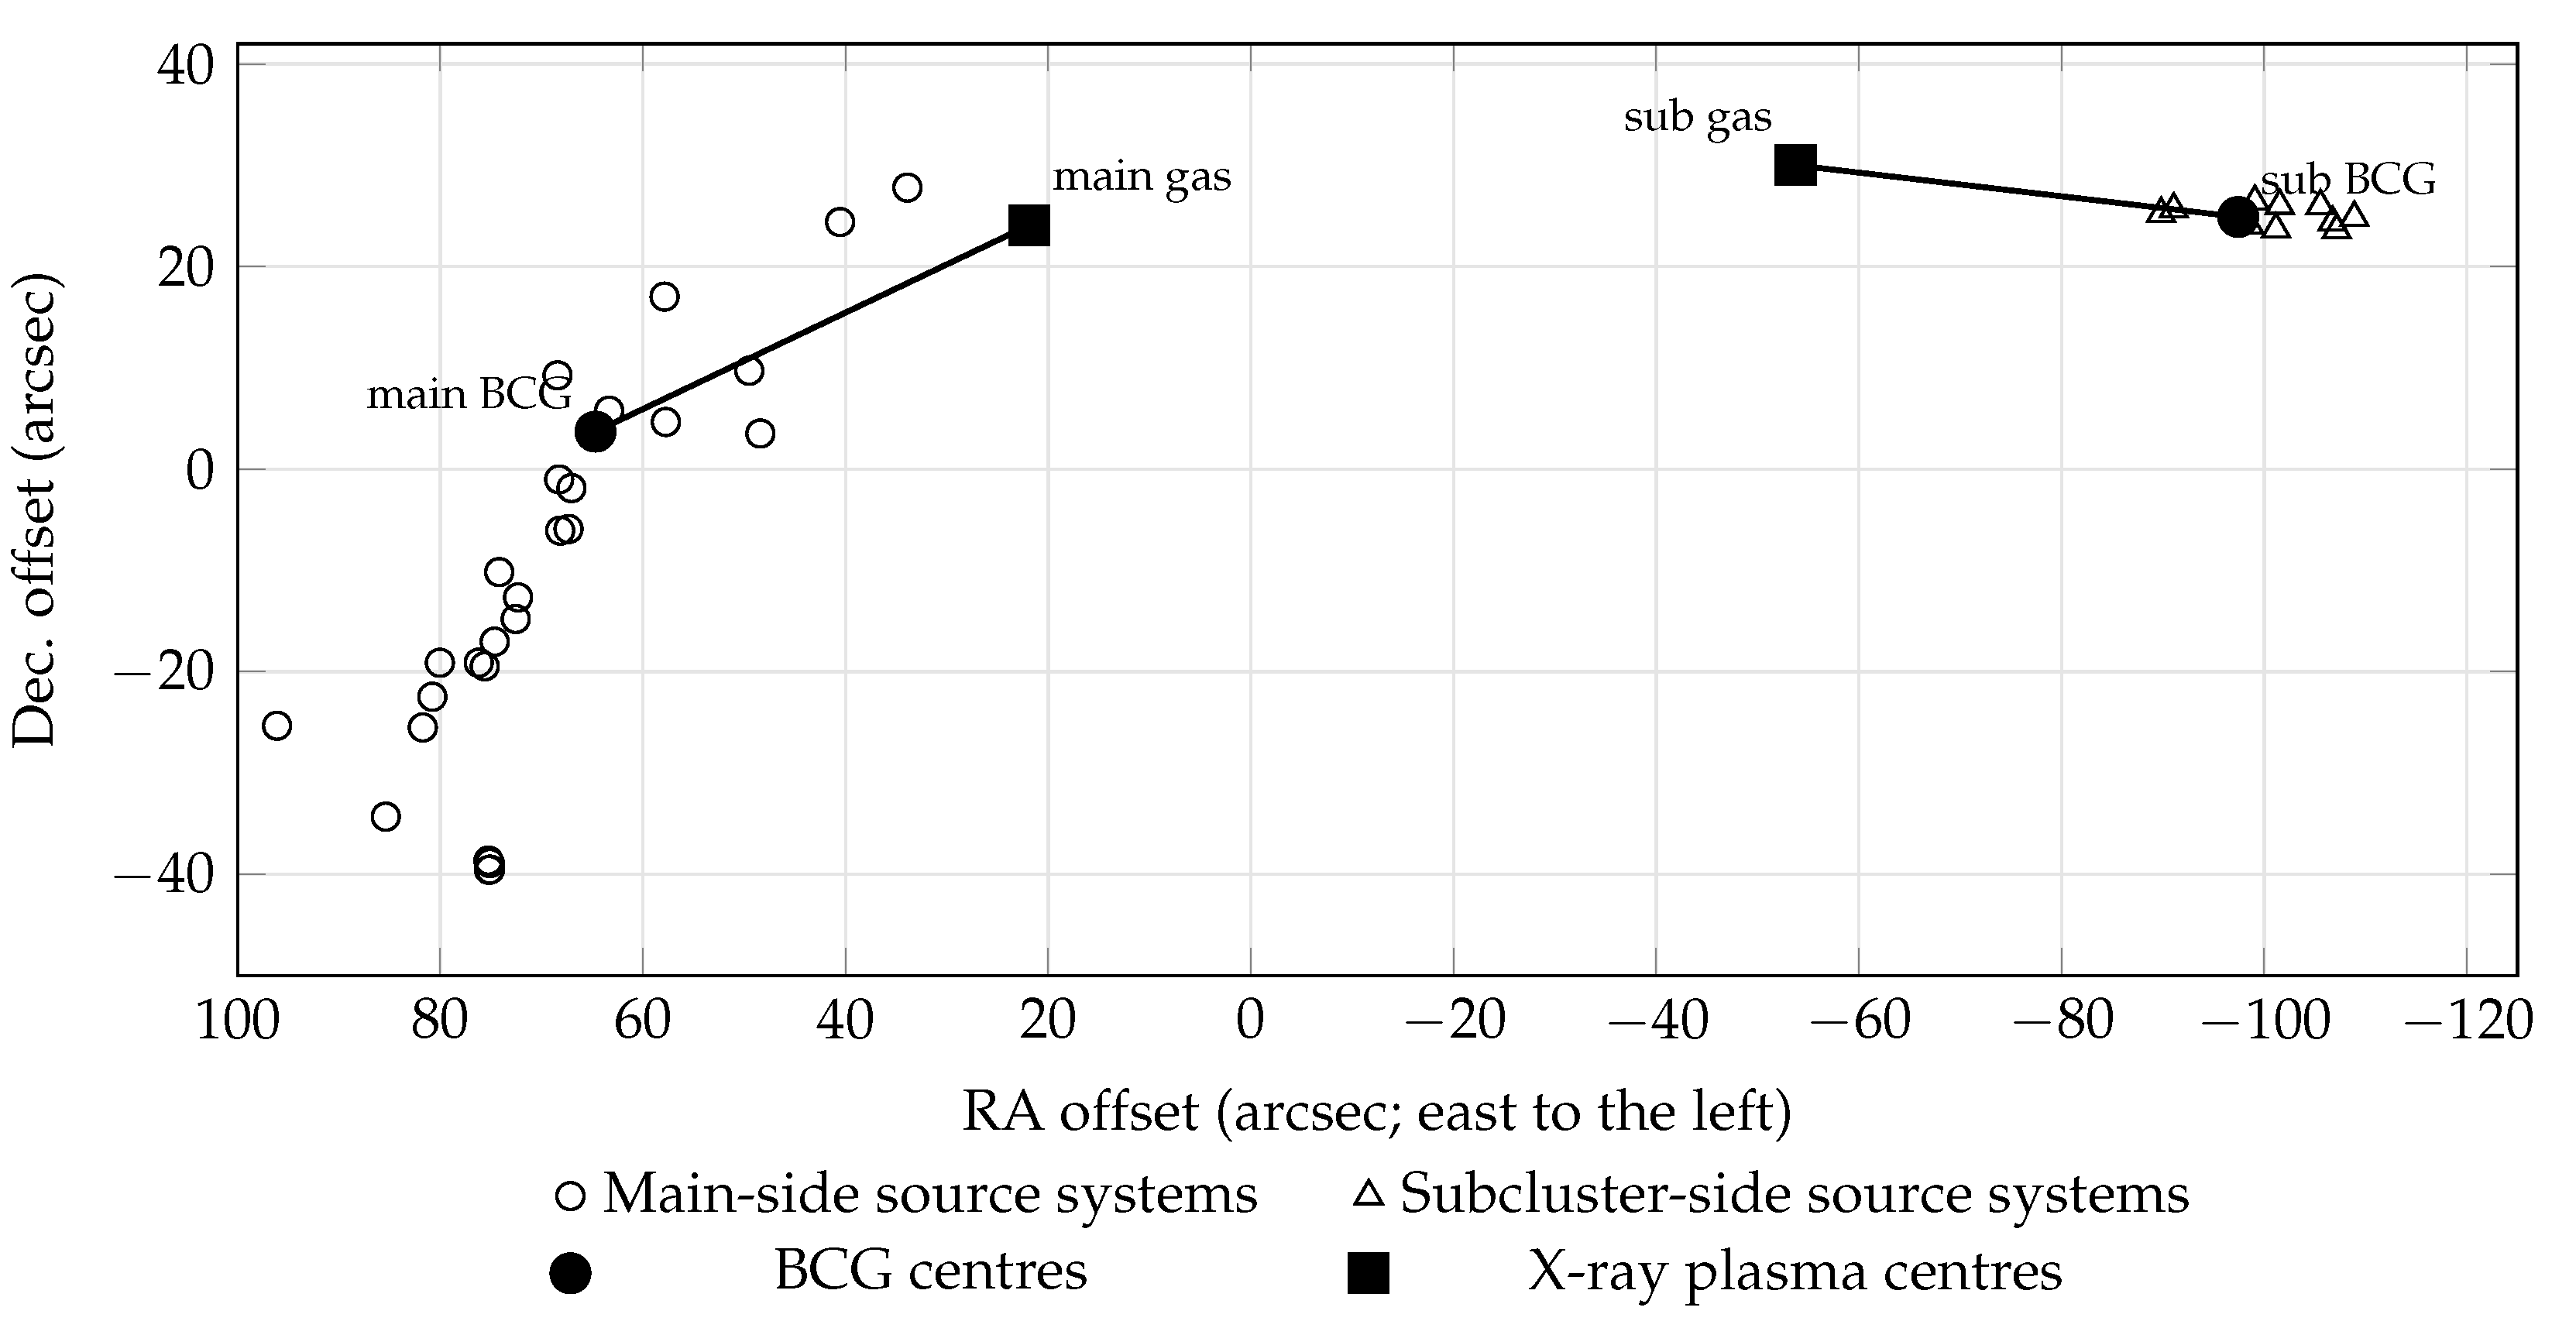
The result is summarized in Table 4. On the main-cluster side, 25 of 27 systems are closer to the BCG than to the main plasma centroid. On the subcluster side, all 10 are closer to the BCG. In the component-free statistic, 35 of 37 system centroids are closer to one of the two BCGs than to either plasma centroid. The median nearest-center distance is to a BCG and to a plasma centroid, a median advantage of . A nonparametric system bootstrap gives – for the 95% interval of that median advantage.
For the component-specific geometry it is also useful to introduce the dimensionless coordinate
so that at the BCG and at the corresponding plasma centroid. The median values are for the main-side systems and for the subcluster-side systems. The strong-lensing records are therefore concentrated on the BCG side of the BCG–plasma axis rather than between the BCG and the displaced gas.
This statistic has a deliberately limited interpretation. Multiple-image positions are produced jointly by the lens potential, source position, selection, and catalogue construction; their sky locations are not direct samples of surface density. We therefore do not convert the 35/37 count into a physical p-value or use it to estimate . Its role is simpler: the raw high-information lensing constraints occupy the same galaxy-centred regions required independently by the 100-kpc source-attribution result. That geometric consistency is obtained without importing a separate mass model.
6.1. Later Mass Reconstructions as Held-Out Morphology Checks
The full Cha et al. reconstruction combines the 146 strong-lensing constraints with a weak-lensing source density of roughly 398 arcmin−2 and resolves at least three main-cluster subclumps aligned with bright cluster galaxies. The reported mass pattern follows the intracluster light with a modified Hausdorff distance of kpc [2]. A later JWST imaging and NIRSpec analysis uses 135 secure multiple images from 27 spectroscopically confirmed background galaxies and places the dominant subcluster mass component within kpc of its BCG [4].
Neither reconstruction supplies an equation used in the PODA calculation. They are morphology checks. The fixed coefficient and the centroid identity in Section 5 make such an alignment dynamically admissible. A future full two-dimensional calculation may use part of the available cluster data to estimate the target-specific initial state, but only records not used in that calibration may then be counted as independent validation.
7. What the Present Calculation Establishes—And What It Does Not
The results can be separated cleanly.
- Source attribution. The 2006 weak-lensing maxima lie much closer to the BCGs than to the displaced plasma centroids, while the subcluster’s measured baryonic aperture mass is significantly larger at the plasma position. Within the zero-independent-dark-component PODA common-source equation this requires a nonzero, galaxy-side observation-field contribution. No numerical field amplitude is inferred from the mixed-definition Table 1 entries.
- Transport. The fixed normal-mode coefficient leaves a 50–200 kpc observation-field concentration coherent over 100 Myr, and Equation (20) shows that the gradient term contributes no independent centroid drag. The measured plasma displacement therefore does not kinematically require the observation field to share the plasma centroid.
- Independent lensing-record geometry. The public 2025 multiple-image coordinates concentrate on the BCG side of the BCG–plasma geometry: 35 of 37 source-system centroids are nearer to a BCG than to either plasma centroid. This is a raw-coordinate consistency test, not a mass reconstruction.
- What remains to be computed. The absolute amplitude, full two-dimensional morphology, and post-collision phase of require one Bullet-Cluster initial–boundary data set. This is not a missing universal law: it is the ordinary target-specific data needed to select a solution. The next calculation must state which records calibrate those data and which records remain unused for validation.
This distinction is consequential. The Bullet Cluster does not presently falsify the fixed PODA normal-mode branch: its required source geometry is dynamically admissible and its measured aperture inversion has exactly the sign expected if an objective observation field carries part of the gravitational source. But the current theory is not yet entitled to claim a full fit of the lensing map. The missing bridge is specific rather than open-ended.
8. The Correct Closure Standard: A PODA Initial–Boundary-Value Problem
The remaining system-specific freedom should not be confused with a failure of the field equations. A universal field theory determines a family of solutions; a particular astronomical system is selected by its source data, initial state and boundary conditions. Relativistic orbit calculations follow exactly this logic: the gravitational field equations are universal, whereas a particular planet’s initial position, velocity and orbital elements belong to the solution rather than to the theory’s universal constants.
The same distinction applies here. Let
denote the universal data of the retained PODA branch, with the previously calibrated intrinsic mode coefficient m fixed once. Let
denote the data selecting one Bullet-Cluster solution. Equivalently, when the envelope has no nodes on a simply connected region, may be replaced by the density-current pair introduced below. The prediction map is then
The theory is not required to derive from . What it must do is evolve every admissible declared consistently with the same equations and the same universal coefficients.
8.1. Occupation Is Conserved Data, Not an Extra Coupling
Multiplying Equation (5) by , subtracting its complex conjugate, and using the reality of gives
For any control volume V,
Thus an isolated or flux-specified realization conserves
This conservation law does not have to predict N from the baryonic mass. It states how a specified occupation evolves. In the same way, conservation of orbital energy does not have to determine a planet’s initial orbital energy before an orbit can be calculated.
8.2. Minimal Observation-Field Initial Data
Write the nonrelativistic PODA envelope on a region where as
Then Equation (27) has the flux form
Hence the target-specific observation-field state can be specified by itself or, on a connected simply connected non-nodal domain, by and satisfying
Indeed,
can then be integrated to determine up to a constant global phase, which does not affect , or lensing. Multiply connected domains additionally require the circulation sector around independent loops. These quantities are initial data of the cluster solution. They are not new gravitational couplings and do not have to be universal.
8.3. Why Density Alone Is Insufficient—And Why This Is Ordinary Initial-Value Physics
Two envelopes
have the same instantaneous density, occupation and gravitational potential, but opposite currents. Their subsequent centroids move in opposite directions. This does not signal a failure of PODA closure; it simply shows that a first-order-in-time complex field requires phase/current information in addition to density, just as an orbit requires velocity in addition to position.
For the fixed PODA intrinsic coefficient, a free Gaussian of initial width obeys
Table 5 uses Myr and an illustrative solely to show the sensitivity to the specified initial current. The value is not fitted to the Bullet Cluster.
The table therefore identifies which component of matters dynamically. It does not create an additional closure condition.
9. How Bullet-Cluster Initial Data May Legitimately Be Obtained
The target-specific data in Equation (25) can enter a physical prediction in three ordinary ways.
- Independent measurement or historical reconstruction. A physical-axis source history, galaxy kinematics, pre-merger constraints or another non-target record may directly constrain or its density-current representation.
- Calibration on a declared subset of the same astronomical system. Some Bullet-Cluster records may be used to estimate the target-specific initial data. They then belong to calibration, not validation. The remaining shear components, multiple-image positions, spatial regions, epochs or other records provide the test.
- A stronger PODA formation calculation. A future microscopic formation theory may predict the initial observation field from earlier two-axis history. This would reduce the amount of calibration and strengthen the prediction, but it is not required for the field theory itself to be closed.
This distinction removes the over-strong requirement imposed in the preceding revision. The record-to-Cauchy factorization condition developed there remains useful only for the third, strongest case: a calibration-free blind prediction. If a declared fine-record signature happens to satisfy
then the record fixes the same gravitational Cauchy class without calibration ambiguity. PODA information theory explains why such a condition is nontrivial: a state-erased record generally cannot be inverted to recover the hidden observation state. PODA quantum information theory supplies conditional Fisher metrics for quantifying which observation directions remain distinguishable after physical-axis nuisance motion is removed. PODA quantum computing constrains dynamically admissible observation histories. These are powerful tools for estimating or predicting ; none is a prerequisite for the ordinary initial–boundary-value problem in Equation (26).
The same normal-mode reduction used throughout the paper also gives a local bridge when a formation calculation supplies the canonical mode history. For carrier frequency ,
so a supplied pair determines the weak-field envelope. This is one possible way to obtain initial data, not the only logically admissible one.
10. Disjoint Non-Lensing Phase-Space Initialization
The orbit-calculation standard is applied literally. The theory parameters are fixed first; the cluster-specific initial data are then estimated from galaxy positions and redshift velocities. Lensing is not used to define the phase-space partition described in this section.
10.1. The Bullet Component and the Main Component Are Disjoint
The DS+ application to 231 redshifts identifies a nine-galaxy Bullet component with projected centre
mean rest-frame velocity , and line-of-sight dispersion
To transfer the spatial shape to the published Barrena table, we rank its 78 members by distance from this DS+ phase-space centroid after coordinatewise robust-MAD normalization of . The nine nearest members are catalogue IDs
Their projected covariance has principal one-sigma axes
The DS+ centre, rather than the nine-member sample mean, is retained as the Bullet centre because it comes from the larger redshift catalogue.
The remaining 69 Barrena members define the main component. A minimum-covariance estimate gives
with axes
Using exactly the same 69 velocities, the rest-frame gapper estimator gives
A 5000-resample nonparametric bootstrap gives 16–50–84 percentiles . Thus the main spatial shape and main velocity moment are determined from one disjoint non-lensing population rather than from a whole-cluster velocity statistic.
10.2. Low-Order PODA Moment Closure
For one explicit Cauchy realization we retain the isotropic Gaussian moment closure
which gives
This is a target initial-data estimator inside the retained PODA branch, not a universal cluster mass–dispersion relation. With Equations (41)–(44) and the independently reported central Bullet dispersion, it gives
After subtracting the non-lensing gas and stellar components already fixed by the four 100-kpc apertures, the corresponding observation-field masses are
The Gaussian moment ratio at the central DS+ dispersion is 5.99. It is not compared numerically with a reported ratio because the two masses have different definitions. A provisional earlier calculation that produced 9.92 used the full-cluster dispersion as the main-component dispersion while adding the Bullet component separately; that bookkeeping is not retained here.
The physical-axis gas and stellar maps are unchanged. The two observation-field components inherit the disjoint galaxy-side centres and covariances. Opening the 2006 weak-lensing peak positions only after this source is frozen gives
The agreement is a location test; neither weak-lensing peak was used to move a source component.
11. Absolute Deflection from the Frozen PODA Source
For a physical projected source the one-plane deflection used here is
The FFT implementation is normalized in physical kpc and solar-mass units. The same code was checked against the analytic circular-Gaussian relation
and differs by only 0.28–0.63 percent over 50–400 kpc. No per-source mass normalization is introduced after Equation (52).
For a source at redshift , write the geometric factor as
We do not insert an external cosmological distance model. Instead, is treated as a target-specific nuisance geometry learned only from the training sources, constrained by and monotonicity. This isolates the test of the frozen mass map from a separate cosmological-distance calculation.
12. Twenty-Seven Spectroscopic Background Galaxies: Nested Calibration and Holdout
Rihtaršič et al. report 135 secure multiple images from 27 background galaxies with spectroscopic redshifts spanning approximately [4]. To prevent a source with many identified knots from dominating the statistic, the present calculation preselects one gold multiply-imaged feature for each distinct background galaxy. This gives 27 independent source galaxies, 79 image positions, and –6.64. Their published lens mass model is not used.
The Bullet velocity dispersion is an ordinary system-specific initial datum. We therefore allow it to be calibrated, exactly as orbital elements may be calibrated before a relativistic prediction, but the calibration and validation records are kept separate. The procedure is nested:
- Sort the 27 galaxies by spectroscopic redshift and assign them round-robin to five outer folds. Each outer fold is untouched while the remaining galaxies are used for initialization.
- On the outer training set, scan the predeclared interval in 25 steps, covering the quoted DS+ one-sigma range.
- For each trial , determine the best geometric factor of every training galaxy, fit a bounded monotone to all but one training galaxy, and evaluate that omitted training galaxy. The inner leave-one-galaxy-out source-plane scatter chooses .
- Refit on the complete outer training set at the selected , freeze both quantities, and evaluate every galaxy in the untouched outer fold.
Every source retains its own unknown two-dimensional source position, which is eliminated by centering the lens equation. No held-out galaxy receives its own lens-strength parameter.
For PODA the five training folds select
close to the independent DS+ value . The pooled outer-held-out source-plane angular scatter is
Two controls undergo the same validation discipline. Baryons alone contain no Bullet observation-field amplitude to calibrate and give
For the placement control the observation-field components have the same equations and the Bullet amplitude is independently calibrated on each training fold, but the components are forced onto the X-ray plasma centroids. Its selected Bullet dispersions are 825–925 and its outer scatter is
The galaxy-side PODA source is better on all 27 outer-held-out galaxies. The median per-galaxy RMS ratios are
12.1. What Is Being Tested
The nested result is stronger than a morphology comparison but narrower than a complete merger reconstruction. It tests whether one physically normalized galaxy-side PODA source, with one object-specific Bullet amplitude chosen only from training records, transfers across independent background galaxies and their spectroscopic redshifts. It does not test a PODA cosmological distance–redshift law because is calibrated nonparametrically. It also does not evolve a resolved three-dimensional merger; the source remains a low-order Cauchy representation of the observed phase-space populations.
The principal residual uncertainty now lies in spatial resolution and membership, not in an unclosed gravitational force. The main component is represented by one robust covariance although the JWST constraints resolve more structure. Likewise, mapping the DS+ nine-galaxy group from a 231-redshift catalogue to the older 78-member Barrena table is an observational approximation. These limitations can be improved with denser non-lensing spectroscopy without changing Equations (5)–().
13. Conclusions
The Bullet Cluster can be treated in PODA with the same logic used for any initial–boundary-value theory. The universal common action, weak-field equations and intrinsic observation-mode coefficient are fixed first. Object-specific phase-space data then select one cluster solution; they need not be universal consequences of the action.
The latest calculation removes an important provisional ambiguity. The Bullet nine-member DS+ component is separated from the Barrena member table before the main component is estimated. The remaining 69 galaxies give a main projected scale of 263.4 kpc and a rest-frame gapper dispersion of ; the Bullet component has projected scale 94.0 kpc and the independent DS+ dispersion . This disjoint phase-space state places the two frozen PODA source maxima only and from the later weak-lensing maxima. The earlier nominal common-mass ratio 9.92 is not retained, because it arose from using a whole-cluster dispersion as the main-component datum while adding the Bullet subgroup separately.
The decisive step is the nested spectroscopic strong-lensing test. One gold multiply-imaged feature from each of 27 independent background galaxies supplies 79 image positions over –6.64. In every outer fold the Bullet amplitude and the monotone lens geometry are selected only on the training galaxies. PODA chooses –825 , close to the non-lensing DS+ measurement, and gives a pooled outer-held-out source-plane scatter of . Moving the same kind of extra source to the plasma centroids gives after its own training-only amplitude calibration; baryons alone give . PODA is better on all 27 outer galaxies.
The result therefore goes beyond the statement that a galaxy-side source can be drawn through the observed lensing peaks. A system-specific amplitude inferred on one subset of background sources transfers to disjoint sources without changing the PODA dynamics. What remains is resolution: the main cluster is not one Gaussian object, and the available non-lensing spectroscopy does not yet supply the full three-dimensional phase-space distribution. Those are ordinary improvements of the initial data, analogous to refining orbital elements, not missing terms in the gravitational law.
Data and Reproducibility
The accompanying scripts reproduce every stage used in the present revision. The non-lensing member table is stage8barrenamembers.csv. bulletpodastage16disjointphasespace.py constructs the disjoint 69+9 phase-space initialization, computes the physical deflection, performs the nested five-fold amplitude calibration, and writes stage16nested27galaxyholdout.csv. The 27-galaxy representative spectroscopic catalogue used here is rihtarsic2026goldrepresentative.csv; it contains one predeclared gold multiply-imaged feature per distinct spectroscopic background galaxy. Figure 4, Figure 5 and Figure 6 are generated directly by the same script. The earlier Stage-11 Gaussian normalization test is retained in the reproducibility package. External references supply measured positions, redshifts and phase-space statistics only; no external dark-matter, modified-gravity or merger-simulation equation enters the PODA forward dynamics.
References
- Clowe, D.; et al. A Direct Empirical Proof of the Existence of Dark Matter. Astrophys. J. Lett. 2006, 648, L109–L113. [Google Scholar] [CrossRef]
- Cha, S.; et al. A High-Caliber View of the Bullet Cluster through JWST Strong and Weak Lensing Analyses. Astrophys. J. Lett. 2025, 987, L15. [Google Scholar] [CrossRef]
- Cha, S.; et al. The data for A High-Caliber View of the Bullet Cluster Through JWST Strong and Weak Lensing Analyses. Zenodo 2025. [Google Scholar] [CrossRef]
- Rihtaršič, G.; et al. Mapping dark matter in the Bullet Cluster using JWST imaging and spectroscopy. Astron. Astrophys. 2026, 710, A207. [Google Scholar] [CrossRef]
- Barrena, R.; Biviano, A.; Ramella, M.; Falco, E. E.; Seitz, S. The dynamical status of the cluster of galaxies 1E0657–56. Astron. Astrophys. 2002, 386, 816–828. [Google Scholar] [CrossRef]
- Benavides, J. A.; Biviano, A.; Abadi, M. G. DS+: A method for the identification of cluster substructures. Astron. Astrophys. 2023, 669, A147. [Google Scholar] [CrossRef]
- Cho, B. Y.; Jee, M. J.; Joo, H.; Cha, S.; Kim, H. Joint JWST–DECam Lensing Reveals That the Bullet Cluster Is a Minor Merger. Astrophys. J. 2026, 1005, 28. [Google Scholar] [CrossRef]
Figure 4.
Disjoint non-lensing phase-space initialization. The Bullet nine-member subset is mapped to the published DS+ phase-space centroid; the main component is estimated from the remaining 69 Barrena members. No lensing coordinate enters the partition.
Figure 4.
Disjoint non-lensing phase-space initialization. The Bullet nine-member subset is mapped to the published DS+ phase-space centroid; the main component is estimated from the remaining 69 Barrena members. No lensing coordinate enters the partition.
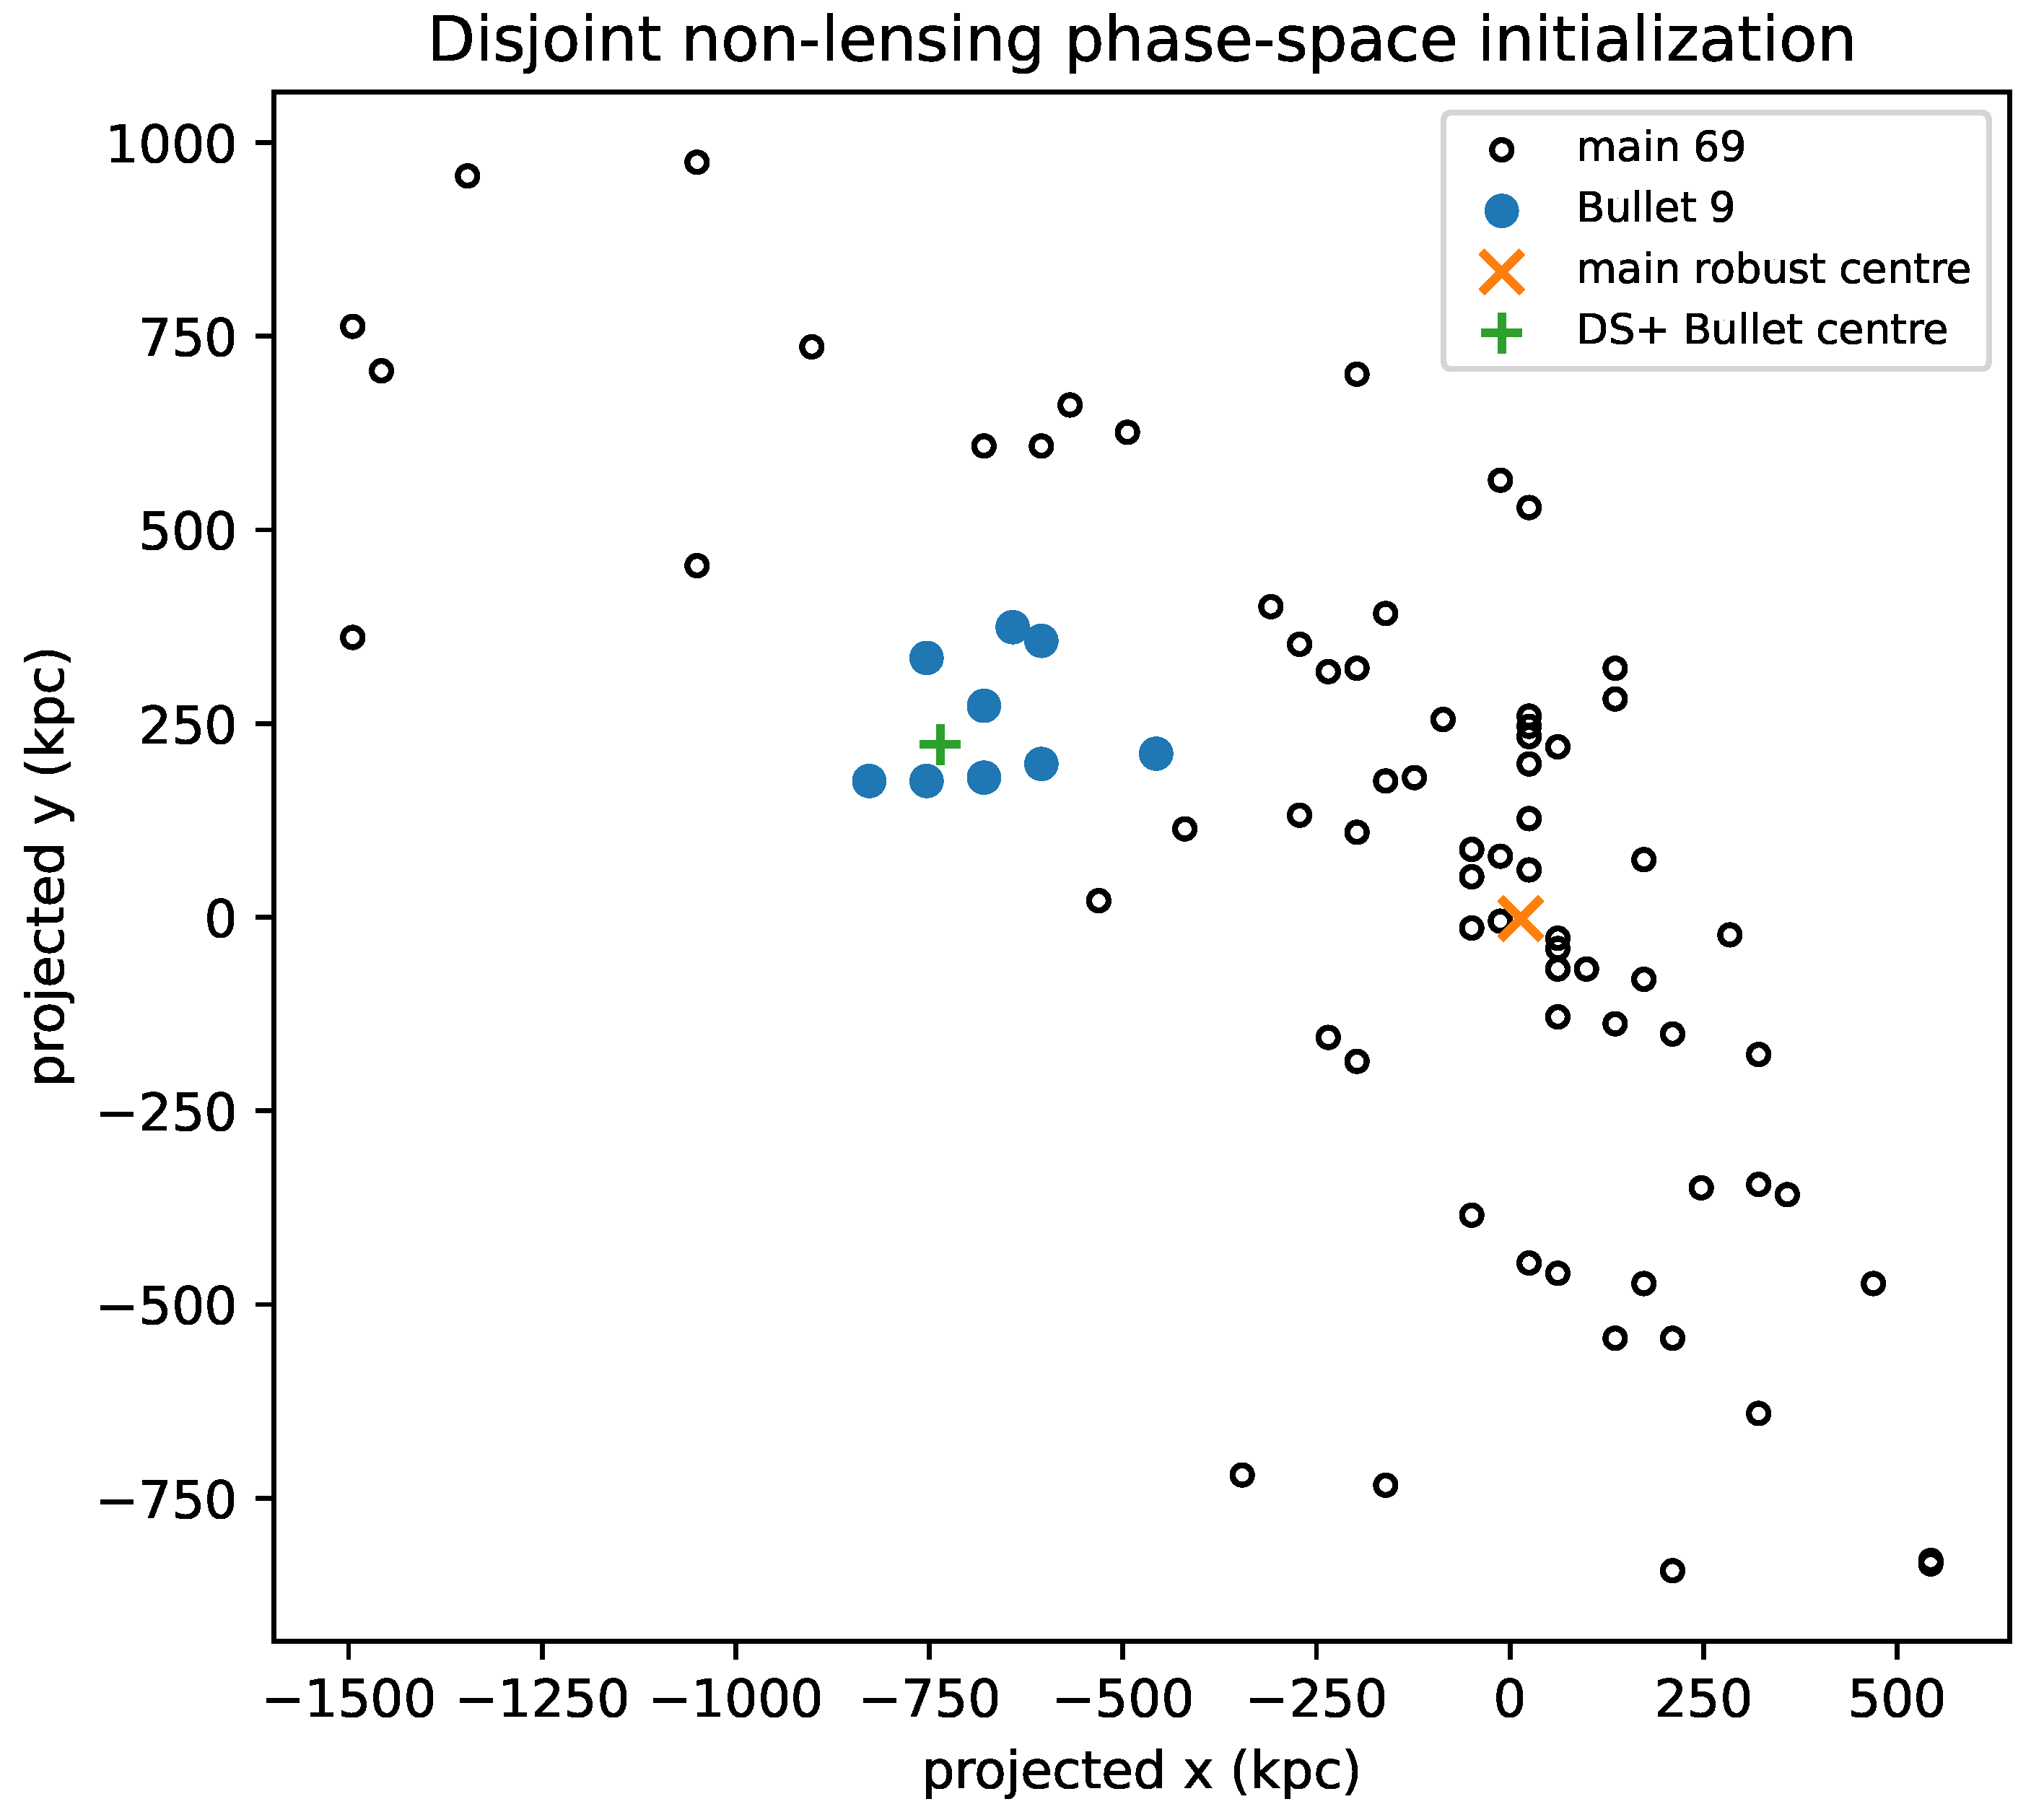
Figure 5.
Nested 27-galaxy validation. The Bullet initial amplitude and the monotone source-distance efficiency are calibrated only on the outer training galaxies and are frozen before each outer fold is evaluated. Values are equivalent angular source-plane scatters.
Figure 5.
Nested 27-galaxy validation. The Bullet initial amplitude and the monotone source-distance efficiency are calibrated only on the outer training galaxies and are frozen before each outer fold is evaluated. Values are equivalent angular source-plane scatters.
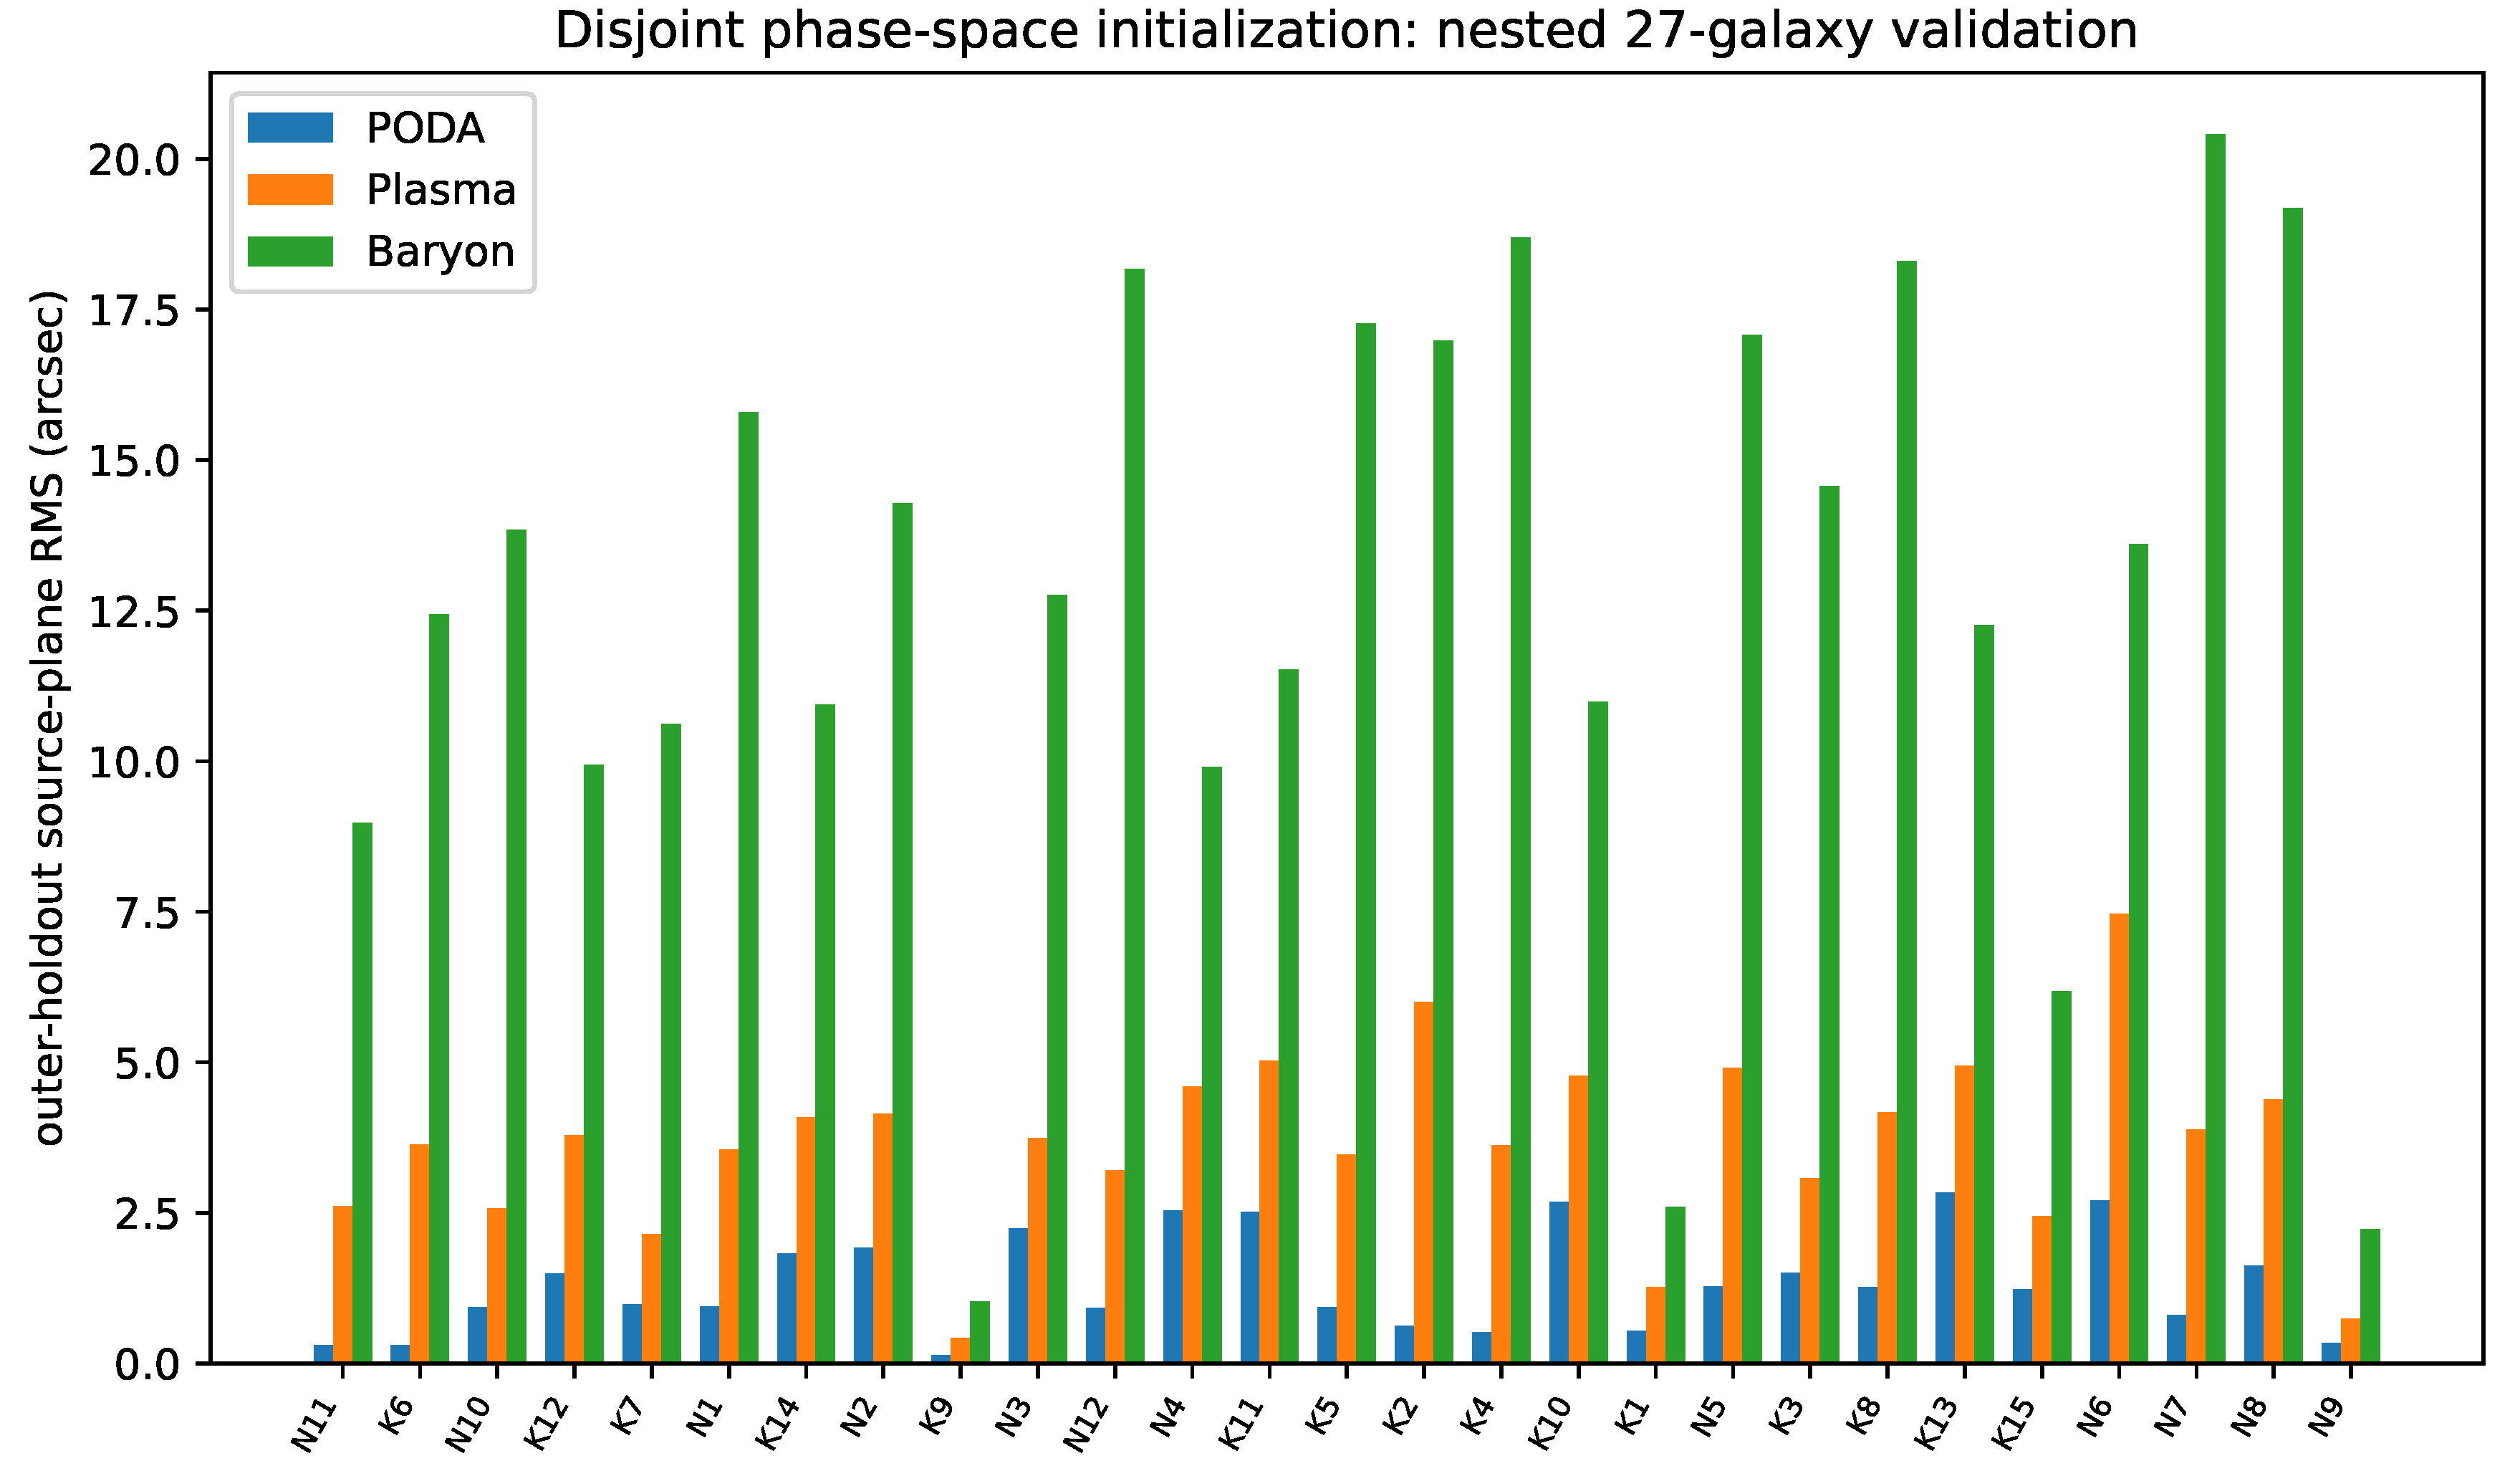
Figure 6.
Training-only Bullet velocity-dispersion calibration. The PODA folds select 800–825 , within the independent DS+ interval and close to its central value. The plasma-centred control requires a different training optimum but remains substantially worse on the outer galaxies.
Figure 6.
Training-only Bullet velocity-dispersion calibration. The PODA folds select 800–825 , within the independent DS+ interval and close to its central value. The plasma-centred control requires a different training optimum but remains substantially worse on the outer galaxies.
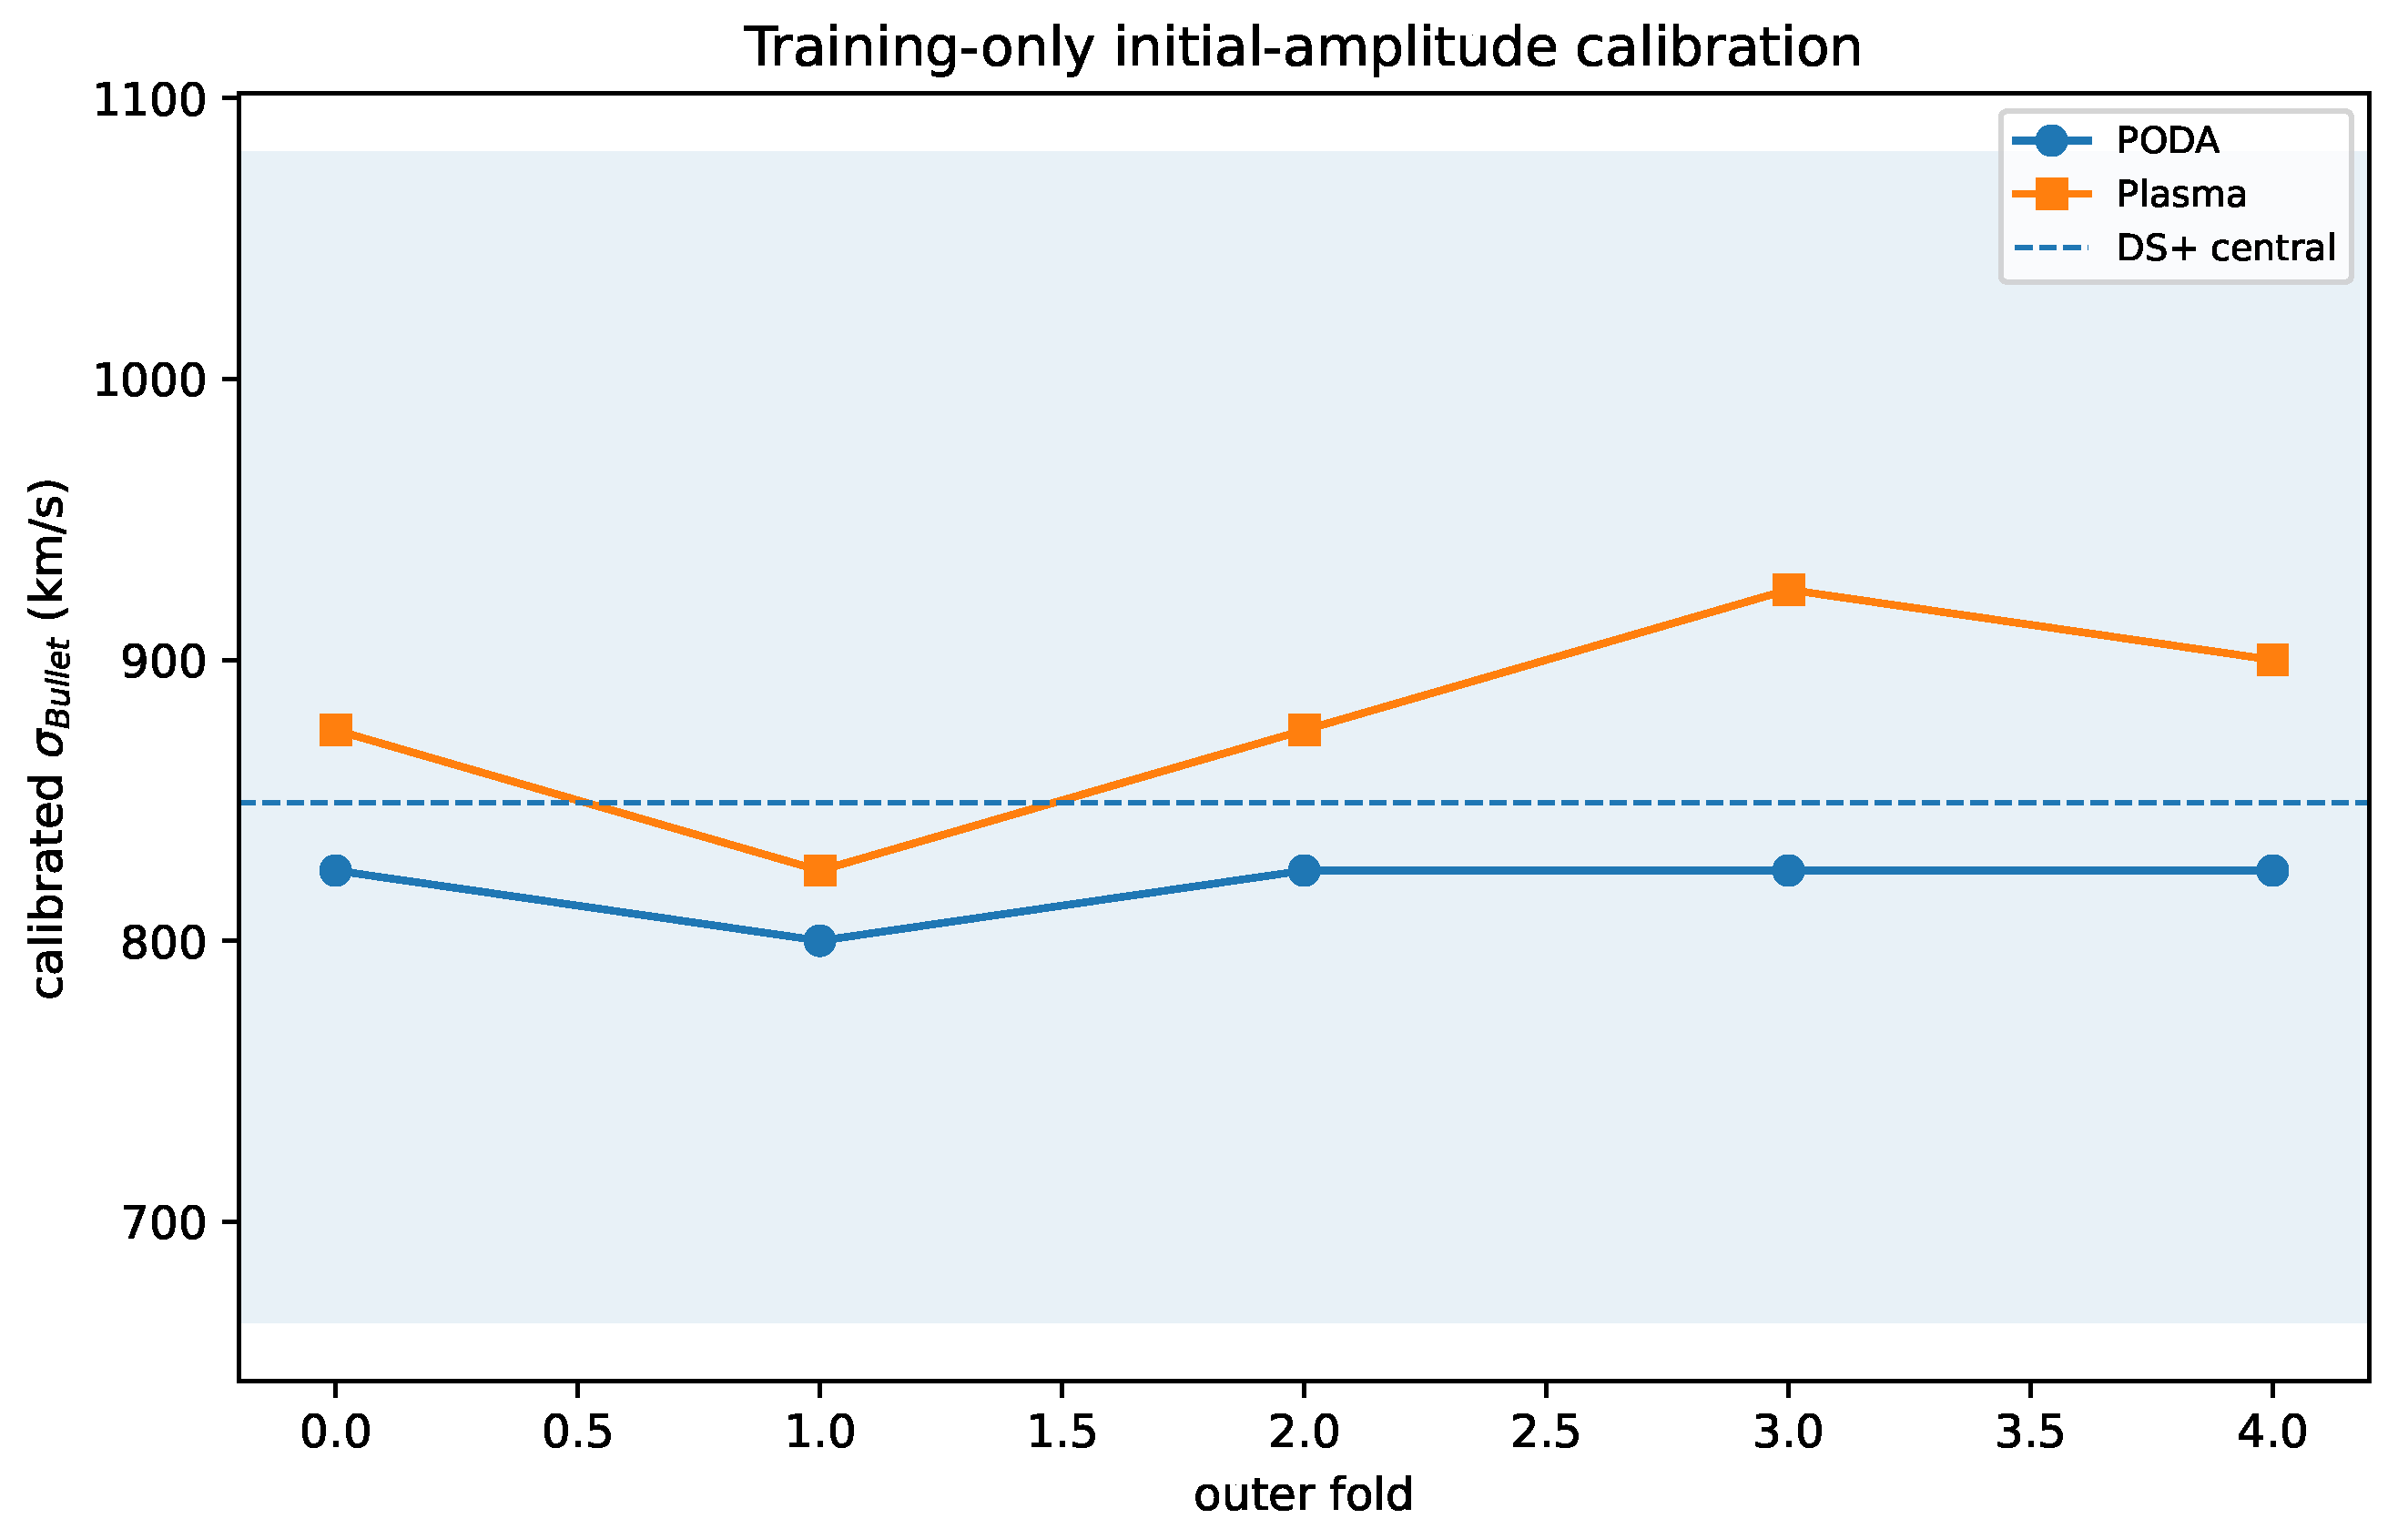

Table 1.
Observed 100-kpc aperture inputs from Clowe et al. [1]. Masses are in . The last column is the published mean convergence.
Table 1.
Observed 100-kpc aperture inputs from Clowe et al. [1]. Masses are in . The last column is the published mean convergence.
| Position | ||||
|---|---|---|---|---|
| Main BCG | ||||
| Main plasma | ||||
| Subcluster BCG | ||||
| Subcluster plasma |
Table 2.
Distances from each 2006 weak-lensing peak to the corresponding BCG and X-ray plasma centroid. The last column uses at the BCG and at the plasma centroid along their connecting axis.
Table 2.
Distances from each 2006 weak-lensing peak to the corresponding BCG and X-ray plasma centroid. The last column uses at the BCG and at the plasma centroid along their connecting axis.
| Component | ||||
|---|---|---|---|---|
| (arcsec) | (arcsec) | |||
| Main | 11.77 | 55.44 | 4.71 | -0.152 |
| Subcluster | 9.63 | 36.60 | 3.80 | 0.178 |
Table 3.
PODA free-envelope transport benchmark for Myr.
| (kpc) | (kpc) | (km s−1) | ||
|---|---|---|---|---|
| 20 | 0.7706 | 1.26246 | 5.249 | 301.4 |
| 50 | 0.1233 | 1.00757 | 0.379 | 120.6 |
| 100 | 0.03082 | 1.000475 | 0.0475 | 60.3 |
| 200 | 0.007706 | 1.000030 | 0.00594 | 30.1 |
Table 4.
Geometry of independent source systems in the Cha et al. public catalogue. “BCG side” means closer to the assigned BCG than to its corresponding plasma centroid. The global row uses the nearest of either BCG and the nearest of either plasma centroid. Wilson intervals describe the catalogue-system fractions only; they are not lensing detection significances.
| Subset | Systems | BCG side | Median | Median |
|---|---|---|---|---|
| (arcsec) | (arcsec) | |||
| Main | 27 | 25 (92.6%) | 23.00 | 62.56 |
| Subcluster | 10 | 10 (100%) | 7.01 | 47.88 |
| Global nearest | 37 | 35 (94.6%) | 16.27 | 53.78 |
Table 5.
Sensitivity of the fixed PODA mode to legitimate initial-current data. The bulk phase speed is illustrative and is not a fitted cluster parameter.
Table 5.
Sensitivity of the fixed PODA mode to legitimate initial-current data. The bulk phase speed is illustrative and is not a fitted cluster parameter.
| (kpc) | free broadening (kpc) | (kpc) | /broadening |
|---|---|---|---|
| 50 | 0.378599 | 102.271 | |
| 100 | 0.047493 | 102.271 | |
| 200 | 0.005938 | 102.271 |
Disclaimer/Publisher’s Note: The statements, opinions and data contained in all publications are solely those of the individual author(s) and contributor(s) and not of MDPI and/or the editor(s). MDPI and/or the editor(s) disclaim responsibility for any injury to people or property resulting from any ideas, methods, instructions or products referred to in the content. |
© 2026 by the authors. Licensee MDPI, Basel, Switzerland. This article is an open access article distributed under the terms and conditions of the Creative Commons Attribution (CC BY) license (http://creativecommons.org/licenses/by/4.0/).
Copyright: This open access article is published under a Creative Commons CC BY 4.0 license, which permit the free download, distribution, and reuse, provided that the author and preprint are cited in any reuse.