

Submitted:
01 October 2026
Posted:
02 October 2026
You are already at the latest version
Abstract
Background: Learning often occurs under instruction. In the neuromotor domain, this entails moving with intent to accomplish the instructed goal, repeatedly, building an expectation and predicting future events. In autism, however, neuromotor development is delayed and their sense of kinesthetic reafference affected by random noise in the returning motor stream. This impedes fluid, moment-to-moment predictive control, creating a gap between mental intent and physical volition. However, our lab discovered that uninstructed, goal-less spontaneous movements, typically embedded in purposeful actions, are spared and plastic across the autism spectrum. How can we leverage these motions’ unintended consequences, to help autistics self-discover a goal and fluidly complete actions on their own volition? Methods: We built a closed-loop interactive assay: the Torres Agentic Learning (TAL) task. In this task, without instructions, 33 children had to self-discover the goal and complete the action of watching movies under their own volitional control. We continuously recorded their hand motions as they caused media to play, first through naïve wondering and spontaneous unintended consequences from surprising events and then, learning through deliberate error-correction relative to the self-discovered goal. Results: All participants learned through the TAL paradigm. They self-discovered the goal and gained prediction of their motor code, lowering the entropy and enhancing the signal-to-noise ratio of their hand speed temporal streams. Conclusions: Uninstructed goal-less agentic learning mediated by spontaneous motions and surprises is feasible in both autistics and typically developing children. This work offers both an assay and biometrics to track the effectiveness of the agentic learning progression.
Keywords:
agentic learning
; autonomous motor control
; surprise
; autism
; stochastic analysis
; entropy
; signal-to-noise ratio
; micro-movements
; motor agency
; motor autonomy
1. Introduction
The sense of socio motor agency is not something that can be instructed on a person. It is a sense that self emerges, spontaneously, from full awareness of our bodies in motion. It mentally manifests in situations when our intended plan consistently matches our physical volition and we can naturally act at will, while autonomously exerting control over our immediate environment [1]. A byproduct of this seamless match between planned actions and anticipated impending consequences is the emergence of the sense of action ownership, critical in turn, for acquiring a sense of autonomy over one’s own volitional actions. This sense develops when the person systematically identifies congruence between the physical act realizing one’s own mental intent and the anticipated physical consequences.
The physical act preceding the consequence is often guided by salient sensory goals. The system must become aware of such goals and autonomously self-discover them to act accordingly. Much has been studied about learning processes when the sensory goal (a target for action) is given a priori, perhaps as a visual or auditory stimulus. In such cases, when the system is prompted, the goal provides a reference signal to compute an error. This error is the discrepancy between the intended consequence of the action to attain the target, and the present state of the system. This error signal can then be minimized and the successful reaches attaining the goal paired with some reward externally provided to the agent in exchange for that success. This type of error-correction learning occurs in the context of reinforcement learning RL [2].
Clinical applications aimed at reshaping human behavior tend to use this form of RL [3]. For example, under a paradigm called Applied Behavioral Analysis (ABA) the child on the autism spectrum is provided with a reward when successfully completing the action of pointing to a prompted target. An alternative embodied learning strategy is possible by leveraging instead unexpected (surprising) consequences from unintended actions. In place of explicitly prompting the goal and offering an extrinsic reward, we can create environmental conditions to lead the child to self-discover the goal and use the evoked empowering sensation as the intrinsic reward to sustain the learning process. We can do this in the motor domain, by gradually pairing the physical action’s unintended consequences with their antecedents. By bringing awareness of the ongoing stream of movements, we can turn it into a salient sensory stream and naturally close the motor loop in a circular cycle of efferent output and kinesthetic reafferent input.
Movement can be an ally in autism. As the child builds awareness through movement, the unintended consequence from a goal-less spontaneous motion can turn into an intended consequence from a purposeful motion accomplishing a self-determined goal. Using this inverted cause-effect loop, where the consequence comes first, we can eventually evoke the sense of action ownership, enhance the child’s autonomy and promote an overall sense of socio-motor agency.
Unlike RL approaches requiring an external agent prompting the goal and programming an explicit reward, our proposed approach to learning would lead the person to true autonomous learning. Mechanistically, this process occurs by interleaving unexpected events (surprises) with expected outcomes. Initially, surprises are facilitated by goal-less spontaneous movements, re-orienting the system towards their unplanned outcomes. Building an expectation linked to the surprise then lands the system in a predictive mode, intentionally guessing the consequences of actions that cease to be spontaneous or goal-less. As the surprise itself becomes a reference signal anchoring the learning process to build an expected value, the system can learn to predict a future event. From a memoryless equiprobable estate, the system can transition, on its own volition, to a predictive state that uses prior knowledge.
The motor streams that our bodies intrinsically produce enable this notion of embodied learning. Embodied learning involves the control of self-generated motions and their sensations, i.e., using the returning (afferent) stream that the system itself produces and adjusting it to guide purposeful efferent movements. We posit that part of this process entails the use of motor programs that the system has memorized (motor priors) and can retrieve and deploy in real time, on demand. In autism, however, this recruitment of motor priors to adapt to novel situations might be compromised by excessively, disordered random noise, consistently found in the motor streams of their bodies [4], face [5], eyes [6] and autonomic signals [7]. How could we transiently dampen these noise levels and enable the use of the motor stream in the here and now, to gradually build more fluid motor coordination and control?
We have uncovered signatures of elevated motor noise in autism, spanning from 3 to 30 years of age comparable to those of neurotypically developing 3-year-old toddlers. For this reason, we consider autism as a form of stalled neurodevelopment manifesting as delayed milestones across human neuromotor growth, nonetheless endowed with a latent capacity to self-improve motor coordination and predictive control. To accelerate this delayed path we propose to scaffold autonomy, from the bottom up [8], and then gradually introduce the type of top-down control and structured learning that ABA RL principles advocate, but turning the reward as an intrinsic motivator instead of an explicitly extrinsic reward. Instructed tasks would be introduced much later and would be aimed to acquire the ability to eventually follow commands or to execute instructed goals. We think that it is important to first establish a sense of embodied autonomy to avoid trauma in systems with immature neuromotor control [9,10] – as it is the case in autism [11,12,13].
To facilitate this scaffolding process, we propose that instead of initially providing an extrinsic reward when correctly attaining a prompted target, the agent (the autistic individual) should be encouraged to self-discover the target on its own terms. Ecologically, this means that we can create conditions on the agent’s environment for the agent to achieve this type of motor autonomy, (i.e., facilitating the matching of the person’s mental intent and the resulting physical action, by correctly predicting the impending action’s consequence). That achievement itself is the intrinsic reward that upkeeps motivation and leads to motor fluidity, seamlessly controlling the flow of the planning-execution loops of the physical act. We coin this proposed model “the Torres Agentic Learning, TAL” and describe it in Figure 1 highlighting key steps of what transpires.
We borrowed this proposed TAL framework from our studies of human neuromotor developmental stages. In neurotypical development, these stages gradually unfold and eventually result in fluid motor control. Through spontaneous motions, neonates naturally learn to self-discover salient sensory goals – a process that we coin naïve wondering. Before any targets can be prompted to them or before they understand any explicit instructions connecting extrinsically provided rewards to their accomplishment of deliberate physical actions, spontaneous movements play a fundamental role in guiding and sustaining the learning process. It takes on the order of 15-30 weeks for spontaneous movements to transition into anti-gravity, well-controlled intentional movements [14,15,16,17,18]. We have digitized such transitions [19,20] and found that it is precisely the quality and timing of such transitions that denote healthy neuromotor developmental milestones in the formal context of General Movements Assessment theory [21,22]. How these naïve wondering learning mechanisms translate to purposeful motor learning remains a mystery. The transition seems important to understand the acquisition and maintenance of autonomous volitional control in general.
In the case of autism, we can set the conditions to evoke this type of aimless wondering leading to surprisingly unexpected events that change the levels of arousal and reorient their system towards salient sensory information. Such process we posit, can eventually turn into the self-discovery of goals for action [23]. In such cases, the person actively seeks rewards that intrinsically satisfy their will.
Further evidence supporting the use of spontaneous movements to guide learning in autism comes from prior work by our group involving non-speakers with high support needs. We found that while movements resulting from instructed goals (intentional movements) in autism across all ages, have biorhythms well characterized by abnormally elevated random and disorderly motor noise [11,12,13,24], the spontaneous segments of their natural actions are closer to those of the neurotypicals [12].
Spontaneous movements, incidental to the goal, may then help us automatically orient the person to salient sensory stimuli in the form of kinesthetic reafferent streams, while preserving this early type of naïve wondering in a setting whereby no prompting, or explicit showing of obvious sensory goals is available [25]. In such scenarios the person must self-discover the goal of the task through a learning process that requires no instruction. This is a form of problem-solving ubiquitous to our daily lives and as such, it is important to understand what transpires throughout stages encompassing this different form of learning. In this sense, we develop new techniques to characterize distinct stages of learning, starting with naïve wondering and evolving to targeted error correction. We compare these processes in two cohorts, one involving typically developing (TD) children and the other involving children on the spectrum of autism with high supporting needs, who cannot communicate through spoken language (minimally verbal, mv-ASD).
2. Materials and Methods
2.1. Participants
We analyzed kinematics data from mv-ASD and their school peers [23] using a new set of computational methods and theoretical question. A group of 25 individuals with a diagnosis of ASD participated in this study, (17 males and 8 females) as well as 8 TD controls (6 males and 2 females). The ages ranged from 3–15 years of age for the individuals with ASD and 3–5 years of age for the TD controls. The IQ score of the individuals with ASD ranged between 40 and 107. Demographic information is presented in Supplementary Tables A1 and A2 also in [23]. Parents signed parental consent for the children and young adults provided their consent. The protocol (Pro2020000154 Digital characterization of nervous systems) was approved by the Institutional Review Boards at Rutgers University and at Indiana University in compliance with the Declaration of Helsinki.
2.2. The Torres Agentic Learning Assay
The participants received no prompts about the location of what we call the agentic region of interest aROI (Figure 2). The task was to discover this aROI along with the effect that the passing of the hand through the aROI caused. The participants were told to aimlessly explore the reachable region and see what happened. There was no predefined goal.
The idea is to use spontaneous movements to create an unexpected event with unintended consequences. This is formally depicted in schematic form through Figure 1A–D. By surprising the participant’s brain with a sudden and transient appearance of media playing on a screen in front of them, as their hand spontaneously crosses a ‘magic spot’ within this aROI, we hypothesized that they would become aroused by this surprising event and, out of curiosity, try to return their hand to that location, purposely trying to reproduce a similar outcome. In transitioning from aimless to purposeful search, they would eventually be gaining control of the cause (purposeful hand motion action) and effect (media playing). In other words, given access to the intended consequence, they would discover the antecedent. Yet, our departure from the current RL methods is that we start the learning process with spontaneous goal-less movements that generate unintended consequences. Furthermore, we do not explicitly administer an extrinsic reward (there is no pre-specified goal). The reward is intrinsic and implicit in the successful act of self-discovery and eventual willful act matching an expectation when the surprising aROI turns into a 3D location featuring a goal for action.
Moving from evoking a surprising event to inducing a biased search could then be documented through the kinematics and stochastic analyses of the trajectories of the participant’s arm in relation to the aROI. This volitional behavioral path would then enable us to more formally study the transition from surprise to biased search, to the finding of regularities in the environment that could lead to self-discovering the goal of the task without any instruction or prompting, while transitioning to error-correction learning. We previously developed the analytical framework in the context of finding neural correlates of statistical learning applied to a highly dynamic perceptual task [25].
Importantly, since the ASD cohort was minimally speaking or non-speaking, we studied the behaviors of typically developing children who could communicate. These children described their experience, “if I place my hand here, I can play the movie”. The connection between impending action and consequence was immediate in TD children. Thus, we wanted to be able to extract information in the motor code of the non-verbal ASD cohort leading us to better understand what they motorically sensed throughout the learning process. To that end, we performed kinematics analyses followed by micro-movements’ stochastic analyses.
2.3. Apparatus for Agentic Learning
The setup for this experiment was previously presented [23,26] (Chapter 2) and is depicted in Figure 2. The participants sat in front of a computer screen at a far-enough distance that prevented them from touching the screen. They were wearing electromagnetic sensors on their (dominant) moving hand, forearm, upperarm and shoulder (Polhemus Liberty, 240Hz) and moving the arm freely, unconstrained in three dimensions, while recruiting all degrees of freedom to rotate the joints. We here focus on the hand only.
The sensors continuously streamed the positions and orientations of their moving hand and arm locations relative to a frame of reference located behind the participant’s setup. This motion caption system creates a weak electromagnetic field containing the participant with sensors on the arm (shoulder, upperarm, forearm and hand). The system tracks the motion trajectories (3D displacements and rotations) of each sensor on the arm segments and reveals the coordinates’ ranges of the reachable hand positions. Obtaining such coordinate range, we could then program, in a personalized manner, the coordinates of a 3D grid of reachable points surrounding the participant’s peripersonal space. The locations of these points could then be used by our computer program to measure the changing distance between the moving hand’s 3D position and a region of some radius surrounding a point in that grid. By adjusting the radius, we could make the region broader (demanding less precision and increasing the chances of the hand passing through it) or narrower (demanding more precision and decreasing the chances of the hand passing through it).
The aROI is depicted in light pink color (Figure 2). It is agentic in the sense that, without instructions, the person transitions from aimless to purposeful search at will. On one’s own terms, one eventually shifts from goal-less spontaneous movements to volitionally controlling the motion of the hand. Eventually, sustaining the hand in that region, triggering the media and continuously playing it. In the first occurrence of the media playing, the consequence is unintended (a surprise). Yet, through biased (curious) search and eventually through intentional motions within the region, one learns the link between cause and intended effect, i.e., the triggering of the media which we projected on the computer screen located in front of the person (Figure 2B). The system matures into a self-discovered impending action-consequence pair that requires predictive control. We shift the location of the aROI to build a map of such pairs and help the system generalize this notion across the reachable space.
We also placed a video camera (attached to the computer screen) facing the participant such that it could capture the participant’s face when toggled ON as the hand entered the aROI (Figure 2C). The media (or the video feed) was triggered when the distance between the position of the hand and the center position of the aROI was at an epsilon radius that we pre-programmed. When the hand entered that aROI within this epsilon distance, the media was triggered. In some instances, the media consisted of Disney movies of the participant’s liking. When the video camera was toggled ON, the media acted as a digital mirror image of the participant. In such cases, the participants could see themselves moving in real time.
2.4. Kinematics Analyses
We examined the positional trajectory of the hand sensor and registered the 3D positional points (and orientations, not reported here) when the hand entered the aROI. Thus, we automatically labeled the points of the trajectory as IN or OUT the aROI. This is shown in Figure 3A highlighting in red the points within the aROI. Notice here that the visits to the aROI were not made all at once but at random transient times, which became more frequent as the participant sustained curiosity about the surprising (unintended) effect that passing the hand through it caused. The hand then began to more systematically return to it in search of the now intended media-playing effect following the action of placing the hand inside it. Thus, interspersed with the red points of the position trajectory are the blue points where the hand searches outside the aROI. The linear speed profiles are shown in Figure 3B where we zoom in (Figure 3C) and settled on 1-second-long window for our moment-by-moment stochastic analysis, using a 50% overlap with 1-1.5-second-long sliding window. We also performed the same analysis using 5-second-long sliding windows with 50% overlap. We asked the extent to which the features quantified under 1second would be retained when using a longer window size. This question is important to allow scalability of the results when using commercial sensors of lower sampling resolution than 240Hz and as such, requiring longer sampling. However, we focus on the main text on the 1.5-second-long windows and reserve the 5-second-long windows for the Supplementary Materials Figures S1–S4.
Figure 3.
Kinematics analysis and personalized micro-movement spikes (micro-peaks). (A) Hand 3D position trajectories output while exploring the peripersonal space outside (blue) and inside (red) the agentic region of interest aROI unknown to the participant. As the hand passes through the center position of the aROI, a computer program triggers media, and the media is ON if the participant sustains the hand’s 3D position in that region. The program turns the media OFF otherwise (blue segments), such that the behavior of the hand can be continuously registered and labeled without instructions. (B) Corresponding linear speed with 1-second window inset. (C) Zooming in. (D) MMS micro-peaks from Equation 2 correcting for allometric effects due to anatomical disparities. (E) Zooming in the MMS.
Figure 3.
Kinematics analysis and personalized micro-movement spikes (micro-peaks). (A) Hand 3D position trajectories output while exploring the peripersonal space outside (blue) and inside (red) the agentic region of interest aROI unknown to the participant. As the hand passes through the center position of the aROI, a computer program triggers media, and the media is ON if the participant sustains the hand’s 3D position in that region. The program turns the media OFF otherwise (blue segments), such that the behavior of the hand can be continuously registered and labeled without instructions. (B) Corresponding linear speed with 1-second window inset. (C) Zooming in. (D) MMS micro-peaks from Equation 2 correcting for allometric effects due to anatomical disparities. (E) Zooming in the MMS.
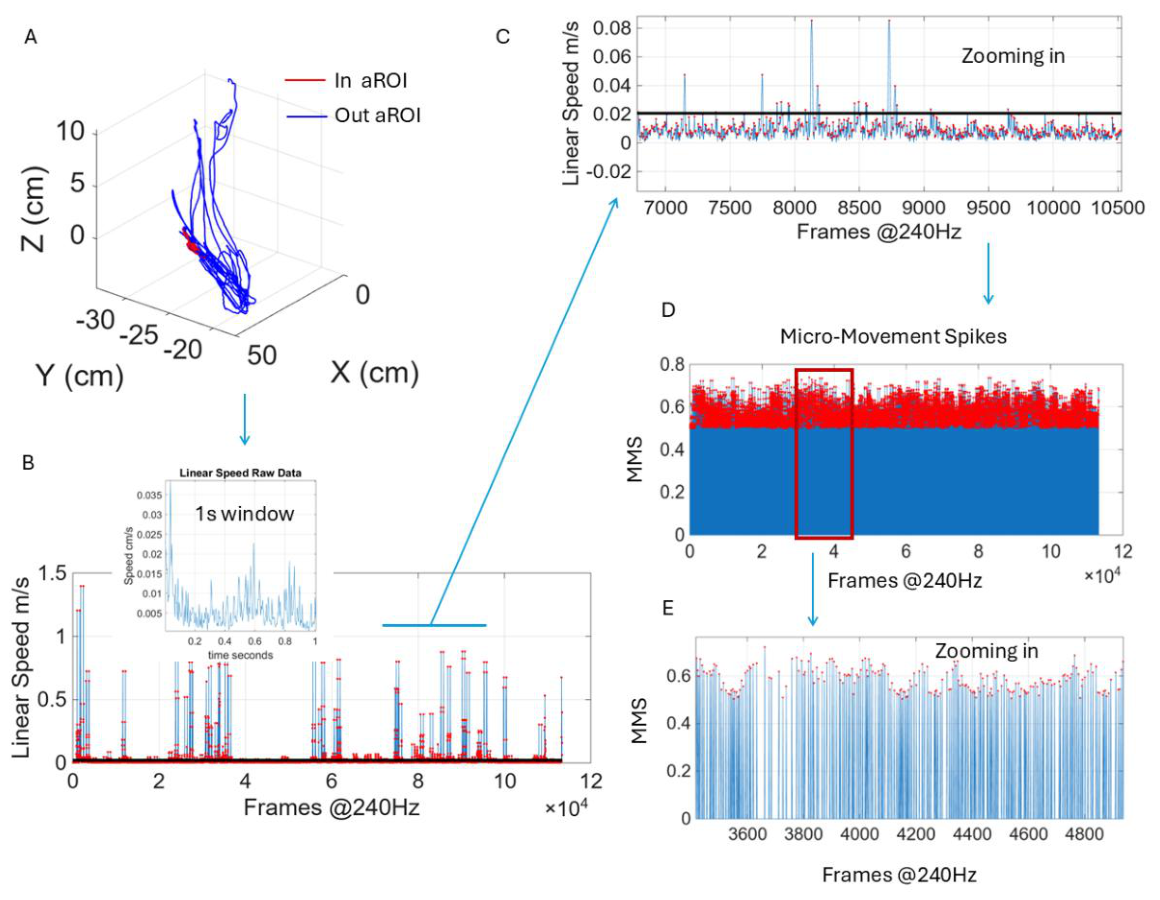
Figure 4.
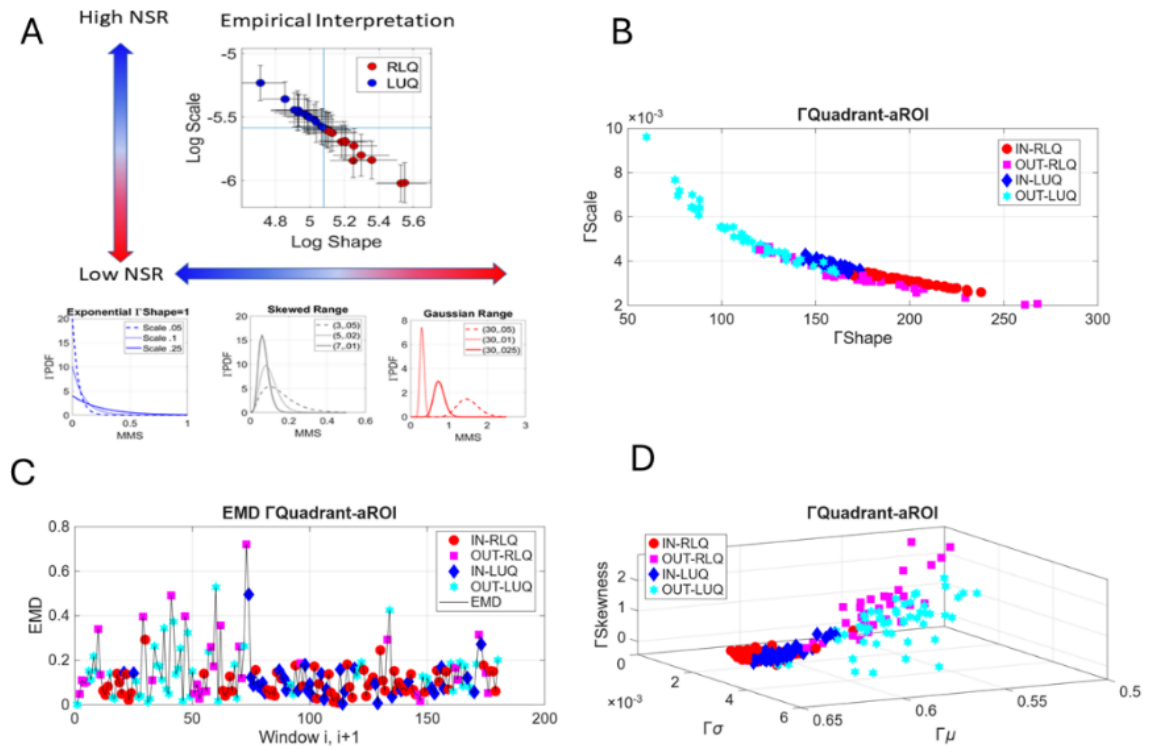
Automatically quantifying the stochastic trajectories and empirical shifts in direction and magnitude of the stochastic process. (A) log-log Gamma parameter plane representation with points as the log-Gamma shape and log-Gamma scale derived from the MMS using MLE of and 95% confidence intervals. Line represents the median log-shape and median log-scale obtained from all points in the session. They divide the quadrants according to the ranges of Gamma distribution. Along the shape axis at the leftmost limiting case is the memoryless exponential regime (shape = 1), midway are sample skewed distributions and at the limiting right range are symmetric, Gaussian distributions. These span random processes ranging from equiprobable, memoryless to predictive. Along the vertical axis is the Gamma scale representing the dispersion of the distribution and the NSR. High noise corresponds to equiprobable regimes in the left upper quadrant (LUQ) while low noise corresponds to predictive regimes in the right lower quadrant (RLQ). (B) Actual data from a child performing the agentic task with points color-coded according to the stochastic quadrant location and whether the hand is inside or outside the aROI. (C) The stochastic trajectory in the order in which it evolved, shifting direction from quadrant to quadrant and magnitude from window to window, the latter measured by the EMD capturing the rate of change of the process. Notice the automatic labeling of the correspondence between the stochastic process with the physical location of the hand. (D) The Gamma moments space with the Gamma means along the x-axis, the variances along the y-axis and the skewness along the z-axis. Points correspond to the Gamma parameter in (B) taken for each 5-second-long window across the session. MLE is from the MMS derived from the hand-trajectory’s linear speed.
Figure 4.
Automatically quantifying the stochastic trajectories and empirical shifts in direction and magnitude of the stochastic process. (A) log-log Gamma parameter plane representation with points as the log-Gamma shape and log-Gamma scale derived from the MMS using MLE of and 95% confidence intervals. Line represents the median log-shape and median log-scale obtained from all points in the session. They divide the quadrants according to the ranges of Gamma distribution. Along the shape axis at the leftmost limiting case is the memoryless exponential regime (shape = 1), midway are sample skewed distributions and at the limiting right range are symmetric, Gaussian distributions. These span random processes ranging from equiprobable, memoryless to predictive. Along the vertical axis is the Gamma scale representing the dispersion of the distribution and the NSR. High noise corresponds to equiprobable regimes in the left upper quadrant (LUQ) while low noise corresponds to predictive regimes in the right lower quadrant (RLQ). (B) Actual data from a child performing the agentic task with points color-coded according to the stochastic quadrant location and whether the hand is inside or outside the aROI. (C) The stochastic trajectory in the order in which it evolved, shifting direction from quadrant to quadrant and magnitude from window to window, the latter measured by the EMD capturing the rate of change of the process. Notice the automatic labeling of the correspondence between the stochastic process with the physical location of the hand. (D) The Gamma moments space with the Gamma means along the x-axis, the variances along the y-axis and the skewness along the z-axis. Points correspond to the Gamma parameter in (B) taken for each 5-second-long window across the session. MLE is from the MMS derived from the hand-trajectory’s linear speed.
We applied smoothing algorithms to the 3D position trajectory (example in Figure 3A) and through spline interpolation and proper derivative functions, determined the velocity field to obtain the speed temporal profile. For each vector in this velocity field representing the first-order rate of change in position per unit of time, we used the Euclidean norm to compute the magnitude of the 3D velocity vector (Equation 1).
Then we focused on the peaks (amplitudes) of the temporal speed profile to analyze them as a stochastic point process. To that end, we obtained the micro-movement spikes (MMS micro-peaks) in two steps.
The first step is to gather the speed peaks (local points of maximum amplitude) into a frequency histogram. Figure 3B shows the speed peaks marked in red with a sample 1-second-long window. Then using maximum likelihood estimation (MLE), we probed different continuous families of probability distribution functions (PDF) and obtained the best fit to the peaks’ distribution. The continuous Gamma family of PDFs was the best fit, in an MLE sense, to the empirical distributions. We obtained the 95% confidence intervals for the empirically estimated Gamma parameters.
The Gamma shape and scale parameters were then used to obtain Gamma moments. The Gamma mean, , the Gamma variance , the Gamma skewness, measuring asymmetry and uniquely determined by the shape parameter , and the Gamma kurtosis describing the heaviness in the tail of its outliers. As the skewness, the kurtosis depends solely on the Gamma shape parameter, . Excess kurtosis is .
In the second step, for each 1-second-long (or 5-second-long) sliding window we determined the empirical Gamma mean and subtracted the peak speed values from it within that window.
The absolute deviations of the local peaks are computed relative to this empirical Gamma mean from the window (Figure 3C), while preserving the timings when they occurred. We obtained the local valleys as well; the local minima surrounding the local peaks and took the average value of all the points contained between the two local minima surrounding the local peak. We then applied Equation 2 to normalize the speed peaks of the window. This procedure is done for each sliding window such that we build a stochastic trajectory of the micro-peaks on the Gamma parameter spaces (Figure 3D, zooming in Figure 3E).
Equation 2 is a correction to scale out allometric effects due to anatomical disparities in the limbs’ lengths across participants. Different arm lengths in this case will impact the end-effector speed ranges as the hand sweeps across the space in search of the aROI. Examples of resulting MMS obtained after the allometric normalization are shown in Figure 3D.
2.5. Stochastic Analyses to Uncover Autonomous Self-Discovery of Goals
We are interested in the tracking of the stochastic process to differentiate naïve states of wonder, (produced during spontaneous aimless hand motions) from purposeful (biased) search seeking an expectation or goal. We reasoned that if the conditions for surprise were high (high entropy values) as in an equiprobable exponential distribution of peaks, as the system is naively exploring, we would enable autonomous self-discovery of goals [25]. Conversely, if the state of surprise was low (low entropy values), as when the system had already built an expectation with high probability, we would then have a predictive state. More formally, Equation 3 below provides the entropy as the sum of the products of surprise and probability of surprise.
Notice here that the standard form of the Equation 3 for entropy first published by Claude Shannon in 1948 can be obtained by reorganizing the terms and using the properties of the logarithm:
where we see the familiar expression to obtain entropy. Here we sum over the windows of a session to obtain the entropy values as a proxy of the states leading to surprise. Further we track the empirically estimated Gamma variance to characterize the transitions from aimless naïve to goal-directed purposeful search.
Since the continuous Gamma family fits best the MMS micro-peaks, we used the differential entropy of the Gamma family to track the evolution of the learning process. Specifically, we tracked the differential entropy values across different stochastic regimes: memoryless exponential vs. predictive Gaussian, as the hand was IN or OUT the aROI in physical space.
where is the Γ shape parameter, is the Γ scale parameter, Γ is the Gamma function, which extends the factorial function, and Ψ is the digamma function defined as the logarithmic derivative of the gamma function . Units of measurement are Nats (natural logarithm-based e).
Figure 4 shows examples of parameter spaces derived from the empirical process of fitting window-by-window, the best Gamma parameter family in an MLE sense, with 95% confidence. These methods were described in [25] and represent a general unifying statistical platform for individualized behavioral analysis (SPIBA) [27] to demonstrate the use of continuous streams of time series data registered from the nervous system. Each point on the Gamma parameter plane spanned by the Gamma shape and the Gamma scale represents the measurements of a window, i.e., the MMS micro-peaks derived from the speed amplitude maxima within a window length (1-second-long or 5-second-long). We then obtain the median value of the shape and the scale taken across all windows in a session. This is used to split the Gamma plane into quadrants with interpretable empirical meaning (Figure 4A).
The theoretical Gamma distribution spans shape values with lower limit of , representing the memoryless exponential distribution. As the values increase, they sweep through heavy tailed distributions and as they continue to grow, they approach symmetric distributions, such as the Gaussian type with different dispersions (scale values). This can be appreciated in Figure 4A. Points with shape values below the median shape value and scale values above the median scale value are in the left upper quadrant (denoted LUQ). They represent points towards the exponential range of the Gamma family. In contrast, points on the right lower quadrant (denoted RLQ) represent points tending towards the Gaussian range of the Gamma family.
2.6. The Gamma Scaling Power Law of Human Motor Control
It has been our discovery that human MMS micro-peaks derived from kinematic scalar parameters such as speed or acceleration, are governed by a scaling power law whereby there is an inverse linear relationship between the log scale and the log shape values. The distribution parameters are locked into a geometric constraint where both variance and differential entropy become tied to a single driving variable, namely the shape . where M > 0, which by exponentiation simplifies to the power law
Figure 4A shows the log-log scatter fitting this inverse linear relationship. Figure 4B shows an example of the shape vs. scale scatter with exponential relation and color-coded according to whether the stochastic location is in the LUQ or the RLQ, and whether the hand is inside the agentic region of interest (IN aROI) or OUT aROI. We track these 4 conditions for each of the TD and mv-ASD cohorts.
2.7. The Gamma Variance as It Relates to the Scaling Power Law
The physical meaning of this equation is that the variance follows a power law driven entirely by the shape parameter , which we will examine in tandem with the variance evolution for each of the four cases in each cohort. Figure 4B shows an example of a child’s performance during a session as the hand is searching in physical space and across stochastic modes.
In equation 6, if M = 0.5, the exponent becomes 0, locking the variance at a constant value of but if M > 0.5, the variance collapses toward 0, as the shape value grows. We will obtain the values of the exponent M (the slope) and examine the differences between the ASD and TD cohorts.
2.8. The Gamma Differential Entropy as It Relates to the Gamma Shape and Variance
The general definition of the differential entropy of a continuous random variable X:
For a standard Gamma distribution
where we express the differential entropy as a function of the Gamma shape and the slope M acts as a modulating factor. The Gamma shape dictates both equations 6 and 8, the dynamic behaves entirely differently based on the value of the slope M. A question therefore is whether there are differences between TD and ASD neuromotor codes. To address that question, we obtain the values of M (and C the intercept) for each of the 4 log-log shape vs. scale scatters of each cohort and do the same for the variance and differential entropy scatters as a function of the shape. We report the ranges of M and C (as in Equation 5) for all other cases.
2.8.1. Possible Scenarios for Slope M
Case 1 – High inverse scaling: When M > 0.5 the scale decreases fast as the shape increases. As , the variance shrinks towards 0 because the exponent is negative. The entropy drops down toward negative infinity. The severe compression of the scale parameter overpowers the spreading effect of the shape parameter.
Case 2 – Low inverse scaling: When M < 0.5 the scale decreases slowly as the shape increases. As , the variance grows toward infinity because the exponent is positive. The entropy grows toward positive infinity. The broadening shape parameter dominates the mild compression of the scale .
Case 3 – The case when the critical threshold M = 0.5. In this case, . This causes fixed variance at a constant value, completely decouple from the parameters: . The entropy depends purely on the shape since the variance is strictly locked at , any change in the shape modifies the entropy purely by changing the geometry of the distribution (moving from highly skewed exponential-like profile to a symmetric bell curve) without changing the overall standard deviation.
As the shape becomes large, the Gamma distribution approaches the normal distribution.
To understand how the differential entropy scales in relation to the physical variance across this inverse trajectory, let us look at the high-shape asymptotic limit when the Gamma distribution approaches a Gaussian profile.
2.8.2. The Gaussian Entropy Ceiling
Substituting the constrained variance into the Gaussian entropy ceiling limit gives Equation 9:
This highlights that for large shape the entropy changes linearly with at a slope determined entirely by and confirms how the inverse slope acts as a master control valve for information. Summarizing the above remarks for the Gaussian regime:
When M < 0.5: The coefficient is positive, causing the entropy to continuously grow.
When M = 0.5: The term vanishes entirely, forcing the system onto a flat entropy plateau influenced by the intercept C.
When M > 0.5: The coefficient is negative, as the shape grows the shrinking scale overpowers the system, forcing entropy to collapse linearly in log-space.
Given the scaling power law (Equation 5) connecting the Gamma shape and scale parameters of the micro-peaks derived from the hand’s linear speed [12] we examine the behavior of the Gamma shape parameter during the agentic learning transitions, from spontaneous surprise to purposeful error-correction learning, upon self-discovery of the sensory goal. We track the variance and the differential entropy across 4 different regimes that we automatically extract from the stochastic trajectory, explained in the next section.
2.9. The Gamma Scale (NSR) and the 4 Regimes of Interest
In a stochastic trajectory, where values of the Gamma shape and scale parameters fluctuate both individually for each participant and across the human population according to the scaling power law, as described above, knowing the Gamma shape one can infer the Gamma scale . Importantly, the Gamma scale is the Gamma NSR because the ratio of variance over the mean permits us to track NSR as the scale in Equation 10:
Empirically, we discovered that the stages of neurodevelopment and transitional milestones can be well characterized by stochastic processes and well defined by tracking a single parameter representing the noise to signal ratio, the NSR which decreases at some rate (dictated by M) as the shape increases according to the above mentioned scaling power law in Equation 5 [12]. Knowing the shape, we can infer the scale and vice versa. Knowing the slope, we can infer the rate of the stage of neuromotor learning.
Gamma NSR as a Target for Treatment
In autism, this scaling power law defined the Gamma NSR as a target for treatment [11,12,24,28]. Regardless of sex or verbal abilities, this parameter remained high throughout the young lifespan (from 3-30 years old). It remained at the ranges found in 3-year-old TD participants. Importantly, by 4-5 years of age the TD expressed a key transition from the memoryless exponential distribution to skewed distributions with heavy tail, which by college age shifted again, towards the Gaussian ranges.
In autism, using spontaneous motions, we were able to dampen the Gamma NSR levels and bring them transiently during the sessions towards the levels of TD participants. Through agentic learning described in Figure 2, we transiently shifted the motor control stochastic process to a predictive regime [23]. This regime was absent otherwise from the autistic nervous systems where instructed movements intended to a prompted goal were well characterized by high levels of disorderly random noise. Because of its relevance, we here examine the variance as an important component of the Gamma NSR and the entropy ranges of these processes, while considering the shape parameter in the context of the scaling power law. We examine the ranges of the parameters that express the rates of change of these stochastic variables on the log-log Gamma parameter plane.
We also use the Wasserstein distance (a.k.a., the Kantorovich-Rubinstein metric or Earth Mover’s Distance, EMD [29,30,31]) to profile the rate of change in PDFs. The EMD quantifies the effort to transition Gamma distributions between a memoryless exponential location to a predictive Gaussian location on the Gamma parameter plane, as the hand moves IN or OUT the aROI. Figure 4C shows the EMD profile depicting the dynamics of the stochastic process. Importantly, the first red dot denotes the first surprising event, and we can perceive in this example that the hand entered the aROI multiple times and moved within it in Exponential (LUQ) and Gaussian (RLQ) modes. This is followed by movements outside the aROI and then by a series of motions inside the aROI and some outside the aROI towards the end of the session. Figure 4D shows the corresponding Gamma moments space with clear separation between the signatures corresponding to stochastic regions and physical 2D space locations. More spread in the scatter is noted when the hand is OUT aROI (magenta and cyan) and some overlap IN aROI (red and blue)
In Figure 5 we appreciate the automatic labeling of the points along the stochastic trajectory using different parameter spaces (each point representing the Gamma empirically estimated parameters from one-second-long sliding window). As they travel through the different quadrants, they move from memoryless exponential, random noisy regimes with high uncertainty in the motor code, to highly predictable Gaussian regimes with high signal to noise ratio (SNR=1/NSR). In Figure 5A we show a representative sample of a child’s hand trajectories with the aROI visited in red. This is the region that triggers the movie as the hand enters it in the initial learning stages of the session, when the consequences of those spontaneous motions are unintended.
In the subsequent stages, when the region is expected rather than surprising, the search for the consequential media-playing is biased (no longer a naïve wondering process). Entering the hand in the aROI eventually becomes the goal of the task. It becomes the target for action generating intended consequences (media playing). Figure 5B traces the variance labeled according to the physical location of the hand, i.e., IN or OUT the aROI and the stochastic modes defined in Figure 4A. Recalling here that these regions are automatically defined by the median values, taken across all the values of the shape and the scale parameters within a session, as we divide the session into one-second-long sliding windows with 50% overlap.
Importantly we are interested in cases where the variances of the equiprobable LUQ regimes are at their lowest level, setting the SNR at its highest level. Under the memoryless equiprobable exponential regime of the Gamma family, we have high entropy. When the variance concentrates in its lower ranges, we have high SNR. Then we maximize the conditions for surprise. Those points when the hand is searching OUT the aROI and overlapping variance levels in the LUQ and RLQ regimes are of interest (see for example red and blue scatters in Figure 4D) since the SNR is high. In the LUQ case the system is in an equiprobable state, ready for surprise while in the RLQ state, the system is in the Gaussian regime entering a predictive mode.
We trace the EMD in Figure 4C as the points in probability space change positions and determine not only the direction (from LUQ to RLQ or vice versa) but also the magnitude of the change and the rates at which these distributions are changing in each of the stochastic regimes and physical regions of interest.
Another representative example is shown in Figure 5D–E where there is no overlap in the variance levels between the LUQ and the RLQ stochastic regimes. This is an example where the surprise already was experienced and the system thereafter is in a biased search mode, purposefully looking for the spot that triggers the video. We can automatically establish a correspondence between physical locations of the hand (with meaning related to the stochastic learning process) and stochastic states located on the Gamma plane representing the process (memoryless exponential vs. predictive Gaussian). Furthermore, we will examine the entropy regimes across such cases, (evolving through high surprise, biased search, target-oriented motions) according to the slope and intercepts of the log-log inverse linear relation identified as a power law in Equation 5.
Using the EMD, we show window by window, the magnitude of the change according to this similarity metric and automatically label the points to help us understand the stochastic dynamics. The EMD is gathered in a frequency histogram to examine the distributions as they evolve globally across the session for each child and for each cohort. At the child level (e.g., Figure 4 and Figure 5), we provide new methods for personalized (precision) medicine approaches to track autonomous learning regimes. At the cohort level we can appreciate the full range of such parameters and offer new ways to localize the child’s learning stages across the population ranges.
2.10. Statistical Tests
We use non-parametric statistical tests to ascertain the significance of statistical differences between the cohorts, within the cohorts for each of the 4 stages of interest and pairwise for cohort type and stage type. Importantly, our dependent parameters in these comparisons are not the kinematics but rather the probability parameters comprising thousands of points in the kinematics realm, specifically related to the hand’s speed amplitudes. We use MATLAB ranksum test, p = ranksum(x,y) wich returns the p-value of a two-sided Wilcoxon rank sum test. The rank sum test examines the null hypothesis that data in x and y are samples from continuous distributions with equal medians, against the alternative that they are not. The test assumes that the two samples are independent. x and y can have different lengths. This test is equivalent to a Mann-Whitney U-test.
We also employed the Kruskal-Wallis test in MATLAB. This is a nonparametric version of classical one-way ANOVA, and an extension of the Wilcoxon rank sum test to more than two groups. We compared 2 groups mv-ASD and TD of equal lengths. The test uses the median of the groups of data in x to determine if the samples come from the same population (or, equivalently, from different populations with the same distribution). The test ranks the data from smallest to largest across all groups and takes the numeric index of this grouping (rather than the actual values). In this ranking method, for a tied observation the rank is equal to the average rank of all observations tied with it. Instead of the F-statistic used in classical one-way ANOVA it uses the chi-square statistic, and the p-value measures the significance of the chi-square statistic.
The Kruskal-Wallis test assumes independence and that all samples come from populations having the same continuous distribution (apart from possibly different locations due to group effects). The classical ANOVA uses the stronger assumption that the populations have normal distributions.
Because the TD group comprises data from 8 participants whereas the ASD group comprises data from 25 participants, we repeated the KW test for random draws of the data samples (for each of the 4 conditions of interest) with a minimum of 440 samples per parameter in the TD case (the smallest sample). To build the comparison groups, we generated random numbers between 1 and 440 and shuffled the TD group while selecting 440 random numbers to sample from the larger mv-ASD sample. We did this 1000 times and built a distribution of resulting p-values. We then asked for each parameter of interest (mean, variance, shape, scale) in each of the 4 conditions of interest (IN or OUT aROI, RLQ or LUQ) what percentage of the comparisons between ASD and TD were statistically significant at the alpha .01 level. Besides ascertaining differences, we are interested in uncovering for which percentage in each condition ASD and TD are not statistically separable.
3. Results
3.1. The Stochastic Shifts Automatically Differentiate Learning Transitions in mv-ASD
We gathered the shape parameter into frequency histograms according to their label. Four distributions emerged: LUQ IN aROI, LUQ OUT aROI, RLQ IN aROI, RLQ OUT aROI. For each of these frequency histograms, we tracked the frequency distribution of the variance, the minimum variance (maximum SNR), the EMD, the rate of change ΔEMD and the % of time within the session when these parameters occurred. To compute the latter, we tallied the times within the session that the window occurred and assigned to this point the corresponding percentage of the session time. If within the 1-second-long window the (log shape, log scale) point was over 90% of the time in the LUQ, the Gamma parameters for that window was labeled LUQ. In this way, we could ask for example, about the concentration of lower variance values occurring in the first half of the session, or in the second half of the session, etc., as we pooled data across all participants of each cohort.
The variance distribution of the empirically estimated Gamma process gave us a sense of when during the stochastic shifts and where in the peripersonal physical space the hand was with equiprobable (memoryless exponential) signature and the process transitioning from lowest variance (highest SNR) to higher variance. This is when the system maximizes surprise and it concentrates on the occurrence of high SNR in the first half of the session. This regime is shown in Figure 6 for non-verbal ASD. Figure 6A shows the resulting distribution of Gamma shape values and the automatic transition from low exponential (equiprobable) to heavy-tailed towards Gaussian regimes. Figure 6B shows that these shape values are concentrated earlier in the session, when the surprise occurs. The spontaneous movement generates an unintended consequence, namely the media plays as the hand enters the aROI. Figure 6C shows the concentration of variance values at its lowest level (highest SNR) and the rate of change in EMD distributed across the range of values. Here the Gamma distributions were dynamically changing as early naïve exploration was taking place.
Figure 6D–F show the patterns when the hand moves outside the aROI and within the LUQ stochastic regime. As the hand moves in LUQ mode inside the aROI, the distributions are not as dynamically changing as when they were outside the aROI in the LUQ mode (see Figure 6C bottom panel). Here the EMD is concentrated towards the lower values, rather than distributed across the full range of values. Furthermore, the concentration of the % of time when the Gamma distribution shape values occur shifts to later in the session, ~½ of the session.
Figure 6G–I present a different distribution of Gamma shapes when the hand is outside the aROI and RLQ stochastic regime. Here we see a concentration of higher values in the Gaussian range (shape values concentrated around 104) and concentration of these values in the earlier % of times in the session, with distributed variance (Figure 6H) in the low ranges and broad distribution of EMD values signaling a dynamic change in Gamma PDFs.
These patterns are similar in the case when the hand is inside aROI in Figure 6J–L apart from the % of times when these shape values occur, which correspond to later times concentrated toward ½ of the session. Following the orderly % time of Gamma variance values evolution within a session, the earliest state is RLQ OUT aROI. It has the concentration of Gaussian shapes early in the sessions (Figure 6H). Following this is LUQ OUT aROI, featuring a shift towards the first ¼ of the session (Figure 6B). Then we see that LUQ IN aROI follows ~ ½ of the session (Figure 6E) and finally, RLQ IN aROI past ½ the session (Figure 6K).
3.2. Similar Patterns of Physical and Stochastic Transitions in TD Controls
As seen in the previous section (Figure 6A,D) in reference to the mv- ASD cohort, exploration LUQ OUT aROI revealed bimodality in the distribution of Gamma shape values. This result extended to the TD controls, though with a more modest frequency of shapes near the equiprobable exponential regime. As in mv-ASD, the shape values of the Gamma PDFs automatically distributed bimodally (Hartigan dip test, p <. 01). The first mode comprised lower values of the Gamma shape, signaling highly right skewed towards exponential shape (Figure 7A), and the second mode had a skewed shape with a heavy right tail tending to symmetric Gaussian shapes. A difference in the timing of these shape values is appreciated in later concentration of the % of times that the shapes occurred. These tended towards ½ the session in contrast to the mv-ASD who manifested it earlier, at ¼ of the session (Figure 7B vs. Figure 6B).
Like the mv-ASD case, the distribution of the Gamma variance values was concentrated at the lower end of the range (featuring high SNR) (Figure 7C). The magnitude of the change in PDFs spanned a broad distribution of ΔEMD values denoting a dynamic stochastic process in (Figure 7C bottom panel). The temporal dynamics of these parameters were different between mv-ASD and TD cohorts when comparing the LUQ IN aROI regimes. TD participants spent far less time in the exponential regime, reached it later in the session (beyond 50% of the session) and had different distributions of the shape parameters than mv-ASD. In contrast, mv-ASD had earlier occurrences of the exponential shape parameter ranges and later occurrences of the Gaussian range when the hand was IN aROI. These differences are visible in Figure 6 vs. Figure 7 representing the ASD and TD cohorts respectively. These qualitative stochastic descriptions are next examined across stochastic modes and cohorts using non-parametric statistics and examining the slopes M and intercepts C of the scaling power laws relating these parameters.
3.3. Agentic Learning Reduced the Noise Levels in Both mv-ASD and TD at Different Rates in the Slope M and Intercept C of the Gamma Scaling Power Law
The Continuous Gamma family of PDFs fitting the empirical data spans a range of shape and scale values whereby, as in previous work, the log scale parameter is linearly inversely proportional to the log shape parameter, according to Equation 5, where M is the slope and C is the intercept. Table 1 lists the values for each of the 4 cases and the 2 cohorts, while Figure 8 shows the linear fit with 95% confidence intervals for each case and cohort. Figure 8A refers to the mv-ASD cohort while Figure 8B refers to the TD cohort.
We find that the data is in Case 1 – High inverse scaling: Both cohorts have M > 0.5 whereby the scale decreases fast as the shape increases. Here we find differences between mv-ASD and TD cohorts which we list in Table 1.
This is the case that as the shape parameter , the variance shrinks towards 0 because the exponent is negative. This is seen in Figure 8C. The entropy drops toward negative infinity. The fast decrease of the scale parameter overpowers the spreading effect of the shape parameter. However, the rate of change of the shape-scale is lower in the ASD than in the TD cohort.
Notice here that in Figure 8A although the cases for IN and OUT of the aROI, when the systems are in the LUQ stochastic range, span similar shape values, their slope and intercept differ between ASD and TD (Table 1). On the other hand, in Figure 8B, the IN and OUT the aROI when the systems are in RLQ stochastic mode, there is a visible difference between the ranges of the log shape parameter. These differences are also appreciable in the relationship between the variance and the differential entropy plotted in Figure 8C (mv-ASD) and Figure 8D (TD).
Figure 8E shows the parameter plane spanned by the slope along the horizontal axis and the intercept along the vertical axis for each of the 4 conditions and the 2 cohorts in Table 1 derived from Figure 8A,B fitting. Here notice that the ASD (red and blue markers) express a contraction of the slope and intercept values, which span broader ranges for the TD (magenta and cyan markers). Steeper slope in TD (higher absolute values of M) indicates a faster rate of change in the log-log Gamma parameters, meaning that as the shape increases towards the Gaussian ranges of the Gamma probability distribution family, the dispersion measured by the scale representing the NSR decreases faster in the TD cohort than in the ASD case, where the slope is shallower.
3.4. Linear Relation in the Log Shape vs. Log 1/Variance Reveals Differences in Rate of Change Between ASD and TD
We further studied the relationship between the log Gamma shape and the log of the inverse of the Gamma variance. As the shape increases the variance decreases. The log shape and log 1/variance then relate linearly, and we report the slopes and intercepts of this relationship for ASD and TD in Table 2. Supplementary Figure 6 shows the parameter plane spanning these values in ASD along with the linear fits and 95% confidence regions.
Figure 9A reports the values of the mv-ASD cohort. Each point represents a window of a session, and the data is taken across the cohort, with the size of the marker proportional to the session time: smaller markers represent times when these parameter values were attained earlier vs. larger markers representing later times in the session. Figure 9B then provides the relationship between the variance of the MMS micro-peaks and the log of 1/probability of MMS micro-peaks.
As the probability of MMS micro-peaks increases towards 1, the log tends to 0 and the variance increases. As the probability of a MSS micro-peak decreases towards 0, the log term increases and the variance decreases. These patterns are distinct between LUQ and RLQ as they complement each other. But there is an overlapping region on the parameter plane where the variance is at its lowest (high SNR), the log shape is below 4 (see the inset graphs), the hand is exploring OUT aROI, in LUQ mode. At high SNR and near equiprobable memoryless exponential mode, the system maximized surprise.
Surprise maximization is the region of interest when the system starts the transition from naïve wondering (unintended consequences) to biased search (intended consequences). Figure 10 provides similar results for TD children albeit differences in the rates of change quantified through the slope M and intercept C of the relationships between log shape and log 1/variance, reported in Table 2.
As in the case of the log shape vs. log scale, the slopes and intercepts of the TD children spanned a broader range of values, even though their cohort had fewer participants than the ASD cohort. Furthermore, the ASD slope and intercept ranges demonstrate a slower rate of change in the shape-variance relationship was consistent with the relationship that we saw in the Gamma scale (NSR). They undergo similar stages of learning albeit at a slower pace than TD.
As per equation 8, establishing the linear relationship between log shape and differential entropy, we studied, for each cohort, this inverse relation across the different learning stages. Furthermore, we studied the relationship between the Gamma probability of MMS micro-peaks and the differential entropy to identify regions of overlapping ranges between the LUQ and RLQ modes when the hand explored OUT aROI vs. when it did so IN aROI. Lower probability of events with higher entropy ranges in the LUQ where the distributions are memoryless exponential and the variance levels concentrated in the lower end of the ranges provided the conditions preceding the earlier surprising event. In this case the unintended consequence of media playing came from aimless flailing of the hand. This early surprise was accompanied by high SNR (lower ranges of variance). We traced the overlapping ranges of probability and entropy levels to the natural log shape < 4 in both the ASD and the TD cohorts. Figure 11 shows the profiles for each cohort Top panels A-D refer to the mv-ASD and bottom panels to the TD cohort.
Table 3 quantifies the slopes and intercepts according to the linear relation between ln shape and differential entropy in Equation 8.
We found fundamental differences in the rates of change of differential entropy as a function of the shape parameter between the LUQ (M < .5 in both cohorts) and the RLQ (M > .5 in both cohorts) stochastic modes. The LUQ mode showed slopes featuring low inverse scaling (M < 0.5). In this case the entropy decreases slowly as the shape increases. Furthermore, IN and OUT RLQ, the mv-ASD cohort had lower M absolute values than the mv-ASD cohort.
Supplementary Materials Figures S7 and S8 capture the linear fit scatters with slopes and intercepts reported in Table 3.
Figure 12 plots the Gamma moments in a 3D space with the Gamma mean along the x-axis, the Gamma variance along the y-axis and the Gamma skewness along the z-axis. Figure 12A refers to the mv-ASD while Figure 12B refers to the TD cohort. The corresponding profiles of EMD values obtained window by window are in the inset plots of Figure 12A,B. We also obtained the frequency histograms of the EMD values across windows for each of the stochastic modes and physical locations. These are plotted in Figure 12C,D for mv-ASD and TD cohorts, respectively.
The proportions of cumulative EMD differed greatly between mv-ASD and TD for the case when the hand moved outside the aROI in RLQ (Gaussian) mode (1.95 times, nearly double increase between the IN and OUT cases in mv-ASD vs. 1.05 times, remaining nearly the same between IN and OUT the aROI in the TD case). This is because, as they verbalized it to us, they found the aROI faster and figured out the causal relationship between moving the hand there and the consequential media playing. The TD shifted faster from unintended to intended consequence modality as their aimless motions turned purposeful and they self-discovered the 3D positional goal that enabled their switch to error-correction learning. Supplementary Materials Figure 9 reports the slopes vs. intercepts graphs corresponding to Table 1, Table 2 and Table 3 and show the contraction of the range of parameters in mv-ASD relative to those of the TD cohort.
To examine the significance of non-parametric statistical analyses, we performed a pairwise comparison between cohort type and stochastic mode / physical aROI. The outcome, visualized in matrix form color-coded by significance level of the ranksum test is shown in Figure 13. Each entry is the p-value and values p < 0.01 are darker blue (see color bar). Figure 13A shows the matrices for the Gamma mean (left panel) and Gamma variance (right panel). Figure 13B features the same type of comparison for the Gamma scale (left panel) and Gamma shape (right panel). Figure 13C refers to rate of change of EMD (ΔEMD). These matrices reflect the 4 stochastic modes and physical region, and for the two cohorts, inform which comparisons are statistically significantly different, and which are not.
Since the cohorts have different sizes (8 TD vs. 25 ASD) we also examined random draws of the larger ASD cohort matching the size of the smaller TD cohort. For each ASD vs. TD comparison and each of the 4 conditions of interest, we used the non-parametric one-way ANOVA, the Kruskal-Wallis test and built a frequency distribution of the p-values. We did this for the variance, the shape and the scale. These were identified by the ranksum test (using the disparate sizes of the cohort) as the parameters where the statistical differences had maximal significance. Figure 13D shows that in Exponential regime (LUQ) when the hand was inside the agentic ROI, 100% of the comparisons were significant at the 0.01 alpha level. In contrast, only 28.20% were significant at this level for the case when the hand was outside the agentic ROI. For the RLQ (Gaussian) regime, the hand inside the aROI 100% of the comparisons were significant vs. 98.9% when the hand was outside the aROI. In the case of the shape parameter, whether in LUQ or RLQ when the hand was inside the aROI, we obtained 100% significance at the 0.01 alpha level, whereas outside the aROI, we had 67.9% significant differences across comparisons for the LUQ exponential range and 99.30% for the Gaussian range.
Finally, for the scale parameter we found 100% significant differences whether the stochastic mode was LUQ or RLQ in the case when the hand was inside the aROI but 51.8% significant differences across comparisons in the LUQ mode vs. 99.60 in RLQ stochastic mode, both when the hand was outside the aROI. In general, across all parameters under study, when the hand was inside the aROI, whether in exponential or in Gaussian mode, 100% significantly different outcomes between ASD and TD contrasted with variable percentages of statistically significant differences across comparisons when the hand was outside the aROI. Importantly, as the kinematics of reaching motions had uncovered in our previous work, the spontaneous motions of the hand bear the most resemblance between mv-ASD and TD cohorts. This is evidenced not only in the percentages of the cumulative EMD traveled along the stochastic processes at hand (Figure 13D), but also in the outcomes of the non-parametric Kruskal-Wallis test comparing these cohorts (Figure 13F).
Across the variance, shape and scale Gamma parameters, during the equiprobable memoryless exponential phase, when motions as spontaneously occurring outside the aROI, we see lower percentage of significant p-values, making their profiles statistically indistinguishable. In the case of the variance, only 28.2 percent of times were significantly different at the alpha level 0.01 and only 51.8 in the case of the Gamma NSR (dispersion, scale parameter). This is the condition that we render as “the entry point” in ASD to target the dampening of the random, disorderly motor noise and to bring it to the level of motor noise that enables a predictive code via kinesthetic reafference.
4. Discussion
In this paper, we characterized the process of learning to self-discover a goal that was not instructed to the participant in both TD and mv-ASD children. TD participants could communicate through language what they were experiencing. In the case of mv-ASD participants, we could only infer, from the evolution of their efferent movement patterns, the state of learning they were experiencing. Our ongoing hypothesis is that the efferent movement patterns serve as a proxy of the quality of kinesthetic reafference that the brain receives from continuous returning streams of self-generated movements [8,12,13,26].
To build our hypothesis, we borrowed the concept of kinesthetic reafference from the classical works of Nicolai Bernstein [32,33] and von Holst and Mittelstaedt [34]. Our fundamental addition to this notion is the use of goal-less spontaneous movements, transpiring largely beneath awareness, in combination with a pleasant surprise to change arousal states, reorient the brain to salient sensory stimuli (both external audiovisual and internal proprioceptive and kinesthetic), and in this way, evoke awareness of the intended goal, through self-generated movements.
In the words of von Holst and Mittelstaedt “Voluntary movements show themselves to be dependent on the returning stream of afference which they themselves cause”. These voluntary movements have intended consequences. By first exploiting the spontaneous segments from aimless hand motions, we start out with the unintended consequences that a surprise evokes. Gradually, without the use of prompting or external rewards, we lead the child to autonomously self-discover the intended consequences of one’s own, self-generated movement streams. And in this process, self-discover the antecedent (goal) of the action leading to the pleasantly surprising media playing. In our new conceptualization of learning, the child’s reward is intrinsic and implicitly embedded in the context that we created to promote learning that is not explicitly reinforced. In this sense, we promote full autonomy in the child’s motor systems – whether mv-ASD or TD. And in both cohorts, we quantified that this type of spontaneous, truly autonomous learning is possible.
To precisely quantify this process (beyond a qualitative description) we studied the physical 3D trajectories of the hand’s excursions and automatically identified the stochastic patterns of the corresponding linear speeds. They ranged from equiprobable (memoryless) exponential to predictive Gaussian. Furthermore, we were able to automatically identify whether the hand was inside or outside the aROI that we defined. We created the conditions in the child’s immediate external environment to evoke a surprising event and measured the stochastic signatures surrounding this event. The evolution of the stochastic trajectories was quantified through distance metrics appropriate for points representing probability distribution functions on the Gamma parameter space.
We investigated the use of uninstructed spontaneous movements as they evolved from surprising (unintended) to deliberate (intended) consequences in a context whereby the child was not given a goal, nor was the child extrinsically and explicitly rewarded for successfully attaining the goal (once they self-discovered it). This learning method is a fundamental departure from modern reinforcement learning computational and clinical approaches. The RL approaches are adopted both in computational models of AI learning and in behavioral modification interventions ubiquitous in autism. We present this form of spontaneous learning in the motor domain as a new way to evoke the sense of action ownership, by gradually learning to establish cause and effect relations in a truly agentic manner, without instructions, under full physical volitional control by the person over the situation.
We chose to examine this form of learning through the MMS-micro-peaks lens because we had previously developed analytical tools to track the evolution of the stochastic process and to establish a correspondence between the stochastic spaces and the physical spaces where the hand moves. By automatically labeling the stochastic mode and the hand location in relation to the aROI, we were able to fully characterize the learning process and identify key transitions across modalities of motor learning: (1) from naïve wondering in exploratory mode without a preset goal, to biased search towards the aROI as the 3D region linked to the action of the hand (agentically) causes the media to play; (2) from biased search to fully understanding that the goal was to position the hand inside the aROI and deliberately, minimize the error between the current hand location and the targeted 3D position that steadily emerges and allows the child to watch the media. For each of these stages, which evolved without instructions, we characterized the Gamma parameter ranges, the differential entropy and the scaling power laws relating these parameters as a function of the Gamma shape of the distributions and the Gamma variance. We uncovered differences in the rate of learning between TD and mv-ASD children whereby the latter experienced the same neurotypical transitions.
These parameter ranges characterize our previously proposed index of motor agency expressing the balance between autonomy and predictive control [12,23] in TD and mv-ASD children who cannot communicate through spoken language. These children can nevertheless do so via gestural language, typing and other augmented communication means. Autonomy was characterized by levels of differential entropy defining the order of the patterns, while predictive control was tied to ranges of the Gamma SNR defining the variability and quality of noise levels of the speed signal, as well as the level of predictability vs. randomness of the process.
We specifically measured the stochastic process transitioning goal-less spontaneous movements with unintended consequences into deliberate goal directed movements with intended consequences. From aimless to purposeful motoric actions, by tracking the evolution of surprise (differential entropy) and variance regimes, we were able to characterize these ranges across the population [8]. In recent work, our lab had successfully used these metrics of motor agency in the context of digitizing the diagnosis of autism [35], tracking the efficacy of a therapeutic intervention evoking movement awareness over the span of 4 months in children with autism [36] and tracking therapeutic outcomes across 40 weeks in infants with cerebral palsy [37].
At the population level, prior work from our lab unveiled a scaling power law expressing the maturation process of autonomous volitional control (intentional, goal-directed movements) in neurotypical motor development. In this neurodevelopmental maturation process, the levels of motor noise across the human lifespan covered a range of values of the Gamma parameters spanning from exponential to Gaussian regimes. There are key transitions between 3-4 years of age and 5-6 years of age whereby the Gamma probability distributions shift signatures from memoryless exponential to skewed with heavy tails and then again, towards the end of puberty and beginning of college age, shift signatures from heavy tailed to Gaussian symmetric. In autism, however, this process is arrested, and the system remains at high levels of noise and randomness with disordered motor code (high differential entropy). That work also revealed that spontaneous (uninstructed) movements incidental to a goal were spared in autism and highly plastic [12,23], with signatures comparable to those of neurotypical controls. So, in the present work, we wanted to see how uninstructed movements, spontaneously occurring without a prompted goal, could guide the system to self-discover the goal of the task at hand. Because we already knew the empirical meaning of the Gamma parameter space locations and the interpretation of these locations, we explored the motor learning process while considering the lowering of the Gamma NSR level as our target for this experimental intervention. In this sense, we had some evidence to hypothesize that the use of spontaneous movements in some therapies that exploit uninstructed behaviors can lead to the improvement of the intentional movements [23,36,37].
But given that the spontaneous movements occur largely beneath our awareness, how do we automatically identify them in complex behaviors? Spontaneous movements are incidental to the targets of our actions, they exist embedded in our actions, in an uninstructed and goal-less manner [28,38]. Their movement trajectories inserted in complex behaviors (e.g., in activities of daily life, in sports and in the performing arts) are automatically detectable because the motion curves that their trajectories describe are highly sensitive to the changes in the forces generated by our bodies in motion [38,39]. They contrast with instructed deliberate segments aimed at a goal, where the trajectories remain impervious to changes in the forces across repetitions of e.g., a boxing routine, a tennis serve, or simply during the acquisition of a new motor skill in the context of cognitive decision-making mediated by pointing [12,39]. From moment to moment, deliberate movements conserve the geometry of their trajectories across multiple representational spaces: those of the end effector extrinsic to the body and those of the joint angles intrinsic to the body [40,41,42,43,44]. Spontaneous movements on the other hand, reshape their stochastic signatures as the system learns a new motor program, as it adapts it to a new context and as it generalizes it and transfers it to different situations [26,28,38]. Although spontaneous segments of our actions tend to occur largely beneath awareness, they can be brought to awareness. Here we saw that manipulating high entropy (surprise) in the equiprobable, memoryless exponential regime of the motions, we could change the variance distribution around the micro-movements mean and create the conditions to bring self-awareness of the kinesthetic reafferent code -absent, corrupted, or extremely low otherwise in autism [11,12]. Under persistent, systemic, excessively disordered random motor noise [45] (high variance around the micro-peaks’ mean) it is difficult for the autistic individual to predict the intended consequences of any instructed act. Building on the notion that unintended consequences from surprises could help the autistic brain reorient its arousal states and seek states that provide intrinsic satisfaction from that unintended consequence, we deployed our agentic learning paradigm.
We borrowed equiprobable naïve wondering (exploration) preceding error-correction learning (exploitation) from early human developmental motor patterns instantiated in general movements theory [21]. Accordingly, the spontaneous transition of motor movements from aimless exploration to purposeful, predictive behavior occurs through maximizing opportunity for surprise. Surprise then serves to help the motor system switch fluidly between arousal states engaging the brain during well-balanced exploration and exploitation of sensory signals that become salient to the system, reorienting attention to potential goals for action.
This type of agentic learning is then developed in the broader context of action ownership reflecting the sense of motor agency as part of the more general sense of psychological agency often studied in the fields of cognitive psychology [46]. Motor agency, we posit, is a fundamental building block within the motor domain, to develop and maintain the broader psychological sense of agency and enhance embodied cognitive states. Under excessive uncertainty in their motor code, the autistic individuals bear excess cognitive load which interferes with all activities. By lowering the noise and bringing order to their kinesthetic sensing, we also lower the cognitive load that their brain bears [8].
Our work revealed that the naïve exploration phase maximizes opportunity for surprise, and it is well characterized by memoryless random events obtained in the here and now. Prior work in statistical learning revealed that such events occur primarily in unstable environments [47,48]. In such environments, individuals gather information equiprobably first (as schematized in Figure 1A), without biasing their search by prior expectations (as in Figure 1B). The surprise serves as anchor to probe in various directions, to self-discover the one linking the effect of the surprise to its most probable antecedent (moving along the gradient direction in Figure 1C). As the system initially wonders, the variance shrinks tightly around the mean, while maximizing entropy for information transfer and preparing the system for a surprise [25]. Concentration towards the lower ranges of the variance along (higher signal to noise ratio) with moderate-to-high entropy levels were found here as the system faced a surprise. According to the continuous Gamma family of probability distribution functions, fluctuations in key kinematic parameters stayed closer to the mean (low variance, tightly spread around the mean), within the Gamma’s memoryless exponential regime (shape = 1) governing the distribution of micro-peaks. Every impending outcome within that narrow window was equally probable (with high uncertainty or surprise, meaning high entropy, as in Figure 1D). We found consistent evidence for this development in both TD and mv-ASD, albeit with differences in the rates of change of the parameters, as captured by scaling power relationships between the Gamma shape and Gamma scale, the Gamma shape and variance and the Gamma shape and differential entropy.
Our new analytical approach demonstrated that unpredictable conditions provide the most efficient learning opportunities via surprising events that automatically orient the system, without instructing it to do so [25]. Through the speed MMS micro-peaks code, we captured this naïve exploratory process and showed that the child’s ability to self-discover goals is present in our designed motor assay. Much as neonates learn neuromotor control through rocking and rolling their trunk and performing random flailing motions of their arms and legs [19,20], here we found that TD and mv-ASD children used flailing motions to explore and to self-discover the goal without instruction. In this sense, the prompting of something relevant was implicitly done by surprise, rather than explicitly given as a target.
The present work shed light on the mechanisms leading the human motor systems to autonomously arrive at a reference signal for error correction, to track that signal without instructions and to eventually develop congruence between action and impending consequences [23]. In the initial stages of the learning process, these consequences of the action were unintended (surprising) but as the learning progressed, they turned intended and in mv-ASD systematically helped close their reported gap between mental intent and physical volition. They could indeed attain their intended consequence now (the playing the media through deliberate movements). We showed through multiple parameters that such systematic congruence between intention and action consequence led to enhancement of the sense of action ownership, key to acquiring the sense of motor agency. Our work shows that this embodied learning process can be precisely quantified in personalized manner and give way to true autonomous motor learning
Caveats
The present study was designed to demonstrate that when the proper context for motor learning is provided to any child, autistic or neurotypical, the system finds its own goal without the need for explicit prompting or reward. The system draws motivation from its own self-rewarding acts eventually matching intent with expected consequences. This transpires in a matter of minutes. Our work, however, needs to be scaled and adapted for the home environment. In its current form, the setup was used at a school system, and it can be used at the laboratory. Yet, to be truly useful, this work needs scaling.
It will be important, before designing a therapy or intervention, to physiologically profile each child and determine the state of neuromotor development of their nervous systems. A personalized approach will also give us a sense of the child’s nervous systems preferences. Some children may prefer structured learning and explicit goals while others may prefer naïve, exploratory wondering before acquiring the ability to follow instructed goals with ease. It is not one way or another but rather both ways of learning interleaved to produce a nervous system that can both be creative and follow instructions. We advocate for both types of learning but caution on the importance of building autonomy from the bottom up and supporting the immature neuromotor systems before imposing or assuming that top-down control is possible.
5. Conclusions
Severe autism is not an impediment to attain autonomous volition and develop motor agency. The autistic child can learn along similar path as the TD child when the context is provided to endow the motor systems with natural autonomy and the time is allotted to allow for the freedom to naively explore. In such scenario, inducing order in their motor code is possible alongside enhancement of the SNR and the sense of predictive motor control attained without instructions, prompting or rewards. In autism, as in TD, there can be new forms of learning complementing prompted goals, reinforcement schedules and explicit rewards.
6. Patents
Supplementary Materials
The following supporting information can be downloaded at https://www.mdpi.com/article/doi/supplementary_materials.
Author Contributions
Conceptualization, EBT.; methodology; software, validation; formal analysis; investigation; resources; data curation; writing—original draft preparation, visualization; supervision; project administration; funding acquisition. All authors have read and agreed to the published version of the manuscript.
Funding
This research was funded by The Nancy Lurie Marks Family Foundation Career Development Award to EBT.
Institutional Review Board Statement
The study was conducted in accordance with the Declaration of Helsinki and approved by the Institutional Review Board (or Ethics Committee) of Rutgers the State University of New Jersey (protocol code Pro2020000154 Digital characterization of nervous systems approved 5/30/2025).
Informed Consent Statement
Informed consent was obtained from all subjects involved in the study.
Data Availability Statement
Data available on request due to restrictions (e.g., privacy, legal or ethical reasons).
Acknowledgments
We thank the participants and their families and the clinicians who provided the clinical scores.
Conflicts of Interest
The funders had no role in the design of the study; in the collection, analyses, or interpretation of data; in the writing of the manuscript; or in the decision to publish the results.
Abbreviations
The following abbreviations are used in this manuscript:
| LUQ | Gamma parameter plane Left Upper Quadrant exponential, heavy tailed distributions |
| RLQ | Gamma parameter plane Right Lower Quadrant with Gaussian regime distributions |
| TAL | Torres Agentic Learning paradigm |
| mv-ASD | Non-speaking or minimally verbal ASD |
| TD | Typically Developing control |
References
- Torres, E.B. System and method for determining amount of volition in a subject, in Google Patents; USPTO, Ed.; Rutgers The State University of New Jersey: US, 19 Oct 2017; p. 15. [Google Scholar]
- Sutton, R.S.; Barto, A.G. Reinforcement learning: an introduction. In Adaptive computation and machine learning; MIT Press: Cambridge, Mass., 1998; p. xviii, 322 p. [Google Scholar]
- Sarafino, E.P. Applied behavior analysis: principles and procedures for modifying behavior; Wiley: Hoboken, NJ, 2012; p. xxiii, 472 p. [Google Scholar]
- Bermperidis, T.; et al. Optimal time lags from causal prediction model help stratify and forecast nervous system pathology. Sci. Rep. 2021, 11(1), 20904. [Google Scholar] [CrossRef]
- Torres, E.B.; et al. Hidden social and emotional competencies in autism spectrum disorders captured through the digital lens. Front Psychiatry 2025, 16, 1559202. [Google Scholar] [CrossRef]
- Ziv, I.; et al. Oculomotor randomness is higher in autistic children and increases with the severity of symptoms. Autism Res. 2024. [Google Scholar] [CrossRef]
- Elsayed, M.; Torres, E.B. Exploring Cardiac Responses of Pain and Distress, in Topics in Autonomic Nervous System; IntechOpen, 2023. [Google Scholar]
- Torres, E.B. Autism Autonomy; Elsevier Academic Press: US, 2024; p. 470. [Google Scholar]
- Lenz, S.; et al. Traumatic Experiences and Major Life Stressors in Children and Youth With Neurodevelopmental Disorders. J. Autism Dev. Disord. 2026. [Google Scholar] [CrossRef]
- Smith Martin, A.; Thompson, F. Post-traumatic Stress Disorder in Individuals With Autism Spectrum Disorder: A Literature Review. Cureus 2026, 18(6), e110949. [Google Scholar] [CrossRef]
- Brincker, M.; Torres, E.B. Noise from the periphery in autism. Front Integr. Neurosci. 2013, 7, 34. [Google Scholar] [CrossRef]
- Torres, E.B.; et al. Autism: the micro-movement perspective. Front Integr. Neurosci. 2013, 7, 32. [Google Scholar] [CrossRef]
- Brincker, M.; Torres, E.B. Chapter 1- Why Study Movement Variability in Autism_, in Autism: the movement sensing perspective; Torres, E.B., Whyatt, C., Eds.; CRC Press/Taylor & Francis Group: Boca Raton, 2018; p. xviii, 386 pages. [Google Scholar]
- Beintema, D.J. A neurological study of newborn infants; Clinics in developmental medicine; Spastics International Medical Publications: London; London, Distributed by Heinemann Medical, 1968; Volume 11, 178 p. [Google Scholar]
- Bruggink, J.L.; et al. Quantitative aspects of the early motor repertoire in preterm infants: do they predict minor neurological dysfunction at school age? Early Hum. Dev. 2009, 85(1), 25–36. [Google Scholar] [CrossRef]
- Bruggink, J.L.; et al. The quality of the early motor repertoire in preterm infants predicts minor neurologic dysfunction at school age. J. Pediatr. 2008, 153(1), 32–9. [Google Scholar] [CrossRef]
- Einspieler, C.; Prechtl, H.F. Prechtl's assessment of general movements: a diagnostic tool for the functional assessment of the young nervous system. Ment. Retard Dev. Disabil. Res. Rev. 2005, 11(1), 61–7. [Google Scholar] [CrossRef]
- Einspieler, C. H.F.R. Prechtl, Prechtl's method on the qualitative assessment of general movements in preterm, term and young infants. In Clinics in developmental medicine; Mac Keith Press: London, 2004; Volume xi, 91 p. [Google Scholar]
- Torres, E.B.; et al. Neonatal Diagnostics: Toward Dynamic Growth Charts of Neuromotor Control. Front Pediatr. 2016, 4, 121. [Google Scholar] [CrossRef]
- Rai, R. From heart rhythms to scheduled motor milestones: A novel approach to early-stage neurodevelopmental monitoring, in Psychology; Rutgers the State University of New Jersey: New Brunswick, NJ, USA, 2024; p. 284. [Google Scholar]
- Prechtl, H.F.R. Qualitative changes of spontaneous movements in preterm infants are a marker of neurological dysfunction. Early Hum. Dev. 1990, 23, 151–159. [Google Scholar] [CrossRef]
- Einspieler, C.; Prechtl, H.F.R. Fetal Movements. Though They May Be Spontaneous, Yet There is Method in Them., in Fetal MRI. In Medical Radiology; Prayer, D., Ed.; Springer: Berlin, Heidelberg, 2010. [Google Scholar]
- Torres, E.B.; Yanovich, P.; Metaxas, D.N. Give spontaneity and self-discovery a chance in ASD: spontaneous peripheral limb variability as a proxy to evoke centrally driven intentional acts. Front Integr. Neurosci. 2013, 7, 46. [Google Scholar] [CrossRef]
- Wu, D.; et al. A Biomarker Characterizing Neurodevelopment with applications in Autism. Sci. Rep. 2018, 8(1), 614. [Google Scholar] [CrossRef]
- Vaskevich, A.; Torres, E.B. Rethinking statistical learning as a continuous dynamic stochastic process, from the motor systems perspective. Front Neurosci. 2022, 16, 1033776. [Google Scholar] [CrossRef]
- Torres, E.B. Objective biometric methods for the diagnosis and treatment of nervous system disorders; Elsevier Academic Press: London, 2018; Volume x, 568 pages. [Google Scholar]
- Torres, E.B.; Vero, J.; Rai, R. Statistical Platform for Individualized Behavioral Analyses Using Biophysical Micro-Movement Spikes. Sensors (Basel) 2018, (4), 18. [Google Scholar]
- Torres, E.B. Atypical signatures of motor variability found in an individual with ASD. Neurocase 2011, 19(2), 150–65. [Google Scholar]
- Monge, G. Memoire sur la theorie des deblais et des remblais., in Histoire de l’ Academie Royale des Science; avec les Memoires de Mathematique et de Physique; De L’imprimerie Royale: Paris, France, 1781. [Google Scholar]
- Rubner, Y.; Tomasi, C.; Guibas, L.J. Metric for Distributions with Applications to Image Databases. In Proceedings of the ICCV, Bombay, India, 1998. [Google Scholar]
- Stolfi, J.; Guibas, L.J. The earth mover’s distance as a metric for image retrieval. Int. J. Comput. Vis. 2000, 40, 99–121. [Google Scholar] [CrossRef]
- Bernstein, N.A. The Coordination and Regulation of Movements; Pergamon Press: London, 1967. [Google Scholar]
- Feĭgenberg, I.M.; Linkova, J. Nikolai Bernstein: from reflex to the model of the future. In Studien zur Geschichte des Sports; Lit Verlag: Zurich, 2014; p. xiii, 268 pages. [Google Scholar]
- Dodwell, P.C. (Ed.) Von Holst E. and M. H., The principle of reafference: Interactions between the central nervous system and the peripheral organs., in Perceptual Processing: Stimulus equivalence and pattern recognition e; Appleton-Century-Crofts: New York, 1950; pp. 41–72. [Google Scholar]
- Bermperidis, T.; Rai, R.; Torres, E.B. Digital screener of socio-motor agency balancing motor autonomy and motor control. Front Hum. Neurosci. 2024, 18, 1442799. [Google Scholar] [CrossRef]
- Torres, E.B.; Baniel, A. Longitudinal tracking of treatment targets and measures of treatment efficacy for autism spectrum disorders in the context of coupled dyadic interactions during the Anat Baniel Method Neuromovement Intervention. In The Annual Meeting of the Society for Neuroscience; SFN, Editor; SFN: Washington DC, 2026. [Google Scholar]
- Bermperidis, T.; Torres, E.B. Personalized profiling of efficacy in neuromotor development using the Feldenkrais Method: Towards digital accounts of awareness through movement. In The Annual Meeting of the Society for Neuroscience; SFN: Washington DC, 2026. [Google Scholar]
- Torres, E.B. Two classes of movements in motor control. Exp. Brain Res. 2011, 215(3-4), 269–83. [Google Scholar] [CrossRef]
- Torres, E.B. Signatures of movement variability anticipate hand speed according to levels of intent. Behav. Brain Funct. 2013, 9, 10. [Google Scholar] [CrossRef]
- Torres, E.B. Theoretical Framework for the Study of Sensori-motor Integration. In in Cognitive Science; University of California, San Diego: La Jolla, 2001; p. 115. [Google Scholar]
- Torres, E.B.; Zipser, D. Reaching to Grasp with a Multi-jointed Arm (I): A Computational Model. J. Neurophysiol. 2002, 88, 1–13. [Google Scholar] [CrossRef]
- Torres, E.B.; Zipser, D. Simultaneous control of hand displacements and rotations in orientation-matching experiments. J. Appl. Physiol. (Highlighted Topic Neural Control of Movement). 2004, 96, 1978–1987. [Google Scholar] [CrossRef]
- Torres, E.; Andersen, R. Space-time separation during obstacle-avoidance learning in monkeys. J. Neurophysiol. 2006, 96(5), 2613–32. [Google Scholar] [CrossRef]
- Torres, E.B. New symmetry of intended curved reaches. Behav. Brain Funct. 2010, 6, 21. [Google Scholar] [CrossRef]
- Torres, E.B.; Denisova, K. Motor noise is rich signal in autism research and pharmacological treatments. Sci. Rep. 2016, 6, 37422. [Google Scholar] [CrossRef]
- Haggard, P. Sense of agency in the human brain. Nat. Rev. Neurosci. 2017, 18(4), 196–207. [Google Scholar] [CrossRef]
- Vaskevich, A.; Luria, R. Adding statistical regularity results in a global slowdown in visual search. Cognition 2018, 174, 19–27. [Google Scholar] [CrossRef]
- Vaskevich, A.; et al. Neural Evidence Suggests Both Interference and Facilitation from Embedding Regularity into Visual Search. J. Cogn. Neurosci. 2021, 33(4), 622–634. [Google Scholar] [CrossRef]
Figure 1.
Schematic structure of the proposed Torres Agentic Learning, TAL paradigm. (A) The concept of transitioning from an equiprobable state characterized by the memoryless exponential distribution whereby all future events are equally probable, and the signal-to-noise ratio is at its maximum, creating the conditions for a spontaneous surprise leading to an unintended consequence. (B) The surprise sets up the stage for biased search towards the uncovering of a reference signal. (C) Surprise is an anchor denoting a reference signal to probe the space, moving along the gradient direction, one that minimizes the error between desired consequence and impending motor action. (D) Quantification of the non-linear nature of maximizing surprise in our setup. The lower the probability of an outcome, the higher the conditions for a surprise (unexpected event) to occur.
Figure 1.
Schematic structure of the proposed Torres Agentic Learning, TAL paradigm. (A) The concept of transitioning from an equiprobable state characterized by the memoryless exponential distribution whereby all future events are equally probable, and the signal-to-noise ratio is at its maximum, creating the conditions for a spontaneous surprise leading to an unintended consequence. (B) The surprise sets up the stage for biased search towards the uncovering of a reference signal. (C) Surprise is an anchor denoting a reference signal to probe the space, moving along the gradient direction, one that minimizes the error between desired consequence and impending motor action. (D) Quantification of the non-linear nature of maximizing surprise in our setup. The lower the probability of an outcome, the higher the conditions for a surprise (unexpected event) to occur.
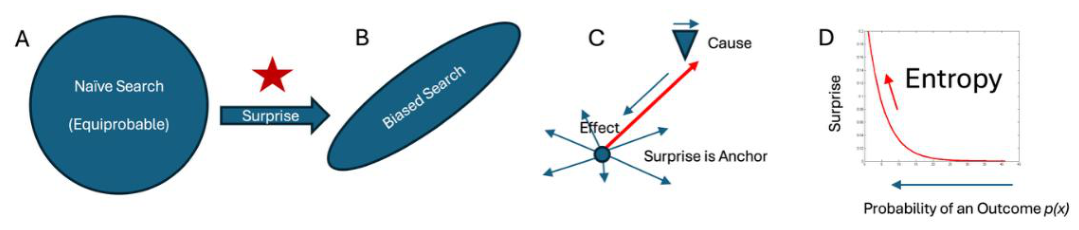
Figure 2.
Agentic Closed Loop Learning Setup. (A) Participant sits facing a computer screen located at a non-reachable distance from the hand, when the arm is fully extended. Four electromagnetic sensors streaming 3D position and orientation are affixed to the hand (red sensor), forearm, upperarm and shoulder. The agentic region (light pink) is defined around a 3D position location such that the distance between the current location of the hand sensor and this point is continuously tracked. If the hand is not inside the agentic region, nothing happens. (B) As the hand moves inside the agentic region (of some radius around a 3D point that the participant does not know) the media is triggered. As soon as the hand moves out of this region the media stops playing. The unexpected media-play is transiently triggered by the hand’s spontaneous motion but revisiting the agentic region to reproduce the unintended consequence (media play) initiates a self-guided learning process until the targeted agentic region is systematically found and the search for the goal is refined such that the hand deliberately moves within the region and the intended consequence is consistently realized (the media continuously plays). (C) The same setup is attained using a camera feed facing the participant. The hand’s spontaneous motions trigger the camera ON, and the participants see themselves on the screen as a digital mirroring image of self in real time. The system moves from unintended to intended consequences as it transitions from spontaneous to intentional movements.
Figure 2.
Agentic Closed Loop Learning Setup. (A) Participant sits facing a computer screen located at a non-reachable distance from the hand, when the arm is fully extended. Four electromagnetic sensors streaming 3D position and orientation are affixed to the hand (red sensor), forearm, upperarm and shoulder. The agentic region (light pink) is defined around a 3D position location such that the distance between the current location of the hand sensor and this point is continuously tracked. If the hand is not inside the agentic region, nothing happens. (B) As the hand moves inside the agentic region (of some radius around a 3D point that the participant does not know) the media is triggered. As soon as the hand moves out of this region the media stops playing. The unexpected media-play is transiently triggered by the hand’s spontaneous motion but revisiting the agentic region to reproduce the unintended consequence (media play) initiates a self-guided learning process until the targeted agentic region is systematically found and the search for the goal is refined such that the hand deliberately moves within the region and the intended consequence is consistently realized (the media continuously plays). (C) The same setup is attained using a camera feed facing the participant. The hand’s spontaneous motions trigger the camera ON, and the participants see themselves on the screen as a digital mirroring image of self in real time. The system moves from unintended to intended consequences as it transitions from spontaneous to intentional movements.
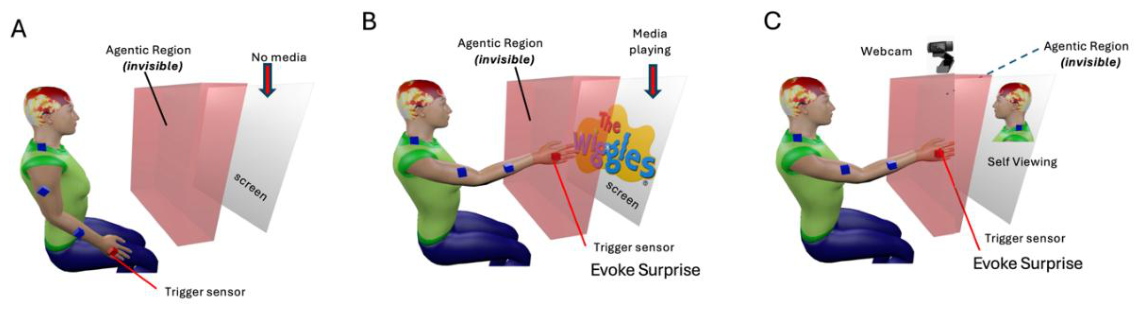
Figure 5.
Automatic labeling of physical and stochastic motor trajectories. (A) 3D positional hand trajectories in peripersonal space as the participant performs aimless arm flailing and the hand wonders (blue) crossing through the agentic region of interest (ROI). Positional segments in the ROI (red) are marked when the distance between the current hand position and the designated ROI is within an epsilon value. (B) Upon labeling the stochastic signatures of each one-second window according to the location on the empirically estimated points on the Gamma parameter plane (RLQ vs. LUQ) and IN vs. OUT the agentic ROI, the Gamma variance is tracked window by window. (C) The EMD reflecting the magnitude of the shift in PDF across the Gamma parameter plane is also obtained and labeled accordingly. These points will then be grouped in frequency histograms to automatically detect different forms of motor learning associated with the process of self-discovering the goal of a task without any instructions or given reference signals.
Figure 5.
Automatic labeling of physical and stochastic motor trajectories. (A) 3D positional hand trajectories in peripersonal space as the participant performs aimless arm flailing and the hand wonders (blue) crossing through the agentic region of interest (ROI). Positional segments in the ROI (red) are marked when the distance between the current hand position and the designated ROI is within an epsilon value. (B) Upon labeling the stochastic signatures of each one-second window according to the location on the empirically estimated points on the Gamma parameter plane (RLQ vs. LUQ) and IN vs. OUT the agentic ROI, the Gamma variance is tracked window by window. (C) The EMD reflecting the magnitude of the shift in PDF across the Gamma parameter plane is also obtained and labeled accordingly. These points will then be grouped in frequency histograms to automatically detect different forms of motor learning associated with the process of self-discovering the goal of a task without any instructions or given reference signals.
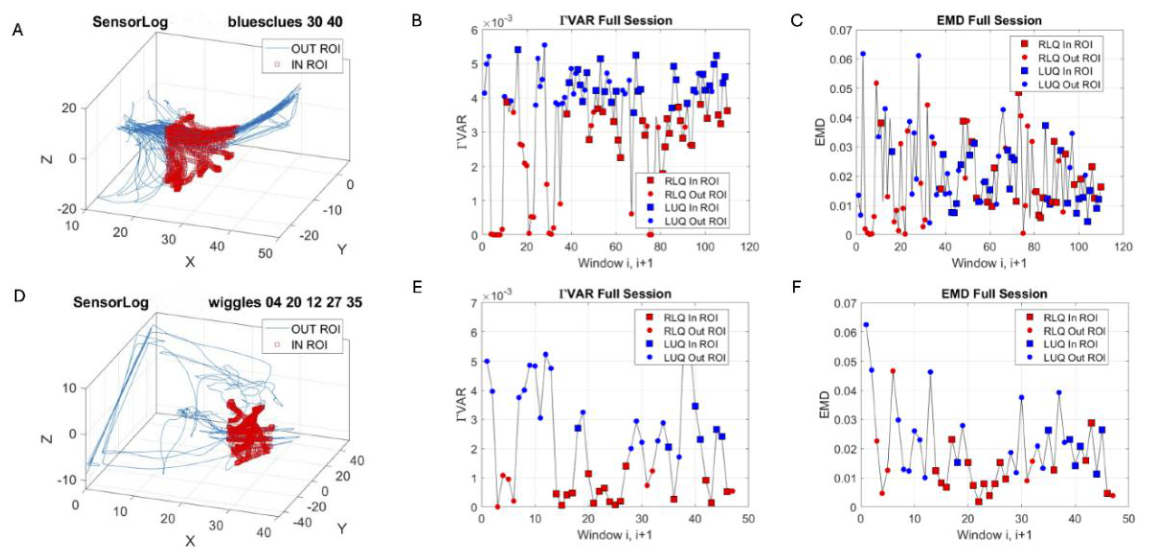
Figure 6.
Physical and Stochastic characterization of Exploration towards Surprise and transition to Error correction in the ASD cohort. (A) LUQ-OUT of aROI where the Gamma PDF shapes gathered into a frequency histogram reveal bimodality, one mode comprises Gamma shapes in the memoryless (equiprobable) exponential regime and one towards skewed shapes with heavy tail to the right. (B) The block times of the windows in the session when these parameters were detected pointed to the earlier half of the exploration block. (C) Distribution of variance concentrated in the lower range (high SNR) and EMD distributed across the range of dynamically shifting PDFs. (D) LUQ-IN aROI also reveal bimodality in the distribution of shapes but concentrated later in the session ~ ½ the session. (F) Highly concentrated lower range of the variance accompanied by highly concentrated EMD values towards the lower end of the ranges, denoting more stability in the PDF shifts. (G) RLQ-OUT aROI shows Gamma shapes in the Gaussian regime (104 and above) distributed unimodally. (H) Early occurrences of these shapes in the first ¼ of the session. (I) Distributed variance across lower ranges of values and distributed EMD denoting dynamic shifts in PDFs. (J) RLQ-IN aROI with Gamma shape values similarly distributed unimodally in the Gaussian range. (K) but with occurrences later in the session. (L) Variance distribution (top) and Rate of change of EMD signaling dynamics of the stochastic process whereby probability distributions change.
Figure 6.
Physical and Stochastic characterization of Exploration towards Surprise and transition to Error correction in the ASD cohort. (A) LUQ-OUT of aROI where the Gamma PDF shapes gathered into a frequency histogram reveal bimodality, one mode comprises Gamma shapes in the memoryless (equiprobable) exponential regime and one towards skewed shapes with heavy tail to the right. (B) The block times of the windows in the session when these parameters were detected pointed to the earlier half of the exploration block. (C) Distribution of variance concentrated in the lower range (high SNR) and EMD distributed across the range of dynamically shifting PDFs. (D) LUQ-IN aROI also reveal bimodality in the distribution of shapes but concentrated later in the session ~ ½ the session. (F) Highly concentrated lower range of the variance accompanied by highly concentrated EMD values towards the lower end of the ranges, denoting more stability in the PDF shifts. (G) RLQ-OUT aROI shows Gamma shapes in the Gaussian regime (104 and above) distributed unimodally. (H) Early occurrences of these shapes in the first ¼ of the session. (I) Distributed variance across lower ranges of values and distributed EMD denoting dynamic shifts in PDFs. (J) RLQ-IN aROI with Gamma shape values similarly distributed unimodally in the Gaussian range. (K) but with occurrences later in the session. (L) Variance distribution (top) and Rate of change of EMD signaling dynamics of the stochastic process whereby probability distributions change.
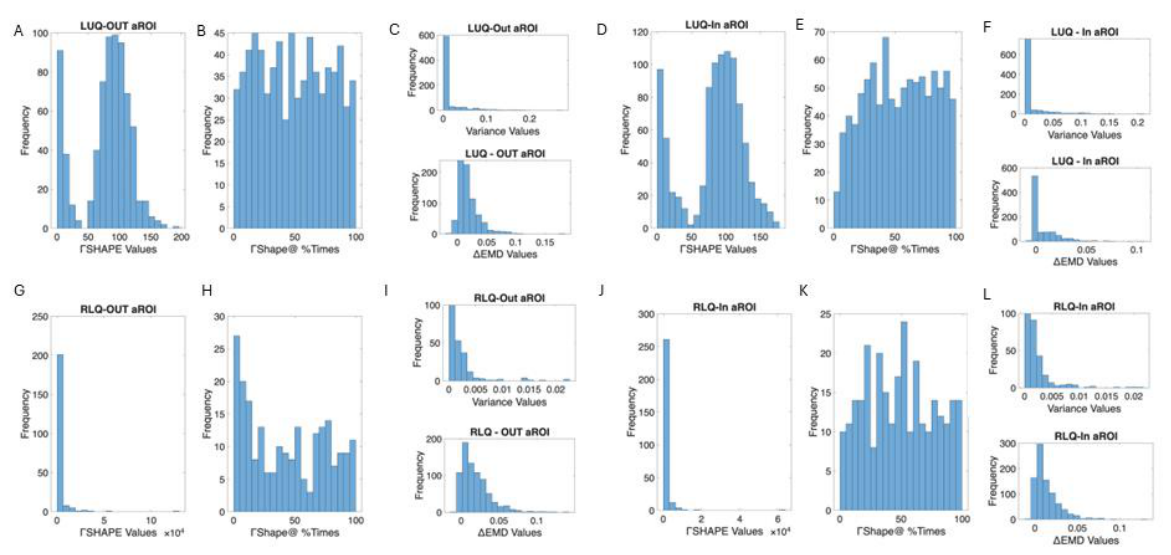
Figure 7.
Physical and Stochastic characterization of Exploration towards Surprise and transition to Error correction in the TD cohort. (A-L) Similar results as in the ASD cohort with differences in the temporal dynamics of the non-stationary stochastic process and faster convergence to Error-correction regimes in (J-L) comparing panel 7K to panel 6K.
Figure 7.
Physical and Stochastic characterization of Exploration towards Surprise and transition to Error correction in the TD cohort. (A-L) Similar results as in the ASD cohort with differences in the temporal dynamics of the non-stationary stochastic process and faster convergence to Error-correction regimes in (J-L) comparing panel 7K to panel 6K.
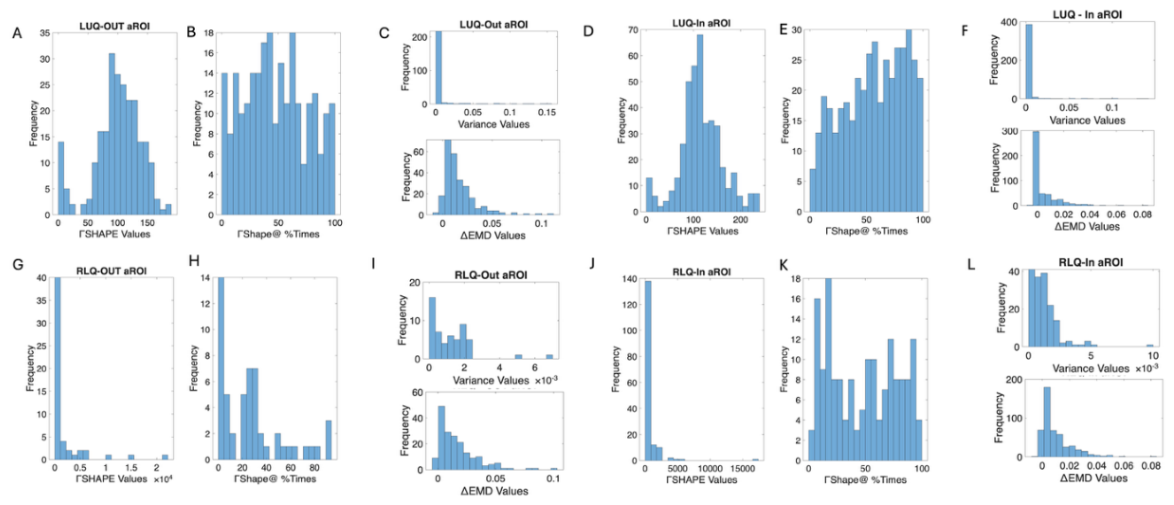
Figure 8.
Scaling power law inversely relating the log shape and log scale scatters of the continuous Gamma family. (A) mv-ASD IN vs. OUT of the LUQ Exponential (blue) and IN vs. OUT RLQ Gaussian (red). (B) Same as in (A) for TD. (C) Differential entropy as a function of the Gamma variance for all mv-ASD cases. (D) same as (C) for the TD. (E) Slope vs. intercept from the linear fit across stochastic modes and physical states for mv-ASD vs. TD showing a contraction of the ranges of values in the autistic cohort.
Figure 8.
Scaling power law inversely relating the log shape and log scale scatters of the continuous Gamma family. (A) mv-ASD IN vs. OUT of the LUQ Exponential (blue) and IN vs. OUT RLQ Gaussian (red). (B) Same as in (A) for TD. (C) Differential entropy as a function of the Gamma variance for all mv-ASD cases. (D) same as (C) for the TD. (E) Slope vs. intercept from the linear fit across stochastic modes and physical states for mv-ASD vs. TD showing a contraction of the ranges of values in the autistic cohort.
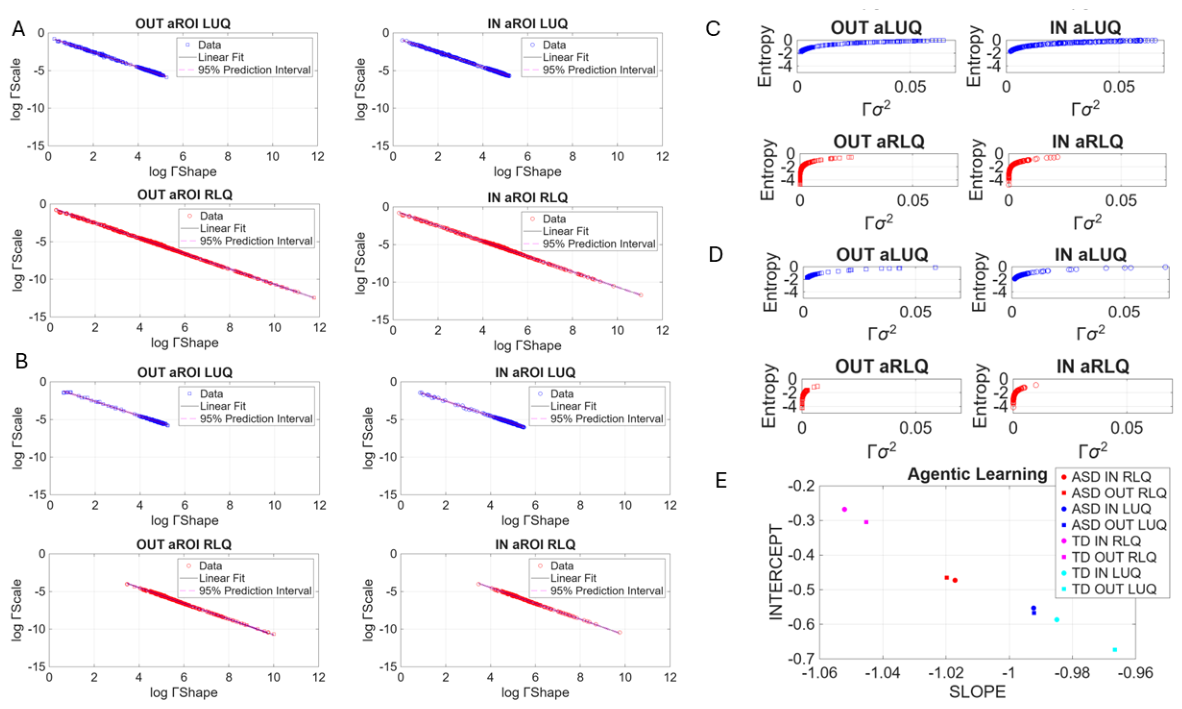
Figure 9.
Characterization of 4 stochastic and physical stages of uninstructed learning process in ASD. (A) The log (1/Gamma variance) evolution as a function of the Gamma shape parameter for all 4 groups of learning: inside the aROI LUQ, outside the aROI LUQ, inside the aROI RLQ and outside the aROI RLQ. As the shape increases towards the Gaussian regime, the variance decreases resulting in higher values along the vertical axis (log 1/VAR) with overlaps across the 4 regimes along the ranges of the log Gamma shape < 4. (B) The log of 1/probability of MMS as a function of the Gamma variance reveals vertical overlaps up to the 200 range with horizontal variance concentration in the lower ranges. They correspond to log shape below 4 and log scale ranges blow -5 in the inset graphs. As the log shape increases, the log scale linearly decreases with slope and intercepts reported in Table 1.
Figure 9.
Characterization of 4 stochastic and physical stages of uninstructed learning process in ASD. (A) The log (1/Gamma variance) evolution as a function of the Gamma shape parameter for all 4 groups of learning: inside the aROI LUQ, outside the aROI LUQ, inside the aROI RLQ and outside the aROI RLQ. As the shape increases towards the Gaussian regime, the variance decreases resulting in higher values along the vertical axis (log 1/VAR) with overlaps across the 4 regimes along the ranges of the log Gamma shape < 4. (B) The log of 1/probability of MMS as a function of the Gamma variance reveals vertical overlaps up to the 200 range with horizontal variance concentration in the lower ranges. They correspond to log shape below 4 and log scale ranges blow -5 in the inset graphs. As the log shape increases, the log scale linearly decreases with slope and intercepts reported in Table 1.
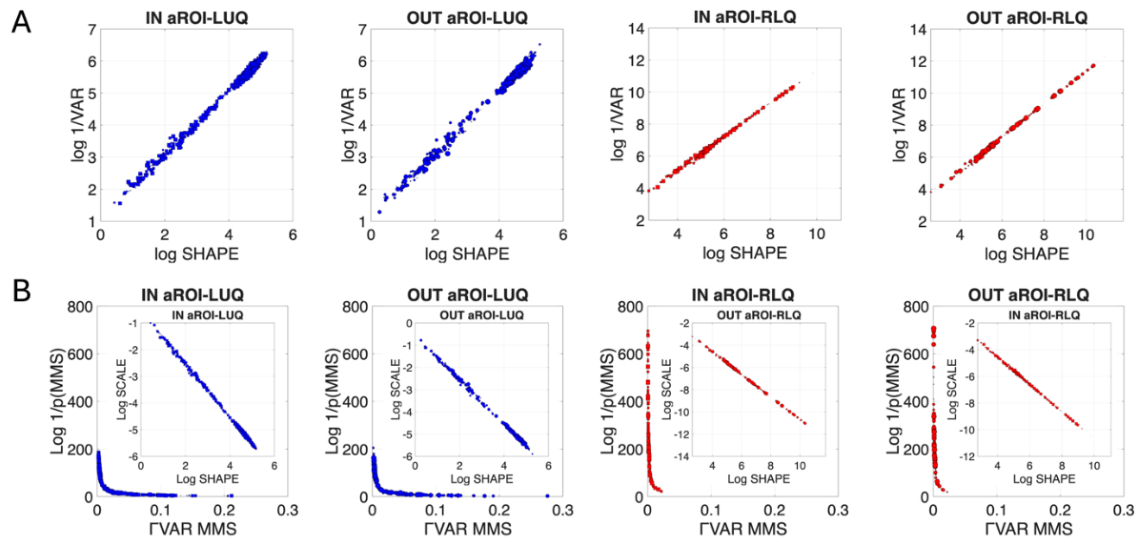
Figure 10.
Characterization of 4 stochastic and physical stages of uninstructed learning process in TD similarly to Figure 8. (A) The log (1/Gamma variance) evolution as a function of the Gamma shape parameter for all 4 groups of learning. As the shape increases towards the Gaussian regime, the variance decreases resulting in higher values along the vertical axis with overlapping across the 4 regimes along the 4-5 ranges of the log Gamma shape. (B) The log of 1/probability of MMS as a function of the Gamma variance reveals overlap up to the 200 range with variance concentration in the lower ranges. Similarly, as in the ASD cohort, they correspond in the inset to log shape (4-6) and log scale ranges (-6 to -5). As the log shape increases the log scale decreases linearly.
Figure 10.
Characterization of 4 stochastic and physical stages of uninstructed learning process in TD similarly to Figure 8. (A) The log (1/Gamma variance) evolution as a function of the Gamma shape parameter for all 4 groups of learning. As the shape increases towards the Gaussian regime, the variance decreases resulting in higher values along the vertical axis with overlapping across the 4 regimes along the 4-5 ranges of the log Gamma shape. (B) The log of 1/probability of MMS as a function of the Gamma variance reveals overlap up to the 200 range with variance concentration in the lower ranges. Similarly, as in the ASD cohort, they correspond in the inset to log shape (4-6) and log scale ranges (-6 to -5). As the log shape increases the log scale decreases linearly.
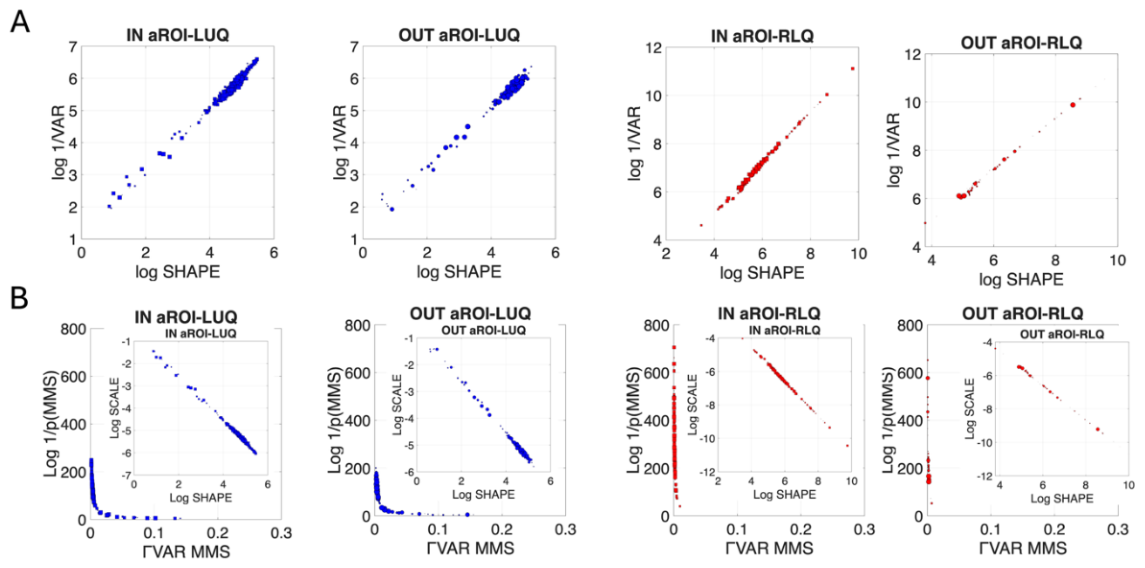
Figure 11.
Entropy behavior across all four blocks of physical and stochastic agentic learning. (A) ASD cohort Entropy as a function of Gamma PDF derived from the MMS. As the Gamma probability of the MMS decreases the entropy increases with chances for surprise corresponding to concentration of variance in the lower range (Figure 6 and Figure 7). Notice sparse values in the higher Gamma PDF ranges for the RLQ stochastic regime particularly when the hand is in the aROI (since that is when the error-correction is taking place and the target has already been self-discovered). (B) This is even more evident in the TD cohort. Sparser higher entropy at low Gamma PDF in TD is accompanied by more brief naïve exploration.
Figure 11.
Entropy behavior across all four blocks of physical and stochastic agentic learning. (A) ASD cohort Entropy as a function of Gamma PDF derived from the MMS. As the Gamma probability of the MMS decreases the entropy increases with chances for surprise corresponding to concentration of variance in the lower range (Figure 6 and Figure 7). Notice sparse values in the higher Gamma PDF ranges for the RLQ stochastic regime particularly when the hand is in the aROI (since that is when the error-correction is taking place and the target has already been self-discovered). (B) This is even more evident in the TD cohort. Sparser higher entropy at low Gamma PDF in TD is accompanied by more brief naïve exploration.
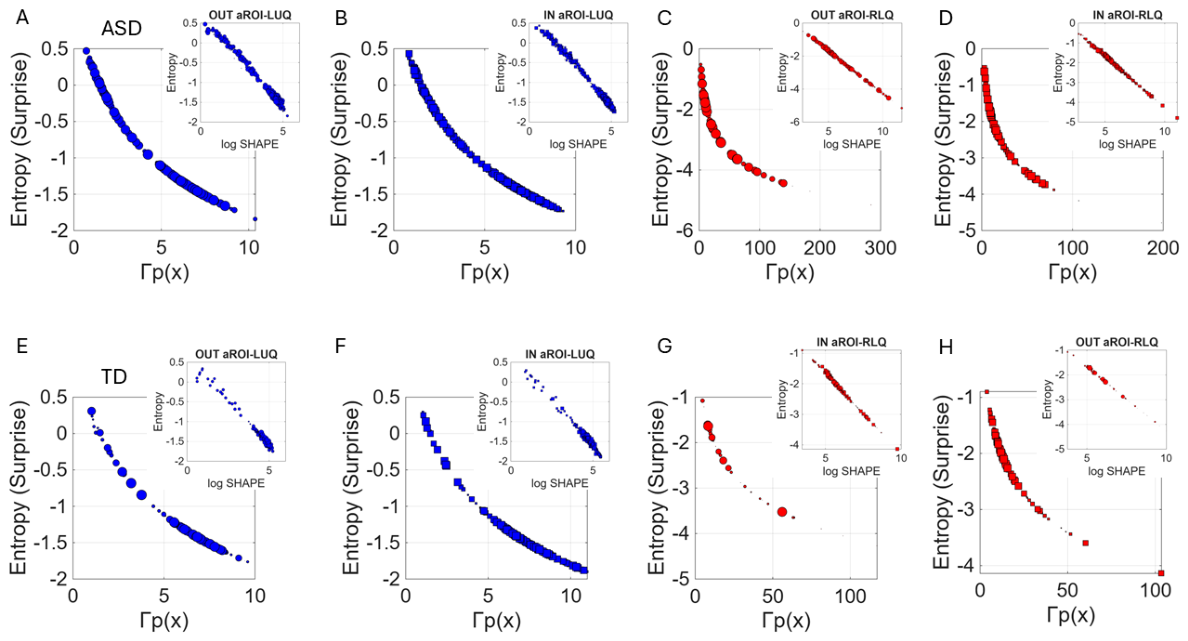
Figure 12.
Tracking stochastic trajectories. (A) mv-ASD Gamma moments, each point representing the window-by-window distribution. Inset shows the EMD profile per unit time (1-second-long sliding window) color coded accordingly. (B) Same as (A) for TD. (C) Frequency histograms of the EMD values grouped by stochastic mode and physical location shown in the title of the subplot. (D) Same as (C) for TD. Notice the brevity of the exploration OUT RLQ relative to IN RLQ vs. mv-ASD -which nearly doubles relative to it.
Figure 12.
Tracking stochastic trajectories. (A) mv-ASD Gamma moments, each point representing the window-by-window distribution. Inset shows the EMD profile per unit time (1-second-long sliding window) color coded accordingly. (B) Same as (A) for TD. (C) Frequency histograms of the EMD values grouped by stochastic mode and physical location shown in the title of the subplot. (D) Same as (C) for TD. Notice the brevity of the exploration OUT RLQ relative to IN RLQ vs. mv-ASD -which nearly doubles relative to it.
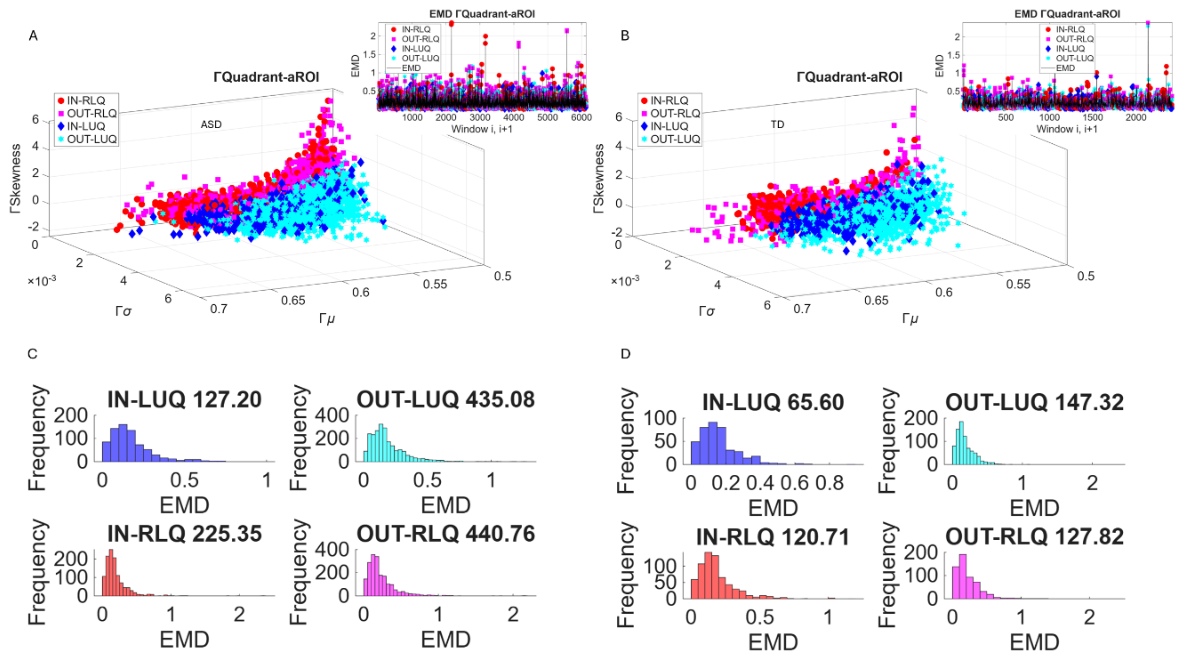
Figure 13.
Statistical tests. (A) Rank sum test comparing pairwise the stochastic mode and physical hand location state of mv-ASD vs. TD cohorts for Gamma mean left panel and Gamma variance right panel. (B) Same as in (A) for the Gamma scale (left) and shape (right). (C) Same for EMD rate of change. (D) Cumulative EMD distances in each mode/state for mv-ASD vs. TD. (D-F) Frequency histograms of p-values from the Kruskal-Wallis (non-parametric one-way ANOVA) testing for significance at the alpha level 0.01 for the Gamma Variance (D), Gamma shape (E) and Gamma scale (F). Each plot comprises 4 panels IN Exponential (LUQ), OUT LUQ, IN Gaussian (RLQ) and OUT RLQ, with the percent of significant p-values listed on the subplot title. Note that exploring OUT LUQ (equiprobable exponential mediated by spontaneous movements) are most similar between mv-ASD and TD, both in (D) Cumulative EMD and across the shape, scale and variance parameters.
Figure 13.
Statistical tests. (A) Rank sum test comparing pairwise the stochastic mode and physical hand location state of mv-ASD vs. TD cohorts for Gamma mean left panel and Gamma variance right panel. (B) Same as in (A) for the Gamma scale (left) and shape (right). (C) Same for EMD rate of change. (D) Cumulative EMD distances in each mode/state for mv-ASD vs. TD. (D-F) Frequency histograms of p-values from the Kruskal-Wallis (non-parametric one-way ANOVA) testing for significance at the alpha level 0.01 for the Gamma Variance (D), Gamma shape (E) and Gamma scale (F). Each plot comprises 4 panels IN Exponential (LUQ), OUT LUQ, IN Gaussian (RLQ) and OUT RLQ, with the percent of significant p-values listed on the subplot title. Note that exploring OUT LUQ (equiprobable exponential mediated by spontaneous movements) are most similar between mv-ASD and TD, both in (D) Cumulative EMD and across the shape, scale and variance parameters.
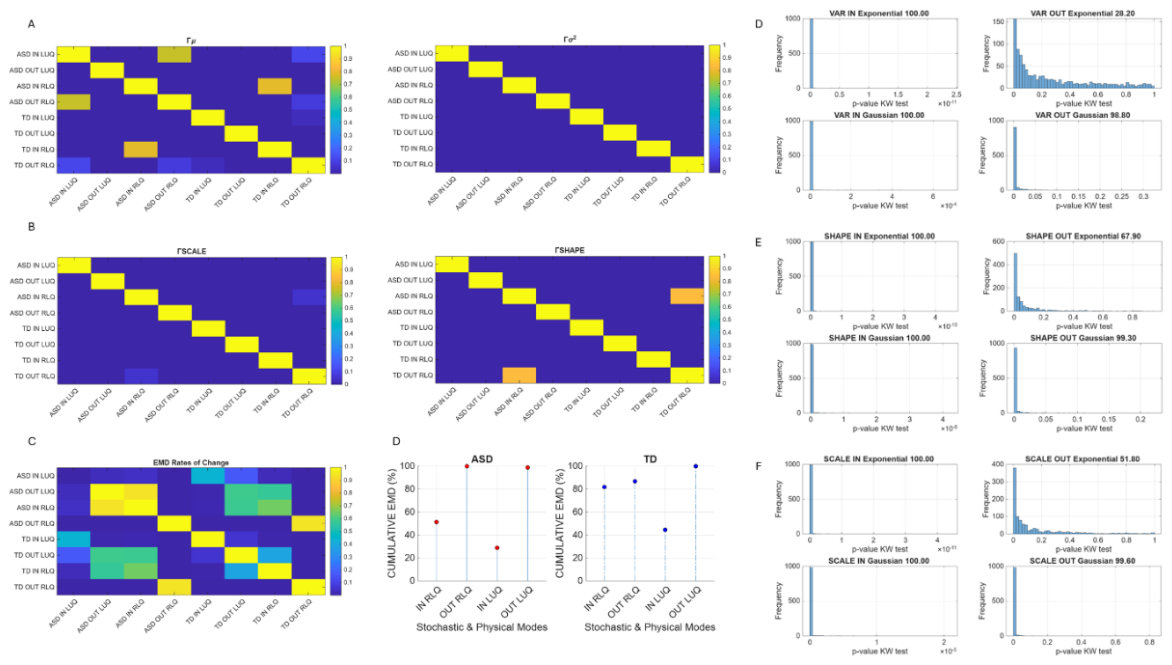

Table 1.
Slopes and Intercepts for each of the four (natural) log-log Gamma parameters scatter plots across mv-ASD vs. TD cohorts.
Table 1.
Slopes and Intercepts for each of the four (natural) log-log Gamma parameters scatter plots across mv-ASD vs. TD cohorts.
| Group |
OUT aROI LUQ |
IN aROI LUQ |
OUT aROI RLQ |
IN aROI RLQ |
|---|---|---|---|---|
|
mv-ASD |
(-0.992, -0.567) R2 0.998 |
(-0.992 -0.553) R2 0.998 |
(-1.019, -0.465) R2 0.999 |
(-1.017, -0.473) R2 0.998 |
|
TD |
(-0.966, -0.674) R2 0.996 |
(-0.985, -0.587) R2 0.998 |
(-1.045, -0.305) R2 0.999 |
(-1.052, -0.2678) R2 0.999 |
Table 2.
Slopes and Intercepts for each of the 4 modes, (natural) log shape and (natural) log 1/var across mv-ASD vs. TD cohorts.
Table 2.
Slopes and Intercepts for each of the 4 modes, (natural) log shape and (natural) log 1/var across mv-ASD vs. TD cohorts.
| Group |
OUT aROI LUQ |
IN aROI LUQ |
OUT aROI RLQ |
IN aROI RLQ |
|---|---|---|---|---|
|
mv-ASD |
(0.984, 1.134) R2 0.992 |
(0.985, 1.105) R2 0.994 |
(1.0459, 0.946) R2 0.998 |
(1.057, 0.855) R2 0.996 |
|
TD |
(0.933, 1.347) R2 0.985 |
(0.969, 1.174) R2 0.983 |
(1.079, 0.702) R2 0.996 |
(1.058, 0.854) R2 0.998 |
Table 3.
Slopes and Intercepts for each of the 4 modes, log shape and log differential entropy across mv-ASD vs. TD cohorts.
Table 3.
Slopes and Intercepts for each of the 4 modes, log shape and log differential entropy across mv-ASD vs. TD cohorts.
| Group |
OUT aROI LUQ |
IN aROI LUQ |
OUT aROI RLQ |
IN aROI RLQ |
|---|---|---|---|---|
|
mv-ASD |
(-0.465,0.727) R2 0.9981 | (-0.469,0.759) R2 0.9964 | (-0.527,0.981) R2 0.9991 | (-0.522,0.936) R2 0.9995 |
|
TD |
(-0.437,0.606) R2 0.9964 | (-0.4643,0.731) R2 0.9957 | (1.0459, 0.946) R2 0.9982 |
(-0.539,1.061) R2 0.9989 |
Disclaimer/Publisher’s Note: The statements, opinions and data contained in all publications are solely those of the individual author(s) and contributor(s) and not of MDPI and/or the editor(s). MDPI and/or the editor(s) disclaim responsibility for any injury to people or property resulting from any ideas, methods, instructions or products referred to in the content. |
© 2026 by the authors. Licensee MDPI, Basel, Switzerland. This article is an open access article distributed under the terms and conditions of the Creative Commons Attribution (CC BY) license (http://creativecommons.org/licenses/by/4.0/).
Copyright: This open access article is published under a Creative Commons CC BY 4.0 license, which permit the free download, distribution, and reuse, provided that the author and preprint are cited in any reuse.