

Submitted:
30 September 2026
Posted:
01 October 2026
You are already at the latest version
Abstract
The conversion of fast-growing non-food woody biomass into storable fuels and carbon-rich products may contribute to the diversification of regional renewable-resource systems. This exploratory pilot-scale study evaluated Paulownia wood chips in a continuously fed five-zone pyrolysis reactor at setpoint temperatures of 300, 400, and 500 °C. One 20 kg wet-feed run was evaluated at each setpoint at a nominal throughput of 20 kg h⁻¹ and a nominal residence time of 10 min. Reactor temperature, non-condensable gas volumetric flow, and electrical input power were recorded at 5 s intervals. Recovered biochar masses were 7.3, 7.4, and 5.8 kg, and recovered condensed-liquid masses were 9.1, 8.3, and 6.6 kg at 300, 400, and 500 °C, respectively. The combined solid-plus-liquid recovery decreased from 82.0 to 62.0% of wet feed. Because gas mass and composition were not measured, the remaining fraction cannot be interpreted as a gas yield, and a closed mass balance was not established. Mean non-condensable gas flow rates calculated from the time-series data were 1.65, 3.53, and 8.36 m³ h⁻¹, while mean measured reactor temperatures were 303.1, 398.5, and 498.0 °C. The highest observed carbon content and higher heating value of biochar occurred at 400 °C, at 76.99 wt.% and 30.47 MJ kg⁻¹. The calculated atomic H/C ratio decreased from 0.68 at 300 °C to 0.37 at 500 °C. The results describe temperature-dependent behaviour in one pilot-scale run per condition and do not provide inferential evidence of an optimum. Replicated reactor runs, gas chromatography, liquid-phase analysis, and expanded biochar characterisation are required before process efficiency or application suitability can be established.
Keywords:
Paulownia
; pilot-scale pyrolysis
; biochar
; non-condensable gas
; mass recovery
; electrical input power
1. Introduction
Fast-growing woody crops can provide lignocellulosic biomass without direct use as food, although their sustainability depends on cultivation practice, land status, transport distance, and the selected conversion pathway. Paulownia species and hybrids have attracted attention because of rapid growth and established uses in lightweight wood products, furniture, boards, pulp, and other material applications. Energy and biorefinery options include direct combustion, densification, biochemical conversion, gasification, and pyrolysis [1,2,3,4,5].
Pyrolysis is the thermal decomposition of organic matter under oxygen-limited or oxygen-free conditions. It produces a solid carbon-rich residue, a condensable liquid fraction, and a non-condensable gas. Product distribution depends on feedstock composition, particle dimensions, final temperature, heating rate, vapour residence time, carrier-gas conditions, and reactor design [6,7,8,9,10,11]. Consequently, temperature-only comparisons must be interpreted within a defined reactor and operating envelope rather than as universally transferable optima.
Paulownia pyrolysis has previously been examined at laboratory scale. Yorgun and Yıldız investigated final temperature, heating rate, particle size, and nitrogen flow in a fixed-bed reactor and reported a maximum liquid yield at 500 °C under their selected conditions [12]. Other work has addressed thermal behaviour and kinetics of Paulownia wood and its major components [13]. These studies demonstrate that the basic influence of temperature is not novel in itself. A remaining practical question is how industrially relevant wood chips behave in a larger, continuously fed prototype with spatially distributed heating and time-resolved operational measurements.
The objective of this study was therefore to determine how setpoint temperature between 300 and 500 °C was associated with recoverable solid and condensed-liquid fractions, biochar elemental and fuel properties, non-condensable gas-flow dynamics, reactor-temperature stability, and electrical input power during pilot-scale processing of Paulownia wood chips. Because each temperature was represented by one reactor run, the study was designed and interpreted as exploratory rather than confirmatory.
2. Materials and Methods
2.1. Feedstock and Experimental Design
Paulownia wood chips were used as received. The chips had an approximate cross-section of 10 × 10 mm and a maximum reported length of 50 mm. The particles were irregular; a complete sieve-size distribution was not available. Each experimental condition used 20 kg of wet feed. Reactor setpoints were 300, 400, and 500 °C, the nominal feed rate was 0.5 kg per 90 s (20 kg h⁻¹), and the nominal residence time reported for the unit was 10 min. One reactor-scale run was available at each temperature. Accordingly, temperature was not subjected to inferential statistical testing, and differences among setpoints are reported descriptively.
2.2. Pilot-Scale Pyrolysis System
Experiments were performed in the Unipyr SPU-1 pilot pyrolysis unit (Danagra, Slovakia) in the Biomass Gasification Laboratory. The reactor was 5 m long and contained five independently regulated 1 m heating sections. Biomass was transported through the heated reactor by a conveyor. Volatile products passed to a condenser, the recovered liquid accumulated in the lower part of the condenser, and residual gas passed through a mechanical filter and blower. Biochar left the reactor through a cooling conveyor. The process examined in this study is described consistently as pyrolysis because no oxidising agent was intentionally supplied to the reaction zone. The gaseous stream is termed non-condensable pyrolysis gas rather than syngas because its composition was not measured.
2.3. Process Measurements and Analysis of Excel Records
The control system recorded time, a selected reactor-temperature channel, three-phase electrical current, and non-condensable gas volumetric flow. The supplied Excel records contained observations at 5 s intervals. The combined workbook “Grafy 300_400_500.xlsx” was used as the harmonised source for the 60 min comparison. Means and sample standard deviations were calculated across the 768 recorded time points for each run. These standard deviations quantify within-run temporal variability and must not be interpreted as between-run reproducibility. Electrical input power was taken from the calculated power channel in the supplied workbook. Trapezoidal integration of that channel over the recorded interval was used to estimate electrical energy input. This quantity does not include feedstock chemical energy and must not be interpreted as total process energy demand or conversion efficiency.
2.3. Process Measurements and Analysis of Excel Records
The control system recorded time, a selected reactor-temperature channel, three-phase electrical current, and non-condensable gas volumetric flow. The supplied Excel records contained observations at 5 s intervals. The combined was used as the harmonised source for the 60 min comparison. Means and sample standard deviations were calculated across the 768 recorded time points for each run. These standard deviations quantify within-run temporal variability and must not be interpreted as between-run reproducibility. Electrical input power was taken from the calculated power channel in the supplied workbook. Trapezoidal integration of that channel over the recorded interval was used to estimate electrical energy input. This quantity does not include feedstock chemical energy and must not be interpreted as total process energy demand or conversion efficiency.
2.4. Biochar Analyses
Elemental analysis of carbon, hydrogen, nitrogen, and sulphur was performed using an Elementar vario MACRO cube analyser (Elementar Analysensysteme GmbH, Germany). Approximately 40 mg was used per determination. Three analytical determinations were made on the feedstock and on the biochar, sample collected from each reactor run. These are analytical replicates of a run-specific sample, not independent pyrolysis replicates. Dry matter was determined thermogravimetrically using a KERN MLB 50-3 moisture analyser (KERN & SOHN GmbH, Germany), using approximately 1.5 g per determination and three analytical repetitions. Organic dry matter and residual ash-related fraction were determined gravimetrically after treatment at 550 °C using an ANETA A2X muffle furnace (Slovakia). Because confirmation of compliance with a named coal or solid-biofuel standard was not available, the values are presented as method-specific gravimetric results.
Atomic H/C ratios were calculated from the reported mass fractions as H/C = (H/1.008)/(C/12.011). As total carbon rather than organic carbon was used, these values are indicators of carbonisation and are not equivalent to H/Corg values required by dedicated biochar classification frameworks.
2.5. Product Recovery and Limitations of the Balance
Recovered biochar and condensed liquid were weighed after each run. Their wet-feed-based recoveries were calculated by dividing recovered mass by the 20 kg wet feed. The difference between feed mass and recovered biochar plus condensed liquid was reported as an unmeasured fraction. It may include non-condensable gas, water and organic vapours not recovered in the condensate, deposits, reactor hold-up, leakage, and measurement error. Because neither gas mass nor its composition was determined, the unmeasured fraction was not assigned as gas yield.
3. Results
3.1. Product Recovery
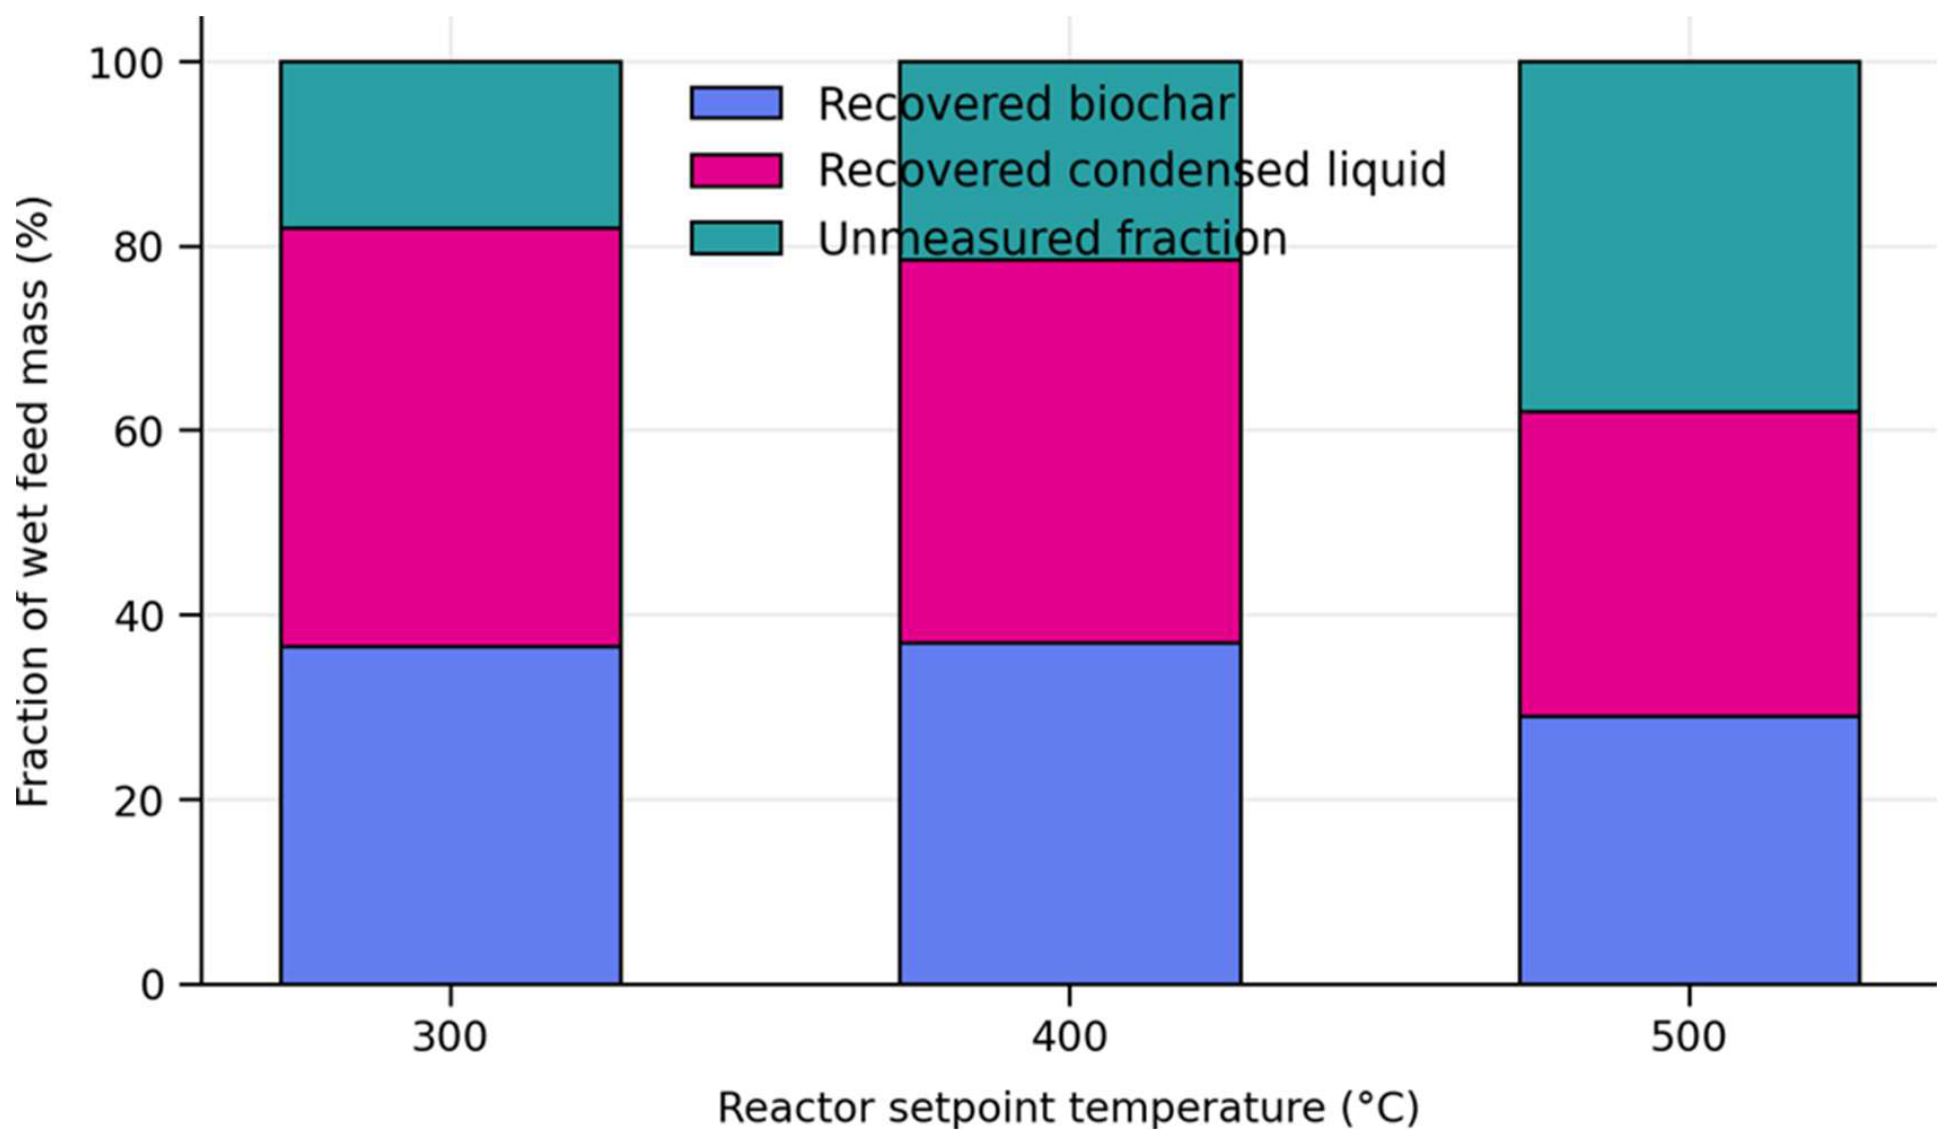
The amounts of biochar and liquid produced during the experiments are given in Table 1. The measured data show that at a depolymerization temperature of 300 °C more biochar and liquid is produced than at a temperature of 500 °C. At a temperature of 300 °C 36% of the input biomass is transformed into biochar, at a temperature of 400 °C 37% of the input biomass is transformed into biochar, at a temperature of 500 °C 29% of the input biomass is transformed into biochar (provide a source if others have the same idea). Figure 7 shows the produced biochar.

Table 1.
Qualitative comparison of major Paulownia valorisation routes and information required for their evaluation.
Table 1.
Qualitative comparison of major Paulownia valorisation routes and information required for their evaluation.
| Route | Principal product(s) | Potential advantage | Evidence required for comparison |
|---|---|---|---|
| Material use | Boards, furniture, construction components | Retention of wood structure and value | Mechanical properties, durability, market and life-cycle data |
| Direct combustion / densification | Heat; pellets or briquettes | Simple energy pathway | Emissions, ash behaviour, net efficiency, logistics |
| Gasification | Fuel gas | High gaseous-product fraction | Gas composition, tar, cold-gas efficiency |
| Pyrolysis | Biochar, condensed liquid, non-condensable gas | Simultaneous recovery of three fractions | Closed mass/energy balance and product characterisation |
| Biochemical conversion | Ethanol, methane, other bioproducts | Integration in a biorefinery | Pretreatment, yields, inhibitors, economics |
Table 2.
Comparison of produced products.
| Parameter | Experiment 1 | Experiment 2 | Experiment 3 |
|---|---|---|---|
| Temperature of pyrolysis [°C] | 300 | 400 | 500 |
| Total volume of biomass, [kg] | 20 | 20 | 20 |
| Production of biochar [kg] | 7,3 | 7,4 | 5,8 |
| Production of liquid [kg] | 9,1 | 8,3 | 6,6 |
3.2. Biochar Composition and Fuel-Related Properties
The wood chip sample shown in the Figure 1 and the biochar samples shown in the Figure 7 were analysed for dry matter and organic dry matter content and ash according to equations 1 and 2. The results are presented in the Table 3. As can be seen from the table, the highest organic dry matter content of VSS TS in biochar is that of biochar processed at 300 °C.
The difference in recovered biochar between 300 and 400 °C was 0.1 kg, equivalent to 0.5 percentage points of wet feed, and cannot be interpreted as a reproducible temperature effect without independent runs. At 500 °C, both biochar and condensed-liquid recovery were lower than at the two lower setpoints. The increasing unmeasured fraction is consistent with increased formation of non-condensable products, but the fraction is not a direct gas-yield measurement.
Figure 1.
Paulownia wood chips used as feedstock. The image documents macroscopic appearance only.
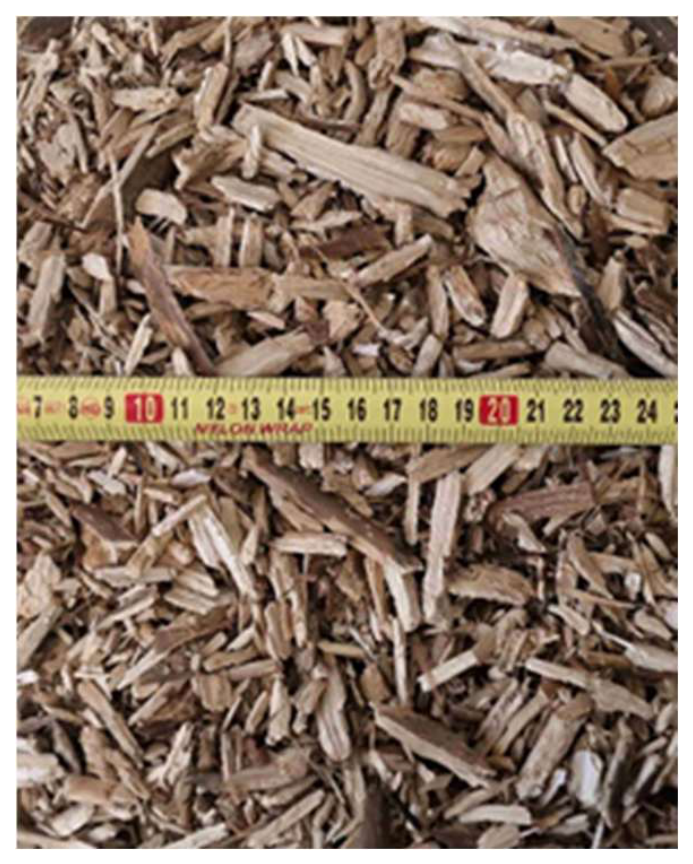
Figure 2.
Macroscopic appearance of recovered biochar: (a) 300 °C, (b) 400 °C, and (c) 500 °C. Images are not microstructural evidence.
Figure 2.
Macroscopic appearance of recovered biochar: (a) 300 °C, (b) 400 °C, and (c) 500 °C. Images are not microstructural evidence.
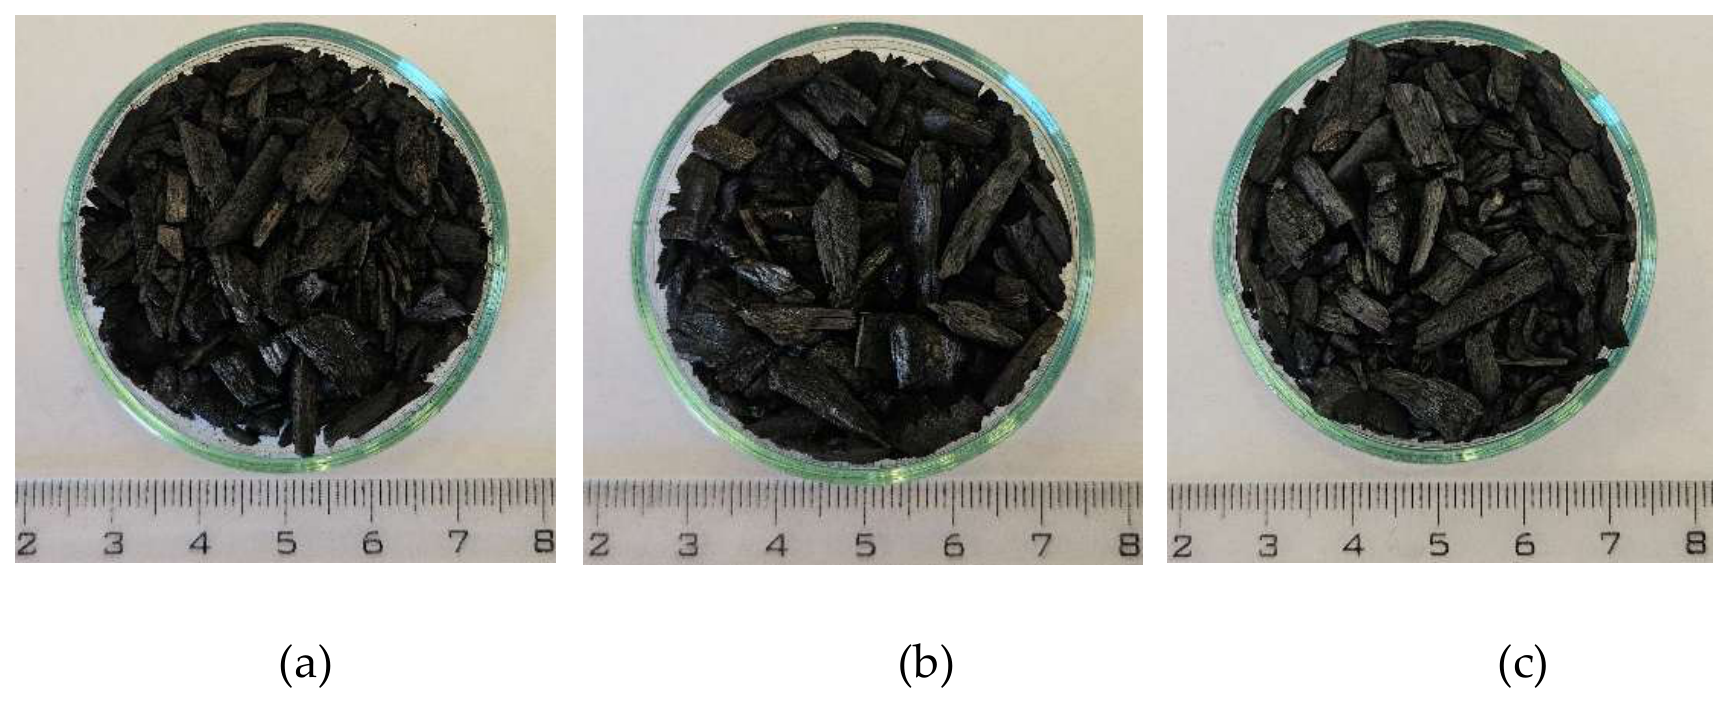
Figure 3.
Recovered products and unmeasured fraction on a wet-feed mass basis. The unmeasured fraction is not equivalent to gas yield.
Figure 3.
Recovered products and unmeasured fraction on a wet-feed mass basis. The unmeasured fraction is not equivalent to gas yield.
Changing the depolymerization temperature not only affects the production of biochar, liquid and gas, but also the carbon content of the biochar. CHNS analysis (Table 4.) showed that the highest carbon content is at a processing temperature of Paulownia 400 °C. The input raw material had a carbon content of 46.2%. Table 4 presented value of combustion heat. Paulownia wood chips has HHV 17,26 MJ.kg-1. After pyrolysis, by 400°C was produced biochar with HHV 30,47 MJ.kg-1, what is increasing about 13,21 MJ.kg-1.
Table 4.
Dry matter and method-specific gravimetric fractions.
| Material | TS (%) | VSS in sample (%) | VSS/TS (%) | Residual ash-related fraction (%) |
|---|---|---|---|---|
| Paulownia feedstock | 93.79 | 93.19 | 97.92 | 6.81 |
| Biochar, 300 °C | 97.55 | 87.69 | 89.96 | 12.31 |
| Biochar, 400 °C | 99.02 | 79.18 | 79.96 | 20.82 |
| Biochar, 500 °C | 96.67 | 80.46 | 83.23 | 19.54 |
Table 5.
CHNS composition, calculated atomic H/C ratio, and higher heating value.
| Material | N (wt.%) | C (wt.%) | H (wt.%) | S (wt.%) | Atomic H/C | HHV (MJ kg⁻¹) |
| Feedstock | 0.54 ± 0.01 | 46.20 ± 0.28 | 6.17 ± 0.05 | 0.05 ± 0.00 | 1.59 | 17.26 |
| Biochar, 300 °C | 0.97 ± 0.00 | 72.15 ± 0.30 | 4.09 ± 0.02 | 0.05 ± 0.00 | 0.68 | 28.08 |
| Biochar, 400 °C | 1.07 ± 0.04 | 76.99 ± 0.83 | 3.11 ± 0.06 | 0.12 ± 0.06 | 0.48 | 30.47 |
| Biochar, 500 °C | 0.89 ± 0.01 | 69.07 ± 0.20 | 2.15 ± 0.03 | 0.05 ± 0.00 | 0.37 | 25.15 |
Pyrolysis increased carbon concentration and HHV relative to the feedstock at all tested temperatures. The highest observed carbon concentration and HHV occurred at 400 °C. Hydrogen concentration and the calculated H/C ratio decreased across the temperature sequence. Carbon concentration, HHV, and the ash-related fraction did not change monotonically between 400 and 500 °C. Because the results represent analytical repeatability within one run-specific sample, the non-monotonic values cannot be assigned to a process mechanism without replicated runs and confirmation of sample representativeness.
3.3. Gas-Flow and Reactor-Temperature Time Series
Table 5.
Descriptive statistics derived from 5 s process records (n = 768 time points per run).
| Setpoint (°C) | Gas flow (m³ h⁻¹) | Reactor temperature (°C) | Electrical power (kW) | Integrated electrical input (kWh) |
|---|---|---|---|---|
| 300 | 1.65 ± 0.51 | 303.1 ± 5.7 | 10.51 ± 2.96 | 11.21 |
| 400 | 3.53 ± 0.93 | 398.5 ± 5.8 | 12.66 ± 2.00 | 13.49 |
| 500 | 8.36 ± 1.46 | 498.0 ± 3.9 | 11.85 ± 1.82 | 12.62 |
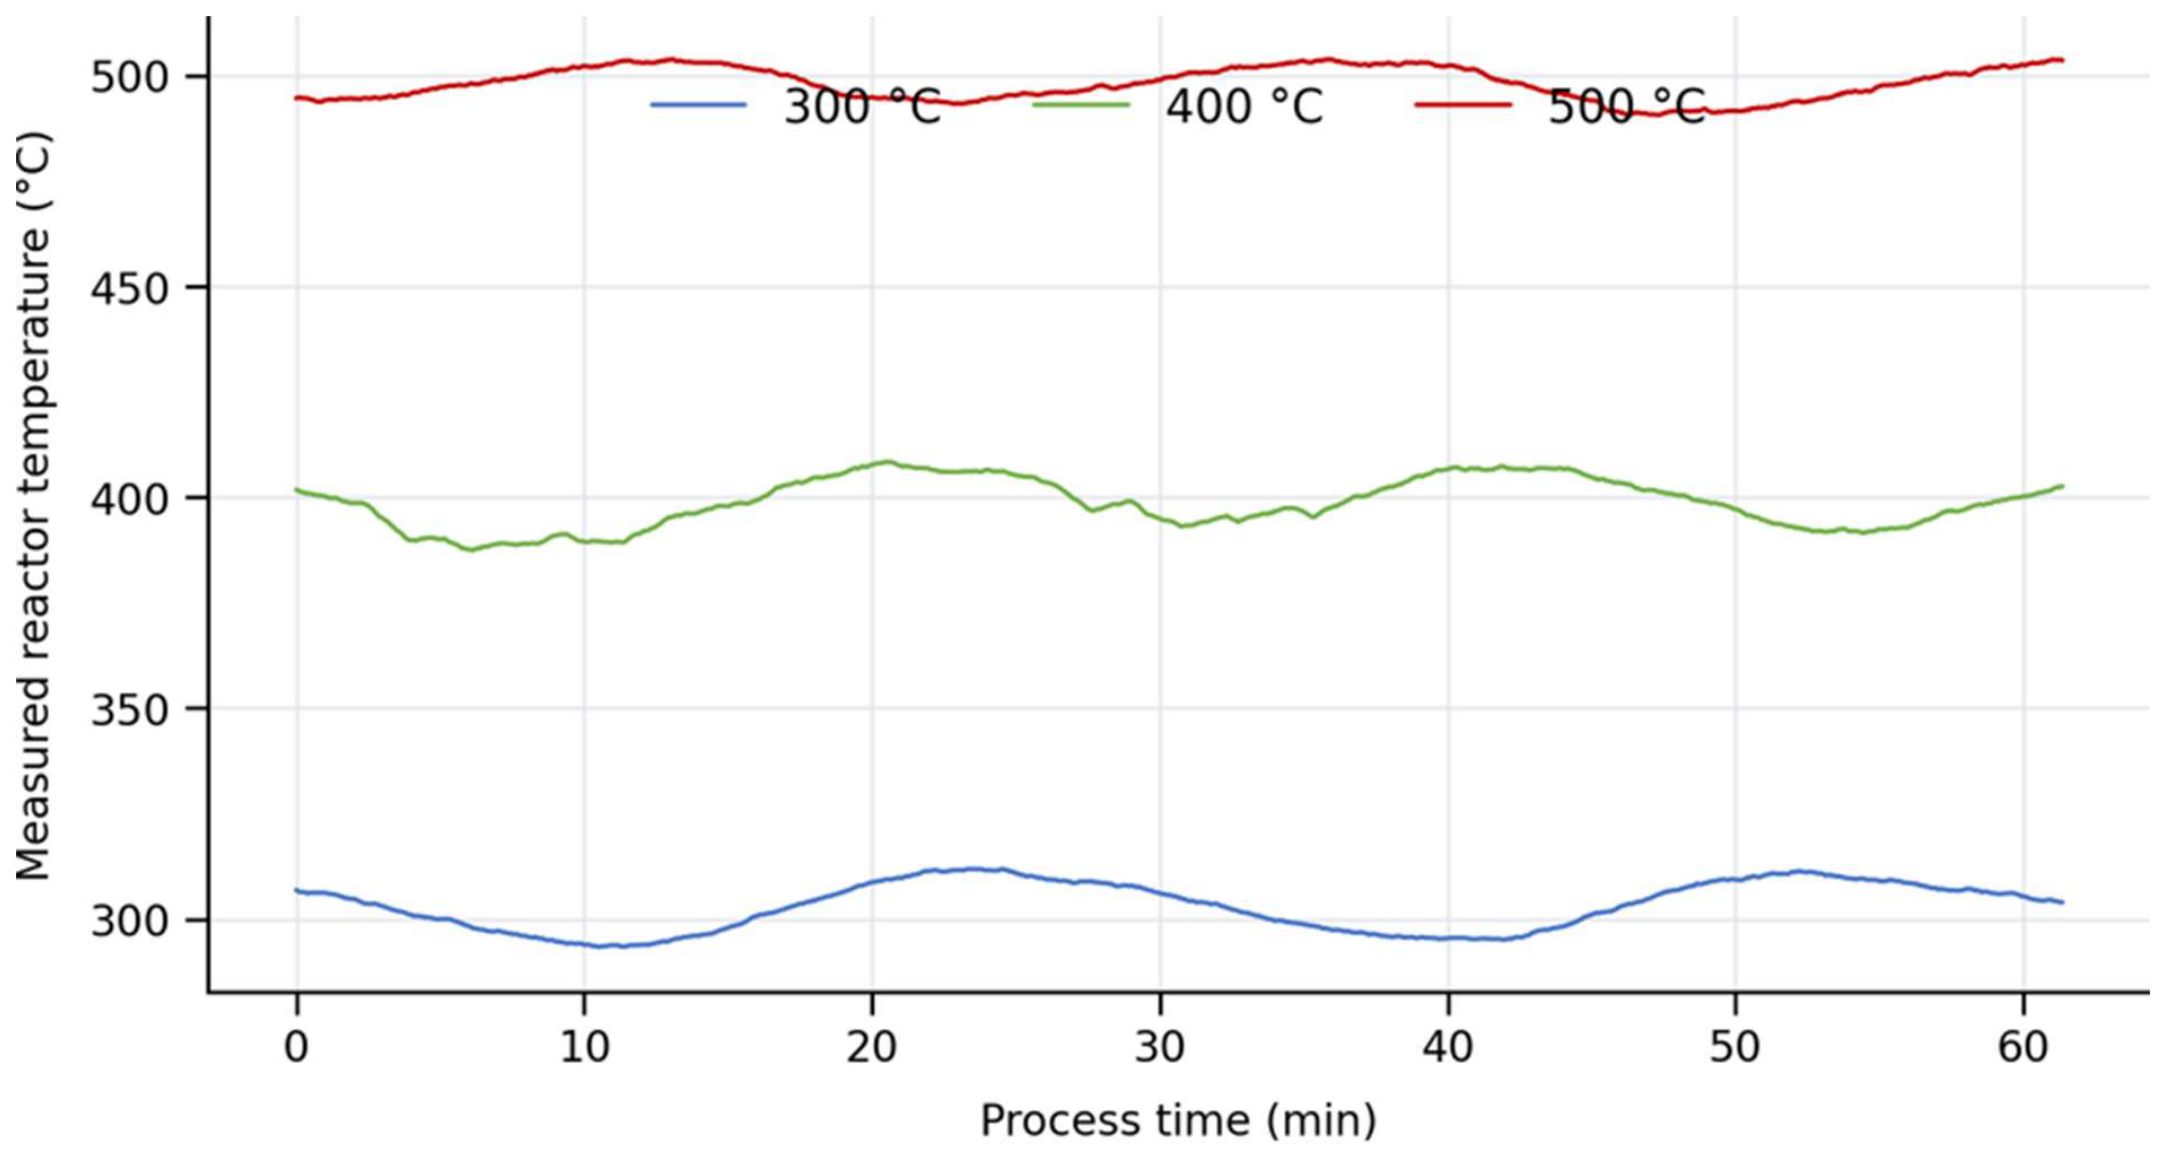
Mean gas flow increased from 1.65 m³ h⁻¹ at 300 °C to 8.36 m³ h⁻¹ at 500 °C. These values differ slightly from rounded values in the original draft because they were recalculated directly from the 768-point harmonised time series. The associated standard deviations describe fluctuations during individual runs. The mean measured temperatures were close to the setpoints, although the 300 °C record showed the largest relative deviation. The time series include start-up and shutdown portions and therefore describe the complete selected record rather than a separately defined steady-state window.
Figure 4.
Non-condensable pyrolysis-gas volumetric flow during complete pilot runs.
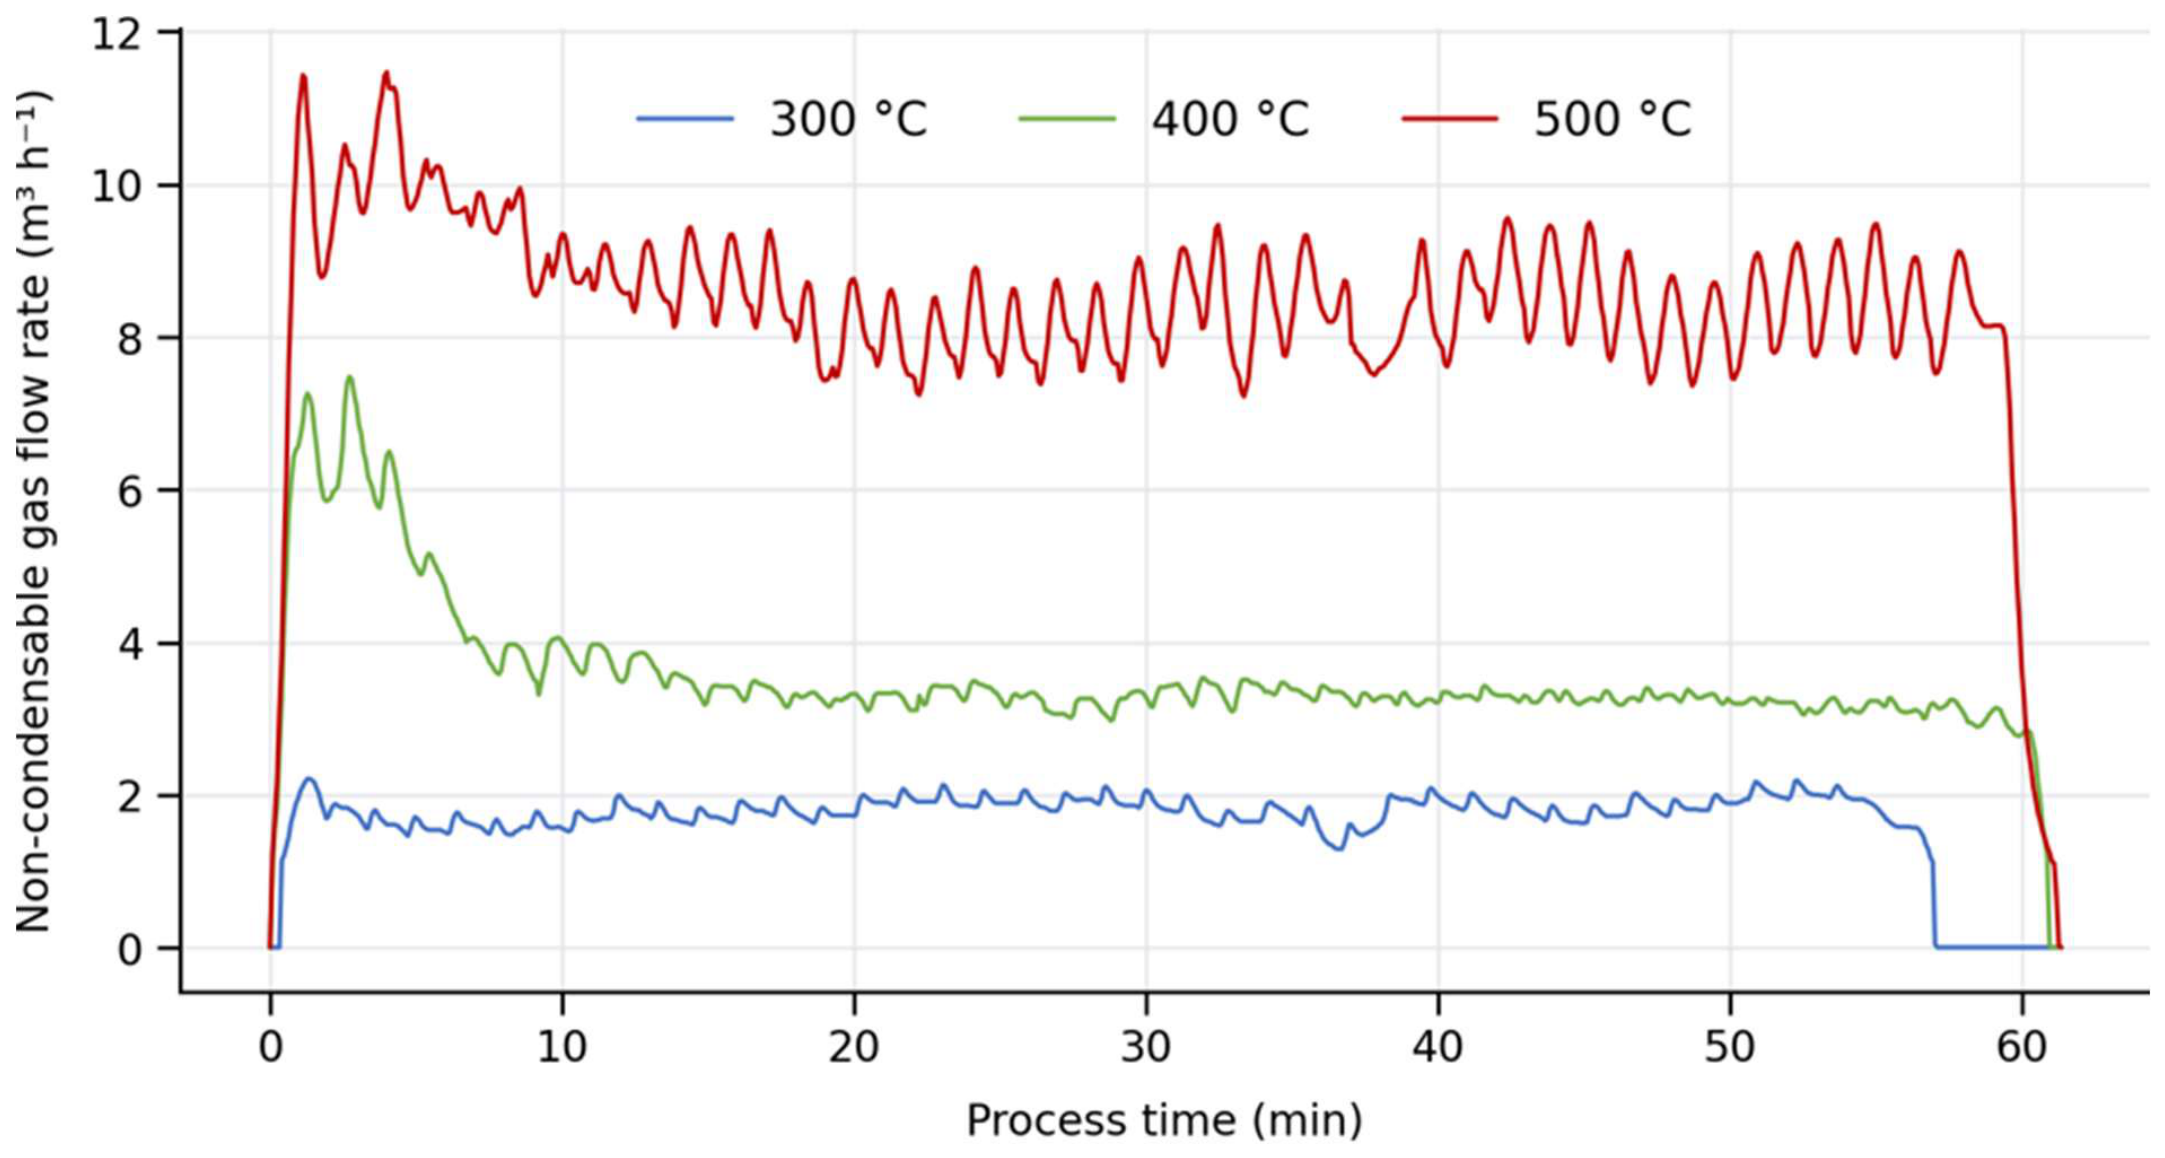
Figure 5.
Measured reactor-temperature channel during complete pilot runs.
3.4. Electrical Input Power
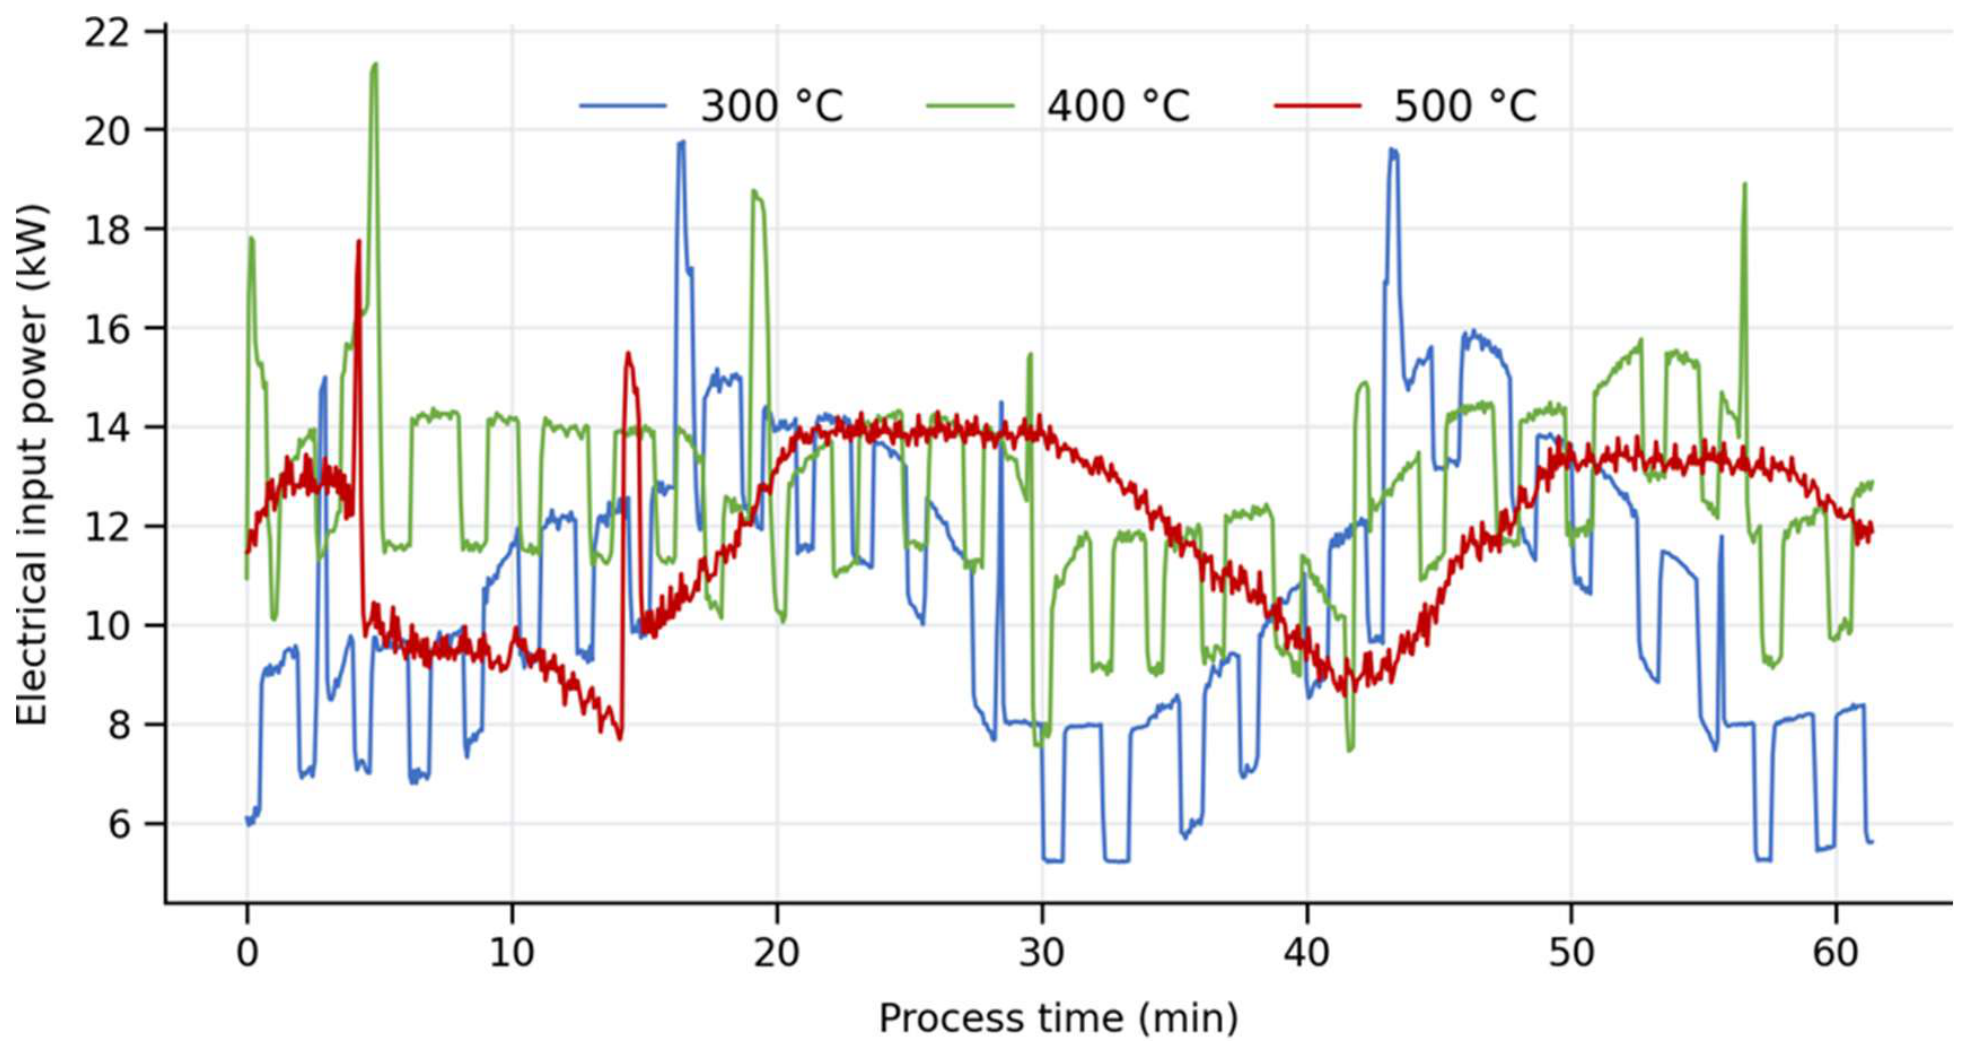
The supplied process files also contained calculated electrical input power. Mean values were 10.51, 12.66, and 11.85 kW for the 300, 400, and 500 °C runs, and trapezoidal integration over the selected records gave 11.21, 13.49, and 12.62 kWh. The 400 °C run had the highest recorded mean electrical input. This non-monotonic behaviour shows that the logged power was affected by run-specific control dynamics and initial thermal conditions, not only by nominal temperature. Because heating-system efficiency, thermal losses, preheating history, and auxiliary loads were not independently measured, these values cannot support a process-efficiency comparison.
Figure 6.
Calculated electrical input power from the supplied process records.
The results clearly indicate that pyrolysis temperature significantly influenced product distribution. At 300 and 400 °C, biochar represented 36 % and 37 % of the input biomass, respectively. At 500 °C, biochar yield decreased to 29 %, while syngas production increased markedly.
Liquid production followed a similar decreasing trend with temperature, confirming enhanced secondary cracking of vapours at higher temperatures. These trends are consistent with typical behaviour observed for lignocellulosic biomasses during pyrolysis.
Pyrolysis substantially increased the carbon content of biochar compared with raw Paulownia biomass. The highest carbon concentration (76.99 wt.%) was observed at 400 °C, suggesting an optimal balance between carbon enrichment and thermal degradation. Biochar produced at 500 °C exhibited lower hydrogen content, indicating increased aromaticity and structural stability.
The reduction in organic dry matter with increasing temperature reflects progressive devolatilization and ash accumulation. These properties are favourable for applications in carbon sequestration and soil amendment.
Syngas flow rates increased rapidly with temperature, reaching an average of 8.4 m³ h⁻¹ at 500 °C. Temperature profiles demonstrated stable reactor operation at all setpoints, with the lowest standard deviation observed at the highest temperature, indicating improved process control.
4. Discussion
4.1. Interpretation of Product Recovery
The lower solid and condensed-liquid recoveries at 500 °C are directionally consistent with intensified devolatilisation and secondary cracking at higher temperature [6,7,8,9,10,11]. However, mechanistic attribution is limited because gas composition, vapour residence time, condensate water content, and deposits were not quantified. The 0.1 kg difference in biochar between 300 and 400 °C is smaller than can be defended as a temperature effect in the absence of independent reactor replication. It should therefore be treated as practically indistinguishable within the available dataset.
The incomplete balance is a central limitation. Only 82.0, 78.5, and 62.0% of wet feed was recovered as weighed solid plus condensed liquid. Assigning the residual directly to gas would overstate the evidence because process hold-up and uncollected condensates were not measured. Future balances should be reported on wet, dry, and dry ash-free bases and should include gas mass determined from calibrated flow, pressure, temperature, water content, and composition.
4.2. Biochar Properties and Limits on Application Claims
The decrease in hydrogen and H/C indicates increasing carbonisation across the tested setpoints. Nevertheless, the available CHNS and HHV data do not directly establish aromatic structure, environmental persistence, adsorption performance, catalytic behaviour, or agronomic suitability. Such claims require complementary measurements such as FTIR or Raman spectroscopy, BET surface area and pore distribution, pH, electrical conductivity, mineral nutrients, potentially toxic elements, PAHs, and application-specific performance tests [14,15,16,17,18].
The lower carbon and HHV observed at 500 °C relative to 400 °C require particular caution. Potential explanations include sample heterogeneity, ash concentration, spatially non-uniform conversion, contamination, or labelling and sampling effects. These are hypotheses rather than demonstrated mechanisms. Replicated runs with homogenised composite sampling and results expressed on dry and dry ash-free bases are required to determine whether the observation is reproducible.
4.3. Gas-Flow Dynamics and Energy Interpretation
The strong increase in volumetric flow with temperature demonstrates increased production or expansion of the non-condensable stream within the recorded operating system. It does not demonstrate increased fuel-gas energy yield. Volumetric flow alone cannot distinguish combustible species such as H₂, CO, CH₄, and light hydrocarbons from CO₂, water vapour, or other components. Consequently, the revised study makes no claim regarding gas calorific value or suitability for combined heat and power generation. Such assessment requires gas chromatography, standardised-volume conversion, and lower-heating-value calculation.
The electrical records add an operational dimension unavailable in the earlier draft. However, integrated electrical input was not monotonic with setpoint temperature. This result reinforces the need to distinguish a single logged run from controlled energy-efficiency testing. A future energy balance should include electrical and auxiliary energy, sensible heat, feedstock HHV, char and liquid HHV, gas composition and LHV, heat recovery, and uncertainty.
4.4. Contribution and Generalisability
The primary contribution is the description of Paulownia wood-chip processing at a 20 kg scale in a continuously fed five-zone prototype, including high-frequency gas-flow, temperature, and electrical-power records. The study does not establish a universal optimum and should not be compared directly with laboratory fixed-bed studies without accounting for differences in chip size, heating rate, reactor geometry, atmosphere, and vapour-residence conditions. The results are best interpreted as pilot-scale observations that motivate a replicated campaign.
4.5. Study Limitations
- one available reactor-scale run per temperature;
- analytical triplicates that do not represent independent process replication;
- absence of gas mass, composition, and heating value;
- absence of chemical characterisation of the condensed-liquid fraction;
- incomplete wet-feed mass balance and no carbon balance;
- limited biochar characterisation;
- uncertain compliance of the 550 °C residue procedure with a named standard;
- lack of a separately defined steady-state analysis window; and
- absence of calibrated uncertainty estimates for process sensors.
5. Conclusions
This exploratory pilot-scale study evaluated Paulownia wood chips at reactor setpoints of 300, 400, and 500 °C under otherwise fixed nominal operating conditions. Recovered char mass was 7.3, 7.4, and 5.8 kg per 20 kg of wet feed, while recovered condensed-liquid mass was 9.1, 8.3, and 6.6 kg, respectively. Combined recovery decreased from 82.0% at 300 °C to 62.0% at 500 °C. Because non-condensable gas mass was not determined, these results do not constitute a closed mass balance.
Mean non-condensable gas flow calculated from the supplied 5 s records increased from 1.65 to 8.36 m³ h⁻¹ across the tested setpoints. Without gas composition and calorific-value data, gas energy yield and CHP suitability cannot be quantified. The highest observed biochar carbon content and HHV occurred at 400 °C, reaching 76.99 wt.% and 30.47 MJ kg⁻¹. The atomic H/C ratio decreased with temperature, whereas carbon, HHV, and the ash-related fraction showed non-monotonic behaviour between 400 and 500 °C. This behaviour requires confirmation by replicated reactor runs and representative composite sampling.
The appended electrical records yielded mean input powers of 10.51–12.66 kW and integrated inputs of 11.21–13.49 kWh for the selected records, but they do not establish conversion efficiency. Future work should prioritise independent reactor replication, a closed mass and carbon balance, gas chromatography, liquid-phase FTIR or GC–MS, and FTIR, BET, pH, conductivity, mineral, contaminant, and stability analyses of the biochar. These additions are required before optimisation or specific energy, agricultural, environmental, or carbon-sequestration applications can be claimed.
Author Contributions
Conceptualization, T.G. and K.K.; methodology, T.G.; software, T.G.; validation, T.G., K.K. and M.A.; formal analysis, J.G.; investigation, T.G.; resources, J.G.; data curation, T.G.; writing—original draft preparation, T.G.; writing—review and editing, K.K.; visualization, K.K.; supervision, J.J.; project administration, J.G.; funding acquisition, J.G. All authors have read and agreed to the published version of the manuscript.
Data Availability Statement
The time-series data supporting the process analysis are contained in the accompanying Excel workbooks. Raw sensor-channel definitions, calibration records, and additional metadata should be archived with the revised submission where available.
Acknowledgments
The paper was created as part of the preparation and solution of the VEGA project no. 1/0344/24 “Rational Land Management with Positive Effect on Reducing the Carbon Footprint „solved at the Institute of Economics and Management.
Conflicts of Interest
The authors declare no conflicts of interest.
References
- Jakubowski, M. Cultivation Potential and Uses of Paulownia Wood. Forests 2022, 13, 668. [Google Scholar] [CrossRef]
- Nelis, P.A.; Michaelis, F.; Krause, K.C.; Mai, C. KIRI Wood (Paulownia tomentosa): Can It Improve the Performance of Particleboards? Eur. J. Wood Wood Prod. 2018, 76, 445–453. [Google Scholar] [CrossRef]
- Domínguez, E.; Romaní, A.; Domingues, L.; Garrote, G. Evaluation of strategies for second generation bioethanol production from fast growing biomass Paulownia within a biorefinery scheme. Appl. Energy 2017, 187, 777–789. [Google Scholar] [CrossRef]
- Rodriguez-Seoane, P.; Diaz-Reinoso, B.; Moure, A.; Dominguez, H. Potential of Paulownia sp. for biorefinery. Ind. Crops Prod. 2020, 155, 112739. [Google Scholar] [CrossRef]
- Fos, M.; Oliver-Villanueva, J.V.; Vazquez, M. Radial variation in anatomical wood characteristics and physical properties of a Paulownia hybrid. Eur. J. Wood Wood Prod. 2023, 81, 819–831. [Google Scholar] [CrossRef]
- Antal, M.J.; Grønli, M. The Art, Science, and Technology of Charcoal Production. Ind. Eng. Chem. Res. 2003, 42, 1619–1640. [Google Scholar] [CrossRef]
- Bridgwater, A.V. Review of fast pyrolysis of biomass and product upgrading. Biomass Bioenergy 2012, 38, 68–94. [Google Scholar] [CrossRef]
- Mohan, D.; Pittman, C.U.; Steele, P.H. Pyrolysis of Wood/Biomass for Bio-oil: A Critical Review. Energy Fuels 2006, 20, 848–889. [Google Scholar] [CrossRef]
- Yang, H.; Yan, R.; Chen, H.; Lee, D.H.; Zheng, C. Characteristics of hemicellulose, cellulose and lignin pyrolysis. Fuel 2007, 86, 1781–1788. [Google Scholar] [CrossRef]
- Anca-Couce, A. Reaction mechanisms and multi-scale modelling of lignocellulosic biomass pyrolysis. Prog. Energy Combust. Sci. 2016, 53, 41–79. [Google Scholar] [CrossRef]
- Tripathi, M.; Sahu, J.N.; Ganesan, P. Effect of process parameters on production of biochar from biomass waste through pyrolysis. Renew. Sustain. Energy Rev. 2016, 55, 467–481. [Google Scholar] [CrossRef]
- Yorgun, S.; Yıldız, D. Slow pyrolysis of paulownia wood: Effects of pyrolysis parameters on product yields and bio-oil characterization. J. Anal. Appl. Pyrolysis 2015, 114, 68–78. [Google Scholar] [CrossRef]
- Zhang, X.; Tan, H.; Kan, T.; Wang, S.; Xu, L. Pyrolysis behavior and kinetic study of Paulownia wood and its main components. J. Therm. Anal. Calorim. 2015, 119, 1301–1309. [Google Scholar]
- Lehmann, J.; Joseph, S. Biochar for Environmental Management: Science, Technology and Implementation; Routledge: London, UK, 2015. [Google Scholar]
- Qambrani, N.A.; Rahman, M.M.; Won, S.; Shim, S.; Ra, C. Biochar properties and eco-friendly applications for purification of environmental pollutants: A review. Renew. Sustain. Energy Rev. 2017, 77, 713–730. [Google Scholar]
- Amalina, F.; Razak, A.S.A.; Krishnan, S.; Sulaiman, H.; Zularisam, A.W.; Nasrullah, M. Biochar production techniques utilizing biomass waste-derived materials and environmental applications: A review. J. Hazard. Mater. Adv. 2022, 7, 100134. [Google Scholar] [CrossRef]
- Rangabhashiyam, S.; Balasubramanian, P. The potential of lignocellulosic biomass precursors for biochar production: performance, mechanism and wastewater application. Ind. Crops Prod. 2019, 128, 405–423. [Google Scholar] [CrossRef]
- Lehmann, J.; Cowie, A.; Masiello, C.A.; et al. Biochar in climate change mitigation. Nat. Geosci. 2021, 14, 883–892. [Google Scholar] [CrossRef]
Table 3.
Wet-feed-based recovery of measured product fractions.
| Setpoint (°C) | Feed (kg) | Biochar (kg; %) | Condensed liquid (kg; %) | Measured recovery (%) | Unmeasured fraction (kg; %) |
|---|---|---|---|---|---|
| 300 | 20.0 | 7.3; 36.5 | 9.1; 45.5 | 82.0 | 3.6; 18.0 |
| 400 | 20.0 | 7.4; 37.0 | 8.3; 41.5 | 78.5 | 4.3; 21.5 |
| 500 | 20.0 | 5.8; 29.0 | 6.6; 33.0 | 62.0 | 7.6; 38.0 |
Disclaimer/Publisher’s Note: The statements, opinions and data contained in all publications are solely those of the individual author(s) and contributor(s) and not of MDPI and/or the editor(s). MDPI and/or the editor(s) disclaim responsibility for any injury to people or property resulting from any ideas, methods, instructions or products referred to in the content. |
© 2026 by the authors. Licensee MDPI, Basel, Switzerland. This article is an open access article distributed under the terms and conditions of the Creative Commons Attribution (CC BY) license (http://creativecommons.org/licenses/by/4.0/).
Copyright: This open access article is published under a Creative Commons CC BY 4.0 license, which permit the free download, distribution, and reuse, provided that the author and preprint are cited in any reuse.