

Submitted:
30 September 2026
Posted:
01 October 2026
You are already at the latest version
Abstract
The crested francolin complex comprises geographically variable populations assigned to three African species, Ortygornis grantii, O. rovuma and O. sephaena. We examined phenotypic differentiation across Africa using 272 photographic records, museum specimens and mitochondrial data. Seven plumage characters were scored, with repeatability assessed by blind intra-observer rescoring of 61 stratified records. Breast markings, gorget-line position, abdominal feather structure and abdominal colour were retained for formal statistical inference. Gower ordination showed geographic structuring among eight historical forms, and PERMANOVA confirmed this pattern (R² = 0.717), although morphospace overlap persisted. Northeastern/eastern populations were predominantly high-gorget, whereas southern populations were mainly low-gorget, with intermediate combinations in eastern contact areas. Ugandan ochrogaster were high-gorget with a predominantly weak or fine abdominal vermiculation, differing strongly from neighbouring grantii. The form spilogaster showed weaker centroid separation from grantii than from rovuma, although mean Gower dissimilarities were similar. Mitochondrial divergence was lower between spilogaster and grantii (1.4%) than between spilogaster and rovuma (3.8%), supporting qualified placement with O. grantii. Southern O. sephaena forms also showed phenotypic structure despite shallow mitochondrial divergence. Overall, the results support geographically structured phenotypes and selected subspecific units within the established three-species framework. Several transitions remained clinal or overlapping rather than sharply bounded.
Keywords:
African biogeography
; ecological gradients
; geographic subspecies
; gorget morphology
; mitochondrial DNA
; phenotypic intergradation
; plumage variation
; taxonomic history
; integrative taxonomy
1. Introduction
Galliforms are highly valued, primarily as subsistence food sources but also for hunting, aesthetic, cultural and recreational purposes (Fuller; Garson 2000; Geldenhuys et al. 2013; Tian et al. 2018; Wang et al. 2020), and are considered one of the most important avian groups for human societies worldwide (del Hoyo et al. 1994). Moreover, galliforms play key roles in several terrestrial ecosystems as primary consumers in the local food webs and seed dispersers (Crespo et al. 2018; Anderson; Holmes 2022). For these and other reasons, a substantial body of research has been produced on this avian group over the last few decades, with taxonomic and phylogenetic studies based on molecular evidence burgeoning during this period (Tian et al. 2018).
Nevertheless, when examining the spatial breadth of this research, it is heavily skewed towards North America and Europe, with only a small proportion being conducted in Africa (2.1%; Tian et al. 2018). This is quite surprising given that the varied topography of this continent, characterised by numerous natural barriers such as deserts and mountain ranges, is generally considered to have played a significant role in shaping avian speciation and biogeographic patterns by promoting isolation and divergence over time (Moreau 1966). Furthermore, Africa’s dramatic climatic fluctuations—such as those responsible for the desertification of the Sahara and the recurrent shifts in the extent of tropical rainforests—have contributed to the adaptation of galliforms to a range of ecological conditions across different habitats in response to diverse selective pressures (Crowe 1978), making it an ideal region for studying speciation processes and ecological adaptations (Jønsson; Fjeldså 2014). Moreover, Africa’s geological history―including periods of isolation and connection with Eurasia―has generated unique evolutionary pressures in the context of global galliform evolution (Holt et al. 2013). The evolutionary history of this order in Africa therefore provides valuable insights into how birds evolve and adapt to diverse environments, enhancing our understanding of avian biology in one of the most ecologically diverse continents on Earth (Crowe; Crowe 1982). Moreover, clarifying the phylogenetic relationships and taxonomy of African galliforms has also important conservation implications, given pressing threats such as habitat fragmentation, overhunting, and climate change, which calls for the need to establish conservation priorities, especially by identifying populations that are genetically distinct or particularly vulnerable (Collar; Stuart 1985).
Crucially, despite the above considerations, some African galliforms remain poorly studied or have contentious taxonomy. An exemplary case is the 36 species of francolins formerly assigned to the genus Francolinus (Hall 1963), which, at 41 species―36 African and 5 Asian―was the most speciose genus of the order Galliformes. These species were later divided among the genera Afrocolinus, Dendroperdix, Francolinus, Peliperdix, Pternistis (spurfowl) and Scleroptila (Little 2016), illustrating the substantial taxonomic revision that has occurred within the group.
In particular, the taxonomy of the crested francolin (D. sephaena, formerly F. sephaena), the sole species previously included in the monotypic genus Dendroperdix, has been widely debated over the last century (Appendix I; see from Madge; McGowan 2002 to Little 2016). Traditionally, five morphological subspecies have been recognised for this galliform, which occurs across most of eastern (including the Zanzibar and Lamu islands) and southern Africa (Moreau; Pakenham 1941, Hall 1963, Little 2011): D. s. sephaena, D. s. zambesiae, D. s. rovuma, D. s. grantii and D. s. spilogaster (Figure 1; Hall 1963, Clancey 1967a,b,c, Madge; McGowan 2002, Little; Crowe 2011, Gill et al. 2020). However, this relatively simple arrangement conceals a considerably more complicated nomenclatural history. Earlier authors recognised various combinations of grantii, jubaensis, ochrogaster, rovuma, sephaena, spilogaster, thompsonii, zambesiae, and zuluensis as both specific and subspecific epithets or synonyms within genera Francolinus, Dendroperdix and Ortygornis, and several names were subsequently reassigned, synonymised or abandoned (Appendix I). This instability reflects persistent disagreement over whether geographically distinctive plumage forms represent discrete taxa, regional phenotypes or populations connected through intergradation (Hall 1963). The historical treatments are important because many of these names originated from repeated observations of geographically structured morphology rather than from arbitrary subdivision. For example, ochrogaster was historically recognised from the Uganda region, thompsonii from Namibia and adjacent southwestern areas, and zuluensis from southeastern southern Africa, while spilogaster and jubaensis were associated with eastern African populations, respectively (Appendix I). The changing taxonomic status of these forms therefore provides a series of explicit geographic hypotheses that can be reconsidered using broader phenotypic and genetic evidence. Following this rationale, the crested francolin complex was subsequently revised, with D. s. grantii, D. s. rovuma and D. s. sephaena being elevated to species rank within the genus Ortygornis (Mandiwana-Neudani et al. 2019). Nevertheless, several unresolved questions remain.
In northeastern and eastern Africa, the taxonomic placement of spilogaster has been interpreted differently by successive authors. Hall (1963) associated its occurrence with intergradation involving grantii and rovuma, whereas later taxonomic treatments have placed it differently relative to these neighbouring forms. Under the Mandiwana-Neudani et al. (2019) framework, spilogaster was associated with O. rovuma, while earlier treatments had also linked it closely with grantii. Determining whether spilogaster is phenotypically and genetically more closely related to grantii or rovuma therefore represents an explicit test rather than a predetermined taxonomic conclusion.
The Ugandan form ochrogaster provides a second important test. Described by Hartlaub (1882), it was recognised in early treatments but subsequently synonymised with grantii or omitted from later revisions (Appendix I). If ochrogaster represents a coherent geographic phenotype rather than local individual variation, multiple independently scored characters should occur together repeatedly within its principal range and distinguish it from neighbouring populations of O. grantii. Conversely, if the historical name merely represents part of continuous variation within O. grantii, the putatively diagnostic character combination should occur broadly and inconsistently throughout the range of this species.
Southern Africa presents a related but distinct problem. Historically named forms including sephaena, zambesiae, thompsonii and zuluensis (Appendix I) occupy different geographic sectors of the southern distribution, but their taxonomic treatment has varied considerably through time—zuluensis and thompsonii, for instance, are now generally synonymised with sephaena and zambesiae respectively. Their evaluation is particularly informative because geographically structured phenotypes need not necessarily be accompanied by deep mitochondrial divergence, particularly where divergence is recent or gene flow has been ongoing. If these forms represent meaningful subspecific differentiation, they should display repeatable combinations of plumage characters within their principal geographic ranges even where mitochondrial differentiation is shallow. This provides an opportunity to examine whether phenotypic and mitochondrial DNA structure are fully concordant or instead reflect different levels of geographic differentiation.
A broader geographic question concerns the organisation of plumage variation across the crested francolin complex. Several historically important characters—particularly the gorget line separating the throat from the breast, and the structure and distribution of breast and abdominal markings—can be scored as discrete pattern states rather than solely as subtle colour differences. Existing taxonomic accounts describe a notable contrast: the rovuma group (east Kenya to northern Mozambique) has underparts with fine, sparse spotting, whereas the sephaena group (southern Africa) shows fine but indistinct vermiculation and in grantii the underparts are scaled (Mackworth-Praed; Grant 1936, 1952, 1962). This raises the possibility that these traits exhibit a broad geographic organisation, with northeastern/eastern populations (grantii, rovuma and spilogaster) differing consistently from southern populations (sephaena and zambesiae).
The boundaries between neighbouring forms may likewise be complex. Earlier taxonomic treatments repeatedly invoked hybridisation or intergradation, particularly in eastern Africa, to explain birds with intermediate combinations of plumage characters (Hall 1963; Mandiwana-Neudani et al. 2019). However, since morphology alone cannot demonstrate genetic hybridisation, it is necessary to distinguish between a phenotypic intergradation zone, which can be identified from changing combinations of character states, and a genetically demonstrated hybrid zone. Under an intergradation hypothesis, populations within core geographic areas should show relatively consistent character combinations, whereas populations approaching neighbouring forms should increasingly display mixtures or intermediate expressions of those characters. Demonstration of a hybrid zone, however, requires independent genetic evidence of admixture or introgression, typically expressed as geographic or genomic transitions in ancestry or allele frequencies across the contact zone (Barton; Hewitt 1985; Harrison; Larson 2014).
By combining phenotypic evidence obtained from geographically extensive photographic material and museum specimens, environmental (climatic) information, and mitochondrial DNA data, we address three related but distinct questions: (I) the existence of geographic phenotypic structure within the crested francolin species complex; (II) the correspondence of historically named forms with any such structure; and (III) the evolutionary interpretation of those patterns.
2. Materials and Methods
2.1. Study Framework and Geographic Forms
We examined geographic phenotypic differentiation in the crested francolin complex based on the three-species framework (O. grantii, O. rovuma and O. sephaena) of the most recent pertinent taxonomic reappraisal (Mandiwana-Neudani et al. 2019). The historically recognised forms grantii, ochrogaster, spilogaster, rovuma, sephaena, zambesiae, zuluensis and thompsonii were treated initially as geographic units for comparative analysis rather than assumed a priori to represent valid subspecies. Their nomenclatural histories and previous geographic treatments were reconstructed from the taxonomic literature summarised in Appendix I. The taxon jubaensis was retained in the historical review because of its importance in earlier interpretations of eastern African populations but was not included as a separate unit in the quantitative photographic analyses because pertinent material was insufficient; biological sampling was similarly constrained. Historical ranges, museum specimen localities and georeferenced photographic records provided the geographic framework for comparison. Geographic units were therefore defined from previous taxonomic and distributional data. In areas where historical ranges overlap or where taxonomic placement has been contentious, records were additionally examined for evidence of phenotypic transition without assuming genetic admixture.
2.2. Photographic Material and Image Eligibility
An initial pool of 450 crested francolin photographs was compiled from the Macaulay Library (Cornell Laboratory of Ornithology). Photographs were screened before morphological scoring and retained only when the anatomical regions required for assessment were sufficiently visible and image quality permitted confident assignment of the predefined character states. This procedure yielded a final dataset of 272 scored records distributed among the eight geographic forms included in the quantitative morphological analyses (Appendices II–IX).
Camera orientation was used solely as an image-eligibility criterion, not for selecting plumage phenotypes. Photographs in which the required breast, abdominal, gorget, crest or dorsal regions were obscured, strongly foreshortened or otherwise impossible to assess confidently were excluded before scoring. No image was excluded on the grounds that the bird’s phenotype did not match expectations from its locality or historical taxonomic assignment.
The scored characters included both pattern-based and colour-based plumage features. Gorget-line position, breast-marking configuration and abdominal feather structure were primarily based primarily on the placement or structural arrangement of markings, whereas crest, scapular and abdominal colour depended more strongly on apparent hue. Colour characters were therefore classified only into broad predefined states, because illumination, exposure, camera processing and viewing conditions may influence apparent colour. Lower-eye markings were retained as a descriptive character only, as they were not assumed a priori to be equally reproducible under all photographic conditions. Photographs in which lighting or image quality prevented confident assignment of any required character were excluded during the initial screening process. A blind repeatability assessment was used to determine which of the seven scored characters were sufficiently reproducible for formal statistical inference (see below).
2.3. Plumage Character Scoring
Seven plumage characters were scored using predefined categorical states: (1) crest colour, greyish or brownish; (2) scapular colour, chestnut brown, rich chestnut brown or pale chestnut brown; (3) breast markings, prominent or sparsely distributed; (4) gorget-line position, high or low; (5) abdominal feather structure, distinctly vermiculated, scaled or snowflake-shaped, plain with fine markings, guttate from the gorget line to the belly, guttate from the gorget line to the vent, or weakly or finely vermiculated on an otherwise relatively uniform abdominal ground; (6) abdominal colour, creamy, brown wash or reddish ochre; and (7) lower-eye markings, solid or speckled/diluted. Complete scoring definitions and record-level data are provided in Appendices II–IX. Numerical codes assigned to character states were used solely as identifiers for data handling. They were not interpreted as continuous measurements and did not imply equal numerical distances among character states.
For each geographic form, the frequency of each character state was calculated as the proportion of scored records exhibiting that state. A separate binary variable, “drop below gorget”, recorded whether breast or abdominal markings extended below the expected gorget boundary. This character was used as an indicator of geographic instability or transition in the gorget–breast pattern and was interpreted as evidence of phenotypic intergradation rather than as evidence of genetic hybridisation. Typical examples of variation in gorget position and ventral plumage pattern are shown in Figure 2.
All seven characters were retained in the record-level appendices as descriptive plumage observations. However, following blind intra-observer rescoring, breast markings, gorget-line position, abdominal feather structure and abdominal colour were retained for formal statistical inference. Crest colour, scapular colour and lower-eye markings showed lower repeatability and were therefore excluded from the formal multivariate and character-level inferential analyses.
All statistical analyses of plumage and environmental data were conducted in R. The principal functions and packages used were stats for contingency-table tests, Fisher’s exact tests, multiple-testing correction, and environmental principal component analysis; DescTools for Cramér’s V; irr and irrCAC for scoring-repeatability statistics; boot for bootstrap confidence intervals; cluster for Gower dissimilarities; ape for principal coordinates analysis; and vegan for PERMANOVA and multivariate-dispersion analyses. Statistical significance was assessed at α = 0.05. Where families of related tests were conducted, p-values were adjusted using the Benjamini–Hochberg false discovery rate procedure implemented with stats::p.adjust(method = “BH”).
2.4. Blind Assessment of Scoring Repeatability
The repeatability of photographic scoring was assessed using blind intra-observer validation. A geographically stratified subset of 61 unique Macaulay photographs was selected from the scored material and distributed among the eight geographic forms as follows: grantii (n = 13), ochrogaster (n = 9), spilogaster (n = 4), rovuma (n = 4), sephaena (n = 9), zambesiae (n = 8), zuluensis (n = 10) and thompsonii (n = 4) (Appendices II to IX). Each photograph was assigned an anonymous identification code. Approximately six months after the original scoring exercise, the original observer rescored all 61 photographs without access to locality, historical taxonomic assignment or original scores. Only the photograph, anonymous identifier and predefined scoring criteria were available during reassessment. Repeatability was evaluated independently for each of the seven plumage characters.
Observed percentage agreement was calculated as the proportion of photographs assigned the same character state in the original scoring and blind rescore. Chance-corrected agreement was quantified using unweighted Cohen’s κ calculated with irr::kappa2(). Unweighted κ was used because the character-state codes represented nominal rather than ordered quantitative categories. Since Cohen’s κ may be affected by strongly unequal prevalence of character states, Gwet’s AC1 was additionally calculated using the irrCAC package. Ninety-five per cent confidence intervals for agreement statistics were obtained by non-parametric bootstrap resampling of photographs with 10,000 replicates using the boot package. Repeatability was evaluated across the pooled validation sample rather than separately within geographic forms because the purpose was to assess reproducibility of the scoring criteria themselves.
2.5. Museum Specimens
Photographic assessment was cross-checked against examination of 46 study skins from 18 ornithological collections worldwide (Table S1). Museum material was particularly important for populations of uncertain geographic affinity or taxonomic status, and for comparisons involving grantii, jubaensis, rovuma and spilogaster; jubaensis was included here despite its exclusion from the quantitative photographic analyses, because preserved material was available even though photographs were not. Specimens from type localities and other historically important sites provided a physical reference against which photographically scored plumage states could be compared.
Museum specimens were not used independently to redefine geographic units from morphology alone. Rather, they provided comparative evidence to assess whether character combinations evident in photographic records were also represented in preserved specimens from the relevant geographic regions.
2.6. Geographic Assessment of Phenotypic Intergradation
A separate targeted assessment examined the transition in breast and abdominal markings among eastern African populations historically interpreted as involving grantii, spilogaster and rovuma. A broader pool of 904 Macaulay photographs was screened specifically for visibility of the breast-to-abdominal transition. Forty-nine photographs showing irregular breast and abdominal markings with sufficient clarity were retained for detailed examination and compared with 13 relevant museum skins selected from the 46 specimens described above (Appendix X; Table S1). This targeted material was analysed separately and was not added to the 272-record dataset used to calculate the principal character-state frequencies.
Breast markings on the upper breast and around the gorget were examined in relation to their progressive modification into elongate or guttate markings farther down the breast and abdomen. Ortygornis rovuma was used as a morphological reference for the strongly developed guttate condition because this form exhibits regularly spaced large guttate markings along the ventral body surface. Individuals showing mixtures or transitional expressions of these character states were treated as examples of phenotypic intergradation. Geographic concentrations of intermediate phenotypes were therefore interpreted as candidate contact or intergradation zones requiring independent genetic confirmation. The separate 49-photograph and 13-skin examination of breast-to-abdominal transitions was descriptive and geographic in scope and was not used to infer individual ancestry statistically (Appendix X). Instead, it was used to describe the distribution and direction of intermediate pattern states and to identify geographic regions in which neighbouring phenotypes intergrade.
The geographic distribution of the binary “drop below gorget” character was summarised as frequencies and percentages among geographic forms. Heterogeneity among forms was tested using a Monte Carlo chi-square test implemented with stats::chisq.test(simulate.p.value = TRUE, B = 9999), and the magnitude of association was quantified using Cramér’s V with DescTools::CramerV(). The separate 49-photograph and 13-skin examination of breast-to-abdominal transitions was descriptive and geographic in scope and was not used to infer individual ancestry statistically (Appendix X). Instead, it was used to describe the distribution and direction of intermediate pattern states and to identify geographic regions in which neighbouring phenotypes intergrade.
2.7. Character-Level Statistical Analyses
We evaluated geographic differentiation in the four plumage characters retained for formal inference using contingency-table analyses. Several characters had sparse cells or strongly unequal state frequencies, so statistical significance was estimated using Monte Carlo chi-square tests implemented with stats::chisq.test(simulate.p.value = TRUE, B = 9999). The strength of association between geographic form and each plumage character was quantified using Cramér’s V calculated with DescTools::CramerV(). The same procedure was applied independently to the four southern geographic forms: sephaena, zambesiae, zuluensis and thompsonii.
The geographic distribution of the binary “drop below gorget” character was summarised as frequencies and percentages among geographic forms. Heterogeneity among forms was tested using a Monte Carlo chi-square test implemented with stats::chisq.test(simulate.p.value = TRUE, B = 9999), and the magnitude of association was quantified using Cramér’s V with DescTools::CramerV().
2.8. Northern/Eastern Versus Southern Gorget Hypothesis
The broad geographic differentiation in gorget-line position constituted an explicit a priori hypothesis. Records were assigned to northeastern/eastern or southern geographic assemblages according to their geographic distributions and historical assignments rather than their observed gorget state. Frequencies of high- and low-gorget phenotypes were compared between the two assemblages using Fisher’s exact test implemented with stats::fisher.test(). The magnitude of the association was expressed as an odds ratio with a 95% confidence interval.
2.9. Multivariate Phenotypic Differentiation
Pairwise phenotypic dissimilarities among scored records were calculated using the Gower coefficient with cluster::daisy(metric = “gower”) (Gower 1971). The four plumage characters retained following blind repeatability assessment—breast markings, gorget-line position, abdominal feather structure and abdominal colour—were specified as categorical factors. The resulting Gower distance matrix was subjected to principal coordinates analysis (PCoA) using the ape package (Paradis; Schliep 2019). The first two principal-coordinate axes were used to visualise multivariate phenotypic relationships among individual records and historically defined geographic forms, with the percentage represented by each axis calculated relative to the sum of positive eigenvalues.
Overall multivariate differentiation among geographic forms was tested using permutational multivariate analysis of variance (PERMANOVA) implemented with vegan::adonis2() (McArdle; Anderson 2001), with geographic form as the sole explanatory factor and the Gower dissimilarity matrix as the response, using 9999 permutations. Homogeneity of multivariate dispersion was tested independently on the same Gower distance matrix using vegan::betadisper(), with significance assessed by vegan::permutest() using 9999 permutations. PERMANOVA results were interpreted together with the corresponding dispersion tests.
Planned pairwise PERMANOVAs were conducted for spilogaster–grantii, spilogaster–rovuma, ochrogaster–grantii, and all six pairwise comparisons among sephaena, zambesiae, zuluensis and thompsonii. For each comparison, the relevant records were subsetted and analysed using vegan::adonis2() with 9999 permutations. The nine pairwise PERMANOVA p-values were adjusted using the Benjamini–Hochberg false discovery rate procedure. Corresponding pairwise tests of multivariate dispersion were conducted using vegan::betadisper() and vegan::permutest(), and the nine resulting dispersion p-values were adjusted independently using the same Benjamini–Hochberg procedure (Table S3).
Since the alternative placement of spilogaster constituted a specific hypothesis, mean Gower dissimilarity between spilogaster and grantii and between spilogaster and rovuma was also calculated from the same distance matrix. Mean dissimilarity was used to quantify the magnitude of phenotypic separation between the groups, whereas PERMANOVA tested differences in multivariate group centroids. Phenotypic affinity was interpreted from the combined evidence of pairwise dissimilarity, ordination position, character-state frequencies and independent mitochondrial comparisons rather than from any single statistical result.
2.10. Environmental Comparison
Environmental characteristics associated with the eight geographic forms were compiled from published habitat descriptions and spatial environmental datasets (Mackworth-Praed; Grant 1936, 1952, 1962; Hall 1963; Clancey 1967b; Roberts 1930, 1951; Madge; McGowan 2002; Hockey et al. 2005; Little 2016; Mandiwana-Neudani et al. 2019). Variables comprised Leaf Area Index (LAI) (Yuan et al. 2011), Normalised Difference Vegetation Index (NDVI) (Pettorelli et al. 2005), vegetation biomass (Henry et al. 2011), temperature, rainfall (Copernicus Climate Data Store), and elevation (Jarvis et al. 2008).
Environmental differentiation among geographic forms was summarised using principal component analysis performed in R with stats::prcomp(center = TRUE, scale. = TRUE). All environmental variables were therefore centred and standardised before analysis. The proportion of variance explained by successive principal components and the corresponding variable loadings were examined to determine the principal environmental gradients, and the first two components were used to visualise environmental relationships among geographic forms.
The environmental values represented broad summaries of the geographic distributions of the forms rather than replicate habitat measurements associated with individual birds. The environmental PCA was therefore interpreted descriptively as an assessment of environmental association and was not used as a formal statistical test of ecological adaptation or of historical climatic or palaeoecological causes of phenotypic differentiation.
2.11. Comparative Mitochondrial Analysis
We collected toe-pad slivers from 18 crested francolin museum specimens housed at the American Museum of Natural History (AMNH; n = 8) and the Ditsong National Museum of Natural History (DNMNH; n = 10) (Table S4). DNA was extracted using the DNeasy Blood and Tissue Kit (Qiagen, Hilden, Germany) in dedicated archival facilities at the Centre for Molecular Analysis (CTM), BIOPOLIS–CIBIO/InBIO, Portugal. Extraction blanks were included to monitor potential contamination. DNA concentration was measured using a Qubit® 2.0 High Sensitivity DNA Assay (Invitrogen, Waltham, USA).
A 184 bp fragment of the mitochondrial Control Region (CR) and a 187 bp fragment of NADH dehydrogenase subunit 2 (ND2) were amplified and sequenced using the primer pairs CRFra58 (5′-GTATACGTACTAAACCCATTAT-3′) and CRFra355 (5′-TCCGATCAATAAATCCATCTGG-3′) for CR, and ND2_1_fw (5′-CCTTCCCCTACTAATGAAC-3′) and ND2_1_rev (5′-GGATTAGGGCTGATGCAG-3′) for ND2, following Forcina et al. (2015). Sequences were manually edited using ChromasPro (Technelysium®, Brisbane, Australia) and aligned in Geneious 8.1.5 (Kearse et al. 2012). Available CR and ND2 reference sequences were incorporated for comparative purposes (Table S4).
The comparative dataset included the eight focal geographic forms spilogaster, grantii, ochrogaster, rovuma, zambesiae, sephaena, zuluensis and thompsonii. Identification of geographically variable forms was guided by comparative photographs and validated voucher specimens housed in museum collections. Alignments were standardised and trimmed to homologous positions before analysis. CR and ND2 sequences were analysed separately and as a concatenated dataset in MEGA X (Kumar et al. 2018), which was used to generate pairwise sequence divergences as uncorrected p-distances.
The CR, ND2 and concatenated alignments were imported into NETWORK 10 (Fluxus Technology Ltd., UK) to construct median-joining haplotype networks (Bandelt et al. 1999), with positions weighted uniformly, ε set to 0 and the transition/transversion ratio set to 1. Maximum-likelihood analysis of the concatenated CR + ND2 dataset was conducted in RAxML 8.0.0 (Stamatakis 2014) using the GTR + G substitution model identified as the best-fitting model in PartitionFinder 2 (Lanfear et al. 2012). Rapid bootstrapping and multiple alternative runs were conducted from 100 random starting trees. GenBank sequences of related galliform species served as outgroups (Table S4). Trees were visualised in FigTree 1.4 (Rambaut 2018), and phylogenetic analyses were executed on the CIPRES platform (Miller et al. 2010).
3. Results
3.1. Blind Rescoring and Geographic Differentiation in Plumage
Blind intra-observer rescoring yielded usable comparisons for 61 photographic records. Repeatability statistics for all seven plumage characters are summarised in Table 1. Breast markings, gorget-line position, abdominal feather structure and abdominal colour showed the strongest overall repeatability and were therefore retained for formal statistical inference, whereas lower-eye markings, crest colour and scapular colour were retained only as descriptive characters.
Based on these repeatability results, breast markings, gorget-line position, abdominal feather structure and abdominal colour were retained for formal statistical inference.
The four retained plumage characters showed significant geographic structuring among the eight forms examined (Table 2 and Table 3). The strongest association with geographic form was observed for gorget-line position (Cramér’s V = 0.935), followed by abdominal feather structure (V = 0.771), breast markings (V = 0.566) and abdominal colour (V = 0.526). All four associations remained significant after Benjamini–Hochberg correction (adjusted p = 0.0001; Table 3).
Multivariate analysis based on Gower dissimilarities likewise revealed substantial phenotypic structuring among geographic forms (Figure 3). The first two principal-coordinate axes accounted for 45.8% and 18.1%, respectively, of the variation represented by positive eigenvalues. Overall multivariate phenotype differed strongly among forms (PERMANOVA: pseudo-F7,264 = 95.61, R2 = 0.717, permutation p < 0.001). Multivariate dispersion also differed significantly among forms (F7,264 = 7.27, permutation p = 0.0001).
A pronounced geographical division was evident in gorget-line position (Figure 4). Among the 125 records representing the northeastern/eastern forms (grantii, ochrogaster, spilogaster and rovuma), 120 (96.0%) showed a high gorget. In contrast, only 8 of 147 southern records (5.4%) exhibited a high gorget. This association was exceptionally strong (Fisher’s exact test, p = 4.56 × 10−60; odds ratio = 417.0, 95% CI = 132.9–1308.7). High gorgets occurred in 98.1% of grantii, 100% of ochrogaster, 75.0% of spilogaster and 100% of rovuma (Table 1). The southern forms showed the largely reciprocal condition: all sephaena and zambesiae records had low gorgets and 98.4% of zuluensis were low-gorget birds. The form thompsonii differed from this otherwise strong north–south pattern, with high and low gorgets occurring at equal frequency.
3.2. Phenotypic Affinities of Spilogaster
The form spilogaster retained the predominantly high-gorget condition characteristic of northeastern/eastern populations, with 75.0% of individuals showing a high gorget (Table 2). Sparse breast markings occurred in 56.2% of records, while 75.0% showed guttate abdominal markings extending to the belly and a further 6.2% showed guttate markings extending to the vent. Markings extending below the gorget occurred in all scored spilogaster records. Mean Gower dissimilarity was similar in the two comparisons, being 0.522 between spilogaster and grantii and 0.5 between spilogaster and rovuma.
Planned multivariate comparisons showed significant differentiation of spilogaster from both grantii and rovuma. The magnitude of differentiation was lower between spilogaster and grantii (pseudo-F = 21.142, R2 = 0.240, adjusted p = 0.0002) than between spilogaster and rovuma (pseudo-F = 21.390, R2 = 0.401, adjusted p = 0.0002), indicating weaker separation from grantii at the level of group centroids. Mean Gower dissimilarities, however, were very similar, being 0.522 between spilogaster and grantii and 0.500 between spilogaster and rovuma; these values therefore did not independently indicate a closer phenotypic affinity of spilogaster to grantii.
3.3. Geographic Phenotype of Ochrogaster
The Ugandan ochrogaster material showed a coherent combination of character states (Table 1). All 38 scored records exhibited a high gorget, and 92.1% showed weak or fine abdominal vermiculation on an otherwise relatively uniform ground. As an additional descriptive feature, 86.8% of records showed solid lower-eye markings. In neighbouring grantii, 73.6% of individuals exhibited scaled or snowflake-shaped abdominal markings. Multivariate differentiation between ochrogaster and grantii was significant (pairwise PERMANOVA: pseudo-F = 78.011, R2 = 0.467, adjusted p = 0.0002; Table S3).
3.4. Differentiation Among Southern Phenotypes
Geographic phenotypic differentiation was evident within the southern assemblage. Of the four plumage characters retained for formal inference, gorget-line position showed the strongest association with geographic form (Cramér’s V = 0.638), followed by breast markings (V = 0.445) and abdominal feather structure (V = 0.302); all three remained significant after Benjamini–Hochberg correction (adjusted p ≤ 0.0011; Table S2). Abdominal colour did not differ significantly among the four southern forms (V = 0.155, adjusted p = 0.2744). Pairwise PERMANOVA showed significant differentiation in five of the six southern comparisons after correction for multiple testing; the only non-significant comparison was sephaena–zuluensis (R2 = 0.032, adjusted p = 0.0575; Table S3).
The form sephaena was characterised by an entirely low gorget and predominantly distinctly vermiculated abdominal feathering (83.8%), whereas zambesiae also showed uniformly low gorgets but combined predominantly distinctly vermiculated feathering (72.7%) with a substantial plain/fine component (21.2%). The form zuluensis was almost entirely low-gorget (98.4%) but combined distinctly vermiculated (65.1%) and scaled or snowflake-shaped abdominal patterns (31.7%), while thompsonii differed in showing equal frequencies of high and low gorgets, with all 14 records displaying distinctly vermiculated abdominal feathering (Table 2).
3.5. Phenotypic Intergradation
The occurrence of markings extending below the gorget differed strongly among geographic forms (χ2 = 166.13, Monte Carlo p = 0.0001, Cramér’s V = 0.782). This character occurred in all spilogaster and rovuma records, 34.0% of grantii and 21.1% of ochrogaster, but was absent from the scored sephaena, zambesiae, zuluensis and thompsonii material. The targeted examination of eastern African birds likewise revealed intermediate combinations of upper-breast, gorget and abdominal patterning. In some individuals, breast markings extended through or below the gorget and became progressively more elongate or guttate ventrally (Figure 2). The geographic distribution of these transitional expressions was concentrated in eastern Africa (Figure S1).
3.6. Multivariate Phenotypic Structure
The four-character PCoA showed a broad separation between northeastern/eastern and southern phenotypes along the first principal-coordinate axis, while retaining overlap among individual geographic forms (Figure 3). The form ochrogaster occupied a relatively differentiated region of morphospace, whereas grantii, spilogaster and rovuma showed greater overlap. The southern forms sephaena, zambesiae, zuluensis and thompsonii occupied partly overlapping regions of morphospace, although the extent of differentiation varied among pairwise comparisons. Overall, the ordination indicates geographic phenotypic structure based on the four repeatable plumage characters, but not completely discrete or non-overlapping phenotypic clusters.
3.7. Environmental Differentiation
The environmental PCA accounted for 92.2% of the standardised environmental variation on the first two axes (PC1 = 61.2%; PC2 = 31.0%; Figure S2). PC1 was associated primarily with vegetation structure and productivity, including LAI, NDVI and biomass, together with rainfall, whereas PC2 was influenced principally by temperature and elevation. The form ochrogaster, rovuma and zuluensis occupied the more humid and densely vegetated portion of the principal environmental gradient, whereas thompsonii, sephaena, zambesiae and spilogaster were associated with relatively drier and less densely vegetated environmental profiles (Tables S5–S7). Samples assigned to O. grantii occupied an intermediate position (Figure S2). These environmental differences are interpreted as ecological associations rather than evidence of the historical processes responsible for phenotypic differentiation.
3.8. Comparative Mitochondrial Structure
The mitochondrial alignment comprised 18 specimens and 373 aligned positions across CR and ND2, including indels, with 52 variable sites. Eight haplotypes were identified independently for CR and ND2, and 15 haplotypes were identified in the concatenated dataset. Concatenated CR + ND2 distances showed relatively shallow divergence among the northeastern/eastern forms spilogaster, grantii and ochrogaster (1.4–2.3%) and among the southern forms (0.6–1.9%), whereas rovuma showed greater divergence from both assemblages (Table 4). The latter differed by 3.3–3.8% from the northeastern/eastern forms and by 2.1–2.9% from the southern forms.
The contrast involving spilogaster was particularly marked. Its mitochondrial divergence from grantii was 1.4%, whereas divergence from rovuma was 3.8% (Table 4). The form ochrogaster differed from grantii by 1.6%. Within southern Africa, sephaena and zuluensis differed by only 0.6%. The CR (Figure 5a), ND2 (Figure 5b) and concatenated CR + ND2 (Figure 5c) haplotype networks broadly separated northeastern/eastern and southern samples, with rovuma occupying an intermediate position. The maximum-likelihood topology differed in the placement of rovuma, which appeared basally within the northern group (Figure 5d). These mitochondrial results are therefore interpreted as comparative evidence of affinity rather than as independent delimitations of species or subspecies.
4. Discussion
The systematics and taxonomy of African francolins remain intensely debated (Crowe et al. 2022, Hustler 2024). This group is of high evolutionary interest, since it includes several genera endemic to Africa or specific regions of this continent. Moreover, francolins occupy diverse habitats, ranging from forest edges to savannahs. Their evolutionary history provides valuable insights into how isolation, environmental variability and climatic fluctuations have driven adaptive radiations in galliforms and other taxa (Moreau 1966, Crowe 1978). In this study, we carried out a comprehensive exploration of the extant geographic phenotypic structure of one of the most widely distributed and contentious species, the crested francolin, re-examining the validity of previously and presently recognised taxa while elucidating the evolutionary drivers underlying their diversification. Notably, the crested francolin has been described as a link between spurfowl and francolins (Crowe et al. 1992, Hall 1963), as well as between Asian and African francolins (Mandiwana- Neudani et al. 2019).
4.1. Geographic Organisation of Phenotypic Variation
The principal result of this study is that plumage variation within the crested francolin complex is geographically structured rather than randomly distributed across Africa. All four plumage characters retained for formal inference showed significant geographic heterogeneity, with the strongest differentiation in gorget-line position and abdominal feather structure, followed by breast markings and abdominal colour. These patterns were also evident in the four-character PCoA, although substantial overlap occurred among individual birds and geographic forms. The complex is therefore better characterised by geographically recurrent combinations and frequencies of character states, together with areas of phenotypic transition, than by a series of completely discrete morphological units.
The seven originally scored plumage characters remain informative as descriptive observations, but the blind repeatability assessment demonstrated that not all photographic characters were equally reproducible. Crest colour, scapular colour and lower-eye markings showed lower repeatability and were therefore excluded from formal inferential analyses. This distinction is important when photographic material is used for morphological studies: subtle colour and fine plumage characters may be influenced by illumination, exposure, image processing and viewing conditions, and should not automatically be given the same analytical weight as more repeatable pattern or structural characters. The strong geographic signal retained after restriction to the four more repeatable characters indicates that the principal pattern of geographic differentiation is not dependent on the less reproducible photographic traits.
Such geographic structure is characteristic of many widespread polytypic birds. Geographic differentiation may be expressed through locally frequent phenotypes, clines and zones of intergradation without corresponding to complete reproductive or phylogenetic discontinuities (Endler 1977). Earlier treatments of crested francolins similarly encountered difficulty in reconciling geographically characteristic plumage with intermediate populations, resulting in repeated changes in the rank and placement of named forms (Ogilvie-Grant 1896, Van Someren 1932, Hall 1963, Clancey 1967a). The present results support a biological basis for much of this historically recognised geographic variation while also showing why rigid boundaries among forms have been difficult to maintain. Significant differences in multivariate dispersion further caution against interpreting the overall PERMANOVA as evidence for eight completely discrete phenotypic groups; character-state frequencies, geographic distributions and planned pairwise comparisons provide the more appropriate basis for interpreting the observed structure.
4.2. Northern/Eastern–Southern Phenotypic Divide
The most conspicuous single-character geographic pattern was the strong contrast in gorget position between northeastern/eastern and southern populations. High gorgets occurred in 96.0% of records from grantii, ochrogaster, spilogaster and rovuma combined (per-form values in Table 2), compared with only 5.4% among the southern forms, most of the latter contributed by thompsonii. The magnitude of this difference suggests that gorget position represents a primary axis of geographic phenotypic differentiation within African Ortygornis. This north–south contrast should not, however, be interpreted as evidence for an additional species boundary. Geographic characters can change markedly over space while retaining local or regional intermediates, particularly in broadly distributed populations (Endler 1977). Moreover, among the 14 thompsonii records examined, high and low gorgets occurred at equal frequency, departing from the otherwise strong southern tendency towards a low gorget. This variation illustrates that no single plumage character consistently defines all geographic forms. Broad north–south differentiation has long been recognised in the distribution and morphology of African birds, often in association with major vegetation zones and historical changes in habitat connectivity (Moreau 1966, Crowe; Crowe 1982). Comparable north–south structuring occurs in several widespread African bird complexes, including other galliforms such as the helmeted guineafowl (Numida meleagris), in which northern and southern subspecies show parallel morphological and ecological differentiation across the equatorial forest belt (Crowe 1978, Mackworth-Praed; Grant 1936, Urban et al. 1986, Crowe et al. 1992, Van Niekerk et al. 2022). Similar patterns of geographically structured plumage variation are also evident in the red-billed hornbill (Tockus erythrorhynchus; Kemp; Woodcock 1995), yellow-billed kite (Milvus aegyptius; Hockey et al. 2005), white-browed robin-chat (Cossypha heuglini; Urban et al. 1997), Kurrichane thrush (Turdus libonyana; Sinclair; Ryan 2003), and Burchell’s sandgrouse (Pterocles burchelli; Hockey et al. 2005). Our data place the cested francolin within this broader pattern, but they do not establish the historical mechanism responsible for it. Future investigations entailing palaeoclimatic niche modelling or ancestral-area reconstruction are needed to distinguish between alternative historical scenarios.
4.3. Taxonomy Revisited
4.3.1. The Affinities of Spilogaster
The position of spilogaster remains one of the more important taxonomic questions arising from the analysis. Its treatment has varied historically. Hall (1963) considered spilogaster in relation to intergradation between grantii and rovuma, whereas Mandiwana-Neudani et al. (2019) placed it as O. rovuma spilogaster. Our results confirm that spilogaster is a recognisable geographic phenotype, particularly in its guttate ventral markings, predominantly high gorget and tendency towards sparse breast markings.
The four-character multivariate analysis differentiated spilogaster significantly from both grantii and rovuma. The PERMANOVA effect size was smaller for spilogaster–grantii (R2 = 0.24) than for spilogaster–rovuma (R2 = 0.401), indicating weaker separation from grantii at the level of group centroids. Mean Gower dissimilarities, however, were very similar and were marginally lower between spilogaster and rovuma (0.5) than between spilogaster and grantii (0.522). Morphology alone therefore does not provide an unambiguous placement of spilogaster relative to these two neighbouring forms.
The mitochondrial comparison provides an independent line of evidence. In the concatenated CR + ND2 dataset, spilogaster differed from grantii by 1.4%, compared with 3.8% from rovuma (Table 4). These mitochondrial distances should be interpreted cautiously because the sequences are short and the number of sampled individuals is limited. Mitochondrial DNA represents a single maternally inherited marker system and may not accurately reflect population history where incomplete lineage sorting, introgression or stochastic lineage sorting has occurred (Zink; Barrowclough 2008, Kimball et al. 2021).
The present evidence supports transferring spilogaster from O. rovuma to O. grantii, as O. grantii spilogaster (Salvadori 1888). This interpretation rests principally on the mitochondrial affinity, together with the weaker multivariate centroid separation from grantii, rather than on an unequivocal morphological affinity. Nuclear genomic sampling of multiple individuals across the grantii–spilogaster–rovuma transition is required for a stronger test of this placement.
4.3.2. The Status of Ochrogaster
The Ugandan population historically named ochrogaster emerges as a coherent geographic phenotype. The form was recognised by earlier authors but was subsequently synonymised with grantii or omitted from later classifications (Van Someren 1932, Friedmann 1930; Appendix I). Friedmann (1930), for example, treated ochrogaster as a synonym of grantii, whereas Van Someren retained it as a named geographic form.
The morphological evidence for ochrogaster rests primarily on the consistency and comparative distinctiveness of the gorget position and abdominal pattern. All 38 scored birds had a high gorget, and 35 of 38 (92.1%) showed weak or fine abdominal vermiculation on an otherwise relatively uniform ground. Solid lower-eye markings were also frequent in ochrogaster (33 of 38; 86.8%), but because this character showed comparatively poor repeatability in the blinded reassessment, it is treated here only as an additional descriptive feature and not as independent evidence of differentiation. Abdominal ground colour was more variable and is therefore treated as supporting rather than diagnostic evidence. The four-character multivariate analysis nevertheless showed strong differentiation between ochrogaster and neighbouring grantii (R2 = 0.467, adjusted p = 0.0002; Table S3).
The mitochondrial comparison provides no evidence of deep separation from grantii: the two differed by 1.6% in the present short mitochondrial dataset. This is compatible with subspecific differentiation but does not by itself establish subspecific status. We therefore consider the combined geographic, morphological and mitochondrial evidence to support renewed recognition of O. g. ochrogaster (Hartlaub 1882), while emphasising that this is a subspecific rather than species-level interpretation. Its relationship with adjoining grantii populations should be tested further with denser genetic and morphological sampling from western Uganda, the Lake Victoria region and neighbouring East Africa.
4.3.3. Geographic Phenotypes Within O. sephaena
The southern forms present a somewhat different pattern. Mitochondrial divergence among sephaena, zambesiae, zuluensis and thompsonii was shallow, ranging from 0.6% to 1.9%, yet three of the four plumage characters retained for formal inference remained significantly heterogeneous among these populations (Table S2). Gorget-line position showed the strongest geographic association, followed by breast markings and abdominal feather structure, whereas abdominal colour did not differ significantly. The southern populations therefore show geographic phenotypic structure despite relatively shallow mitochondrial differentiation.
The individual forms are differentiated principally by combinations and frequencies of character states rather than by unique diagnostic characters. Among the southern forms, sephaena showed uniformly low gorgets and predominantly distinctly vermiculated abdominal feathering; zambesiae shared the low-gorget condition but included a substantial plain/fine abdominal component; zuluensis was also almost entirely low-gorget but showed a greater incidence of scaled or snowflake-shaped abdominal markings; and thompsonii differed in showing both high and low gorgets while retaining uniformly distinctly vermiculated abdominal feathering. Pairwise multivariate comparisons supported differentiation in five of the six southern contrasts, although sephaena and zambesiae were not significantly differentiated after correction (R2 = 0.032, adjusted p = 0.0575; Table S3). The southern forms therefore should not be interpreted as completely discrete phenotypic clusters.
These patterns correspond broadly with the long history of recognition of geographically differentiated southern populations by Roberts (1951), Clancey (1967a,b,c) and subsequent southern African treatments. The shallow mitochondrial differentiation among them nevertheless requires caution. Mitochondrial divergence is neither a necessary nor sufficient criterion for recognising geographic subspecies, particularly where differentiation may be recent, gene flow has persisted, or different character systems have evolved at different rates (Zink; Barrowclough 2008, Kimball et al. 2021). Equally, statistically significant differences in character frequencies do not by themselves establish taxonomic rank.
The combined geographic distribution, recurrent phenotypic differences and historical nomenclatural continuity are nevertheless consistent with continued recognition of O. s. sephaena, O. s. zambesiae, O. s. zuluensis and O. s. thompsonii as geographic subspecies within O. sephaena. This interpretation recognises measurable geographic structure without implying complete morphological separation among all neighbouring forms. Genome-wide sampling across the southern African distribution would provide a stronger test of whether these phenotypic patterns correspond to restricted gene flow or predominantly morphological differentiation.
4.3.4. Intergradation Rather than Demonstrated Hybridisation
Earlier treatments frequently invoked hybridisation to explain intermediate crested francolin phenotypes, particularly in East Africa (Hall 1963). The historical interpretation of spilogaster was closely connected to a proposed zone of intergradation between grantii and rovuma. Our material confirms that intermediate character combinations occur in geographically structured patterns, but morphology alone cannot distinguish hybrid ancestry from clinal variation, shared ancestral polymorphism or independent combinations of character states. We therefore regard the observed transitions as phenotypic intergradation—geographically gradual change in character states—rather than demonstrated hybridisation. Targeted examination of eastern African birds revealed gradual variation in ventral patterning, ranging from ace-shaped markings to more elongate and guttate forms, further indicating that these plumage characters vary continuously rather than forming sharply discrete geographic states. Such spatial transitions are consistent with intergradation between differentiated populations, but demonstration of introgression requires genetic evidence from both sides of the relevant boundaries (Endler 1977, Semenov et al. 2021).
This distinction is particularly important because the present mitochondrial dataset cannot provide such evidence. Short mitochondrial sequences can reveal broad maternal affinities but cannot establish recent admixture or quantify contemporary gene flow. Future sampling with genome-wide, biparentally inherited nuclear markers, such as single nucleotide polymorphisms (SNPs), should therefore target the geographic areas in which intermediate phenotypes are most frequent.
4.3.5. Ecology and Phenotype
Environmental analyses provide useful context but should not be interpreted as demonstrating ecological adaptation. The first two environmental principal components accounted for 92.2% of the standardised environmental variation among geographic forms (PC1 = 61.2%; PC2 = 31.0%), with the principal gradients involving rainfall, vegetation productivity, vegetation structure, temperature and elevation (Figure S2; Tables S5–S7). NDVI and related measures provide broad indices of vegetation productivity and greenness (Pettorelli et al. 2005), while African vegetation zones vary substantially across the range of the complex (White 1983, Mucina; Rutherford 2006). Several phenotypically differentiated forms also occupy contrasting environmental settings. For example, spilogaster is associated with relatively elevated, drier and more open environments, whereas rovuma occurs in warm, low-elevation environments with denser vegetation; grantii occupies an intermediate environmental position.
Earlier authors repeatedly related francolin distributions to vegetation and regional biogeography (Hall 1963, Clancey 1967b, Moreau 1966), and avian plumage and morphology can covary with environmental conditions and habitat structure (James 1970, Stevens; Merilaita 2011, Medina et al. 2017). The present analysis, however, is based on environmental summaries for geographic forms rather than replicate ecological measurements associated with individual birds. It can therefore identify environmental associations but cannot establish that plumage states evolved as adaptations to those environments. The environmental results are best regarded as an independent description of the ecological settings occupied by the geographic phenotypes and as a basis for future hypothesis testing.
4.3.6. Phylogeographic Inference and Historical Biogeography
The mitochondrial data provide a line of evidence independent of plumage. Divergence was relatively shallow within the northeastern/eastern grantii assemblage (1.4–2.3%) and among the southern sephaena forms (0.6–1.9%), whereas rovuma was more differentiated from both assemblages (2.1–3.8%). The comparison involving spilogaster is particularly informative: mitochondrial divergence was 1.4% between spilogaster and grantii, compared with 3.8% between spilogaster and rovuma (Table 3). This mitochondrial affinity is stronger than the corresponding morphological signal, which did not unequivocally place spilogaster closer to either neighbouring form.
Interpretation beyond these broad comparisons should remain cautious. The mitochondrial dataset comprises short CR and ND2 fragments from only 18 museum specimens. Mitochondrial DNA represents a single maternally inherited genealogical history and may differ from population or species history because of incomplete lineage sorting, sex-biased dispersal or introgression (Zink; Barrowclough 2008). Moreover, cytonuclear discordance is well documented among landfowl (Kimball et al. 2021), which calls for carrying out further analyses based on multilocus nuclear DNA. The fact that rovuma haplotypes are nearly equidistant to those falling in both the northern and the southern group (Figure 5a–c) along with their non-monophyletic placement in the maximum-likelihood tree (Figure 5d) illustrates why the current mitochondrial data alone should not be used to infer the evolutionary history of this species complex. Ortygornis rovuma is phenotypically (other than vocally: van Niekerk et al. 2021) distinctive, particularly in its ordered guttate ventral markings, and comparatively divergent in the mitochondrial dataset, but its precise phylogenetic placement within the African Ortygornis complex remains unresolved. The observed mitochondrial relationships could reflect historical divergence, introgression or incomplete lineage sorting. Resolving these alternatives will require substantially denser geographic sampling and genome-wide nuclear data.
The geographic pattern documented here is compatible with a history in which climatic and vegetational change repeatedly altered connectivity among eastern and southern African savannahs and woodlands. African vegetation underwent major changes during the late Cenozoic and Quaternary, including expansion of C4 grasslands and repeated shifts among forest, woodland and more open habitats (Moreau 1966, Bonnefille 2010, Malhi et al. 2013). Changes associated with the termination of the African Humid Period likewise altered forest–savannah distributions in tropical Africa (Marchant; Hooghiemstra 2004). These changes provide a plausible historical context for geographic differentiation and subsequent contact in Ortygornis, but the present study does not test palaeogeographic scenarios. Determining whether specific climatic events or historical isolation produced the observed patterns will require dated genomic phylogenies, demographic modelling and palaeoclimatic distribution modelling.
5. Conclusions
The African members of Ortygornis show strong but incomplete geographic structuring of plumage across eastern and southern Africa. The clearest large-scale pattern is a predominantly high-gorget northeastern/eastern assemblage and a predominantly low-gorget southern assemblage, superimposed on finer-scale variation in breast markings, abdominal feather structure and colour. These regional phenotypes overlap and intergrade, indicating that geographic differentiation within the complex is not represented by completely discrete morphological units.
The position of spilogaster remains partly ambiguous morphologically: the four-character multivariate analysis showed weaker centroid separation from grantii than from rovuma, whereas mean Gower dissimilarities were very similar for the two comparisons. The mitochondrial data, however, showed substantially closer affinity of spilogaster to grantii than to rovuma. The combined evidence therefore provides qualified support for transfer of spilogaster to O. grantii as O. g. spilogaster. The geographically coherent Ugandan phenotype likewise supports renewed recognition of O. g. ochrogaster. Within O. sephaena, the southern data reveal geographically structured phenotypic variation despite shallow mitochondrial differentiation and are consistent with recognition of sephaena, zambesiae, zuluensis and thompsonii as geographic subspecies.
These conclusions concern geographic phenotypic and subspecific structure rather than species delimitation. Denser geographic sampling and biparentally inherited nuclear genomic data will be required to test fine-scale relationships, the extent of gene flow and introgression, and the evolutionary history of contact among neighbouring forms.
Supplementary Materials
The following supporting information can be downloaded at the website of this paper posted on Preprints.org, Figure S1. Geographic distribution of phenotypic intergradation in the crested francolins species complex across eastern Africa. Numbered localities correspond to specimens and photographic records examined for changes in breast and abdominal marking structure (Appendix XI). The red circles indicate the occurrence of rovuma, as observed on museum skins (Appendix XI). Percentages indicate the frequency of markings extending below the gorget within the relevant geographic samples, as summarised in Appendix II–IX. The mapped pattern identifies areas of phenotypic transition but does not independently demonstrate introgression. Figure S2. Environmental differentiation among eight geographic taxa of crested francolin across Africa. Principal component analysis was based on standardised temperature, rainfall, elevation, Leaf Area Index (LAI), Normalised Difference Vegetation Index (NDVI) and vegetation biomass. Arrows indicate variable loadings. PC1 and PC2 account for 61.2% and 31.0% of total environmental variance, respectively. Environmental positions are interpreted descriptively and not as evidence of historical causation. Table S1. Museum study skins used for morphological analysis of the Crested Francolin species complex. These specimens provided the data for the distribution map in Figure 1 and were used to confirm phenotypic differences. AMNH: American Museum of Natural History; DNMNH: Ditsong National Museum of Natural History; MCZ: Museum of Comparative Zoology, Harvard University; NHMD: Natural History Museum of Denmark; NHMUK: Natural History Museum, UK; NRM: Swedish Museum of Natural History; RMNH: National Museum of Natural History (Rijksmuseum voor Natuurlijke Historie); SMF: Senckenberg Research Institute and Natural History Museum; WFVZ: Western Foundation of Vertebrate Zoology; YPM: Peabody Museum of Natural History; ZMA: Zoological Museum Amsterdam. NA: data not available; ?: contentious specimen label information (not consistent with taxa distribution or morphology). ISO two-digit country codes are used to denote the countries in which the museums are located. Table S2. Character-level tests of plumage differentiation among the southern geographic forms sephaena, zambesiae, zuluensis and thompsonii for the four plumage characters retained following blind repeatability assessment. Monte Carlo chi-square probabilities were estimated from 9999 permutations. Cramér’s V indicates effect size, and p-values were adjusted using the Benjamini-Hochberg false discovery rate procedure. Table S3. Planned pairwise PERMANOVA comparisons among selected geographic forms based on Gower dissimilarities calculated from the four plumage characters retained following blind repeatability assessment: breast markings, gorget-line position, abdominal feather structure and abdominal colour. Corresponding tests of multivariate dispersion are also shown. PERMANOVA and dispersion p-values were estimated using 9999 permutations and adjusted for multiple comparisons using the Benjamini–Hochberg procedure. Table S4. List of museum specimens and GenBank records used for genetic analyses. AMNH: American Museum of Natural History; DNMNH: Ditsong Museum of Natural History; FMNH: Field Museum of Natural History; * based on sampling locality; ** labelled as schoanus; NA: not available. Table S5. Loadings of the six environmental variables on the first two principal components of the environmental PCA. Table S6. Scores of the eight geographic forms on the first two principal components of the environmental PCA. Table S7. Eigenvalues, percentage variance explained and cumulative variance for the environmental principal component analysis of eight geographic forms of crested francolin across Africa. The PCA was based on the six standardised environmental variables listed in Table S3: temperature, rainfall, elevation, Leaf Area Index (LAI), Normalised Difference Vegetation Index (NDVI) and vegetation biomass. Table S8. Environmental descriptors used in the environmental principal component analysis of eight geographic forms of crested francolin across Africa. Variables comprise mean temperature, rainfall, elevation, Leaf Area Index (LAI), Normalised Difference Vegetation Index (NDVI) and vegetation biomass.
Author Contributions
Johann van Niekerk: Conceptualization-Lead, Data curation-Equal, Formal analysis-Lead, Funding acquisition-Lead, Investigation-Lead, Methodology-Equal, Project administration-Lead, Visualization-Supporting, Writing-original draft-Equal, Writing-review; editing-Equal, Marta Rodríguez-Rey: Formal analysis-Supporting, Methodology- Supporting, Writing-review; editing, José Antonio Dávila García: Formal analysis-Supporting. Funding acquisition-Supporting, Giovanni Forcina: Conceptualization-Supporting, Data curation-Equal, Formal analysis-Supporting, Funding acquisition-Supporting, Investigation-Supporting, Methodology-Equal, Project administration-Supporting, Validation-Equal, Visualization-Lead, Writing-original draft-Supporting, Writing-review; editing-Equal.
Institutional Review Board Statement
This research was approved by the UNISA-CAES Animal Research Ethics Committee on 8 June 2021 (Ref. 2021/CAES_AREC/100).
Data Availability Statement
The newly generated DNA sequences have been deposited in GenBank under accession numbers QB047253-QB047286. Additional data supporting the findings of this study are available from the corresponding author upon reasonable request.
Acknowledgments
The authors are grateful to the University of South Africa for awarding a grant to conduct genetic analyses, issued under ethical approval reference AREC-100818-024. Special thanks go to the curators of ornithological collections, collaborators, and associated museums for providing tissue samples, facilitating access to specimens and/or supplying photographs of the 46 specimens examined: P. Capainolo, P. Sweet and T.J. Trombone (American Museum of Natural History, Division of Vertebrate Zoology, New York); Mpho Malematja (Ditsong National Museum of Natural History, Pretoria); Maria Mostadius (Natural History Museum of Sweden); Jon Fjeldså (The Natural History Museum of Denmark at the University of Copenhagen); Pepijn Kamminga (Naturalis Biodiversity Center, Leiden); Kristof Zyskowski (Peabody Museum of Natural History, Division of Vertebrate Zoology, Yale University); Jeremaih Trimble (Museum of Comparative Zoology, Massachusetts); Garret Kimball (Natural History Museum of Los Angeles County); Jonathan Rice (Carnegie Museum of Natural History); Sharon Mwelu Kyungu (National Museums of Kenya); Gerald Mayr (Senckenberg Research Institute and Natural History Museum, Ornithological Section, Frankfurt); Tineke G. Prins (Zoological Museum Amsterdam); Andrew Kratter (Florida Museum of Natural History); Alain Reygel (Royal Museum of Central Africa); Mimi Damwyk (Western Foundation of Vertebrate Zoology); Hein van Grouw (The Natural History Museum, Bird Group, Department of Life Sciences, Tring). The authors are also grateful to CTM technicians Susana Lopes, Patricia Ribeiro and Sofia Mourão for their assistance with Sanger sequencing, and to laboratory manager Sara João for support with project administration. Photographs of crested francolin used in this paper were accessed from the Macaulay Library at the Cornell Lab of Ornithology: low-gorget line (ML 615357673, by Antonio Ceballos Barbancho) and high-gorget line individual (ML 613073778, by Keith Cowton); breast markings concentrated above (ML509880911, by Adriana Dinu) and below (ML632342487, by Daniel Dankwerts) the gorget line; disruption of the gorget line with elongate guttate markings extending ventrally (ML205351011, by David Beadle). Finally, thanks go to Tshifhiwa Mandiwana-Neudani and Rebecca Kimball for sharing additional metadata regarding GenBank references FR691574.1 and MW574367.1, respectively.
Conflicts of Interest
The authors declare no competing financial interests or personal relationships that could have appeared to influence the work reported in this paper.
References
- Anderson, G.; Holmes, C. Galliformes: Species, varieties, and behavior. In Gamebird Medicine and Management; Morishita, T.Y., Porter, R.E., Hoboken, N.J., Eds.; Wiley-Blackwell: Hoboken, NJ, USA, 2022. [Google Scholar] [CrossRef]
- Baker, N.; Baker, L. Tanzania Bird Atlas Project. 2007. Available online: http://tanzaniabirdatlas.net/start.htm.
- Bandelt, H.-J.; Forster, P.; Röhl, A. Median-joining networks for inferring intraspecific phylogenies. Mol. Biol. Evol. 1999, 16, 37–48. [Google Scholar] [CrossRef] [PubMed]
- Barton, N.H.; Hewitt, G.M. Analysis of hybrid zones. Annu. Rev. Ecol. Syst. 1985, 16, 113–148. [Google Scholar] [CrossRef]
- Bonnefille, R. Cenozoic vegetation, climate changes and hominid evolution in tropical Africa. Glob. Planet. Change 2010, 72, 390–411. [Google Scholar] [CrossRef]
- Canty, A.; Ripley, B.D. boot: Bootstrap R (S-Plus) Functions. 2021.
- Ceresa, F.; Brambilla, M.; Kvist, L.; Vitulano, S.; Pes, M.; Tomasi, L.; Pedrini, P.; Bettega, C.; Anderle, M.; Hilpold, A.; et al. Wing morphology changes with habitat availability and elevation in an alpine-specialist bird. Glob. Ecol. Conserv. 2024, 56, e03276. [Google Scholar] [CrossRef]
- Clancey, P.A. A review of the Crested Francolins (Francolinus sephaena complex). Durb. Mus. Nov. 1967, 6, 123–146. [Google Scholar]
- Clancey, P.A. Gamebirds of Southern Africa; Purnell: Johannesburg, South Africa, 1967. [Google Scholar]
- Clancey, P.A. On the South African races of the Crested Francolin with special reference to Francolinus sephaena zambesiae Mackworth-Praed, 1920. Bull. Br. Ornithol. Club 1967, 86, 163–165. [Google Scholar]
- Clancey, P.A. The Birds of Southern Mozambique. Volume II. Mem. Inst. Invest. Cient. Moçamb. 1980, 11, 1–379. [Google Scholar]
- Clancey, P.A. The birds of southern Africa: Subspecies and distribution. Durb. Mus. Nov. 1992, 18, 1–306. [Google Scholar]
- Collar, N.J.; Stuart, S.N. Threatened Birds of Africa and Related Islands: The ICBP/IUCN Red Data Book. Part, 1, 3rd ed.; International Council for Bird Preservation and International Union for Conservation of Nature and Natural Resources: Cambridge, UK, 1985. [Google Scholar]
- Crespo, R.; França, M.; Fenton, H.; Shivaprasad, H.L. Galliformes and Columbiformes. In Pathology of Wildlife and Zoo Animals; Academic Press: Cambridge, MA, USA, 2018; pp. 747–773. [Google Scholar] [CrossRef]
- Crowe, T.M. The evolution of guinea-fowl (Galliformes, Phasianidae, Numidinae): Taxonomy, phylogeny, speciation, and biogeography. Ann. S. Afr. Mus. 1978, 76, 43–136. [Google Scholar]
- Crowe, T.M.; Harley, E.H.; Jakutowicz, M.B.; Komen, J.; Crowe, A.A. Phylogenetic, taxonomic and biogeographical implications of genetic, morphological, and behavioral variation in francolins (Phasianidae: Francolinus). Auk 1992, 109, 3. Available online: https://digitalcommons.usf.edu/auk/vol109/iss1/3. [CrossRef]
- Crowe, T.M.; Mandiwana-Neudani, T.G.; Little, R.M.; Bowie, R.C.K. Why the taxonomy of francolins and spurfowls (Galliformes, Phasianidae) needs revision: Responses to Hustler (2021) and Hunter et al. (2021a, b). Ostrich 2022, 93, 280–291. [Google Scholar] [CrossRef]
- del Hoyo, J.; Elliott, A.; Sargatal, J. Handbook of the Birds of the World, Volume 2: New World Vultures to Guineafowl; Lynx Edicions: Barcelona, Spain, 1994. [Google Scholar]
- Endler, J.A. Geographic Variation, Speciation, and Clines; Princeton University Press: Princeton, NJ, USA, 1977; 262 pp. [Google Scholar]
- Forcina, G.; Guerrini, M.; van Grouw, H.; Gupta, B.K.; Panayides, P.; Hadjigerou, P.; Al-Sheikhly, O.F.; Awan, M.N.; Khan, A.A.; Zeder, M.A.; et al. Impacts of biological globalization in the Mediterranean: Unveiling the deep history of human-mediated gamebird dispersal. Proc. Natl. Acad. Sci. USA 2015, 112, 3296–3301. [Google Scholar] [CrossRef] [PubMed]
- Friedmann, H. Birds collected by the Childs Frick Expedition to Ethiopia and Kenya Colony. Part I: Non-Passeres. Bull. U.S. Natl. Mus. 1930, 153, 1–516. [Google Scholar] [CrossRef]
- Fuller, R.A.; Garson, P.J. Pheasants: Status Survey and Conservation Action Plan 2000–2004; IUCN: Gland, Switzerland, 2000. [Google Scholar]
- Gabriel, V.A.; Pizo, M.A. Foraging ecology of tyrant flycatchers (Aves, Tyrannidae) in Brazilian Atlantic Forest fragments. Braz. J. Biol. 2005, 65, 113–119. [Google Scholar] [CrossRef] [PubMed]
- Gamer, M.; Lemon, J.; Fellows, I.; Singh, P. irr: Various Coefficients of Interrater Reliability and Agreement. R Package Version 0.85. 2026. Available online: https://CRAN.R-project.org/package=irr.
- Geldenhuys, G.; Hoffman, L.C.; Muller, N. Gamebirds: A sustainable food source in Southern Africa? Food Sec. 2013, 5, 235–249. [Google Scholar] [CrossRef]
- Gill, F.; Donsker, D.; Rasmussen, P. IOC World Bird List (v10.2). 2020. Available online: https://doi.org/10.14344/IOC.ML.10.2 (accessed on 18 October 2020). [CrossRef]
- Gower, J.C. A general coefficient of similarity and some of its properties. Biometrics 1971, 27, 857–874. [Google Scholar] [CrossRef]
- Gwet, K.L. irrCAC: Computing Chance-Corrected Agreement Coefficients (CAC). R Package Version 1.0. 2019. Available online: https://cran.r-project.org/web/packages/irrCAC (accessed on 17 September 2026).
- Hall, B.P. The francolins: A study in speciation. Bull. Br. Mus. Nat. Hist. Zool. 1963, 10, 105–204. [Google Scholar] [CrossRef]
- Harrison, R.G.; Larson, E.L. Hybridization, introgression, and the nature of species boundaries. J. Hered. 2014, 105, 795–809. [Google Scholar] [CrossRef] [PubMed]
- Hartlaub, G. Ueber einige neue Vögel aus dem oberen Nilgebiete. J. Ornithol. 1882, 30, 321–329. [Google Scholar] [CrossRef]
- Henry, M.; Picard, N.; Trotta, C.; Manlay, R.J.; Valentini, R.; Bernoux, M.; Saint-André, L. Estimating tree biomass of sub-Saharan African forests: A review of available allometric equations. Silva Fenn. 2011, 45, 477–569. [Google Scholar] [CrossRef]
- Hockey, P.A.R.; Dean, W.R.J.; Ryan, P.G. (Eds.) Roberts—Birds of Southern Africa, 7th ed.; Trustees of the John Voelcker Bird Book Fund: Cape Town, South Africa, 2005. [Google Scholar]
- Holt, B.G.; Lessard, J.-P.; Borregaard, M.K.; Fritz, S.A.; Araújo, M.B.; Dimitrov, D.; Fabre, P.-H.; Graham, C.H.; Graves, G.R.; Jønsson, K.A.; et al. An update of Wallace’s zoogeographic regions of the world. Science 2013, 339, 74–78. [Google Scholar] [CrossRef]
- Hustler, K. Recent proposed changes to the taxonomy of spurfowl and francolins: Further commentary and concerns. Bull. Br. Orn. Club 2024, 144, 191–210. [Google Scholar] [CrossRef]
- Jarvis, A.; Reuter, H.I.; Nelson, A.; Guevara, E. Hole-filled seamless SRTM data V4. International Centre for Tropical Agriculture (CIAT). 2008.
- Jackson, F. Notes on the Game Birds of Kenya and Uganda; Williams and Norgate: London, UK, 1926. [Google Scholar]
- James, F.C. Geographic size variation in birds and its relationship to climate. Ecology 1970, 51, 365–390. [Google Scholar] [CrossRef] [PubMed]
- Jønsson, K.A.; Fjeldså, J. Determinants of avian diversification on Africa’s sky islands (Afrotropical montane regions). Biol. J. Linn. Soc. 2014, 111, 604–620. [Google Scholar] [CrossRef]
- Kearse, M.; Moir, R.; Wilson, A.; Stones-Havas, S.; Cheung, M.; Sturrock, S.; Buxton, S.; Cooper, A.; Markowitz, S.; Duran, C.; et al. Geneious Basic: An integrated and extendable desktop software platform for the organization and analysis of sequence data. Bioinformatics 2012, 28, 1647–1649. [Google Scholar] [CrossRef] [PubMed]
- Kemp, A.; Woodcock, M. The Hornbills: Bucerotiformes; Oxford University Press: Oxford, UK, USA, 1995. [Google Scholar]
- Kimball, R.T.; Guido, M.; Hosner, P.A.; Braun, E.L. When good mitochondria go bad: Cyto-nuclear discordance in landfowl (Aves: Galliformes). Gene 2021, 801, 145841. [Google Scholar] [CrossRef] [PubMed]
- Kumar, S.; Stecher, G.; Li, M.; Knyaz, C.; Tamura, K. MEGA X: Molecular evolutionary genetics analysis across computing platforms. Mol. Biol. Evol. 2018, 35, 1547–1549. [Google Scholar] [CrossRef] [PubMed]
- Lanfear, R.; Calcott, B.; Ho, S.Y.; Guindon, S. Partitionfinder: Combined selection of partitioning schemes and substitution models for phylogenetic analyses. Mol. Biol. Evol. 2012, 29, 1695–1701. [Google Scholar] [CrossRef] [PubMed]
- Little, R.; Crowe, L. Gamebirds of Southern Africa; Struik Nature: Cape Town, South Africa, 2011. [Google Scholar]
- Little, R. Gamebirds and Snipes of Africa; Jacana: Johannesburg, South Africa, 2016. [Google Scholar]
- Mackworth-Praed, C.W.; Grant, C.H.B. Systematic notes on East African birds. Part IX. J. Bombay Nat. Hist. Soc. 1936, 37, 515–528. [Google Scholar]
- Mackworth-Praed, C.W.; Grant, C.H.B. Birds of Eastern and North-Eastern Africa; Longmans: London, UK, 1962. [Google Scholar]
- Mackworth-Praed, C.W.; Grant, C.H.B. Birds of the Southern Third of Africa; Longmans: London, UK, 1962. [Google Scholar]
- Madge, S.; McGowan, P. Pheasants, Partridges, and Grouse; Christopher Helm: London, UK, 2002. [Google Scholar]
- Mahaney, W.C. Ice on the Equator: Quaternary Geology of Mount Kenya, East Africa; William Caxton Ltd.: Sister Bay, WI, USA, 1990. [Google Scholar]
- Malhi, Y.; Adu-Bredu, S.; Asare, R.A.; Lewis, S.L.; Mayaux, P. African rainforests: Past, present and future. Phil. Trans. R. Soc. B. 2013, 368, 20120312. [Google Scholar] [CrossRef] [PubMed]
- Mandiwana-Neudani, T.G.; Little, R.M.; Crowe, T.M.; Bowie, R.C.K. Taxonomy, phylogeny and biogeography of ‘true’ francolins: Galliformes, Phasianidae, Phasianinae, Gallini; Francolinus, Ortygornis, Afrocolinus gen. nov., Peliperdix, and Scleroptila spp. Ostrich 2019, 90, 191–221. [Google Scholar] [CrossRef]
- Marchant, R.; Hooghiemstra, H. Rapid environmental change in African and South American tropics around 4000 years before present: A review. Earth-Sci. Rev. 2004, 66, 217–260. [Google Scholar] [CrossRef]
- Mayr, E. Animal Species and Evolution; Belknap Press of Harvard University Press: Cambridge, MA, USA, 1963. [Google Scholar]
- McArdle, B.H.; Anderson, M.J. Fitting multivariate models to community data: A comment on distance-based redundancy analysis. Ecology 2001, 82, 290–297. [Google Scholar] [CrossRef]
- Medina, I.; Delhey, K.; Peters, A.; Cain, K.E.; Hall, M.L.; Mulder, R.A.; Langmore, N.E. Habitat structure is linked to the evolution of plumage colour in female, but not male, fairy-wrens. BMC Evol. Biol. 2017, 17, 35. [Google Scholar] [CrossRef] [PubMed]
- Miller, M.A.; Pfeiffer, W.; Schwartz, T. Creating the CIPRES Science Gateway for inference of large phylogenetic trees. In GCE; IEEE: New York, NY, USA, 2010; pp. 1–8. [Google Scholar] [CrossRef]
- Moreau, R.E. The Bird Faunas of Africa and Its Islands; Academic Press: London, UK, 1966. [Google Scholar]
- Moreau, R.E.; Pakenham, R.H.W. The birds of Zanzibar and Pemba Islands. Ibis 1941, 83, 437–452. [Google Scholar] [CrossRef]
- Mucina, L.; Rutherford, M.C. The Vegetation of South Africa, Lesotho and Swaziland; South African National Biodiversity Institute: Pretoria, South Africa, 2006. [Google Scholar]
- Nudds, R.L.; Oswald, S.A. An interspecific test of Allen’s rule: Evolutionary implications for endothermic species. Evolution 2007, 61, 2839–2848. [Google Scholar] [CrossRef] [PubMed]
- Ogilvie-Grant, W.R. A Handbook to the Game Birds; Edward Lloyd, Limited: London, UK, 1896; Volume 1. [Google Scholar]
- Paradis, E.; Schliep, K. ape 5.0: An environment for modern phylogenetics and evolutionary analyses in R. Bioinformatics 2019, 35, 526–528. [Google Scholar] [CrossRef] [PubMed]
- Pettorelli, N.; Vik, J.O.; Mysterud, A.; Gaillard, J.-M.; Tucker, C.J.; Stenseth, N.C. Using the satellite-derived NDVI to assess ecological responses to environmental change. Trends Ecol. Evol. 2005, 20, 503–510. [Google Scholar] [CrossRef] [PubMed]
- Rambaut, A.; Drummond, A.J.; Xie, D.; Baele, G.; Suchard, M.A. Posterior summarization in Bayesian phylogenetics using Tracer 1.7. Syst. Biol. 2018, 67, 901–904. [Google Scholar] [CrossRef] [PubMed]
- Roberts, A. Scientific results of the Vernay-Lang Kalahari expedition, March to September 1930. Ann. Transv. Mus. 1930, 16, 27. [Google Scholar]
- Roberts, A. The Birds of South Africa; The Trustees of the South African Bird Book Fund: London, UK, 1951. [Google Scholar]
- Salvadori, T. Uccelli dello Scioa e dell’Harar raccolti dal Dott. Vincenzo Ragazzi. Ann. Mus. Civ. Stor. Nat. Genova 1888, 26, 525–544. [Google Scholar]
- Semenov, G.A.; Linck, E.; Enbody, E.D.; Harris, R.B.; Khaydarov, D.R.; Alström, P.; Andersson, L.; Taylor, S.A. Asymmetric introgression reveals the genetic architecture of a plumage trait. Nat. Comm. 2021, 12, 1019. [Google Scholar] [CrossRef] [PubMed]
- Sinclair, I.; Ryan, P. Birds of Africa South of the Sahara; Struik Publishers: Cape Town, South Africa, 2003. [Google Scholar]
- Stamatakis, A. RAxML version 8: A tool for phylogenetic analysis and post-analysis of large phylogenies. Bioinformatics 2014, 30, 1312–1313. [Google Scholar] [CrossRef] [PubMed]
- Stevens, M.; Merilaita, S. Animal camouflage: An introduction. In Animal Camouflage: Mechanisms and Function; Stevens, M., Merilaita, S., Eds.; Cambridge University Press: Cambridge, MA, USA, 2011; pp. 1–16. [Google Scholar] [CrossRef]
- Tian, S.; Xu, J.; Li, J.; Zhang, S.; Wang, Y. Research advances of Galliformes since 1990 and future prospects. Avian Res. 2018, 9, 32. [Google Scholar] [CrossRef]
- Urban, E.K.; Fry, C.H.; Keith, S. The Birds of Africa: Volume II. Gamebirds to Pigeons; Academic Press: London, UK, 1986. [Google Scholar]
- Van Niekerk, J.H.; Megía-Palma, R.; Forcina, G. Call variation of Crested Francolin (Dendroperdix sephaena) across Africa defies the effects of spatial gradients. Ibis 2021, 163, 1409–1424. [Google Scholar] [CrossRef]
- Van Niekerk, J.H.; Megía-Palma, R.; Forcina, G. Thermoregulatory function and sexual dimorphism of the throat sack in Helmeted Guineafowl (Numida meleagris) across Africa. Avian Res. 2022, 13, 100047. [Google Scholar] [CrossRef]
- Van Someren, V.G.L. Notes on the Birds of East Africa. Novit. Zool. 1932, 29, 30–31. [Google Scholar]
- Vaughan, J.H. On the birds of Zanzibar and Pemba. Ibis 1929, 33, 577–608. [Google Scholar] [CrossRef]
- Wang, M.S.; Thakur, M.; Peng, M.S.; Jiang, Y.; Frantz, L.A.F.; Li, M.; Zhang, J.J.; Wang, S.; Peters, J.; Otecko, N.O.; et al. 863 genomes reveal the origin and domestication of chicken. Cell Res. 2020, 30, 693–701, Erratum in Cell Res. 2020, 30, 824–825. https://doi.org/10.1038/s41422-020-0380-z. [Google Scholar] [CrossRef]
- White, F. The Vegetation of Africa: A Descriptive Memoir to Accompany the UNESCO/AETFAT/UNSO Vegetation Map of Africa; UNESCO: Paris, France, 1983. [Google Scholar]
- Zink, R.M.; Barrowclough, G.F. Mitochondrial DNA under siege in avian phylogeography. Mol. Ecol. 2008, 17, 2107–2121. [Google Scholar] [CrossRef] [PubMed]
Figure 1.
Distribution of crested francolin (Ortygornis spp.) complex with historical geographic forms. The map was compiled from previous taxonomic treatments in Appendix I, museum material and georeferenced photographic records. Boundaries were defined as geographic hypotheses to structure the comparative sampling and should not be interpreted as taxonomic boundaries demonstrated by independent evidence. The outlined Ugandan region indicates the principal geographic distribution considered for ochrogaster, while the dotted southwestern region represents the historically proposed transition between zambesiae and thompsonii.
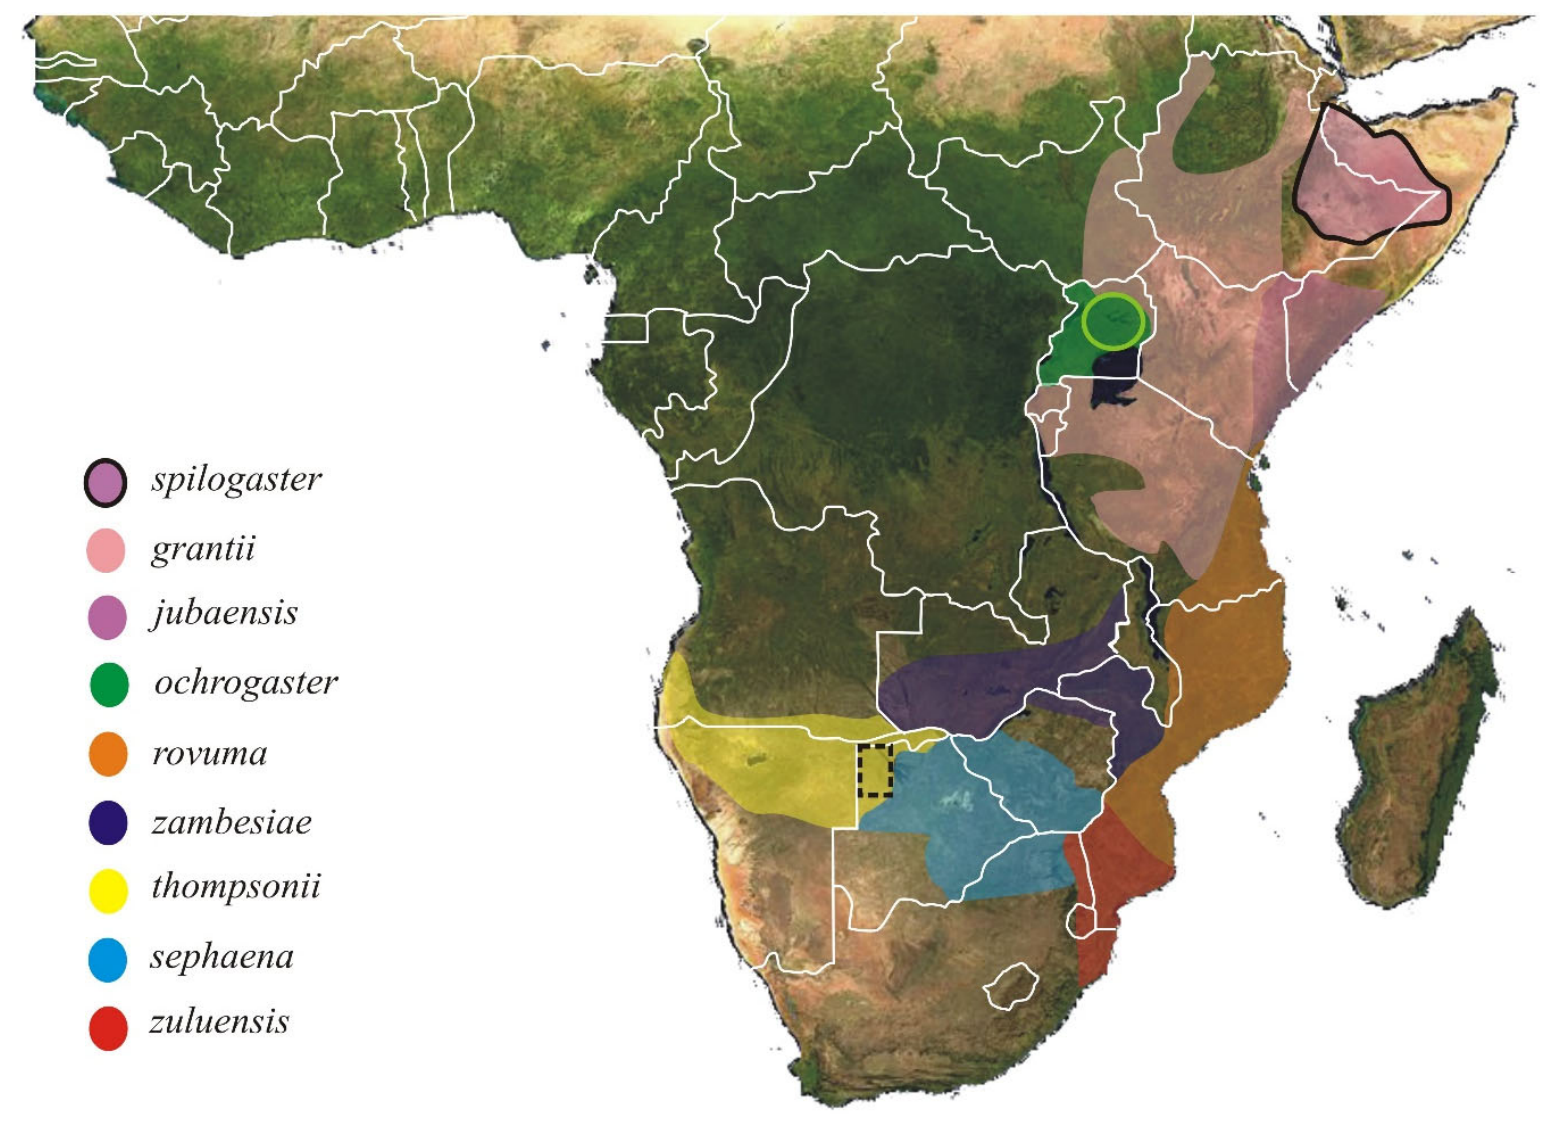
Figure 2.
Examples of geographic variation in gorget and ventral plumage patterns in eastern African crested francolins. (a). Crested francolin displaying a low gorget line (see inserted black line) and vermiculite stripes typical of populations inhabiting the savannahs south of the Zimbabwean, Zambian and Angolan moist woodlands (i.e., “southern group”). Photo credit: Antonio Ceballos Barbancho ML 615357673. (b). Crested francolin displaying a high gorget line and concentric snowflake breast markings typical of populations inhabiting the savannahs north of these woodlands (i.e., “northern group”) Photograph credit: Keith Cowton ML 613073778. (c) Crested francolin museum skins at the American Museum of Natural History (AMNH) identified by vouchers AMNH 541108, AMNH 541134, AMNH 541135, AMNH 541136, AMNH 541160 (left to right: see Table S1 further details). The two skins on the left represent spilogaster from Somalia, with small teardrop markings on their breasts that do not reach the vent. The skin on the far right is a smaller rovuma from Tanzania, with larger guttate spots that extend to the vent. The two skins in between represent intermediate forms from Somalia and labelled as rovuma and spilogaster, respectively. (d) ML509880911 (photo by Adriana Dinu), showing a strongly defined high gorget with breast markings concentrated above the gorget line; (e) ML632342487 (photo by Daniel Dankwerts), showing breast markings extending below the gorget and becoming progressively more guttate; and (f) ML205351011 (photo by David Beadle), showing disruption of the gorget boundary and elongate guttate markings extending ventrally. These examples illustrate transitions in phenotypic character states and are not interpreted independently as evidence of genetic hybridisation.
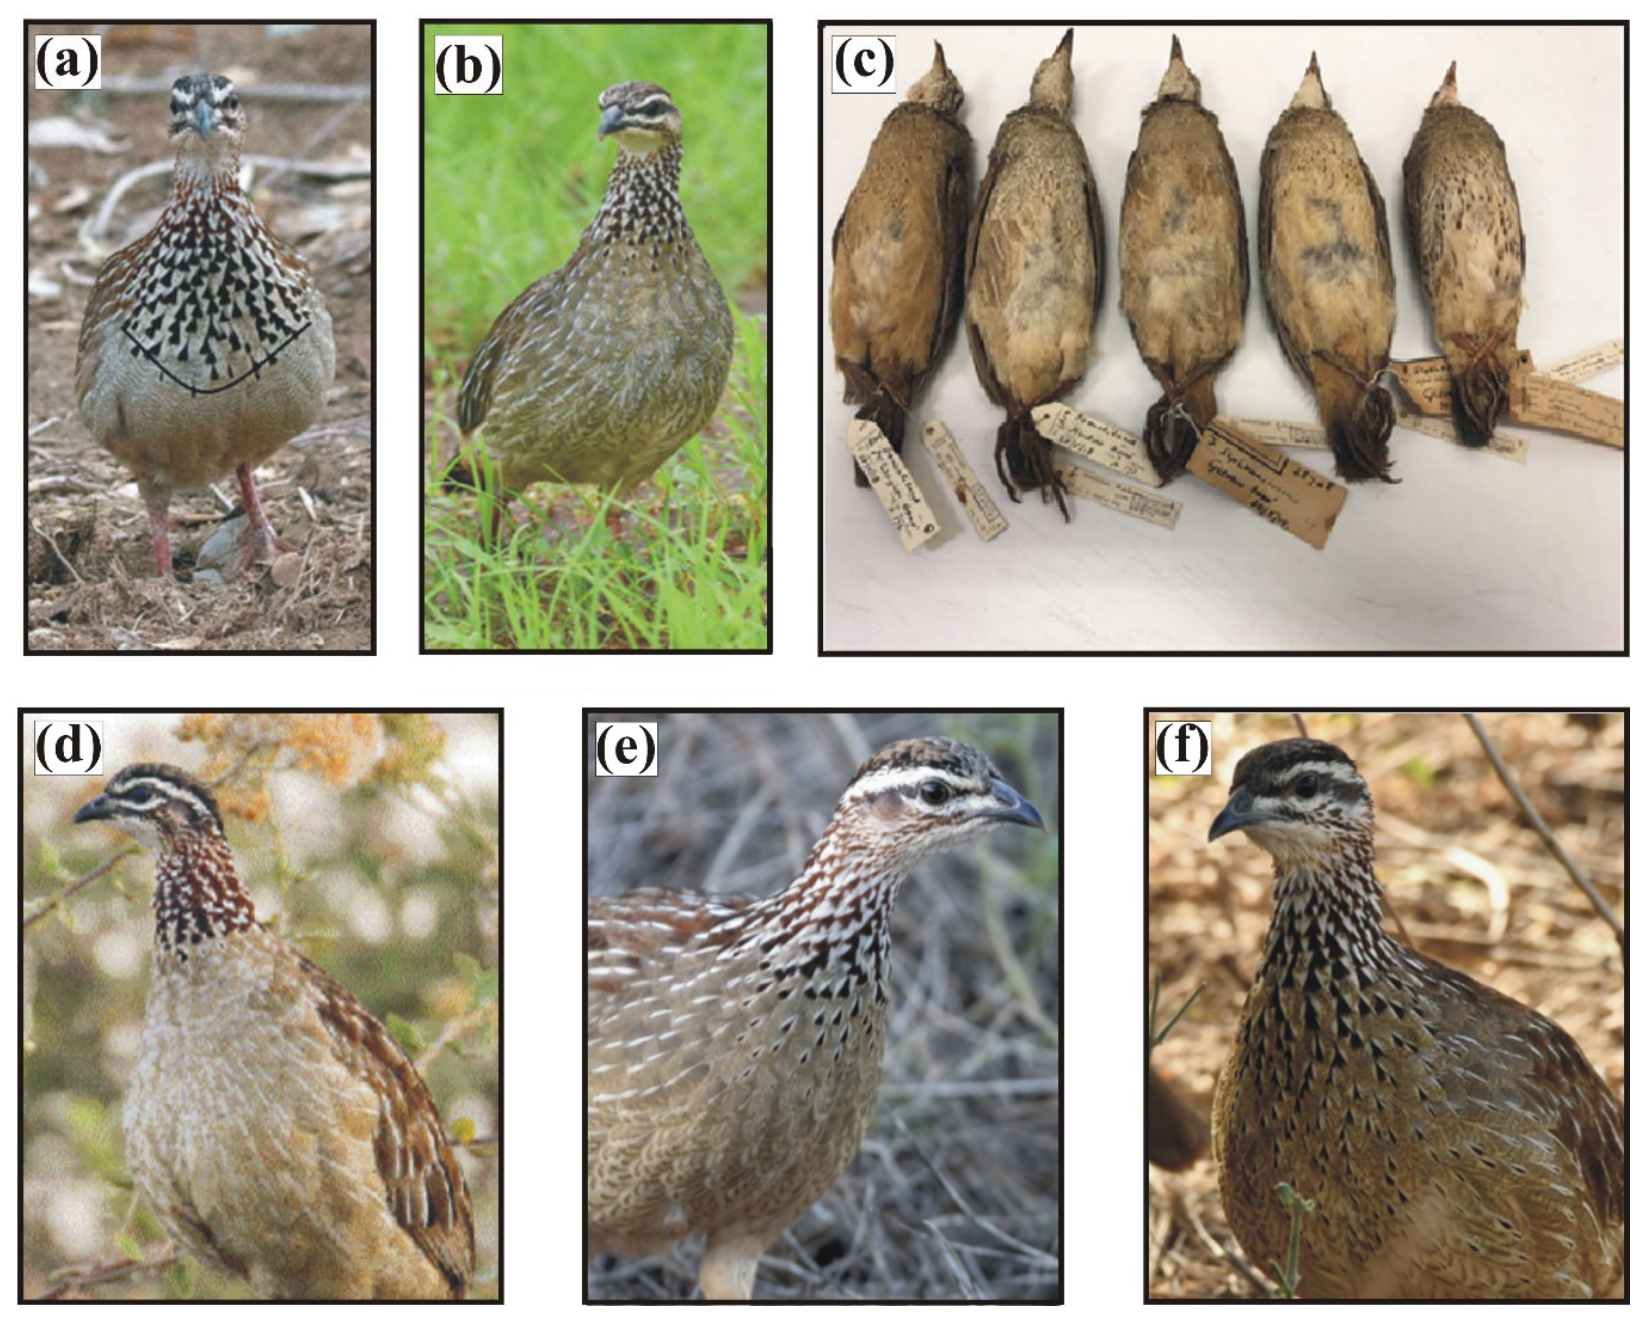
Figure 3.
Principal coordinates analysis (PCoA) of phenotypic variation among eight geographic forms of crested francolin across Africa. The analysis was based on Gower dissimilarities calculated from the four plumage characters retained following blind repeatability assessment: breast markings, gorget-line position, abdominal feather structure and abdominal colour. Small symbols represent individual records, and large crosses indicate form centroids. PCoA1 and PCoA2 accounted for 45.8% and 18.1%, respectively, of the variation represented by positive eigenvalues.
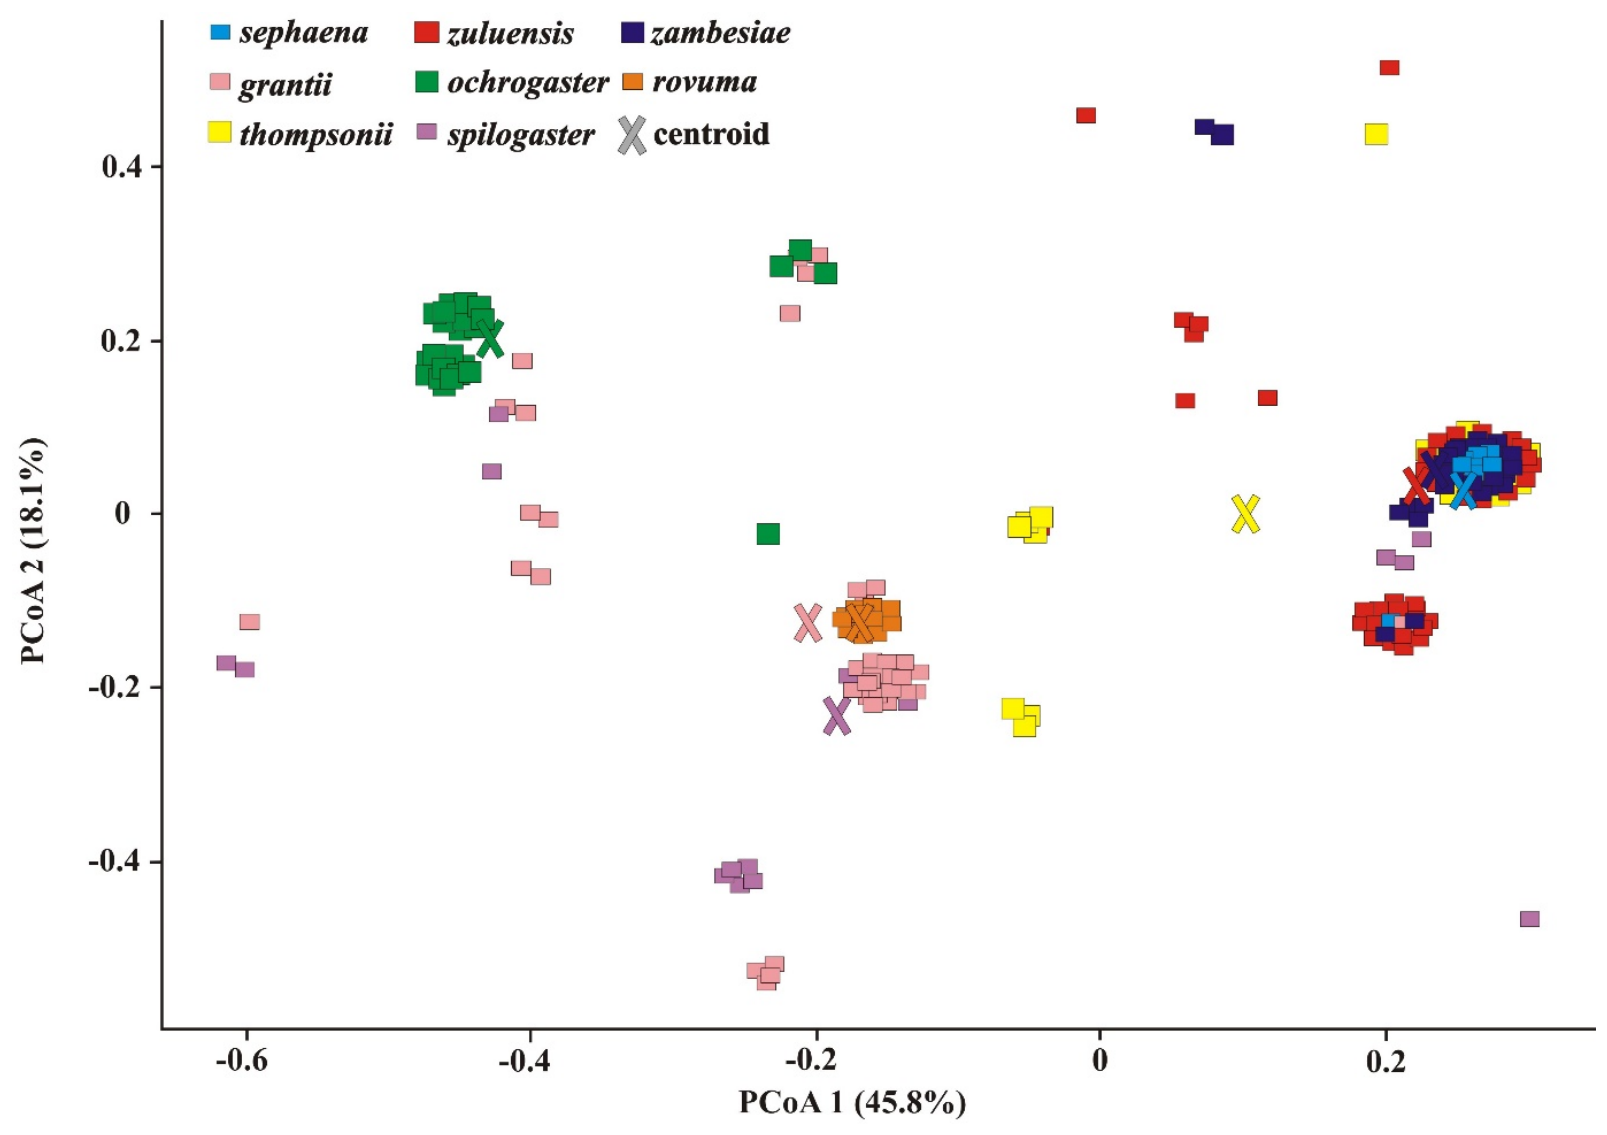
Figure 4.
Frequency of high- and low-gorget phenotypes among eight geographic taxa of crested francolins across Africa. Bars indicate the percentage of scored records exhibiting high and low gorget positions. The upper four forms represent the northeastern/eastern assemblage used in the planned regional comparison and the lower four represent the southern assemblage. The broad contrast between the two regions was highly significant (Fisher’s exact test, p = 4.56 × 10−60).
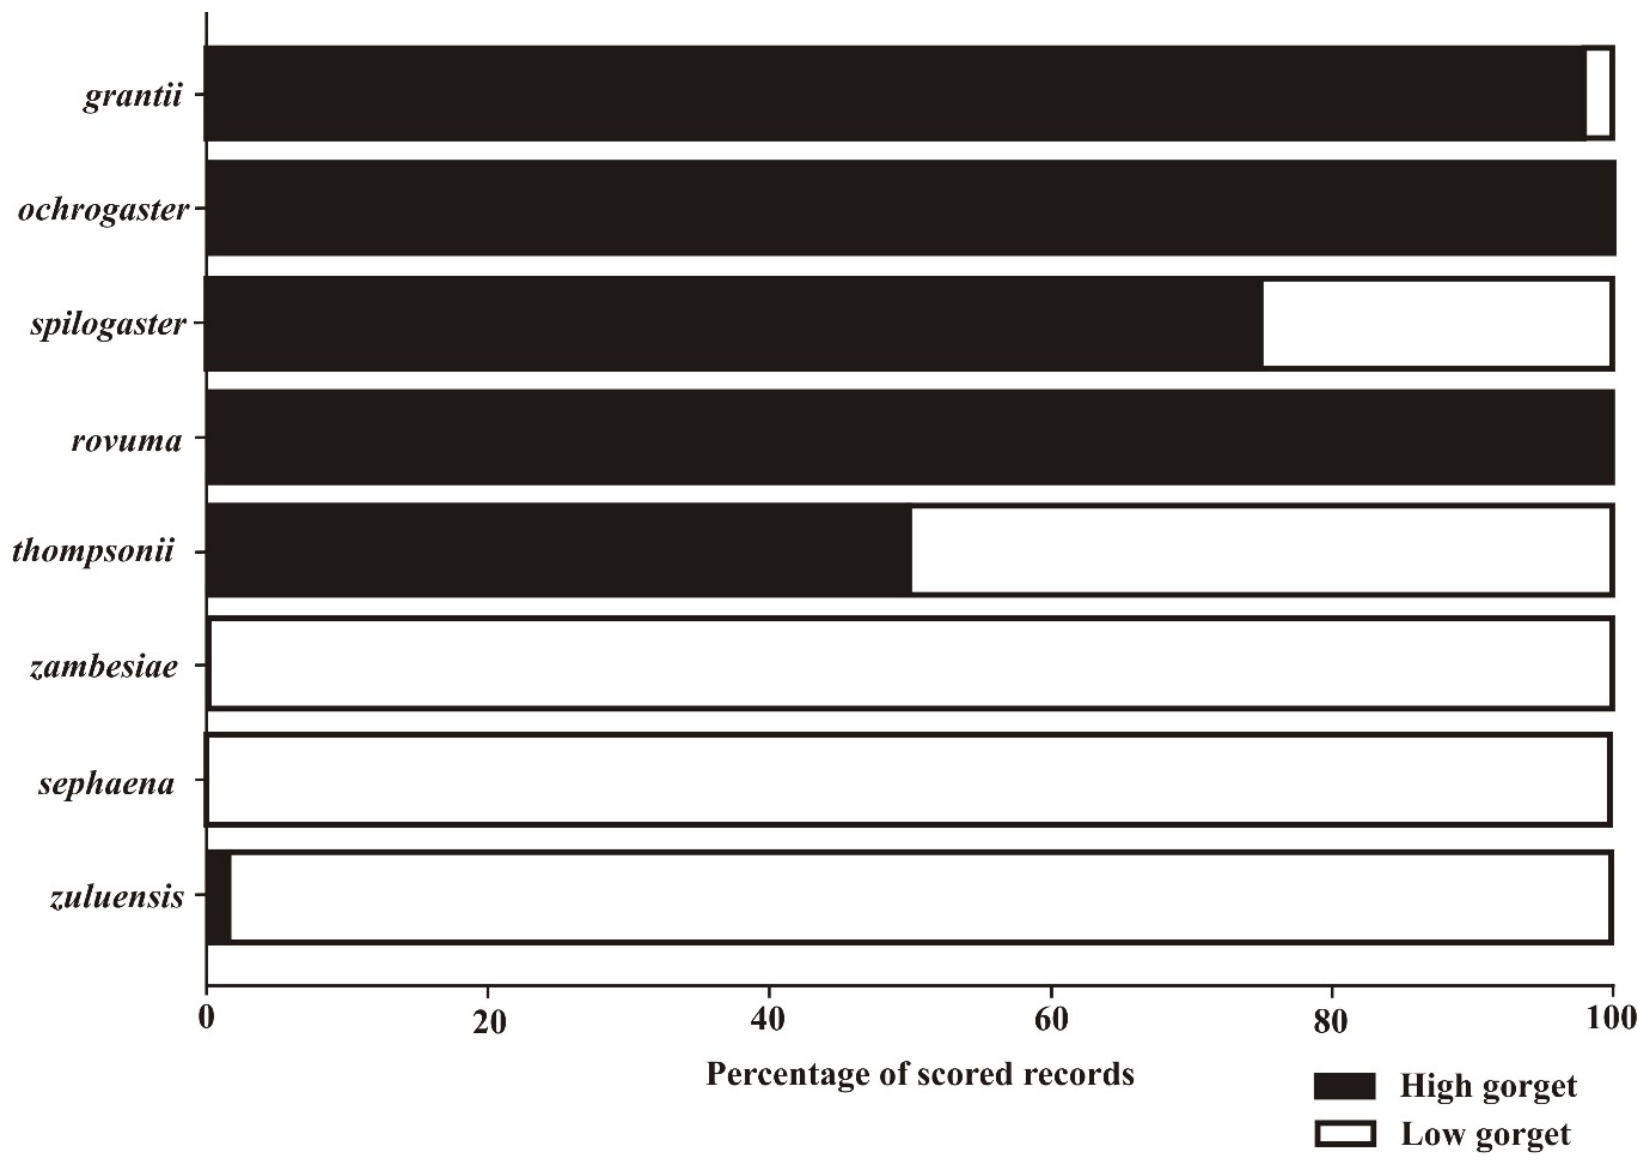
Figure 5.
Median-joining mitochondrial haplotype networks for African Crested Francolins based on (a) Control Region (CR), (b) ND2 and (c) concatenated sequences. Circle size represents the number of individuals sharing a haplotype and hatch marks indicate mutational steps. Geographic forms are distinguished according to the sampling categories used in the study. Networks are interpreted as comparative evidence of mitochondrial affinity rather than as independent delimitations of species or subspecies. (d) Maximum-likelihood mitochondrial phylogeny (CR + ND2) of crested francolin taxa.
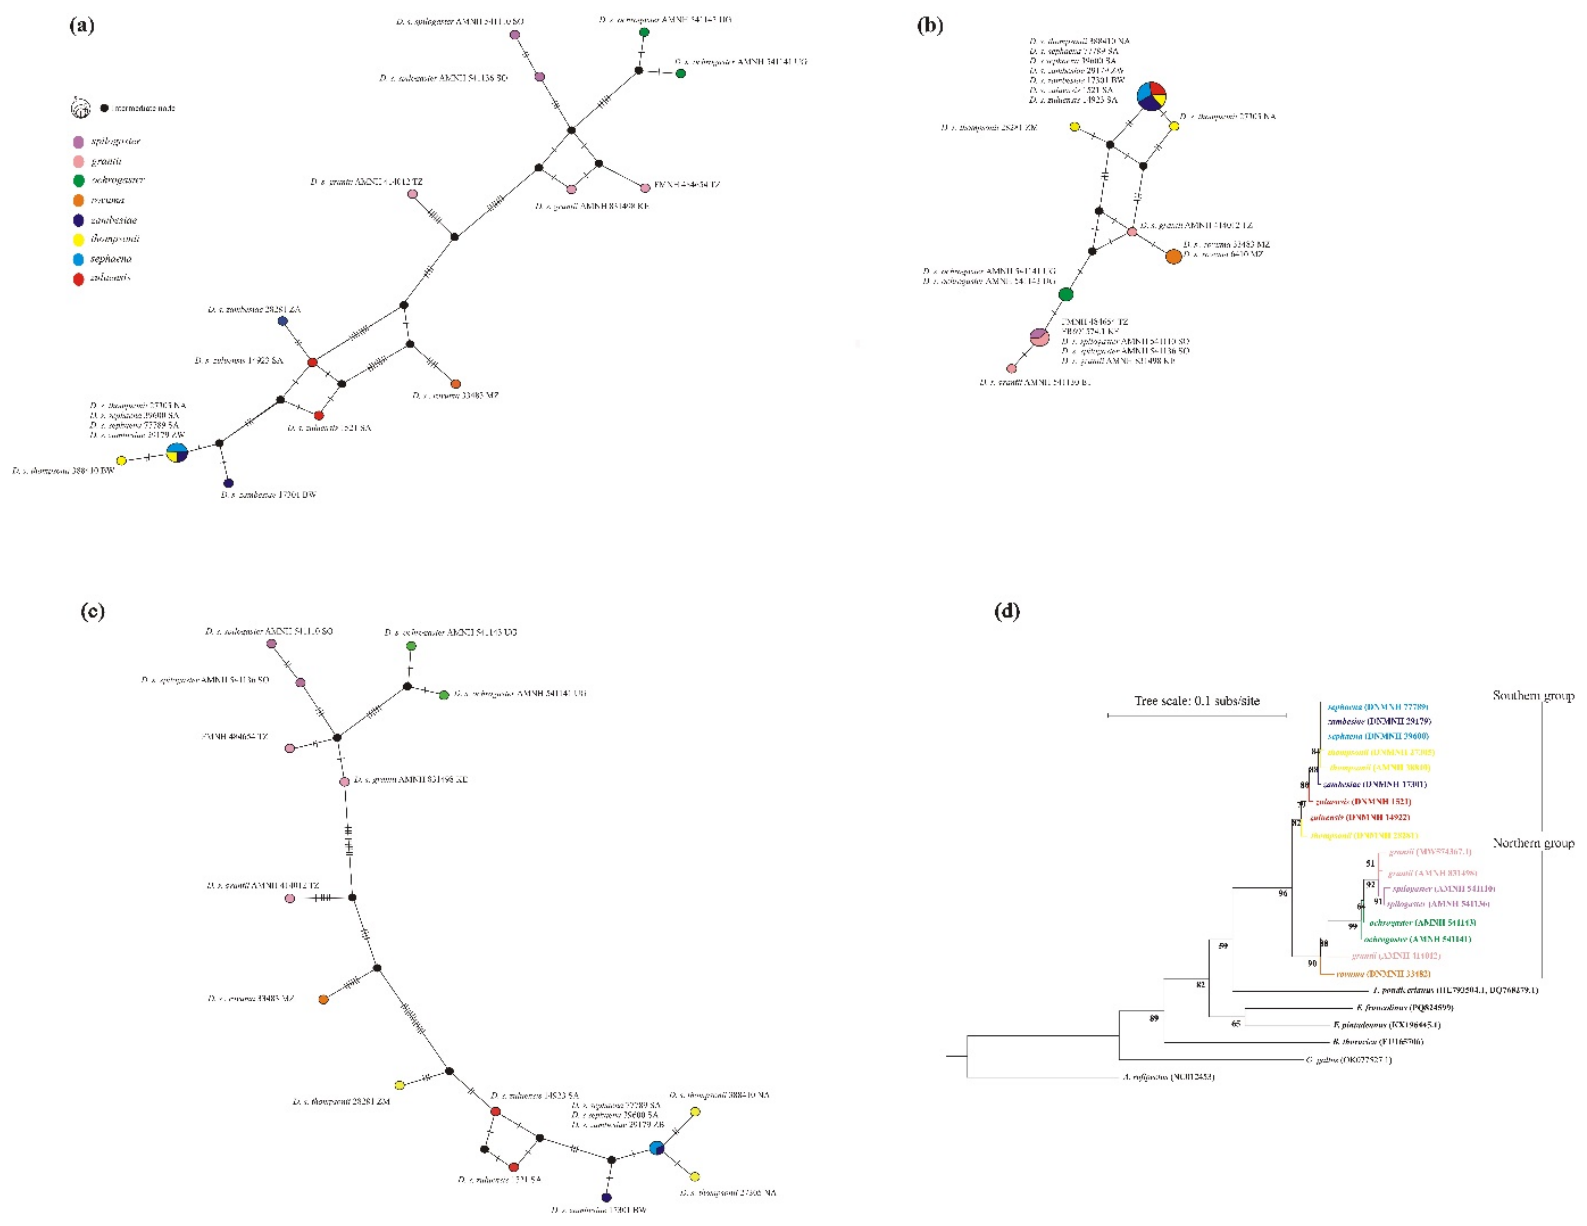

Table 1.
Intra-observer repeatability of seven plumage characters scored from 61 blinded photographic records. Observed agreement is the percentage of records assigned the same character state in the original assessment and blind rescore. Cohen’s κ provides chance-corrected agreement, while Gwet’s AC1 is reported as an additional prevalence-robust measure of agreement. The four characters retained for formal statistical inference were breast markings, gorget-line position, abdominal feather structure and abdominal colour.
| Character | Observed Agreement (%) | Cohen’s κ | Gwet’s AC1 |
|---|---|---|---|
| Breast markings | 90.2 | 0.197 | 0.888 |
| Gorget-line position | 85.2 | 0.704 | 0.708 |
| Abdominal feather structure | 72.1 | 0.604 | 0.676 |
| Abdominal colour | 73.8 | 0.395 | 0.666 |
| Lower-eye markings | 65.6 | 0.334 | 0.329 |
| Crest colour | 59.0 | 0.208 | 0.260 |
| Scapular colour | 52.5 | 0.200 | 0.343 |
Table 2.
Frequency distribution (%) of principal gorget and abdominal plumage character states among eight geographic forms of the crested francolins (Ortygornis spp.). Percentages are calculated from 272 scored photographic records. Sample sizes are given for each geographic form. Character-state definitions follow Appendices II–IX. Geographic-form names are used as analytical units and do not presuppose their taxonomic validity.
| Trait State |
grantii n = 53 |
ochrogaster n = 38 |
rovuma n = 18 |
sephaena n = 37 |
spilogaster n = 16 |
thompsonii n = 14 |
zambesiae n = 33 |
zuluensis n = 63 |
|---|---|---|---|---|---|---|---|---|
| Gorget high | 98.1 | 100.0 | 100.0 | 0.0 | 75.0 | 50.0 | 0.0 | 1.6 |
| Gorget low | 1.9 | 0.0 | 0.0 | 100.0 | 25.0 | 50.0 | 100.0 | 98.4 |
| Abdomen distinctly vermiculated | 9.4 | 7.9 | 0.0 | 83.8 | 0.0 | 100.0 | 72.7 | 65.1 |
| Abdomen scaled/snowflake | 73.6 | 0.0 | 0.0 | 16.2 | 18.8 | 0.0 | 6.1 | 31.7 |
| Abdomen plain/fine | 15.1 | 0.0 | 0.0 | 0.0 | 0.0 | 0.0 | 21.2 | 0.0 |
| Guttate to belly | 0.0 | 0.0 | 0.0 | 0.0 | 75.0 | 0.0 | 0.0 | 0.0 |
| Guttate to vent | 0.0 | 0.0 | 100.0 | 0.0 | 6.2 | 0.0 | 0.0 | 0.0 |
| Weak/fine vermiculation | 1.9 | 92.1 | 0.0 | 0.0 | 0.0 | 0.0 | 0.0 | 3.2 |
| Abdomen creamy | 73.6 | 2.6 | 100.0 | 100.0 | 75.0 | 92.9 | 93.9 | 90.5 |
| Abdomen brown wash | 13.2 | 57.9 | 0.0 | 0.0 | 6.2 | 0.0 | 6.1 | 6.3 |
| Abdomen red ochre | 13.2 | 39.5 | 0.0 | 0.0 | 18.8 | 7.1 | 0.0 | 3.2 |
Table 3.
Statistical association between geographic form and the four plumage characters retained following blind repeatability assessment. Monte Carlo chi-square probabilities were estimated using 9999 permutations. Cramér’s V indicates the magnitude of association between geographic form and character state. p-values were adjusted for multiple testing using the Benjamini–Hochberg false discovery rate procedure.
| Character | Chi-Square | df | Monte Carlo p | Cramér’s V | BH-Adjusted p |
|---|---|---|---|---|---|
| Breast markings | 87.288 | 7 | 0.0001 | 0.566 | 0.0001 |
| Gorget-line position | 238.021 | 7 | 0.0001 | 0.935 | 0.0001 |
| Abdominal feather structure | 808.874 | 35 | 0.0001 | 0.771 | 0.0001 |
| Abdominal colour | 150.363 | 14 | 0.0001 | 0.526 | 0.0001 |
Table 4.
Pairwise uncorrected mitochondrial p-distances (%) among eight geographic forms of African Crested Francolins based on the concatenated Control Region and ND2 dataset. The mitochondrial data are used as comparative evidence of geographic affinity rather than as an independent species-delimitation dataset.
| spilogaster | grantii | ochrogaster | rovuma | zambesiae | sephaena | zuluensis | thompsonii | |
| spilogaster | — | |||||||
| grantii | 1.4 | — | ||||||
| ochrogaster | 2.3 | 1.6 | — | |||||
| rovuma | 3.8 | 3.5 | 3.3 | — | ||||
| zambesiae | 4.5 | 4.2 | 4.0 | 2.1 | — | |||
| sephaena | 4.9 | 4.7 | 4.6 | 2.4 | 1.2 | — | ||
| zuluensis | 5.0 | 4.9 | 4.8 | 2.7 | 1.4 | 0.6 | — | |
| thompsonii | 5.4 | 5.3 | 5.2 | 2.9 | 1.9 | 1.7 | 1.8 | — |
Disclaimer/Publisher’s Note: The statements, opinions and data contained in all publications are solely those of the individual author(s) and contributor(s) and not of MDPI and/or the editor(s). MDPI and/or the editor(s) disclaim responsibility for any injury to people or property resulting from any ideas, methods, instructions or products referred to in the content. |
© 2026 by the authors. Licensee MDPI, Basel, Switzerland. This article is an open access article distributed under the terms and conditions of the Creative Commons Attribution (CC BY) license (http://creativecommons.org/licenses/by/4.0/).
Copyright: This open access article is published under a Creative Commons CC BY 4.0 license, which permit the free download, distribution, and reuse, provided that the author and preprint are cited in any reuse.