
Submitted:
28 September 2026
Posted:
29 September 2026
You are already at the latest version
Abstract
Azo-dye electropolymerization produces functional electrode films, but links between electrochemical activation, reactive intermediates, molecular coupling and growth remain incompletely established. A structured literature search, complemented by backward and forward tracking, yielded an audited core of 33 primary studies published between 2012 and 2026. Thirty-one include sensing or electroanalytical applications and 11 use methyl orange as a precursor; none in this core primarily targets direct removal of an azo-dye pollutant through its own electropolymerization. The evidence indicates that activation and coupling pathways depend on molecular structure, solution acidity, electrode material and polarization programme. A provisional physicochemical framework separates transport, adsorption, electrochemical activation, effective intermediates, competing reactions and material accumulation. Conservation laws are distinguished from phenomenological closures; current is not equated with polymer growth. Material-balance, mechanistic-validation and energy-efficiency criteria are proposed, together with a staged experimental roadmap toward predictive modeling and assessment of water-treatment applications.
Keywords:
electropolymerization
; azo dyes
; methyl orange
; electrochemical mechanisms
; physicochemical modeling
; water treatment
1. Introduction
Azo dyes contain one or more azo groups (–N=N–) generally conjugated with aromatic structures. Their substituents govern electronic distribution, acid–base properties and oxidation–reduction behavior, accounting for both their industrial uses and interest in their removal from water or conversion into functional materials [1]. Methyl orange is a useful case study because its molecular structure and spectroscopic response are well characterized, while its electrochemical transformations depend strongly on the medium and electrode [2,3]. Throughout this review, pH denotes the negative base-ten logarithm of hydrogen-ion activity; it is dimensionless.
Electrochemical treatment can involve direct electron transfer, reactions mediated by electrogenerated oxidants or reductants, adsorption and surface deposition. Ramírez et al. [2] investigated methyl-orange oxidation in a flow reactor with a boron-doped diamond anode. Their degradation results demonstrate transformation under the conditions studied, but loss of the precursor or its characteristic absorbance does not necessarily establish mineralization. Decolorization, chemical transformation, removal from the liquid phase and elimination of organic matter must therefore be distinguished.
Electropolymerization offers a different transformation route: electrochemical activation may generate species that undergo molecular coupling and form a material. Giribabu et al. [3] prepared poly(methyl orange) on glassy carbon for 4-nitrophenol determination, whereas Kul and Öztürk [4] studied the potential-cycling synthesis of poly(methyl red) and its dependence on solution acidity. These studies establish that some azo dyes can act as precursors to electrogenerated films. They do not establish a universal polymerization mechanism or justify transferring conditions between electrode materials.
Precursor structure is particularly important. Liv’s review of hydroxyl-containing azo-dye polymers [1] discusses electron transfer, radical formation, coupling and dye–surface interactions. Methyl orange lacks a phenolic hydroxyl group; a phenoxide-radical pathway cannot be assigned to it without a separate molecular justification. Likewise, Gooding et al. [5] showed that the reduction of Orange G and Sunset Yellow FCF depends on protonation and azo–hydrazone tautomerism, with direct reduction observed at sufficiently high pH. These findings show why voltammetric peaks cannot automatically be assigned to initiation, propagation or termination.
Film accumulation itself is ambiguous. Adsorption, deposition of transformation products, molecular immobilization and covalent polymer growth can all modify a surface. Changes in peak intensity or position can additionally reflect mass transport, capacitance, electrode accessibility or competing reactions. As emphasized by Liv [1], distinguishing immobilized dye from a polymer requires chemical and structural evidence in addition to electrochemistry. Total current can combine precursor activation, intermediate reactions, double-layer charging and film redox processes; it is not generally a direct measure of polymer-growth rate.
Connecting electropolymerization to wastewater treatment requires a further change in objective. A functional sensor film does not demonstrate effective pollutant separation. The precursor balance, soluble and insoluble products, material stability, recoverability and electrical consumption must all be established. A predictive model must therefore connect the supported chemical transformations to transport, operating conditions and independently measured amounts, rather than infer treatment performance from a useful analytical response.
This review critically examines proposed activation and coupling mechanisms for azo dyes, using methyl orange as the main comparison case. It evaluates how precursor structure, acidity, electrode material and potential programme affect interpretation; distinguishes polymerization from adsorption, deposition and degradation; and develops a provisional physicochemical framework and experimental roadmap for assessing a possible water-treatment application.
2. Review Methodology
2.1. Scope and Search Strategy
The primary corpus comprises studies in which an azo dye is directly electropolymerized, or explicitly participates as a precursor, to form a film or electrogenerated material. Studies in which the dye is only an analyte, template, dopant, adsorbate or degradation substrate are outside this operational scope. The distinction matters because searches for electropolymerization also retrieve polymers made from unrelated monomers.
The reported search cutoff was 22 September 2026. Public academic sources and publisher pages were supplemented by backward and forward reference tracking, using recent reviews as starting points [1,6,7]. Generic queries combined electropolymer*, electro-polymer* or electrooxidative polymerization with azo-dye terms and individual names: methyl orange, methyl red, Congo red, Sunset Yellow, Eriochrome Black T, Evans Blue, Bismarck Brown, Orange G, Sudan III, Acid Red 176 and Allura Red. Names were added iteratively when identified in reference tracking.
2.2. Selection Criteria and Information Extraction
Inclusion required an identifiable electrochemical material-formation procedure, sufficient bibliographic information to distinguish the study, and a description of formation, characterization or use of the resulting material. Studies treating the dye solely as an analyte, molecular-imprinting template, dopant or adsorbate, and degradation studies without a material attributed to electropolymerization, were excluded. Reviews guided study identification but were not counted as primary records.
Duplicates were checked by title and digital object identifier (DOI). Extracted fields, where available, were publication year, dye, electrode or support, synthesis method, polarization conditions, characterization, application and type of mechanistic evidence. Missing experimental conditions were not inferred.
2.3. Audited Corpus and Coverage Limitations
The resulting core contains 33 primary studies published between 2012 and 2026. It is a descriptive evidence map, not a universal bibliometric census. A separate landscape search identified additional studies outside the frozen candidate set, and the search did not include authenticated, exhaustive exports from Scopus or Web of Science. The reported counts are therefore restricted to the audited core; complete database reconciliation and deduplication remain coverage checks rather than demonstrated properties of the search.
Of the 33 studies, 31 include sensing or electroanalysis and 11 use methyl orange as a film precursor. No study in this core primarily aimed to remove the pollutant directly through electropolymerization of the dye itself. This is a corpus-specific observation, not proof that no such study exists elsewhere. Table 1 provides a representative selection; Supplementary Table S1 supplies the complete 33-study corpus with titles, applications and identifiers.
2.4. Manuscript Preparation
OpenAI Codex (GPT-6) assisted with manuscript organization, English-language revision, LaTeX preparation, conceptual diagrams and notation checks. A local Spanish-to-English translation model from Argos Translate (package version 1.9) assisted an initial language pass, followed by substantive revision. Published experimental panels were extracted and proportionally arranged without generating or altering experimental curves or micrographs. These tools are not sources of experimental evidence and are not authors of the review.
3. Chemical and Electrochemical Fundamentals
3.1. Molecular Structure and Electronic Properties
An azo group is part of a larger conjugated system whose electron-donating and electron-withdrawing substituents affect optical properties, acid–base behavior and possible reaction sites [1]. Methyl orange, sodium 4-[(4-dimethylaminophenyl)diazenyl]benzenesulfonate, contains two aromatic rings connected by the azo linkage, a dimethylamino group and a sulfonate group. The dimethylamino group contributes electron donation and the sulfonate group favors aqueous solubility; protonation changes the electronic structure [17].
Electron transfer need not occur exclusively at the azo linkage. A peak does not by itself identify the molecular activation site: substituent effects, protonation, products and subsequent reactions must be considered [1,3]. An activated species also need not undergo intermolecular coupling. Polymer growth requires compatible reactivity and formation of new bonds between precursor-derived units; a conjugated aromatic structure alone does not guarantee electropolymerization.
3.2. Acid–Base Equilibria and Methyl-Orange Tautomerism
Protonation and tautomerism alter both electron distribution and absorption. Tawarah and Abu-Shamleh [17] used ultraviolet–visible spectroscopy to study methyl orange and methyl yellow at different acidities. They reported for methyl orange under their experimental conditions, where and is the dimensionless acid-dissociation constant on an activity basis. They also identified coexisting tautomers and a shift toward an azonium form as hydrochloric-acid concentration increased. Such changes do not necessarily imply irreversible degradation or polymerization.
For a simplified single acid–base equilibrium, let the protonated methyl-orange form be HMO and its conjugate base be MO−:
This representation does not resolve all protonation states or tautomers. The corresponding Henderson–Hasselbalch relation is
where and are dimensionless activities. Concentration ratios approximate activity ratios only under an appropriate activity-coefficient assumption. Supporting-electrolyte concentration and ionic strength can separate apparent constants from thermodynamic ones.
Different acid–base forms can have different surface affinities and reactivities, but protonation does not automatically make the dye more polymerizable. Moreover, an absorbance change caused by protonation or tautomerism can resemble concentration loss when a single wavelength is monitored without controlling sample chemistry. Removal studies must distinguish reversible spectral changes from irreversible transformation, particularly across different pH conditions [17].
3.3. Reduction of the Azo Group
Reduction can involve proton-coupled electron transfer, a change in nitrogen–nitrogen bond order, hydrazo-type species and subsequent azo-linkage cleavage. The sequence and intermediate stability are system-specific [5]. Using a mercury-coated rotating disk electrode, Gooding et al. studied Orange G and Sunset Yellow FCF and proposed protonation before electron transfer, through an intermolecular pathway or intramolecular azo–hydrazone tautomerism. At sufficiently high pH they observed direct reduction.
These results show that a voltammetric response depends on chemical speciation and the supply of reducible species as well as electron-transfer kinetics. They cannot be transferred unchanged to methyl orange: suitably positioned hydroxyl groups permit intramolecular pathways unavailable to a precursor without them. Reduction may compete with material formation, and alternating potentials may change the intermediate population. A reductive pulse must not be called a propagation or regeneration step without chemical and electrochemical evidence.
3.4. Oxidation and Formation of Reactive Species
Oxidation may generate species that subsequently undergo functional-group transformation, bond cleavage, coupling or deposition. Liv [1] discusses radical and coupling pathways for hydroxyl-containing azo dyes, whereas Ramírez et al. [2] demonstrate a degradation route for methyl orange on boron-doped diamond. These are different possible outcomes of electrochemical activation.
The importance of each pathway depends on potential, electrode and medium. Cyclic voltammetry locates electrochemical processes but does not uniquely identify their products. Evidence of polymerization must go beyond formation of a reactive species and support new inter-unit bonds and a material consistent with the proposed polymeric structure.
3.5. Interactions with the Electrode Surface
Aromatic dyes can interact with graphitic domains; electrostatic forces and, where functional groups permit, hydrogen bonding may also contribute [1]. Adsorption changes local availability without necessarily increasing polymer growth: retained molecules may remain unchanged or form nonpolymeric products. In porous carbons, increased internal area coexists with transport limitations, nonuniform accessibility and progressive product accumulation.
Film formation on glassy carbon [3] therefore cannot be extrapolated directly to graphite felt or other porous supports without considering geometry, accessible area and species distributions. Adsorption is a potentially relevant step, not independent proof of electropolymerization.
3.6. Implications for Mechanistic Interpretation
Precursor structure, protonation, potential and surface interactions jointly determine the possible transformations. The literature establishes preparation of materials derived from methyl orange and other azo dyes [1,3,4], but not one mechanism applicable to the entire family. Voltammetric evolution and film accumulation must be assessed together with product chemistry, dissolved species and operating conditions. The next section separates supported observations from proposed activation, coupling and growth pathways.
4. Mechanisms of Azo-Dye Electropolymerization
4.1. General Considerations
Electropolymerization can involve precursor activation, reactive intermediates, intermolecular coupling and accumulation on an electrode. These stages provide an analytical framework, not a universal or necessarily irreversible sequence. Protonation and competing oxidation, reduction and cleavage can share intermediates with a proposed growth pathway. Liv [1] particularly distinguishes immobilization of dye molecules from covalent material growth.
Figure 1 summarizes the alternative destinations of an activated precursor. The purpose is to separate chemical transformation, adsorption and material formation before interpreting a change in current or color.
The relative contribution of each branch requires controls and material balances. Neither accumulation nor decolorization alone identifies molecular coupling.
4.2. Precursor Adsorption and Electrochemical Activation
Adsorption may bring precursor molecules close to the electrode–solution interface through aromatic, electrostatic or hydrogen-bonding interactions [1]. It changes local concentration and can affect electron-transfer rates, but adsorbed dye may remain unreacted, desorb reversibly or undergo nonpolymerizing transformations. Adsorption is therefore system-dependent rather than an obligatory polymerization step.
At a suitable potential, electron transfer can generate reactive species whose subsequent behavior depends on electronic structure, protonation and the medium. Their ability to couple competes with other transformations. Adsorption and activation signals can overlap double-layer charging and other redox processes. Interpretation requires the dye-free electrode response, precursor behavior in solution and the evolution under the applied potential programme; an oxidation peak cannot distinguish these contributions by itself.
4.3. Reactive Intermediates and Molecular Coupling
For hydroxyl-containing azo dyes, proposed pathways involve functional-group oxidation and reactive centers whose positions depend on precursor structure [1]. Methyl orange contains dimethylamino and sulfonate groups but no phenolic hydroxyl group. A pathway based specifically on phenolic oxidation cannot be assigned to it without a separate structural justification.
The existence of a reactive intermediate does not identify the atoms forming new bonds, the repeating-unit connectivity or the molecular-weight distribution. Several reactive positions could produce different structures. Likewise, representing coupling as a reaction between precursor-derived species does not prove an elementary second-order step or coupling exclusively between identical intermediates. Formation rate can depend on intermediate generation and lifetime, transport and available surface sites; activation and incorporation must remain conceptually distinct.
4.4. Comparative Mechanistic Evidence Across Azo Dyes
Acar et al. [9] compared Lanaset Red 2B, Acid Blue 113 and Acid Yellow 17 on a bentonite-modified carbon paste electrode. From cyclic voltammetry and Fourier-transform infrared spectroscopy, they proposed electro-oxidative pathways involving azo/hydrazone-derived intermediates. Because the comparison includes hydroxylated and nonhydroxylated precursors, phenolic hydroxyl groups may facilitate particular radical pathways but are not a universal condition for observing an electrogenerated film.
Figure 2 compares individual dyes with binary and ternary mixtures under the same protocol. In A, original labels a–c identify the individual dyes and d–f the mixtures. B uses the same labels for spectra after ten scans, allowing electrochemical evolution to be related to chemical changes in material retained on the electrode.
Figure 2.
Electro-oxidative polymerization on a bentonite-modified carbon paste electrode (BentMCPE). (A)
Consecutive cyclic voltammograms in 1.0 × 10⁻⁴ mol L−1 dye, 100 mV s−1, 0–1.2 V vs. saturated calomel electrode
(SCE). Labels: a, Lanaset Red 2B (LR2B); b, Acid Blue 113 (AB113); c, Acid Yellow 17 (AY17); d, LR2B–AB113; e,
LR2B–AY17; f, LR2B–AB113–AY17. Reproduced from Acar et al. [9], Figure 8; layout adapted. © 2015 Elsevier B.V.
Figure 2.
Electro-oxidative polymerization on a bentonite-modified carbon paste electrode (BentMCPE). (A)
Consecutive cyclic voltammograms in 1.0 × 10⁻⁴ mol L−1 dye, 100 mV s−1, 0–1.2 V vs. saturated calomel electrode
(SCE). Labels: a, Lanaset Red 2B (LR2B); b, Acid Blue 113 (AB113); c, Acid Yellow 17 (AY17); d, LR2B–AB113; e,
LR2B–AY17; f, LR2B–AB113–AY17. Reproduced from Acar et al. [9], Figure 8; layout adapted. © 2015 Elsevier B.V.
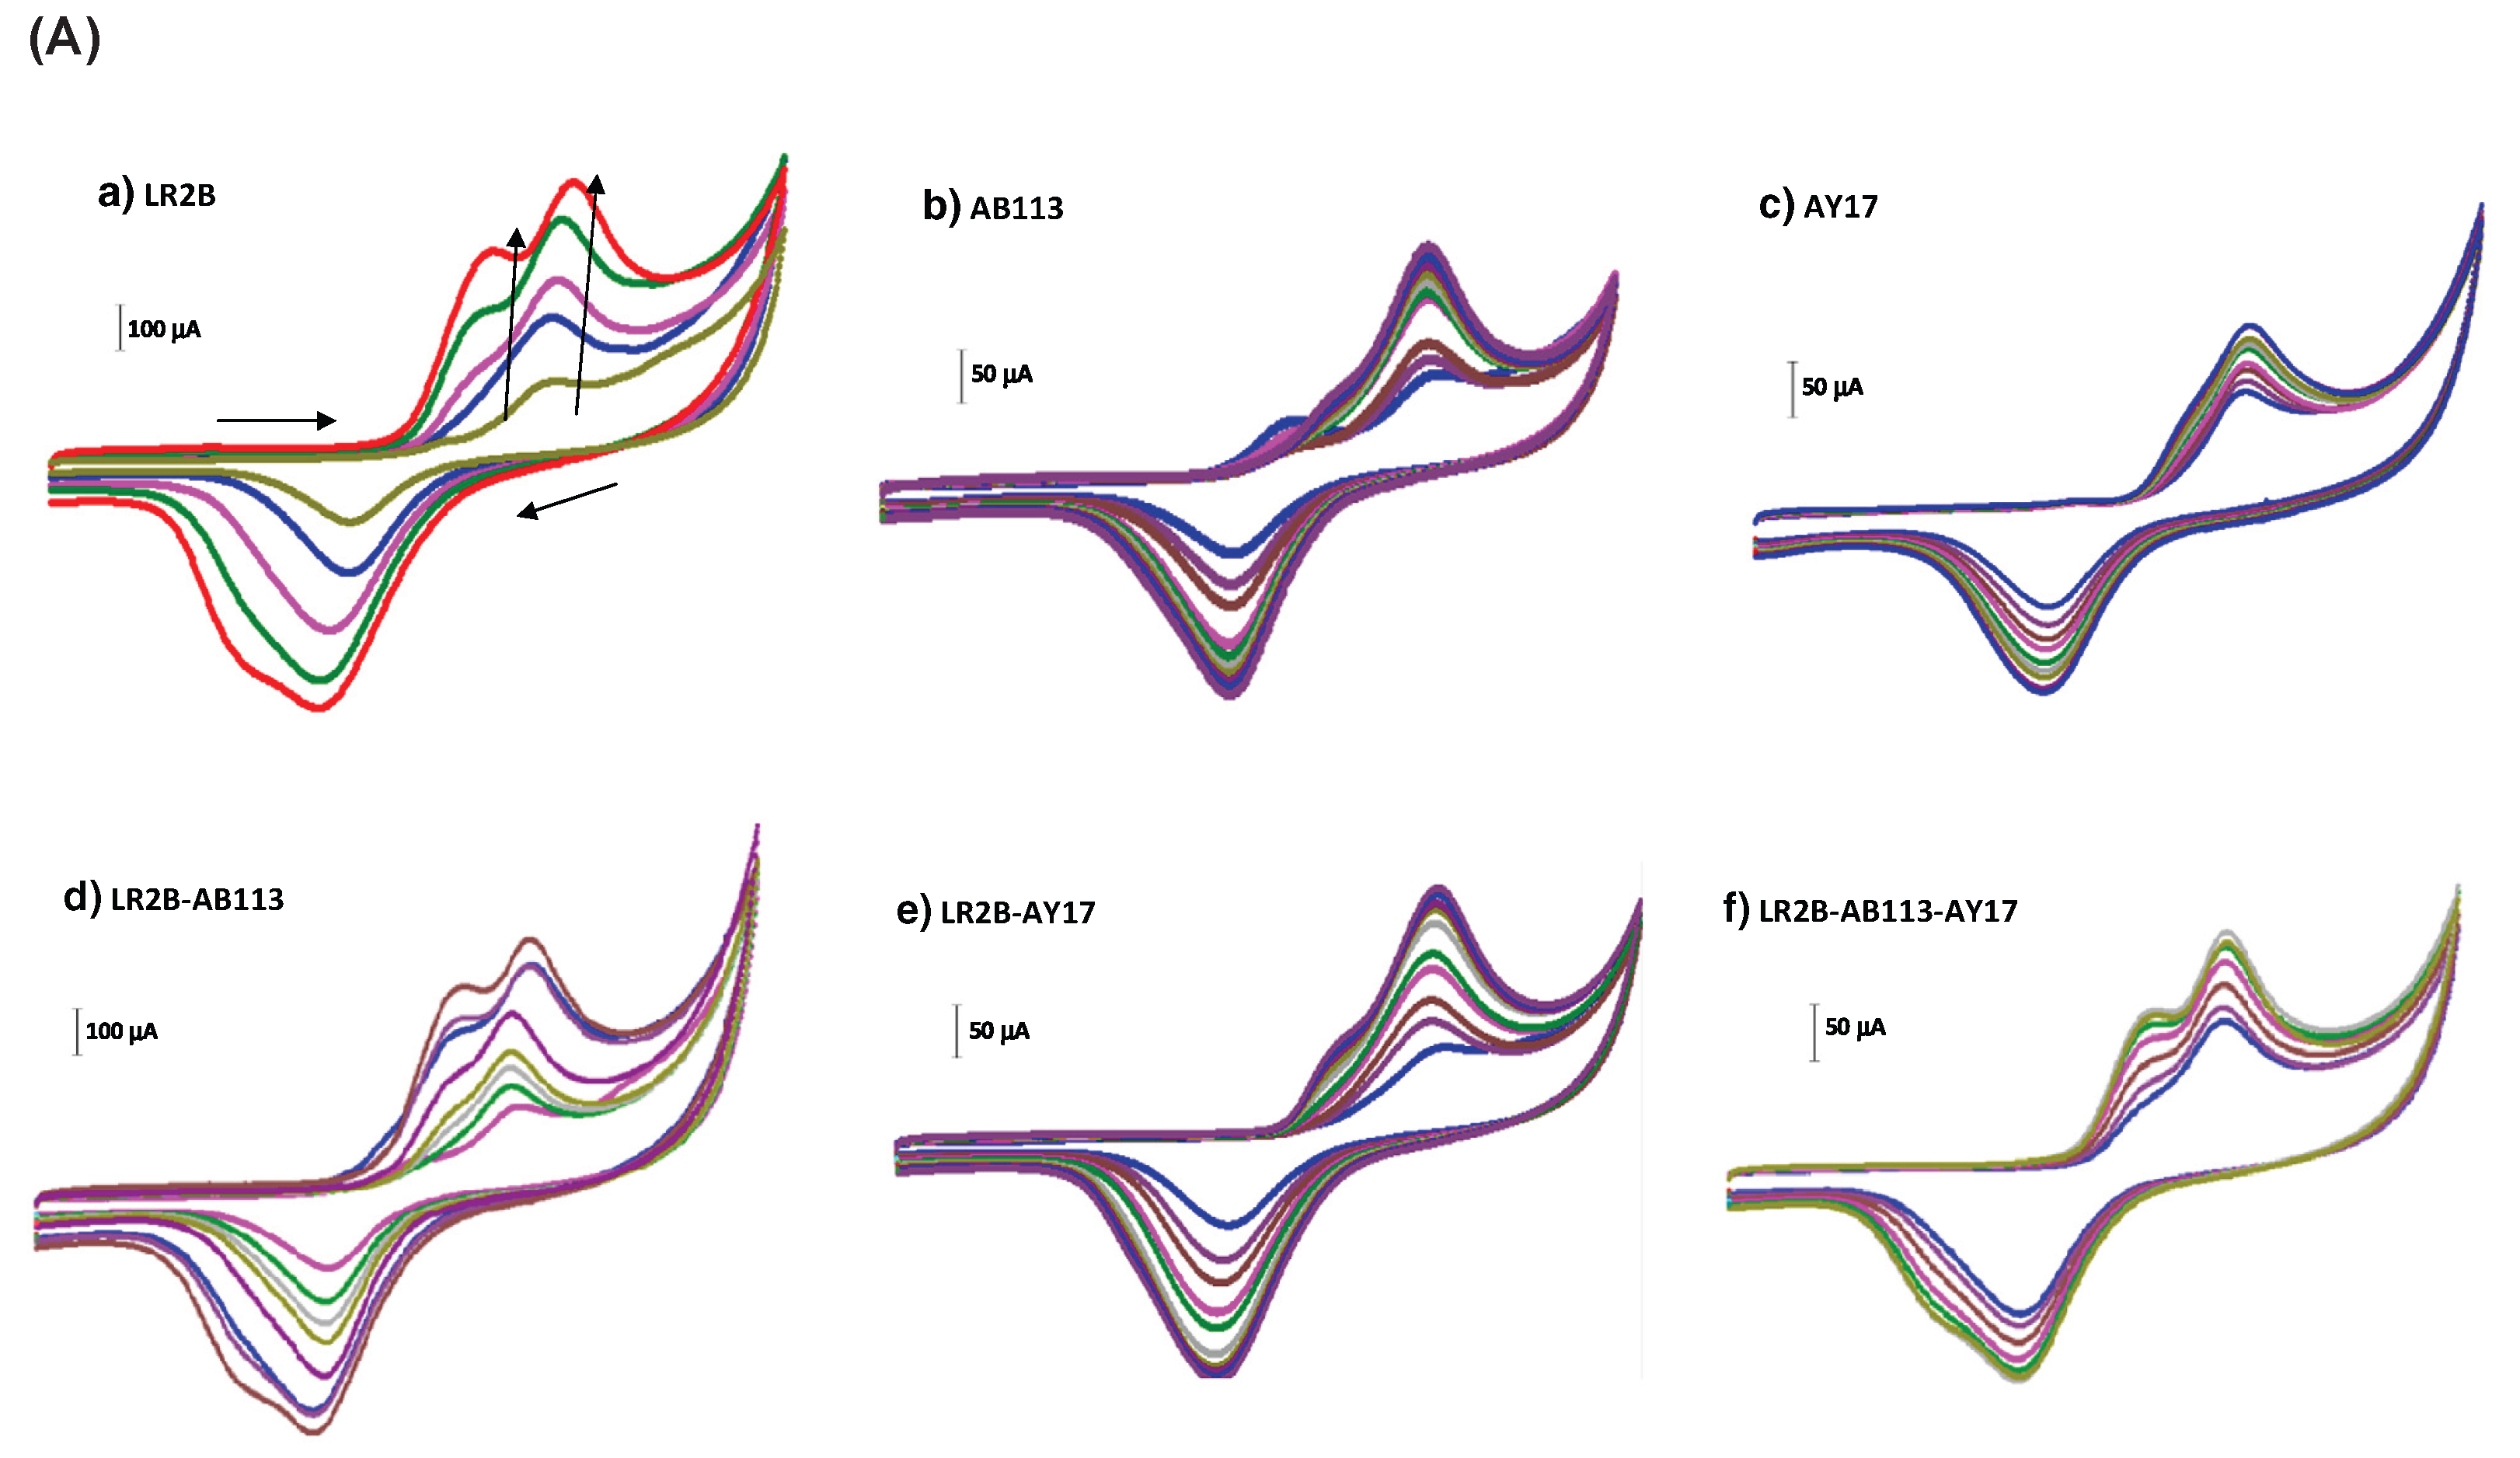
Figure 2.
Cont. (B) Fourier-transform infrared (FTIR) spectra of a bentonite-modified carbon paste electrode (BentMCPE) after ten scans. Labels: a, Lanaset Red 2B (LR2B); b, Acid Blue 113 (AB113); c, Acid Yellow 17 (AY17); d, LR2B–AB113; e, LR2B–AY17; f, LR2B–AB113–AY17. Reproduced from Acar et al. [9], Figure 9; layout adapted without changing spectra. © 2015 Elsevier B.V.
Figure 2.
Cont. (B) Fourier-transform infrared (FTIR) spectra of a bentonite-modified carbon paste electrode (BentMCPE) after ten scans. Labels: a, Lanaset Red 2B (LR2B); b, Acid Blue 113 (AB113); c, Acid Yellow 17 (AY17); d, LR2B–AB113; e, LR2B–AY17; f, LR2B–AB113–AY17. Reproduced from Acar et al. [9], Figure 9; layout adapted without changing spectra. © 2015 Elsevier B.V.
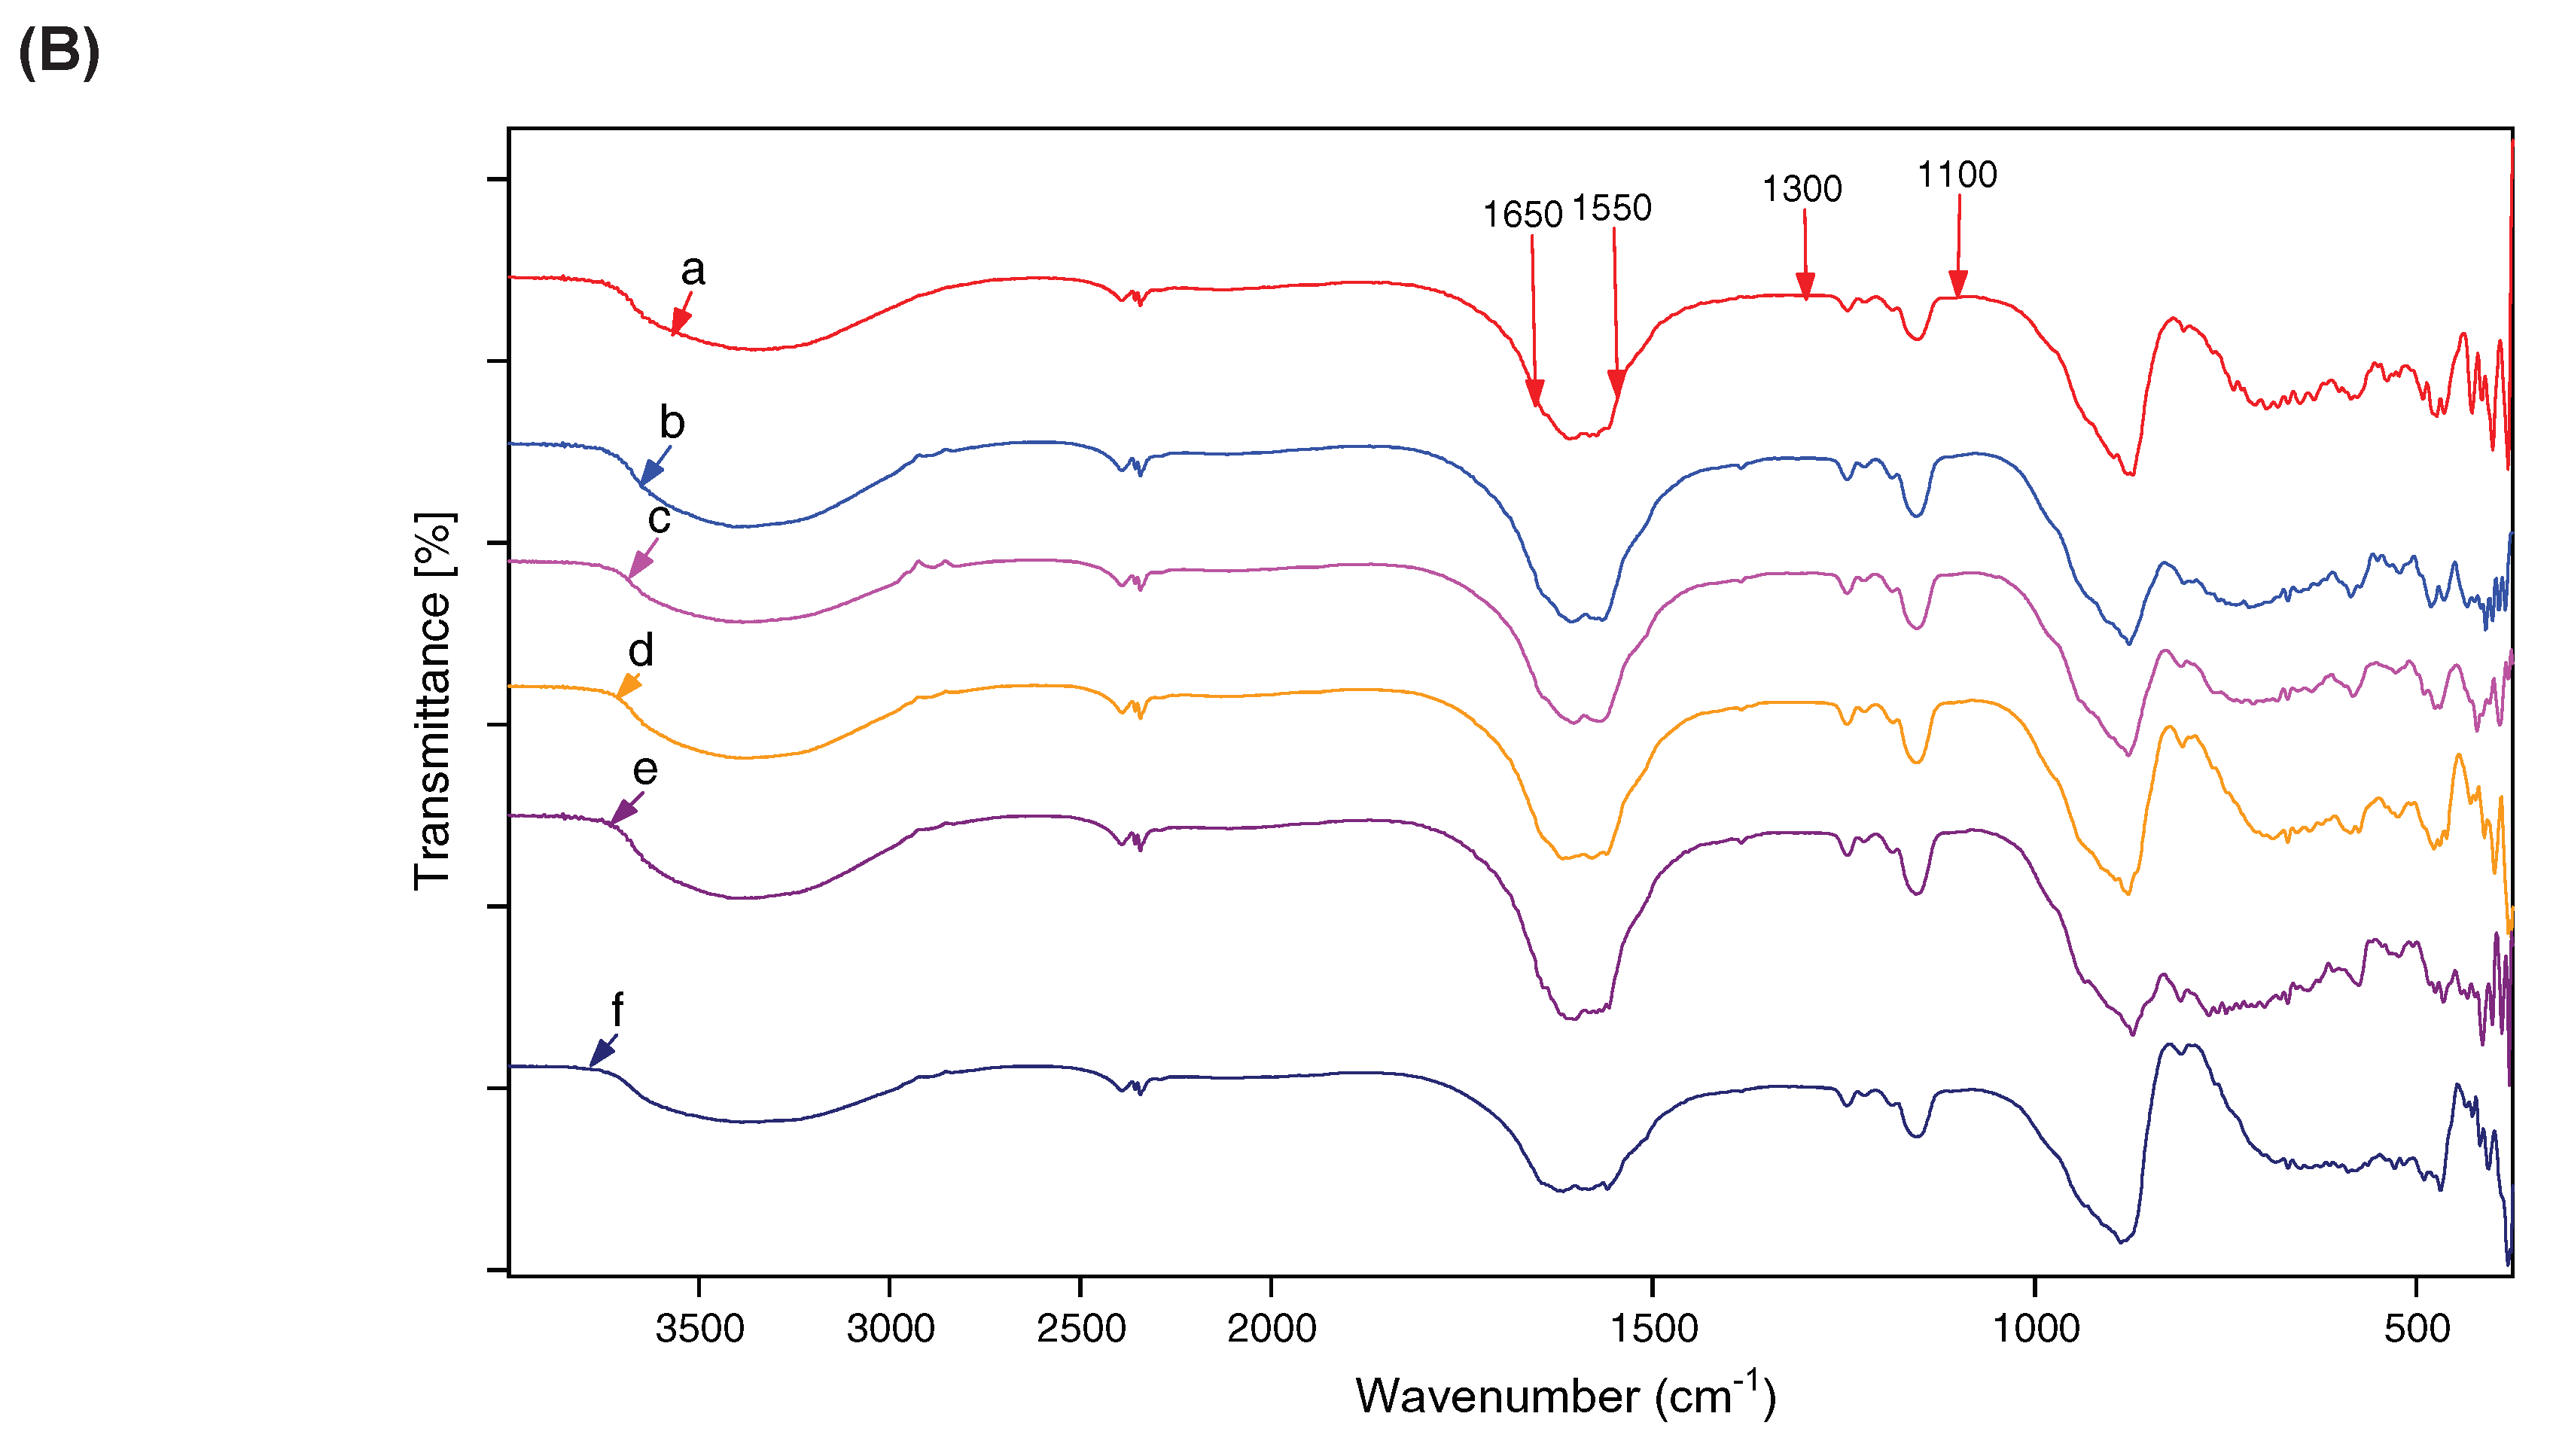
The authors interpreted increasing anodic intensities as consistent with electro-oxidative material formation. Differences between individual dyes and mixtures indicate sensitivity to precursor identity and mixture composition. Voltammetry establishes electrochemical evolution and infrared spectroscopy adds chemical information, but neither uniquely resolves inter-unit connectivity or molecular-weight distribution.
Bismarck Brown Y presents a different case because it contains terminal amino groups. Teixeira et al. [10] combined electrochemistry, optical spectroscopy, impedance and microscopy to characterize its conjugated film. Olean-Oliveira et al. [12] subsequently examined a poly(Bismarck Brown Y)/reduced-graphene-oxide composite and proposed terminal-amino oxidation, radical-cation coupling and propagation. These proposals remain specific to the precursor and support.
Figure 3 connects potential cycling on fluorine-doped tin oxide with morphology after 50 and 100 cycles. It tests whether the electrochemical history accompanies a change in film organization rather than treating current alone as a growth measurement.
Repeated cycling produces an evolving redox response. The authors described a porous texture after 50 cycles and a denser layer after 100 cycles. This supports progressive surface modification, but microscopy cannot identify propagation bonds and current cannot be directly equated with polymer-growth rate.
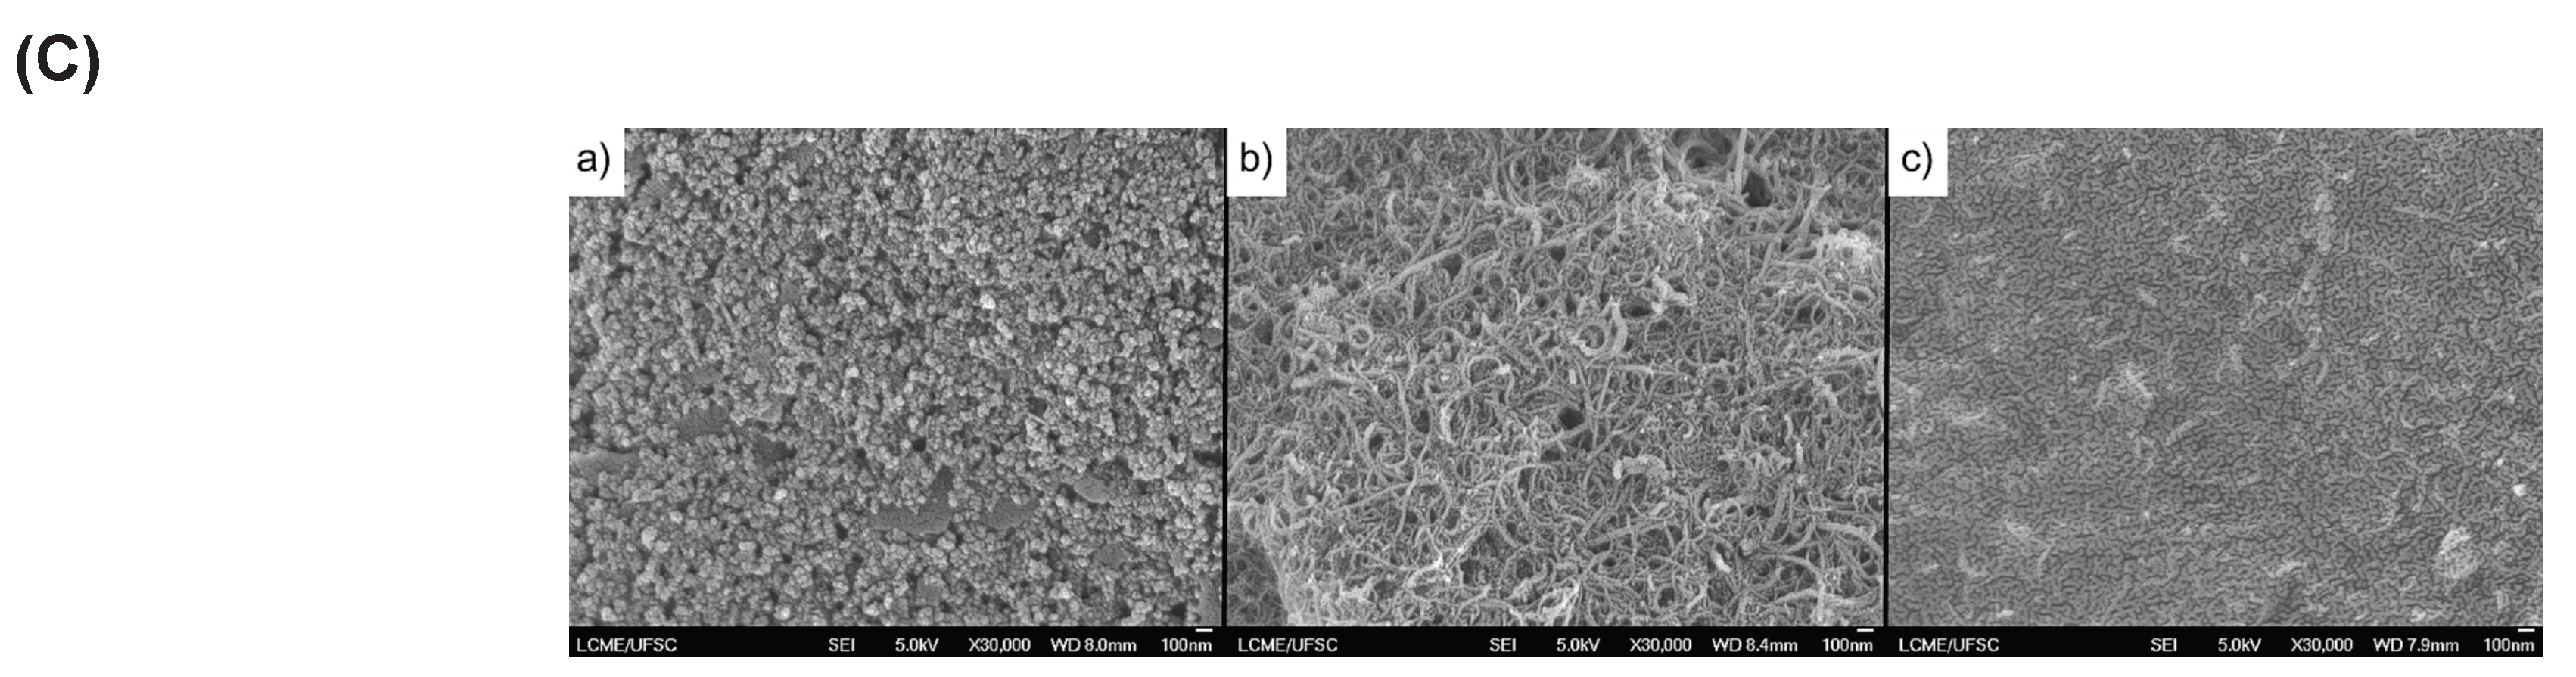
Mondini et al. [15] investigated Orange G on oxygenated carbon nanotubes using voltammetry, spectroelectrochemistry and attenuated total reflectance Fourier-transform infrared spectroscopy. Figure 4 combines three complementary comparisons: A, synthesis on bare and nanotube-modified glassy carbon; B, precursor and film infrared spectra; and C, surface morphology before modification, after nanotube deposition and after film formation. Internal source labels are defined separately for each technique in the caption.
The support changes the voltammetric processes. The authors interpreted a band near 1455 cm−1 as evidence that azo bonds remain in the film, while microscopy shows coverage of the nanotube-containing surface. This combines electrochemical, chemical and morphological evidence more strongly than any one technique alone. The persistence of an azo band nevertheless does not uniquely determine repeating-unit connectivity or molecular-weight distribution.
Figure 4.
Complementary evidence for Orange G (OG) electropolymerization. (A) Cyclic voltammograms in 1 mmol L−1 OG and 0.1 mol L−1 phosphate-buffered solution (PBS), pH 7: a, glassy carbon electrode (GCE); b, oxygenated carbon nanotubes (OCNT)/GCE. I–IV and IIa/IIb are the source\textquotesingle s process labels. Reproduced from Mondini et al. [15], Figure 1; layout adapted. © 2025 Elsevier B.V.
Figure 4.
Complementary evidence for Orange G (OG) electropolymerization. (A) Cyclic voltammograms in 1 mmol L−1 OG and 0.1 mol L−1 phosphate-buffered solution (PBS), pH 7: a, glassy carbon electrode (GCE); b, oxygenated carbon nanotubes (OCNT)/GCE. I–IV and IIa/IIb are the source\textquotesingle s process labels. Reproduced from Mondini et al. [15], Figure 1; layout adapted. © 2025 Elsevier B.V.
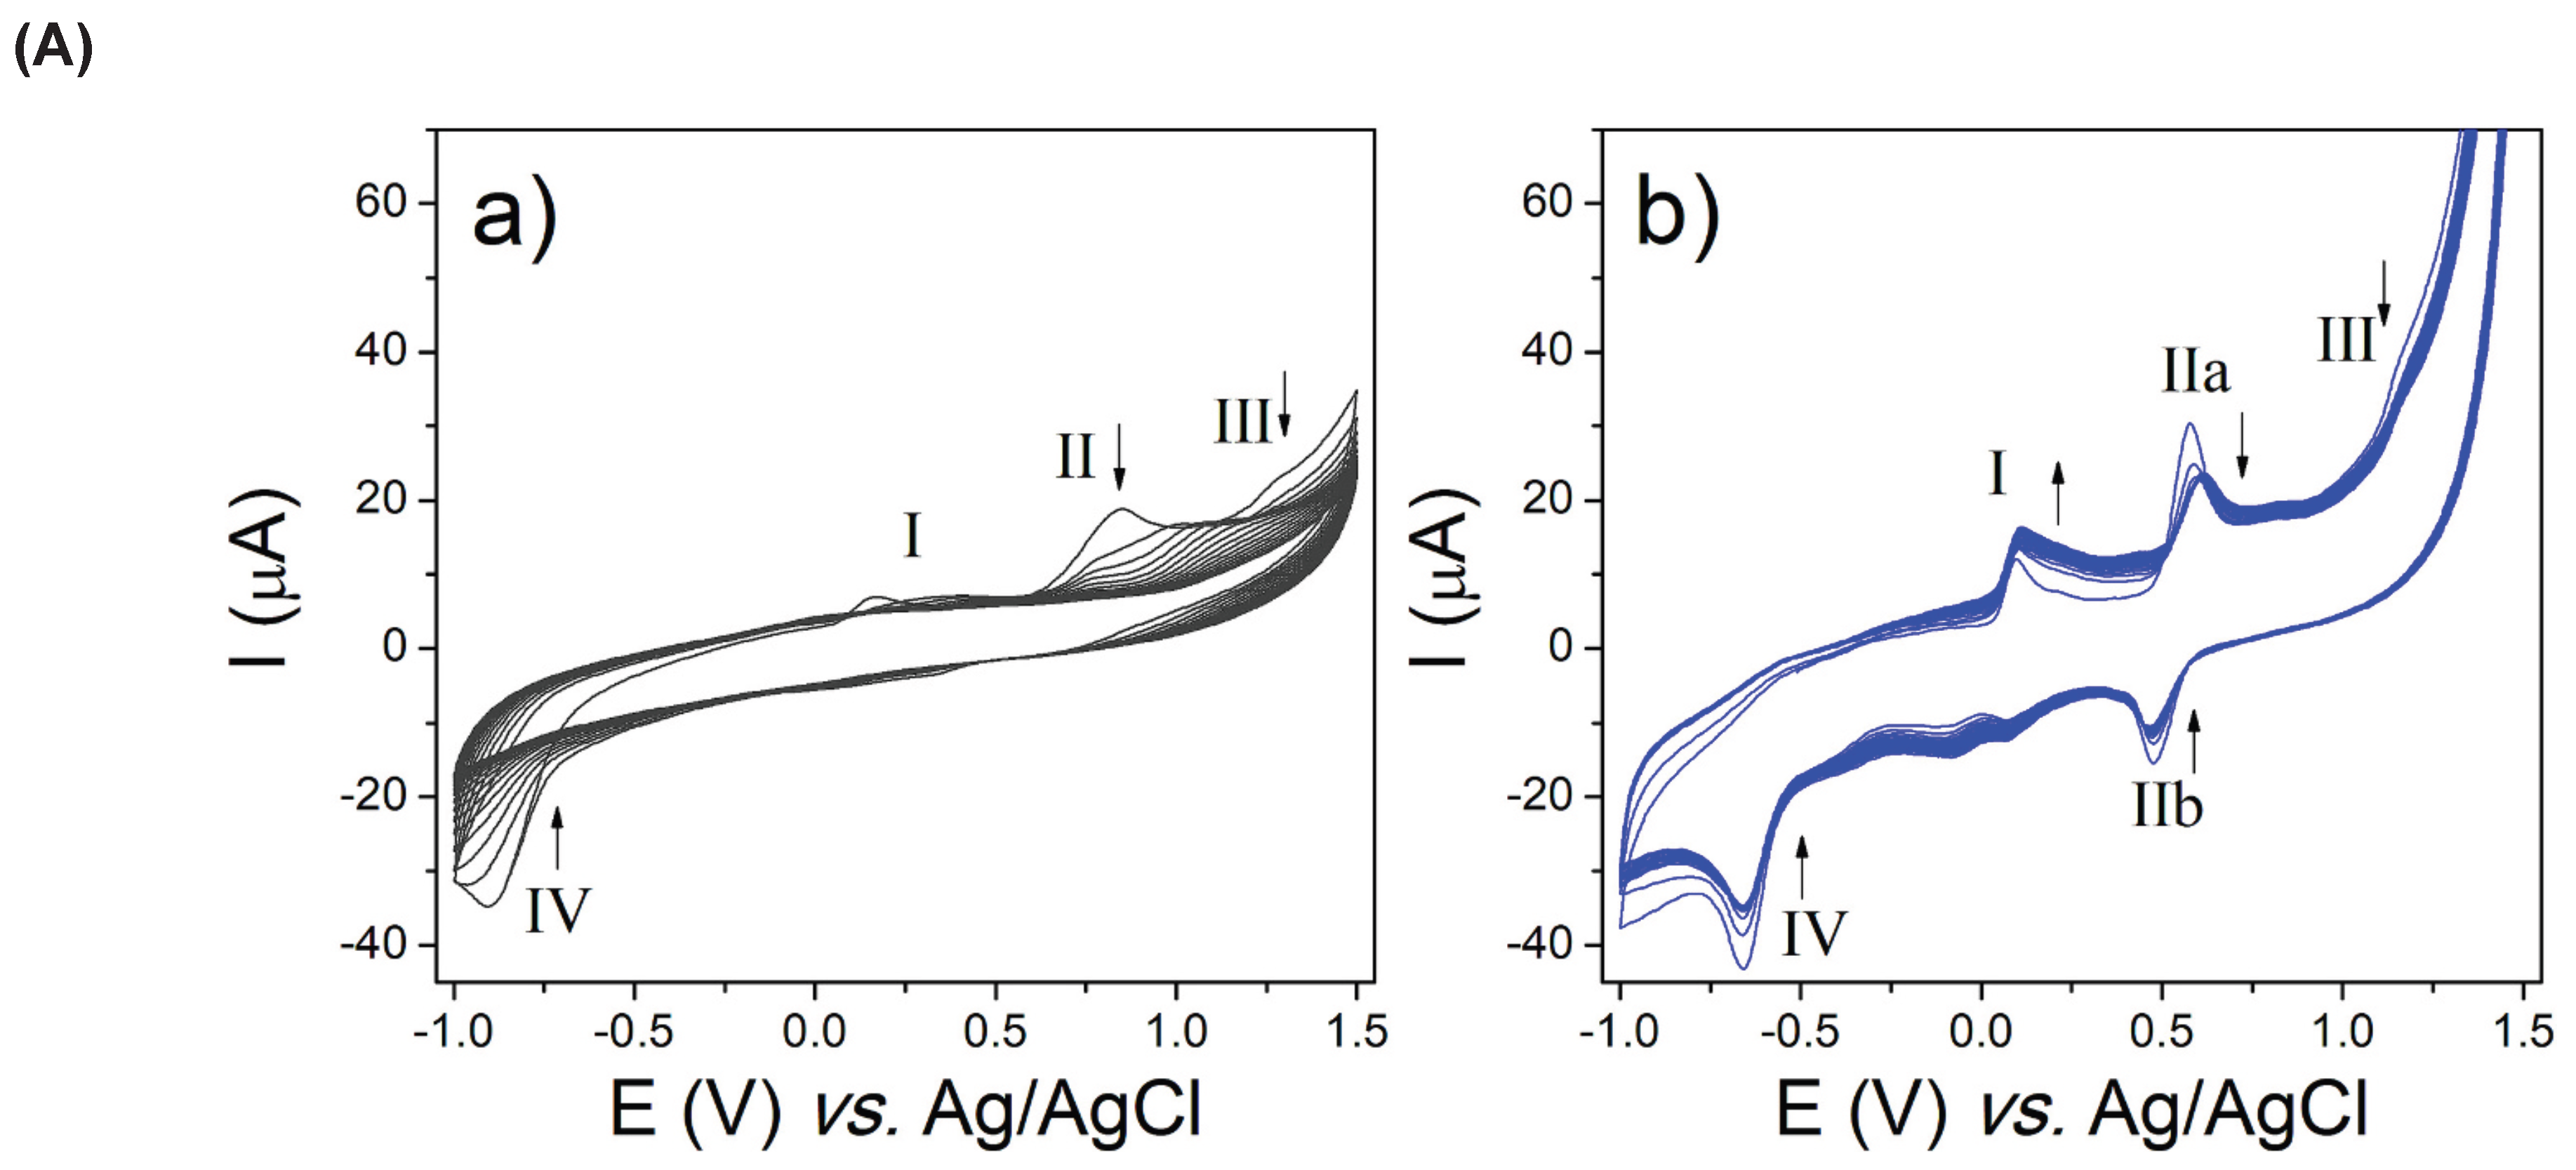
Figure 4.
Cont. (B) Attenuated total reflectance Fourier-transform infrared (ATR-FTIR) spectra: a, Orange G (OG); b, poly(Orange G) (POG). The reported azo stretching band near 1455 cm−1 remains observable. Reproduced from Mondini et al. [15], Figure 2; layout adapted. © 2025 Elsevier B.V.
Figure 4.
Cont. (B) Attenuated total reflectance Fourier-transform infrared (ATR-FTIR) spectra: a, Orange G (OG); b, poly(Orange G) (POG). The reported azo stretching band near 1455 cm−1 remains observable. Reproduced from Mondini et al. [15], Figure 2; layout adapted. © 2025 Elsevier B.V.
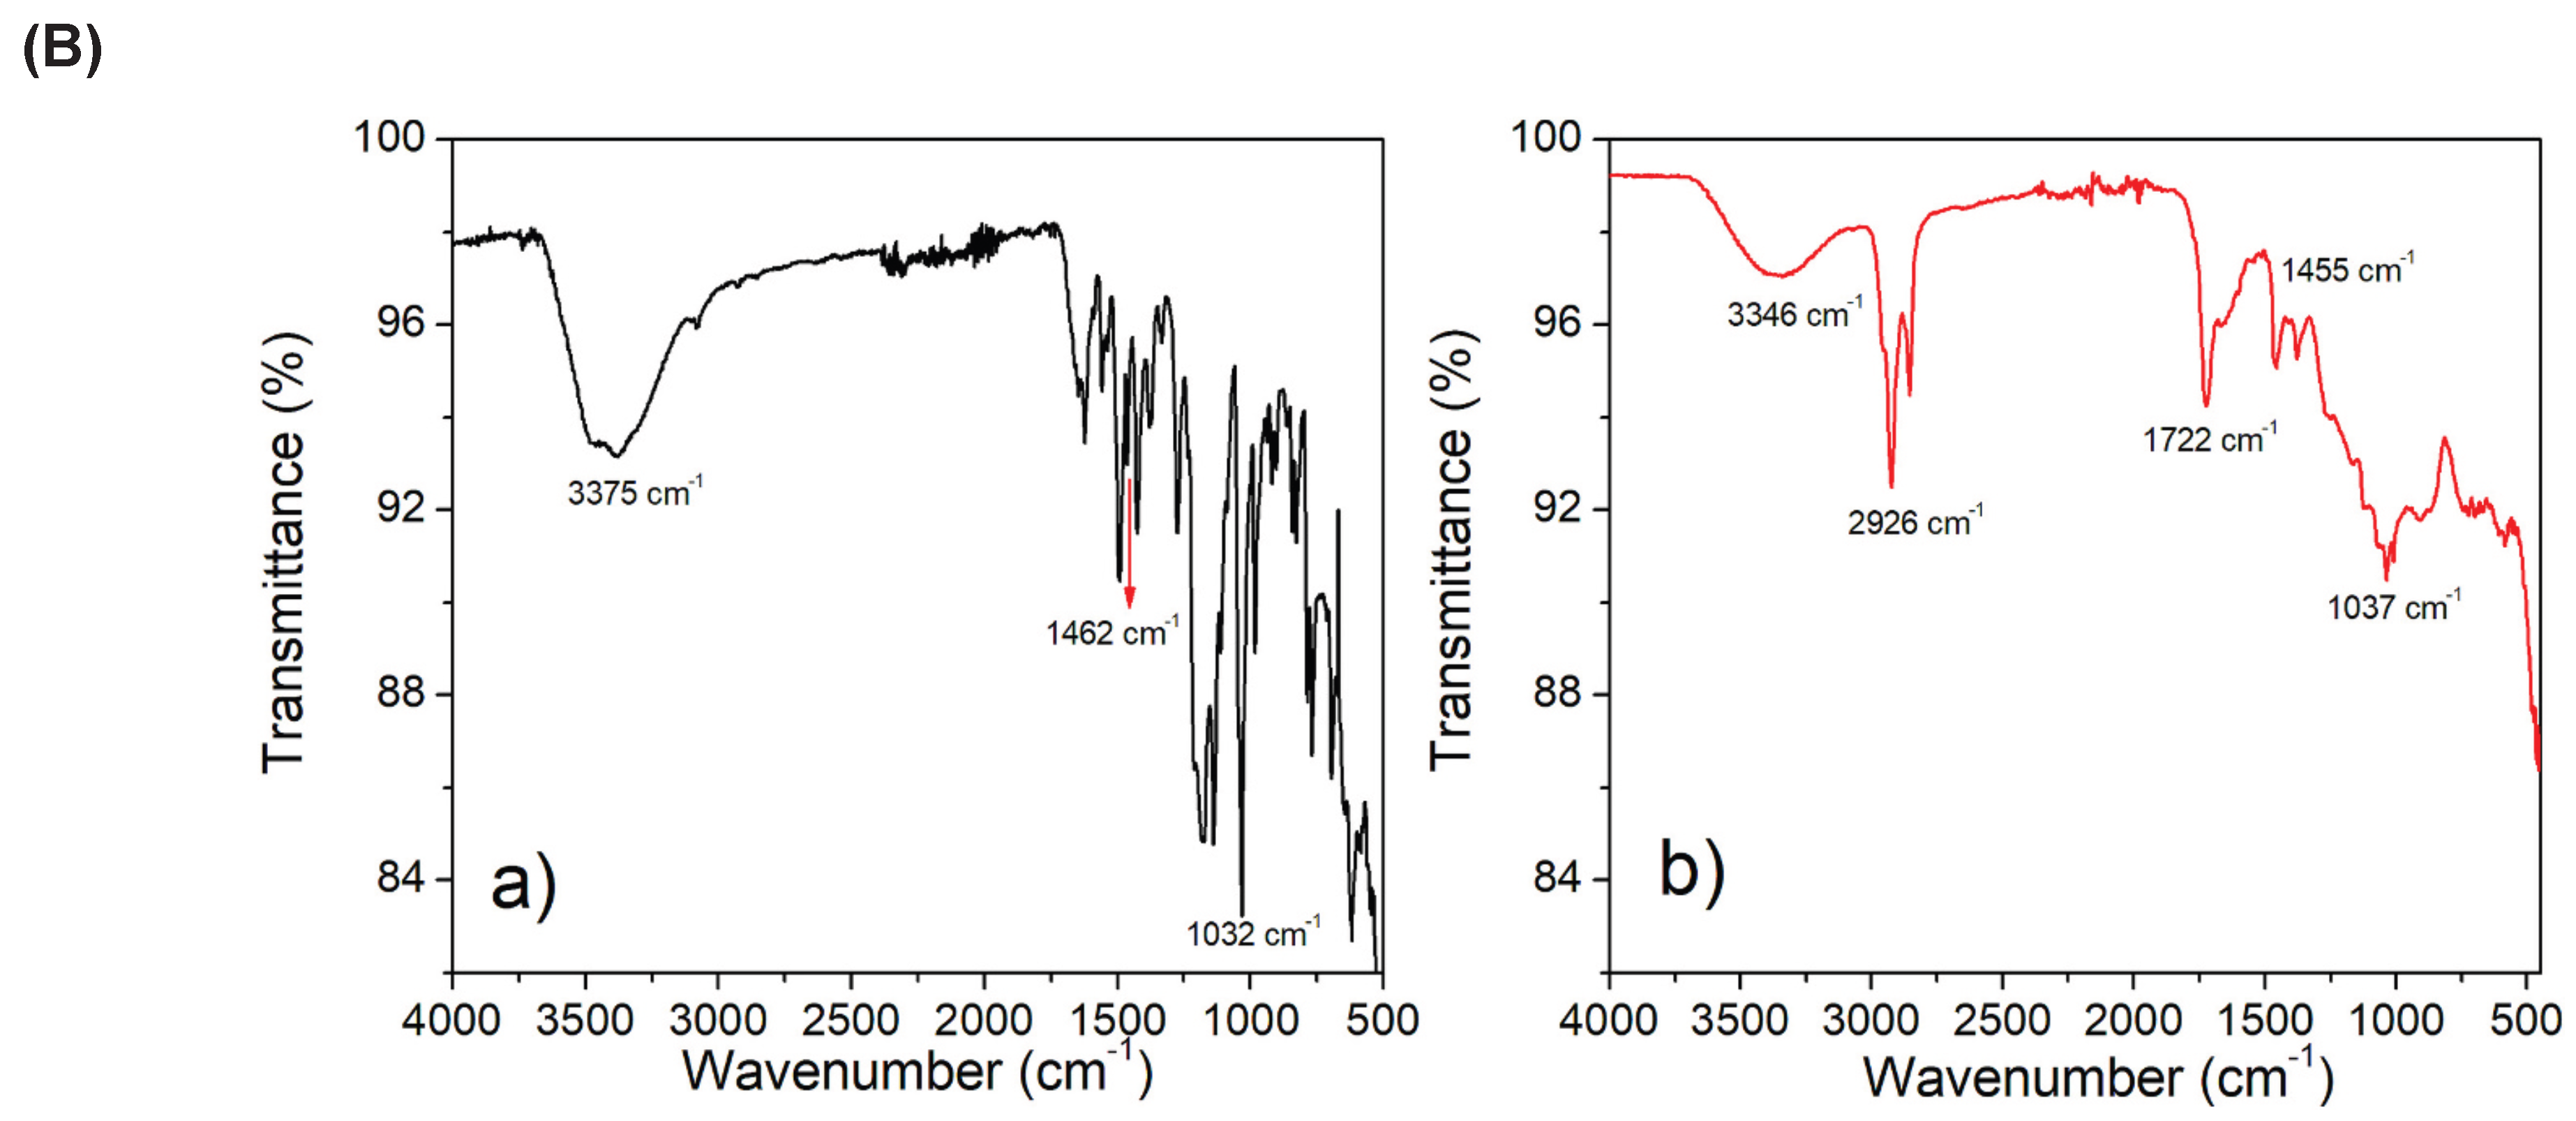
Figure 4.
Cont. (C) Field-emission scanning electron microscopy (FE-SEM): a, bare screen-printed carbon electrode (SPCE); b, oxygenated carbon nanotubes (OCNT)/SPCE; c, poly(Orange G) (POG)/OCNT/SPCE. Original scale bars are retained. Reproduced from Mondini et al. [15], Figure 3; layout adapted without changing the data. © 2025 Elsevier B.V.
Figure 4.
Cont. (C) Field-emission scanning electron microscopy (FE-SEM): a, bare screen-printed carbon electrode (SPCE); b, oxygenated carbon nanotubes (OCNT)/SPCE; c, poly(Orange G) (POG)/OCNT/SPCE. Original scale bars are retained. Reproduced from Mondini et al. [15], Figure 3; layout adapted without changing the data. © 2025 Elsevier B.V.
4.5. Methyl-Orange Electropolymerization
Methyl orange occurs in 11 of the 33 audited studies, mainly for electrode modification and electroanalysis. The studies demonstrate material preparation under different conditions; they do not imply equivalent mechanisms or morphology across supports.
Giribabu et al. [3] prepared poly(methyl orange) on glassy carbon and subsequently used it for 4-nitrophenol determination. Their results section describes 20 cycles from to V in 0.1 mol L−1 phosphate buffer at pH 7. Figure 5 links the published synthesis voltammogram with the resulting surface at two magnifications; the caption retains the conditions stated in the original figure legend rather than reconciling contradictory descriptions.
Figure 5.
Formation of poly(methyl orange) (PMO) from methyl orange (MO) on a glassy carbon electrode (GCE).
(A) Cyclic voltammogram; the original legend specifies 0.1 mmol L−1 MO, 0.05 mol L−1 phosphate-buffered
solution (PBS), 30 cycles, −0.6 to +1.2 V vs. saturated calomel electrode (SCE), and 50 mV s−1. R1 labels
reduction; O1/O2 label oxidation features. Synthesis conditions differ across source sections (see discussion
below). Reproduced from Giribabu et al. [3], Figure 1; layout adapted. © 2017 Elsevier B.V.
Figure 5.
Formation of poly(methyl orange) (PMO) from methyl orange (MO) on a glassy carbon electrode (GCE).
(A) Cyclic voltammogram; the original legend specifies 0.1 mmol L−1 MO, 0.05 mol L−1 phosphate-buffered
solution (PBS), 30 cycles, −0.6 to +1.2 V vs. saturated calomel electrode (SCE), and 50 mV s−1. R1 labels
reduction; O1/O2 label oxidation features. Synthesis conditions differ across source sections (see discussion
below). Reproduced from Giribabu et al. [3], Figure 1; layout adapted. © 2017 Elsevier B.V.
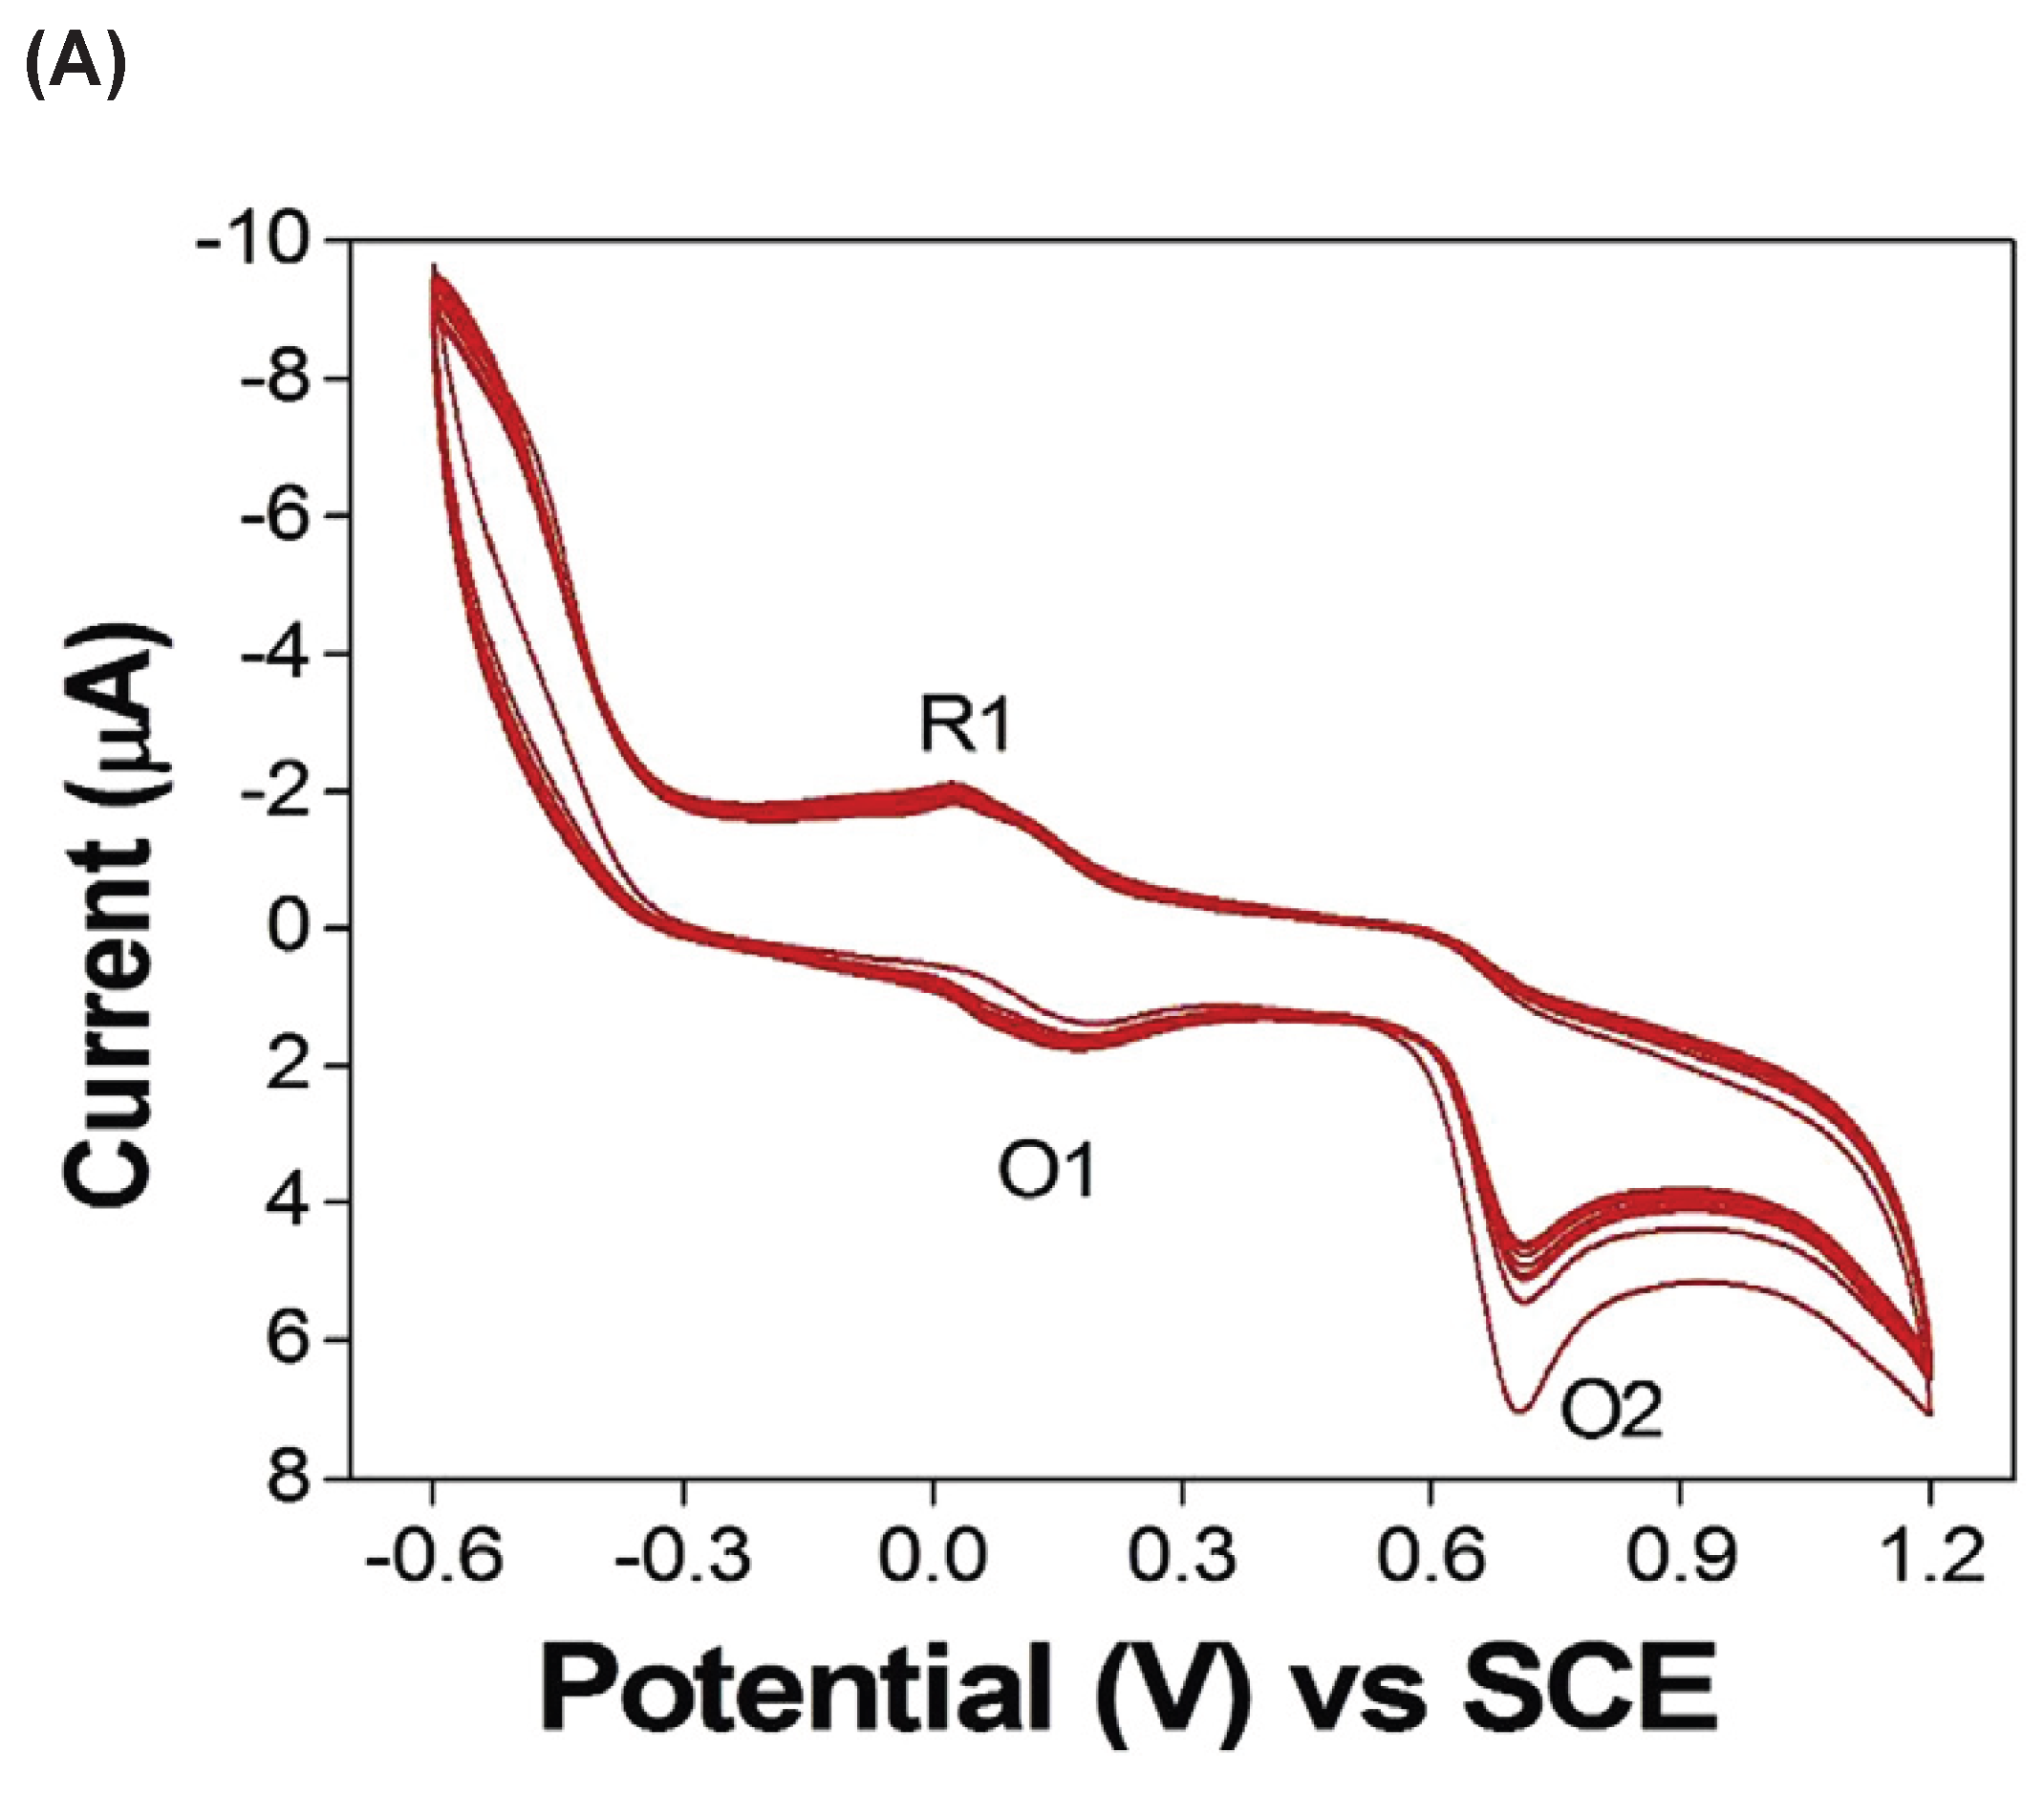
Figure 5.
Cont. (B,C) Scanning electron microscopy (SEM) of poly(methyl orange) (PMO) on a glassy carbon electrode (GCE), at different magnifications. Scale bars: B, 2 m; C, 200 nm. Original b and c correspond to B and C. Reproduced from Giribabu et al. [3], Figure 2b,c; layout adapted without changing the micrographs. © 2017 Elsevier B.V.
Figure 5.
Cont. (B,C) Scanning electron microscopy (SEM) of poly(methyl orange) (PMO) on a glassy carbon electrode (GCE), at different magnifications. Scale bars: B, 2 m; C, 200 nm. Original b and c correspond to B and C. Reproduced from Giribabu et al. [3], Figure 2b,c; layout adapted without changing the micrographs. © 2017 Elsevier B.V.
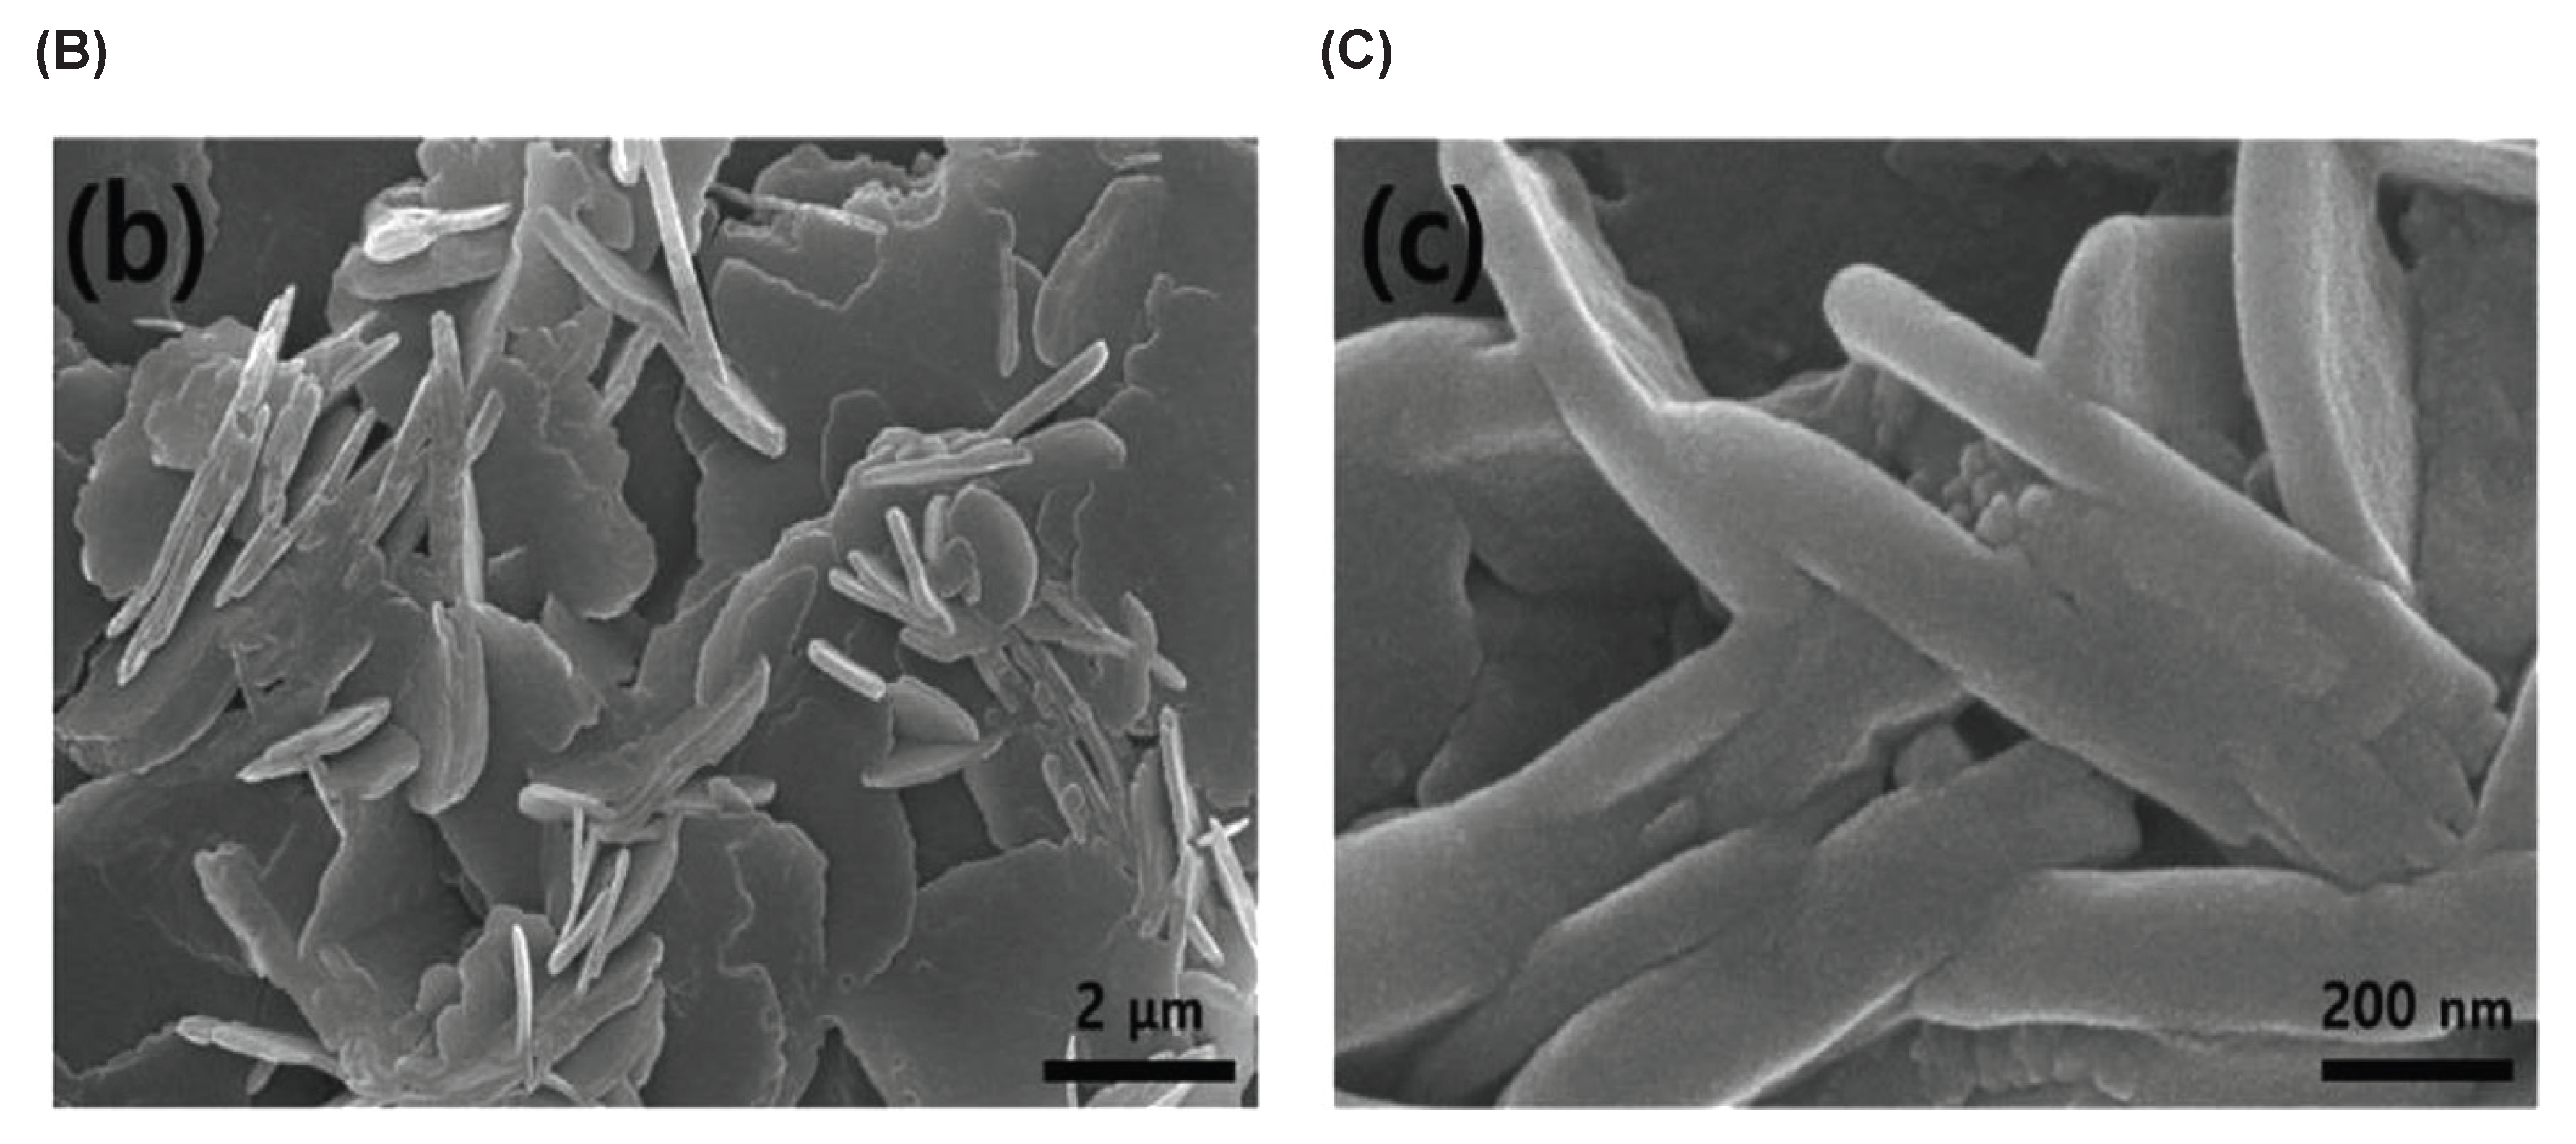
The micrographs show fibrous/agglomerated domains and plate-like structures for which the authors reported thicknesses of approximately 200 nm. This supports formation of an electrogenerated surface layer, not a unique molecular structure. Reproducibility is limited by internal inconsistencies: the experimental section states 30 cycles in 0.1 mol L−1 phosphate-buffered solution over to V; the results text states 20 cycles over to V; and the original figure legend specifies 30 cycles in 0.05 mol L−1 buffer. These values have not been artificially harmonized.
Bairagi and Verma [11] prepared a dendritic poly(methyl orange) film on a composite of copper/nickel nanoparticles, carbon nanofibers and a polymer matrix, subsequently used for cholesterol sensing. Figure 6 compares synthesis with the precursor-free control and the composite surface before and after deposition at two magnifications. The source specifies an initial potential of 0 V and a conditioning time of 5 s, in addition to the conditions retained in the caption.
Figure 6.
Methyl orange (MO) electropolymerization on the Cu/Ni–carbon-nanofiber/poly(vinyl acetate) composite
electrode (BMCP). (A) Cyclic voltammograms for poly(methyl orange) (PMO) growth and the precursor-free
BMCP control: 45 cycles, −1.0 to +1.0 V vs. silver/silver chloride (Ag/AgCl; 0.3 mol L−1 KCl), 100 mV s−1, in an
equivolume mixture of 0.01 mol L−1 MO and 0.1 mol L−1 phosphate-buffered solution (PBS), pH 7. Original a
identifies the source panel. Reproduced from Bairagi and Verma [11], Figure 2a. © 2018 Elsevier B.V.
Figure 6.
Methyl orange (MO) electropolymerization on the Cu/Ni–carbon-nanofiber/poly(vinyl acetate) composite
electrode (BMCP). (A) Cyclic voltammograms for poly(methyl orange) (PMO) growth and the precursor-free
BMCP control: 45 cycles, −1.0 to +1.0 V vs. silver/silver chloride (Ag/AgCl; 0.3 mol L−1 KCl), 100 mV s−1, in an
equivolume mixture of 0.01 mol L−1 MO and 0.1 mol L−1 phosphate-buffered solution (PBS), pH 7. Original a
identifies the source panel. Reproduced from Bairagi and Verma [11], Figure 2a. © 2018 Elsevier B.V.
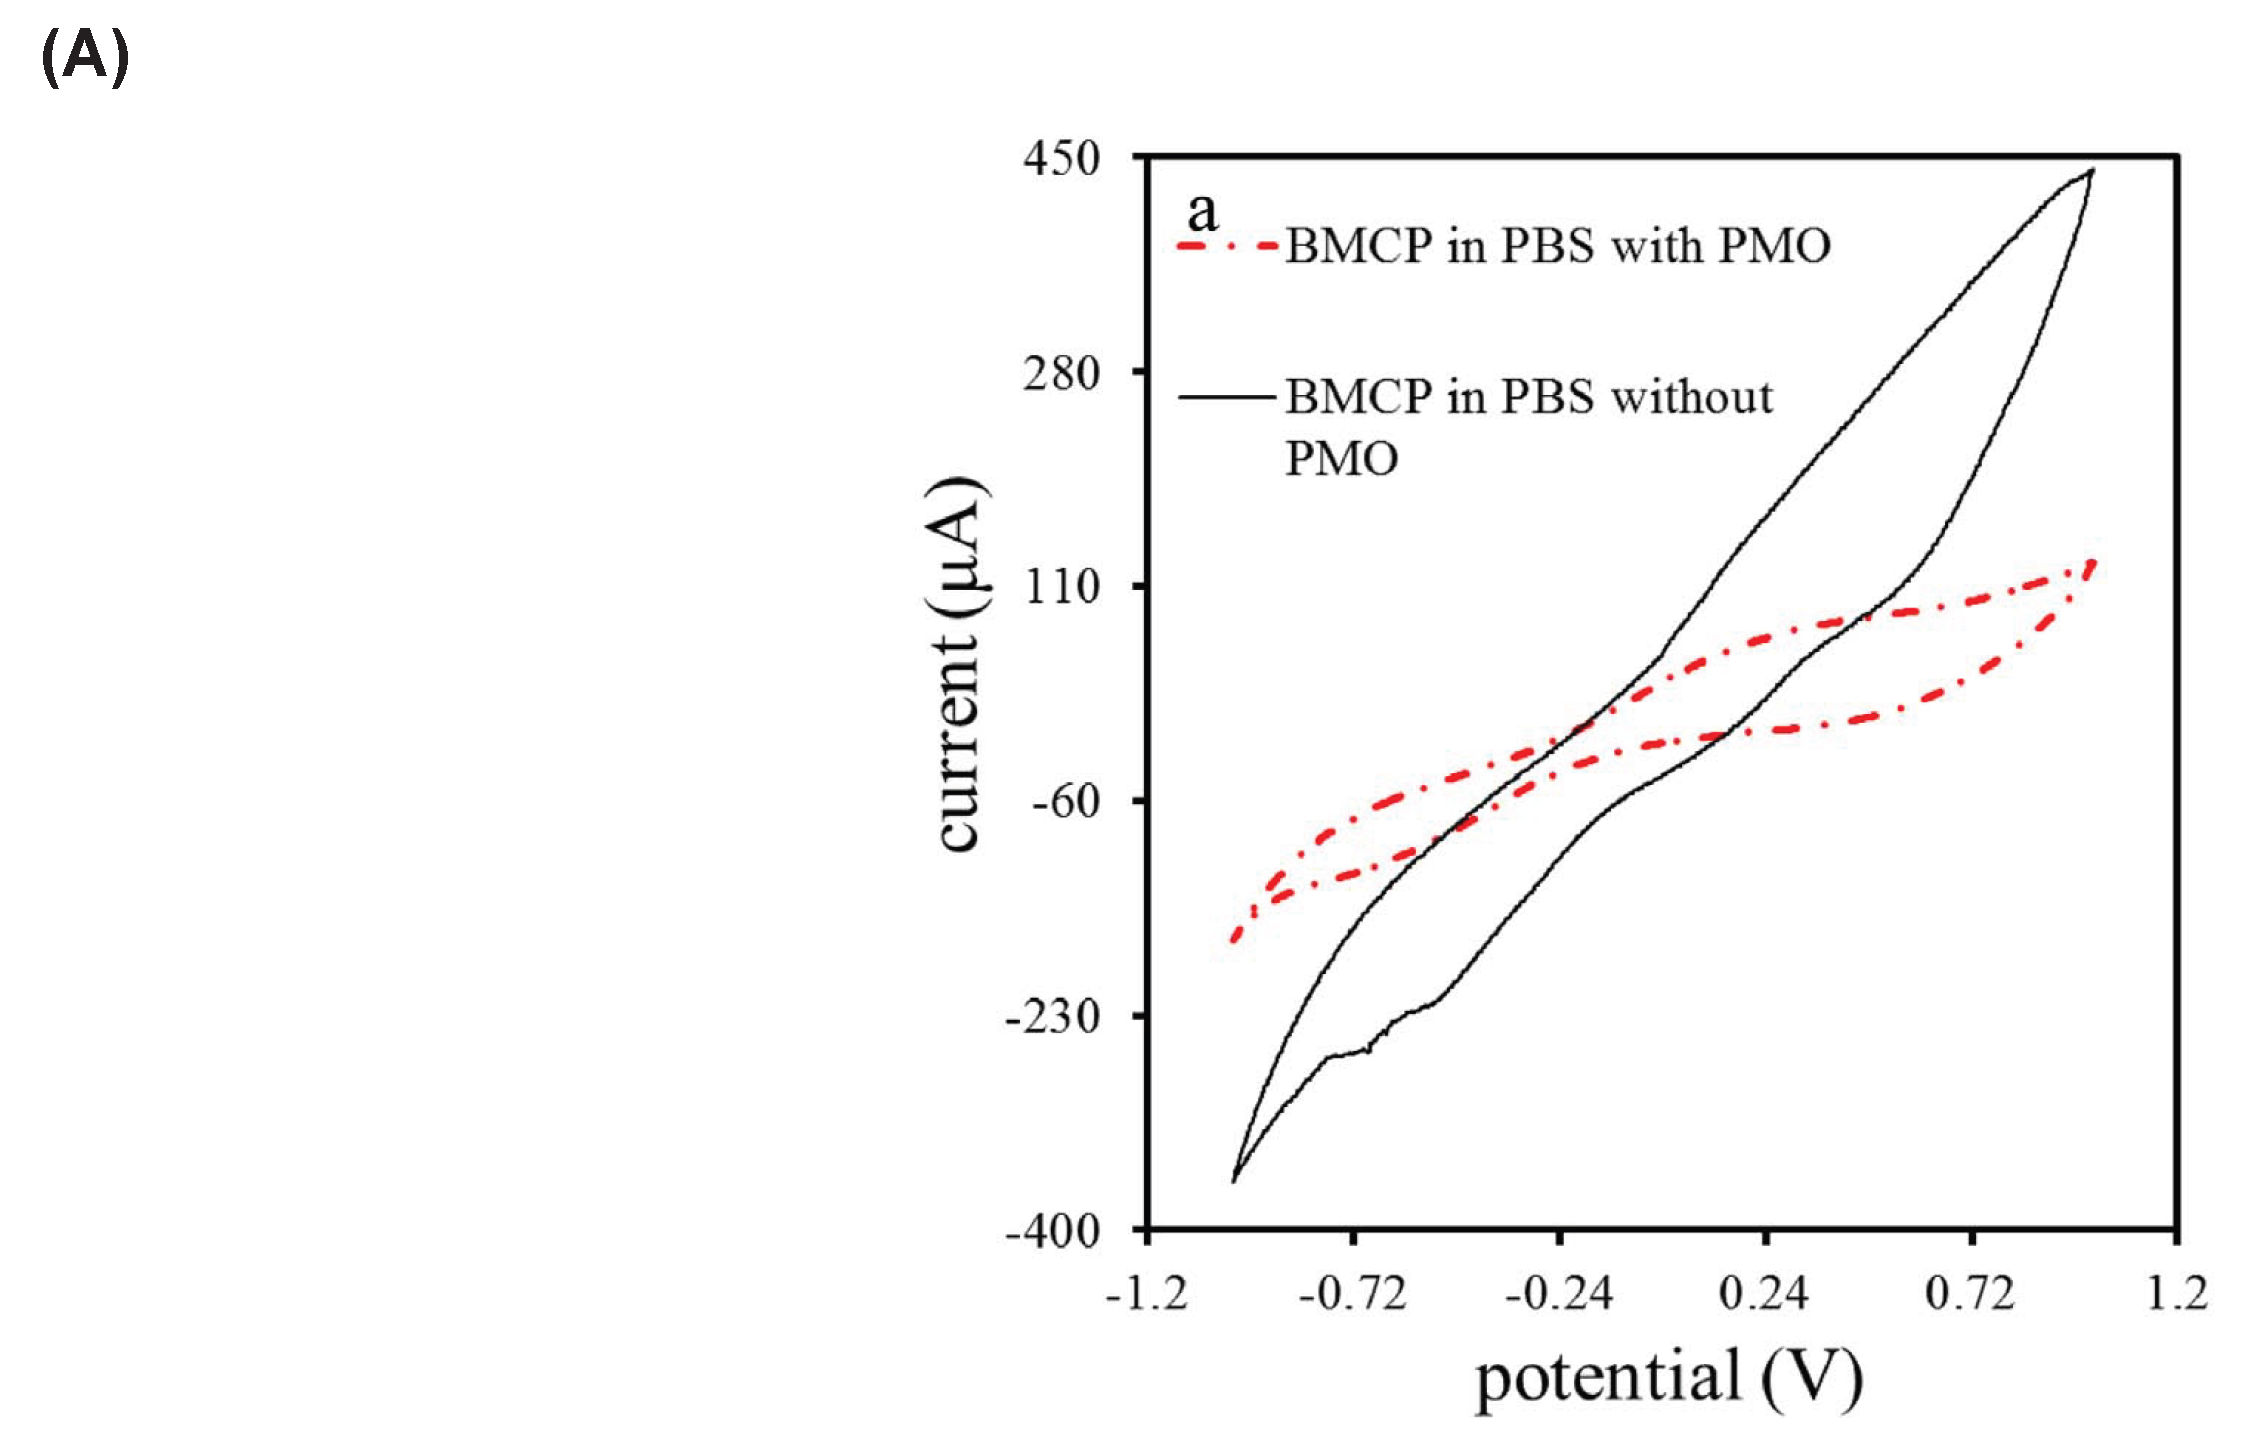
Figure 6.
Cont. (B,C) Scanning electron microscopy (SEM) of the Cu/Ni–carbon-nanofiber/poly(vinyl acetate) composite (BMCP), before and after deposition of poly(methyl orange) (PMO), respectively. Original a/a1 and b/b1 show lower/higher magnification; scale bars are retained. Panel a1 is cropped to omit the source cross-section inset a11; the displayed field is narrower. Reproduced from Bairagi and Verma [11], Figure 3; layout adapted without changing the data. © 2018 Elsevier B.V.
Figure 6.
Cont. (B,C) Scanning electron microscopy (SEM) of the Cu/Ni–carbon-nanofiber/poly(vinyl acetate) composite (BMCP), before and after deposition of poly(methyl orange) (PMO), respectively. Original a/a1 and b/b1 show lower/higher magnification; scale bars are retained. Panel a1 is cropped to omit the source cross-section inset a11; the displayed field is narrower. Reproduced from Bairagi and Verma [11], Figure 3; layout adapted without changing the data. © 2018 Elsevier B.V.
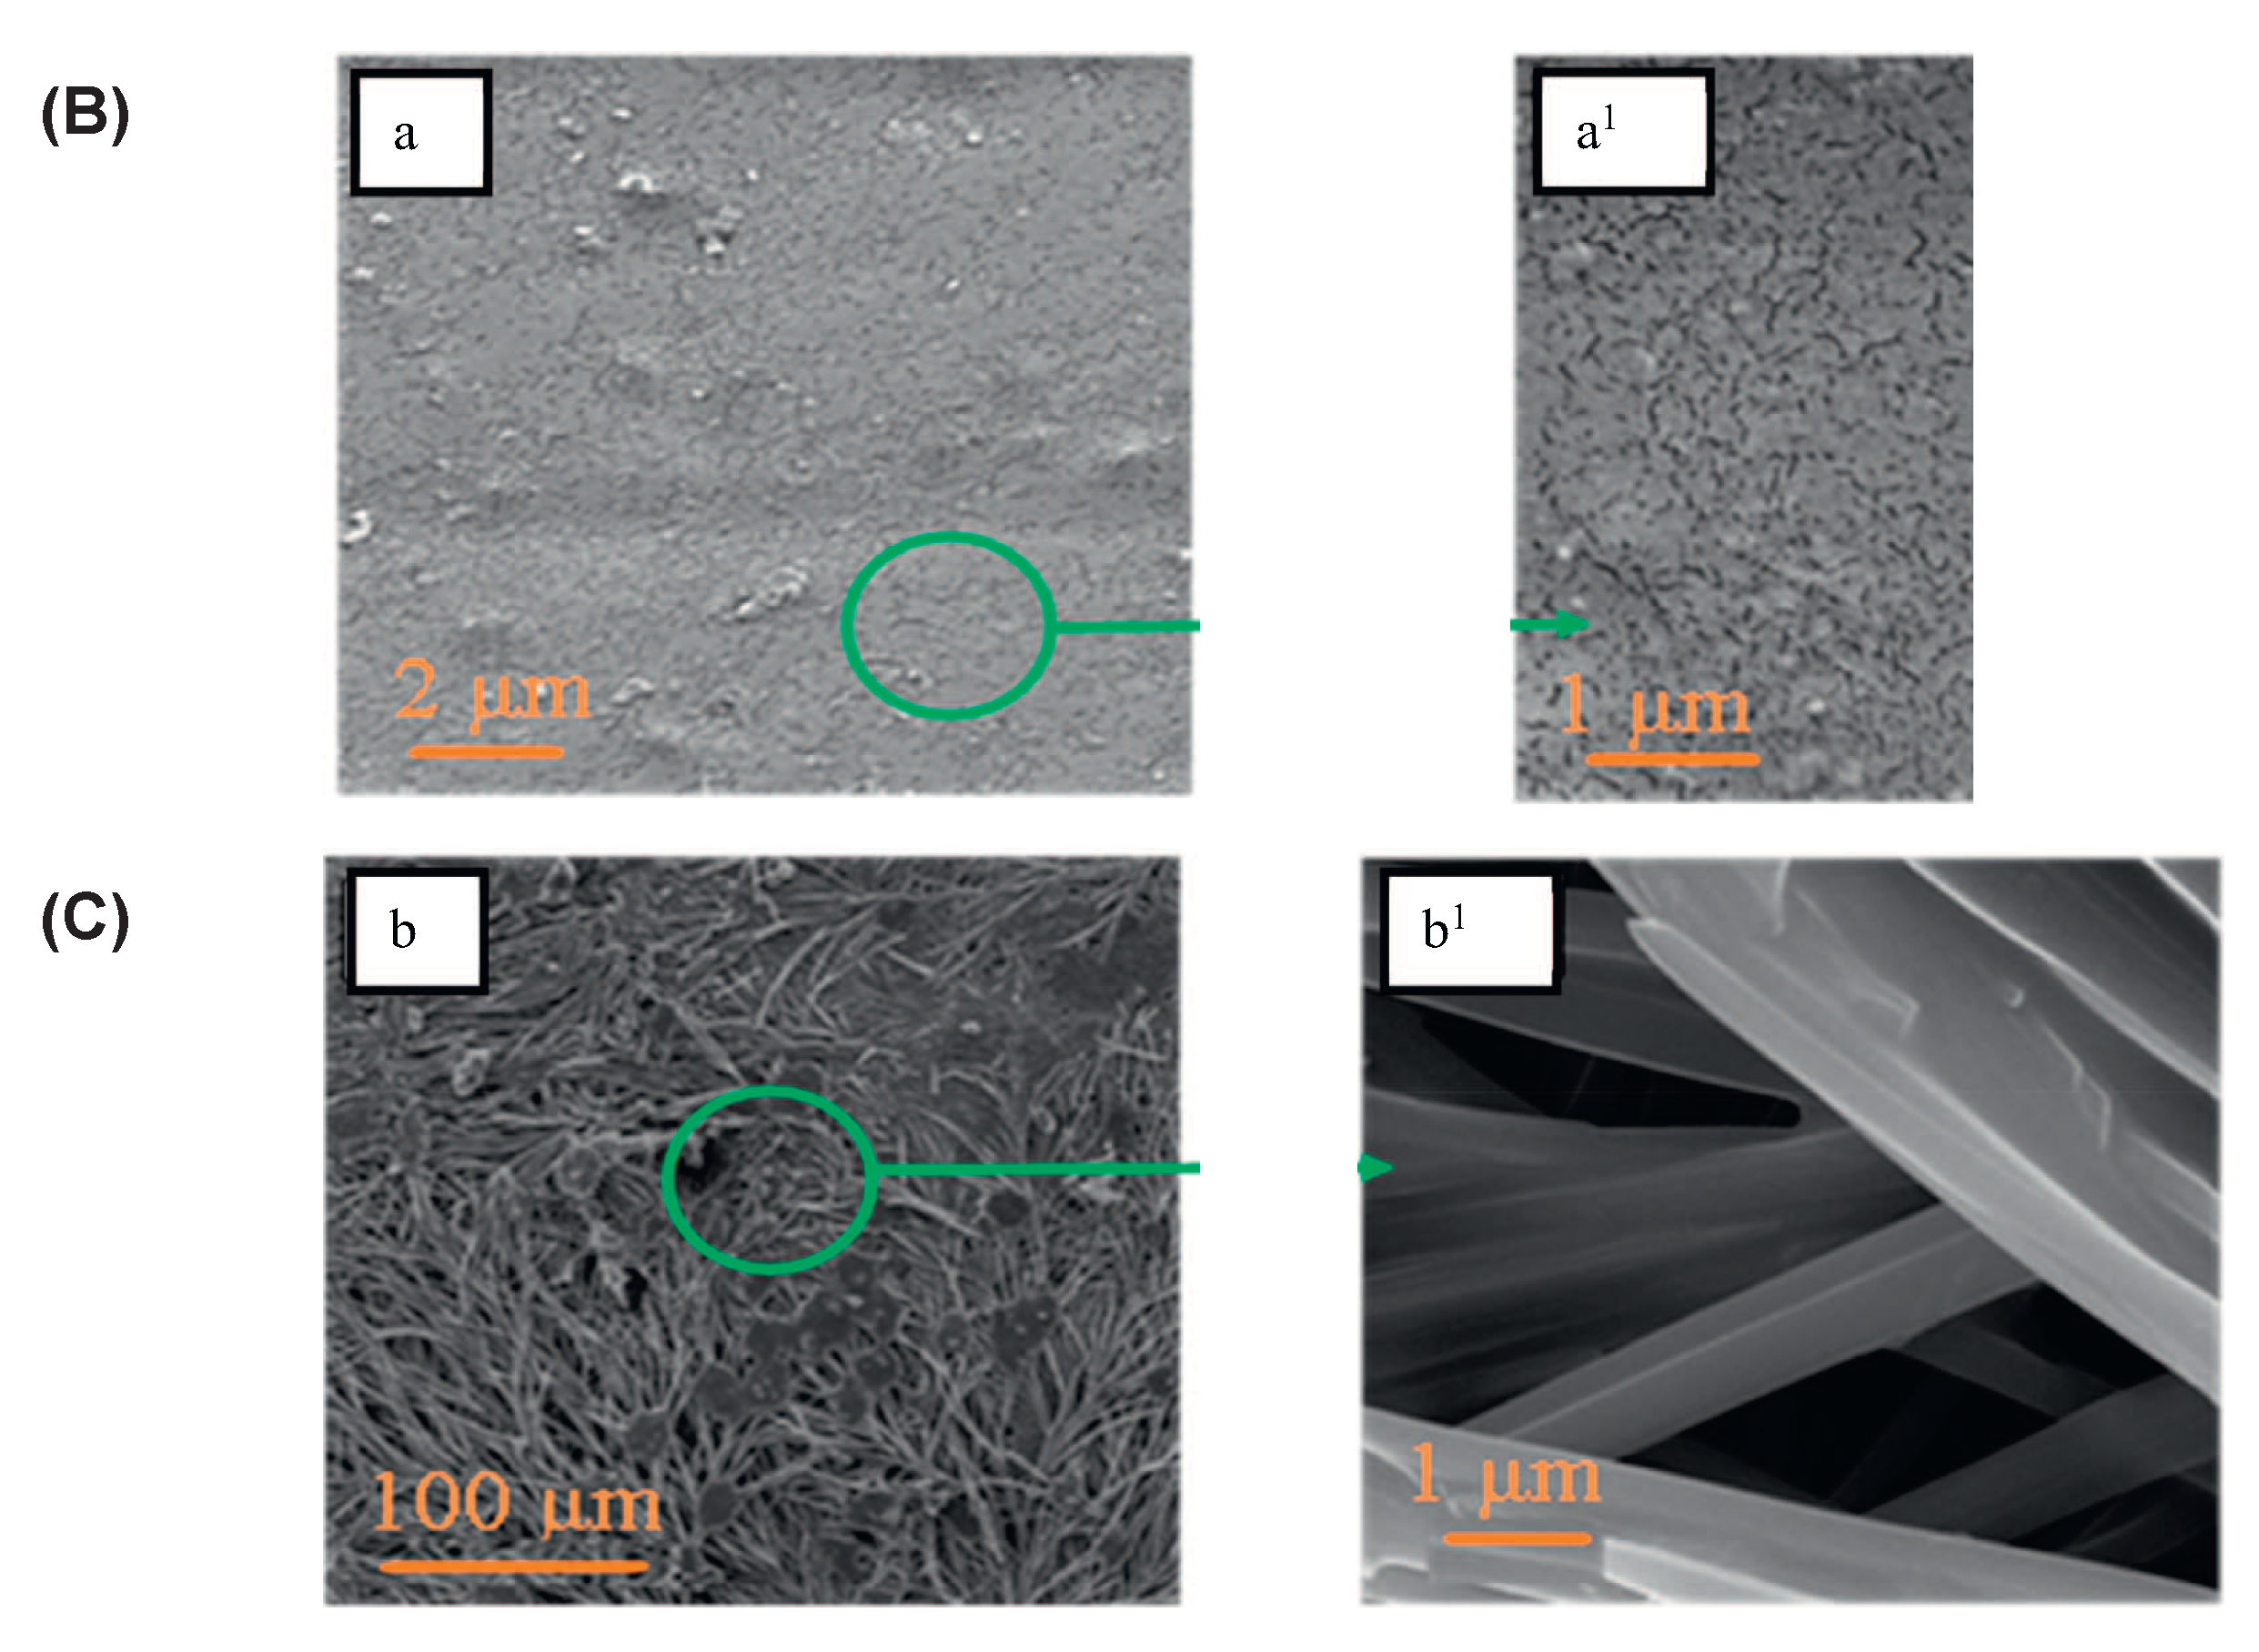
The before/after comparison is central: the starting composite is comparatively smooth, whereas the modified surface displays dense dendrite-like structures and porosity. The authors assigned oxidation and reduction features near and V and proposed a species described as a diazonium cation followed by a quinoid material. Those assignments remain their mechanistic interpretation. Voltammetry and microscopy support formation of surface material but do not prove this molecular pathway. These surface images do not establish film thickness.
The contrast with Giribabu’s fibrous/agglomerated, plate-like morphology demonstrates that one morphology cannot represent all materials termed poly(methyl orange). Electrode composition, metallic nanoparticles and synthesis conditions may alter nucleation, transport and interfacial chemistry. The difference does not, by itself, establish different molecular connectivity or isolate the causal role of the support from that of the protocol.
Figure 7 separates the known precursor structure, the pathway proposed by Bairagi and Verma, and unresolved structural questions.
Keeping these levels separate prevents attribution of a definitive repeating unit to evidence that establishes only electrochemical and morphological changes. Inter-unit bonding, intermediate identity and attachment to the surface require additional molecular characterization.
4.6. Growth and Surface Accumulation
An accumulating film can alter accessible electroactive sites, precursor access, species transport and electrical response. Both Giribabu et al. [3] and Bairagi and Verma [11] subsequently demonstrated electroanalytical functionality, but this does not establish the molecular steps of growth.
A current decrease may reflect blocking, transport limitations or slower electron transfer. An increase may reflect larger accessible area, newly electroactive species or altered film conductivity. Neither trend independently measures growth. Quantitative interpretation must separate faradaic reactions, capacitance and competing processes. Material retained on the electrode must also be distinguished from soluble products and precipitates elsewhere in the cell: precursor disappearance does not imply quantitative incorporation into the film.
4.7. Competing Reactions and Evidential Limits
Oxidation, reduction, coupling, adsorption and deposition can coexist or share intermediates. Methyl-orange degradation on boron-doped diamond [2] and protonation-dependent azo reduction [5] demonstrate relevant alternatives to polymer accumulation. The dominant route must be established through complementary electrochemical, spectroscopic and product evidence, distinguishing observations from source-author proposals and untested steps. Table 2 summarizes the supported and unresolved conclusions.
4.8. Literature Distribution and Research Trends
The audited core contains 3 studies from 2010–2014, 13 from 2015–2019, 12 from 2020–2024 and 5 from 2025 to September 2026 (Table 3). These are counts within the verified set, not worldwide publication totals.
Sensing and electroanalysis dominate (31 of 33 studies). Supports have diversified from glassy carbon and carbon paste to nanotubes, graphene, reduced graphene oxide, nanoparticles and pencil graphite. Potential cycling nevertheless remains the dominant synthesis protocol; potentiostatic procedures and deliberately designed pulse programmes are less represented [6,7].
Mechanistic characterization has developed less uniformly than applications. Many studies combine voltammetric evolution, morphology and improved analytical response but provide limited evidence for inter-unit connectivity or complete initiation–propagation–termination sequences. Comparative and spectroscopic studies by Acar, Teixeira, Olean-Oliveira and Mondini provide stronger constraints [9,10,12,15].
Ahmed et al. [18] developed a reaction–diffusion model for a preformed poly(methyl orange) layer used in a nonenzymatic cholesterol biosensor. This demonstrates modeling of reaction and transport within an existing film, not modeling of its electrosynthesis. No model in the audited core explicitly links dye activation, intermediates, coupling, film growth and current throughout synthesis.
The separation between sensor-film studies and treatment studies defines a research opportunity within the search scope. Transforming a sensor-preparation procedure into a controlled pollutant-separation operation requires product identification, material balances, energy assessment and stability tests. Table 4 summarizes the trends and limitations without treating this opportunity as an established treatment technology.
5. Toward a Physicochemical Description
5.1. Scope and State Variables
A minimal, non-atomistic framework separates mass transport, adsorption, electrochemical activation, effective intermediates, material formation and competing transformations. Let and denote precursor concentrations in the bulk liquid and at the electrode–solution interface, respectively [mol m−3]. The surface inventories , and describe adsorbed precursor, effective reactive intermediates and accumulated material [mol m−2 on a common precursor-equivalent basis]. Subscripts M, I and P identify these three pools; I does not designate a unique molecular structure. Time is t [s]. Figure 8 relates the state variables to the activation rate , material-formation rate , and competing transformation and loss rates and , all expressed in mol m−2 s−1 on the same equivalent basis.
This separation makes the subsequent balances testable without assigning a molecular identity to every intermediate. Each effective rate requires experimental identification rather than interpretation as a proven elementary step.
5.2. Adsorption and Electrochemical Activation
If adsorption is relevant, define the fractional coverage , where is the maximum adsorbed inventory [mol m−2]. A Langmuir-type balance is
where [m3 mol−1 s−1] and [s−1] are adsorption and desorption coefficients, and [s−1] is the activation rate on a coverage basis. All balance terms therefore have units s−1.
For an identified electron-transfer step, the standard Butler–Volmer relation may be used:
Here and are the faradaic and exchange current densities [A m−2]; and are dimensionless anodic and cathodic transfer coefficients; n is the electron number of the identified reaction; F is the Faraday constant [C mol−1]; R is the gas constant [J mol−1 K−1]; and is absolute temperature [K]. The applied potential E, equilibrium potential and overpotential are in volts on a consistent reference scale. Faradaic current is not equated with polymer growth unless its generating reaction is established.
When one branch dominates and mass transport does not control the response, an apparent activation law is
The coefficient [s−1], dimensionless transfer coefficient and formal potential [V] belong to this reduced relation. Acidity can first enter through an effective coefficient [s−1]. If speciation is independently supported,
5.3. Intermediates, Competing Pathways and Growth
On a consistent equivalent basis, conservation gives
A first phenomenological approximation is
The apparent orders m and q are dimensionless and are not automatically molecularities. The units of and are s−1 and s−1, respectively. If these rates account for the relevant nonnegative competing pathways, the apparent material selectivity is
The dimensionless requires product assignment. Material accumulation obeys
where is the material-loss rate [mol m−2 s−1]. If the deposit can be approximated as a film with apparent density [kg m−3],
where is effective thickness [m] and is deposited mass per mole of precursor equivalents [kg mol−1]. Porous or nonuniform deposits require additional caution. A phenomenological surface feedback can be written , where is the unmodified rate. For example, blocking may be represented by with [m2 mol−1]. This adjustable relation is not a demonstrated mechanism.
5.4. Current, Charge and Faradaic Efficiency
The measured current can contain several contributions:
All currents are in amperes: total, precursor activation, side reactions, film redox response and double-layer charging, respectively. If activation stoichiometry is known,
where A is the electrode area [m2] consistent with the rate normalization. Thus, in general,
Total charge is [C], where is an integration variable. Only when composition and electron stoichiometry are established can an apparent faradaic efficiency be defined as
where is the amount incorporated into the material [mol of precursor equivalents] and is the electron number per equivalent. The dimensionless requires a stated charge convention and appropriate background correction, especially for alternating-polarity operation.
5.5. Mass Transport
When supporting electrolyte makes migration negligible,
For species i, is concentration [mol m−3], diffusivity [m2 s−1], and the net volumetric production rate [mol m−3 s−1]; is fluid velocity [m s−1]. The operator ∇ denotes the spatial gradient. If migration is significant, a Nernst–Planck formulation is required. A lumped external-transfer approximation is
where is precursor molar flux [mol m−2 s−1], the mass-transfer coefficient [m s−1], and the bulk concentration. The notation avoids confusing flux with an amount of precursor. In a porous medium, may be used, where D and are bulk and effective diffusivities, is porosity and the dimensionless tortuosity factor under this convention; other conventions use .
5.6. Potential Programmes
For a periodic double pulse, let and [V] act for and [s], respectively. The period [s] is distinct from absolute temperature . With cycle time ,
The dimensionless oxidative duty fraction is . Figure 9 illustrates these independently controllable quantities.
Figure 9.
Periodic double-pulse potential programme. Oxidative and reductive potentials and act for durations and . The period is and the oxidative duty fraction is . This schematic is not experimental data. The role of the reductive pulse must be established experimentally; regeneration or propagation is not assumed.
Figure 9.
Periodic double-pulse potential programme. Oxidative and reductive potentials and act for durations and . The period is and the oxidative duty fraction is . This schematic is not experimental data. The role of the reductive pulse must be established experimentally; regeneration or propagation is not assumed.
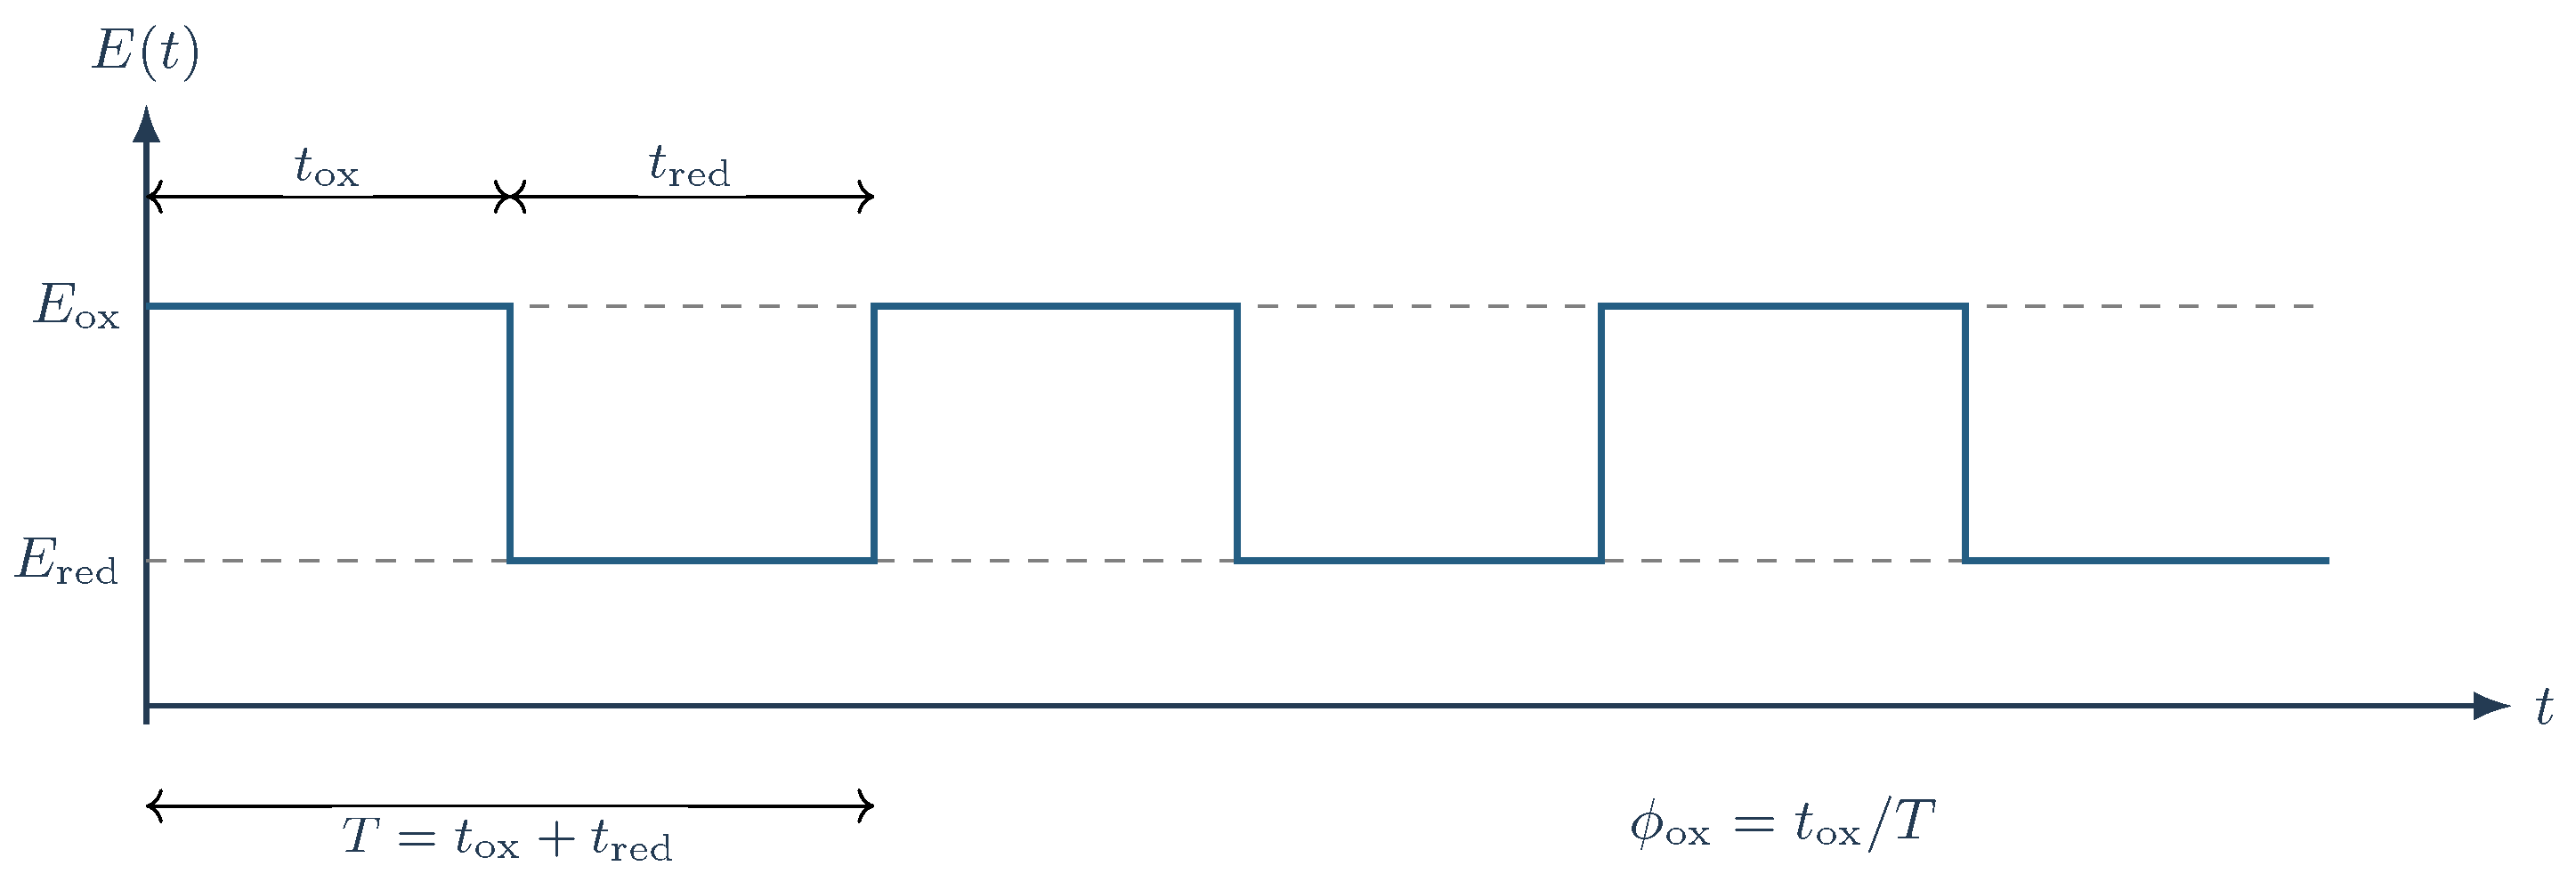
Potential and duration can be varied separately, but the effect of each segment on activation, competing losses and accumulation requires experimental comparison.
5.7. Reaction and Mass-Transport Regimes
For an apparent first-order surface coefficient [m s−1], a characteristic length L [m] and precursor diffusivity [m2 s−1], define the surface Damköhler number
For a first-order volumetric coefficient [s−1], the volumetric Damköhler number is
For convection at characteristic speed u [m s−1], the Péclet number is . All three numbers are dimensionless. Distinguishing from prevents mixing dimensionally different kinetic descriptions.
5.8. Global Balance and Experimental Observables
For a closed reactor, let be the initial precursor amount, the remaining precursor, the material pool, the competing transformation-product pool, and other separately assigned retained or solid material. These mutually exclusive amounts are expressed on the same precursor-equivalent basis [mol]; sampled material must be included when relevant. Conservation gives
The percentage precursor disappearance is
and the fraction of transformed precursor incorporated into the material is
The dimensionless yield is defined when the denominator is nonzero. Decolorization, precursor disappearance, material incorporation and mineralization are therefore different observables. Table 5 connects the principal variables to measurements.
Model development should be hierarchical: first an identifiable lumped model, then spatial mass transport, and finally, if supported by independent observations, porous-electrode potential distributions and effective diffusion. Additional complexity must not replace experimental identifiability.
5.9. Audit of Equations and Constitutive Relations
The framework combines conservation laws, standard electrochemical relations and phenomenological expressions. Table 6 distinguishes their physical roles, dimensions, assumptions and validation requirements. A satisfactory fit is not proof of a molecular mechanism.
6. Electropolymerization as a Potential Water-Treatment Strategy
6.1. From Film Fabrication to Separation
A functional film can be sufficient for sensing, whereas treatment requires evidence of how much pollutant leaves the liquid, its chemical and physical destination, residual products and electricity demand. No study in the audited core primarily targeted direct pollutant removal through electropolymerization of the azo dye itself. Methyl-orange oxidation studies provide a useful comparison but describe degradation rather than capture through material growth [2,19].
6.2. Decolorization, Precursor Disappearance and Mineralization
Absorbance tracks a chromophore, not the full organic-matter balance. Under validated analytical conditions, percentage decolorization is
where and are dimensionless absorbances initially and at time t, measured at the same wavelength and path length. They are distinct from electrode area A. Precursor disappearance requires specific calibration and, where products have overlapping spectra, a separation technique. Chemical oxygen demand and total organic carbon provide independent information about residual organic load; neither should be inferred from color alone.
6.3. Closing the Material Balance
For batch operation, the dimensionless balance-closure ratio is
A value near unity indicates closure within analytical uncertainty, provided that the mutually exclusive pools in Equation 21 include relevant products and sampled material. Electrode mass gain or a precipitate must not automatically be counted as polymer. If is the recoverable portion of the additional retained/solid pool [mol of precursor equivalents], the recovered fraction of transformed precursor is
The dimensionless requires a nonzero denominator and demonstrated recoverability of the counted material. Product assignment and recovery are separate measurements.
6.4. Energy Consumption and Efficiency
Electrical cell energy is
where W is energy [J], cell voltage [V], current [A], and final treatment time [s]. With consistent sign conventions, useful normalizations are [J m−3], [J kg−1] and [J kg−1], where V is treated volume and the two masses are removed and recovered precursor-equivalent masses. A phenol electropolymerization study illustrates the broader plausibility of polymerization-based separation, but does not establish transfer to azo dyes [20].
6.5. Porous Electrodes, Repeated Operation and Regeneration
Porous carbon can increase interfacial area while introducing adsorption, internal transport, nonuniform potential and blocking. Concentration loss must be compared with unpolarized controls. Repeated operation requires measurements of impedance, accessible area, material detachment, stability and electrode regeneration. Table 7 sets out the minimum complementary evidence.
Direct electropolymerization of an azo pollutant remains a separation hypothesis rather than a demonstrated treatment technology within this corpus. A defensible assessment must establish material identity, balance closure, selectivity, energy demand and operational stability together.
7. Knowledge Gaps and Experimental Roadmap
7.1. From Literature Gaps to Testable Hypotheses
Demonstrating a film is different from establishing its formation mechanism, the fraction of precursor incorporated and its usefulness for treatment. Research gaps should therefore be framed as falsifiable questions. The proposed sequence addresses material identity, activation and coupling, charge–material relations, waveform effects, porous-electrode transport and separation performance. Chemical evidence should precede increasing model or reactor complexity.
7.2. Gap 1: Chemical Identity of the Material
The term poly(azo dye) does not always imply resolved connectivity, molecular-weight distribution or a quantified distinction from adsorption and precipitation. For methyl orange, mechanisms established for hydroxylated or terminal-amino dyes cannot simply be transferred.
H1: under a defined electrochemical window, methyl orange gives rise to an electrogenerated material containing covalently transformed dye-derived units rather than only adsorbed or precipitated precursor.
Testing requires comparison of precursor, untreated electrode, unpolarized exposure control and polarized material. Fourier-transform infrared and Raman spectroscopy can identify functional-group changes; X-ray photoelectron spectroscopy probes surface chemical states. Scanning electron microscopy establishes morphology, not molecular connectivity. Where possible, analysis of detached material by molecular-mass or mass-spectrometric methods should constrain its oligomeric or polymeric nature.
7.3. Gap 2: Activation Sites and Coupling Pathways
Potential and protonation affect the methyl-orange response, but this dependence does not identify a polymerization intermediate.
H2: the distribution of protonation states and the applied potential determine the population of reactive intermediates and therefore modify the competition between coupling and non-polymerizing transformation pathways.
A potential–pH matrix should combine voltammetry, spectroelectrochemistry and product characterization. The dependence of peak potential [V] on pH may support proton–electron coupling but is not an automatic intermediate assignment.
7.4. Gap 3: Current, Precursor Disappearance and Growth
As shown in Section 5, total current contains capacitive, side-reaction and deposit-redox contributions.
H3: only a measurable fraction of the total transferred charge is associated with precursor incorporation into the electrogenerated material, and this fraction varies with operating conditions.
Current, charge, precursor concentration and recovered material should be measured simultaneously. The informative comparison is between charge, transformed precursor and incorporated equivalents, rather than maximum current. An apparent faradaic efficiency becomes interpretable only after establishing a defensible stoichiometric basis.
7.5. Gap 4: the Role of Potential Programmes
Potential cycling dominates the core, while potentiostatic and pulsed programmes are less represented. This limits conclusions about deliberate waveform control of activation, growth, reduction and degradation.
H4: waveform parameters modify product selectivity and material growth independently of total charge.
Programmes should be compared at similar charge where possible. Different yields of recoverable material at comparable charge would distinguish waveform effects from simple charge exposure. A reductive pulse should not be labeled regeneration until its effect is demonstrated using chemical and electrochemical controls.
7.6. Gap 5: Reaction and Transport in Porous Electrodes
A small geometric area can contain a large internal surface that is not uniformly accessible. Growing material may progressively change porosity and resistance.
H5: in porous carbon electrodes, the observed electropolymerization rate results from coupling between intrinsic electrochemical kinetics and time-dependent internal mass-transfer limitations.
Validation should vary agitation or flow, initial concentration, electrode dimensions and, where feasible, thickness or porosity. The dimensionless numbers , and defined in Section 5 organize the regimes. Electrochemical impedance spectroscopy before, during and after treatment can add information, provided its parameters are interpreted with physically justified circuits or models.
7.7. Gap 6: Electropolymerization Versus Degradation
A 2025 carbon-membrane reactor study of phenol reported oxygen-demand removal, current efficiency and energy consumption for polymerization rather than mineralization [20]. Its radical, persulfate and iron chemistry does not establish an equivalent azo-dye route.
H6: under selected electrochemical conditions, a significant fraction of transformed azo dye can be directed toward a recoverable electrogenerated phase while limiting soluble transformation products.
The decisive metric is material closure across liquid, electrode and solids, complemented by organic-load and product analyses. The goal is not merely to maximize precursor disappearance , but to improve recoverable fraction , stability and energy efficiency together. Table 8 links the six hypotheses to discriminating experiments and decision criteria.
7.8. A Staged Experimental Roadmap
Staged validation limits overparameterization and prevents ambiguous results from entering the model prematurely.
Stage I: Chemical identity.
Establish material identity and composition with electrode blanks, unpolarized adsorption and precursor comparisons. Maximizing removal is secondary at this stage.
Stage II: Electrochemical attribution.
Determine the potential window, acidity dependence, scan-rate behavior and interfacial evolution. Separate activation, transport and surface modification.
Stage III: Kinetic closure.
Record current, charge, concentration and recovered material together to estimate the minimum model parameters and assess identifiability.
Stage IV: Waveform optimization.
Compare constant potential, scans and pulses using recoverable yield per charge and energy, rather than current or disappearance alone.
Stage V: Electrode and reactor validation.
Introduce porous geometry, flow or intensified mixing after establishing the basic chemistry and kinetics. Improved transport and removal of accumulated material may facilitate continuous operation, but require independent evaluation for azo dyes.
Stage VI: Complex matrices and reuse.
Introduce interferents, variable ionic strength and synthetic or real matrices; evaluate reuse, electrode stability, recovered-material fate and effluent quality. Figure 10 summarizes this progression.
Each stage requires evidence before moving to a more complex model or reactor. Improved apparent performance alone does not establish the preceding chemical and mechanistic steps.
7.9. Criteria for a Predictive Model
A model is predictive only when parameters estimated from one subset of experiments reproduce independent observations. Fitting the same data used to construct it is calibration, not validation. A minimum output vector is
where collects the concentration, charge, accumulated inventory and recovery fraction defined above, with their respective units. Impedance parameters or product concentrations may be added when data quality supports them. For pulsed operation, a control vector is
where is initial concentration [mol m−3] and u characteristic flow speed [m s−1]; other entries are defined in Section 5. The vector is distinct from fluid velocity in Equation 16.
A useful model should predict beyond the exact calibration conditions, quantify uncertainty and fail detectably when the dominant mechanism changes. Complexity should increase only when a reduced model cannot explain independent observables simultaneously. Immediate priorities are material identity, quantitative closure among transformation, charge and recovery, and determination of waveform-dependent selectivity. These results are prerequisites for credible scale-up.
8. Conclusions and Perspectives
The reviewed literature establishes azo-dye electropolymerization as a route to functional electrode modification, while leaving important molecular and kinetic questions unresolved. The 33-study core is dominated by sensing and electroanalysis (31 studies), and the evidence for activation, coupling and growth is heterogeneous. Electropolymerization of an azo dye should therefore not be treated as one mechanism shared by the whole family.
Functional groups constrain plausible activation pathways. Proposals for hydroxylated dyes or terminal-amino systems provide useful comparisons but cannot automatically be transferred to methyl orange. Materials termed poly(methyl orange) have been prepared on different supports, yet intermediate identity, coupling positions, inter-unit connectivity and film–surface attachment remain incompletely determined. Current evolution and microscopy support electrochemical and morphological changes; neither independently establishes a complete polymer structure or a growth rate.
The proposed physicochemical framework separates transport, adsorption, activation, effective intermediates, competing routes and accumulation. It is intended to define experimentally testable balances and observables rather than impose an atomistic mechanism. The equation audit distinguishes conservation laws, standard electrochemical relations and phenomenological closures so that a good fit is not mistaken for molecular proof.
Potential-waveform design is a testable opportunity. Cycling dominates the core, while potentiostatic and pulsed procedures are less explored. Systematic variation of oxidative and reductive potentials and durations can test whether selectivity changes independently of total charge. A reductive segment must not be assumed to regenerate the electrode or propagate the material without direct evidence.
Treatment requires a different criterion from sensor performance. Decolorization, precursor disappearance, incorporation into a recoverable phase and mineralization are distinct. A removal claim must close the precursor balance across liquid, electrode and solids, characterize products, and relate recovery to charge and energy. No primary study in the audited core directly targeted removal of the azo pollutant through its own electropolymerization; this is a scope-limited research gap, not proof of universal absence.
The roadmap consequently prioritizes chemical identity, quantitative charge–transformation–recovery relations, waveform effects and porous-electrode transport before scale-up. Predictive status requires independent validation and quantified uncertainty. If a substantial fraction of transformed dye can reproducibly enter a recoverable phase at competitive energy consumption and acceptable effluent quality, electropolymerization may become relevant as a separation operation in addition to its established role in electrode modification. That possibility remains to be demonstrated.
Supplementary Materials
Supplementary Table S1 contains the complete 33-study primary evidence corpus, study titles, source details and digital object identifiers. It is provided in the accompanying supplementary material.
Author Contributions
Conceptualization, P.E.D.; methodology, P.E.D.; investigation, P.E.D.; formal analysis, P.E.D.; literature curation, P.E.D.; visualization, P.E.D.; writing—original draft preparation, P.E.D.; writing—review and editing, P.E.D. The author has read and agreed to the published version of the manuscript.
Funding
This work was supported through the ICETEX scholarship program for international students, 2025-2 cohort.
Institutional Review Board Statement
Not applicable.
Informed Consent Statement
Not applicable.
Data Availability Statement
No new experimental datasets were generated for this review. The literature corpus supporting the analysis is described in the manuscript and its supplementary material.
Acknowledgments
The author gratefully acknowledges the ICETEX scholarship program for international students, 2025-2 cohort, for the financial support that made the development of this research possible. The author also acknowledges GIMBA, Universidad Industrial de Santander, for the academic and research environment supporting this work. Computational assistance is disclosed in Section 2.4; the author remains responsible for the scientific content.
Conflicts of Interest
The author declares no conflicts of interest.
References
- Liv, L. Marvelous Characteristics of Hydroxyl-Functionalized Azo-Dye Polymers for Electrocatalytic Sensing: An Informative Review. ACS Polym. Au 2026, 6, 61–85. [Google Scholar] [CrossRef] [PubMed]
- Ramírez, C.; Saldaña, A.; Hernández, B.; Acero, R.; Guerra, R.; Garcia-Segura, S.; Brillas, E.; Peralta-Hernández, J.M. Electrochemical oxidation of methyl orange azo dye at pilot flow plant using BDD technology. J. Ind. Eng. Chem. 2013, 19, 571–579. [Google Scholar] [CrossRef]
- Giribabu, K.; Haldorai, Y.; Rethinasabapathy, M.; Jang, S.-C.; Suresh, R.; Cho, W.-S.; Han, Y.-K.; Roh, C.; Huh, Y.S.; Narayanan, V. Glassy carbon electrode modified with poly(methyl orange) as an electrochemical platform for the determination of 4-nitrophenol at nanomolar levels. Curr. Appl. Phys. 2017, 17, 1114–1119. [Google Scholar] [CrossRef]
- Kul, D.; Öztürk, G. Poly(Methyl Red) Modified Glassy Carbon Electrodes: Electrosynthesis, Characterization, and Sensor Behavior. Electroanalysis 2017, 29, 1721–1730. [Google Scholar] [CrossRef]
- Gooding, J.J.; Compton, R.G.; Brennan, C.M.; Atherton, J.H. The mechanism of the electro-reduction of some azo dyes. Electroanalysis 1996, 8, 519–523. [Google Scholar] [CrossRef]
- Tkach, V.V.; Martins, J.I.F.P.; Ivanushko, Y.G.; Yagodynets, P.I. Dye Electropolymerization for Electrochemical Analysis. A Brief Review. Biointerface Res. Appl. Chem. 2022, 12, 4028–4047. [Google Scholar] [CrossRef]
- Zahran, M. Conducting dyes as electro-active monomers and polymers for detecting analytes in biological and environmental samples. Heliyon 2023, 9, e19943. [Google Scholar] [CrossRef] [PubMed]
- Reddaiah, K.; Madhusudana Reddy, T.; Raghu, P. Electrochemical investigation of L-dopa and simultaneous resolution in the presence of uric acid and ascorbic acid at a poly (methyl orange) film coated electrode: A voltammetric study. J. Electroanal. Chem. 2012, 682, 164–171. [Google Scholar] [CrossRef]
- Acar, E.T.; Ortaboy, S.; Hisarlı, G.; Atun, G. Sensitive determination and electro-oxidative polymerization of azodyes on a carbon paste electrode modified with bentonite. Appl. Clay Sci. 2015, 105–106, 131–141. [Google Scholar] [CrossRef]
- Teixeira, M.F.S.; Barsan, M.M.; Brett, C.M.A. Molecular engineering of a π-conjugated polymer film of the azo dye Bismarck Brown Y. RSC Adv. 2016, 6, 101318–101322. [Google Scholar] [CrossRef]
- Bairagi, P.K.; Verma, N. Electrochemically deposited dendritic poly(methyl orange) nanofilm on metal-carbon-polymer nanocomposite: A novel non-enzymatic electrochemical biosensor for cholesterol. J. Electroanal. Chem. 2018, 814, 134–143. [Google Scholar] [CrossRef]
- Olean-Oliveira, A.; Oliveira Brito, G.A.; Teixeira, M.F.S. Mechanism of nanocomposite formation in the layer-by-layer single-step electropolymerization of pi-conjugated azopolymers and reduced graphene oxide: An EIS study. ACS Omega 2020, 5, 25954–25967. [Google Scholar] [CrossRef] [PubMed]
- Ziyatdinova, G.K.; Guss, E.V.; Morozova, E.V.; Budnikov, H.C. An Electrode Based on Electropolymerized Sunset Yellow for the Simultaneous Voltammetric Determination of Chlorogenic and Ferulic Acids. J. Anal. Chem. 2021, 76, 371–380. [Google Scholar] [CrossRef]
- Pradeepa, E.; Yanjerappa, A.N.; Sahana, H.R. Development of an inexpensive poly(MO)/CNT@PGE for voltammetric investigation of Methocarbamol in presence of Levofloxacin. Inorg. Chem. Commun. 2024, 161, 112041. [Google Scholar] [CrossRef]
- Mondini, L.; Bulin, L.A.X.; Mezalira, D.Z.; Zapp, E. Electrochemical sensor based on electropolymerized Orange G and oxygenated carbon nanotubes for the detection of dopamine. J. Mol. Liq. 2025, 437, 128642. [Google Scholar] [CrossRef]
- Sorkulu, G.; Alanyalıoğlu, M. Layer-By-Layer Assembly of Poly(Bismarck Brown Y) and Carbon Nanomaterial Films on a Pencil Graphite Electrode for Amperometric Detection of Nitrite. Electroanalysis 2026, 38, e70119. [Google Scholar] [CrossRef]
- Tawarah, K.M.; Abu-Shamleh, H.M. A spectrophotometric study of the tautomeric and acid-base equilibria of methyl orange and methyl yellow in aqueous acidic solutions. Dye. Pigm 1991, 16, 241–251. [Google Scholar] [CrossRef]
- Ahmed, L.N.; Krishnan, S.; Thomas, P.; Babu, S.G. A Theoretical Analysis of Nonlinear Phenomena in the Reaction-Diffusion Model under Unsteady-State Conditions in the Poly-Methyl Orange (PMO) Layer of a Non-enzymatic Biosensor for Cholesterol. J. Phys. Chem. B 2025, 129, 7059–7068. [Google Scholar] [CrossRef] [PubMed]
- Hou, J.; Li, X.; Yan, Y.; Wang, L. Electrochemical Oxidation of Methyl Orange in an Active Carbon Packed Electrode Reactor (ACPER): Degradation Performance and Kinetic Simulation. Int. J. Environ. Res. Public Health 2022, 19, 4775. [Google Scholar] [CrossRef] [PubMed]
- Wang, H.; Ge, X.; Du, M.; Dong, J.; Wang, Q.; Zhang, B.; Wang, P.; Li, J. High efficiency phenol removal from wastewater with low energy consumption enabled by an electropolymerization membrane reactor. Chem. Eng. J. 2025, 164920. [Google Scholar] [CrossRef]
- Xu, C.-X.; Huang, K.-J.; Fan, Y.; Wu, Z.-W.; Li, J. Electrochemical determination of acetaminophen based on TiO2–graphene/poly(methyl red) composite film modified electrode. J. Mol. Liq. 2012, 165, 32–37. [Google Scholar] [CrossRef]
- Li, X.-B.; Xu, G.-R. Selective Determination of Dopamine and Uric Acid at Poly(acid red 176) Modified Glassy Carbon Electrode in the Presence of Ascorbic Acid. Int. J. Electrochem. Sci. 2013, 8, 1920–1927. [Google Scholar] [CrossRef]
- Ge, C.-Y.; Rahman, M.M.; Li, X.-B.; Lee, J.-J. Simultaneous and interference-free detection of hydroquinone and catechol on poly(Evans Blue)-modified glassy carbon electrode. J. Electrochem. Soc. 2016, 163, B556–B562. [Google Scholar] [CrossRef]
- Kiranmai, S.; Veera Manohara Reddy, Y.; Venu, M.; Madhuri, Ch.; Anitha, K.; Madhavi, G.; Varada Reddy, A. Determination of Terazosin by using Poly (Congo red) Modified Carbon Paste Electrode. Anal. Bioanal. Electrochem. 2017, 9, 154–163. [Google Scholar]
- Kuskur, C.M.; Kumara Swamy, B.E.; Jayadevappa, H.; Shivakumar, K. Electropolymerized Congo Red Film based Sensor for Dopamine: A Voltammetric Study. Insights Anal. Electrochem. 2017, 3. [Google Scholar] [CrossRef]
- Edris, N.M.M.A.; Abdullah, J.; Kamaruzaman, S.; Saiman, M.I.; Sulaiman, Y. Electrochemical reduced graphene oxide-poly(eriochrome black T)/gold nanoparticles modified glassy carbon electrode for simultaneous determination of ascorbic acid, dopamine and uric acid. Arab. J. Chem. 2018, 11, 1301–1312. [Google Scholar] [CrossRef]
- Chiwunze, T.E.; Palakollu, V.N.; Gill, A.A.S.; Kayamba, F.; Thapliyal, N.B.; Karpoormath, R. A highly dispersed multi-walled carbon nanotubes and poly(methyl orange) based electrochemical sensor for the determination of an anti-malarial drug: Amodiaquine. Mater. Sci. Eng. C 2019, 97, 285–292. [Google Scholar] [CrossRef] [PubMed]
- Kuskur, C.M.; Kumara Swamy, B.E.; Jayadevappa, H. Poly (Evans blue) sensor for catechol and hydroquinone: A voltammetric study. J. Electroanal. Chem. 2019, 833, 512–519. [Google Scholar] [CrossRef]
- Kuskur, C.M.; Kumara Swamy, B.E.; Shivakumar, K.; Jayadevappa, H.; Sharma, S.C. Poly (sunset yellow) sensor for dopamine: A voltammetric study. J. Electroanal. Chem. 2019, 840, 52–59. [Google Scholar] [CrossRef]
- Naik, T.S. Sunil Kumar; Mwaurah, M.M.; Swamy, B.E. Kumara. Fabrication of poly (Sudan III) modified carbon paste electrode sensor for dopamine: A voltammetric study. J. Electroanal. Chem. 2019, 834, 71–78. [Google Scholar] [CrossRef]
- Konnur, S.B.; Naik, P.S.; Naik, P.B.; Nandibewoor, S.T. Electro analysis of 3-Aminopyridine at poly Eriochrome black T modified glassy carbon electrode and its oxidation mechanism. Chem. Data Collect. 2020, 25, 100336. [Google Scholar] [CrossRef]
- Mostafiz, B.; Fotouhi, L.; Dorraji, P.S. An electrochemical sensor based on an Eriochrome Black T polymer and deep eutectic solvent for the simultaneous determination of omeprazole and lansoprazole. Anal. Methods 2020, 12, 4072–4079. [Google Scholar] [CrossRef] [PubMed]
- Shetti, N.P.; Ilager, D.; Malode, S.J.; Monga, D.; Basu, S.; Reddy, K.R. Poly(eriochrome black T) modified electrode for electrosensing of methdilazine. Mater. Sci. Semicond. Process. 2020, 120, 105261. [Google Scholar] [CrossRef]
- Ariyanta, H.A.; Ivandini, T.A.; Yulizar, Y. Poly(methyl orange)-modified NiO/MoS2/SPCE for a non-enzymatic detection of cholesterol. FlatChem 2021, 29, 100285. [Google Scholar] [CrossRef]
- Charithra, M.M.; Manjunatha, J.G. Fabrication of Poly (Evans Blue) Modified Graphite Paste Electrode as an Electrochemical sensor for Sensitive and Instant Riboflavin Detection. Moroc. J. Chem. 2021, 9, 7–17. [Google Scholar] [CrossRef]
- Monnappa, A.B.; Manjunatha, J.G.G.; Bhatt, A.S.; Nagarajappa, H. Sensitive and selective electrochemical detection of vanillin at graphene based poly (methyl orange) modified electrode. J. Sci. Adv. Mater. Devices 2021, 6, 415–424. [Google Scholar] [CrossRef]
- Hasan, I.M.A.; Abd-Elsabur, K.M.; Assaf, F.H.; Abd-Elsabour, M. Folic Acid Determination in Food Samples Using Green Synthesized Copper Oxide Nanoparticles and Electro-Poly (Methyl Orange) Sensor. Electrocatalysis 2022, 13, 759–772. [Google Scholar] [CrossRef]
- Manjunatha, J.G.; Kanthappa, B.; Hareesha, N.; Raril, C.; Tighezza, A.M.; Albaqami, M.D. Enhanced Electrochemical Detection of Rutin Using Poly (Methyl Orange) Modified Carbon Paste Electrode as a Responsive Electrochemical Sensor. Chem. Afr. 2024, 7, 1141–1150. [Google Scholar] [CrossRef]
- Sahana, H.R.; Nayaka, Y. Arthoba; Pradeepa, E. Development of simple and effective poly methyl orange modified pencil graphite electrode for the voltammentric investigation of aminotriazole in presence of 2,4-dichlorophenoxyacetic acid. Microchem. J. 2024, 199, 109959. [Google Scholar] [CrossRef]
- Koçak, Ç.C.; Karabiberoğlu, Ş. Electropolymerized poly(Congo red) on graphene oxide: a novel platform for electrochemical sensing of acyclovir. Anal. Methods 2025, 17, 7156–7166. [Google Scholar] [CrossRef] [PubMed]
- Moussa, A.K.A.; Sağlam, Ş.; Can, Z.; Üzer, A.; Apak, R. Electrochemical Determination of N-Guanylurea Dinitramide (FOX-12) Using a Poly(Methyl Orange)-Modified Carbon Nanotube Electrode. ACS Omega 2025, 10, 19974–19982. [Google Scholar] [CrossRef] [PubMed]
- Şişman, E.; Öztürk, G.; Kul, D.; Ağın, F. Electrochemical Determination of Terazosin at a Poly(Allura Red AC)-Modified Glassy Carbon Electrode: Mechanistic Study and Application to Pharmaceutical Formulations and Serum Samples. Electroanalysis 2026, 38, e70171. [Google Scholar] [CrossRef]
Figure 1.
Conceptual pathways following electrochemical activation of an azo dye. The central sequence represents precursor activation, formation of effective reactive intermediates, molecular coupling and accumulation of an electrogenerated material. Alternative branches represent adsorption/desorption and competing redox or cleavage reactions that may generate soluble or insoluble transformation products. The relative importance of each pathway depends on potential waveform, pH, electrode material, electrolyte composition, precursor concentration and mass transport. Dashed arrows denote system-dependent possibilities; no specific atomic structure is assigned to the intermediates or repeating units.
Figure 1.
Conceptual pathways following electrochemical activation of an azo dye. The central sequence represents precursor activation, formation of effective reactive intermediates, molecular coupling and accumulation of an electrogenerated material. Alternative branches represent adsorption/desorption and competing redox or cleavage reactions that may generate soluble or insoluble transformation products. The relative importance of each pathway depends on potential waveform, pH, electrode material, electrolyte composition, precursor concentration and mass transport. Dashed arrows denote system-dependent possibilities; no specific atomic structure is assigned to the intermediates or repeating units.
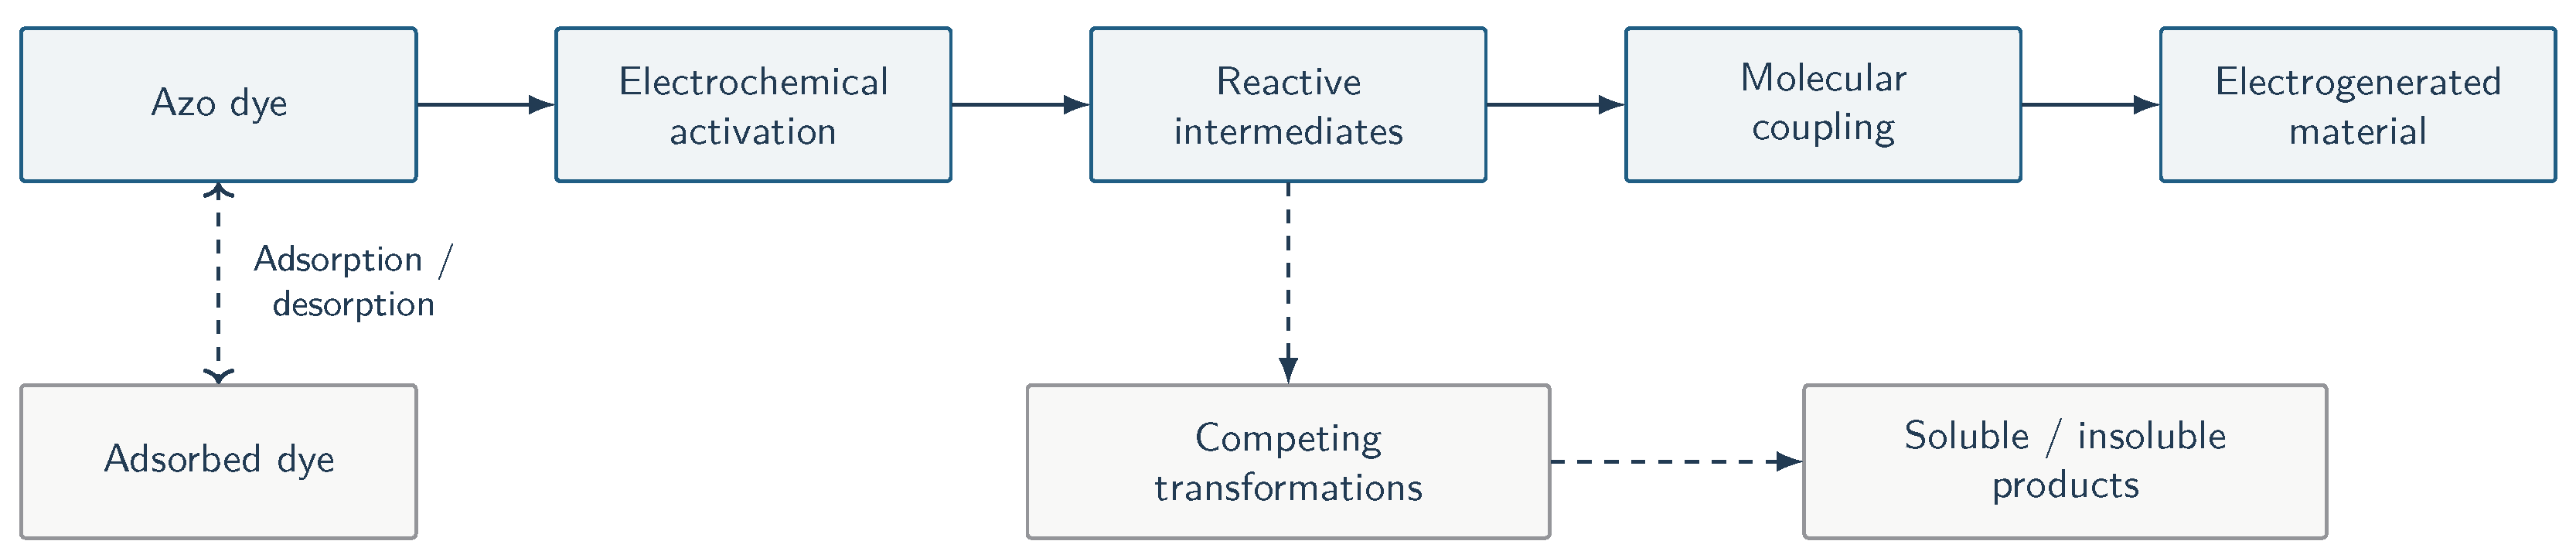
Figure 3.
Electropolymerization of Bismarck Brown Y (BBY) on fluorine-doped tin oxide (FTO). (A) Cyclic voltammetry (CV), to V vs. saturated calomel electrode (SCE), 100 mV s−1, in 10 mmol L−1 BBY and 1.0 mol L−1 hydrochloric acid. (B,C) Scanning electron microscopy (SEM) after 50 and 100 cycles, respectively; both scale bars are 1 m. Original A identifies the CV panel; original B identifies the 100-cycle micrograph. Reproduced from Figs. 2A and 5A,B of Teixeira et al. [10], accepted manuscript; layout adapted. © 2016 The Royal Society of Chemistry.
Figure 3.
Electropolymerization of Bismarck Brown Y (BBY) on fluorine-doped tin oxide (FTO). (A) Cyclic voltammetry (CV), to V vs. saturated calomel electrode (SCE), 100 mV s−1, in 10 mmol L−1 BBY and 1.0 mol L−1 hydrochloric acid. (B,C) Scanning electron microscopy (SEM) after 50 and 100 cycles, respectively; both scale bars are 1 m. Original A identifies the CV panel; original B identifies the 100-cycle micrograph. Reproduced from Figs. 2A and 5A,B of Teixeira et al. [10], accepted manuscript; layout adapted. © 2016 The Royal Society of Chemistry.
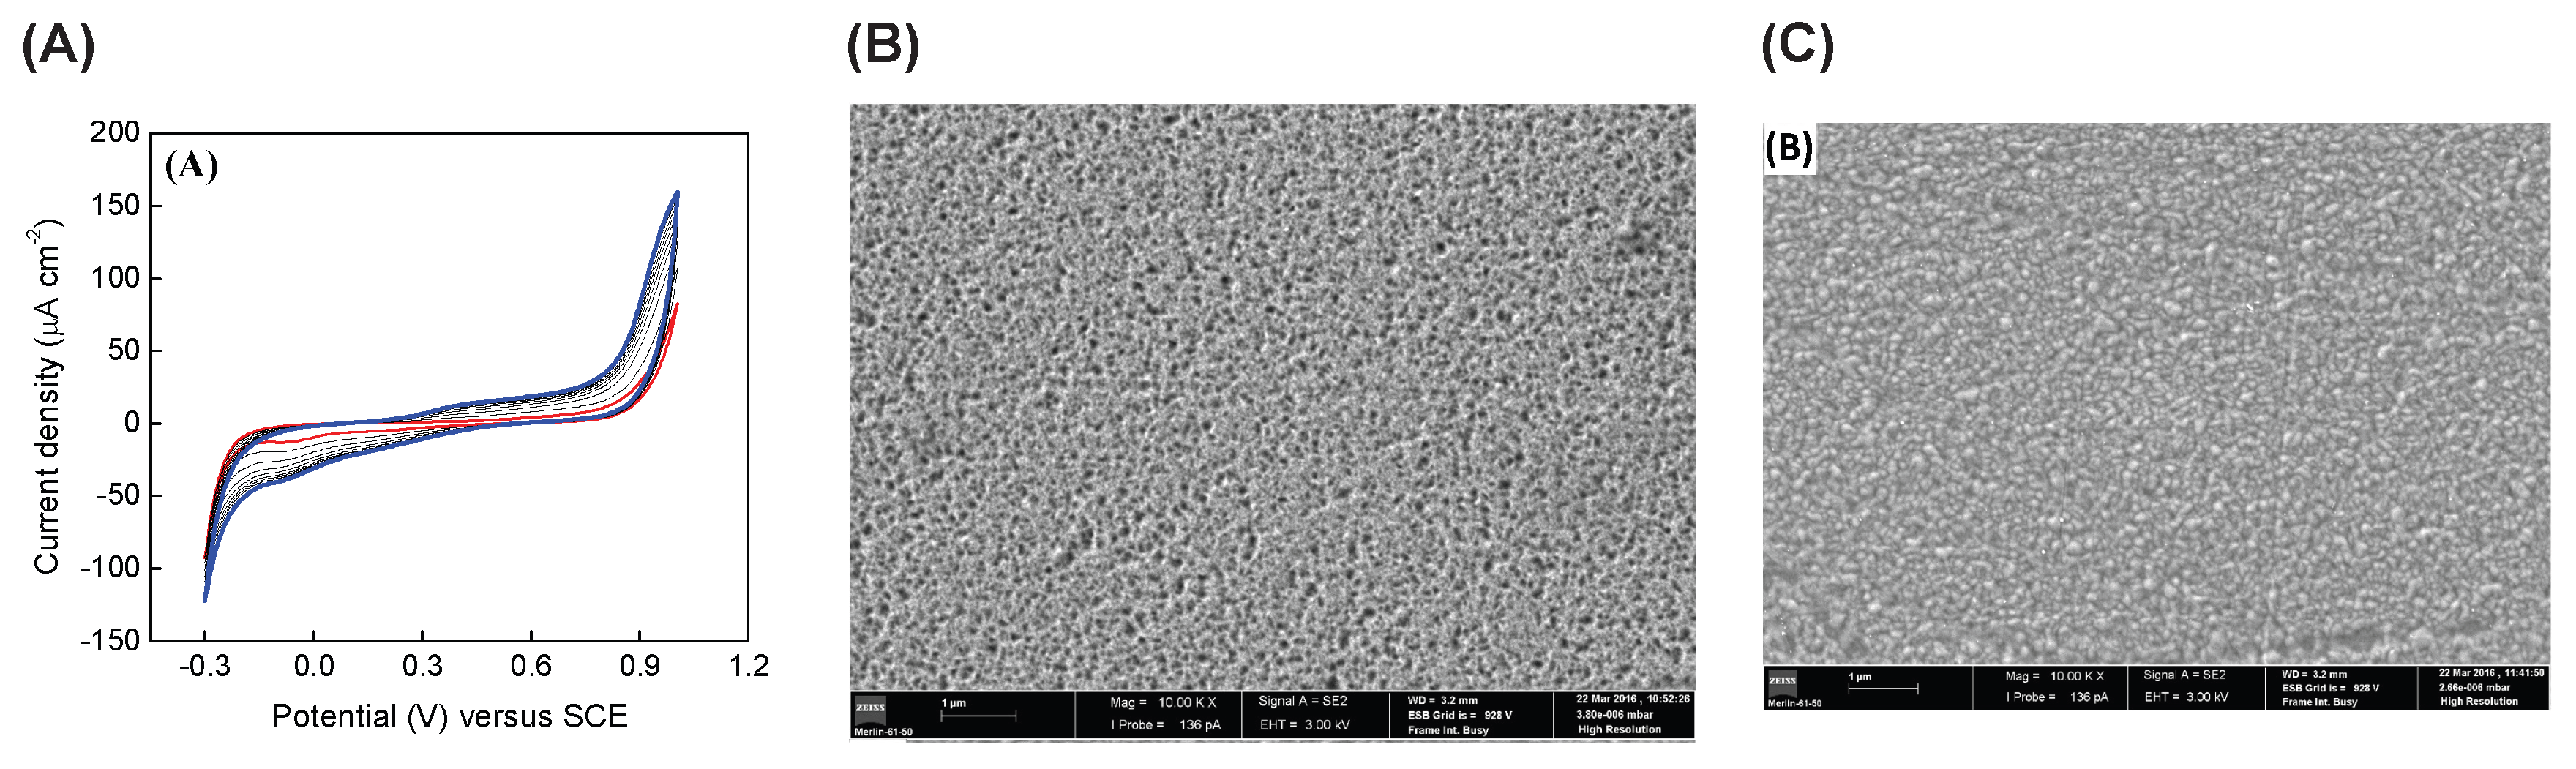
Figure 7.
Evidence and uncertainty for methyl orange (MO) and poly(methyl orange) (PMO). (A) Known precursor connectivity; protonated forms are omitted. (B) Sequence proposed by Bairagi and Verma [11]: adsorbed MO, an oxidized species described as a diazonium cation, and material assigned a quinoid PMO structure. Reported peaks are near and V vs. silver/silver chloride (Ag/AgCl; 0.3 mol L−1 KCl). (C) Unresolved intermediate identity, coupling sites, inter-unit connectivity and film–surface attachment. Panel B presents the source authors’ proposals, not atomic-resolution structural proof.
Figure 7.
Evidence and uncertainty for methyl orange (MO) and poly(methyl orange) (PMO). (A) Known precursor connectivity; protonated forms are omitted. (B) Sequence proposed by Bairagi and Verma [11]: adsorbed MO, an oxidized species described as a diazonium cation, and material assigned a quinoid PMO structure. Reported peaks are near and V vs. silver/silver chloride (Ag/AgCl; 0.3 mol L−1 KCl). (C) Unresolved intermediate identity, coupling sites, inter-unit connectivity and film–surface attachment. Panel B presents the source authors’ proposals, not atomic-resolution structural proof.
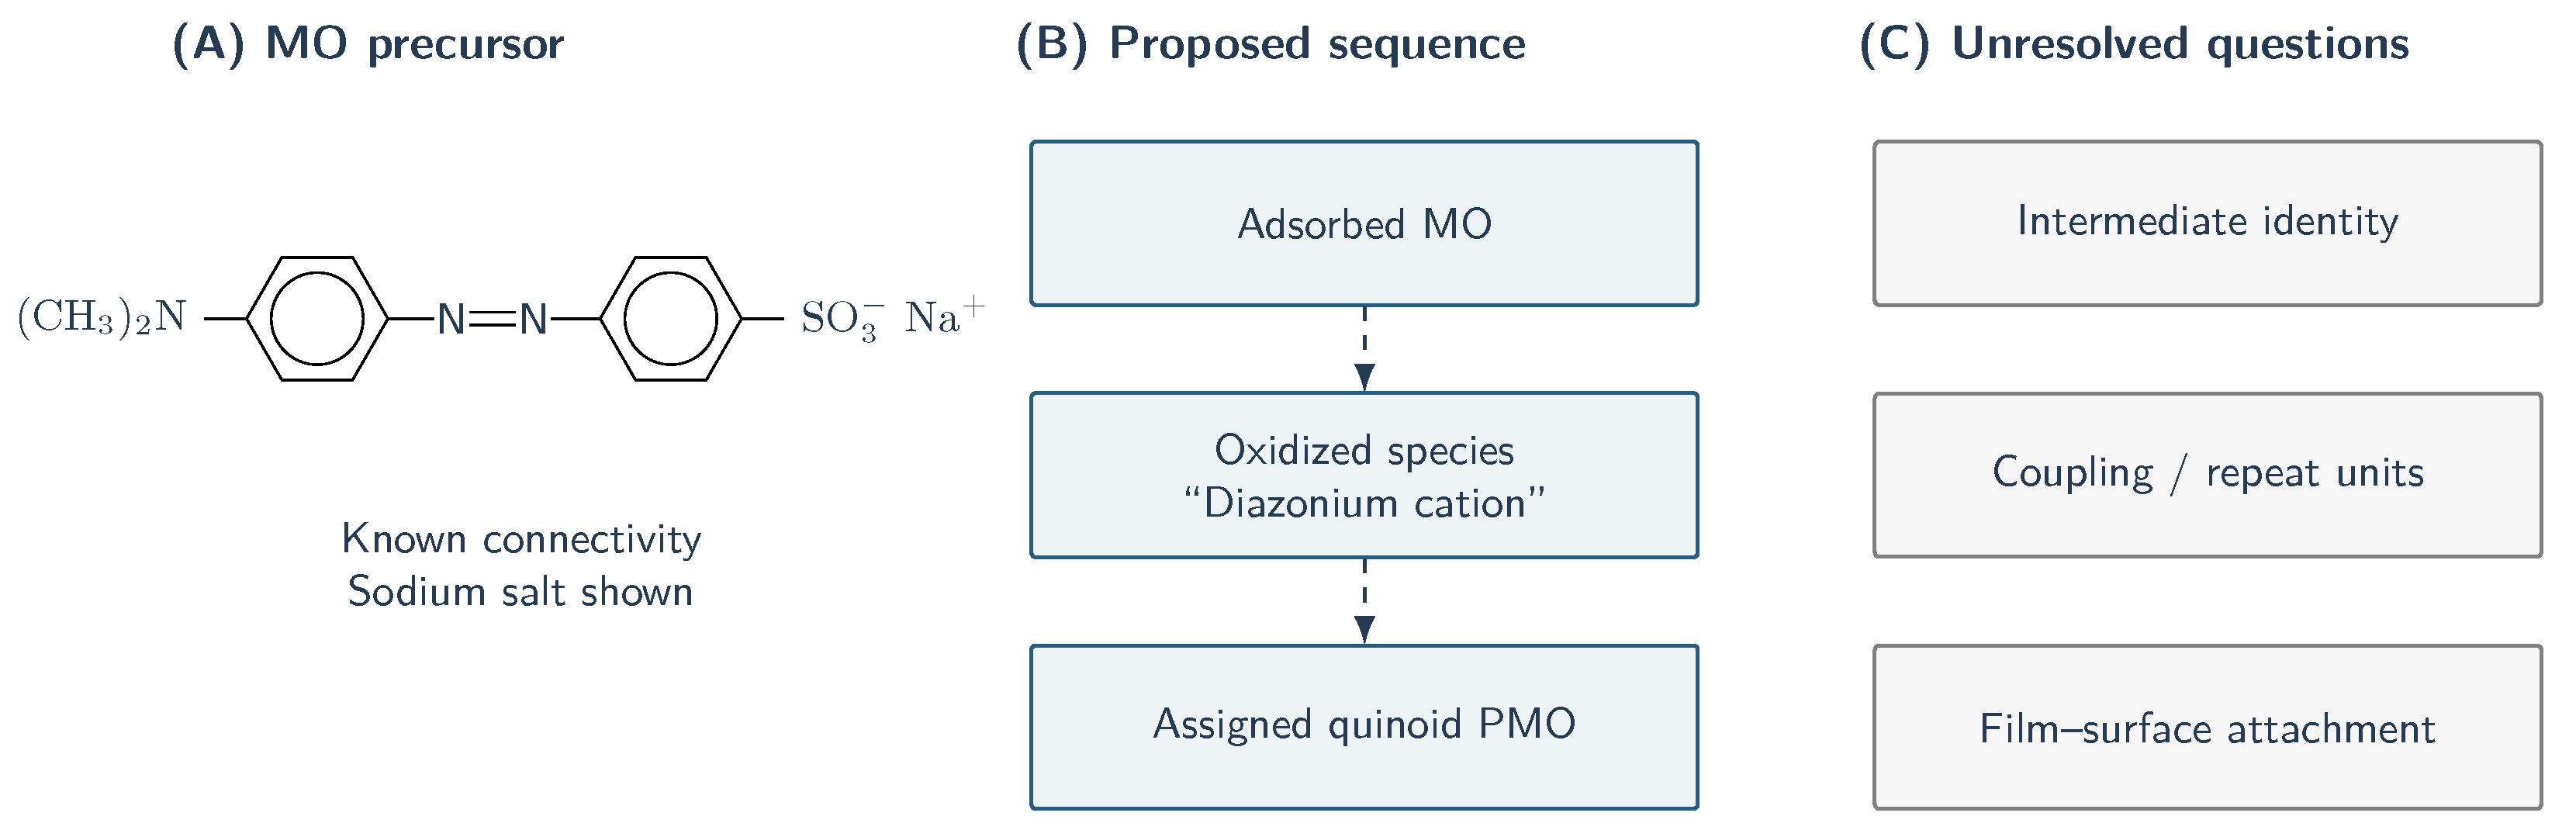
Figure 8.
Minimal physicochemical framework. Bulk precursor concentration supplies interfacial concentration and adsorbed inventory . Activation at rate produces the effective intermediate inventory ; formation at rate increases material inventory , while represents competing losses. The dimensionless feedback function describes a phenomenological effect of the film. Inventories and rates use a common precursor-equivalent basis. Precursor disappearance and material accumulation are distinct observables; this scheme is not an elementary molecular mechanism.
Figure 8.
Minimal physicochemical framework. Bulk precursor concentration supplies interfacial concentration and adsorbed inventory . Activation at rate produces the effective intermediate inventory ; formation at rate increases material inventory , while represents competing losses. The dimensionless feedback function describes a phenomenological effect of the film. Inventories and rates use a common precursor-equivalent basis. Precursor disappearance and material accumulation are distinct observables; this scheme is not an elementary molecular mechanism.
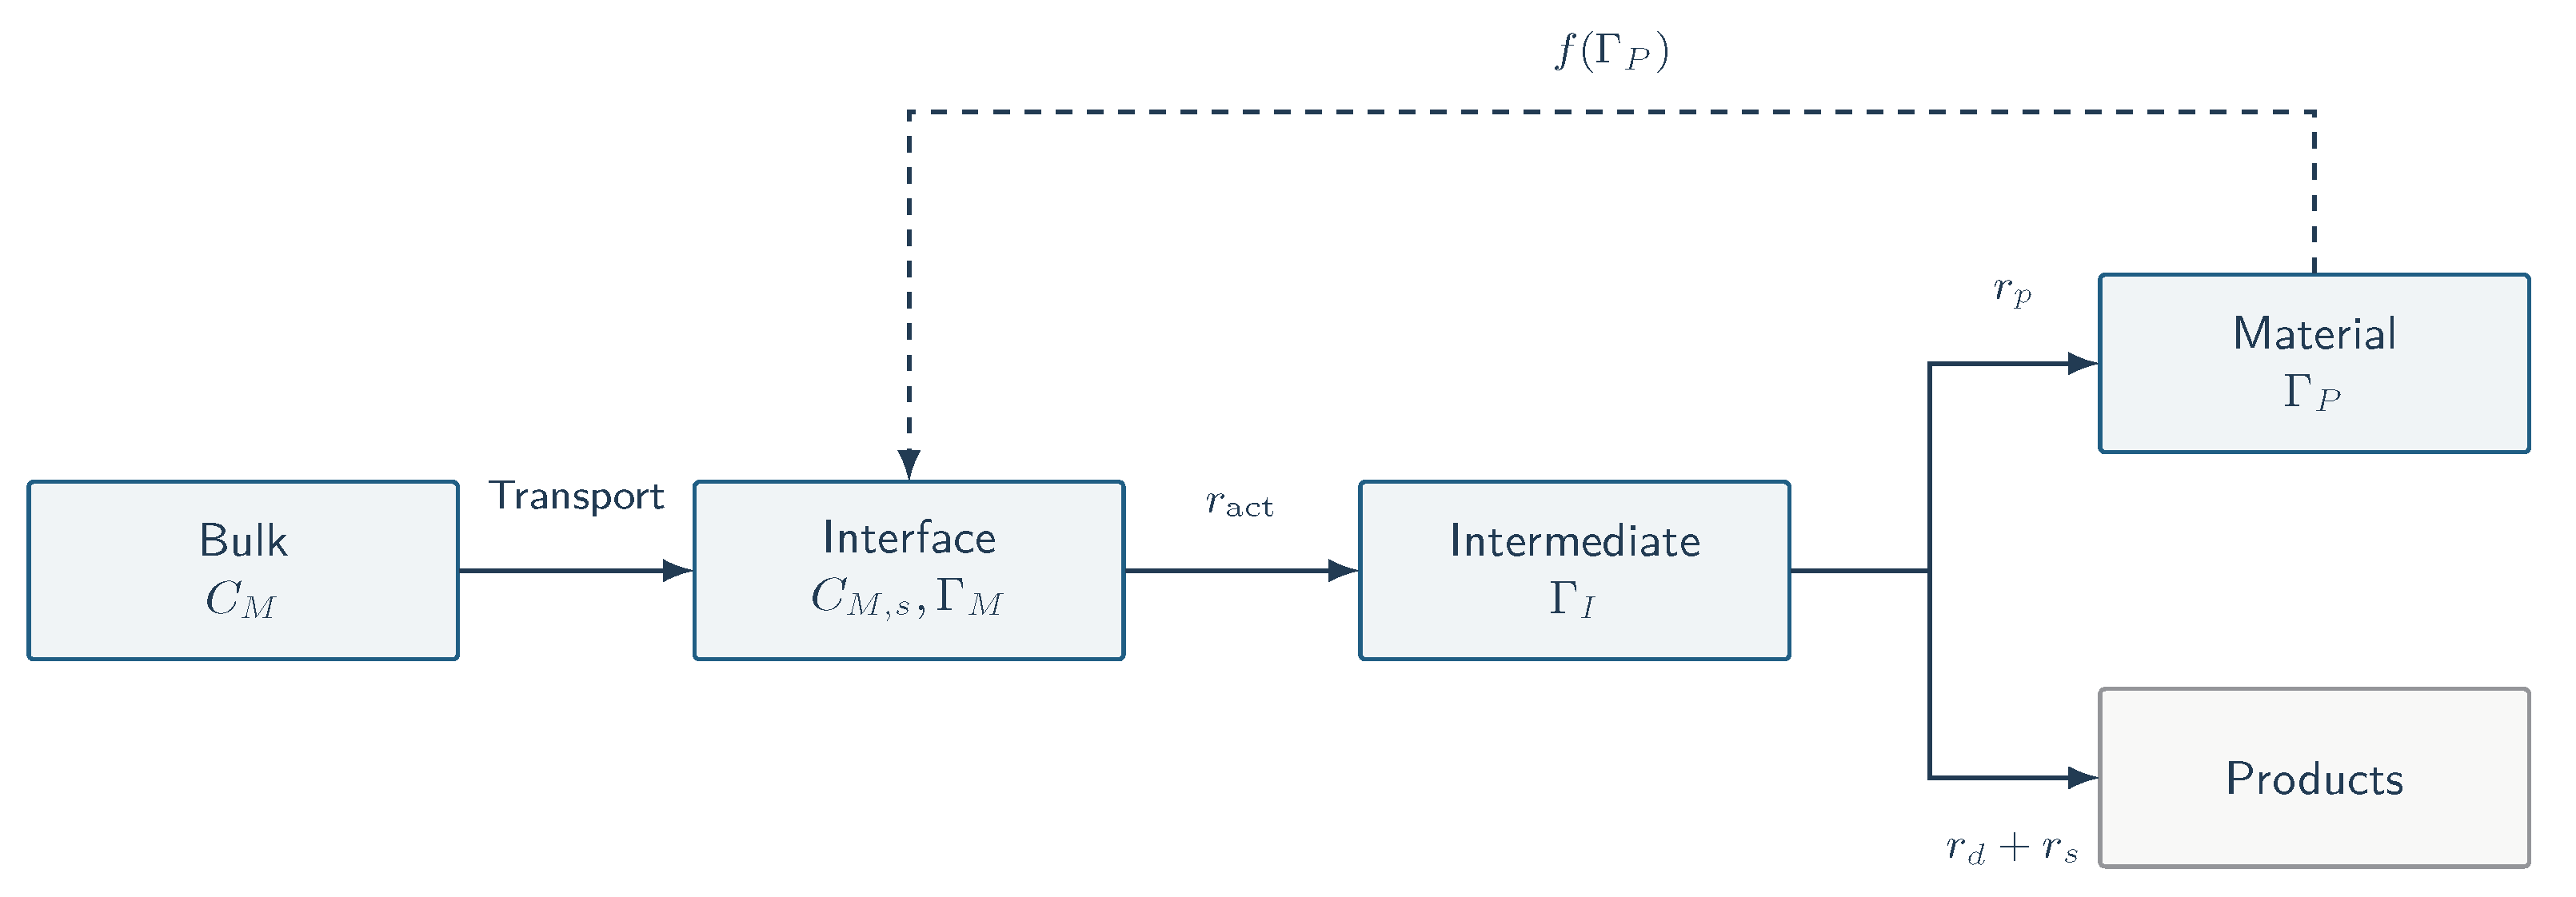
Figure 10.
Experimental roadmap for evaluating azo-dye electropolymerization. I: establish the chemical identity of the material; II: attribute the electrochemical response using appropriate controls; III: close and validate the kinetic description; IV: optimize the potential waveform; V: assess porous electrodes and reactor transport; VI: test complex matrices, reuse and stability. Each stage requires evidence before increasing model or reactor complexity.
Figure 10.
Experimental roadmap for evaluating azo-dye electropolymerization. I: establish the chemical identity of the material; II: attribute the electrochemical response using appropriate controls; III: close and validate the kinetic description; IV: optimize the potential waveform; V: assess porous electrodes and reactor transport; VI: test complex matrices, reuse and stability. Each stage requires evidence before increasing model or reactor complexity.
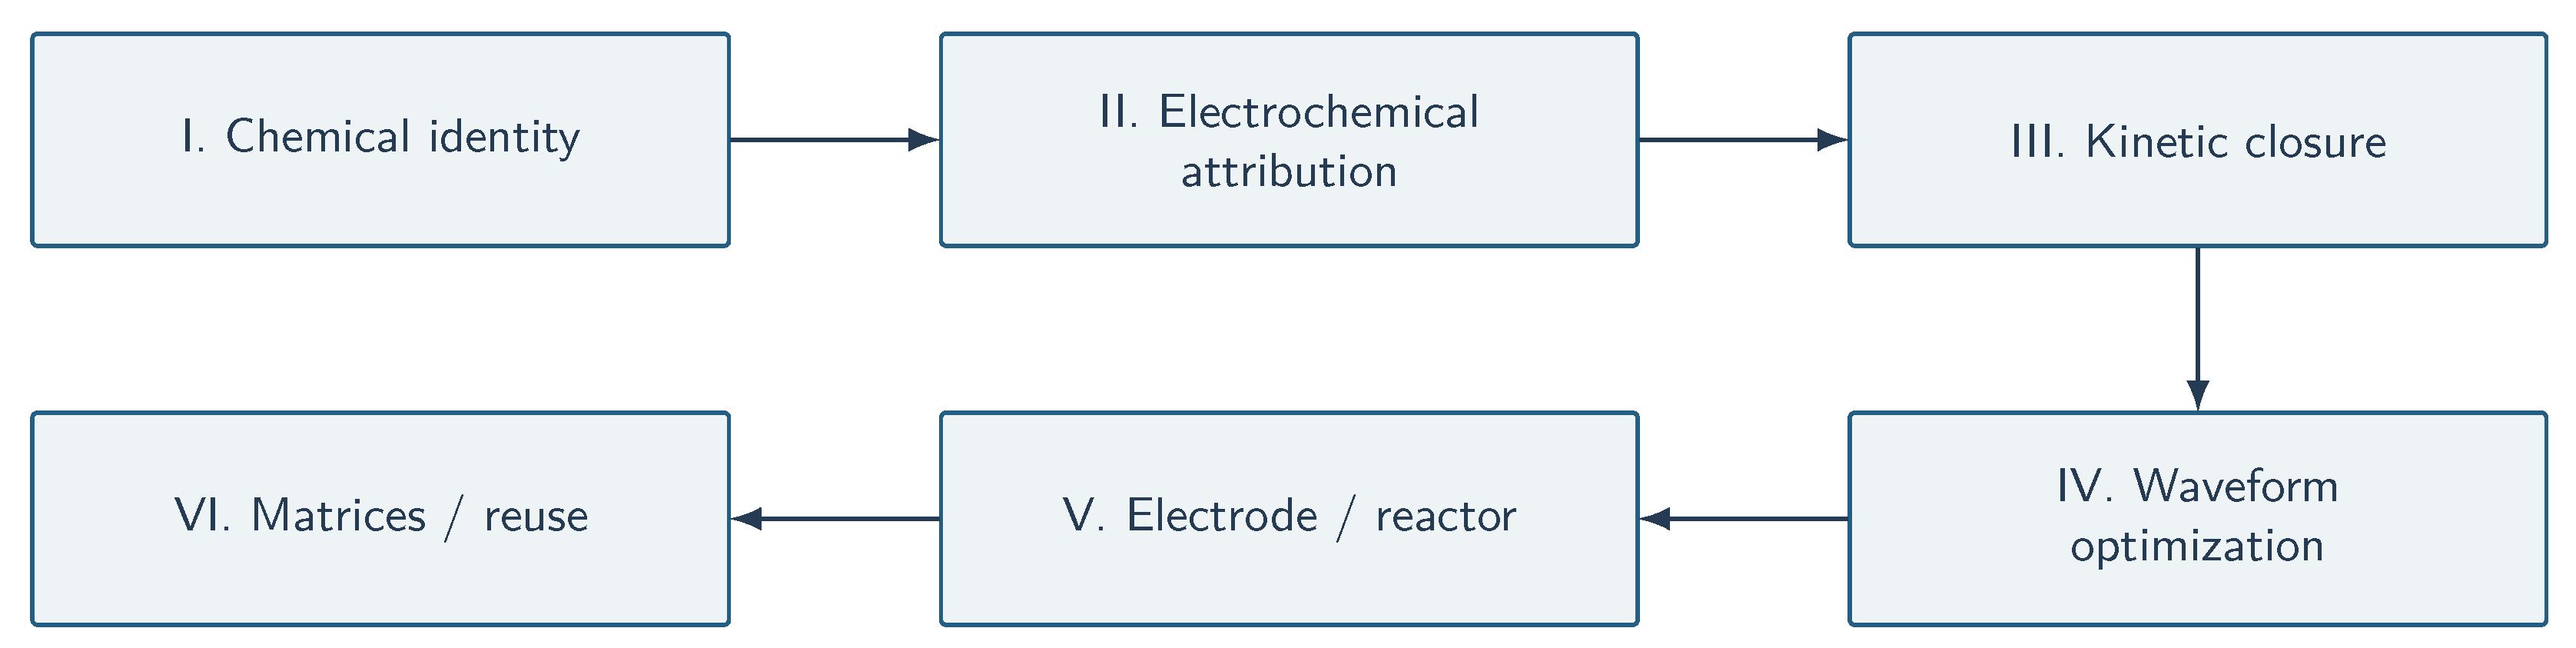

Table 1.
Representative studies from the 33-study primary evidence core.
| Year / reference | Precursor and support | Preparation / evidence | Main contribution |
|---|---|---|---|
| 2012 [8] | Methyl orange; carbon electrode | Electropolymerized film; voltammetry | Early methyl-orange-derived sensing film. |
| 2015 [9] | Lanaset Red 2B, Acid Blue 113 and Acid Yellow 17; bentonite-modified carbon paste | Potential cycling; voltammetry and infrared spectroscopy | Comparative activation and radical-coupling proposals; hydroxyl groups are not a universal requirement. |
| 2016 [10] | Bismarck Brown Y; fluorine-doped tin oxide | Electropolymerization; spectroscopy, impedance and microscopy | Electroactive film; morphology compared after 50 and 100 cycles. |
| 2017 [3] | Methyl orange; glassy carbon | Potential cycling; voltammetry and microscopy | Film formation and morphology; synthesis conditions differ between sections of the source. |
| 2017 [4] | Methyl red; glassy carbon | Potential cycling and differential pulse voltammetry | Electrosynthesis and sensor behavior depend on solution acidity. |
| 2018 [11] | Methyl orange; Cu/Ni–carbon-nanofiber–polymer composite | 45 cycles, to V vs. Ag/AgCl; microscopy and impedance | Dendritic film; authors propose diazonium/quinoid assignments. |
| 2020 [12] | Bismarck Brown Y; fluorine-doped tin oxide/reduced graphene oxide | 20 cycles; 1 mmol L−1 dye in 0.10 mol L−1 HCl | Terminal-amine oxidation and radical-cation coupling proposed for this system. |
| 2021 [13] | Sunset Yellow; carbon electrode | Potentiostatic preparation (1.1 V, 30 s, as reported in the reviewed record) | Less common example of constant-potential electropolymerization. |
| 2024 [14] | Methyl orange; carbon nanotubes/pencil graphite | Electropolymerized film; voltammetry | Low-cost nanocarbon sensing interface. |
| 2025 [15] | Orange G; oxygenated carbon nanotubes | Voltammetry, spectroelectrochemistry, infrared spectroscopy and microscopy | Chemical and morphological evidence links activation to changes in the deposited material. |
| 2026 [16] | Bismarck Brown Y; pencil graphite/carbon-nanomaterial multilayers | Layer-by-layer film assembly; amperometry | Continued development of dye-derived sensing architectures. |
Table 2.
Mechanistic interpretation of evidence relevant to azo-dye electropolymerization.
| Study / system | Experimental evidence | What it supports | What it does not establish |
|---|---|---|---|
| Acar et al. [9]; three azo dyes | Voltammetry and infrared spectra; initial/subsequent scans; dyes with and without hydroxyl groups. | Electrooxidative film formation compatible with radical coupling; phenolic hydroxyl groups are not universally required. | Unique radical identities, every new bond, chain length or molecular-mass distribution. |
| Teixeira et al. [10]; Bismarck Brown Y | Voltammetry, ultraviolet–visible spectra, impedance and microscopy after 50 and 100 cycles. | An electroactive film and a transition from porous texture to a denser layer with more cycles. | All propagation and termination steps at atomic resolution. |
| Olean-Oliveira et al. [12]; Bismarck Brown Y/reduced graphene oxide | Voltammetry, impedance and nanocomposite characterization during layer-by-layer preparation. | A proposed route involving terminal-amine oxidation, radical-cation coupling and propagation. | Transfer of this system-specific route to methyl orange or hydroxyazo dyes without structural justification. |
| Giribabu et al. [3]; methyl orange/glassy carbon | Deposition voltammetry, microscopy and film electrochemical response. | Electrochemical generation of a stable surface layer termed poly(methyl orange). | A unique repeat unit, connectivity or mass distribution; source synthesis conditions are inconsistent. |
| Bairagi and Verma [11]; methyl orange/composite support | Synthesis voltammetry and before/after microscopy; dendritic morphology; authors’ diazonium/quinoid assignments. | Film formation and a reversible electroactive response on the composite support. | Atomic-resolution structure or definitive intermediate assignments; the support may change the pathway. |
| Mondini et al. [15]; Orange G/nanotubes | Voltammetry, spectroelectrochemistry, infrared spectra and microscopy; changes near 1455 cm−1. | Converging evidence of chemical changes linking oxidation, azo-linkage transformation and phenolic chemistry. | A universal mechanism beyond the studied dye, support and medium. |
| Gooding et al. [5]; azo-dye reduction | Kinetic analysis versus pH for Orange G and Sunset Yellow FCF. | Coupled protonation/electron transfer and competing reduction pathways. | Polymerization from reduction alone, or direct transfer of rate constants to methyl orange. |
| Ramírez et al. [2]; methyl-orange degradation | Flow-cell electrolysis on boron-doped diamond and product analysis by liquid chromatography–mass spectrometry. | Competing pathways involving azo-linkage cleavage and subsequent transformation. | Polymerization or complete mineralization from precursor or color loss alone. |
Film formation, adsorption, degradation and covalent polymerization require complementary evidence. No voltammetric trend is treated as independent structural proof. Dye names retain the source designations.
Table 3.
Temporal distribution of the audited primary evidence core ().
| Period | Records | Fraction (%) | Interpretation |
|---|---|---|---|
| 2010–2014 | 3 | 9.1 | Early core studies using carbon electrodes for electroanalysis. |
| 2015–2019 | 13 | 39.4 | Expansion of sensing applications alongside mechanistic studies. |
| 2020–2024 | 12 | 36.4 | Increasing use of hybrids, nanocarbons and low-cost electrodes. |
| 2025–2026 | 5 | 15.2 | More extensive mechanistic characterization and continued sensor development. |
Counts refer to this evidence core, not a global bibliometric census. Search cutoff: 22 September 2026. Percentages sum to 100.1% because of rounding.
Table 4.
Trends and unmet needs within the audited evidence core.
| Trend | Evidence in the core | Interpretation | Need / caution |
|---|---|---|---|
| Electroanalytical sensing | 31 of 33 records include sensing or electroanalytical applications. | Film function is often characterized more extensively than growth chemistry. | Complement analytical performance with structural evidence and material/charge balances. |
| Carbon supports | Glassy carbon, carbon paste, nanotubes, graphene, reduced graphene oxide and pencil graphite recur. | Potential windows, adsorption and electron transfer can be tailored. | Do not automatically transfer mechanisms between carbon architectures. |
| Potential programme | Potential cycling dominates; potentiostatic growth is uncommon. | Window, cycles, acidity and support are largely optimized empirically. | Explore pulses and systematic waveform design. |
| Mechanistic evidence | Acar (2015), Teixeira (2016), Olean-Oliveira (2020) and Mondini (2025) provide complementary evidence. | Coupling routes depend on functional groups and medium. | The evidence does not support a universal azo-dye electropolymerization mechanism. |
| Modeling | A 2025 study models reaction and diffusion within an already formed poly(methyl orange) sensing film. | Mathematical description of a preformed film is feasible. | An explicit kinetic connection between activation, coupling and growth remains needed. |
| Water treatment | 0 of 33 studies primarily target direct pollutant removal through its own electropolymerization. | Sensor fabrication remains distinct from evaluation as a separation operation. | This is a research opportunity within the corpus; absence outside it has not been established. |
Numerical statements are limited to the 33 audited studies. The corpus is an evidence map rather than an exhaustive census.
Table 5.
Principal model variables and associated experimental observables.
| Symbol | Meaning | Unit | Estimation / evidence |
|---|---|---|---|
| Precursor concentration | mol m−3 | Validated ultraviolet–visible spectroscopy or high-performance liquid chromatography | |
| Adsorbed precursor inventory | mol m−2 | Adsorption isotherms and surface-sensitive techniques | |
| Effective intermediate inventory | mol m−2 | Latent variable; spectroelectrochemistry needed for assignment | |
| Accumulated material inventory | mol-eq m−2 | Gravimetry, electrochemical quartz crystal microbalance and material balance | |
| Total current | A | Chronoamperometry, cyclic voltammetry and pulse programmes | |
| Q | Charge | C | Time integration of |
| External mass-transfer coefficient | m s−1 | Hydrodynamic variation and independent estimation | |
| Precursor diffusivity | m2 s−1 | Rotating disk electrode or another transport-sensitive method |
mol-eq denotes moles on a common precursor-equivalent basis; all surface inventories use that basis when included in a balance. Spectral measurements require validated selectivity.
Table 6.
Audit of equations and constitutive relations in the physicochemical framework.
| Relation | Physical role | Dimensions | Assumption | Validation / status |
|---|---|---|---|---|
| Surface coverage | Dimensionless | Finite adsorption capacity | Definition; requires an interpretable surface inventory. | |
| Coverage balance | Adsorption, desorption, activation | s−1 | Langmuir-type sites; relevant adsorption | Constitutive hypothesis; compare unpolarized controls. |
| Butler–Volmer | Interfacial charge transfer | A m−2 | Identified redox step; activation control | Standard relation; does not establish polymer growth. |
| Tafel-type activation | Potential dependence | mol m−2 s−1 | One branch dominates | Reduced approximation; constrain independently. |
| Species-weighted | Speciation / acidity coupling | mol m−2 s−1 | Known reactive fractions | Requires independent speciation evidence. |
| Intermediate conservation | mol m−2 s−1 | Lumped intermediates; common basis | Effective-scale conservation balance. | |
| Power laws | Competing kinetics | Coefficients depend on order | Power law valid over fitted range | Phenomenological orders are not molecularities. |
| Apparent selectivity | Dimensionless | Relevant routes represented | Definition; requires product assignment. | |
| Material accumulation | mol-eq m−2 s−1 | Defined equivalent basis | Conservation; quantify deposits and losses. | |
| Effective thickness | Inventory-to-thickness conversion | m | Uniform apparent density/composition | Geometric approximation; caution for porous deposits. |
| Exponential blocking | Surface-activity feedback | Dimensionless | Monotonic activity loss | Phenomenological; compare alternatives. |
| Current decomposition | Electrical contributions | A | Conceptually separable contributions | Requires blanks, film controls and transient analysis. |
| Faraday relation | A | Known electron number and relevant area | Fundamental after identifying the reaction. | |
| Transferred charge | C | Appropriate baseline | Definition; state sign convention. | |
| Apparent faradaic efficiency | Dimensionless | Known composition and electron stoichiometry | Cannot be inferred from current or color alone. | |
| Convection–diffusion–reaction | Species transport | mol m−3 s−1 | Migration negligible or included | Conservation form; use Nernst–Planck if needed. |
| External transfer | Interfacial supply | mol m−2 s−1 | Lumped transfer coefficient | depends on hydrodynamics and geometry. |
| Porous-medium diffusivity | m2 s−1 | Specified tortuosity convention | Effective-medium approximation. | |
| and | Electrical forcing | V; dimensionless | Ideal imposed programme | Input definition; local potential may differ. |
| Regime diagnosis | Dimensionless | Appropriate characteristic scales | Scaling tools, not mechanistic proof. | |
| Global precursor balance | Matter conservation | mol-eq | All relevant pools included | Fundamental criterion; report closure. |
| Disappearance and yield | %; dimensionless | Common analytical basis | Operational definitions; neither proves mineralization. |
Symbols and their units are defined with the corresponding equations in Section 5; mol-eq denotes moles of precursor equivalents. The audit separates definitions and conservation laws from model-dependent closures.
Table 7.
Minimum evidence for evaluating electropolymerization as a treatment strategy.
| Claim | Minimum evidence | Recommended measurements |
|---|---|---|
| The original dye disappears | Selective decrease in precursor concentration | Validated ultraviolet–visible spectroscopy; preferably high-performance liquid chromatography |
| A material forms | Independent evidence of accumulated solid | Gravimetry or electrochemical quartz crystal microbalance; microscopy and surface characterization |
| The material derives from the dye | Chemical relationship between precursor and solid | Infrared, Raman and X-ray photoelectron spectroscopy |
| Removal exceeds adsorption | Comparison with unpolarized controls | Adsorption controls and material balance |
| Removal is not only degradation | Destination of transformed precursor | Liquid/solid analysis; chromatography with mass spectrometry |
| Organic load decreases | Independent carbon or oxygen-demand measurements | Total organic carbon and/or chemical oxygen demand |
| Recoverable material is obtained | Quantification of or | Phase-resolved balance in precursor equivalents |
| Energy demand is evaluable | Electrical work of the cell | , and recovered mass |
| The electrode is reusable | Stable performance across cycles | Repeated operation; impedance, mass and morphology |
| Effluent quality is acceptable | Residual-product assessment | Product identification and subsequent toxicity testing |
: recovered fraction of transformed precursor; : material yield; : cell voltage; i: current; t: time. The corresponding definitions and units are given in Section 5 and 6.
Table 8.
Knowledge gaps, hypotheses, experiments and decision criteria.
| Test | Testable question | Minimum experiment | Observables | Progress criterion |
|---|---|---|---|---|
| H1 | Is the material chemically distinct from adsorbed or precipitated dye? | Compare polarized electrode, open-circuit control, precursor and recovered solid. | Chemical spectra, mass and microscopy | Reproducible chemical changes and independently quantified material formation. |
| H2 | How do acidity and potential change activation and products? | Potential–pH matrix at comparable exposure time and transport. | Voltammetry, peak potential, spectra and products | Systematic dependence beyond acid–base color changes. |
| H3 | What fraction of charge produces recoverable material? | Simultaneous electrolysis, precursor analysis and solid quantification. | Reproducible charge–mass relation and acceptable balance closure. | |
| H4 | Does waveform control selectivity independently of charge? | Compare constant potential, scans and pulses at comparable charge. | , products and impedance | Statistically reproducible selectivity differences. |
| H5 | Is the porous electrode transport-limited? | Vary hydrodynamics, thickness/geometry and concentration. | Transients, and impedance | Predictable changes and scaling consistent with the model. |
| H6 | Does the process separate rather than merely transform the pollutant? | Treatment with complete phase-resolved balance. | Balance closure, organic load, products and | High recoverable fraction, controlled soluble products and acceptable energy demand. |
Q: charge; : remaining precursor; : material amount in precursor equivalents; : material yield; : recovery fraction; : mass-transfer coefficient; : surface and volumetric Damköhler numbers; : Péclet number; : energy per recovered mass. Definitions and units appear in Section 5 and 6; H1–H6 refer to the hypotheses in Section 7.
Disclaimer/Publisher’s Note: The statements, opinions and data contained in all publications are solely those of the individual author(s) and contributor(s) and not of MDPI and/or the editor(s). MDPI and/or the editor(s) disclaim responsibility for any injury to people or property resulting from any ideas, methods, instructions or products referred to in the content. |
© 2026 by the authors. Licensee MDPI, Basel, Switzerland. This article is an open access article distributed under the terms and conditions of the Creative Commons Attribution (CC BY) license (http://creativecommons.org/licenses/by/4.0/).
Copyright: This open access article is published under a Creative Commons CC BY 4.0 license, which permit the free download, distribution, and reuse, provided that the author and preprint are cited in any reuse.