

Submitted:
28 September 2026
Posted:
29 September 2026
You are already at the latest version
Abstract
University campus buildings consume significant energy through chilled water (CHW) systems, yet facility and energy managers lack tools that connect sensor data to actionable, spatially grounded decisions without requiring programming expertise. We present BearcatAI, an end-to-end analytics platform developed at the University of Cincinnati that unifies machine learning demand prediction, a large language model (LLM) conversational interface, an interactive 3D GIS-derived campus visualization, and a ROS-based robotic inspection system into a single web-accessible workflow. The platform is informed by ten years of monthly CHW records (July 2015–July 2025) and validated against 271 days of daily meter data across 70 UC buildings (June 2025–February 2026). An ensemble of XGBoost and Random Forest models achieves R2=0.987 and MAPE =21.8% on DAAP, the priority building identified by the UC utility engineering team. Beyond building-specific models, we introduce use-type models that pool buildings by functional category (Academic, Research, Administrative, Housing, Recreation, Medical) and learn a transferable CHW intensity pattern without any building-specific identity features. Leave-One-Building-Out (LOBO) cross-validation shows that the Research type model generalizes to unseen research buildings with median R2=0.911, and the Academic model achieves R2=0.918 on DAAP without having seen it during training, validating the hypothesis that a functional type model can serve as a generalizable benchmark for campus CHW consumption. A natural language interface powered by BearcatGPT, UC’s hosted instance of GPT-4.1, free for students and faculty, allows utility managers to query anomalies, request forecasts, and generate building charts through conversation. Anomalous buildings are automatically highlighted in a 3D campus model spanning UC Main Campus, Medical Campus, and Digital Futures. A ROS-based inspection robot, trained in a Digital Futures digital twin via reinforcement learning, is under ongoing development and is described as a future integration target. The platform is designed for open deployment on JetStream2 academic cloud infrastructure.
Keywords:
chilled water
; building energy management
; large language model
; 3D campus visualization
; use-type benchmarking
; anomaly detection
; digital twin
; robotic inspection
; university campus
; sustainable facilities
1. Introduction
The use of computational methods to support architectural decision-making has a long history in performance-driven design research within the AECO industry. Earlier studies demonstrated how simulation, analytics, and digital prototyping could inform building design and façade development by integrating environmental and performance criteria into the design process [1,2]. These efforts established the value of data-informed decision-making during design and construction, moving architectural practice beyond purely formal and aesthetic considerations [3]. As buildings have become increasingly instrumented, Building Information Modeling (BIM) has extended this performance-oriented approach into facility management by integrating building information with operational and maintenance data [4]. More recently, digital twin technologies have further expanded this framework by linking physical assets with real-time data streams to support monitoring, analysis, and operational decision-making throughout the building lifecycle [5,13]. Building on these developments, this study applies AI-assisted analytics and spatial visualization within a campus-scale digital twin environment to support continuous building performance assessment, benchmarking, and sustainable facility management.
Chilled water systems represent one of the largest and most variable energy expenditures on university campuses, serving concurrent cooling demands across academic, research, residential, and clinical facilities. Effective management of these systems—detecting anomalies, forecasting demand, and benchmarking buildings against peer facilities—requires capabilities that are theoretically available through sub-metered building automation data but operationally inaccessible to most utility and facility teams. The gap is not data availability; it is the absence of tools that translate data into spatially contextualized, interpretable decisions without requiring programming expertise.
This paper presents BearcatAI, developed at the University of Cincinnati’s eXtended Reality (XR) Lab, Digital Futures, in collaboration with UC Utility Management. The project originated from a direct question posed by UC’s energy engineering team: can we predict how much chilled water a building of a given type should consume based on weather and the academic calendar, and automatically flag when a building deviates from that expectation? This question motivates the two complementary model approaches in this paper: building-specific models for well-metered facilities, and use-type models that establish a generalizable CHW intensity benchmark for each functional building category.
The paper is guided by two explicit research questions:
- 1.
- RQ1: Can functional building-type models generalize CHW demand prediction to unseen buildings within the same category, enabling transferable benchmarking without building-specific training data?
- 2.
- RQ2: How can natural language and spatial interfaces be integrated into a campus-scale digital twin framework to support building performance analytics and facility management?
From an architectural perspective, this research contributes to the emerging field of operational digital twins for campus-scale built environments. Rather than focusing solely on energy prediction accuracy, the study investigates how spatially contextualized analytics, building-type benchmarking, and digital representations of the campus can support performance-informed decision-making throughout the building life cycle. BearcatAI addresses three interconnected challenges in sustainable campus facility management:
- 1.
- Accessibility: CHW data and ML predictions are exposed through a natural language interface (BearcatGPT, UC’s hosted GPT-4.1) that requires no technical expertise, lowering the barrier for energy engineers and facilities staff.
- 2.
- Spatial context: anomaly alerts and building comparisons are grounded in an interactive 3D campus model derived from GIS data, spanning UC Main Campus, Medical Campus, and Digital Futures, giving utility managers immediate visual context for flagged buildings.
- 3.
- Physical verification: a ROS-based inspection robot, trained in a Digital Futures digital twin using reinforcement learning, represents an ongoing investigation into closing the loop from data-driven anomaly detection to on-site physical inspection.
The remainder of the paper is organized as follows. Section 2 reviews related work. Section 3 describes the full system architecture. Section 4 introduces use-type models and LOBO evaluation. Section 5 presents building-level validation results. Section 6 discusses deployment and limitations. Section 7 concludes.
2. Related Work
Chilled water and campus energy prediction.
Data-driven approaches to building energy prediction are well established [6]. Degree-day features at a F base are standard predictors of HVAC-driven energy demand [7], and energy use intensity (EUI, normalized by floor area) is the standard cross-building comparison metric in campus sustainability reporting [8]. Most existing campus energy analytics platforms, however, are designed for engineers with programmatic data access; natural language interfaces that support non-technical users remain rare.
Building type benchmarking.
Commercial tools such as ENERGY STAR Portfolio Manager compare building EUI against type-specific national distributions [9]. BearcatAI extends this concept from static annual benchmarking to daily demand prediction, and from national percentile comparison to a campus-specific model that predicts and flags deviations at daily granularity. The use-type model is the operationalized form of this benchmarking idea: rather than asking where a building falls in a national distribution, it asks how the building compares to a weather-driven prediction of what its type should consume today.
LLM interfaces for facility management.
Function-calling in large language models [10] enables LLM-powered systems to query structured databases, generate visualizations, and execute actions through natural language. Applications to building automation control [11] and energy optimization [12] have recently been demonstrated. BearcatAI applies this pattern to campus CHW analytics, where the LLM autonomously determines which data queries and predictions are needed to answer a facility manager’s question and executes them in a multi-step loop.
3D visualization for built environments.
BIM-integrated digital twin platforms represent the high-fidelity end of spatial building visualization for energy management [13]. Web-based 3D visualization using game engines (Unity, PlayCanvas, Unreal Engine) offers a lighter-weight browser-accessible alternative. BearcatAI demonstrates that GIS-derived building geometry, without BIM-level fidelity, is sufficient to provide operationally useful spatial context for anomaly communication.
Digital twin and sim-to-real transfer.
3. System Architecture
BearcatAI consists of four operational components—a data pipeline, an ML prediction and anomaly scoring layer, a FastAPI backend with LLM tool-calling, and a PlayCanvas 3D visualization front end—together with a planned robotic inspection module described in Section 3.5 as a future extension. Figure 1 illustrates their interactions.
3.1. Data Pipeline
CHW data was provided by Sid Thatham (Energy Engineer, UC Utility Management) in two forms. Monthly aggregates spanning July 2015–July 2025 (ten years) cover buildings across UC Main Campus, Medical Campus, and Digital Futures, providing long-term seasonal and year-over-year context. A supplementary daily dataset (UC_CHWusage_2025-2026) spanning June 1, 2025–February 28, 2026 (271 days) provides per-building daily readings paired with weather observations (, , outdoor air enthalpy), and was explicitly provided with the caveat that it contains noise values and erroneous meter inputs. The UC_CHWusage_2025-2026 dataset and ten years of historical CHW records were provided by UC Utilities Management and are not publicly available due to institutional data policies. Detailed preprocessing procedures, feature definitions, model configurations, and evaluation protocols are provided within the manuscript to support methodological reproducibility.
Preprocessing pivots both sources from wide-format (buildings as columns) to long-format (one row per building per day or month) and engineers the following features:
- Weather: daily maximum and minimum temperature (Fahrenheit), mean temperature, cooling degree days (CDD) and heating degree days (HDD) at base F, outdoor air enthalpy (Btu/lb).
- Calendar: day-of-week, weekend indicator, month, week-of-year, cyclical sine/cosine encodings of month and day-of-week to avoid ordinal discontinuities.
- Lag features: previous-day actual CHW usage (), 7-day rolling mean (), each computed per-building to preserve temporal structure without information leakage across buildings.
- Intensity target: CHW consumption normalized by gross square footage (ton-hr per thousand square feet, ton-hr/kSF), enabling cross-building model training without size confounds.
Missing weather values are interpolated; missing CHW readings are left as NaN and excluded from model training. The final training dataset spans June 2025–February 2026 (17,267 building-day rows across 77 buildings) after merging the daily data with an August 2025 pilot dataset and applying quality filtering. The building counts reported throughout this paper refer to different stages of data preparation and evaluation. The complete daily dataset initially contained records for 77 buildings. Of these, 70 buildings contained sufficient chilled water observations for model development and exploratory analysis. For formal building-level validation, a coverage threshold of at least 50% non-missing daily readings was applied, resulting in 56 buildings. Some performance comparisons further excluded buildings with incomplete metadata, near-constant readings, or undefined evaluation metrics, yielding a subset of 48 buildings for the use-type versus building-specific model comparison presented in Figure 3. Unless otherwise noted, reported model-training statistics refer to the full 77-building dataset, while validation results refer to the filtered subsets described above.
3.2. ML Prediction and Anomaly Scoring
Three models are trained on the pooled building-day dataset:
- Ridge Regression (): baseline for per-building residual statistics used in z-score anomaly detection.
- Random Forest (400 trees, min_samples_leaf ): ensemble member.
- XGBoost (800 rounds, lr , max_depth , subsample , colsample_bytree ): ensemble member.
Building identity and type are one-hot encoded as features alongside weather and calendar inputs. The top-2 models by RMSE on the per-building held-out test set (last 28 days per building) are ensembled by averaging. Predictions are back-converted from intensity to raw ton-hr using each building’s gross square footage.
Anomaly detection uses per-building z-scores:
where and are the training-set residual mean and standard deviation for building b. Two alert types are defined: single-day alert () and run alert ( for consecutive days). All artifacts are saved at training time and loaded at server startup for zero-latency inference.
Model performance was evaluated using multiple complementary metrics. was treated as the primary indicator because it measures the model’s ability to explain temporal variation in chilled water demand and remains stable when demand approaches zero. Mean Absolute Percentage Error (MAPE) was reported to facilitate comparison with prior building energy prediction studies but can become inflated during periods of very low consumption. Bias was used to identify systematic over- or under-prediction, while absolute error was considered when evaluating performance during low-demand periods where percentage-based metrics may be misleading. Together, these metrics provide a more complete assessment of predictive performance across buildings with different operational profiles.
3.3. FastAPI Backend and LLM Tool-Calling
The server exposes two endpoints: a conversational chat endpoint for natural language queries and a robot dispatch endpoint for direct navigation commands.
3.3.0.6. Conversational endpoint.
Each chat request constructs a BearcatGPT message list beginning with a system prompt defining BearcatAI’s role. A key feature is building context injection: buildings currently selected in the 3D campus view are forwarded as contextual metadata, enabling building-specific queries without the user needing to type a building name. If a building is selected when the user sends a message (e.g., “how is this building doing?”), the backend appends the selection to the system context so BearcatGPT resolves the referent automatically.
The server enters a tool-calling loop of up to 5 iterations. On each tool-call response, the server dispatches the requested function, serializes the result as JSON, and continues until BearcatGPT returns a natural language response. Six ML tools are available: list_buildings, get_recent_anomalies, summarize_building, plot_building_history, predict_for_building_date, and score_observation. A seventh tool, dispatch_robot, is described in Section 3.5.
3.3.0.7. UI actions.
When anomaly tool calls return flagged buildings, the server derives severity from z-scores (: high; : medium; otherwise: low) and appends structured flag_anomaly actions to the chat response. These are forwarded by the HTML overlay to the PlayCanvas scene via the ui:actions event bus, triggering visual highlighting independently of the text reply.
3.3.0.8. BearcatGPT.
The LLM is BearcatGPT, the University of Cincinnati’s hosted instance of GPT-4.1, provided free of charge to UC students and faculty through UC’s Azure OpenAI arrangement. The API follows the OpenAI chat completions format, making the system straightforward to migrate to any compatible endpoint.
3.4. PlayCanvas 3D Campus Visualization
The spatial front end is a PlayCanvas WebGL application hosting a GIS-derived 3D model of the UC campus. Building footprints and heights were extrapolated from GIS data covering UC Main Campus (academic, administrative, housing, and recreation facilities), UC Medical Campus (hospital and clinical research buildings), and the Digital Futures building. The model does not include UC Blue Ash or UC Clermont campuses.
Three JavaScript scripts implement spatial interaction. A raycasting BuildingPicker fires selection events on mouse-click against the scene’s collision hierarchy. A BuildingSelectionManager maintains the selected building set, applies a warm yellow emissive highlight (RGB 1.0/0.85/0.2, intensity 1.5), and synchronizes the selection to a global array read by the chat overlay on each message send, creating the spatial-to-LLM context link without server-side session state. A HighlightScript listens for ui:actions events from the LLM and, on flag_anomaly actions, applies a severity-graded red emissive highlight and renders a billboard “!” icon above each flagged building, oriented toward the camera and visible from any viewpoint.
The HTML overlay provides the chat panel, dispatch modal, and image viewer. Images returned by forecast tools appear as clickable “View chart” buttons opening a full-screen modal within the 3D scene.
3.5. Future Robotic Inspection Integration
A ROS-based mobile inspection robot is being explored as a future extension of the BearcatAI framework to investigate how anomaly detection workflows may be linked to physical building inspection. The robot is trained for autonomous navigation using reinforcement learning in a digital twin of the Digital Futures building, following the sim-to-real paradigm [14], with the design goal that learned navigation behaviors transfer to the physical space without additional on-site training.
Within BearcatAI, a dispatch_robot LLM tool parses a location target from conversational input and forwards it to the ROS navigation server. This enables a utility manager to describe an inspection target in natural language (e.g., “check the mechanical level of the flagged building”), and BearcatGPT resolves the location and issues the dispatch command. Physical validation of navigation transfer from the digital twin to the building is ongoing and is discussed further in Section 6.
3.6. Reproducibility and Implementation Details
Although the chilled water datasets used in this study are subject to institutional data-sharing restrictions, the modeling workflow is fully reproducible using comparable building energy datasets. The workflow consists of (1) data cleaning and quality filtering, (2) feature engineering including weather, calendar, lag, and building metadata variables, (3) normalization of chilled water consumption by gross square footage, (4) model training using Ridge Regression, Random Forest, and XGBoost algorithms, (5) model selection based on validation performance, and (6) anomaly detection using residual-based z-scores. All model hyperparameters, feature definitions, filtering criteria, and evaluation metrics are reported in this paper to facilitate replication using alternative datasets.
4. Use-Type Models for Transferable CHW Benchmarking
4.1. Motivation
Building-specific models require historical meter data per building and encode building identity as a learned feature. This limits applicability to buildings with sparse or absent metering and prevents cross-institutional use. The UC utility engineering team articulated the core hypothesis directly: “an academic building should consume CHW based on a type-level model, and that should theoretically apply to comparable academic buildings, although validation beyond the University of Cincinnati remains future work.” Use-type models operationalize this hypothesis: they learn CHW intensity patterns shared across buildings of the same functional category without any building identity encoding. This directly addresses RQ1.
4.2. Formulation
Let denote the set of building types (Academic, Administrative, Housing, Research, Recreation, Medical, University Hospital Infrastructure, Miscellaneous). A use-type model is trained on all building-day rows from all buildings of type t:
where is the CHW intensity (ton-hr/kSF) for building b on day d, and contains weather, calendar, lag, and gross square footage features but no building identity encoding. GSF is retained as a continuous feature, enabling the model to scale predictions by building size and thus apply to buildings of any size within the type.
4.3. Leave-One-Building-Out Evaluation
Standard held-out test sets would be optimistic because buildings in the test split share the type distribution with training buildings. We use Leave-One-Building-Out (LOBO) cross-validation to directly measure transfer to an unseen building:
where denotes the use-type model trained on all buildings of type except building b. A positive LOBO indicates that the type pattern generalizes; values near or below zero indicate that building-specific characteristics dominate over shared type signals.
4.4. Results
Table 1 summarizes results. The DAAP LOBO prediction is shown in Figure 2 and the full building-level comparison in Figure 3.
Figure 2.
True out-of-sample LOBO prediction for DAAP. The ACA use-type model was trained on 19 other academic buildings with DAAP withheld, then evaluated on 271 days of DAAP CHW meter readings. demonstrates strong seasonal pattern transfer from peer buildings. The systematic over-prediction indicates DAAP consumes less CHW than the average UC academic building of comparable size, a direct benchmarking outcome. Top: daily actual vs. predicted. Middle: daily residuals. Bottom: monthly totals with percentage deltas.
Figure 2.
True out-of-sample LOBO prediction for DAAP. The ACA use-type model was trained on 19 other academic buildings with DAAP withheld, then evaluated on 271 days of DAAP CHW meter readings. demonstrates strong seasonal pattern transfer from peer buildings. The systematic over-prediction indicates DAAP consumes less CHW than the average UC academic building of comparable size, a direct benchmarking outcome. Top: daily actual vs. predicted. Middle: daily residuals. Bottom: monthly totals with percentage deltas.
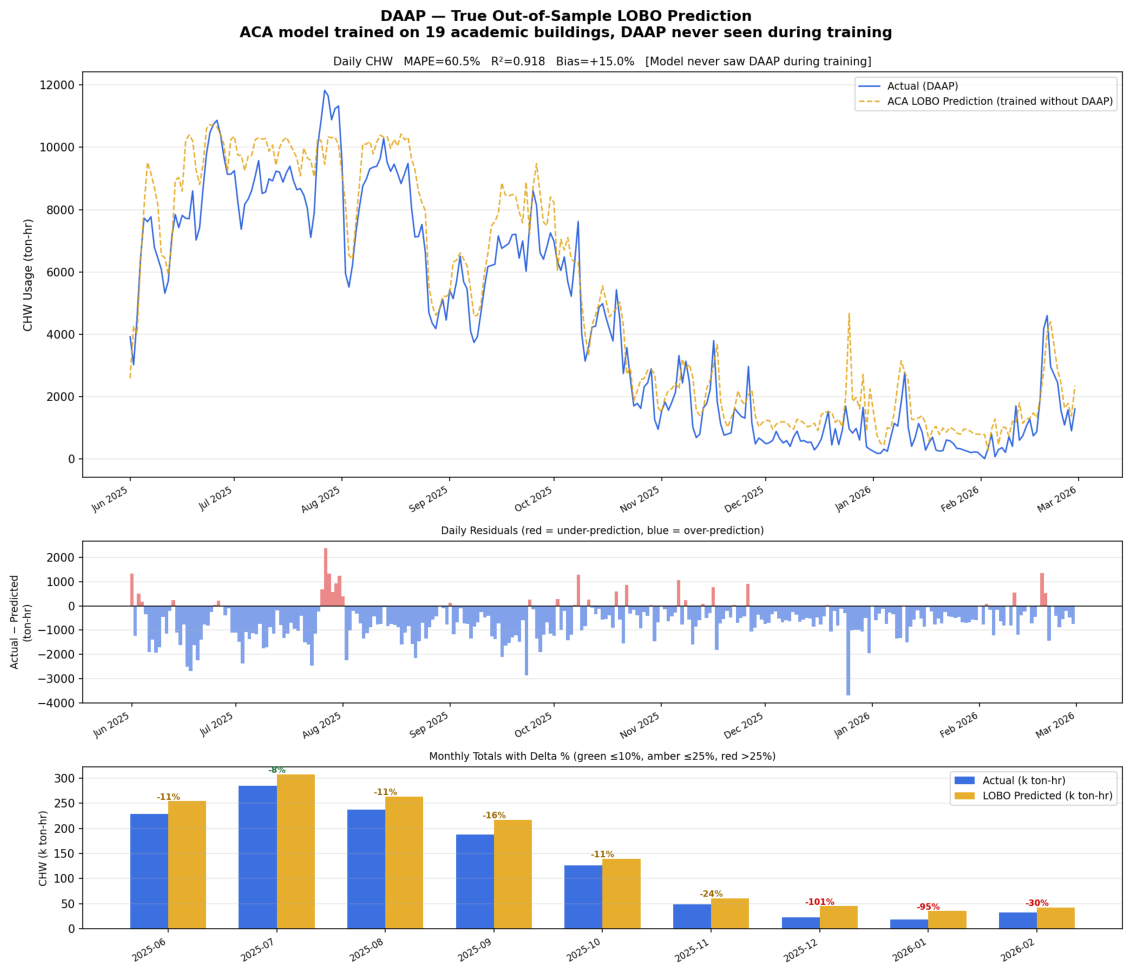
Figure 3.
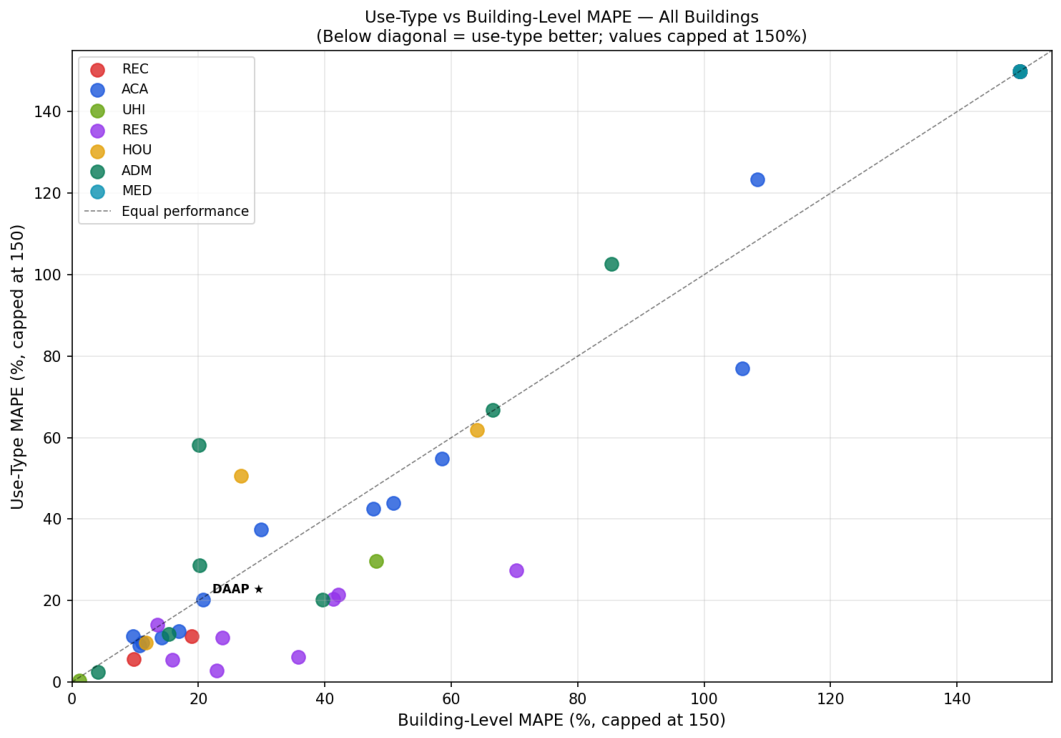
Use-type vs. building-specific MAPE for all 48 validated buildings (capped at 150% for readability). Points below the diagonal indicate use-type outperforms building-specific. Research buildings (purple) cluster strongly below the diagonal. DAAP (labeled star) lies on the diagonal, confirming near-equivalent performance between the fully out-of-sample ACA use-type model and the DAAP-specific model.
Figure 3.
Use-type vs. building-specific MAPE for all 48 validated buildings (capped at 150% for readability). Points below the diagonal indicate use-type outperforms building-specific. Research buildings (purple) cluster strongly below the diagonal. DAAP (labeled star) lies on the diagonal, confirming near-equivalent performance between the fully out-of-sample ACA use-type model and the DAAP-specific model.
4.5. Practical Implications
Strong LOBO for RES (0.911) and ACA (0.726) indicates that research and academic buildings share a learnable weather- and calendar-driven CHW intensity pattern. This is operationally consistent: academic cooling loads follow semester occupancy schedules and ambient temperature in a structurally similar way across buildings of the same type.
MED and UHI types show negative LOBO , indicating that clinical and hospital-grade facilities are dominated by building-specific equipment schedules and process loads that do not transfer. For these types, building-specific models are necessary.
The practical deployment rule that follows is straightforward: use the building-specific model for well-metered buildings with sufficient history; use the use-type model for new construction, buildings with limited historical data, or campus-wide benchmarking among comparable building types. Evaluation of cross-institutional transferability remains an important area for future study. The use-type prediction also serves as a continuous benchmark: DAAP’s consistent under-prediction by the ACA model quantifies DAAP’s relative efficiency, directly analogous to ENERGY STAR scoring but at daily granularity from local sensor data.
5. Building-Level Model Validation
5.1. Setup
Models were retrained on the full UC_CHWusage_2025-2026 dataset (June 2025–February 2026) after an initial August-only pilot demonstrated the expected failure of predicting constant summer-level demand for all months (DAAP: MAPE , before retraining), confirming the importance of seasonal coverage. A coverage filter excludes buildings with fewer than 50% non-null daily readings, yielding 56 buildings for validation. Validation metrics are in-sample with respect to the retrained models; true out-of-sample evaluation requires meter data from March 2026 onward.
Weather for the validation period was fetched from the Open-Meteo historical archive (Cincinnati: 39.N, 84.W). Outdoor air enthalpy, unavailable from Open-Meteo, was approximated using Cincinnati monthly climatological values.
5.2. DAAP Priority Building
The building-specific ensemble achieves , MAPE , and bias on DAAP across the full 9-month period. Table 2 shows month-by-month totals. Predictions for June through October are within 3.1% of actual monthly totals. Winter months (December–January) show larger percentage errors driven by near-zero denominator effects (Section 5.3); the absolute errors in those months are 4,058 and 936 ton-hr, small relative to the July peak of 285,203 ton-hr.
5.3. Near-Zero Readings and Metric Selection
MAPE becomes arbitrarily large when the actual denominator approaches zero. Many buildings reduce CHW consumption to near-zero during winter months or low-occupancy days, producing MAPE values in the thousands of percent even when the absolute prediction error is small. This is a metric artifact, not a model failure. Consistent with the evaluation framework described in Section 3.2, is treated as the primary performance metric for buildings with frequent near-zero readings because it reflects the model’s ability to capture temporal patterns without the instability associated with percentage-based error measures. This is consistent with guidance in the building energy literature that MAPE is inappropriate for loads with intermittent near-zero values [6].
5.4. All-Building Performance Tiers
Table 3 groups 56 validated buildings into four performance tiers. Tier 3 buildings have strong (the model accurately tracks seasonal and weekly patterns) but inflated MAPE due to near-zero readings. Tier 4 buildings show genuine model failures with poor , most attributable to unusual operational profiles not well represented in the training distribution.
Among 48 buildings with valid metrics, the use-type model outperforms the building-specific model in 24 cases (50%), ties within 2% in 12 (25%), and is outperformed in 12 (25%). The RES type shows the most consistent advantage: the RES use-type model outperforms building-specific models for 7 of 8 research buildings, with MAPE improvements of 10–43 percentage points.
6. Deployment and Future Work
6.1. Current Deployment
BearcatAI currently runs on the UC campus network. BearcatGPT, UC’s hosted GPT-4.1, provided free of charge to UC students and faculty, eliminates the commercial API billing that limits deployment of comparable systems.
Figure 4 illustrates the integration of conversational AI, semantic analytics, and a campus-scale digital twin within the BearcatAI platform. The workflow begins with a GIS-derived 3D representation of the University of Cincinnati campus, which serves as the primary spatial interface for facility managers. Through the BearcatAI chatbot, users can query building inventories, inspect building metadata, and identify facilities exhibiting abnormal chilled water consumption behavior. Selected buildings are automatically highlighted within the digital twin, providing immediate spatial context and allowing users to navigate between campus-scale and building-level analysis.
The semantic analytics layer enables users to perform detailed investigations through natural-language interaction. Facility managers can request building performance summaries, visualize actual versus predicted CHW consumption trends, and review anomaly indicators generated by the machine learning models. The system combines quantitative visualizations with automatically generated textual interpretations, allowing users to understand abnormal performance patterns and key deviation periods without requiring programming expertise or direct access to raw datasets. Together, the conversational interface, semantic analytics layer, and spatial digital twin provide an integrated framework for campus-scale facility management, performance benchmarking, and operational decision support.
6.2. JetStream2
The planned production deployment targets JetStream2 (NSF-funded academic cloud infrastructure), which would make BearcatAI accessible from any network without VPN. A containerized FastAPI backend with model artifacts is straightforward to deploy on a JetStream2 VM with a public IP. This deployment model also enables other institutions to adapt the system to their own metering data, particularly relevant given the transferable use-type models demonstrated in Section 4.
6.3. Robotic Inspection: Future Investigation
The integration of the ROS-based inspection robot is an ongoing investigation. The robot is trained in a digital twin of the Digital Futures building via reinforcement learning, with the design goal of sim-to-real transfer to the physical space [14]. Future work will physically validate whether navigation behaviors learned in the digital twin transfer without additional on-site training. Once validated, the robot dispatch capability will be integrated into the full BearcatAI workflow, enabling a utility manager to dispatch a physical inspection agent through the same natural language interface used for anomaly queries and forecasts. Extending robotic inspection to additional campus buildings beyond Digital Futures is also a planned future direction.
6.4. Limitations
The models were developed and evaluated using data from a single university campus located in a temperate climate region. Although the results demonstrate promising transferability among building types within the University of Cincinnati portfolio, the applicability of the proposed models to other institutions, climates, and utility infrastructures remains to be investigated.
In-sample validation: models were trained and validated on the same 9-month period; true out-of-sample evaluation awaits March 2026 data.
Enthalpy approximation: monthly climatological enthalpy estimates substitute for measured values unavailable from Open-Meteo, introducing approximation error in humid summer months.
Missing metadata: eight buildings lack GSF records, preventing intensity-normalized modeling.
Near-zero meter reliability: several buildings show predominantly zero readings inconsistent with building size and type, suggesting meter faults that the system flags but does not correct.
Robot sim-to-real: physical validation of navigation behavior transfer from the Digital Futures digital twin to the physical building is ongoing.
7. Conclusions
This research extends the tradition of performance-driven architectural design into the operational phase of the building lifecycle. By integrating digital twin technologies, building performance analytics, and spatial decision-support tools, BearcatAI demonstrates how campus-scale built environments can be monitored, benchmarked, and interpreted through a unified information framework. Beyond predictive modeling, the primary contribution lies in connecting operational data with spatial context and decision-making processes, enabling facility managers and campus stakeholders to translate building performance information into actionable insights that support sustainability goals and long-term building stewardship.
The results indicate that chilled water consumption patterns are transferable across certain building categories. Leave-One-Building-Out (LOBO) evaluation demonstrated strong generalization for research and academic buildings, suggesting that functional building types share common weather- and occupancy-driven operational characteristics. In contrast, medical and hospital-related facilities exhibited substantial building-specific behavior and did not generalize well across the use-type models. These findings suggest that different building categories may require different modeling strategies and provide a practical framework for campus-scale benchmarking, anomaly detection, and performance assessment.
The study also demonstrates how natural-language interaction and spatial visualization can be integrated within a campus-scale digital twin environment to support building performance analytics and facility management workflows. The combination of predictive analytics, natural-language interaction, and campus-scale visualization offers a promising approach for improving access to building performance information and supporting operational decision-making. However, the present study is limited to data collected from a single institution, and the building-level validation remains constrained by the currently available dataset. Additional validation using future operational data and datasets from other campuses will be necessary to evaluate broader applicability. Likewise, formal usability studies with facility managers are needed to assess the effectiveness of the proposed interface and workflow.
More broadly, this work highlights the growing convergence of architectural representation, building performance analysis, and operational data systems. As digital twins become increasingly integrated into the management of complex built environments, the distinction between design-phase evaluation and post-occupancy operation continues to diminish. By linking spatial models, performance data, and human-centered decision support within a single framework, this research contributes to an emerging vision of architecture as a continuously monitored and adaptive system, where operational knowledge can inform both current facility management practices and future design decisions.
Author Contributions
Conceptualization, M.N. and M.T.; methodology, M.N.; software, M.N.; validation, M.N. and A.K.; formal analysis, M.N.; investigation, M.N.; resources, S.T.; data curation, M.N. and S.T.; writing—original draft preparation, M.N.; writing—review and editing, M.T. and A.K.; visualization, M.N.; supervision, M.T.; project administration, M.T.; funding acquisition, M.T. All authors have read and agreed to the published version of the manuscript.
Funding
This research was funded by the University of Cincinnati Bearcat AI Grants Committee (Fall 2025–Spring 2026, $4,400) under the project “Integrating BIM and GPT for Sustainable Building Analytics and Green Design Education in DAAP and CEAS.”
Institutional Review Board Statement
Not applicable.
Informed Consent Statement
Not applicable.
Data Availability Statement
The UC_CHWusage_2025-2026 dataset and ten years of historical CHW records were provided by UC Utilities Management and are not publicly available due to institutional data policies.
Acknowledgments
The UC_CHWusage_2025-2026 dataset and ten years of historical CHW records were provided by UC Utilities Management. BearcatGPT API access was provided by the University of Cincinnati. The authors used Grammarly for grammar and spelling checks during manuscript preparation.
Conflicts of Interest
The authors declare no conflicts of interest. The funders had no role in the design of the study; in the collection, analyses, or interpretation of data; in the writing of the manuscript; or in the decision to publish the results.
Abbreviations
The following abbreviations are used in this manuscript:
| AECO | Architecture, Engineering, Construction, and Operations |
| CHW | Chilled water |
| LLM | Large language model |
| ML | Machine learning |
| EUI | Energy use intensity |
| LOBO | Leave-One-Building-Out |
| MAPE | Mean absolute percentage error |
| CDD | Cooling degree days |
| HDD | Heating degree days |
| GIS | Geographic information system |
| BIM | Building information modelling |
| ROS | Robot operating system |
| GSF | Gross square footage |
| DAAP | Design, Architecture, Art, and Planning (UC building) |
References
- Tang, M.; Aksamija, A.; Hodge, M.; Anderson, J. Performance-driven design and prototyping: Design computation and fabrication. Perkins+Will Res. J. 2011, 3, 42–49. [Google Scholar]
- Aksamija, A.; Snapp, T.; Hodge, M.; Tang, M. Re-skinning: Performance-based design and fabrication of building facade components: Design computing, analytics and prototyping. Perkins+Will Res. J. 2012, 4, 15–28. [Google Scholar]
- Oxman, R. Performance-based design: Current practices and research issues. Int. J. Archit. Comput. 2008, 6, 1–17. [Google Scholar] [CrossRef]
- Becerik-Gerber, B.; Jazizadeh, F.; Li, N.; Calis, G. Application areas and data requirements for BIM-enabled facilities management. J. Constr. Eng. Manag. 2012, 138, 431–442. [Google Scholar] [CrossRef]
- Fuller, A.; Fan, Z.; Day, C.; Barlow, C. Digital twin: Enabling technologies, challenges and open research. IEEE Access 2020, 8, 108952–108971. [Google Scholar] [CrossRef]
- Deb, C.; Zhang, F.; Yang, J.; Lee, S.E.; Shah, K.W. A review on time series forecasting techniques for building energy consumption. Renew. Sustain. Energy Rev. 2017, 74, 902–924. [Google Scholar] [CrossRef]
- Hitchin, R.; Knight, I. Daily energy consumption signatures and control charts for air-conditioned buildings. Energy Build. 2016, 112, 101–109. [Google Scholar] [CrossRef]
- Granderson, J.; Piette, M.A.; Ghatikar, G. Building energy information systems: User case studies. Energy Effic. 2011, 4, 17–30. [Google Scholar] [CrossRef]
- U.S. Environmental Protection Agency. ENERGY STAR Score for Higher Education. ENERGY STAR Portfolio Manager Technical Reference. EPA: Washington, DC, USA, 2023. [Google Scholar]
- Schick, T.; Dwivedi-Yu, J.; Dessì, R.; Raileanu, R.; Lomeli, M.; Zettlemoyer, L.; Cancedda, N.; Scialom, T. Toolformer: Language models can teach themselves to use tools. arXiv 2023, arXiv:2302.04761. [Google Scholar]
- Zhang, L.; Chen, Z. Large language model-based interpretable machine learning control in building energy systems. Energy Build. 2024, 313, 114278. [Google Scholar] [CrossRef]
- Zhang, L.; Chen, Z.; Ford, V. Advancing building energy modeling with large language models: Exploration and case studies. arXiv 2024, arXiv:2402.09579. [Google Scholar]
- Lu, Q.; Parlikad, A.K.; Woodall, P.; Don Ranasinghe, G.; Xie, X.; Liang, Z.; Konstantinou, E.; Heaton, J.; Schooling, J. Developing a digital twin at building and city levels: Case study of West Cambridge campus. J. Manag. Eng. 2020, 36, 05020004. [Google Scholar] [CrossRef]
- Zhao, W.; Queralta, J.P.; Westerlund, T. Sim-to-real transfer in deep reinforcement learning for robotics: A survey. In Proceedings of the IEEE Symposium Series on Computational Intelligence (SSCI), Canberra, Australia, 1–4 December 2020; pp. 737–744. [Google Scholar]
Figure 1.
BearcatAI system architecture. Building selections in the GIS-derived 3D campus model are forwarded as spatial context to the LLM. BearcatGPT autonomously calls ML tools, returns a natural language reply, and emits structured ui_actions that highlight anomalous buildings in the 3D scene. A robot dispatch tool enables conversational dispatch of a ROS-based inspection robot to flagged buildings (future integration target).
Figure 1.
BearcatAI system architecture. Building selections in the GIS-derived 3D campus model are forwarded as spatial context to the LLM. BearcatGPT autonomously calls ML tools, returns a natural language reply, and emits structured ui_actions that highlight anomalous buildings in the 3D scene. A robot dispatch tool enables conversational dispatch of a ROS-based inspection robot to flagged buildings (future integration target).
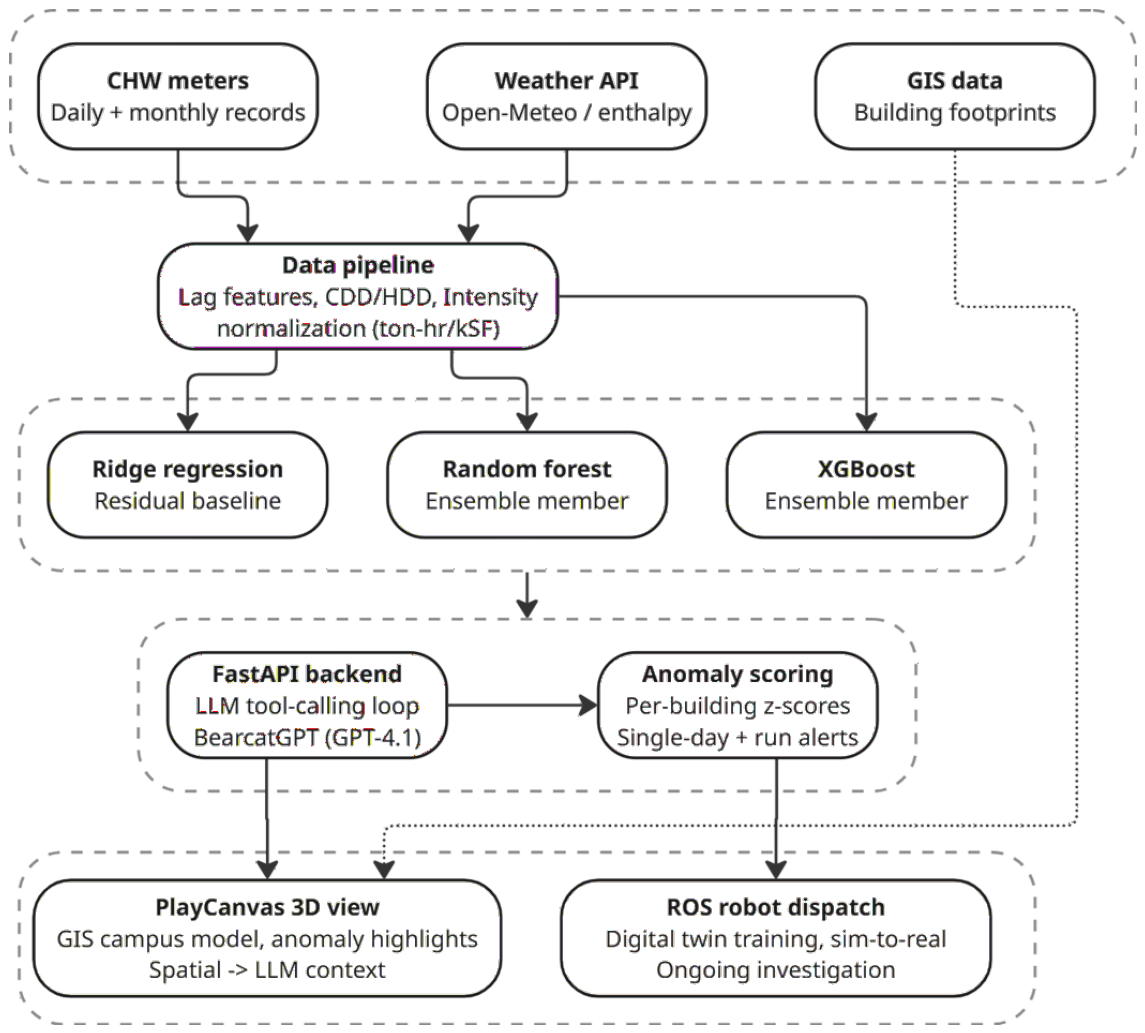
Figure 4.
BearcatAI conversational interface integrated with a campus digital twin for building performance analytics. (1) Campus-scale digital twin of the University of Cincinnati used as the spatial interface for facility management. (2) Users query the campus building inventory through the BearcatAI chatbot and retrieve building metadata. (3) The chatbot identifies buildings exhibiting abnormal chilled water (CHW) consumption patterns and highlights their locations within the digital twin. (4) Users can request detailed performance summaries for a selected building through natural-language commands. (5) The chatbot generates performance visualizations, including actual versus predicted CHW consumption and anomaly indicators. (6) Structured analytics and natural-language summaries provide facility managers with interpretable information on abnormal performance patterns and key deviation periods.
Figure 4.
BearcatAI conversational interface integrated with a campus digital twin for building performance analytics. (1) Campus-scale digital twin of the University of Cincinnati used as the spatial interface for facility management. (2) Users query the campus building inventory through the BearcatAI chatbot and retrieve building metadata. (3) The chatbot identifies buildings exhibiting abnormal chilled water (CHW) consumption patterns and highlights their locations within the digital twin. (4) Users can request detailed performance summaries for a selected building through natural-language commands. (5) The chatbot generates performance visualizations, including actual versus predicted CHW consumption and anomaly indicators. (6) Structured analytics and natural-language summaries provide facility managers with interpretable information on abnormal performance patterns and key deviation periods.
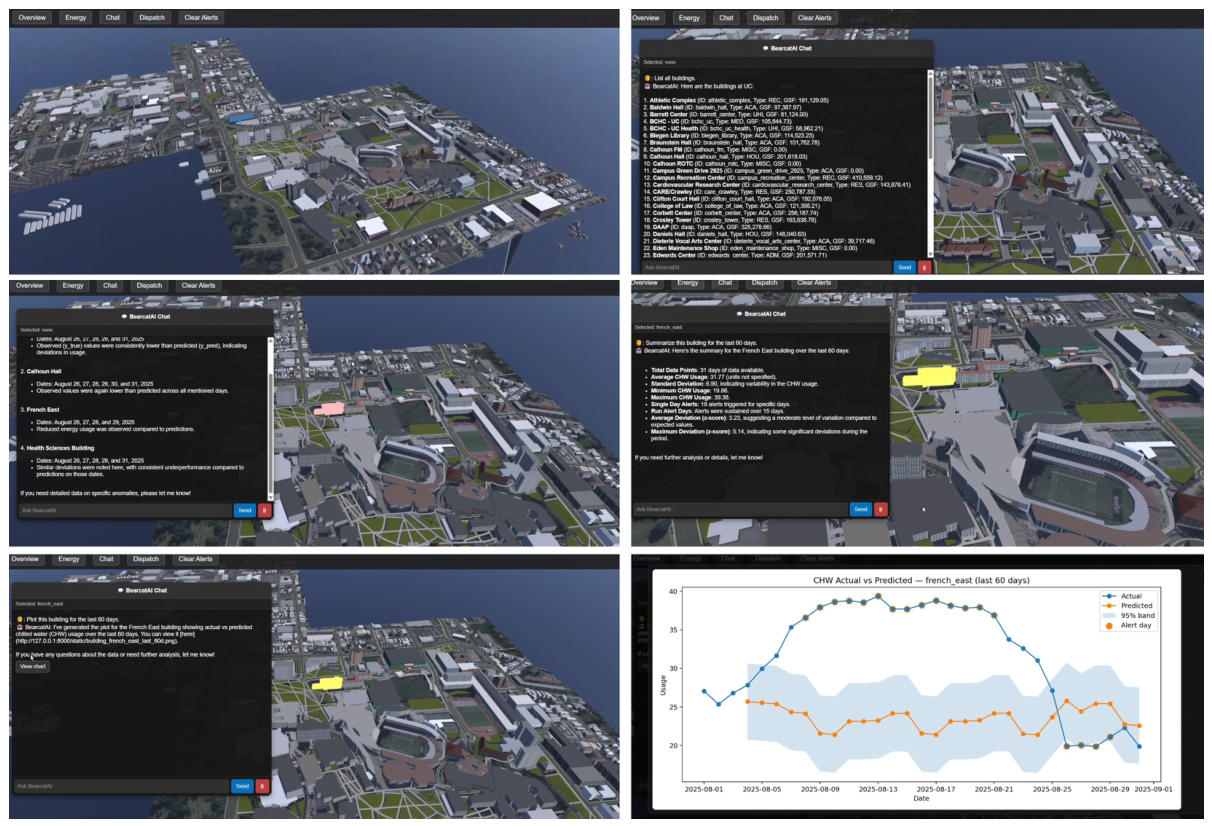

Table 1.
Use-type model performance. LOBO measures genuine out-of-sample generalizability. Values marked † have MAPE inflated by near-zero winter readings; is the primary metric in those cases.
Table 1.
Use-type model performance. LOBO measures genuine out-of-sample generalizability. Values marked † have MAPE inflated by near-zero winter readings; is the primary metric in those cases.
| Type | Bldgs | Test | LOBO | LOBO MAPE | Verdict |
|---|---|---|---|---|---|
| RES | 8 | 0.630 | 0.911 | 31.6% | Strong generalization |
| ADM | 7 | 0.572 | 0.860 | 85. | Good generalization |
| HOU | 6 | 0.792 | 0.778 | 45.2% | Reasonable |
| ACA | 20 | 0.600 | 0.726 | 81. | Good generalization |
| REC | 5 | 0.614 | 0.491 | 55.2% | Marginal |
| MED | 3 | 0.822 | −1.720 | >1000% | No generalization |
| UHI | 4 | 0.949 | −61.6 | >100% | No generalization |
Table 2.
DAAP monthly CHW actual vs. predicted (building-specific model). ; negative indicates over-prediction. Summary: , MAPE , Bias .
Table 2.
DAAP monthly CHW actual vs. predicted (building-specific model). ; negative indicates over-prediction. Summary: , MAPE , Bias .
| Month | Actual (ton-hr) | Predicted | (ton-hr) | |
|---|---|---|---|---|
| Jun 2025 | 228,938 | 231,377 | −2,440 | |
| Jul 2025 | 285,203 | 284,627 | +576 | |
| Aug 2025 | 237,102 | 238,413 | −1,311 | |
| Sep 2025 | 187,303 | 187,244 | +59 | |
| Oct 2025 | 125,956 | 125,976 | −20 | |
| Nov 2025 | 49,014 | 50,531 | −1,517 | |
| Dec 2025 | 22,428 | 26,486 | −4,058 | |
| Jan 2026 | 18,136 | 19,071 | −936 | |
| Feb 2026 | 48,288 | 50,674 | −2,386 |
Table 3.
Building performance tiers across 56 validated buildings.
| Tier | Criterion | Representative buildings |
|---|---|---|
| 1 (15) | MAPE or | DAAP, ERC, French East/West, Blegen Library, Corbett, CARE/Crawley, Vontz, Nippert West, Procter Hall, Crosley Tower |
| 2 (13) | Rieveschl, Kettering Lab, Morgens Hall, Steger SLC, Van Wormer, Holmes Hospital, Cardiovascular Research, Clifton Court Hall | |
| 3 (10) | , MAPE inflated | Medical Sciences (, MAPE ), Swift Hall (), University Hall (), Teachers-Dyers, Health Sciences |
| 4 (5) | Mary Emery Hall (), Kingsgate Conf. Ctr (), Braunstein Hall () |
Disclaimer/Publisher’s Note: The statements, opinions and data contained in all publications are solely those of the individual author(s) and contributor(s) and not of MDPI and/or the editor(s). MDPI and/or the editor(s) disclaim responsibility for any injury to people or property resulting from any ideas, methods, instructions or products referred to in the content. |
© 2026 by the authors. Licensee MDPI, Basel, Switzerland. This article is an open access article distributed under the terms and conditions of the Creative Commons Attribution (CC BY) license (http://creativecommons.org/licenses/by/4.0/).
Copyright: This open access article is published under a Creative Commons CC BY 4.0 license, which permit the free download, distribution, and reuse, provided that the author and preprint are cited in any reuse.