

Submitted:
27 September 2026
Posted:
29 September 2026
You are already at the latest version
Abstract
Electronic tongue signals provide objective measures of taste-related responses, but their quantitative correspondence with human perceptual intensity remains insufficiently characterized. This study developed a psychophysically calibrated electronic tongue framework for quantitative bitterness evaluation and sweetness-induced modulation. Concentration-dependent responses to quinine hydrochloride, berberine hydrochloride, and iso-α-acid followed logarithmic relationships, with coefficients of determination of 0.991, 0.910, and 0.984, respectively. By integrating these instrumental relationships with psychophysically derived sensory bitterness references, compound-specific conversion models were established to translate electronic tongue signals into human sensory bitterness intensity. Independent validation yielded mean absolute percentage errors of 6.02%, 10.76%, and 7.14%, respectively. Increasing sucrose concentration from 0% to 2% and 8% generally attenuated bitterness-related electronic tongue responses, with compound-dependent differences. The proposed framework provides a quantitative bridge between electronic tongue signals and human bitterness perception and extends instrumental bitterness evaluation toward taste-interaction systems.
Keywords:
electronic tongue
; bitterness perception
; psychophysics
; sensory-instrumental calibration
; sweetness–bitterness interaction
1. Introduction
Bitterness is one of the five basic taste modalities and plays an important role in food perception, dietary behavior, and the recognition of potentially harmful substances[1]. In foods, functional products, and oral pharmaceuticals, however, excessive bitterness is often associated with reduced palatability and consumer acceptance, making effective bitterness evaluation and control important for product development and optimization[2]. Importantly, bitterness is ultimately a perceptual response rather than a direct reflection of bitter compound concentration[3]. Human sensitivity to bitter compounds varies considerably across substances and follows characteristic psychophysical processes, from initial detection at the sensory threshold to discrimination of concentration differences and subsequent changes in suprathreshold intensity[4]. Consequently, the same change in chemical concentration may not necessarily produce an equivalent change in perceived bitterness[5]. Accurate characterization of bitterness therefore requires quantitative assessment of human perceptual intensity, providing a sensory-relevant basis for bitterness evaluation, formulation optimization, and the development of objective taste assessment approaches[6].
Human sensory evaluation remains the most direct approach for assessing bitterness, as it captures the perceptual response elicited by bitter stimuli[7]. Sensory and psychophysical methods, including threshold determination, difference testing, and intensity scaling, have been widely used to characterize bitterness sensitivity and quantify perceived intensity[8]. However, sensory evaluation is inherently influenced by individual variability and panel performance and generally requires trained assessors, standardized procedures, and substantial time, which can limit its efficiency for routine or high-throughput applications. Complementary objective approaches have therefore been developed, including chemical analysis[9], receptor- or cell-based assays[10], and various taste-sensing technologies[11]. These methods can provide reproducible information on bitter compounds or their biological and physicochemical responses, but the measured outputs are not necessarily equivalent to perceived bitterness intensity[12]. Consequently, there remains a need for objective and efficient approaches that can not only characterize bitterness-related responses but also provide quantitative information that is meaningfully linked to human perception[13].
Among the instrumental approaches developed for taste evaluation[14], electronic tongues have attracted considerable attention because of their rapid response, good reproducibility, and potential for objective and high-throughput analysis[15,16]. Inspired by the human gustatory system, electronic tongues employ arrays of cross-sensitive sensors to characterize taste-related physicochemical information and have been extensively applied to the evaluation of basic tastes, food products, pharmaceuticals, and taste-masking formulations[17]. In particular, potentiometric taste-sensing systems based on lipid/polymer membranes can selectively respond to different taste qualities through changes in membrane potential resulting from electrostatic and hydrophobic interactions between taste compounds and sensing membranes[18]. For bitterness evaluation, sensor responses associated with the adsorption of bitter compounds have shown concentration-dependent characteristics and have been used to discriminate bitter substances, estimate bitterness intensity, and evaluate bitterness-masking effects[19]. These characteristics make electronic tongues particularly promising as complementary tools to human sensory evaluation for objective characterization of bitterness.
Despite these advances, translating electronic tongue responses into human-perceptible bitterness remains challenging. Electronic tongue outputs reflect compound-specific interactions with sensing membranes and are expressed as instrumental response values, whereas human bitterness intensity is governed by psychophysical relationships between stimulus concentration and perception[20]. Previous studies have demonstrated correlations between electronic tongue responses and sensory bitterness and have developed regression-based approaches for bitterness estimation[21]. However, a quantitative framework that explicitly links concentration-dependent instrumental responses with psychophysically characterized human bitterness intensity remains insufficiently established. Such a framework would allow electronic tongue signals to be interpreted on a perceptually meaningful scale, extending their role from instrumental signal characterization toward quantitative prediction of human bitterness. Moreover, bitterness in foods rarely occurs in isolation, and interactions with other taste stimuli may alter bitterness-related responses. Although electronic tongue systems have been applied to taste interactions and bitterness-masking effects, including those involving sweet substances[22], systematic characterization of how different sucrose backgrounds modulate concentration-dependent electronic tongue responses across chemically distinct bitter compounds remains limited. Addressing these issues is therefore important for extending electronic tongue-based bitterness evaluation from single-compound systems toward more perceptually and compositionally complex taste environments.
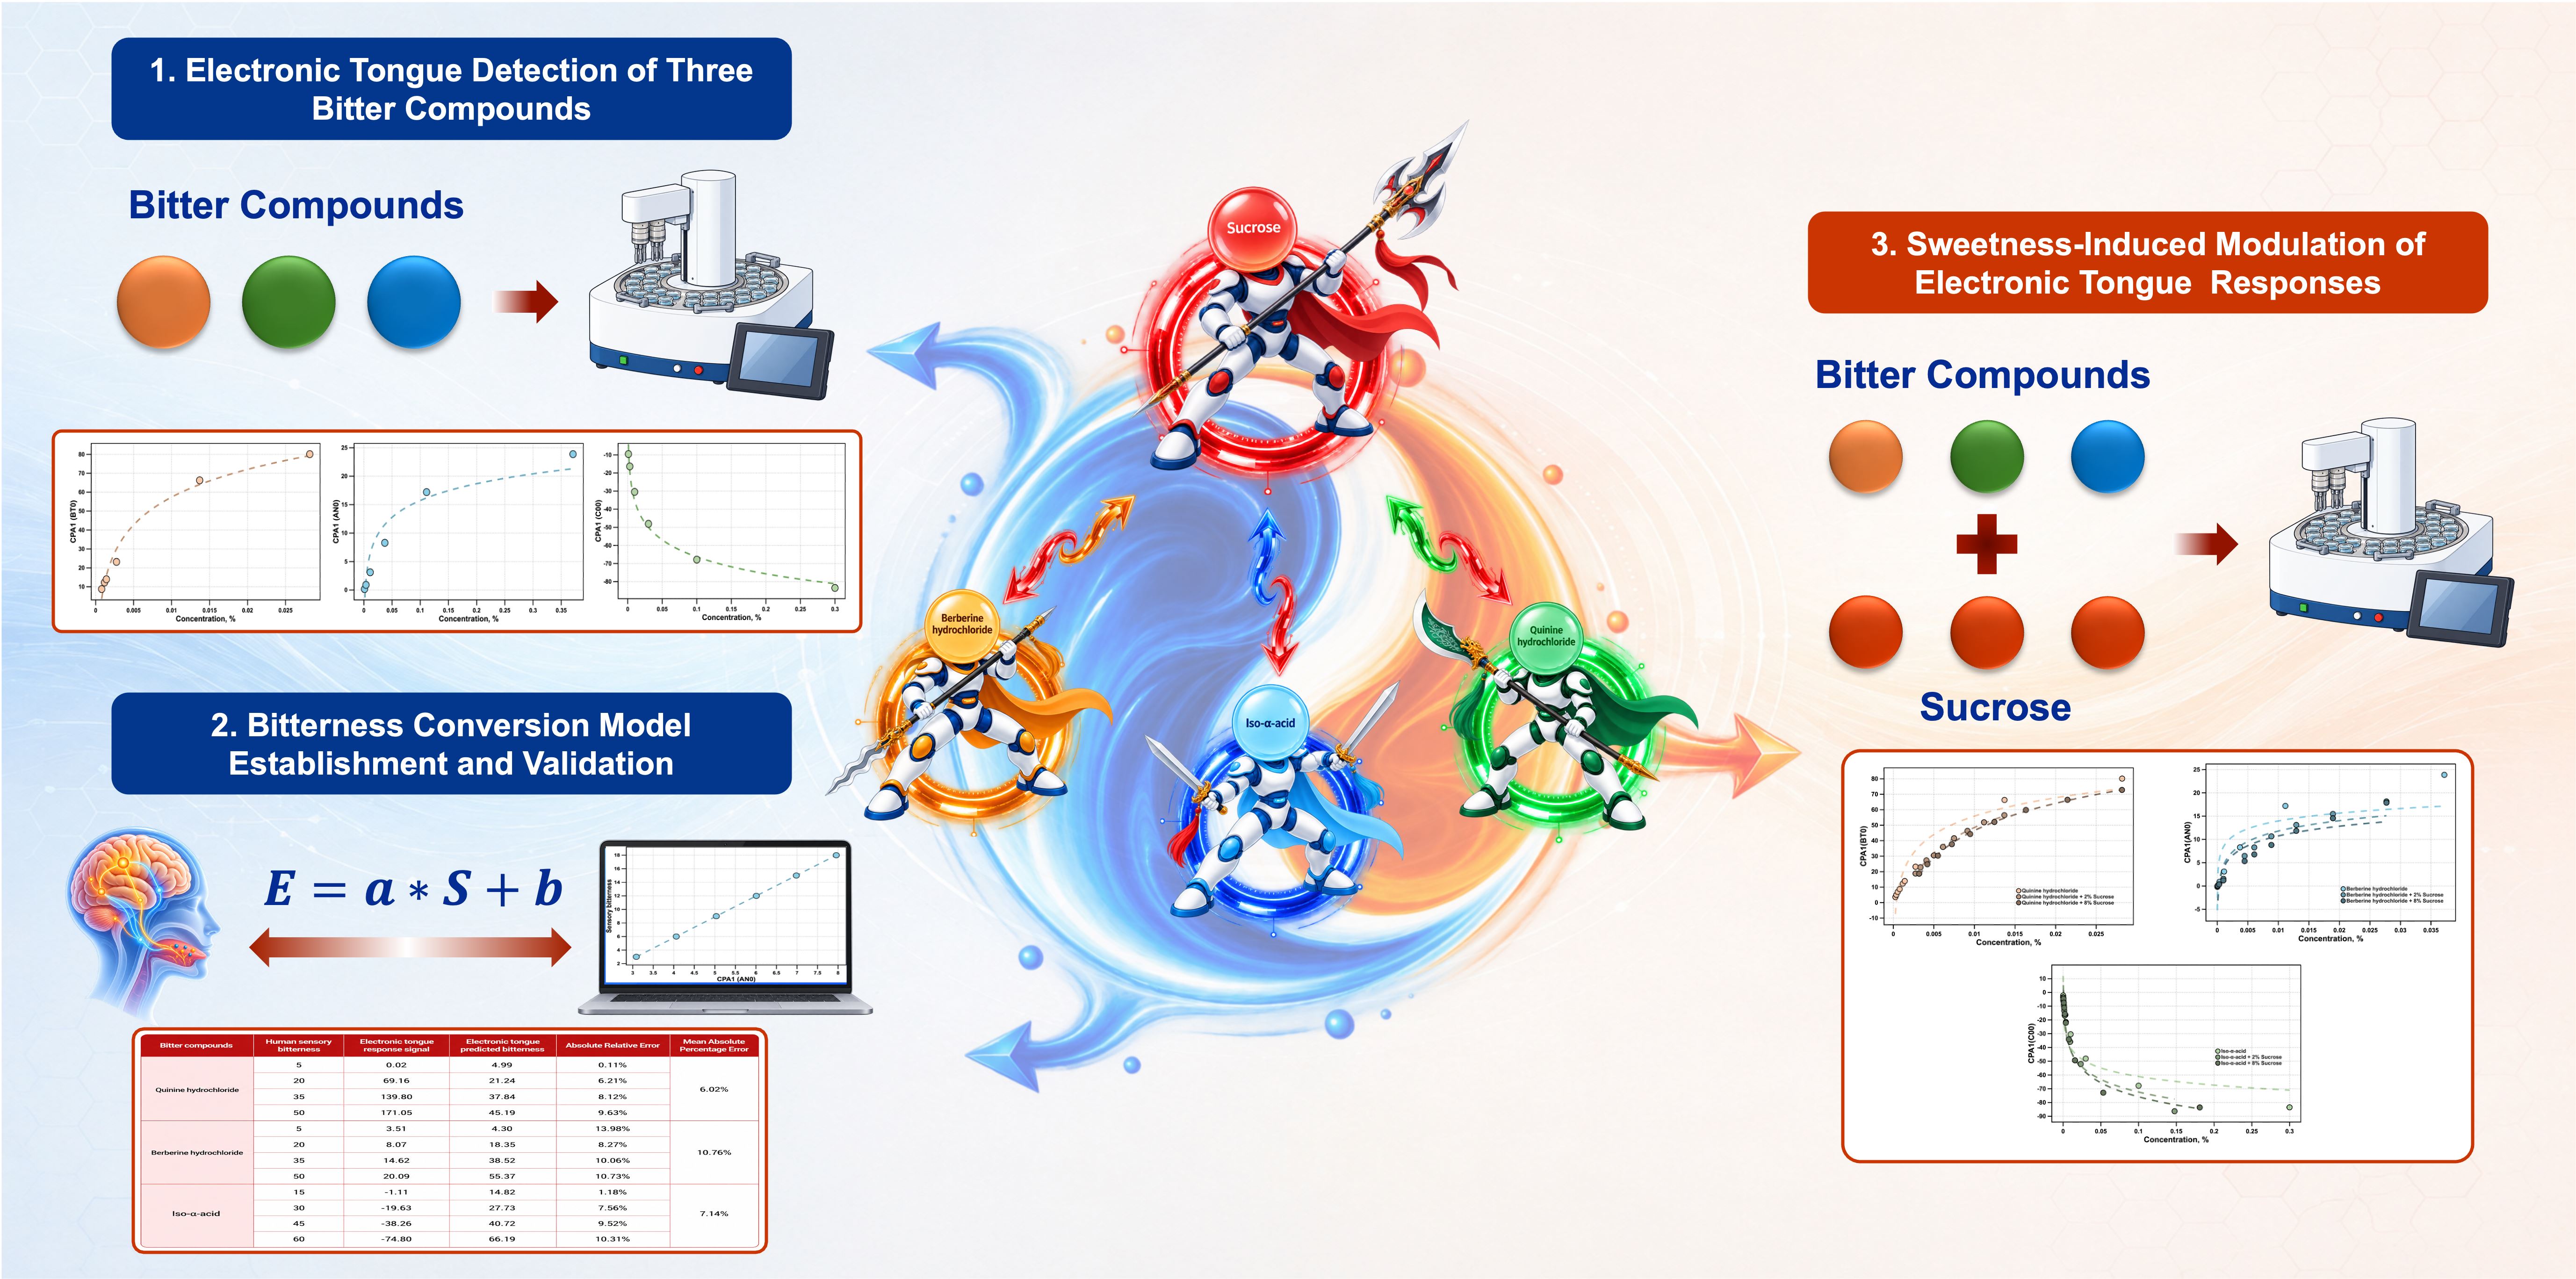
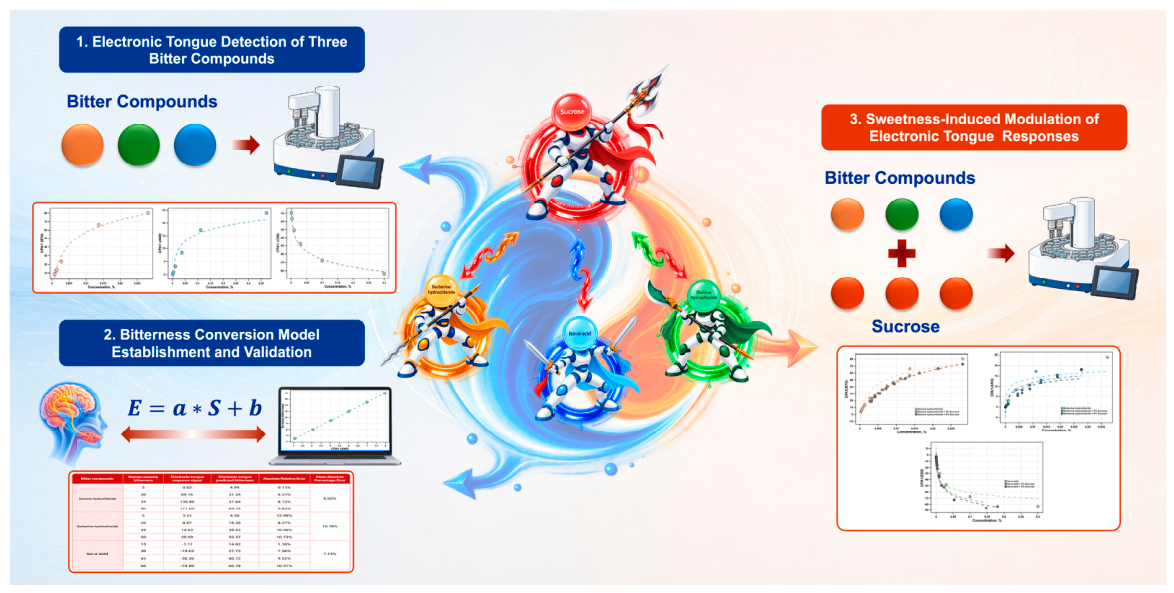
To address these gaps, the present study aimed to develop a human perception-calibrated electronic tongue framework for quantitative bitterness evaluation and to further investigate its applicability to sweetness–bitterness interactions. The overall research framework is illustrated in Fig. 1. First, the detection threshold and Weber fraction of berberine hydrochloride were determined, and its concentration-dependent sensory bitterness function was established to complement the previously established psychophysical reference data for quinine hydrochloride and iso-α-acid. Second, concentration-dependent electronic tongue responses were characterized for quinine hydrochloride, berberine hydrochloride, and iso-α-acid. By integrating these instrumental response functions with psychophysically characterized human sensory bitterness data, compound-specific bitterness conversion models were established to translate electronic tongue signals into perceptually meaningful bitterness intensities. The predictive performance of the models was subsequently validated using four predefined sensory bitterness levels for each compound. Finally, electronic tongue responses to ten concentration levels of each bitter compound were examined under 0%, 2%, and 8% sucrose backgrounds to characterize sweetness-induced modulation of bitterness-related instrumental responses. Collectively, this framework extends electronic tongue-based bitterness evaluation from instrumental signal characterization toward quantitative perceptual prediction and the assessment of taste interactions.
Figure 1.
Overall research framework of the present study.
2. Materials and Methods
2.1. Materials
Iso-α-acid was purchased from Labor Veritas AG (Zurich, Switzerland). Quinine hydrochloride and berberine hydrochloride were purchased from Aladdin Reagent Co., Ltd. (Shanghai, China). Ultrapure water with resistivity of 18.2 MΩ·cm was obtained from a Millipore system.
2.2. Psychophysical Characterization of Sensory Bitterness
2.2.1. Sensory Panel
The sensory panel comprised 30 experienced assessors (15 males and 15 females, aged from 20 to 35 years old), who were selected and trained according to the Chinese national standard (GB/T 16291.1-2012: Sensory analysis - General guidance for the selection, training and monitoring of assessors - Part 1: Selected assessors). All assessors were informed of the purpose of this study and trained for two weeks (once per day) based on the following features:
(1) familiarization with sensory terminology, including absolute and difference thresholds;
(2) discrimination of the basic taste qualities, with all assessors required to correctly complete the identification tests;
(3) training in triangle test method, paired comparison test methods; and
(4) evaluation of taste intensity, with a relative error of below 10% between repeated assessments at the same concentration.
Assessors were instructed to refrain from smoking and consuming food for at least 30 min before each sensory evaluation session.
The study involving human participants was conducted in accordance with the Declaration of Helsinki and was approved by the Ethics Committee of Zhejiang Gongshang University (approval No. 24131201). All human sensory experiments were designed and performed at Zhejiang Gongshang University as a single-center study under this ethics approval. Written informed consent was obtained from all participants before enrolment. Participants were informed of the study procedures, data confidentiality, the voluntary nature of participation and their right to withdraw from the study at any time without penalty.
2.2.2. Determination of Absolute and Difference Thresholds
The absolute and difference threshold data for sucrose, iso-α-acid, and quinine hydrochloride were obtained from our previous study[1]. The corresponding thresholds for berberine hydrochloride were determined in the present study using the same sensory evaluation procedures established in that study.
2.2.3. Establishment of the Sensory Bitterness Reference Scale
Following determination of the absolute and difference thresholds, successive perceptually distinguishable bitterness levels were established for each bitter compound according to the Weber–Fechner law. Based on our previous study[23], the absolute threshold was defined as a sensory bitterness level of 1, and successive perceptually distinguishable levels were sequentially assigned sensory bitterness values of 2, 3, and so forth. The corresponding concentrations at each successive bitterness level were calculated from the absolute threshold and Weber fraction, thereby generating a series of perceptually distinguishable bitterness levels with progressively increasing intensity. For each bitter compound, a quantitative concentration–sensory bitterness reference scale was thereby derived from the absolute threshold and Weber fraction according to the Weber–Fechner law. The resulting concentration–sensory bitterness relationships and sensory bitterness levels were subsequently used as psychophysical references for establishing quantitative relationships between electronic tongue responses and human bitterness perception.
2.3. Electronic Tongue Detection and Response Modeling of Bitter Compounds
A series of solutions with progressively increasing concentrations was prepared for each of the three bitter compounds, including quinine hydrochloride, berberine hydrochloride, and iso-α-acid. Electronic tongue measurements were performed using a TS-5000Z taste sensing system. The BT0, AN0, and C00 sensors were used for quinine hydrochloride, berberine hydrochloride, and iso-α-acid, respectively, and the corresponding CPA1 values were extracted as characteristic response signals. For each bitter compound, scatter plots were constructed using concentration as the independent variable (X) and the corresponding CPA1 value as the dependent variable (Y). The concentration-dependent electronic tongue responses were subsequently fitted using appropriate regression functions to obtain the response model for each bitter compound.
2.4. Establishment of the Bitterness Conversion Models
To establish quantitative relationships between electronic tongue responses and human sensory bitterness, six predefined sensory bitterness levels were selected for each bitter compound. The concentration corresponding to each sensory bitterness level was first calculated using the previously established concentration–sensory bitterness function. The resulting concentrations were then substituted into the corresponding concentration–electronic tongue response functions to obtain the calculated characteristic CPA1 responses, namely CPA1(BT0) for quinine hydrochloride, CPA1(AN0) for berberine hydrochloride, and CPA1(C00) for iso-α-acid. For each bitter compound, the six pairs of electronic tongue responses and sensory bitterness values were plotted as scatter plots, with the characteristic CPA1 response as the independent variable (X) and sensory bitterness intensity as the dependent variable (Y). Regression analysis was subsequently performed to establish compound-specific bitterness conversion models linking electronic tongue responses to human sensory bitterness intensity.
2.5. Validation of the Bitterness Conversion Models
To validate the predictive performance of the established bitterness conversion models, four predefined sensory bitterness levels, ranging from weak to very strong bitterness, were selected for each bitter compound. The concentration corresponding to each predefined bitterness level was first calculated using the previously established concentration–sensory bitterness function. Solutions of quinine hydrochloride, berberine hydrochloride, and iso-α-acid were then prepared at the calculated concentrations and independently measured using the electronic tongue. The characteristic CPA1 responses obtained from the corresponding sensors, namely CPA1(BT0) for quinine hydrochloride, CPA1(AN0) for berberine hydrochloride, and CPA1(C00) for iso-α-acid, were entered into the respective bitterness conversion models to predict sensory bitterness intensity. The predicted bitterness intensities were subsequently compared with the corresponding reference sensory bitterness intensities. Prediction accuracy was evaluated using the absolute relative error (ARE) for each bitterness level and the mean absolute percentage error (MAPE) across the four validation levels for each bitter compound.
2.6. Electronic Tongue Responses to Bitter Compounds Under Different Sucrose Backgrounds
To investigate whether the electronic tongue could characterize sucrose-induced modulation of bitterness-related responses, three sucrose backgrounds (0%, 2%, and 8%, w/v) were established for quinine hydrochloride, berberine hydrochloride, and iso-α-acid. For each bitter compound, nine concentration levels were selected under each sucrose background based on the previously established relationships between sucrose concentration and sensory bitterness reported in our previous study[1]. Specifically, these concentration series represented the concentrations of each bitter compound required to elicit equivalent sensory bitterness intensities under the three sucrose backgrounds. The resulting bitter compound solutions prepared in 0%, 2%, and 8% sucrose were subsequently measured using the electronic tongue. CPA1(BT0), CPA1(AN0), and CPA1(C00) were used as the characteristic responses for quinine hydrochloride, berberine hydrochloride, and iso-α-acid, respectively. For each bitter compound and sucrose background, concentration-dependent response curves were constructed with bitter compound concentration as the independent variable (X) and the corresponding characteristic CPA1 response as the dependent variable (Y). The resulting concentration–response functions were compared across the three sucrose backgrounds to characterize sucrose-dependent changes in electronic tongue responses and their correspondence with the previously established modulation of human sensory bitterness.
3. Results
3.1. Psychophysical Characterization of Berberine Hydrochloride Bitterness
The absolute threshold of berberine hydrochloride was determined to be 0.00447% (w/v), with a Weber fraction of 7.9%. Based on these two psychophysical parameters, successive perceptually distinguishable bitterness levels were derived according to the Weber–Fechner law. The absolute threshold was assigned a sensory bitterness level of 1, and subsequent bitterness levels were sequentially assigned values of 2, 3, and so forth, with their corresponding concentrations calculated using the Weber fraction. This procedure generated a quantitative concentration–sensory bitterness reference scale for berberine hydrochloride, which was subsequently used for establishing its relationship with electronic tongue responses.
3.2. Concentration-Dependent Electronic Tongue Responses of Bitter Compounds
The electronic tongue exhibited distinct concentration-dependent responses to the three bitter compounds (as shown in Figure. 2). CPA1(BT0), CPA1(AN0), and CPA1(C00) were identified as the characteristic response signals for quinine hydrochloride, berberine hydrochloride, and iso-α-acid, respectively. The CPA1(BT0) response increased progressively with increasing quinine hydrochloride concentration, while CPA1(AN0) showed a similar concentration-dependent increase for berberine hydrochloride. In contrast, the CPA1(C00) response became progressively more negative as the concentration of iso-α-acid increased.
Figure 2.
Concentration-dependent electronic tongue responses to three bitter compounds. (a) CPA1(BT0) response to quinine hydrochloride as a function of concentration. (b) CPA1(AN0) response to berberine hydrochloride as a function of concentration. (c) CPA1(C00) response to iso-α-acid as a function of concentration. Dashed lines represent the logarithmic fitting curves.
Figure 2.
Concentration-dependent electronic tongue responses to three bitter compounds. (a) CPA1(BT0) response to quinine hydrochloride as a function of concentration. (b) CPA1(AN0) response to berberine hydrochloride as a function of concentration. (c) CPA1(C00) response to iso-α-acid as a function of concentration. Dashed lines represent the logarithmic fitting curves.
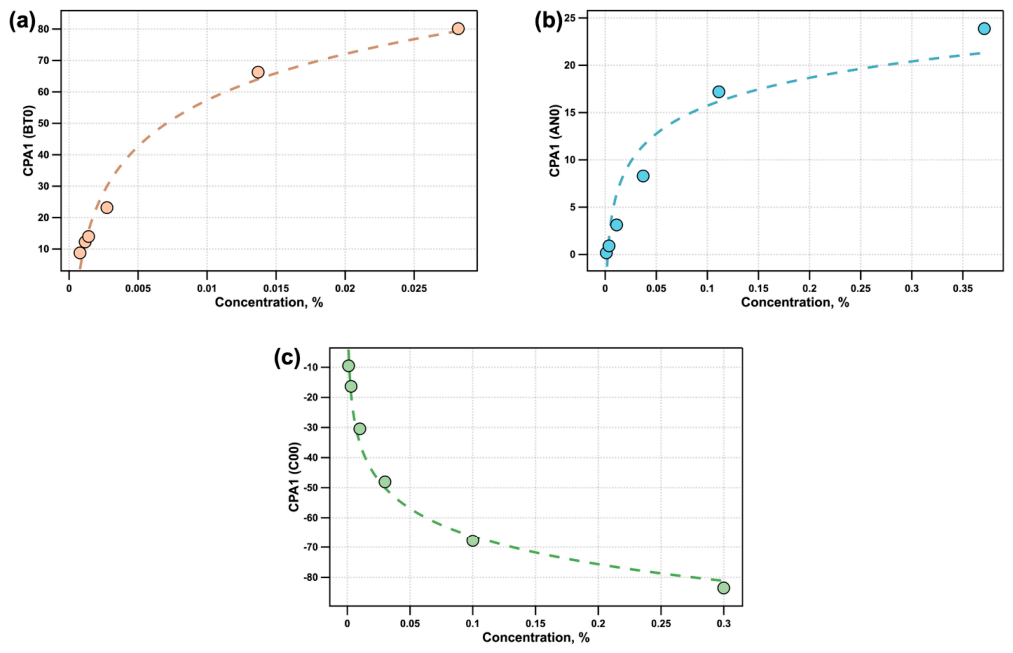
Logarithmic fitting adequately described the concentration-dependent electronic tongue responses of the three bitter compounds, with R2 values of 0.991, 0.910, and 0.984 for quinine hydrochloride, berberine hydrochloride, and iso-α-acid, respectively (as listed in Table 1).
3.3. Establishment of Bitterness Conversion Models
Based on the six predefined sensory bitterness levels, compound-specific relationships between the characteristic electronic tongue responses and human sensory bitterness were established for the three bitter compounds (as shown in Figure 3).
Sensory bitterness intensity increased linearly with CPA1(BT0) for quinine hydrochloride and CPA1(AN0) for berberine hydrochloride, whereas an inverse linear relationship was observed between sensory bitterness intensity and CPA1(C00) for iso-α-acid. The slopes of the conversion models were 0.24, 3.08, and −0.70 for quinine hydrochloride, berberine hydrochloride, and iso-α-acid, respectively, with corresponding intercepts of 4.99, −6.51, and 14.05 (as listed in Table 2). These compound-specific linear relationships provided the bitterness conversion models for translating characteristic electronic tongue responses into sensory bitterness intensity.
3.4. Establishment of Bitterness Conversion Models
The predictive performance of the established bitterness conversion models was evaluated using four predefined sensory bitterness levels for each bitter compound (as listed in Table 3). For quinine hydrochloride, the predicted bitterness intensities were 4.99, 21.24, 37.84, and 45.19 at reference sensory bitterness intensities of 5, 20, 35, and 50, respectively, with ARE values ranging from 0.11% to 9.63% and a MAPE of 6.02%. For berberine hydrochloride, the predicted bitterness intensities were 4.30, 18.35, 38.52, and 55.37, with ARE values ranging from 8.27% to 13.98% and a MAPE of 10.76%. For iso-α-acid, the predicted bitterness intensities were 14.82, 27.73, 40.72, and 66.19 at reference sensory bitterness intensities of 15, 30, 45, and 60, respectively, with ARE values ranging from 1.18% to 10.31% and a MAPE of 7.14%. Overall, the predicted bitterness intensities showed close agreement with the corresponding reference sensory bitterness intensities across the validation levels, with MAPE values ranging from 6.02% to 10.76% among the three bitter compounds.
3.5. Electronic Tongue Responses to Bitter Compounds Under Different Sucrose Backgrounds
Electronic tongue responses to the three bitter compounds were markedly affected by the sucrose background (as shown in Figure. 4). Across the tested concentration ranges, increasing sucrose concentration from 0% to 2% and 8% generally attenuated the characteristic electronic tongue responses to the bitter compounds. For quinine hydrochloride, CPA1(BT0) responses decreased with increasing sucrose concentration, although the differences among the three sucrose backgrounds were relatively limited (Fig. 4a). A more pronounced sucrose-dependent attenuation was observed for berberine hydrochloride, with CPA1(AN0) responses progressively decreasing as the sucrose concentration increased (Figure 4b). Similarly, the magnitude of the CPA1(C00) response to iso-α-acid was reduced with increasing sucrose concentration, as reflected by a shift of the response toward less negative values (Fig. 4c). Despite these sucrose-induced changes, all three bitter compounds retained clear concentration-dependent electronic tongue responses under the different sucrose backgrounds. Overall, increasing sucrose concentration attenuated the bitterness-related electronic tongue responses, with the magnitude of attenuation varying among the three bitter compounds.
4. Discussion
4.1. Linking Electronic Tongue Responses with Human Bitterness Perception
The present study established a quantitative connection between electronic tongue responses and human bitterness perception by integrating instrumental concentration–response relationships with psychophysically characterized sensory bitterness. The three bitter compounds exhibited distinct but systematic concentration-dependent electronic tongue responses, with logarithmic relationships observed for CPA1(BT0), CPA1(AN0), and CPA1(C00) in response to quinine hydrochloride, berberine hydrochloride, and iso-α-acid, respectively, yielding R2 values of 0.991, 0.910, and 0.984. Importantly, the present framework did not rely solely on direct statistical correlations between instrumental signals and sensory scores. Instead, human bitterness perception was first defined on a psychophysical reference scale based on absolute thresholds and Weber fractions, and this sensory reference was subsequently linked to the concentration-dependent electronic tongue responses. This approach resulted in compound-specific linear relationships between characteristic CPA1 responses and sensory bitterness intensity, despite the different response directions and sensitivities of the three sensors. These findings indicate that compound-specific electronic tongue signals can be transformed into a common perceptual dimension when calibrated against an appropriate psychophysical reference, providing a basis for interpreting instrumental responses in terms of human-perceived bitterness rather than sensor output alone.
4.2. Predictive Performance and Applicability of the Bitterness Conversion Models
A critical step in translating electronic tongue measurements into perceptually meaningful information is determining whether the established conversion relationships remain applicable to samples not directly used for model construction. In the present study, four predefined bitterness levels spanning weak to very strong bitterness were independently prepared and measured for each bitter compound, and the experimentally obtained CPA1 responses were converted into predicted sensory bitterness intensities. The resulting MAPE values were 6.02% for quinine hydrochloride, 10.76% for berberine hydrochloride, and 7.14% for iso-α-acid, with most individual predictions remaining close to their corresponding reference bitterness intensities. This independent validation is particularly important because the high linearity of the conversion relationships established in the preceding step is partly determined by the mathematical linkage of the concentration–sensory and concentration–electronic tongue relationships and therefore cannot, by itself, demonstrate predictive performance. In contrast, the validation experiment used independently measured electronic tongue responses, providing direct evidence that the conversion models can translate experimental sensor signals into sensory-relevant bitterness estimates. Nevertheless, the variation in prediction errors among the three compounds, particularly the relatively higher MAPE observed for berberine hydrochloride, also indicates that model performance remains compound dependent and is influenced by the response characteristics of the corresponding sensing membrane. Thus, rather than providing a universal bitterness scale independent of chemical identity, the current framework should be regarded as a compound-calibrated strategy for quantitative prediction of human bitterness from electronic tongue measurements.
4.3. Electronic Tongue Characterization of Sucrose-Induced Bitterness Modulation
Beyond single-compound bitterness prediction, the present study further demonstrated that electronic tongue responses were systematically altered by the presence of sucrose. Increasing the sucrose background from 0% to 2% and 8% generally attenuated the characteristic bitterness-related responses of all three compounds, although the magnitude of attenuation differed substantially among them. Quinine hydrochloride showed relatively limited changes in CPA1(BT0), whereas more pronounced sucrose-dependent attenuation was observed for CPA1(AN0) of berberine hydrochloride and CPA1(C00) of iso-α-acid. Importantly, the concentration series used under the three sucrose backgrounds were not arbitrary but represented concentrations required to elicit equivalent sensory bitterness intensities according to previously established human psychophysical relationships. The resulting changes in electronic tongue response therefore suggest that the instrumental system is sensitive not only to bitterant concentration but also to modifications of the chemical environment associated with sweetness–bitterness interactions. At the same time, the persistence of clear concentration-dependent response patterns under all three sucrose backgrounds indicates that the fundamental responsiveness of the sensors to the bitter compounds was retained. Together, these findings extend the potential application of electronic tongue-based bitterness evaluation from isolated bitter solutions toward more compositionally complex systems in which taste interactions occur, while also emphasizing that instrumental response attenuation should not be interpreted as equivalent to perceptual bitterness suppression without appropriate human sensory calibration.
5. Conclusions
This study developed a psychophysically calibrated electronic tongue framework for translating instrumental responses into human sensory bitterness intensity. By integrating concentration-dependent electronic tongue responses with psychophysically derived bitterness reference scales, compound-specific bitterness conversion models were established for quinine hydrochloride, berberine hydrochloride, and iso-α-acid. Independent validation demonstrated close agreement between predicted and reference sensory bitterness intensities, supporting the feasibility of quantitative bitterness prediction from electronic tongue signals. Moreover, increasing sucrose concentration generally attenuated the characteristic electronic tongue responses to the three bitter compounds, with compound-dependent differences in the magnitude of attenuation. These findings extend the role of the electronic tongue from characterization of instrumental signals toward perceptually calibrated bitterness prediction and the assessment of sweetness–bitterness interactions. The proposed framework provides a methodological basis for sensory-relevant instrumental evaluation of bitterness and may support future applications in food formulation, taste optimization, and bitterness-masking assessment.
Author Contributions
Conceptualization, J.L. and Y.M.; methodology, S.Q.; software, S.T.; validation, L.K. and X.L.; formal analysis, S.Q. and X.L.; investigation, C.L and S.Q..; resources, L.K.; data curation, C.L and X.L.; writing—original draft preparation, S.Q. and Y.M.; writing—review and editing, Y.M.; visualization, S.T.; supervision, J.L.; project administration, Y.M.; funding acquisition, S.T. and Y.M. All authors have read and agreed to the published version of the manuscript.
Funding
This research was funded by “Pioneer” and “Leading Goose” R&D Program of Zhejiang, grant number 2025C01133.
Institutional Review Board Statement
This study was conducted in accordance with the Declaration of Helsinki and was approved by the Ethics Committee of Zhejiang Gongshang University (approval No. 24131201).
Informed Consent Statement
Written informed consent has been obtained from the patients to publish this paper.
Data Availability Statement
The data presented in this study are available on request from the corresponding author.
Conflicts of Interest
The authors declare no conflicts of interest.
References
- Mao, Y.; Qi, X.; Liu, C.; Wang, Y.; Bai, J.; Ke, L.; Tian, S. Bidirectional Modulation of Psychophysical Thresholds in Sucrose-Bitterant Mixtures: Sugar Reduction and Bitterness Masking. npj Sci. Food 2026. [Google Scholar] [CrossRef]
- Sternini, C.; Rozengurt, E. Bitter Taste Receptors as Sensors of Gut Luminal Contents. Nat. Rev. Gastroenterol. Hepatol. 2025, 22, 39–53. [Google Scholar] [CrossRef]
- Dotson, C.D.; Zhang, L.; Xu, H.; Shin, Y.-K.; Vigues, S.; Ott, S.H.; Elson, A.E.T.; Choi, H.J.; Shaw, H.; Egan, J.M.; et al. Bitter Taste Receptors Influence Glucose Homeostasis. PLoS ONE 2008, 3, e3974. [Google Scholar] [CrossRef]
- Beck, T.K.; Jensen, S.; Bjoern, G.K.; Kidmose, U. Masking Effect of Sucrose on Perception of Bitter Compounds in Brassica Vegetables. J. Sens. Stud. 2014, 29, 190–200. [Google Scholar] [CrossRef]
- He, W.; Liang, L.; Zhang, Y. Pungency Perception and the Interaction with Basic Taste Sensations: An Overview. Foods 2023, 12, 2317. [Google Scholar] [CrossRef]
- Choi, Y.; Wong, R.R.; Cha, Y.K.; Park, T.H.; Kim, Y.; Chung, S.-J. Sweet–Bitter Taste Interactions in Binary Mixtures of Sweeteners: Relationship between Taste Receptor Activities and Sensory Perception. Food Chem. 2024, 459, 140343. [Google Scholar] [CrossRef]
- Chen, J.; Tian, S.; Wang, X.; Mao, Y.; Zhao, L. The Stevens Law and the Derivation of Sensory Perception. J. Future Foods 2021, 1, 82–87. [Google Scholar] [CrossRef]
- Mao, Y.; Zhang, Z.; Liu, L.; Qin, Y.; Qin, Z.; Cao, Y.; Zou, X.; Shi, J.; Tian, S.; Jiang, G. Dynamic Interaction of Sweet and Sour Taste Perceptions Based on Sucrose and Citric Acid. npj Sci. Food 2025, 9, 152–11. [Google Scholar] [CrossRef]
- Liu, Q.-R.; Zhang, S.-H.; Zhu, Z.-J.; Luo, J.; Xiang, L.; Xiang, Y.-H.; Wang, S.-T.; Zhang, W.-W.; Liu, Q.-Q.; Huang, T.; et al. Ratio Limitation of Burnt-Bitter-Aroma Compounds in Strong-Aroma Baijiu. Food Chem. 2026, 513, 148966. [Google Scholar] [CrossRef]
- Qin, Y.; Zhou, Y.; Yan, X.; Qin, Z.; Mao, Y.; Tian, S. Establishment of a New Cell-Based Assay to Quantitatively Evaluate the Sweetness of Sugar and Sugar Alcohol. Food Chem. 2024, 434, 137436. [Google Scholar] [CrossRef]
- Mao, Y.; Tian, S.; Gong, S.; Qin, Y.; Han, J.; Deng, S. A Broad-Spectrum Sweet Taste Sensor Based on Ni(OH)2/Ni Electrode. Sensors 2018, 18, 2758. [Google Scholar] [CrossRef]
- Zhang, W.; Liao, J.; Qi, J. Bitter Taste Receptor-Guided Delivery of Limonin: Bridging Taste Masking and Gut Health. Trends Food Sci. Technol. 2026, 177, 105988. [Google Scholar] [CrossRef]
- Qin, Z.; Shen, Q.; Zhao, R.; Qin, Y.; Shen, H.; Tian, S. An Aroma-Induced Strategy for Suppressing Naringin Bitterness: Insights from Sensory Evaluation, Receptor-Based Cellular Assays, and Molecular Simulations. Food Res. Int. 2026, 243, 120382. [Google Scholar] [CrossRef]
- Cheng, S.; Qin, Y.; Mao, Y.; Cao, Y.; Zheng, R.; Han, J.; Tian, S.; Qin, Z. “Reference Sample Comparison Method”: A New Voltammetric Electronic Tongue Method and Its Application in Assessing the Shelf Life of Fresh Milk. Food Chem. 2025, 463, 141064. [Google Scholar] [CrossRef]
- Mao, Y.; Li, N.; Shi, B.; Zhao, L.; Cheng, S.; Tian, S.; Wang, H. Geographical Origin Determination of Red Huajiao in China Using the Electronic Nose Combined with Ensemble Recognition Algorithm. J. Food Sci. 2021, 86, 4922–4931. [Google Scholar] [CrossRef]
- Mao, Y.; Cheng, S.; Qin, Y.; Qin, Z.; Tian, S. Grade Identification of Rice Eating Quality via a Novel Flow-Injection Voltammetric Electronic Tongue Combined with SFFS-BO-SVM. Sens. Actuators B Chem. 2024, 411, 135700. [Google Scholar] [CrossRef]
- Mao, Y.; Tian, S.; Gong, S.; Qin, Y.; Han, J.; Deng, S. A Broad-Spectrum Sweet Taste Sensor Based on Ni(OH)2/Ni Electrode. Sensors 2018, 18, 2758. [Google Scholar] [CrossRef]
- Kong, D.; Zhang, Y.; Li, X.; Dong, Y.; Dou, Z.; Yang, Z.; Zhang, M.; Wang, H. The Material Basis of Bitter Constituents in Carbonized Typhae Pollen, Based on the Integration Strategy of Constituent Analysis, Taste Sensing System and Molecular Docking. J. Pharm. Biomed. Anal. 2024, 242, 116028. [Google Scholar] [CrossRef]
- Wu, X.; Miyake, K.; Tahara, Y.; Fujimoto, H.; Iwai, K.; Narita, Y.; Hanzawa, T.; Kobayashi, T.; Kakiuchi, M.; Ariki, S.; et al. Quantification of Bitterness of Coffee in the Presence of High-Potency Sweeteners Using Taste Sensors. Sens. Actuators B Chem. 2020, 309, 127784. [Google Scholar] [CrossRef]
- Nath, A.; Eren, B.A.; Zinia Zaukuu, J.-L.; Koris, A.; Pásztorné-Huszár, K.; Szerdahelyi, E.; Kovacs, Z. Detecting the Bitterness of Milk-Protein-Derived Peptides Using an Electronic Tongue. Chemosensors 2022, 10, 215. [Google Scholar] [CrossRef]
- Wang, Z.; Li, J.; Hong, X.; Han, X.; Liu, B.; Li, X.; Zhang, H.; Gao, J.; Liu, N.; Gao, X.; et al. Taste Masking Study Based on an Electronic Tongue: The Formulation Design of 3D Printed Levetiracetam Instant-Dissolving Tablets. Pharm. Res. 2021, 38, 831–842. [Google Scholar] [CrossRef]
Figure 3.
Relationships between characteristic electronic tongue responses and human sensory bitterness for three bitter compounds. (a) Relationship between CPA1(BT0) and sensory bitterness for quinine hydrochloride. (b) Relationship between CPA1(AN0) and sensory bitterness for berberine hydrochloride. (c) Relationship between CPA1(C00) and sensory bitterness for iso-α-acid. Dashed lines indicate the linear fitting curves used to establish the bitterness conversion models.
Figure 3.
Relationships between characteristic electronic tongue responses and human sensory bitterness for three bitter compounds. (a) Relationship between CPA1(BT0) and sensory bitterness for quinine hydrochloride. (b) Relationship between CPA1(AN0) and sensory bitterness for berberine hydrochloride. (c) Relationship between CPA1(C00) and sensory bitterness for iso-α-acid. Dashed lines indicate the linear fitting curves used to establish the bitterness conversion models.
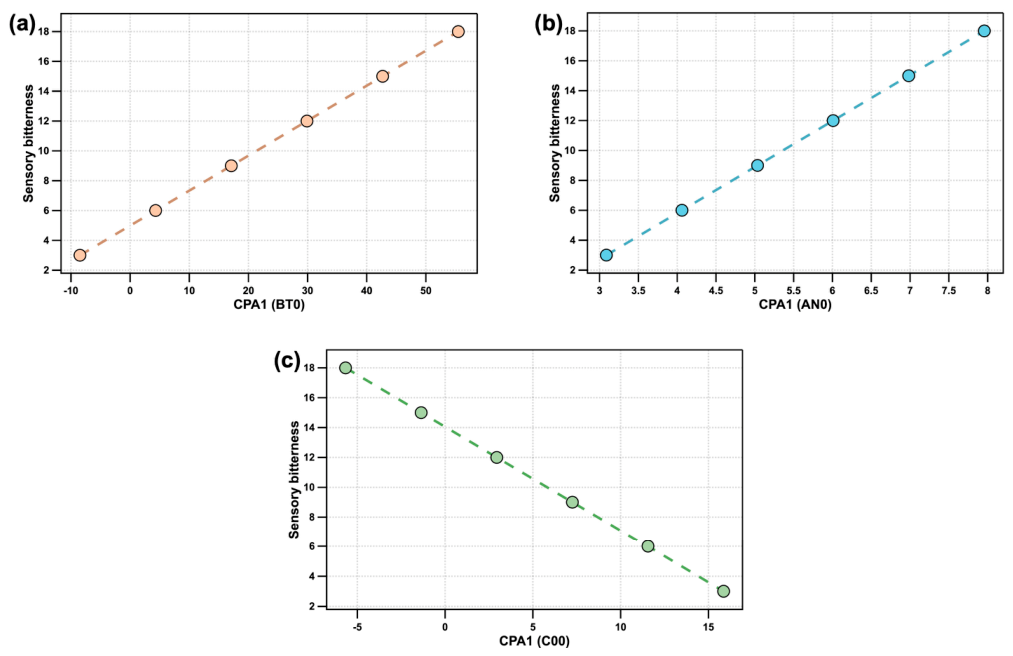
Figure 4.
Concentration-dependent electronic tongue responses to three bitter compounds under different sucrose backgrounds. (a) CPA1(BT0) responses to quinine hydrochloride under 0%, 2%, and 8% sucrose backgrounds. (b) CPA1(AN0) responses to berberine hydrochloride under 0%, 2%, and 8% sucrose backgrounds. (c) CPA1(C00) responses to iso-α-acid under 0%, 2%, and 8% sucrose backgrounds. Dashed lines indicate the fitted concentration–response curves.
Figure 4.
Concentration-dependent electronic tongue responses to three bitter compounds under different sucrose backgrounds. (a) CPA1(BT0) responses to quinine hydrochloride under 0%, 2%, and 8% sucrose backgrounds. (b) CPA1(AN0) responses to berberine hydrochloride under 0%, 2%, and 8% sucrose backgrounds. (c) CPA1(C00) responses to iso-α-acid under 0%, 2%, and 8% sucrose backgrounds. Dashed lines indicate the fitted concentration–response curves.
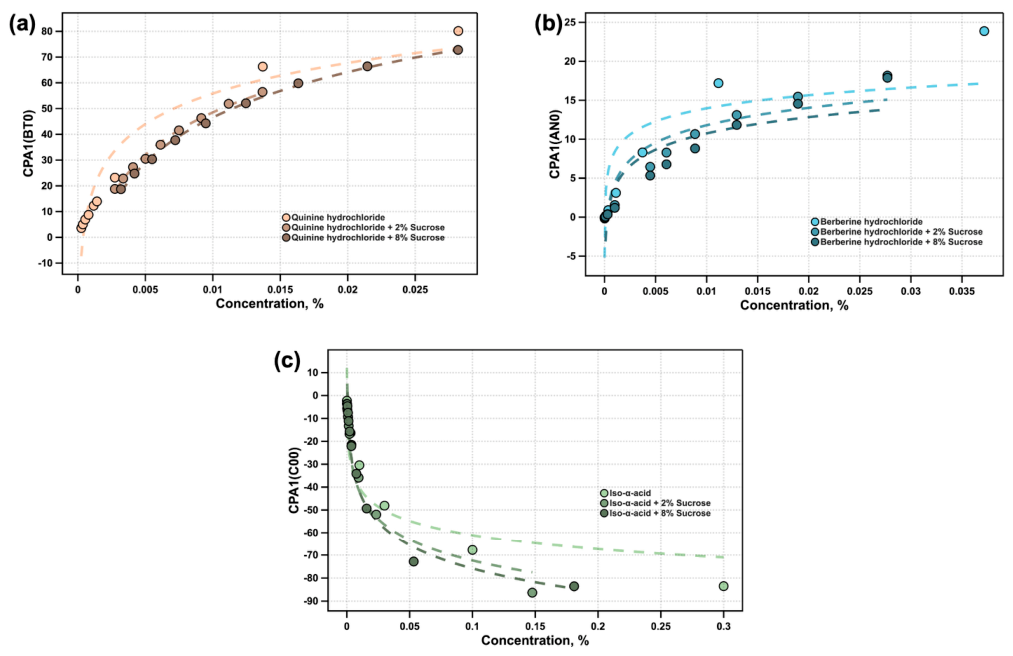

Table 1.
Fitting curves of the electronic tongue response to three bitter compounds.
| Bitter compounds | Fitting equation | Equation parameters | R2 | |
|---|---|---|---|---|
| a | b | |||
| Quinine hydrochloride | E* = a × ln(C) + b | 21.19 | 154.97 | 0.991 |
| Berberine hydrochloride | 4.27 | 25.54 | 0.910 | |
| Iso-α-acid | -13.51 | -97.40 | 0.984 | |
* E means the response signal of electronic tongue.
Table 2.
Conversion model linking electronic tongue signals to human sensory bitterness.
| Bitter compounds | Conversion equation | Equation parameters | |
|---|---|---|---|
| a | b | ||
| Quinine hydrochloride | S* = a × E▲ + b | 0.24 | 4.99 |
| Berberine hydrochloride | 3.08 | -6.51 | |
| Iso-α-acid | -0.70 | 14.05 | |
* S means the human sensory bitterness. ▲ E means the response signal of electronic tongue.
Table 3.
Validation results of conversion model.
| Bitter compounds |
Human sensory bitterness |
Electronic tongue response signal |
Electronic tongue predicted bitterness |
Absolute Relative Error |
Mean Absolute Percentage Error |
|---|---|---|---|---|---|
| Quinine hydrochloride | 5 | 0.02 | 4.99 | 0.11% | 6.02% |
| 20 | 69.16 | 21.24 | 6.21% | ||
| 35 | 139.80 | 37.84 | 8.12% | ||
| 50 | 171.05 | 45.19 | 9.63% | ||
| Berberine hydrochloride | 5 | 3.51 | 4.30 | 13.98% | 10.76% |
| 20 | 8.07 | 18.35 | 8.27% | ||
| 35 | 14.62 | 38.52 | 10.06% | ||
| 50 | 20.09 | 55.37 | 10.73% | ||
| Iso-α-acid | 15 | -1.11 | 14.82 | 1.18% | 7.14% |
| 30 | -19.63 | 27.73 | 7.56% | ||
| 45 | -38.26 | 40.72 | 9.52% | ||
| 60 | -74.80 | 66.19 | 10.31% |
Disclaimer/Publisher’s Note: The statements, opinions and data contained in all publications are solely those of the individual author(s) and contributor(s) and not of MDPI and/or the editor(s). MDPI and/or the editor(s) disclaim responsibility for any injury to people or property resulting from any ideas, methods, instructions or products referred to in the content. |
© 2026 by the authors. Licensee MDPI, Basel, Switzerland. This article is an open access article distributed under the terms and conditions of the Creative Commons Attribution (CC BY) license (http://creativecommons.org/licenses/by/4.0/).
Copyright: This open access article is published under a Creative Commons CC BY 4.0 license, which permit the free download, distribution, and reuse, provided that the author and preprint are cited in any reuse.