

Submitted:
25 September 2026
Posted:
29 September 2026
You are already at the latest version
Abstract
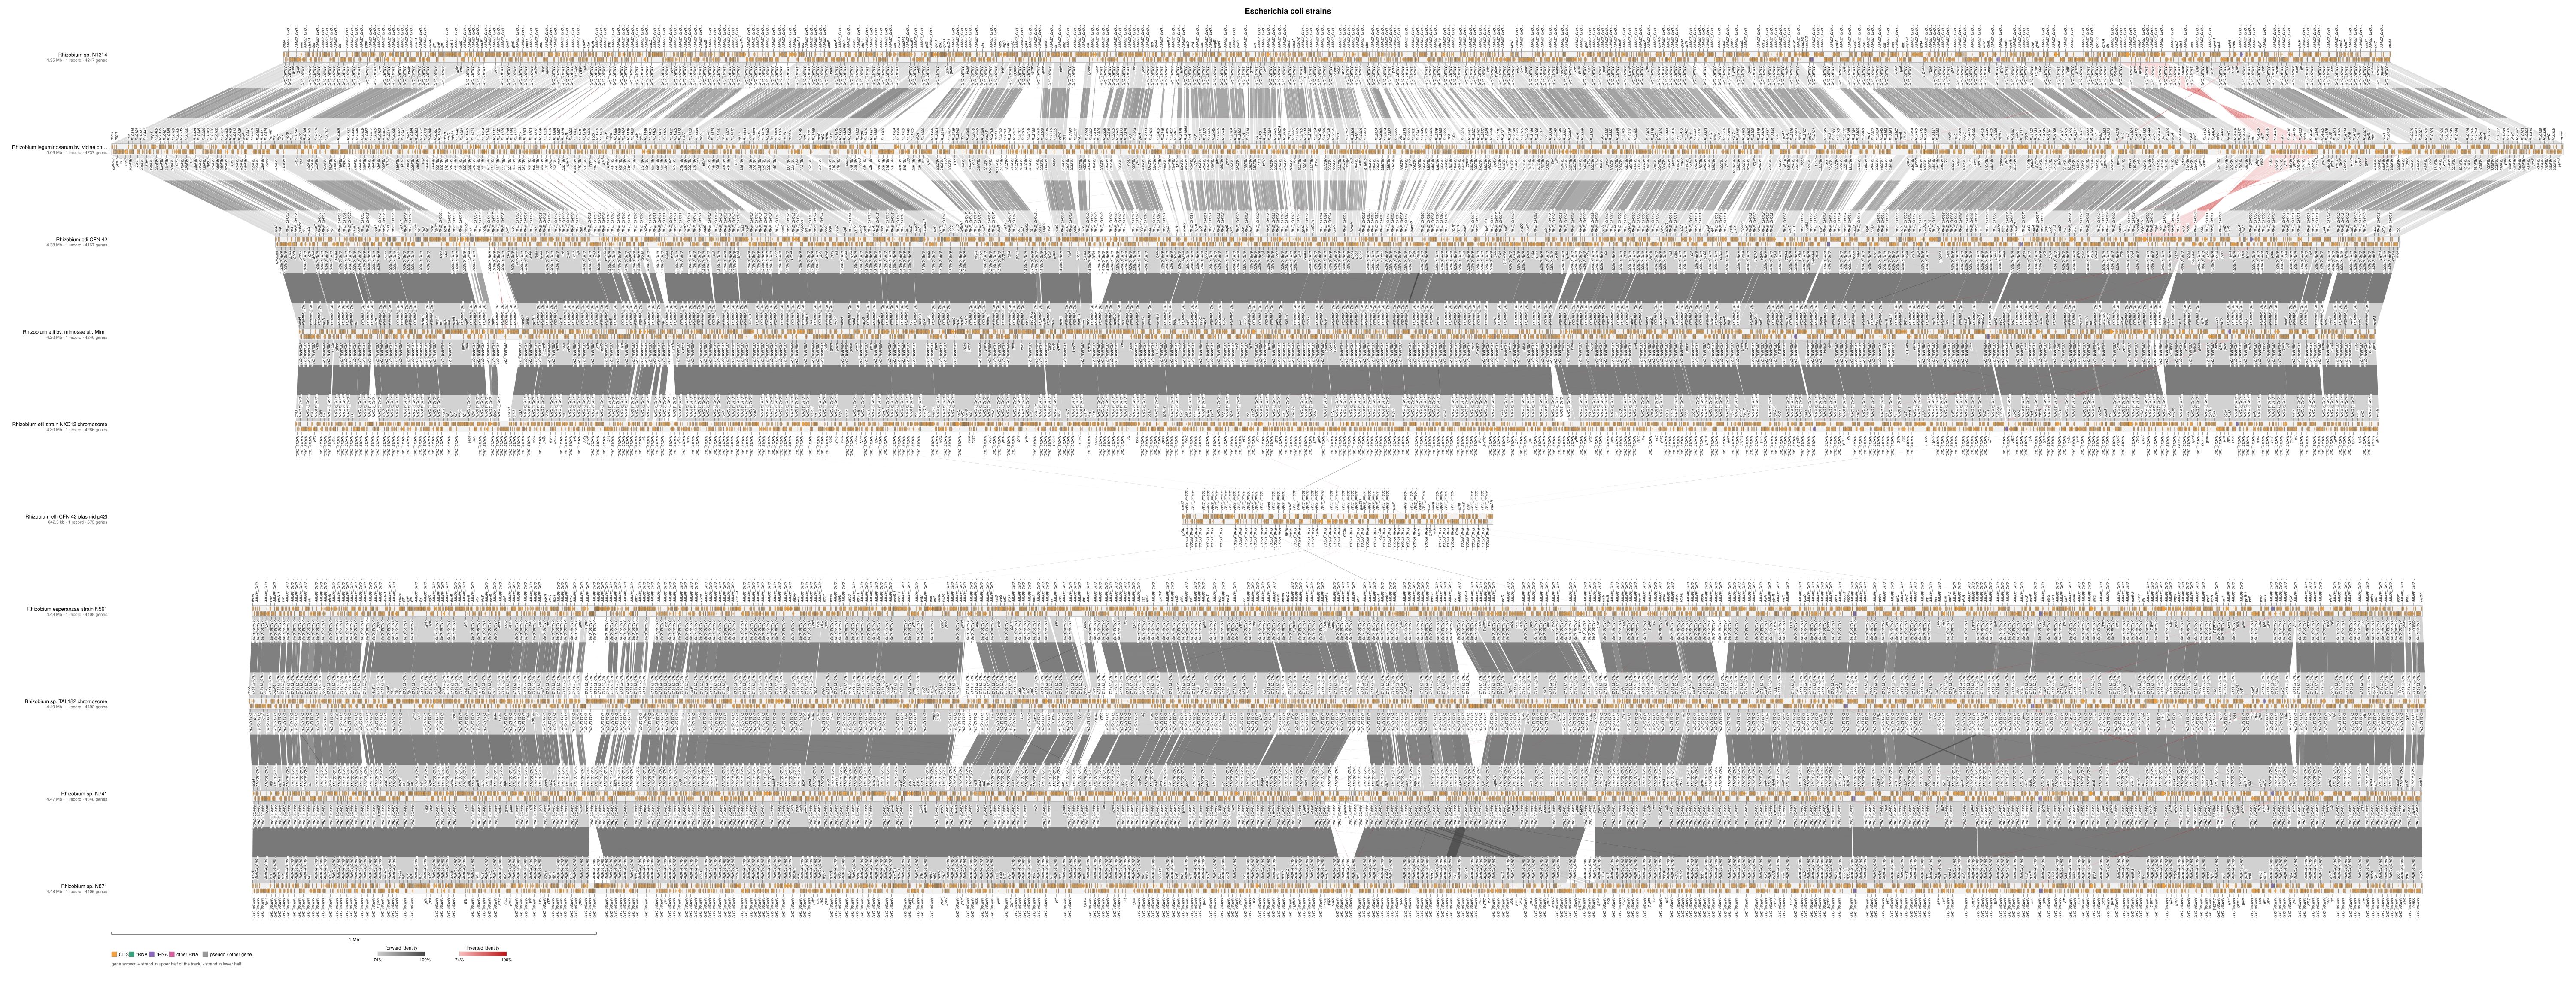
Comparative visualization of bacterial genome structure is an important component of microbial genomics, enabling the inspection of genome conservation, rearrangements, inversions, insertions and deletions, and large-scale differences in gene organization. I present bactiviz, a lightweight command-line tool for generating linear collinearity maps of bacterial genomes. Implemented as a single-binary application in Rust, bactiviz uses MUMmer for nucleotide-level pairwise alignment and produces publication-ready, self-contained SVG figures. The tool is designed specifically for multi-replicon bacterial assemblies and supports chromosomes, plasmids, and other sequence records within GenBank and FASTA inputs. bactiviz provides optional origin normalization of circular replicons using a cascading gene-identification strategy based on gene symbols, locus tags, and product annotations, thereby accommodating heterogeneous real-world GenBank annotations. Conserved regions between adjacent genomes are represented as identity-scaled ribbons, including strand-aware visualization of inversions, while annotated genomic features are rendered as directional gene arrows. An automated label-placement procedure prioritizes user-specified genes and places additional labels where sufficient space is available, reducing overlap while retaining informative gene-level annotation at different output scales. A redundancy-resolution procedure further reduces visually cluttered alignments caused by repetitive sequences and duplicated genomic regions. The resulting SVG output is resolution-independent and can be directly incorporated into manuscripts or edited using standard vector-graphics software. bactiviz is intended for analyses in which a defined ordering of genomes is to be visualized rather than for all-against-all or multiple-genome alignment. By combining MUMmer-based alignment with native multi-replicon handling, genome-orientation normalization, exhaustive feature rendering, and automated annotation placement, bactiviz provides a lightweight and reproducible workflow for producing interpretable linear comparative-genomics figures.
Keywords:
bacterial genomics
; alignment
; visualization
; syntenic
; linearity blocks
1. Introduction
Comparative visualization of microbial genome architecture is an established component of bacterial genomics, supporting the assessment of genomic relatedness, the identification of large-scale rearrangements, the characterization of horizontal gene transfer, and the inspection of genome assembly and annotation structure. A common visualization task is the construction of a linear collinearity map, in which two or more genomes are represented as parallel horizontal tracks, homologous sequence regions are connected by polygonal links, and annotated genomic features are displayed as strand-oriented glyphs along each track. This representation, implemented in widely used tools including Mauve (Darling et al., 2004), Easyfig (Sullivan et al., 2011), genoPlotR (Guy et al., 2010), clinker (Gilchrist and Chooi, 2021), and, more recently, pyGenomeViz (https://github.com/moshi4/pyGenomeViz), facilitates visual assessment of genome-scale collinearity, inversions, insertions, deletions, and other structural differences without requiring direct inspection of alignment coordinates. Existing approaches can broadly be divided into two classes. The first, represented by Mauve (Darling et al., 2004) and progressiveMauve (Darling et al., 2010), performs multiple-genome alignment and identifies locally collinear blocks (LCBs) across multiple input sequences. These approaches provide a global alignment framework for identifying conserved and rearranged genomic segments, but are not primarily designed for lightweight, highly configurable rendering of gene-level annotations in predefined genome orders. The second class, represented by Easyfig (Sullivan et al., 2011) and pyGenomeViz (https://github.com/moshi4/pyGenomeViz), uses pairwise genome comparisons in which each genome is aligned with an adjacent genome in a user-defined sequence. Such workflows commonly employ external nucleotide-alignment programs, including BLASTN or MUMmer (Kurtz et al., 2004; Marçais et al., 2018), and represent the resulting homologous regions as links between adjacent genome tracks. This pairwise strategy avoids the computational and conceptual requirements of a joint multiple-genome alignment and is well suited to visualization of predefined genome series, including multi-megabase bacterial chromosomes.
In practical applications, however, the generation of publication-quality linear collinearity maps from bacterial genome assemblies presents several additional requirements. Bacterial genomes frequently comprise multiple replicons, including chromosomes and plasmids, and their records may contain heterogeneous feature annotations. In addition, circular replicons deposited independently may differ in their coordinate origin and strand orientation. Without normalization, these differences can produce apparent genome-wide inversions, discontinuities, or wrap-around alignments that reflect coordinate conventions rather than biological rearrangements. Existing workflows may therefore require additional preprocessing or custom scripting to accommodate multi-replicon assemblies, consistently render annotated genomic features, and normalize replicon orientation before comparative visualization. A related complication arises from heterogeneity in GenBank annotation. In particular, the /gene qualifier is not uniformly populated; coding sequences may instead be annotated primarily with a locus_tag and a free-text /product qualifier. Workflows that rely exclusively on gene symbols for operations such as origin normalization or gene labeling may consequently fail silently when processing such records.
Here, I present bactiviz, a lightweight command-line tool implemented in Rust for the generation of publication-ready linear collinearity maps of bacterial genomes. bactiviz integrates an external MUMmer alignment backend with native parsing of multi-record GenBank and FASTA input, optional normalization of circular replicon orientation using a user-specified gene, strand-aware rendering of annotated genomic features, and automated gene-label placement. Gene identification for orientation normalization uses a hierarchical lookup based on the /gene qualifier, locus_tag, and /product annotation, thereby accommodating heterogeneous annotation records. Pairwise alignments between adjacent genomes are represented as identity-dependent polygonal links, with separate rendering of forward and inverted alignments. Genomic features are rendered as directional glyphs according to strand, while an automated label-placement procedure prioritizes explicitly requested genes and places additional labels subject to spatial constraints. The output is a self-contained, resolution-independent SVG document suitable for direct incorporation into manuscripts or subsequent editing in vector-graphics software. The implementation has no runtime dependencies beyond the MUMmer executables and is designed to process multi-megabase bacterial chromosomes efficiently. The following sections describe the processing pipeline, discuss its computational and visualization characteristics, and delineate its scope and limitations relative to existing comparative-genomics visualization approaches.
2. Algorithm
bactiviz processes an ordered list of k input genomes, G₁, …, G_k, each potentially comprising multiple replicons (a chromosome and zero or more plasmids or contigs), and produces (a) a set of pairwise collinear-block alignments between every adjacent pair (Gᵢ, Gᵢ₊₁), and (b) a single SVG figure rendering all genomes as stacked linear tracks joined by these alignments. The pipeline consists of five stages: (1) input normalization, (2) optional origin reorientation, (3) pairwise collinear-block detection, (4) redundant-alignment resolution, and (5) coordinate-mapped rendering with automated gene-label placement.
Input Normalization and Feature Extraction
Each input file is parsed as either multi-record GenBank flat-file or FASTA. For GenBank input, the parser performs a single linear pass, tracking a finite-state section marker (header / FEATURES / ORIGIN) and accumulating, for each feature spanning a join(...)/complement(...) location expression, a tuple
| Feature = ⟨kind, gene, locus_tag, product, strand, ranges = [(start, end), …] ⟩ |
restricted to biologically meaningful kinds (CDS, tRNA, rRNA, tmRNA, ncRNA, misc_RNA, gene). Because GenBank records frequently encode a gene twice—once as a gene feature and once as the corresponding CDS/RNA feature—features sharing an identical (start, end, strand) key are merged, with the gene symbol propagated from the gene feature onto its co-located CDS/RNA feature; unmatched gene-only features are retained (these typically represent pseudogenes or otherwise un-translated loci) and rendered in a distinguishing color. Record identifiers are sanitized to whitespace-free, filesystem- and FASTA-header-safe tokens and de-duplicated, since the downstream aligner identifies sequences by header string.
Origin Reorientation
Circular replicons deposited by different submitters may begin at arbitrary, mutually inconsistent positions and may be stored on either strand. Left uncorrected, this manifests in a pairwise alignment as a spurious whole-genome inversion or a diagonal “wrap-around” discontinuity, rather than the collinear block a naive reader would expect for two closely related strains. bactiviz optionally corrects for this via a user-specified anchor gene g (conventionally dnaA for the bacterial chromosome), applied independently to the largest replicon of every input genome:
|
ROTATE-TO-GENE(record R, gene g):
f ← first feature in R matching g, tried in order: (a) CDS whose /gene equals g (b) any feature whose /gene equals g (c) CDS whose locus_tag equals g (d) CDS whose /product contains g as a token if no match found: return unmodified (warn) (s, e, strand) ← bounding coordinates and strand of f if strand is reverse: R.sequence ← reverse_complement(R.sequence) recompute (s, e) in the reverse-complemented coordinate frame flip strand of every feature in R shift ← s R.sequence ← rotate_left(R.sequence, shift) # circular rotation for every feature in R: remap each exon range (a, b) ↦ ((a − shift) mod L, · ) split any range that now wraps past the sequence end into two return R |
The cascading match order in step (a)–(d) is necessary because a nontrivial fraction of real annotation submissions carry no /gene qualifier at all, encoding gene identity only through locus_tag and free-text /product; restricting the lookup to /gene alone silently fails on such records.
Pairwise Collinear-Block Detection
For each adjacent pair (Gᵢ, Gᵢ₊₁) in input order, bactiviz writes both genomes to temporary FASTA and delegates alignment to MUMmer’s nucmer (Kurtz et al., 2004; Marçais et al., 2018), which builds a suffix-array-based index of the reference and reports maximal unique (or maximal, under --maxmatch) exact matches, clustered into diagonal chains in O(n log n) with respect to reference length n. The delta file is optionally passed through delta-filter -1 to enforce a one-to-one mapping, and alignment coordinates are extracted with show-coords -T -H -l. Each reported alignment row is parsed into a block
| Block = ⟨r_rec, r_start, r_end, q_rec, q_start, q_end, inverted, identity ⟩ |
where r_rec/q_rec disambiguate which replicon (chromosome vs. plasmid/contig) of the multi-record genome the coordinates belong to, inverted is derived from the relative sign of the query coordinate span, and blocks falling below user-configurable minimum length or identity thresholds are discarded. This stage treats each genome pair independently and does not attempt a joint multiple alignment across all k genomes; the trade-off, shared with other pairwise-linear tools, is O(k) aligner invocations rather than one multiple-genome alignment, at the cost of not directly identifying blocks conserved across non-adjacent genomes.
Redundant-Alignment Resolution
Repetitive elements—most notably paralogous rRNA operons and, in plastid genomes, inverted-repeat pairs—generate multiple mutually consistent but redundant hits covering the same query interval (e.g., a query IR copy matching both the reference IRa and reference IRb in opposite orientations). Left unfiltered, these produce visually cluttered, overlapping ribbons. bactiviz resolves this with a greedy interval-claiming procedure over the query axis:
|
RESOLVE(blocks):
score(b) = (b.q_end − b.q_start) × b.identity order blocks: all forward blocks by descending score, then all inverted blocks by descending score claimed ← boolean array over query length, initialized false kept ← ∅ for b in order: for each maximal unclaimed sub-interval [a, e) ⊆ [b.q_start, b.q_end): if (e − a) ≥ min_block_length: r-interval ← linearly interpolated sub-range of [b.r_start, b.r_end) corresponding to [a, e), reversed if b.inverted kept ← kept ∪ { clipped block over [a,e) / r-interval } mark [a, e) as claimed return kept |
Processing all forward blocks before any inverted block ensures that a genuine direct match wins over its inverted mirror-image competitor when both exist, while true inversions—which have no forward competitor—are retained. This is applied by default and can be disabled (--all-links) to inspect the unfiltered hit set.
Layout and Rendering
Each genome is assigned a horizontal track partitioned into one sub-span per replicon (laid left to right in file order, separated by a small fixed gap), scaled by a single shared factor sc = plot_width / maxᵢ(total_length(Gᵢ)) so that all tracks are drawn to a common genomic scale; tracks may optionally be centered or left-aligned when replicon totals differ between genomes. Every retained Block from stage 4 is rendered as a quadrilateral connecting its reference-track interval to its query-track interval, twisted (query endpoints swapped) when inverted = true, and filled by linear interpolation between two color ramps (grey for forward, red for inverted) as a function of percent identity relative to the minimum observed identity. To avoid vanishingly thin polygons for short-but-real features (e.g., a single conserved operon on a multi-megabase chromosome) being lost to rasterization, each ribbon’s drawn width is clamped to a minimum of ~1.4 px at each end without altering its underlying coordinates.
Every retained gene feature is drawn as a strand-oriented arrow (apex on the 3′ end), with forward-strand features placed in the upper half and reverse-strand features in the lower half of the track band, and a tooltip carrying gene name, locus tag, product, and coordinates for interactive inspection.
Gene-name labeling is posed as a constrained placement problem: candidate labels (one per gene bearing a /gene symbol, or locus_tag where no symbol exists) are partitioned into an “above” set (forward strand) and a “below” set (reverse strand), each independently placed by a greedy left-to-right scan analogous to interval-point scheduling:
|
PLACE-LABELS(candidates, min_spacing):
sort candidates by (priority, x-position) # forced labels first placed ← ∅ for c in candidates: if c.forced or ∀ p ∈ placed: |p.x − c.x| ≥ min_spacing: placed ← placed ∪ {c} return placed |
run independently for the above- and below-track label rows, each in O(m log m) for m candidate genes. Labels explicitly requested via --label-genes are assigned top priority and always placed; all other candidates are placed only if space permits, so that the figure degrades gracefully from “every gene named” at large output widths to a legible subset at whole-chromosome scale, rather than producing unreadable overlapping text. Each rendered label is drawn with a duplicated white-halo underlay for legibility against the identity-colored ribbons beneath it, and a thin leader line connects it to the corresponding gene arrow.
Complexity and Implementation Notes
Parsing and feature extraction are linear in file size. Reorientation is linear in replicon length. Alignment cost is dominated by MUMmer’s own suffix-array construction and chaining, approximately O(n log n) per genome pair. Redundancy resolution and label placement are each O(m log m) in the number of blocks or candidate labels per genome pair. The complete pipeline is implemented as a single-binary Rust command-line tool with no runtime dependencies beyond the MUMmer executables (nucmer, show-coords, optionally delta-filter), and emits one self-contained, resolution-independent SVG document per run together with an optional tab-separated block table for downstream quantitative analysis.
3. Discussion
Design Rationale and Scope
bactiviz occupies a deliberately narrow niche: pairwise-adjacent, MUMmer-backed, gene-annotated linear collinearity figures for a small-to-moderate number of ordered genomes. This design mirrors Easyfig (Sullivan et al., 2011) and pyGenomeViz (https://github.com/moshi4/pyGenomeViz) rather than Mauve (Darling et al., 2004) or progressiveMauve (Darling et al., 2010), and the trade-off is the same one those tools accept—an alignment between genomes Gᵢ and Gᵢ₊₂ is never computed directly, so a rearrangement or horizontally transferred region shared by non-adjacent genomes but absent from the intervening genome will not be drawn as a link, even though it may be visible as parallel structure once the reader compares two separate rows of ribbons by eye. For studies whose central question is the identification of loci shared across a set of genomes irrespective of order—for example, a pan-genome or core-genome analysis—a graph-based or multiple-alignment approach (Mauve, Darling et al., 2004; Roary, Page et al., 2015; Panaroo, Tonkin-Hill et al., 2020) remains the more direct tool. bactiviz is best suited to the complementary, and in our experience more common, task of presenting a specific, already-chosen ordering of genomes (typically a phylogenetic ladder of increasingly divergent strains or species) as a single explanatory figure.
Behavior on Closely Versus Distantly Related Genomes
Applying bactiviz to a pair of closely related genomes (e.g., two strains of the same species) at default MUMmer stringency typically yields a small number of long, high-identity blocks spanning most of the chromosome, which is the regime the default parameters (nucmer -l 20 -c 65, a 1 kb minimum block length) were tuned for. Applying it to genomes separated by larger evolutionary distances—as in the Bacillus subtilis / Mycobacterium tuberculosis comparison used during development—produces a materially different, and informative, result: nucmer detects essentially no chromosome-backbone synteny, and the only retained block corresponds to the 16S–23S–5S ribosomal RNA operon, a locus whose sequence conservation is known to extend across bacterial phyla even when gene order and content elsewhere have diverged beyond nucleotide-level alignability. We view this as a useful negative control on the tool’s correctness—an empty or near-empty collinearity map for unrelated genomes is the biologically expected output, not a failure—but it also illustrates a genuine usability hazard: a single short block on a multi-megabase axis is, by construction, only a few pixels wide, and can be missed entirely in a screen preview or a heavily downsampled raster export despite being correctly computed and rendered. The minimum-ribbon-width clamp described in Section 2.5 mitigates this for raster export, but does not change the underlying fact that whole-genome linear maps compress short features; for a specific locus of interest at this scale, a dedicated zoomed-in or locus-level figure remains the more appropriate presentation.
Availability: bactiviz (https://codeberg.org/gsablok/bactviz) is implemented in Rust and distributed as source; it depends at runtime on a MUMmer installation (nucmer, show-coords, and optionally delta-filter) reachable on PATH or via an explicit --mummer-dir. Output is a single self-contained SVG document per run, together with an optional tab-separated table of retained alignment blocks suitable for downstream quantitative reuse.
Acknowledgments
GS conceived the study, developed the software and wrote the paper.
References
- Darling, A.C.E.; Mau, B.; Blattner, F.R.; Perna, N.T. Mauve: multiple alignment of conserved genomic sequence with rearrangements. Genome Res. 2004, 14(7), 1394–1403. [Google Scholar] [CrossRef]
- Darling, A.E.; Mau, B.; Perna, N.T. progressiveMauve: multiple genome alignment with gene gain, loss and rearrangement. PLoS ONE 2010, 5(6), e11147. [Google Scholar] [CrossRef]
- Delcher, A.L.; Phillippy, A.; Carlton, J.; Salzberg, S.L. Fast algorithms for large-scale genome alignment and comparison. Nucleic Acids Res. 2002, 30(11), 2478–2483. [Google Scholar] [CrossRef]
- Gilchrist, C.L.M.; Chooi, Y.-H. clinker & clustermap.js: automatic generation of gene cluster comparison figures. Bioinformatics 2021, 37(16), 2473–2475. [Google Scholar] [CrossRef]
- Guy, L.; Roat Kultima, J.; Andersson, S.G.E. genoPlotR: comparative gene and genome visualization in R. Bioinformatics 2010, 26(18), 2334–2335. [Google Scholar] [CrossRef]
- Kurtz, S.; Phillippy, A.; Delcher, A.L.; Smoot, M.; Shumway, M.; Antonescu, C.; Salzberg, S.L. Versatile and open software for comparing large genomes. Genome Biol. 2004, 5(2), R12. [Google Scholar] [CrossRef]
- Marçais, G.; Delcher, A.L.; Phillippy, A.M.; Coston, R.; Salzberg, S.L.; Zimin, A. MUMmer4: a fast and versatile genome alignment system. PLoS Comput. Biol. 2018, 14(1), e1005944. [Google Scholar] [CrossRef]
- moshi4. pyGenomeViz: a genome visualization python package for comparative genomics. GitHub repository. Available online: https://github.com/moshi4/pyGenomeViz (accessed on 2026).
- Page, A.J.; Cummins, C.A.; Hunt, M.; Wong, V.K.; Reuter, S.; Holden, M.T.G.; Fookes, M.; Falush, D.; Keane, J.A.; Parkhill, J. Roary: rapid large-scale prokaryote pan genome analysis. Bioinformatics 2015, 31(22), 3691–3693. [Google Scholar] [CrossRef]
- Sullivan, M.J.; Petty, N.K.; Beatson, S.A. Easyfig: a genome comparison visualizer. Bioinformatics 2011, 27(7), 1009–1010. [Google Scholar] [CrossRef]
- Tonkin-Hill, G.; MacAlasdair, N.; Ruis, C.; Weimann, A.; Horesh, G.; Lees, J.A.; Gladstone, R.A.; Lo, S.; Beaudoin, C.; Floto, R.A.; Frost, S.D.W.; Corander, J.; Bentley, S.D.; Parkhill, J. Producing polished prokaryotic pangenomes with the Panaroo pipeline. Genome Biol. 2020, 21, 180. [Google Scholar] [CrossRef]
Disclaimer/Publisher’s Note: The statements, opinions and data contained in all publications are solely those of the individual author(s) and contributor(s) and not of MDPI and/or the editor(s). MDPI and/or the editor(s) disclaim responsibility for any injury to people or property resulting from any ideas, methods, instructions or products referred to in the content. |
© 2026 by the authors. Licensee MDPI, Basel, Switzerland. This article is an open access article distributed under the terms and conditions of the Creative Commons Attribution (CC BY) license (http://creativecommons.org/licenses/by/4.0/).
Copyright: This open access article is published under a Creative Commons CC BY 4.0 license, which permit the free download, distribution, and reuse, provided that the author and preprint are cited in any reuse.