
Submitted:
25 September 2026
Posted:
28 September 2026
You are already at the latest version
Abstract
Safety risks of large-scale water conservancy, transportation, and energy infrastructure emerge from coupled geological conditions, extreme weather events, and construction disturbances throughout construction and operation phases. These risks are characterized by concealment, wide-area distribution, and dynamic evolution. Limited by sensor deployment locations and personnel accessibility, conventional ground sensors and manual inspections struggle to detect regional geological hazards outside project boundaries. Space–air–ground remote sensing observations, including Synthetic Aperture Radar (SAR) satellites, optical satellites, and Unmanned Aerial Vehicle (UAV) imagery, support wide-area non-contact monitoring and capture spatial information such as slope deformation, land cover anomalies, and landslide precursors. However, single-source remote sensing is vulnerable to cloud and fog contamination and temporal decorrelation. It also cannot reflect internal structural conditions, which demands feature-level fusion with ground-based monitoring data. This study takes multi-source remote sensing as the core modality and integrates ground-based time-series sensors, on-site audio-visual recordings, and engineering archive texts. A space–air–ground collaborative multimodal safety risk situational awareness framework is established for major infrastructure projects. Following the pipeline of feature extraction, cross-modal spatiotemporal alignment, and adaptive attention fusion, the framework enables risk perception, deduction and assessment, and forms a closed-loop prevention chain of “cognition–deduction–decision–optimization”. Simulations and field measurements show that the proposed model achieves an overall risk perception rate of 96%, early warning accuracy above 94%, and a 63% reduction in response latency compared with conventional schemes. The remote sensing branch achieves a recall rate of 92.7% for geological hazard identification. Ablation experiments demonstrate that removing remote sensing inputs reduces the overall perception rate to 90.2%, accompanied by a notable increase in undetected geological hazards. This work delivers a technical solution for intelligent risk prevention and control across the full life cycle of major projects. It advances the shift of engineering safety management from passive response to proactive early warning, and provides theoretical and practical support for remote sensing-enabled infrastructure safety monitoring.
Keywords:
major infrastructure projects
; space–air–ground remote sensing observations
; remote sensing images
; SAR
; UAV remote sensing
; multimodal data fusion
; situational awareness
; risk identification
1. Introduction
Major infrastructure projects, including water conservancy hubs, transportation corridors and energy stations, serve as the core foundation for national economic and social operation. Such projects generally feature long construction cycles, wide spatial coverage and numerous participating stakeholders, together with complex geological environments for both engineering structures and surrounding areas [1,2,3]. During construction and operation phases, multiple factors including technical defects, human-induced construction disturbances, geological hazards and extreme weather are mutually coupled. These interactions generate abundant dynamically evolving safety risks and raise persistent challenges for safety management [4,5,6]. Current safety monitoring systems for major projects mainly rely on ground sensors and manual inspections. Fixed-point sensors only collect stress and vibration data at deployed locations and thus have limited spatial coverage. For hazardous zones such as high-risk slopes and remote reservoir areas, manual inspection involves high operational risks and restricted sampling frequency. It is difficult to capture large-scale regional geological hazards in a timely manner [6,7].
Advances in Earth observation remote sensing compensate for the spatial coverage limitations of conventional ground-based monitoring. Space-borne SAR satellites, using Interferometric Synthetic Aperture Radar (InSAR) interferometry, can retrieve regional time-series surface deformation fields at millimeter to centimeter levels, enabling long-term deformation monitoring of large-scale slopes and dams. Optical satellite images can periodically invert land cover changes. Airborne UAV remote sensing captures centimeter-resolution imagery of local construction sites and identifies slope cracks, deformation of temporary facilities, and precursors of soil pile instability [8,9,10]. Nevertheless, remote sensing observations only reflect surface features and cannot directly measure internal structural stress or vibration states. Clouds, fog and vegetation lead to information loss in optical imagery. SAR measurements suffer from temporal decorrelation. Simple remote sensing interpretation may misclassify natural geomorphic variations as engineering risks and trigger false alarms. Accordingly, deep fusion of remote sensing data with ground sensors, audio-visual streams and engineering operational texts is required. Such integration combines macroscopic wide-area observation and microscopic point monitoring and reduces the probability of false and missed detections [9,10].
Multimodal data fusion technology correlates, aligns, and jointly represents observation data with distinct sources and physical dimensions. It serves as a critical research branch for intelligent perception under complex scenarios [11,12,13]. Within the research field of safety risks for major projects, existing multimodal perception studies mostly fuse sensor time-series data, surveillance videos, and engineering texts and achieve acceptable recognition performance. Nevertheless, three prominent limitations remain. First, most existing works treat remote sensing images merely as visual background materials. These studies only superimpose interpreted remote sensing results at the decision level rather than conducting feature-level deep fusion between remote sensing spatial features, ground time-series signals, and textual semantics. Consequently, the wide-area monitoring potential of remote sensing cannot be fully exploited. Second, data from different modalities differ greatly in physical meaning, dimensional units and spatial scales. Current approaches lack effective cross-modal semantic and spatiotemporal alignment tools. Straightforward feature concatenation tends to discard critical risk information. Third, most researches only produce risk identification results. A complete loop covering risk deduction, prevention strategy generation, and iterative feedback of control effectiveness is absent. Algorithm outputs can hardly support practical engineering safety decision-making directly [14,15,16].
To address the above research gaps, this study investigates multimodal safety risk situational awareness and prevention strategies for major projects integrated with space–air–ground remote sensing observations.
The main contributions of this study are summarized as follows:
(1) A space–air–ground integrated multimodal heterogeneous data fusion framework centered on multi-source remote sensing images is constructed. SAR satellite, optical satellite and UAV remote sensing are treated as independent core modalities. Cross-modal spatiotemporal alignment is implemented between remote sensing spatial-deformation features and ground monitoring time-series signals, audio-visual data, and engineering archives. This framework resolves the separation between macroscopic wide-area observation information and microscopic point monitoring information for major projects.
(2) A remote sensing enhanced two-branch feature extraction module oriented toward engineering geological risks is designed. One branch performs semantic segmentation for slope cracks and surface anomalies from UAV imagery. The other branch extracts InSAR time-series deformation features. Joint characterization of geological hazards within remote sensing images is realized to improve model robustness against wide-area environmental risks.
(3) A full-chain closed-loop prevention system consisting of “data input – feature fusion – risk perception – deduction assessment – prevention decision-making – effect feedback optimization” is established. Newly acquired remote sensing monitoring results are adopted as feedback inputs for control effectiveness. Automatic conversion from risk perception outputs to implementable engineering prevention strategies can be achieved.
The organization structure of this paper is outlined as follows. Section 2 reviews related work. Section 3 describes the overall framework of multimodal-data-driven safety risk situational awareness for major projects. Section 4 establishes the multi-dimensional safety risk feature system for major projects. Section 5 presents the multimodal safety risk assessment model and its training scheme. Section 6 illustrates the deduction model and prevention strategies for safety risk control of major projects. Section 7 reports simulation and field experiments. Section 8 concludes this work and proposes future research prospects.
2. Related Work
2.1. Research on Safety Risk Identification of Major Projects
Safety risks in major projects feature diverse sources, complex manifestations, and coupled evolution of multiple factors. Early risk assessment mainly relied on statistical models and expert scoring. With advances in artificial intelligence, machine learning and deep learning have been gradually applied to the detection of engineering safety anomalies [17,18,19,20]. Singh et al. [17] performed safety anomaly detection using ground sensors and surveillance videos collected at construction sites. Nevertheless, their work lacked wide-area observation data outside project boundaries and showed limited capacity for identifying remote geological hazards. Luo et al. [18] classified risk levels following a perception–understanding–prediction hierarchy to improve construction safety evaluation. However, their method heavily depends on field-collected data. Su et al. [19] proposed collaborative situational awareness theory based on belief entropy to improve the quantification of risk uncertainty, yet fusion modeling for multi-source heterogeneous observation modalities was not implemented in their study.
Overall, most existing risk identification studies focus on point monitoring within construction sites. Limited attention has been paid to large-scale geological and geomorphological evolution risks surrounding engineering areas. Such geological hazards serve as critical triggers for catastrophic accidents in large water conservancy and transportation projects [20].
2.2. Research Progress of Remote-Sensing Techniques in Infrastructure Safety Monitoring
As a non-contact, wide-coverage and repeatable observation method, remote sensing Earth observation technology has become a vital tool for infrastructure safety monitoring [21]. InSAR can retrieve long time-series surface deformation of slopes and dams and capture slow deformation at millimeter to centimeter scales. High-resolution optical satellite images are capable of identifying wide-ranging land cover changes. UAV aerial remote sensing acquires centimeter-level local scene data and supports visual and intelligent interpretation of cracks and deformation in temporary facilities [22,23].
Most existing engineering remote sensing monitoring adopts single-source remote sensing interpretation schemes [24,25,26,27]. The U-Net semantic segmentation network processes UAV images to detect slope cracks, and time-series InSAR is applied to SAR data to derive surface deformation fields. Nevertheless, single-source remote sensing approaches have inherent limitations. Optical remote sensing suffers from cloud-fog contamination and vegetation cover interference, while SAR observations are affected by temporal decorrelation. Ren et al. [27] investigated severe landslide hazards in mountainous regions. They employed Stacking InSAR for deformation detection and optical satellite imagery for landslide boundary mapping to identify slowly moving landslides in the study area.
Remote sensing only captures surface manifestations and cannot obtain internal structural stress and vibration information. It is difficult to distinguish surface anomalies induced by natural environmental variations from those caused by engineering disturbances, which yields a high false-alarm rate [28]. Accordingly, feature-level deep fusion between remote sensing spatial features and multi-source ground monitoring data represents an important research direction for improving the reliability of engineering risk identification [29].
2.3. Research on Multimodal Data Fusion in Engineering Fields
Multimodal data fusion is categorized into three levels: data level, feature level, and decision level. Feature-level fusion can mine implicit correlated features among different modalities and achieves the best overall performance [30,31,32]. Current multimodal fusion studies in engineering mainly focus on texts, surveillance videos, and time-series signals from vibration sensors. Attention mechanisms and graph neural networks are adopted for feature fusion to realize risk identification. However, many existing studies treat remote sensing images merely as visual base maps. They only superimpose remote sensing interpretation results at the decision level rather than implementing deep fusion between remote sensing spatial features and other modalities at the feature level. Therefore, the wide-area observation value of remote sensing has not been fully explored [33,34].
A comprehensive literature review identifies three major research gaps [35,36]. First, few feature-level multimodal fusion frameworks take remote sensing images as the core modality, which leads to separation between macroscopic remote sensing observations and microscopic on-site monitoring information. Second, cross-modal spatiotemporal alignment methods tailored for heterogeneous observation data of major projects are insufficient. Physical quantities and spatial dimensions vary greatly across modalities, making it difficult to map heterogeneous features into a unified feature space. Third, most studies only output risk identification results. A complete operational loop covering risk deduction, prevention strategy generation, and iterative effect feedback is absent.
To fill the above gaps, this paper constructs a multimodal fusion framework integrated with space–air–ground remote sensing observations, which enables the full pipeline from multi-source observation data to actionable prevention strategies.
3. Overall Framework of Multimodal-Data-Driven Safety Risk Situational Awareness for Major Projects
This study establishes five-layer architecture for safety risk situational awareness of major projects. The framework consists of the multimodal data acquisition layer, feature extraction and fusion layer, situational awareness and risk identification layer, risk assessment and early warning layer, and decision support and prevention strategy layer. The overall architecture is illustrated in Figure 1.
3.1. Multimodal Data Acquisition Layer
This layer constructs a space–air–ground integrated collaborative sensing network to realize the acquisition and preprocessing of multi-source heterogeneous data.
(1) Space-borne remote sensing data: optical multispectral satellite imagery and SAR satellite data. These datasets provide wide-area surface and time-series deformation observations covering the entire project zone and surrounding regions.
(2) Air-borne remote sensing data: high-resolution UAV aerial imagery for visible-light observations of construction sites, slopes and temporary facilities.
(3) Ground-based monitoring data: structural health monitoring sensors (vibration, stress and displacement) and environmental meteorological monitoring instruments.
(4) Audio-visual data: on-site construction surveillance videos and audio recordings of equipment operation.
(5) Text data: construction logs, safety inspection reports, accident records and emergency plan documents.
Preprocessing procedures include noise reduction for time-series signals and text cleaning. Remote sensing imagery undergoes geometric registration, radiometric correction, InSAR deformation calculation and image cropping. Remote sensing data acquired from different sensors at varied times are georeferenced to a unified coordinate system. This operation aligns geographic locations between remote sensing spatial features and ground monitoring points. Standardized multimodal datasets are generated for subsequent upper modules.
3.2. Feature Extraction and Fusion Layer
This layer implements a three-stage processing paradigm of “feature extraction – cross-modal semantics – spatiotemporal alignment – adaptive feature fusion”.
For the remote sensing modality, a two-branch feature extraction strategy is adopted. The semantic segmentation branch extracts spatial semantic features of cracks, surface anomalies and landslide hazards. The deformation time-series branch retrieves time-series surface deformation features derived from SAR-InSAR. Spatial geographic coordinates are introduced as auxiliary encoding to match geographic positions between remote sensing features and ground monitoring points.
Appropriate networks are deployed to extract features from other modalities. Bidirectional Encoder Representations from Transformers (BERT) obtains textual semantic features. Three-Dimensional Convolutional Neural Network (3D-CNN) and DeepSpeech extract visual and acoustic features from audio-visual data. Long Short-Term Memory (LSTM) captures time-series evolution features of sensor signals. After single-modal feature extraction, cross-modal alignment is performed to map features of different dimensions into a unified feature space. A multi-head attention mechanism is utilized for adaptive multimodal feature fusion, yielding global unified representation vectors. This layer addresses the heterogeneity and fragmentation of multi-source data and supplies high-quality feature inputs for risk identification.
3.3. Situational Awareness and Risk Identification Layer
This layer adopts a progressive analysis paradigm of “perception – diagnosis – prediction”. It conducts anomaly detection, risk identification and situational deduction based on global fused features. The framework integrates wide-area geological risk features derived from remote sensing while considering local risks associated with equipment and construction behaviors. It identifies on-site violations and partial structural anomalies, as well as regional hazards such as slopes and landslides outside the project boundary. The outputs include risk categories and the probability of risk occurrence.
3.4. Risk Assessment and Early Warning Layer
A closed-loop early warning mechanism of “quantitative assessment – dynamic grading – intelligent generation – multi-channel release” is established. Quantified scoring is performed for identified risks. Dynamic risk grading is realized by combining the occurrence probability of risks and the severity of risk consequences. Standardized warning messages are generated and available for multi-channel release, which provides quantitative evidence for upper-level decision-making.
3.5. Decision Support and Prevention Strategy Layer
A closed-loop decision chain of “cognition – deduction – decision-making – optimization” is constructed. On the basis of risk assessment results, virtual-real deduction is carried out with the support of an engineering knowledge base to generate a set of prevention strategies adapted to current working conditions. Multi-source observation data after prevention implementation, including newly acquired remote sensing monitoring images, are collected to feed back the suppression effect of slope and surface deformation. Prevention strategies are iteratively optimized. This mechanism promotes the transformation of engineering safety management from static management to dynamic active control.
4. Multidimensional Safety Risk Feature Systems for Major Projects
Safety risks of major projects exhibit multi-source heterogeneity and spatiotemporal dynamic evolution. Single-modal data cannot fully describe the complete risk profile. This study establishes a risk feature system covering six dimensions: construction safety, structural safety, environmental safety, personnel behavior safety, management and operation safety, and engineering quality safety. Among these dimensions, environmental safety and partial structural safety rely heavily on remote sensing images for feature extraction.
4.1. Construction Safety Risk Features
Data sources: design reports and inspection records (text); crack photographs, UAV remote sensing images, and SAR-InSAR deformation data; time-series signals of structural vibration.
Text features: TF-IDF and TextRank are adopted to extract keywords. The Latent Dirichlet Allocation (LDA) topic model is used to mine risk topics.
Remote sensing modal features: U-Net performs semantic segmentation of cracks on UAV remote sensing images and outputs features of crack location, length and spatial distribution. Deformation rate features of dams and slopes are extracted from SAR-InSAR time-series results.
Time-series signals: LSTM is applied to explore vibration time series and extract structural health indicators.
TF-IDF: TI(t, d)=T(t, d)×I(t)
4.2. Structural Safety Risk Features
Data sources: design reports and inspection records (text); crack photographs, UAV remote sensing images, and SAR-InSAR deformation data; time-series signals of structural vibration.
Remote sensing modal features: U-Net conducts semantic segmentation of cracks from UAV remote sensing images and outputs features regarding crack location, length and spatial distribution. Deformation rate features of dams and slopes are extracted from SAR-InSAR time-series outputs.
Time-series signals: LSTM is employed to analyze vibration time series and extract structural health indicators.
ResNet Residual learning: y=F(x, Wi)+x
U-Net segmentation: xi, j= fi, j(xiȒ1,k,k∈Ωi, j)
4.3. Environmental Safety Risk Features
Data sources: meteorological and geological warning texts; satellite and UAV remote sensing images; audio records of wind, rainfall and abnormal geological sounds.
Remote sensing serves as the core modality in this dimension. By comparing remote sensing images acquired at different time phases, land cover changes, landslide hazards and precursors of slope collapse can be identified. This approach enables the extraction of large-scale geological risk features surrounding engineering sites.
Text: BERT is used to parse semantic information of geological and meteorological warnings.
Audio: Wav2Vec extracts acoustic anomaly features of the environment.
3D CNN: y=f(Wx+b)
4.4. Personnel Behavior Safety Risk Features
Data sources: safety training records (text), surveillance videos of construction sites, and safety warning audio.
Vision: Three-Dimensional Convolutional Neural Network (3D CNN) identifies personnel violations, and DeepSORT is adopted for human trajectory tracking.
Audio: i-vector extracts voiceprint identity features.
DeepSORT: xk=Fxk-1+wk
3D CNN: y=f(Wx+b)
4.5. Management and Operation Safety Risk Features
Data sources: management regulations, drill records in text format, and drill videos. TextRank is used to extract key management clauses. Video summarization techniques are adopted to obtain risk features from drills.
4.6. Engineering Quality Safety Risk Features
Data sources: texts of inspection reports, process demonstration videos, and time-series inspection data. Graph neural networks are applied to establish correlations between specification texts and visual inspection features.
4.7. Multimodal Global Feature Fusion
Suppose there are m modalities. Let gi(·) be the feature extraction function of the i-th modality:
where Xi denotes the input data of the i-th modality, θi is the network parameter of this modality, and hi represents the single-modal feature vector. hrs indicates the output feature from the remote sensing image branch. The global risk representation is acquired using the multi-head attention fusion module Fusion(⋅):
where θf denotes the parameters of the fusion module. The global feature h integrates multi-dimensional risk information, including remote sensing spatial information, time-series, text, and audio-visual data, and serves for subsequent risk assessment.
hi = gi(Xi, θi), i=1, 2, …, m
h = Fusion(h1, h2, …, hm; θf )
5. Multimodal Safety Risk Assessment Model and Training Method
5.1. Overall Model Architecture
The model consists of four layers: multimodal input layer, multimodal feature extraction and fusion layer, risk assessment layer, and output layer.
(1) Multimodal input layer: This layer accepts multi-source inputs including remote sensing image datasets, sensor time-series data, audio-visual data, and engineering texts, denoted as X={X1, X2, …, Xm}.
(2) Feature extraction and fusion layer: Dedicated backbone networks are adopted for each modality to extract single-modal features. The remote sensing branch adopts a dual-branch structure combining a segmentation network and a deformation time-series encoder to output joint spatial-temporal features of remote sensing. Multi-head attention is applied to achieve adaptive cross-modal fusion and output the global feature vector h.
(3) Risk assessment layer: A multi-layer perceptron (MLP) receives the globally fused features and outputs risk scores and the probability distribution of risk levels.
(4) Output layer: This layer yields comprehensive risk scores, risk levels, risk categories, and the occurrence probability of risks.
The mapping relation of the model is expressed as:
where R denotes the risk assessment results output by the model, f(⋅) represents the model evaluation function, and θ is the set of model parameters.
R=f(X, θ)
Reasoning process:
1) Single-modal feature extraction:
hi = gi(Xi, θi), i=1, 2, …, m
2) Multimodal adaptive feature fusion:
h = Fusion(h1, h2, …, hm; θf )
3) Risk assessment and prediction:
where MLP(⋅) denotes the multi-layer perceptron, which generates the final risk score. θr represents the network parameters of the assessment head.
R=MLP(h; θr)
5.2. Model Training Strategy
1) Loss function
The training objective is to minimize the error between model-predicted risk outputs and ground-truth labels. Mean squared error (MSE) is adopted as the primary loss. Cross-entropy classification loss is further introduced to constrain the identification of risk categories.
where N denotes the number of training samples, Rj is the predicted risk score of the j-th sample, and represents the ground-truth risk score of the j-th sample. Lcls refers to the cross-entropy loss for risk category classification, and λ is the balancing weight.
2) Complete Training Procedures
(1) Data preprocessing: Multimodal data are cleaned and noise reduction. Remote sensing images are processed with geographic registration and normalization. The dataset is partitioned into training, validation and test sets, where the test set retains a certain quantity of geological risk samples identified via remote sensing.
(2) All network parameters are initialized, including those of the modality-specific backbone networks, fusion module, and assessment head.
(3) Branch-wise feature extraction is implemented to yield features of each modality, including features from the remote sensing image branch.
(4) Feature fusion is performed to obtain globally fused features.
(5) Forward inference is conducted to compute the total loss Ltotal.
(6) Backpropagation is executed. The Adam optimizer is employed to update all network parameters.
(7) Model performance is evaluated on the validation set. An early stopping strategy is utilized to mitigate overfitting.
(8) The generalization performance of the model is evaluated on the test set, and multiple evaluation metrics are calculated.
6. Risk Deduction Model and Prevention Strategy for Major Engineering Safety Hazards
After obtaining the risk assessment result R at the current time, risk deduction and prediction are performed combined with historical time-series features to generate prevention strategies. New rounds of observations, including newly acquired remote sensing monitoring images, are adopted to feed back control effects and support iterative updates.
1) Risk situation deduction and prediction
Based on historical fused feature sequences, a time-series prediction model is used to forecast risks over the subsequent T time steps:
where Rfuser,t denotes the multimodal fused features at time t, k represents the length of the historical window, and h(⋅) is the time-series prediction network.
2) Optimized generation of prevention and control strategies
Let the prevention and control decision vector be a=(a1, a2, …, am), where aj denotes the implementation intensity of the j-th prevention measure. An optimization objective is established to balance risk reduction performance and implementation cost of prevention schemes:
a*=arg min(λ1∙Rt+T+λ2∙C(a))
Rt+T represents the predicted risk at the future time. C(a) is the cost function for prevention implementation, and λ1 and λ2 are weighting coefficients. The optimal prevention strategy a∗ is obtained by solving this optimization problem.
3) Dynamic Update via Prevention Effect Feedback
After the implementation of prevention measures, a new round of multi-source observations is collected, and remote sensing monitoring results are retrieved. The system judges whether slope and surface deformation are restrained, quantifies the risk reduction amount ΔR, and iteratively updates the prevention and control strategies.
where η denotes the learning rate, which represents the gradient of prevention effects with respect to the decision vector.
4) Prevention and Control Strategies for Safety Risks
(1) Real-time monitoring and early warning: The multimodal fusion perception model is adopted to exploit the wide-area monitoring advantages of remote sensing, so as to realize integrated real-time monitoring and early warning covering both local and global regions.
(2) Risk prediction and assessment: Multi-source data are fused to evaluate current and future risk levels.
(3) Intelligent decision support: Practical prevention and disposal schemes are generated with reference to the engineering knowledge base.
(4) Safety education and training: A training platform is constructed based on VR/AR technologies to improve personnel safety awareness.
7. Experimental Studies
7.1. Experimental Setup
1) Experimental Dataset
The dataset originates from field measurements collected at two major projects, namely a large bridge and a water conservancy hub.
(1) Text data: construction logs, safety inspection reports, and accident records.
(2) Remote sensing image data: high-resolution UAV aerial images, satellite optical imagery, and SAR time-series datasets. Samples contain remote sensing positive samples such as slope cracks, landslide precursors, and dam deformation. Geohazard samples mainly identified by remote sensing account for 21% of the total samples.
(3) Audio data: recordings of equipment operation and abnormal environmental sounds.
(4) Video data: surveillance videos of construction sites.
A total of 1000 multimodal samples are constructed. The whole dataset is split into training, validation, and test sets at a ratio of 7:1:2.
2) Evaluation Metrics
To comprehensively evaluate model performance, the following primary evaluation metrics are adopted in the experiments:
(1) Risk Perception Rate (RPR)
where TP denotes correctly identified risk samples, and FN denotes missed risk samples. The perception rate of subcategory risks associated with remote sensing images is calculated separately.
(2) Risk Identification Accuracy (RIA)
where FP represents false positive samples.
(3) Risk Identification Time (RIT)
It refers to the average time consumed by the model from data input to the output of risk identification results, and reflects the real-time performance of the model.
where RIT denotes the risk identification time, Ti is the time cost of the i-th risk identification, and N represents the total number of test runs.
Evaluation rule: Shorter time indicates better real-time performance of the model.
(4) Risk Level Evaluation Error (RLEE)
It quantifies the discrepancy between predicted risk levels (five levels are defined in this work) and ground-truth values, which characterizes the accuracy of level assessment.
where Lpred,i stands for the predicted risk level of the i-th event, and Ltrue,i denotes the ground-truth risk level of the i-th event.
Evaluation rule: A smaller error corresponds to more precise discrimination of risk levels by the model.
(5) Overall Performance (OP) of the safety risk evaluation model
Multiple metrics including the Risk Perception Rate, Risk Identification Accuracy, Risk Identification Time and Risk Level Evaluation Error are integrated for global assessment of model performance. Weighted scoring or composite indicators are generally adopted.
where w1, w2, w3, and w4 represent the weights of each metric, satisfying w1+w2+w3+w4=1. Tmax denotes the acceptable maximum identification time.
Evaluation rule: A score closer to 1 indicates better comprehensive performance.
These metrics collectively form a complete performance evaluation system for the intelligent safety risk identification model of major engineering projects.
Algorithm 1. Multi modal based algorithm for major engineering safety risk situational awareness.
| Algorithm 1: Multi modal based feature extraction algorithm |
| Input: Multimodal data of major engineering projects Output: Risk level, intelligent warning Initialize a multimodal feature extraction database for i=1, …, N do Obtaining multimodal data for major engineering projects for i=1, …, N do Calculate TI(t, d)=T(t, d)×I(t), , Calculate , y=F(x, Wi)+x, xi, j= fi, j(xi-1,k,kΩi, j) Calculate ,Φ=m+Tw, y=f(Wx+b) Calculate xk=Fxk-1+wk, y=f(Wx+b), Calculate hi = gi(Xi, θi) for i=1, …, N do Calculate hi = gi(Xi, θi) Calculate h=Fusion(h1, h2, …, hm; θf) Calculate R=MLP(h; θr) for i=1, …, N do Calculate Rt+1, Rt+2, …, Rt+T=h(Rfused,t, Rfused,t-1, …, Rfused,t-k) Calculate a*=argmin(λ1·Rt+T+λ2·C(a) Calculate at+1=at+η·ΓaΔR Intelligent warning generation |
7.2. Experimental Results and Ablation Analysis
(1) Risk Perception Rate: The multimodal dataset consists of text, remote sensing imagery, audio and video data. A total of 1000 simulation experiments are conducted on the given multimodal data. The analysis of risk perception rate for major engineering safety hazards is illustrated in Figure 2. The full multimodal model achieves an overall risk perception rate of 96%. The recall rate for geological hazards of the remote sensing sub-modal reaches 92.7%, while the text, video and audio modalities obtain 96.4%, 85.1% and 81.3%, respectively. The results demonstrate that the model integrated with remote sensing imagery can effectively identify wide-range geological hazards surrounding engineering sites. It compensates for the limitation that ground sensors only support point-based monitoring.
(2) Risk Identification Accuracy: Multimodal feature analysis is performed on non-risk events triggering model false alarms by tuning weights assigned to different modalities. A total of 1000 simulation experiments are carried out on the given multimodal dataset. Comparative experiments are implemented under the same modality settings including text, remote sensing imagery, audio and video data. The risk identification accuracy exceeds 94% when remote sensing imagery is incorporated, enabling accurate classification of risk types. The identification accuracy for the remote-sensing-related sample subset reaches 93.2%. Multimodal fusion effectively reduces false alarms induced by remote sensing interpretation alone. The analysis of risk identification accuracy for major engineering safety hazards is shown in Figure 3.
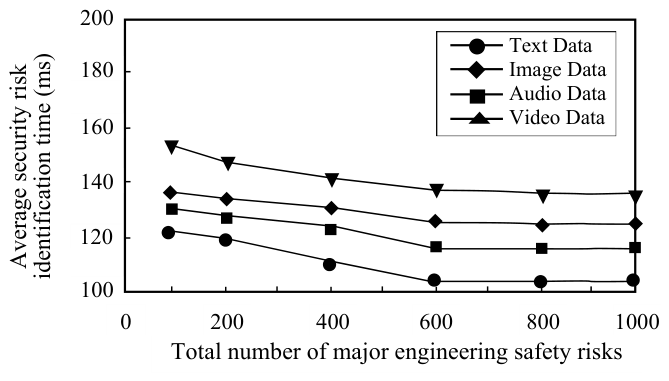
(3) Risk Identification Time: The time difference between cloud and edge devices is compared. A hierarchical processing strategy is proposed to decompose the processing time of each modal data. A total of 1000 simulation experiments are conducted on the given multimodal dataset, and the experimental results are illustrated in Figure 4. As observed from Figure 4, text data yields the shortest identification time, whereas video data consumes the longest processing duration. The overall average identification latency is 140 ms with a standard deviation of 30 ms, and the maximum delay reaches 170 ms. Compared with conventional single-modal schemes, the overall response latency is reduced by 63%, satisfying the real-time early warning requirements of engineering applications.
(4) Risk Level Evaluation Error: The frequency of high-risk levels misclassified as low-risk levels is counted (e.g., a 5% misclassification rate for “high → medium”), and compensation is implemented for multimodal data fusion. The test set contains 1000 multimodal safety risk events. The mean absolute error between ground-truth and predicted levels is 0.15 within the level range of 1–5, which supports accurate risk level assessment.
Ablation experiments: After removing the input of the remote sensing modality, the overall risk perception rate of the model drops to 90.2%. The number of missed geological hazards increases significantly. These results directly verify that remote sensing observations contribute critically to full-domain risk identification for major engineering projects, and point-based ground monitoring cannot replace the wide-area observation capacity of remote sensing.
(5) Verification with Engineering Field Cases: Real system data from a bridge project are selected for testing. The generation time of disposal schemes for high-risk events is no more than 16 s, with plan integrity of 95.3% and resource scheduling error below 4.1%. The high-risk early warning accuracy reaches 96.5%, and the false alarm rate is controlled within 2.3%. The system can complete strategy iteration and optimization within 15 s. In the field case, satellite-UAV remote sensing detected subtle deformation hazards on a slope. This anomaly was not captured by point-based ground sensors, which fully demonstrates the unique value of remote sensing for early wide-area hazard early warning.
8. Conclusions
Targeting the practical demands of safety risk management and control for major engineering projects, this study establishes a multimodal safety risk situational awareness and prevention framework that deeply integrates space-air-ground multi-source remote sensing observations. A space-air-ground integrated collaborative sensing network is constructed. Satellite SAR, optical imagery and UAV remote sensing are adopted as core modalities for feature-level fusion to extract surface deformation, slope cracks and geological hazard features contained in remote sensing images. A hierarchical multimodal deep learning risk assessment model is developed to realize risk perception and situational deduction, forming a closed-loop prevention decision chain of “cognition–deduction–decision–optimization”.
Simulation and field engineering tests demonstrate that the overall risk perception rate of the proposed model reaches 96%, and the early warning accuracy exceeds 94%. The response latency is reduced by 63% compared with conventional schemes. The recall rate of the remote sensing sub-modal for geological hazards such as slope instability is 92.7%. Ablation experiments reveal obvious performance degradation after removing remote sensing inputs, which validates the critical benefits brought by remote sensing in wide-area risk identification of major engineering projects.
Future work will focus on:
(1) Develop few-shot transfer learning tailored for remote sensing imagery to address the scarcity of remote sensing disaster samples in major engineering projects. The robustness of remote sensing feature extraction will be enhanced under interference from cloud, fog and vegetation cover.
(2) Carry out model lightweighting and adaptation for edge computing to reduce inference latency, so that the model can be deployed on edge hardware at construction sites.
(3) Integrate remote sensing observations into digital twin platforms to realize virtual-real visualization for risk deduction.
(4) Construct modelling for coupled evolution of multiple hazards to interpret the coupling mechanism among environmental, structural and human-induced risks and further improve the prediction capacity of risk evolution.
Author Contributions
Conceptualization, Y. N., and Y. S.; methodology, Y. N., and Y. S.; validation, Y. N.; formal analysis, Y. N.; investigation, Y. N.; data curation, Y. N.; writing—original draft preparation, Y. N., and Y. S.; software, Y. S., and B. S.; writing—review and editing, Y. S., and B. S.; supervision, Y. N., Y. S., B. S.; funding acquisition, Y. N., Y. S., B. S. All authors have read and agreed to the published version of the manuscript.
Funding
This work was supported in part by the National Natural Science Foundation of China under Grant 52201363 and the Natural Science Foundation of Hubei Province under Grant 2026AFC1136.
Data Availability Statement
The data presented in this study are available on request from the corresponding author. The datasets are not publicly available due to the ownership restrictions of the simulation laboratories.
Conflicts of Interest
The authors declare no conflicts of interest.
References
- Yan, H.; Zheng, Z.; Huang, H.; Zhou, X.; Tang, Y.; Hu, P. Risk Coupling Evaluation of Social Stability of Major Engineering Based on N-K Model. Buildings 2022, 12(6), 702. [Google Scholar] [CrossRef]
- Zhang, Y.; Pang, M.; Zhang, Z.; Zhou, W.; Li, L.; Cao, S. Engineering Social Stability: An Innovation-Driven Approach to Risk Management in Major Construction Projects. Sustainability 2026, 18(6), 3061. [Google Scholar] [CrossRef]
- Zhang, Y.; Pang, M.; Zhang, Z.; Zhou, W.; Li, L.; Cao, S. Engineering Social Stability: An Innovation-Driven Approach to Risk Management in Major Construction Projects. Sustainability 2026, 18(6), 3061. [Google Scholar] [CrossRef]
- Dicks, E.; Molenaar, K. Causes of Incomplete Risk Identification in Major Transportation Engineering and Construction Projects. Transp. Res. Rec. 2024, 2679(2), 619–628. [Google Scholar] [CrossRef]
- Wei, Q.; Xie, Y.; Nie, X.; Liu, H. Study on Resilience Management Mode in Major Railway Construction Based on Risk Prevention and Control. Railw. Stand. Des. 2024, 68(10), 28–37. [Google Scholar] [CrossRef]
- Xie, L.; Yu, Z.; Yang, Q.; Yu, J.; Zhang, J. Construction Safety Risk Evaluation and Countermeasures for HOPSCA Project. J. Civ. Eng. Manag. 2024, 41(06), 53–60. [Google Scholar] [CrossRef]
- Zhao, W.; Cheng, Y.; Hou, J.; Chen, Y.; Ji, B.; Ma, L. A regional early warning model of geological hazards based on big data of real-time rainfall. Nat. Hazards 2023, 116(3), 3465–3480. [Google Scholar] [CrossRef]
- Tao, F.; Shao, Y.; Pi, Y.; Liu, M.; Zhang, M.; Chen, Y. Research of dual pre-control intelligent decision system for water conservancy project safety risk. Inf. Technol. 2024, (08), 59–64. [Google Scholar] [CrossRef]
- Kou, Y.; Liu, K. Optimization path for construction safety resilience in megaprojects from the perspective of configuration. Int. J. Occup. Saf. Ergon. 2025, 31(2), 603–614. [Google Scholar] [CrossRef]
- Dicks, E.; Molenaar, K. Causes of Incomplete Risk Identification in Major Transportation Engineering and Construction Projects. Transp. Res. Rec. 2025, 2679(2), 619–628. [Google Scholar] [CrossRef]
- Wang, W.; Chen, S.; Zhang, Y.; Song, B. Multimodal data fusion for risk assessment of civil aviation hard landing events. J. Air Transp. Manag. 2026, 135, 103024. [Google Scholar] [CrossRef]
- Zhang, Y.; Fu, C.; Wang, X.; Zhang, Y.; Xiong, Z.; Pan, J.; Yin, J. AI-Driven Sensing for Cross-Lingual Risk Prediction via Semantic Alignment and Multimodal Temporal Fusion. Appl. Sci. 2026, 16(8), 3741. [Google Scholar] [CrossRef]
- Guo, W.; Gao, X.; Jin, S.; Zhao, Z.; Pan, Y.; Yao, W. Deep Adaptive Fusion of Multimodal Satellite-Street View Imagery for Fine-Grained Intersection Risk Mapping. IEEE Trans. Circuits Syst. Video Technol. 2026, 36(4), 4106–4122. [Google Scholar] [CrossRef]
- Yuan, K.; Zhu, Z.; Pang, Y.; Pang, J.; Hou, C.; Tang, Q. FireRisk-Multi: A Dynamic Multimodal Fusion Framework for High-Precision Wildfire Risk Assessment. ISPRS Int. J. Geo-Inf. 2025, 14(11), 426. [Google Scholar] [CrossRef]
- Wang, M.; Zhang, Q.; Liu, X.; Zhang, J.; Yu, F.; Zhang, X.; Zhao, R. Research progress on multimodal data fusion in forest resource monitoring. Front. Plant Sci. 2026, 16, 1710618. [Google Scholar] [CrossRef]
- Yu, Z.; Yang, S.; Ren, C.; Sun, X. Research on Reconstruction Factor Model of Old Residential Area Based on Multi-Modal Data Fusion. Teh. Vjesn.-Tech. Gaz. 2025, 32(1), 88–97. [Google Scholar] [CrossRef]
- Singh, R.; Pal, A.; Mishra, S.; Chowdhury, A. Enhancing Situational Awareness: Anomaly Detection Using Real-Time Video Across Multiple Domains. IEEE Access 2025, 13, 73680–73696. [Google Scholar] [CrossRef]
- Luo, Y.; Abbas, Ali.; Seo, J.; Ahn, S.; Cha, S. Understanding Hazard Recognition Behaviors through Situational Awareness Assessment in Virtual Construction Environments. J. Manag. Eng. 2025, 41(4), 04025017. [Google Scholar] [CrossRef]
- Su, X.; Zhong, J.; Hong, Z.; Qian, H.; Pelusi, D. A novel belief entropy and its application in cooperative situational awareness. Expert Syst. With Appl. 2025, 286, 128027. [Google Scholar] [CrossRef]
- Zhao, Z.; Zhao, B.; Du, R.; Wu, Y.; Chen, J.; Zheng, Y. DLiteNet: A Dual-Branch Lightweight Framework for Efficient and Precise Building Extraction from Visible and SAR Imagery. Remote Sens. 2025, 17, 3939. [Google Scholar] [CrossRef]
- Karadima, K.; Massi, A.; Patacchini, A.; Verde, F.; Masciulli, C.; Esposito, C.; Mazzanti, P.; Giliberti, V.; Ortolani, M. Simultaneous Hyperspectral and Radar Satellite Measurements of Soil Moisture for Hydrogeological Risk Monitoring. Remote Sens. 2026, 18(3), 393. [Google Scholar] [CrossRef]
- Park, S.; Jeong, B.; Son, W.; Lee, C.; Jeong, Y. Evaluation of engagement in online learning: insights based on human factor analysis. J. Supercomput. 2026, 82(3), 147. [Google Scholar] [CrossRef]
- Fan, H.; Zhang, X.; Xu, Y.; Fang, J.; Zhang, S.; Zhao, X.; Yu, J. Transformer-based multimodal feature enhancement networks for multimodal depression detection integrating video, audio and remote photoplethysmograph signals[J]. Inf. Fusion 2024, 104, 102161. [Google Scholar] [CrossRef]
- Liu, Y.; Bing, W.; Ren, S.; Ma, H. BC- FND: an approach based on hierarchical bilinear fusion and multimodal consistency for fake news detection. IEEE Access 2024, 12, 62738–62749. [Google Scholar] [CrossRef]
- Guo, Y.; Li, C.; Zhang, C.; Liu, F. Building a Security Situation Awareness Framework Driven by Multimodal Data. Libr. Inf. Serv. 2024, 68(24), 4–14. [Google Scholar] [CrossRef]
- Liu, X.; Ll, T.; Zhao, Y.; Chong, F.; Zha, S. Safety risk assessment of Yellow River Diversion Culvert Sluice Reconstruction Project. Express Water Resour. Hydropower Inf. 2024, 45(12), 80–88. [Google Scholar] [CrossRef]
- Ren, J.; Yang, W.; Ma, Z.; Li, W.; Zeng, S.; Fu, H.; Wen, Y.; He, J. Remote Sensing-Based Detection and Analysis of Slow-Moving Landslides in Aba Prefecture, Southwest China. Remote Sens. 2025, 17(8), 1462. [Google Scholar] [CrossRef]
- Jones, B.; Taylor, W.; Walsh, C. Sequential autoencoders for feature engineering and pretraining in major depressive disorder risk prediction. JAMIA Open 2023, 6(4), ooad086. [Google Scholar] [CrossRef]
- Luo, J.; Xie, J. Utilizing Adaptive Machine Learning Algorithms for Information Risk Warning and Network Security Scenario Awareness in Cloud Computing Environments. Jove-J. Vis. Exp. 2026, (232), e69633. [Google Scholar] [CrossRef]
- Wei, D.; Zhang, C.; Huang, S.; Fan, M.; Ji, Y.; Jiao, T.; Cheng, Q. Research on Adaptive Interaction Design for the Bright-Dark Visual System and Situation Awareness in Multi-Target Recognition Tasks in Enclosed Environments. Int. J. Hum.-Comput. Interact. 2026, 42(18), 15280–15301. [Google Scholar] [CrossRef]
- Ren, Q.; Han, W. Review of Landslide Identification Based on Multisource Data Fusion. Nat. Hazards Rev. 2026, 27(3), 03126006. [Google Scholar] [CrossRef]
- Hu, J. Product Design Method Based on Data Fusion and Transmission Based on Multimode Sensor. Mob. Inf. Syst. 2022, (S1), 5709786. [Google Scholar] [CrossRef]
- Chen, H.; Zhao, X.; Li, Z.; Fu, Q.; Wang, Q.; Zhao, L. Construction and Analysis of Driver Takeover Behavior Modes Based on Situation Awareness Theory. IEEE Trans. Intell. Veh. 2024, 9(2), 4040–4054. [Google Scholar] [CrossRef]
- Fu, L.; Li, Q. Investigation of Visual Language Landscape of Tourist Attractions from Multimodal Perspective. ACM Trans. Asian Low.-Resour. Lang. Inf. Process. 2024, 23(6), 92. [Google Scholar] [CrossRef]
- Zhi, Y.; Wang, Y.; Zhang, F.; Ma, M.; Mei, S. MSFFNet: Multimodal Spatial–Frequency Fusion Network for RGB-DSM Remote Sensing Image Segmentation. Remote Sens. 2025, 17, 3745. [Google Scholar] [CrossRef]
- Chen, R.; Zhao, L. Two-Level Integrity-Monitoring Method for Multi-Source Information Fusion Navigation. Remote Sens. 2024, 16, 120. [Google Scholar] [CrossRef]
Figure 1.
Operational Framework for Safety Risk Situation Awareness of Major Infrastructure Projects.
Figure 1.
Operational Framework for Safety Risk Situation Awareness of Major Infrastructure Projects.
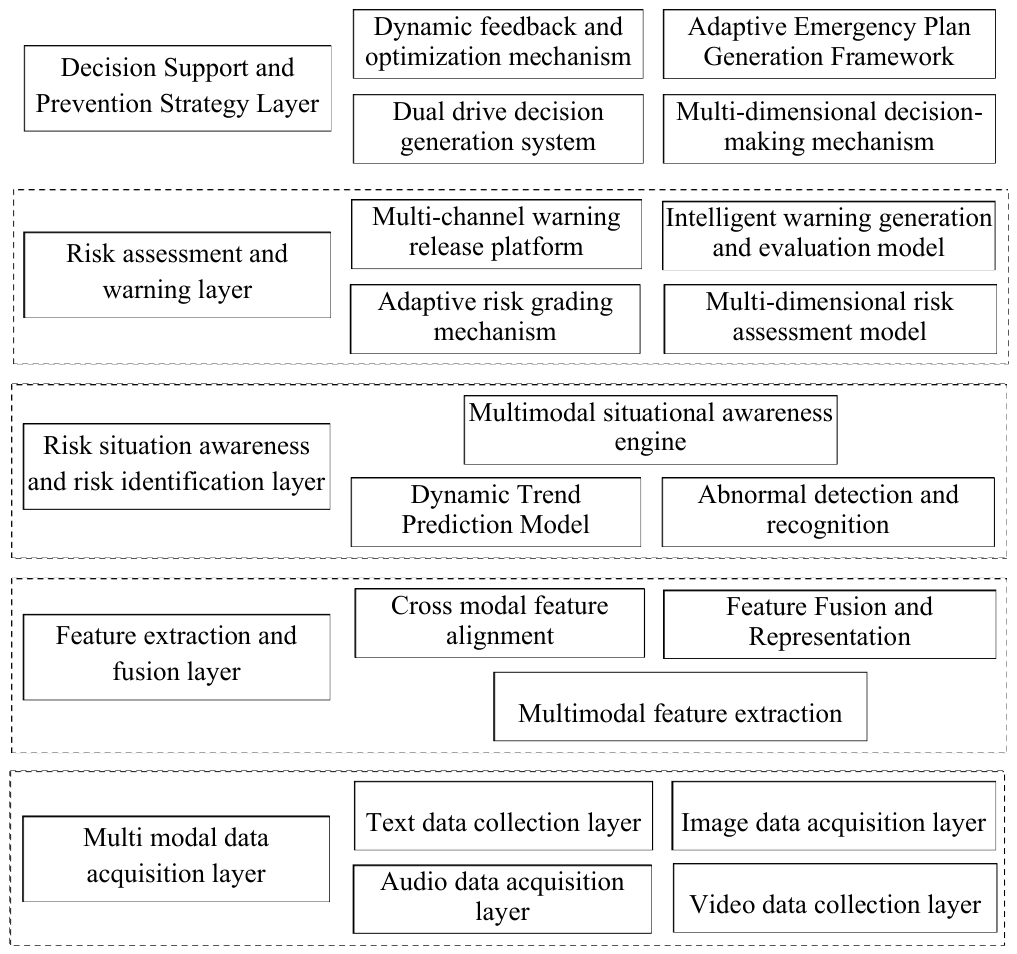
Figure 2.
Analysis of Perceived Safety Risks in Major Engineering Projects.
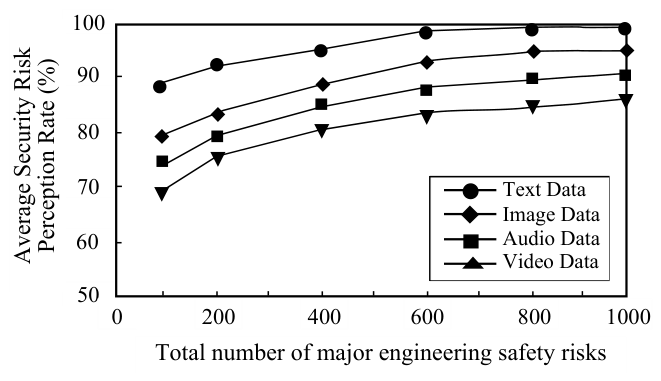
Figure 3.
Accuracy analysis of major engineering safety risks.
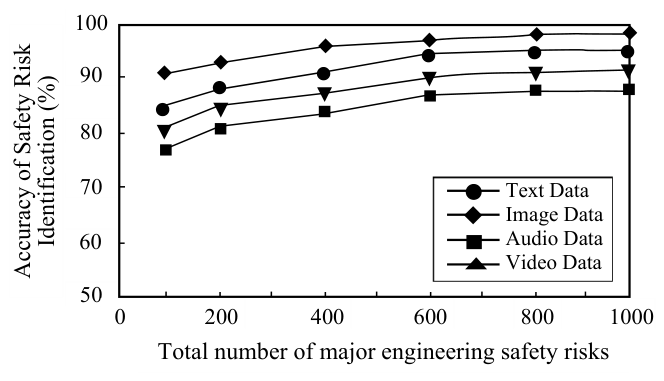
Figure 4.
Time analysis of major engineering safety risk identification.
Disclaimer/Publisher’s Note: The statements, opinions and data contained in all publications are solely those of the individual author(s) and contributor(s) and not of MDPI and/or the editor(s). MDPI and/or the editor(s) disclaim responsibility for any injury to people or property resulting from any ideas, methods, instructions or products referred to in the content. |
© 2026 by the authors. Licensee MDPI, Basel, Switzerland. This article is an open access article distributed under the terms and conditions of the Creative Commons Attribution (CC BY) license.
Copyright: This open access article is published under a Creative Commons CC BY 4.0 license, which permit the free download, distribution, and reuse, provided that the author and preprint are cited in any reuse.