

Submitted:
23 September 2026
Posted:
28 September 2026
You are already at the latest version
Abstract
Background/Objectives: Anaplastic thyroid cancer (ATC) is a rare and highly aggressive thyroid malignancy with limited treatment options. Loss of the sodium/iodide symporter makes ATC resistant to radioactive iodine therapy, highlighting the need for alternative therapeutic targets. This study evaluated L-type amino acid transporter 1 (LAT-1) and vitamin D receptor (VDR) as potential targets in ATC. Methods: We examined LAT-1 (SLC7A5) and VDR gene expression using TCGA data from the UALCAN database. Protein expression was evaluated by immunohistochemistry in 28 formalin-fixed, paraffin-embedded ATC specimens from Loma Linda University Health. We assessed staining intensity and distribution and compared expression between male and female patients. Results: TCGA analysis showed significantly higher SLC7A5 expression in thyroid tumors compared with normal thyroid tissue (*p = 0.0115), while VDR was strongly increased in tumors (**p < 0.001) and across all tumor stages. All 28 ATC specimens expressed both LAT-1 and VDR, although staining intensity and distribution varied among tumors. LAT-1 was primarily localized to the membrane and cytoplasm of tumor cells, with additional expression in stromal and endothelial cells. VDR showed membranous, cytoplasmic, and occasional nuclear expression. LAT-1 expression did not differ significantly by sex (ns, not significant, p = 0.19), whereas VDR expression was significantly higher in females than males (**p = 0.0014). Conclusions: LAT-1 and VDR are broadly expressed in ATC despite substantial intratumoral heterogeneity. Their consistent expression supports further investigation as potential targets for radioligand or other ligand-directed therapies. The higher VDR expression observed in female patients also suggests a potentially important sex-associated difference that warrants validation in larger ATC cohorts.
Keywords:
anaplastic thyroid cancer
; vitamin D receptor
; L-type amino acid transporter 1
; immunohistochemistry
; radioligand therapy
; targeted therapy
1. Introduction
Anaplastic thyroid carcinoma (ATC) is considered one of the deadliest cancers, with an average overall survival (OS) of only 3 months [1]. ATC’s undifferentiated phenotype confers resistance to radioactive iodine (RAI) therapy, an invaluable treatment for advanced, differentiated thyroid cancers (DTCs) which relies upon the presence of the sodium/iodide symporter (NIS). The NIS is a membrane protein expressed on the surface of thyroid follicular cells critical for iodine uptake and normal thyroid function, while also facilitating cancer cell susceptibility to RAI. Even though ATC lacks NIS expression or proper function, rendering RAI therapy ineffective, its mechanism can be employed as a template for similar approaches. Because RAI is a form of radioligand therapy (RLT) that targets cancer-associated surface markers, specifically the NIS in DTC [2], we aimed to uncover alternative cell-surface molecules for the development of novel, targeted ATC treatments. While other therapies exist to improve overall survival in patients with ATC, there remains a need for personalized therapeutic interventions [3,4].
We have recently found 6 different surface markers that influence the pathogenesis of ATC [5]. Two surface markers were chosen for experimental analysis – L-type amino acid transporter 1 (LAT-1) and Vitamin D Receptor (VDR). LAT-1 has been previously studied in ATC [6,7] and is known for its application in boron neutron capture therapy (BNCT) to treat other types of cancer [8]; however, its therapeutic potential for BNCT has not yet been reported in ATC. VDR has also been previously explored in ATC, however studies are limited and report varied results [9,10]. Expanding upon previous work that explored the role of VDR in PTC [11], this study seeks to investigate LAT-1 and VDR expression in ATC. Using The Cancer Genome Atlas (TCGA) data, we identified gene expressions of SLC7A5 and VDR and their correlation to thyroid cancer stage with University of Alabama at Birmingham (UALCAN) software. We analyzed LAT-1 and VDR protein expression in ATC tissue samples from the Loma Linda University Health (LLUH) cohort and assessed their correlations with patient sex, age, stage, and ethnicity, providing insight into their potential as targeted delivery sites for future therapies.
2. Materials and Methods
2.1. Study Design and Data Collection
This retrospective observational study included 28 patients with anaplastic thyroid cancer treated and followed up between January 1, 2012, and January 1, 2024 at Loma Linda University Health, Department of Pathology and Human Anatomy. The study cohort consisted of patients with histopathologically confirmed ATC, classified according to the pathologic tumor–node–metastasis (pTNM) classification. ATC staging was assigned according to the American Joint Committee on Cancer (AJCC) 8th edition criteria. In contrast to earlier editions, primary ATC tumors were classified according to the same T category definitions as those used for DTCs. For example, pT1a was assigned to tumors smaller than 1 cm that were limited to the thyroid, while pT4a was assigned when the tumor had extended beyond the thyroidal capsule to invade adjacent soft tissues and critical neighboring structures, including the trachea, esophagus, larynx, or recurrent laryngeal nerve. Regional lymph node status was recorded as pN0 (no regional lymph node metastasis), pN1 (presence of regional lymph node metastasis), or pNx when lymph nodes could not be adequately assessed. Distant metastatic status was designated as pM0 (no distant metastasis) or pM1 (presence of distant metastasis), based on pathologic confirmation and/or correlative clinical and radiologic findings. Consistent with AJCC 8th edition staging conventions, all ATC cases were categorized as Stage IV, with sub-classification into Stage IVA (pT1-T3a, pN0 or pNx, pM0), Stage IVB (pT1-T3a, N1, M0; pT3b or pT4, any pN, pM0), or Stage IVC (any pT, any pN, pM1) [12,13,14]. pTNM assignments were performed by board-certified pathologists and used for downstream correlative analyses with histopathologic features, molecular alterations, and immunohistochemical analyses.
2.2. The Cancer Genome Atlas (TCGA) Analysis Through the University of Alabama at Birmingham Cancer Data Analysis Portal (UALCAN)
For preliminary data, the UALCAN database was explored to investigate the expression profiles of LAT-1 (gene name SLC7A5) and VDR (VDR) in thyroid cancer [15,16]. While the TCGA dataset does not distinctly highlight ATC, it classifies thyroid cancer by individual stages (Stages I-IV). Since ATC is clinically considered stage IV, analyzing stage-specific TCGA data may provide valuable insight into biomarker expression levels in advanced, undifferentiated malignancies compared to well-differentiated thyroid tumors.
Two distinct graphs were generated from the UALCAN database for each surface marker – Expression in Thyroid Cancer (THCA) Based on Sample Types and Expression in THCA Based on Individual Cancer Stages. P-values indicating statistical significance were provided by the UALCAN platform.
2.3. Immunohistochemical Analysis of LAT-1 and VDR
To evaluate LAT-1 and VDR expression, chromogenic immunohistochemistry (IHC) was performed on 5-µm formalin-fixed, paraffin-embedded (FFPE) ATC tissue sections from the LLUH cohort (n = 28). Staining was carried out using the Mouse and Rabbit Specific HRP/DAB IHC Detection Kit (Abcam, ab236466) with minor protocol optimizations. Slides were baked at 56 °C for 1 hour, deparaffinized in xylene, and rehydrated through graded ethanol solutions to distilled water. Sections were washed in PBS containing 0.01% Tween-20 and subjected to heat-induced epitope retrieval in 1× citrate buffer using microwave heating (10 minutes at 20% power), followed by cooling at room temperature for 30 minutes.
Endogenous peroxidase activity was quenched using hydrogen peroxide block for 1 hour, and non-specific binding was minimized by protein blocking for 1 hour at room temperature. Sections were incubated overnight at 4 °C with primary antibodies against LAT-1 (NBP2-33662, Novus Biologicals; 1:150–1:200) or VDR (67192-1-Ig, Proteintech; 1:200). For VDR-stained sections, a mouse-specific complement reagent was applied for 30 minutes prior to secondary antibody incubation. LAT-1–stained sections bypassed this step.
HRP-conjugated secondary antibody was applied for 1 hour at room temperature, followed by PBS washes without Tween-20. Signal detection was achieved using DAB chromogen, with development monitored microscopically (20 seconds–7 minutes). Sections were counterstained with hematoxylin (25 seconds–1 minute), dehydrated through graded ethanol, cleared in xylene, and mounted using limonene-based mounting medium. Slides were air-dried for 1 hour and fully cured at room temperature for at least 24 hours before brightfield imaging.
2.4. Staining Intensity Scoring
IHC staining for LAT-1 and VDR was independently evaluated by two blinded observers using a semi-quantitative scoring system. Staining intensity was assessed in tumor cells and categorized as follows: 0 (no detectable staining), 1 (weak staining), 2 (moderate staining), and 3 (strong staining). Discrepancies between observers were resolved by joint review to reach consensus. Representative fields were selected to account for intratumoral heterogeneity.
2.5. Statistical Analysis
Statistical analysis of immunostaining data from the LLUH cohort was conducted using SAS version 9.4 (SAS Institute Inc., Cary, NC, USA) [17]. A Wilcoxon rank-sum test and a Kruskal-Wallis test were performed to evaluate whether the distributions of LAT-1 and VDR staining scores differed between male (n=11) and female (n=17) groups. The use of non-parametric analyses accounted for potential deviations from normality within independent groups. Additional analyses were carried out to identify differences between LAT-1 and VDR staining scores and patient ethnicity, age, and cancer stage (AJCC 8th edition) and can be found in the supplemental materials.
3. Results
3.1. Differential LAT-1 Gene Expression Analysis of TCGA Data Using UALCAN Software
3.1.1. LAT-1 Expression in Thyroid Cancer and Correlation to Stage
Figure 1 and Figure 2 include graphs generated by UALCAN for LAT-1 (gene name: SLC7A5). Figure 1 compares the expression of SLC7A5 mRNA (in transcripts per million) in normal thyroid tissue and primary tumor tissue. Using an unpaired two-sample t-test, SLC7A5 was shown to be overexpressed in tumor tissue versus normal thyroid (*p = 0.0115)1. When comparing individual stages of thyroid cancer and normal thyroid tissue, as presented in Figure 2, SLC7A5 expression was found to be higher in Stage IV thyroid cancer compared to normal thyroid tissue, however the difference was not significant (p = 0.0756). Significance was observed between normal and Stage 1 (**p = 0.00478) and between Stage 1 and Stage 3 (*p=0.0357).
3.1.2. Differential LAT-1 Expression in ATC Samples from LLUH Cohort
- All 28 ATC samples exhibited LAT-1 positivity via chromogenic IHC, with LAT-1 immunoreactivity predominantly localized to the cell membrane and cytoplasm of malignant cells. Mild and moderate positivity was detected in endothelial cells and fibroblasts of the tumor stroma. Photomicrographs depicting representative LAT-1 immunohistochemical staining were included for the mild (Figure 3), moderate (Figure 4), and strong (Figure 5) expression categories. By contrast, adjacent normal thyroid tissue showed no LAT-1 expression by follicular epithelial cells and only minimal LAT-1 expression by endothelial cells (Figure 6).
- To evaluate whether LAT-1 staining scores differed between male and female patients with ATC, a non-parametric Wilcoxon rank-sum test was performed (Table 1 and Figure 7). While analysis of the rank sums indicated a higher mean rank score in males (16.95) compared to females (12.91), indicating a tendency toward higher LAT-1 scores among males, the observed difference in the distribution of LAT-1 staining scores was not significantly different between these groups (Wilcoxon rank-sum test, p = 0.19). The Kruskal-Wallis test confirmed that the difference of rank distributions between sexes was not statistically significant (χ2 = 1.82, degrees of freedom (df) = 1, p = 0.18). Therefore, these results do not provide evidence of a significant association between sex and LAT-1 expression.
3.1.3. Differential VDR Gene Expression Analysis of TCGA Data Using UALCAN Software
- Figure 8 and Figure 9 include graphs generated by UALCAN for VDR (gene name: VDR). Figure 8 compares the expression of VDR mRNA (in transcripts per million) in normal thyroid tissue and primary tumor tissue. Using an unpaired two-sample t-test, VDR was shown to be highly overexpressed in primary thyroid tumor tissue compared to normal thyroid tissue (***p = 0.000000000412)2. As displayed in Figure 9, comparing normal thyroid tissue with individual thyroid cancer stages (Stages 1-4) showed significantly higher VDR expression in Stage 1 (***p = 0.000000018), Stage 2 (*p = 0.0127), Stage 3 (***p = 0.000000443), and Stage 4 (**p = 0.00000368)2 thyroid tumor tissue.
3.1.4. Differential VDR Expression in ATC Samples from LLUH Cohort
- For VDR, all 28 ATC samples showed positive staining. VDR immunoreactivity was predominantly localized to the cell membrane and cytoplasm of malignant cells along with mild and moderate positivity in endothelial cells and fibroblasts of the tumor stroma. Photomicrographs depicting representative VDR immunoreactivity were included for the mild (Figure 10), moderate (Figure 11), and strong (Figure 12) expression categories. Alternatively, adjacent normal thyroid tissue demonstrated negative-to-low expression of VDR in the follicular epithelium and mild VDR expression limited to microvessels (Figure 13).
- As with LAT-1, a non-parametric Wilcoxon rank-sum test was performed to determine whether the distribution of VDR staining scores differed between male and female patients with ATC (Figure 14). Analysis of the rank sums indicated a substantially higher mean rank score in females (17.94) and thus higher VDR staining scores compared to males (9.18). The boxplot also showed greater variation in VDR scores among females, whereas scores among males remained concentrated near the lower end of the scale with one apparent low-value observation. The Kruskal-Wallis test confirmed that the variation in the distribution of VDR scores was statistically significant (χ2 = 10.35, df = 1, p = 0.0013). These findings provide evidence of a significant association between sex and VDR expression.

Table 3.
Wilcoxon Scores (Rank Sums) for VDR Staining Score Classified by Sex in ATC Samples from LLUH Cohort.
Table 3.
Wilcoxon Scores (Rank Sums) for VDR Staining Score Classified by Sex in ATC Samples from LLUH Cohort.
| Sex | N | Sum of Scores | Expected Under H0 | Standard Deviation Under H0 | Mean Score |
|---|---|---|---|---|---|
| F | 17 | 305.0 | 246.50 | ± 18.18 | 17.94 |
| M | 11 | 101.0 | 159.50 | ± 18.18 | 9.182 |
Table 4. summarizes immunohistochemical expression of LAT-1 and VDR in 28 anaplastic thyroid cancer (ATC) samples from the LLUH cohort, representing patients with advanced-stage disease (AJCC stage IVA or IVB). LAT-1 expression was heterogeneous, with staining scores of 1, 2, and 3 observed in 10 (35.7%), 10 (35.7%), and 8 (28.6%) tumors, respectively, indicating variable LAT-1 expression across the cohort. In contrast, VDR expression was more consistently moderate to high: 17 tumors (60.7%) had a staining score of 2 and 10 (35.7%) had a score of 3, while only one tumor (3.6%) had a score of 1. Thus, 96.4% of ATC samples demonstrated moderate-to-high VDR staining. Overall, these findings demonstrate frequent expression of both LAT-1 and VDR in advanced ATC, with particularly consistent VDR expression, supporting further investigation of these proteins as potential therapeutic or theranostic targets in ATC.
Table 4.
Immunohistochemistry Results for LAT-1 and VDR Expression in ATC Samples from the LLUH cohort.
Table 4.
Immunohistochemistry Results for LAT-1 and VDR Expression in ATC Samples from the LLUH cohort.
| Sample # | Sex | Age | Ethnicity | AJCC 8th Edition Stage | LAT-1 Staining Score |
VDR Staining Score |
| 1 | F | 25 | African American | IVB | 1 | 2 |
| 2 | F | 91 | Unknown | IVB | 2 | 3 |
| 3 | M | 67 | Hispanic or Latino/a | IVB | 1 | 2 |
| 4 | M | 45 | Caucasian | IVB | 2 | 2 |
| 5 | F | 72 | Caucasian | IVA | 2 | 3 |
| 6 | F | 72 | Caucasian | IVA | 2 | 2 |
| 7 | F | 85 | Caucasian | IVB | 3 | 3 |
| 8 | F | 93 | Caucasian | IVB | 3 | 2 |
| 9 | F | 58 | Hispanic or Latino/a | IVB | 1 | 2 |
| 10 | F | 79 | Caucasian | IVB | 1 | 3 |
| 11 | M | 51 | Caucasian | IVB | 2 | 2 |
| 12 | F | 60 | Caucasian | IVB | 1 | 3 |
| 13 | F | 62 | Caucasian | IVA | 3 | 2 |
| 14 | M | 66 | Hispanic or Latino/a | IVA | 3 | 2 |
| 15 | M | 87 | Caucasian | IVB | 2 | 1 |
| 16 | F | 63 | Caucasian | IVA | 1 | 3 |
| 17 | F | 14 | Hispanic or Latino/a | IVA | 1 | 3 |
| 18 | F | 85 | Caucasian | IVB | 1 | 3 |
| 19 | F | 38 | African American | IVA | 1 | 3 |
| 20 | M | 77 | Caucasian | IVB | 2 | 2 |
| 21 | M | 72 | Hispanic or Latino/a | IVB | 2 | 2 |
| 22 | F | 62 | Caucasian | IVA | 2 | 2 |
| 23 | M | 76 | Filipino | IVB | 1 | 2 |
| 24 | M | 84 | Caucasian | IVA | 3 | 2 |
| 25 | M | 67 | Caucasian | IVA | 3 | 2 |
| 26 | M | 64 | Caucasian | IVB | 3 | 2 |
| 27 | F | 49 | Hispanic or Latino/a | IVA | 2 | 3 |
| 28 | F | 87 | Caucasian | IVB | 3 | 2 |
4. Discussion
Anaplastic thyroid carcinoma (ATC) remains one of the most lethal human malignancies, accounting for only 1–2% of thyroid cancers yet contributing disproportionately to thyroid cancer–related mortality. Its aggressiveness and lack of effective therapy continue to pose a major clinical challenge [18]. The near-universal resistance of ATC to radioactive iodine (RAI) therapy is attributed primarily to the downregulation or absence of the sodium/iodide symporter (NIS), which precludes effective uptake of iodine-131 [19]. While strategies to restore NIS expression are under investigation, they have not yet translated into effective clinical options [20,21]. These limitations highlight the urgent need to identify alternative molecular targets for radioligand therapy (RLT).
In this study, we evaluated two potential surface markers—LAT-1 (SLC7A5) and VDR—based on their previously reported expression in ATC and other solid tumors [5,11]. Immunohistochemistry revealed positivity in all 28 ATC cases for VDR and LAT-1, although both markers demonstrated intratumoral heterogeneity in staining intensity and distribution. LAT-1 localization was predominantly membranous and associated with both tumor cells and neovasculature, supporting its established role in amino acid metabolism and angiogenesis [6,7]. In contrast, VDR exhibited more variable expressions, with membranous, cytoplasmic, and nuclear localization, consistent with its pleiotropic functions in cell growth and differentiation [22].
The marked variability in staining patterns within individual tumors is consistent with the histologic heterogeneity of ATC, which comprises spindle, pleomorphic, epithelioid, squamous, rhabdoid, and osteoclast-like cell variants [23,24]. This morphological diversity may underline the heterogeneous biomarker expression observed and warrants future studies correlating cytologic features with LAT-1 and VDR levels. Furthermore, weak LAT-1 and VDR positivity in adjacent non-neoplastic thyroid tissue raises concerns regarding specificity. Nonetheless, differential receptor density, ligand affinity, or isoform expression between malignant and benign tissues may still permit therapeutic selectivity, provided these distinctions are characterized in detail.
Several limitations should be acknowledged. First, technical variability in IHC, including differences in antibody titration and limited tissue availability, may have contributed to inconsistent staining. Standardized antibody dilutions and simultaneous batch staining could improve reproducibility. Second, the modest cohort size (n=28) limits statistical power and generalizability. Larger, multi-institutional studies are therefore needed to validate LAT-1 and VDR expression and their potential as RLT targets in ATC.
Despite these limitations, our findings align with emerging evidence supporting LAT-1 and VDR as promising therapeutic candidates. LAT-1 is consistently overexpressed in ATC, with transcript levels several-fold higher than in normal thyroid, and its expression has been linked to tumor progression and poor prognosis [6,7]. Similarly, VDR has been implicated in thyroid cancer biology and remains detectable across ATC samples, suggesting that vitamin D–based modulation or ligand-conjugated strategies may offer therapeutic benefit [22]. Importantly, ligand-bound approaches targeting LAT-1 and VDR could complement existing strategies that focus on genetic alterations, such as BRAF V600E inhibition with dabrafenib plus trametinib, which is currently the only FDA-approved targeted regimen for ATC [25,26].
Future studies should extend beyond IHC validation. Molecular quantification using Western blotting and qPCR will clarify expression levels, while functional assays involving gene knockdown or overexpression in ATC cell lines could elucidate the biological roles of LAT-1 and VDR in tumor aggressiveness. Preclinical evaluation of novel radioligands designed to bind these proteins, both in vitro and in vivo, will be essential to determine their suitability for clinical translation. Finally, correlation of LAT-1 and VDR expression with patient outcomes, mutational status, and histologic subtype may help refine their utility as predictive biomarkers.
In conclusion, this preliminary work identifies LAT-1 and VDR as widely expressed but heterogeneous proteins in ATC, underscoring both the promise and challenges of developing targeted therapeutic and radioligand strategies. Notably, the significantly higher VDR expression observed in female compared with male patients suggests a potential sex-associated difference in VDR biology in ATC. This finding is particularly relevant because VDR signaling can influence tumor-cell differentiation, proliferation, metabolism, and interactions with the tumor microenvironment. If confirmed, sex-associated variation in VDR expression could contribute to differences in tumor biology and may have implications for patient selection, therapeutic responsiveness, and the development of VDR-directed imaging or treatment approaches. However, given the limited cohort size and unequal representation of males and females, this observation should be considered hypothesis-generating rather than evidence of a sex-specific therapeutic effect. Validation in larger, independent cohorts, together with studies examining VDR expression, localization, activity, and downstream signaling by sex, will be essential to determine its biological and clinical significance. By integrating molecular validation, mechanistic studies, and ligand development, future investigations may establish LAT-1 and VDR as actionable targets and provide new therapeutic opportunities for patients with this highly aggressive disease
5. Conclusions
Anaplastic thyroid carcinoma (ATC) remains one of the most lethal endocrine malignancies, with few effective targeted treatment options due to the loss of sodium/iodide symporter expression and resistance to radioactive iodine therapy. In this study, we demonstrate that both LAT-1 and VDR are broadly expressed across ATC specimens, although their expression exhibits substantial intratumoral heterogeneity. TCGA analyses further support increased expression of LAT-1 (SLC7A5) and VDR in thyroid tumors compared with normal thyroid tissue, while immunohistochemical analysis confirmed protein expression in all ATC samples. The consistent presence of these surface proteins highlights their potential as therapeutic targets. Although no significant association was observed between LAT-1 and sex, VDR expression showed highly significant sex-based differences, with females exhibiting a pronounced increase in VDR immunoreactivity.
Collectively, these findings provide a strong biological rationale for investigating LAT-1 and VDR as candidate receptors for next-generation radioligand and other ligand-directed therapies in ATC. Given the aggressive nature of ATC and the limited efficacy of current treatment strategies, targeting these cell-surface proteins may offer a novel precision medicine approach that complements existing molecular therapies. Future studies should focus on validating these findings in larger, multi-institutional cohorts, defining the functional roles of LAT-1 and VDR in ATC progression, and developing receptor-specific imaging agents and therapeutic radioligands. Integration of molecular, spatial, and functional analyses will be critical for determining whether these biomarkers can be translated into clinically effective therapies for patients with this devastating disease.
Supplementary Materials
The following supporting information can be downloaded at the website of this paper posted on Preprints.org.
Author Contributions
Conceptualization, S.K., A.A.S.; methodology, J.P., J.C., H.S., S.R., K.E.; software, J.C.; validation, S.K., M.C.P.; formal analysis, J.P., U.S.; investigation, J.P., J.C.; resources, A.A.S., M.C.P.; data curation, H.S, S.R., K.E.; writing—original draft preparation, J.P.; writing—review and editing, S.K., J.C.; visualization, S.K., J.C.; supervision, S.K., A.A.S.; project administration, A.A.S.; funding acquisition, A.A.S. All authors have read and agreed to the published version of the manuscript.
Funding
This research received no external funding.
Institutional Review Board Statement
The study was conducted in accordance with the Declaration of Helsinki and approved by the Loma Linda University Cancer Center Biospecimen Laboratory (protocol code 5230360 and date of approval: 16 August 2023).
Informed Consent Statement
Not applicable.
Data Availability Statement
The data generated in this study are available in the article and its supplementary files. UALCAN software (https://www.cancer.gov/ccg/research/genome-sequencing/tcga, accessed on 19 November 2025).
Acknowledgments
The authors express their sincere gratitude to the Loma Linda Department of Otolaryngology for their support of this research, the Loma Linda University Center for Health Disparities and Molecular Medicine for their technical and laboratory assistance, Dr. Andrea Shields for her invaluable role in data acquisition, and Dr. Yan Chen Wongworawat for providing equipment support and assistance in locating supporting data.
Conflicts of Interest
The authors declare no conflicts of interest.
Abbreviations
The following abbreviations are used in this manuscript:
| BNCT | Boron Captures Neutron Therapy |
| ATC | Anaplastic thyroid cancer |
| PTC | Papillary Thyroid Cancer |
| PBS | Phosphate Buffer Saline |
| DTC | Differentiated thyroid cancer |
| NIS | Sodium/iodide symporter |
| RAI | Radioactive iodine (therapy) |
| VDR | Vitamin D receptor |
| LAT-1 | L-type amino acid transporter 1 |
| FFPE | Formalin-fixed paraffin-embedded (tissue) |
| IHC | Immunohistochemistry |
| RLT | Radioligand therapy |
| THCA | Thyroid cancer |
| DAB | 3,3’-diaminobenzidine |
| TCGA | The Cancer Genome Atlas |
| UALCAN | University of Alabama at Birmingham Cancer Data Analysis |
| LLUH | Loma Linda University Health (cohort) |
| pTNM | Pathologic tumor–node–metastasis (classification) |
| AJCC | American Joint Committee on Cancer (8th edition) |
| ddH2O | Double-distilled water |
| HRP | Horseradish peroxidase |
References
- Rao, S.N.; Smallridge, R.C. Anaplastic thyroid cancer: An update. Best Pract. Res. Clin. Endocrinol. Metab. 2023, 37, 101678. [Google Scholar] [CrossRef] [PubMed]
- Mittra, E.S.; Wong, R.K.S.; Winters, C.; Brown, A.; Murley, S.; Kennecke, H. Establishing a robust radioligand therapy program: A practical approach for North American centers. Cancer Med. 2024, 13, e6780. [Google Scholar] [CrossRef] [PubMed]
- Okamoto, S.; Shiga, T.; Tamaki, N. Clinical Perspectives of Theranostics. Molecules 2021, 26. [Google Scholar] [CrossRef] [PubMed]
- Rakhsh-Khorshid, H.; Samimi, H.; Torabi, S.; Sajjadi-Jazi, S.M.; Samadi, H.; Ghafouri, F.; Asgari, Y.; Haghpanah, V. Network analysis reveals essential proteins that regulate sodium-iodide symporter expression in anaplastic thyroid carcinoma. Sci. Rep. 2020, 10, 21440. [Google Scholar] [CrossRef] [PubMed]
- Pakkianathan, J.; Chan, S.; Cruz, J.; Ewan, K.; Simental, A.A.; Khan, S. Targeting Surface Markers in Anaplastic Thyroid Cancer: Future Directions in Ligand-bound Therapy. J. Endocr. Soc. 2025, 9, bvaf035. [Google Scholar] [CrossRef] [PubMed]
- Enomoto, K.; Sato, F.; Tamagawa, S.; Gunduz, M.; Onoda, N.; Uchino, S.; Muragaki, Y.; Hotomi, M. A novel therapeutic approach for anaplastic thyroid cancer through inhibition of LAT1. Sci. Rep. 2019, 9, 14616. [Google Scholar] [CrossRef] [PubMed]
- Häfliger, P.; Graff, J.; Rubin, M.; Stooss, A.; Dettmer, M.S.; Altmann, K.H.; Gertsch, J.; Charles, R.P. The LAT1 inhibitor JPH203 reduces growth of thyroid carcinoma in a fully immunocompetent mouse model. J. Exp. Clin. Cancer Res. 2018, 37, 234. [Google Scholar] [CrossRef] [PubMed]
- Watanabe, T.; Sanada, Y.; Hattori, Y.; Suzuki, M. Correlation between the expression of LAT1 in cancer cells and the potential efficacy of boron neutron capture therapy. J. Radiat. Res. 2023, 64, 91–98. [Google Scholar] [CrossRef] [PubMed]
- Ling, Y.; Xu, F.; Xia, X.; Dai, D.; Sun, R.; Xie, Z. Vitamin D receptor regulates proliferation and differentiation of thyroid carcinoma via the E-cadherin-β-catenin complex. J. Mol. Endocrinol. 2022, 68, 137–151. [Google Scholar] [CrossRef] [PubMed]
- Clinckspoor, I.; Hauben, E.; Verlinden, L.; Van den Bruel, A.; Vanwalleghem, L.; Vander Poorten, V.; Delaere, P.; Mathieu, C.; Verstuyf, A.; Decallonne, B. Altered expression of key players in vitamin D metabolism and signaling in malignant and benign thyroid tumors. J. Histochem Cytochem 2012, 60, 502–511. [Google Scholar] [CrossRef] [PubMed]
- Mull, B.; Davis, R.; Munir, I.; Perez, M.C.; Simental, A.A.; Khan, S. Differential expression of Vitamin D binding protein in thyroid cancer health disparities. Oncotarget 2021, 12, 596–607. [Google Scholar] [CrossRef] [PubMed]
- Tuttle, R.M.; Haugen, B.; Perrier, N.D. Updated American Joint Committee on Cancer/Tumor-Node-Metastasis Staging System for Differentiated and Anaplastic Thyroid Cancer (Eighth Edition): What Changed and Why? Thyroid 2017, 27, 751–756. [Google Scholar] [CrossRef] [PubMed]
- Perrier, N.D.; Brierley, J.D.; Tuttle, R.M. Differentiated and anaplastic thyroid carcinoma: Major changes in the American Joint Committee on Cancer eighth edition cancer staging manual. CA Cancer J. Clin. 2018, 68, 55–63. [Google Scholar] [CrossRef] [PubMed]
- Onoda, N.; Sugitani, I.; Ito, K.I.; Suzuki, A.; Higashiyama, T.; Fukumori, T.; Suganuma, N.; Masudo, K.; Nakayama, H.; Uno, A.; et al. Evaluation of the 8th Edition TNM Classification for Anaplastic Thyroid Carcinoma. Cancers 2020, 12. [Google Scholar] [CrossRef] [PubMed]
- Chandrashekar, D.S.; Bashel, B.; Balasubramanya, S.A.H.; Creighton, C.J.; Ponce-Rodriguez, I.; Chakravarthi, B.; Varambally, S. UALCAN: A Portal for Facilitating Tumor Subgroup Gene Expression and Survival Analyses. Neoplasia 2017, 19, 649–658. [Google Scholar] [CrossRef] [PubMed]
- Chandrashekar, D.S.; Karthikeyan, S.K.; Korla, P.K.; Patel, H.; Shovon, A.R.; Athar, M.; Netto, G.J.; Qin, Z.S.; Kumar, S.; Manne, U.; et al. UALCAN: An update to the integrated cancer data analysis platform. Neoplasia 2022, 25, 18–27. [Google Scholar] [CrossRef] [PubMed]
- SAS Institute Inc. SAS Software, Version 9.4; SAS Institute Inc.: Cary, NC, USA, 2013. [Google Scholar]
- Molinaro, E.; Romei, C.; Biagini, A.; Sabini, E.; Agate, L.; Mazzeo, S.; Materazzi, G.; Sellari-Franceschini, S.; Ribechini, A.; Torregrossa, L.; et al. Anaplastic thyroid carcinoma: from clinicopathology to genetics and advanced therapies. Nat. Rev. Endocrinol. 2017, 13, 644–660. [Google Scholar] [CrossRef] [PubMed]
- Tiedje, V.; Stuschke, M.; Weber, F.; Dralle, H.; Moss, L.; Führer, D. Anaplastic thyroid carcinoma: review of treatment protocols. Endocr. Relat. Cancer 2018, 25, R153–r161. [Google Scholar] [CrossRef] [PubMed]
- Schmohl, K.A.; Dolp, P.; Schug, C.; Knoop, K.; Klutz, K.; Schwenk, N.; Bartenstein, P.; Nelson, P.J.; Ogris, M.; Wagner, E.; et al. Reintroducing the Sodium-Iodide Symporter to Anaplastic Thyroid Carcinoma. Thyroid 2017, 27, 1534–1543. [Google Scholar] [CrossRef] [PubMed]
- Tesselaar, M.H.; Crezee, T.; Schuurmans, I.; Gerrits, D.; Nagarajah, J.; Boerman, O.C.; van Engen-van Grunsven, I.; Smit, J.W.A.; Netea-Maier, R.T.; Plantinga, T.S. Digitalislike Compounds Restore hNIS Expression and Iodide Uptake Capacity in Anaplastic Thyroid Cancer. J. Nucl. Med. 2018, 59, 780–786. [Google Scholar] [CrossRef] [PubMed]
- Zhang, X.; Gao, Q.; Zhu, W.; Mao, L.; Sun, L. Vitamin D receptor in tumors: A review of biological mechanisms, therapeutic potentials, and prognostic values. Crit. Rev. Oncol. Hematol. 2026, 223, 105357. [Google Scholar] [CrossRef] [PubMed]
- Xu, B.; Fuchs, T.; Dogan, S.; Landa, I.; Katabi, N.; Fagin, J.A.; Tuttle, R.M.; Sherman, E.; Gill, A.J.; Ghossein, R. Dissecting Anaplastic Thyroid Carcinoma: A Comprehensive Clinical, Histologic, Immunophenotypic, and Molecular Study of 360 Cases. Thyroid 2020, 30, 1505–1517. [Google Scholar] [CrossRef] [PubMed]
- Suster, D.I.; Daum, O.; Michal, M.; Mackinnon, A.C.; Nose, V.; Michal, M.; Suster, S. Anaplastic thyroid carcinoma: Clinicopathologic and immunohistochemical study of 144 cases with special emphasis on the spectrum of histologic features. Virchows Arch. 2026, 488, 1111–1124. [Google Scholar] [CrossRef] [PubMed]
- Subbiah, V.; Kreitman, R.J.; Wainberg, Z.A.; Cho, J.Y.; Schellens, J.H.M.; Soria, J.C.; Wen, P.Y.; Zielinski, C.; Cabanillas, M.E.; Urbanowitz, G.; et al. Dabrafenib and Trametinib Treatment in Patients With Locally Advanced or Metastatic BRAF V600-Mutant Anaplastic Thyroid Cancer. J. Clin. Oncol. 2018, 36, 7–13. [Google Scholar] [CrossRef] [PubMed]
- Subbiah, V.; Kreitman, R.J.; Wainberg, Z.A.; Cho, J.Y.; Schellens, J.H.M.; Soria, J.C.; Wen, P.Y.; Zielinski, C.C.; Cabanillas, M.E.; Boran, A.; et al. Dabrafenib plus trametinib in patients with BRAF V600E-mutant anaplastic thyroid cancer: updated analysis from the phase II ROAR basket study. Ann. Oncol. 2022, 33, 406–415. [Google Scholar] [CrossRef] [PubMed]
| 1 | |
| 2 |
Figure 1.
TCGA Data from the UALCAN Database for LAT-1 (SLC7A5) Expression in Thyroid Cancer (THCA). The boxplot shows SLC7A5 transcription levels –measured in transcripts per million– in normal thyroid tissue (n=59) compared to primary thyroid tumor tissue (n=505). Whiskers denote the range of expression data and bold center lines indicate median values. A statistically significant difference was assessed using an unpaired two-sample t-test (*p = 0.0115).
Figure 1.
TCGA Data from the UALCAN Database for LAT-1 (SLC7A5) Expression in Thyroid Cancer (THCA). The boxplot shows SLC7A5 transcription levels –measured in transcripts per million– in normal thyroid tissue (n=59) compared to primary thyroid tumor tissue (n=505). Whiskers denote the range of expression data and bold center lines indicate median values. A statistically significant difference was assessed using an unpaired two-sample t-test (*p = 0.0115).
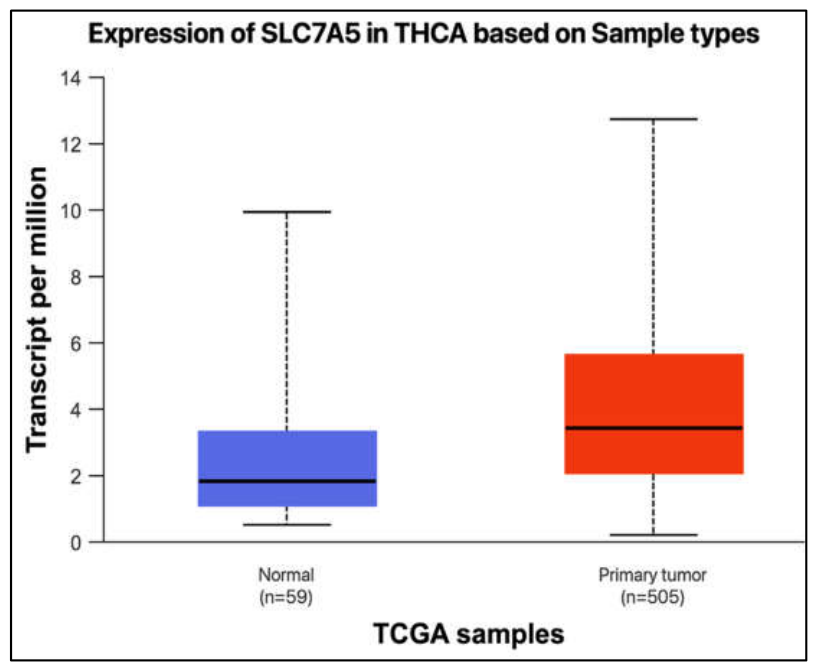
Figure 2.
TCGA Data from the UALCAN Database for LAT-1 (SLC7A5) Expression Stratified by Individual Stages of Thyroid Cancer (THCA). The boxplot shows SLC7A5 transcripts per million across Normal (n=59), Stage 1 (n=284), Stage 2 (n=52), Stage 3 (n=112), and Stage 4 (n=55) tissue. Whiskers denote the range of expression data and bold center lines indicate median values. Normal tissue versus Stage I and Stage I versus Stage III tissue showed statistically significant differences when evaluated by an unpaired two-sample t-test (**p = 0.00478 and *p = 0.0357, respectively). Provided by UALCAN software analysis.
Figure 2.
TCGA Data from the UALCAN Database for LAT-1 (SLC7A5) Expression Stratified by Individual Stages of Thyroid Cancer (THCA). The boxplot shows SLC7A5 transcripts per million across Normal (n=59), Stage 1 (n=284), Stage 2 (n=52), Stage 3 (n=112), and Stage 4 (n=55) tissue. Whiskers denote the range of expression data and bold center lines indicate median values. Normal tissue versus Stage I and Stage I versus Stage III tissue showed statistically significant differences when evaluated by an unpaired two-sample t-test (**p = 0.00478 and *p = 0.0357, respectively). Provided by UALCAN software analysis.
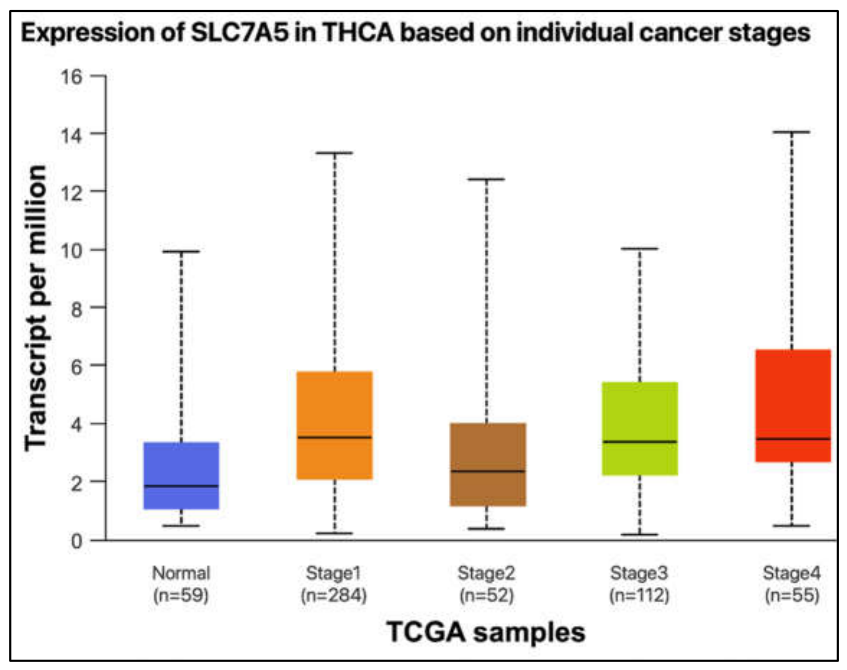
Figure 3.
Representative Immunohistochemistry Results for Mild LAT-1 Expression in ATC Samples (a-d). Mild LAT-1 expression was observed in endothelial cells of the tumor microenvironment (a, c and d) and the cytoplasm of malignant cells (b). All images were taken at 20X magnification using a brightfield microscope. Scale bar: 500 µm. .
Figure 3.
Representative Immunohistochemistry Results for Mild LAT-1 Expression in ATC Samples (a-d). Mild LAT-1 expression was observed in endothelial cells of the tumor microenvironment (a, c and d) and the cytoplasm of malignant cells (b). All images were taken at 20X magnification using a brightfield microscope. Scale bar: 500 µm. .
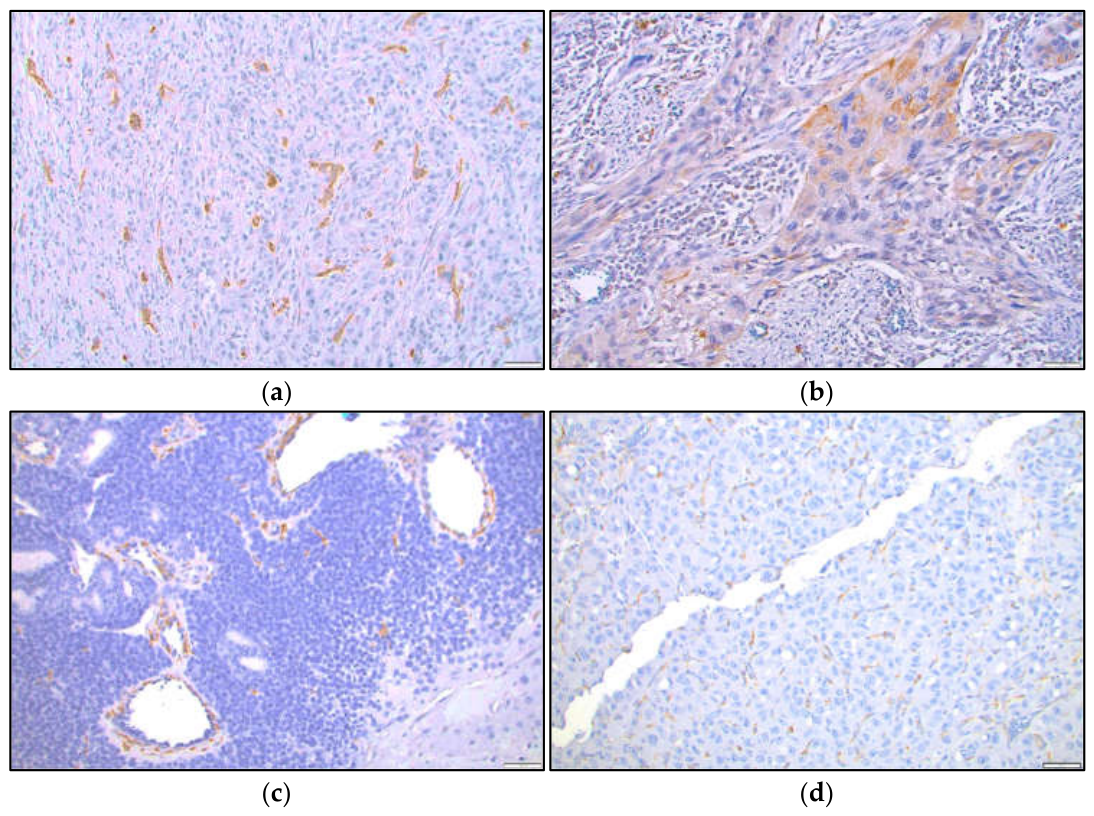
Figure 4.
Representative Immunohistochemistry Results for Moderate LAT-1 Expression in ATC Samples (a-d). Moderate LAT-1 surface staining was observed in tumor cells (a) and the tumor microenvironment, primarily fibroblasts and the tumor vasculature (b-d). All images were taken at 20X magnification using a brightfield microscope. Scale bar: 500 µm.
Figure 4.
Representative Immunohistochemistry Results for Moderate LAT-1 Expression in ATC Samples (a-d). Moderate LAT-1 surface staining was observed in tumor cells (a) and the tumor microenvironment, primarily fibroblasts and the tumor vasculature (b-d). All images were taken at 20X magnification using a brightfield microscope. Scale bar: 500 µm.
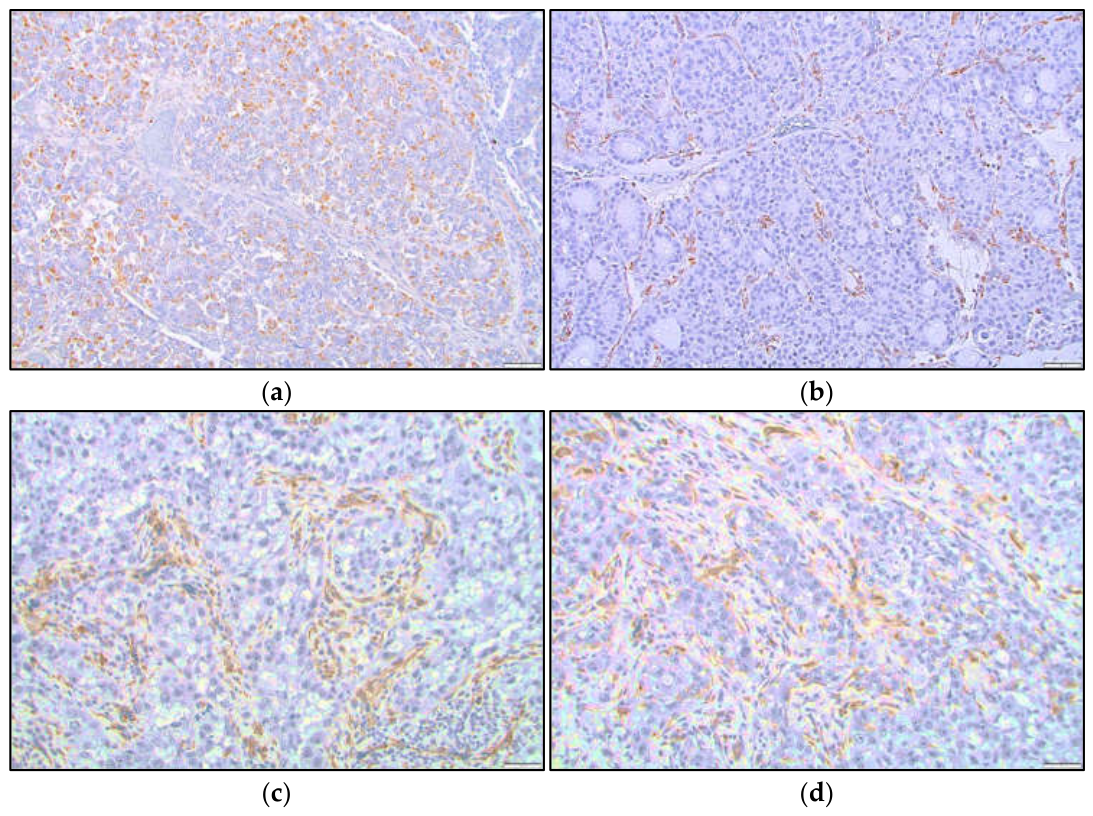
Figure 5.
Representative Immunohistochemistry Results for Strong LAT-1 Expression in ATC Samples (a-d). Strong LAT-1 staining was identified in endothelial cells of the tumor microenvironment (a) but was primarily localized to the cell surface and cytoplasm of malignant ATC cells (b-d). All images were taken at 20X magnification using a brightfield microscope. Scale bar: 500 µm. .
Figure 5.
Representative Immunohistochemistry Results for Strong LAT-1 Expression in ATC Samples (a-d). Strong LAT-1 staining was identified in endothelial cells of the tumor microenvironment (a) but was primarily localized to the cell surface and cytoplasm of malignant ATC cells (b-d). All images were taken at 20X magnification using a brightfield microscope. Scale bar: 500 µm. .
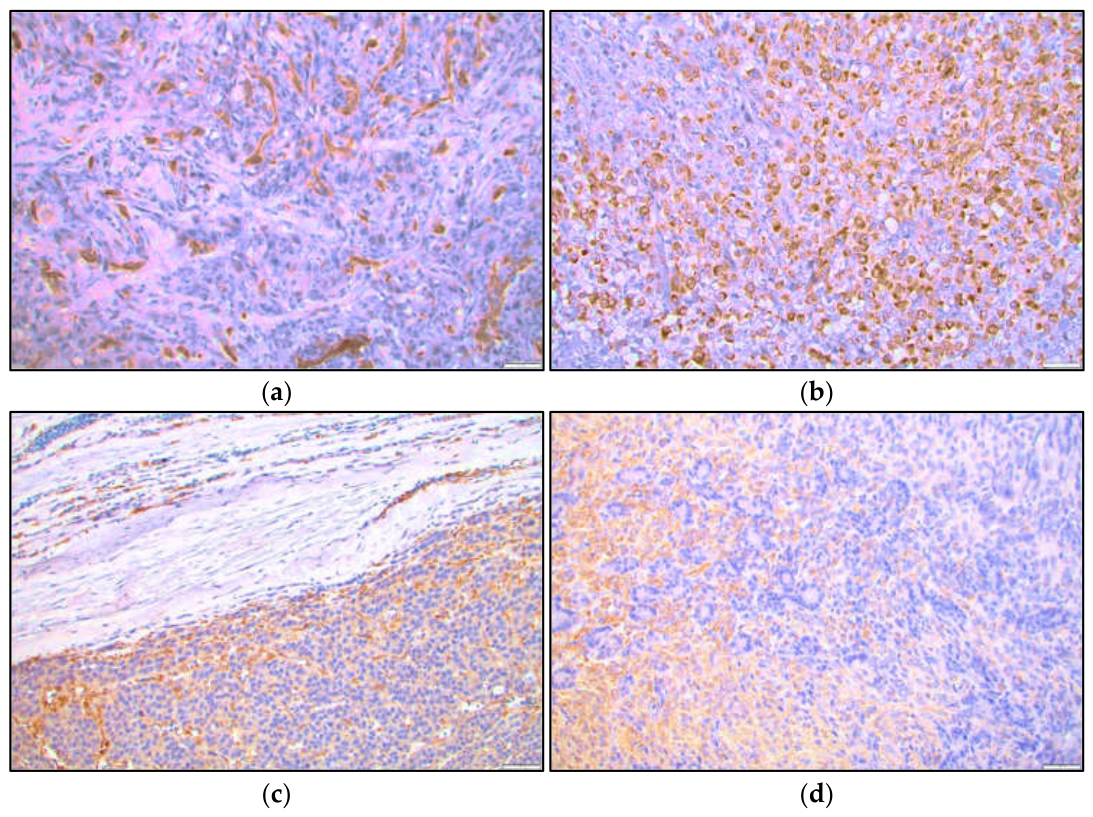
Figure 6.
Representative Immunohistochemistry Results for LAT-1 in Adjacent Normal Thyroid Regions of ATC Samples (a-b). Overall, thyroid follicular epithelia and large vessels were negative for LAT-1 with only minimal expression occurring in small interstitial vessels. All images were taken at 20X magnification using a brightfield microscope. Scale bar: 500 µm. .
Figure 6.
Representative Immunohistochemistry Results for LAT-1 in Adjacent Normal Thyroid Regions of ATC Samples (a-b). Overall, thyroid follicular epithelia and large vessels were negative for LAT-1 with only minimal expression occurring in small interstitial vessels. All images were taken at 20X magnification using a brightfield microscope. Scale bar: 500 µm. .
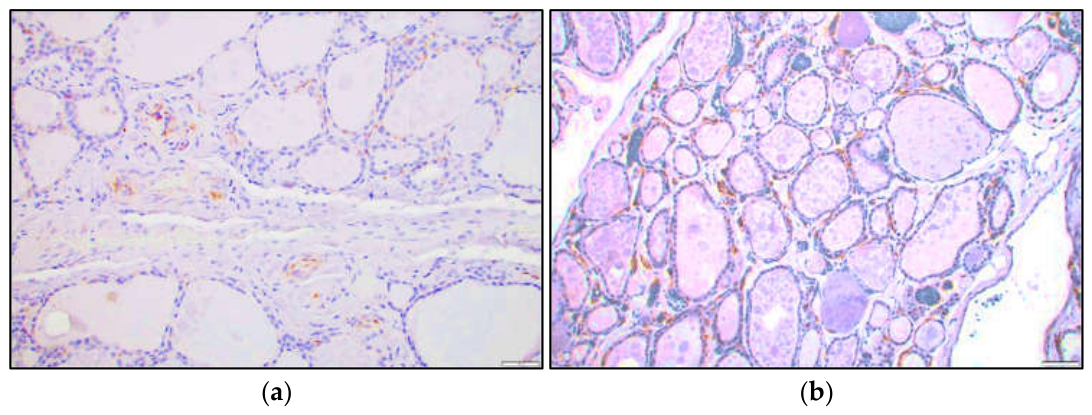
Figure 7.
Distribution of LAT-1 Staining Scores Between Females (F) and Males (M) from the LLUH Cohort. LAT-1 staining scores did not differ significantly between ATC tumors from female (n=17) and male (n=11) participants (Wilcoxon rank-sum test, two-sided p = 0.19). The mean rank score was higher among males (16.9) than females (12.91), although the difference was not statistically significant. Note: Boxplots display medians, interquartile ranges, and ranges; diamonds indicate group means. *p < 0.05, **p < 0.01, ***p < 0.001. Table 1 details the sum of scores, expected scores under the null hypothesis (H0) and standard deviation under H0, and the mean rank for each sex.
Figure 7.
Distribution of LAT-1 Staining Scores Between Females (F) and Males (M) from the LLUH Cohort. LAT-1 staining scores did not differ significantly between ATC tumors from female (n=17) and male (n=11) participants (Wilcoxon rank-sum test, two-sided p = 0.19). The mean rank score was higher among males (16.9) than females (12.91), although the difference was not statistically significant. Note: Boxplots display medians, interquartile ranges, and ranges; diamonds indicate group means. *p < 0.05, **p < 0.01, ***p < 0.001. Table 1 details the sum of scores, expected scores under the null hypothesis (H0) and standard deviation under H0, and the mean rank for each sex.
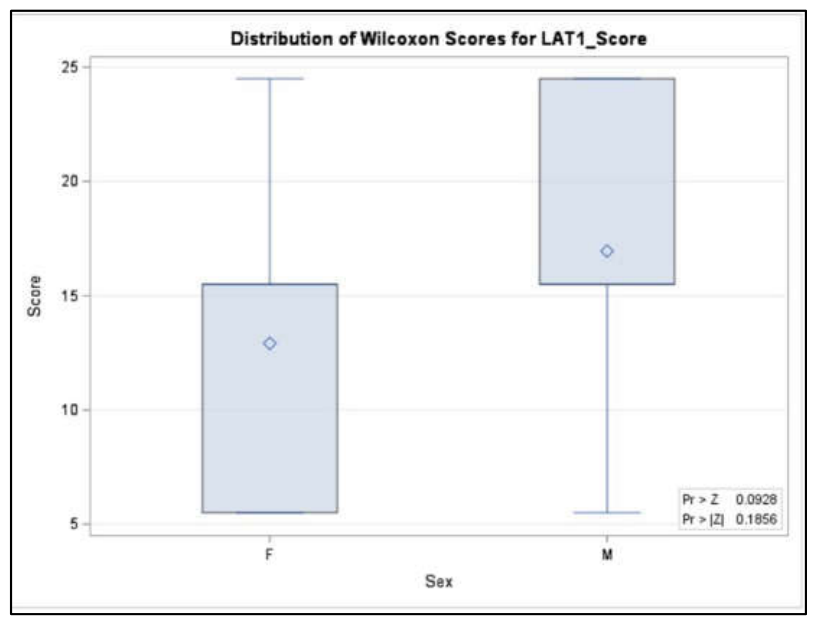
Figure 8.
TCGA Data from the UALCAN Database for VDR Expression in Thyroid Cancer (THCA). The boxplot shows VDR transcripts per million in normal thyroid tissue (n=59) compared to primary thyroid tumor tissue (n=505). Whiskers denote the range of expression data and bold center lines indicate median values. A highly statistically significant difference was assessed using an unpaired two-sample t-test (***p = 0.000000000412).
Figure 8.
TCGA Data from the UALCAN Database for VDR Expression in Thyroid Cancer (THCA). The boxplot shows VDR transcripts per million in normal thyroid tissue (n=59) compared to primary thyroid tumor tissue (n=505). Whiskers denote the range of expression data and bold center lines indicate median values. A highly statistically significant difference was assessed using an unpaired two-sample t-test (***p = 0.000000000412).
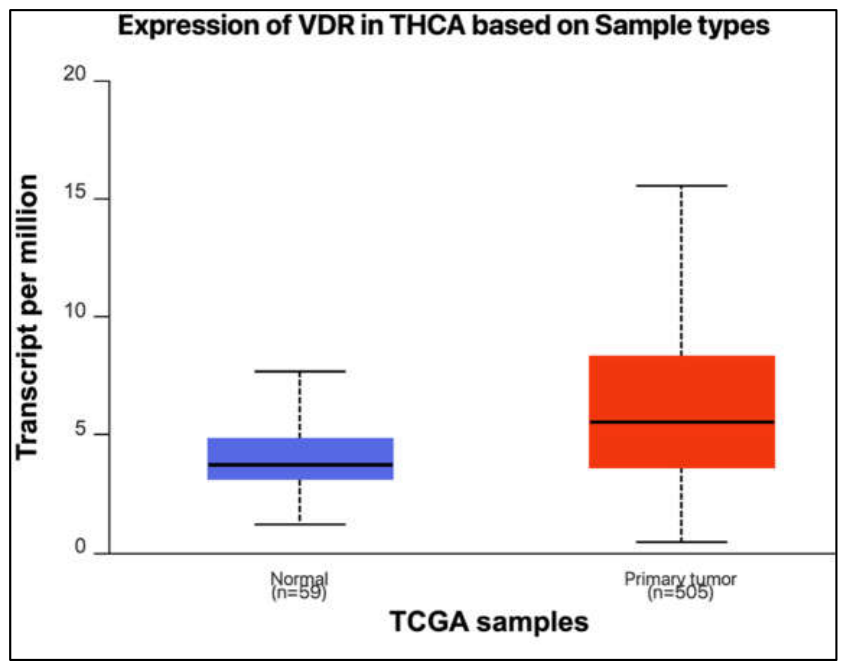
Figure 9.
TCGA Data from the UALCAN Database for VDR Expression Stratified by Individual Stages of Thyroid Cancer. The boxplot shows VDR transcripts per million across Normal (n=59), Stage 1 (n=284), Stage 2 (n=52), Stage 3 (n=112), and Stage 4 (n=55) tissue. Whiskers denote the range of expression data and bold center lines indicate median values. When evaluated by an unpaired two-sample t-test, highly statistically significant differences were shown between normal tissue and all individual cancer stages: Stage 1 (***p = 0.000000018), Stage 2 (*p = 0.0127), Stage 3 (***p = 0.000000443), and Stage 4 (**p = 0.00000368). Provided by UALCAN software analysis.
Figure 9.
TCGA Data from the UALCAN Database for VDR Expression Stratified by Individual Stages of Thyroid Cancer. The boxplot shows VDR transcripts per million across Normal (n=59), Stage 1 (n=284), Stage 2 (n=52), Stage 3 (n=112), and Stage 4 (n=55) tissue. Whiskers denote the range of expression data and bold center lines indicate median values. When evaluated by an unpaired two-sample t-test, highly statistically significant differences were shown between normal tissue and all individual cancer stages: Stage 1 (***p = 0.000000018), Stage 2 (*p = 0.0127), Stage 3 (***p = 0.000000443), and Stage 4 (**p = 0.00000368). Provided by UALCAN software analysis.
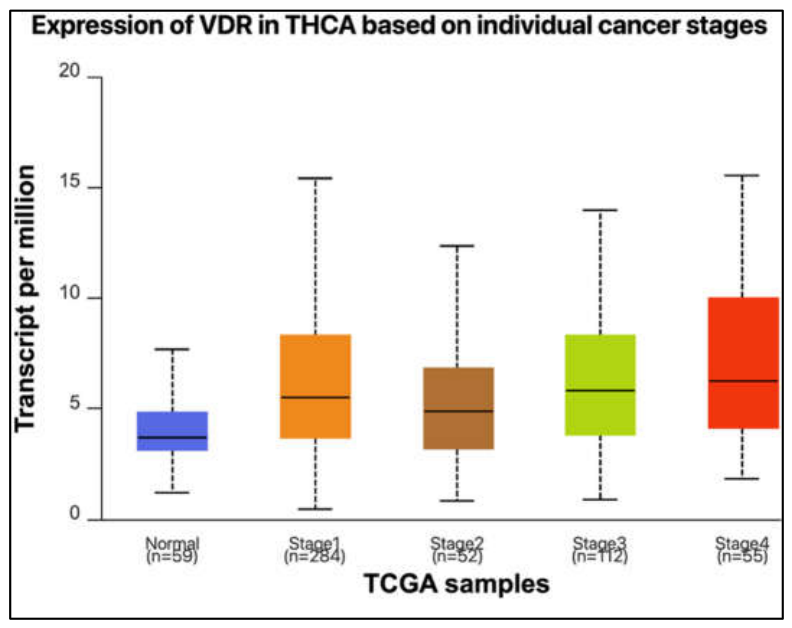
Figure 10.
Representative Immunohistochemistry Results for Mild VDR Expression (a-d). Mild VDR staining was observed in tumor microenvironment endothelial cells (a, d) and the cell surface and cytoplasm of malignant ATC cells (a-c). All images were taken at 20X magnification using a brightfield microscope. Scale bar: 500 µm. .
Figure 10.
Representative Immunohistochemistry Results for Mild VDR Expression (a-d). Mild VDR staining was observed in tumor microenvironment endothelial cells (a, d) and the cell surface and cytoplasm of malignant ATC cells (a-c). All images were taken at 20X magnification using a brightfield microscope. Scale bar: 500 µm. .
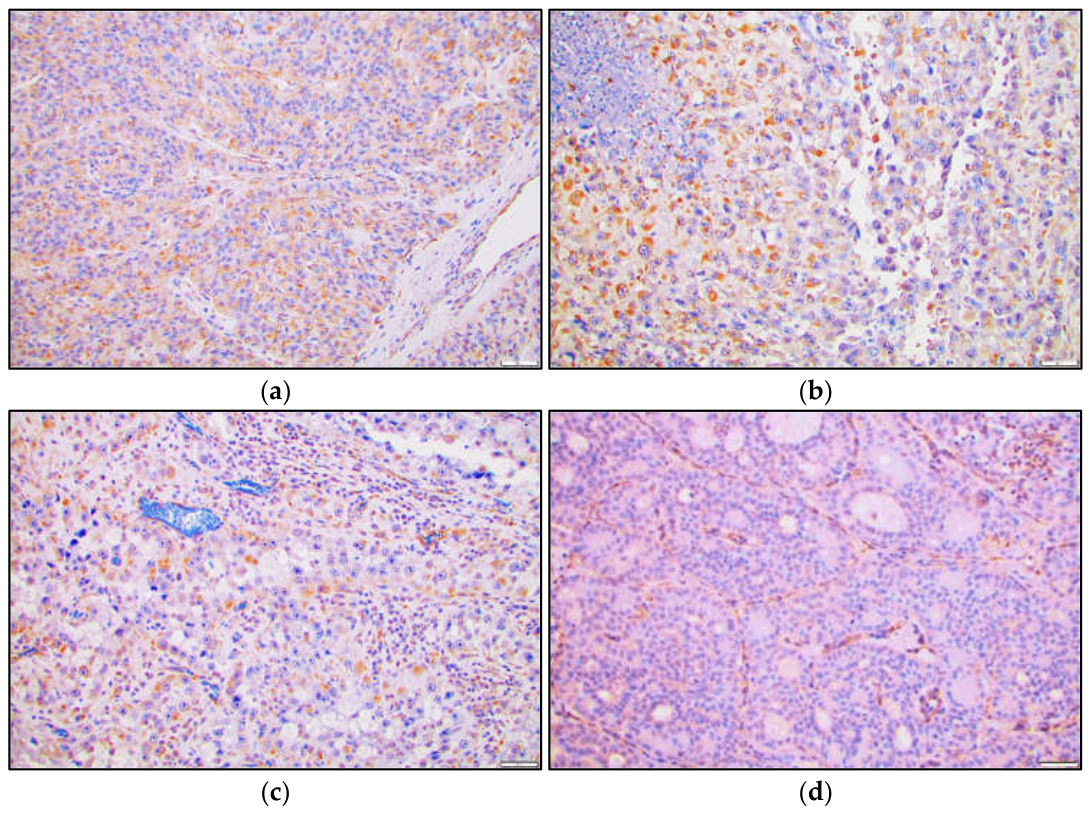
Figure 11.
Representative Immunohistochemistry Results for Moderate VDR Expression (a-d). Moderate VDR staining was localized to the cell surface and cytoplasm of malignant ATC cells. Perivascular staining within the tumor microenvironment was also present (a-d). All images were taken at 20X magnification using a brightfield microscope. Scale bar: 500 µm.
Figure 11.
Representative Immunohistochemistry Results for Moderate VDR Expression (a-d). Moderate VDR staining was localized to the cell surface and cytoplasm of malignant ATC cells. Perivascular staining within the tumor microenvironment was also present (a-d). All images were taken at 20X magnification using a brightfield microscope. Scale bar: 500 µm.
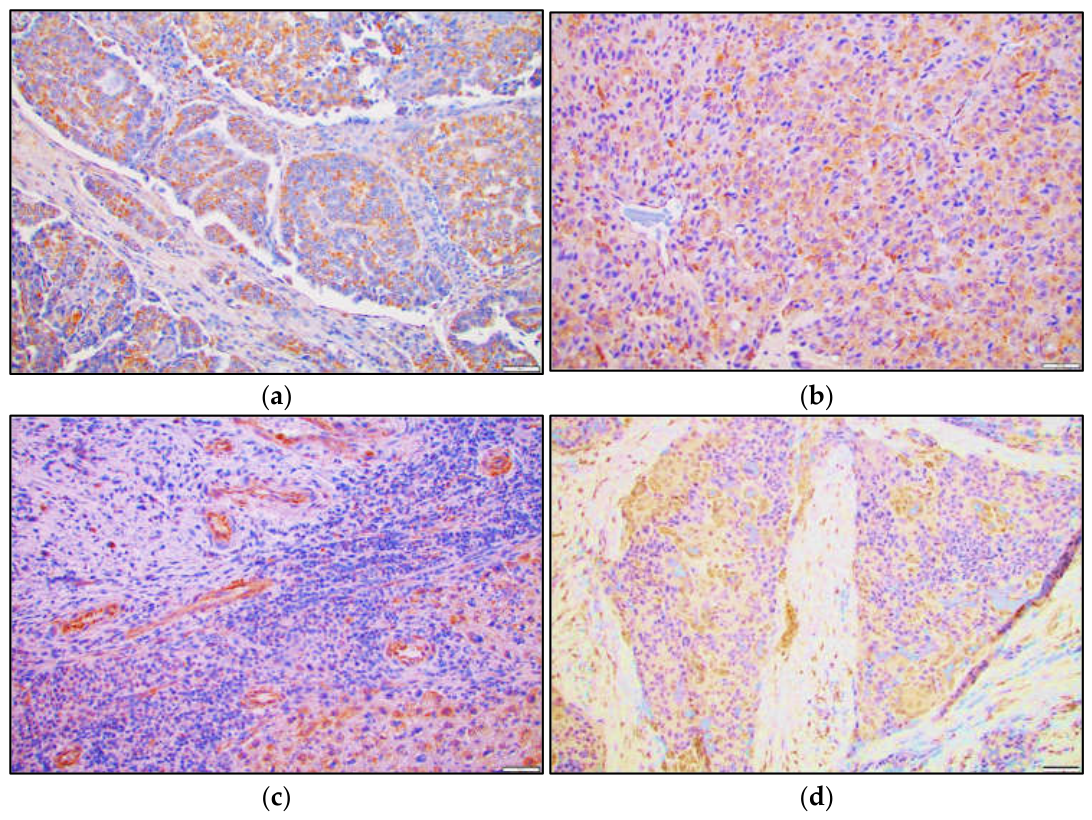
Figure 12.
Representative Immunohistochemistry Results for Strong VDR Expression (a-d). Strong VDR positivity was observed in tumor microenvironment endothelial cells (b, d) and the cell surface and cytoplasm of malignant ATC cells (a-d). Nuclear VDR staining can also be seen (b-d). All images were taken at 20X magnification using a brightfield microscope. Scale bar: 500 µm. .
Figure 12.
Representative Immunohistochemistry Results for Strong VDR Expression (a-d). Strong VDR positivity was observed in tumor microenvironment endothelial cells (b, d) and the cell surface and cytoplasm of malignant ATC cells (a-d). Nuclear VDR staining can also be seen (b-d). All images were taken at 20X magnification using a brightfield microscope. Scale bar: 500 µm. .
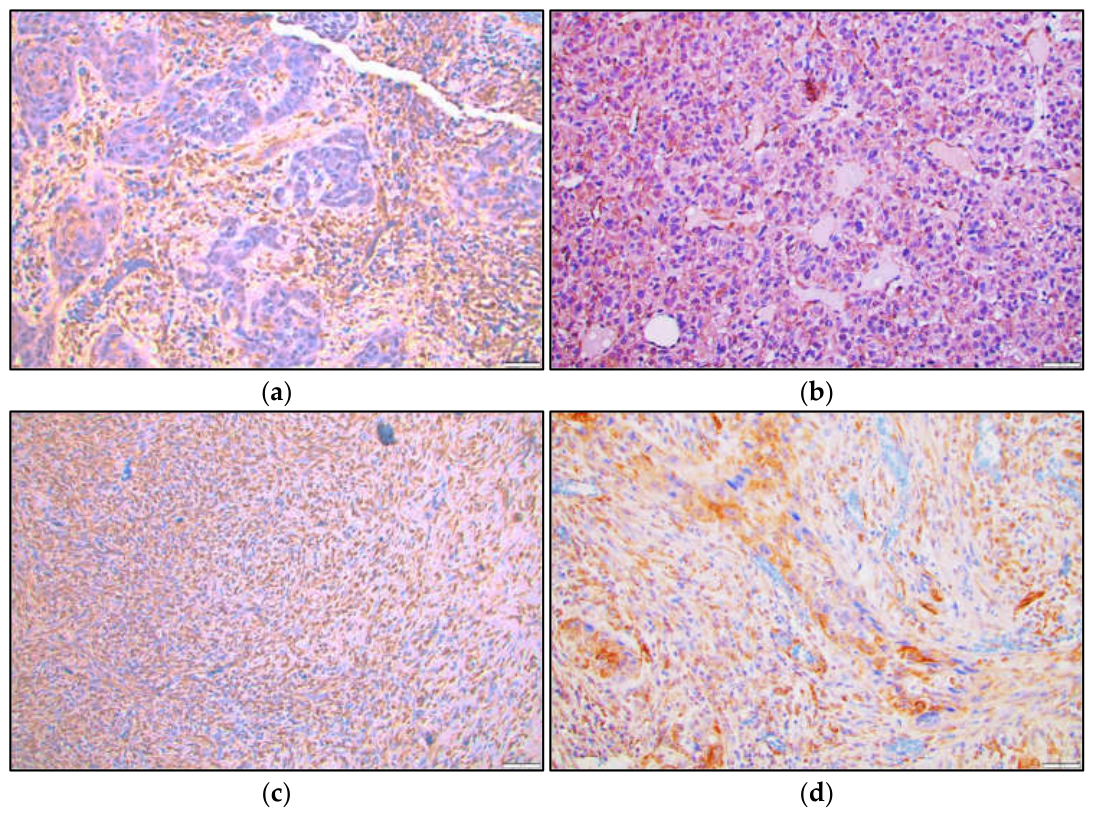
Figure 13.
Representative Immunohistochemistry Results for VDR in Adjacent Normal Thyroid Regions of ATC Samples (c-d). Thyroid follicular epithelia and small interstitial vessels showed minimal VDR expression. All images were taken at 20X magnification using a brightfield microscope. Scale bar: 500 µm. .
Figure 13.
Representative Immunohistochemistry Results for VDR in Adjacent Normal Thyroid Regions of ATC Samples (c-d). Thyroid follicular epithelia and small interstitial vessels showed minimal VDR expression. All images were taken at 20X magnification using a brightfield microscope. Scale bar: 500 µm. .
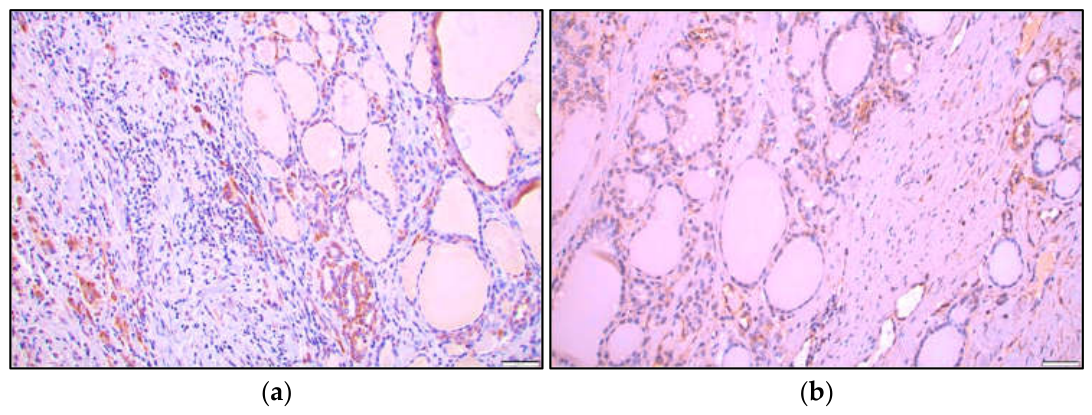
Figure 14.
Distribution of VDR Staining Scores Between Females (F, n=17) and Males (M, n=11) from the LLUH Cohort. VDR staining scores differed significantly between ATC tumors based on sex (Wilcoxon rank-sum test, two-sided **p = 0.0014), with higher mean rank scores observed among females (17.94) compared with males (9.18). Note: Boxplots display medians, interquartile ranges, and ranges; diamonds signify group means and circles signify potential outlying observations. *p < 0.05, **p < 0.01, ***p < 0.001. Table 3 details the sum of scores, expected scores under the null hypothesis (H0), and standard deviation under H0, and the mean rank for each sex.
Figure 14.
Distribution of VDR Staining Scores Between Females (F, n=17) and Males (M, n=11) from the LLUH Cohort. VDR staining scores differed significantly between ATC tumors based on sex (Wilcoxon rank-sum test, two-sided **p = 0.0014), with higher mean rank scores observed among females (17.94) compared with males (9.18). Note: Boxplots display medians, interquartile ranges, and ranges; diamonds signify group means and circles signify potential outlying observations. *p < 0.05, **p < 0.01, ***p < 0.001. Table 3 details the sum of scores, expected scores under the null hypothesis (H0), and standard deviation under H0, and the mean rank for each sex.
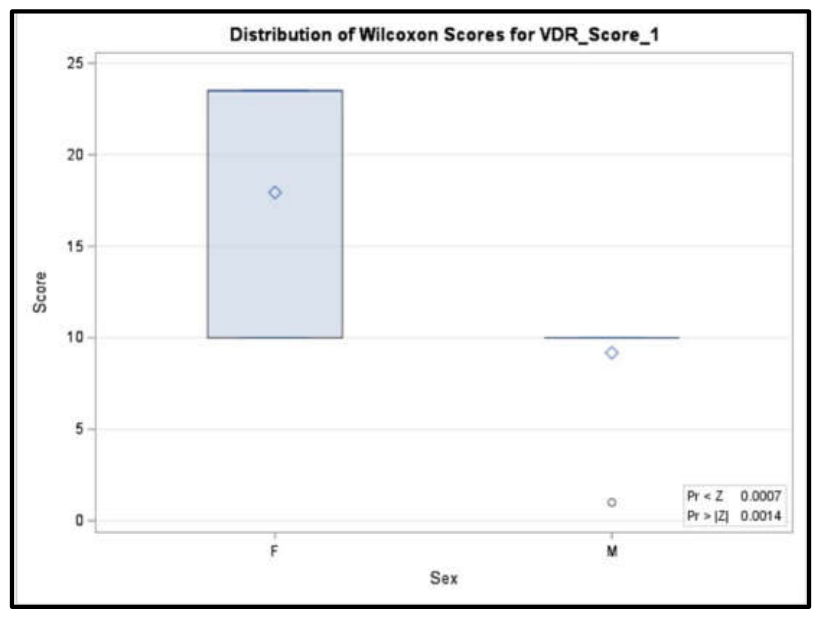
Table 1.
Wilcoxon Scores (Rank Sums) for LAT-1 Staining Score Classified by Sex in ATC Samples from LLUH Cohort.
Table 1.
Wilcoxon Scores (Rank Sums) for LAT-1 Staining Score Classified by Sex in ATC Samples from LLUH Cohort.
| Sex | N | Sum of Scores | Expected Under H0 | Standard Deviation Under H0 | Mean Score |
|---|---|---|---|---|---|
| F | 17 | 219.50 | 246.50 | ± 20.02 | 12.91 |
| M | 11 | 186.50 | 159.50 | ± 20.02 | 16.95 |
Disclaimer/Publisher’s Note: The statements, opinions and data contained in all publications are solely those of the individual author(s) and contributor(s) and not of MDPI and/or the editor(s). MDPI and/or the editor(s) disclaim responsibility for any injury to people or property resulting from any ideas, methods, instructions or products referred to in the content. |
© 2026 by the authors. Licensee MDPI, Basel, Switzerland. This article is an open access article distributed under the terms and conditions of the Creative Commons Attribution (CC BY) license (http://creativecommons.org/licenses/by/4.0/).
Copyright: This open access article is published under a Creative Commons CC BY 4.0 license, which permit the free download, distribution, and reuse, provided that the author and preprint are cited in any reuse.