

Submitted:
24 September 2026
Posted:
24 September 2026
You are already at the latest version
Abstract
Apple pomace, a byproduct of juice processing, poses valorization challenges in circular agriculture. Solid-state fermentation can improve its nutritional quality, but the optimal inclusion level of fermented apple pomace (FAP) in ruminant diets and the underlying systemic mechanisms remain unclear. This study employed a dual-model strategy with five FAP supplementation levels (0–20%). In lactating dairy goats, we determined dietary nutrient composition, lactation performance, rumen fermentation parameters, and serum metabolic and endocrine indices. In rats, we determined hepatic Nrf2/NF-κB signaling, cecal microbiota composition, and short-chain fatty acid (SCFA) concentrations. In goats, the 15% FAP diet achieved the most favorable dietary nutrient composition and nitrogen utilization within the tested range, markedly increased milk yield and average daily gain, reduced the feed-to-milk ratio and somatic cell count, and was accompanied by elevated growth hormone and reduced insulin concentrations, consistent with improved insulin sensitivity. Pooled rumen fluid analysis suggested a descriptive trend toward increased propionate proportion; however, statistical confirmation was not possible because individual VFA proportions were obtained from pooled samples without replication. In rats, 15% FAP was associated with hepatic Nrf2 nuclear translocation and downstream antioxidant activation, suppression of TLR4/NF-κB and pro-inflammatory cytokines (TNF-α, IL-1β), while IL-6 showed a tissue-reparative pattern. These effects were accompanied by enrichment of butyrate-producing genera and elevated cecal butyrate, which was positively correlated with Nrf2 activation and antioxidant capacity and negatively correlated with oxidative damage. All beneficial effects were attenuated at the 20% inclusion level. Collectively, 15% FAP represents the optimal inclusion level within the tested range. The rat mechanistic data suggest a potential gut–butyrate–Nrf2/NF-κB–associated antioxidant/anti-inflammatory axis; however, because these data are correlative and were obtained in a rodent model, this axis should be regarded as hypothesis-generating and requires direct validation in ruminants. The goat production benefits were accompanied by a descriptive trend toward propionate-type rumen fermentation and endocrine remodeling.
Keywords:
fermented apple pomace
; dairy goats
; solid-state fermentation
; Nrf2/NF-κB signaling
; gut microbiota
; butyrate
; oxidative stress
; lactation performance
1. Introduction
The juice processing industry in China generates millions of tons of apple pomace annually [1]. If improperly disposed of (e.g., open-air stacking or landfilling), this organic by-product, which is rich in fermentable sugars, pectin, polyphenols, and minerals, not only wastes biomass resources but also releases greenhouse gases and leachate due to its high moisture content, imposing significant environmental burdens [2]. The conversion of apple pomace, a non-grain biomass resource, into feed represents a pivotal direction for sustainable animal production and circular agriculture [3]. However, fresh apple pomace is characterized by high moisture (approximately 75–80%), high crude fiber (neutral detergent fiber >60%), and the presence of anti-nutritional factors such as tannins and pectin; these characteristics directly limit feed intake and impair rumen fermentation and nutrient utilization in ruminants [4].
Solid-state fermentation (SSF) has been established as an effective approach to upgrade the nutritional quality of agro-industrial by-products [5,6]. Through microbial metabolism (e.g., by Aspergillus, Saccharomyces, or Bacillus), SSF degrades cellulose and hemicellulose, reduces anti-nutritional factors, and concurrently elevates crude protein content while enriching functional secondary metabolites including organic acids, polyphenols, and bioactive peptides [7,8]. Despite sporadic reports on the application of fermented apple pomace (FAP) in monogastric animals such as pigs and poultry [7], systematic investigations into its effects on ruminants—particularly dairy goats—remain remarkably scarce. In particular, there is a pronounced knowledge gap regarding rumen fermentation characteristics, systemic metabolic reprogramming, and the underlying immuno-regulatory and antioxidant molecular mechanisms mediated by FAP in ruminants.
Notably, the gut microbiome, as a "second genome" that integrates nutrient sensing and immune modulation, has been demonstrated to serve as a core driver in dietary intervention-mediated host health improvement [9]. However, whether FAP can reshape the ruminal and hindgut microbial community structure to generate specific bioactive metabolites, such as short-chain fatty acids (SCFAs), and consequently activate host defense systems via defined signaling cascades (e.g., the Nrf2/NF-κB axis), remains entirely unexplored. Moreover, the optimal inclusion level of FAP in ruminant diets and the potential dose-dependent effects have not been systematically evaluated.
Given that goats are not amenable to fine-scale molecular and histological analyses, this study adopted a dual-model complementary strategy: lactating dairy goats were used to assess production performance, rumen fermentation, and systemic metabolism, while rats were employed to deeply dissect hepatic Nrf2/NF-κB signaling and gut microbiota–metabolite crosstalk. We hypothesized that FAP enriches butyrate-producing genera and elevates cecal butyrate production, and that butyrate, as a signaling molecule, activates Nrf2 nuclear translocation while suppressing the NF-κB inflammatory pathway, thereby systemically enhancing antioxidant capacity and immune homeostasis [10,11] and ultimately improving growth and lactation performance; moreover, this effect exhibits an optimal inclusion level, with excess potentially eliciting negative feedback.
Accordingly, the objectives of this study were: (1) to determine the optimal inclusion level of FAP in dairy goat diets; and (2) to elucidate the systemic mechanisms mediated by the "gut microbiota–butyrate–Nrf2/NF-κB" axis, thereby providing a robust theoretical basis and industrial-scale parameters for the high-value utilization of apple pomace as a feed resource.
2. Materials and Methods
2.1. Preparation of Fermented Apple Pomace (FAP)
Fresh apple pomace was sterilized at 121 ℃ for 15 min and cooled to ambient temperature prior to use. Fermentation was performed using a composite solid-state starter culture consisting of Geotrichum candidum, Saccharomyces cerevisiae, Rhizopus sp, Bacillus subtilis, and Trichoderma viride at an optimized viable count ratio of 2:2:0.5:0.5:1 (obtained from the China Center of Industrial Culture Collection, Beijing, China). The fermentation medium was formulated on a mass fraction basis as follows: apple pomace 81.3%, wheat bran 15%, urea 1.5%, ammonium sulfate 2%, dipotassium hydrogen phosphate (K₂HPO₄·3H₂O) 0.10%, and calcium carbonate (CaCO₃) 0.10%. Urea was filter-sterilized (0.22 μm) and added aseptically after the medium had cooled. The mixed starter was inoculated at 10% (v/w), and the initial moisture content was adjusted to 60- 65% with sterile water. After thorough mixing, the mixture was spread evenly to a layer thickness of 5 cm and subjected to solid-state fermentation at 31 ℃ for 72 h. Upon completion, the fermented product was oven-dried at 60 ℃ to constant weight, ground to pass through a 40-mesh sieve, and stored in sealed bags at 4 ℃ until further use.
2.2. Animals and Housing
Two independent animal experiments were conducted to evaluate the effects of FAP on production performance in dairy goats and the underlying molecular mechanisms in rats. All procedures were approved by the Institutional Animal Care and Use Committee of the Lanzhou Institute of Husbandry and Pharmaceutical Sciences, Chinese Academy of Agricultural Sciences (approval No. LIHPS-2018-022, 25 March 2018), and performed in accordance with the Regulations for the Administration of Laboratory Animals of the People’s Republic of China.
2.2.1. Dairy Goat Trial
Thirty healthy lactating dairy goats (initial body weight 55.5 ± 3.2 kg, with similar body condition, parity, and lactation stage) were randomly assigned to five groups (n = 6 per group). Goats were tethered in individual stalls, fed twice daily (08:00 and 17:00), and had free access to water. The barn temperature was maintained at 22 ± 2℃ with relative humidity of 50–60%. The experiment lasted 60 days, including a 14-day adaptation period followed by a 46-day formal trial.
2.2.2. Rat Trial
Fifty specific-pathogen-free (SPF) male Sprague-Dawley rats (8 weeks old, weighing 200-220 g) were acclimatized for 1 week and then randomly assigned to five groups (n = 10 per group) using a random number table. Male rats were used exclusively to avoid confounding effects of estrogen-induced fluctuations in oxidative stress and immune parameters. Rats were housed in barrier facilities under controlled conditions (22 ± 2 ℃, 50% ± 10% relative humidity, 12-h light/dark cycle) with ad libitum access to diet and water. The trial lasted 4 weeks.
2.3. Experimental Diets and Grouping
For dairy goats, the basal diet was formulated on a dry matter (DM) basis with a concentrate-to-forage ratio of 40:60. The concentrate mixture, accounting for 40% of dietary DM, comprised corn, soybean meal, rapeseed meal, peanut meal, wheat bran, dicalcium phosphate, limestone, salt, sodium bicarbonate, and a vitamin–mineral premix. The forage portion, accounting for the remaining 60% of dietary DM, consisted of alfalfa hay (25%), corn silage (20%), and Chinese wildrye hay (15%). The composition of the basal diet is shown in Figure 1 and Table A1, and the composition of the vitamin–mineral premix is shown in Supplementary Table S1. FAP was included at 0%, 5%, 10%, 15%, or 20% of dietary DM by substituting equivalent proportions of corn and wheat bran within the concentrate mixture. Specifically, each 5% increment of FAP replaced 3.6% corn and 1.4% wheat bran on a dietary DM basis, while all other concentrate ingredients and the forage portion remained unchanged; consequently, the total concentrate proportion was maintained at 40% and the concentrate-to-forage ratio at 40:60 across all treatments. The graded FAP inclusion levels and the corresponding ingredient composition of the experimental diets are presented in Supplementary Table S2. All ingredients were mixed into a total mixed ration (TMR), which was prepared fresh daily.
For rats, the basal diet was formulated according to the AIN-93M purified diet. FAP was incorporated by weight-for-weight substitution for microcrystalline cellulose in the AIN-93M diet to maintain comparable total dietary fiber levels among groups. The exact formulation is provided in Supplementary Table S3.
2.4.1. Lactation Performance Measurement
Feed offered and refused were recorded daily for each goat before the morning feeding (08:00), and dry matter intake (DMI) was calculated as (feed offered − feed refused) × dietary dry matter content (determined as described in Section 2.5). Milking was performed twice daily (06:00 and 18:00), and daily milk yield (kg/d) was recorded. On a fixed day each week (Monday), milk samples were collected in proportion to morning and evening milk yield, preserved with potassium dichromate, stored at 4 ℃, and analyzed for milk fat (%), milk protein (%), and lactose (%) using a milk analyzer (Foss MilkoScan™ FT+, Foss, Hillerød, Denmark). Somatic cell count (SCC, ×10³ cells/mL) was determined using a Fossomatic™ 7 (Foss, Hillerød, Denmark). Body weight was measured on two consecutive days before the morning feeding at the start and end of the formal trial, and the average of the two measurements was used as the initial and final body weight to calculate average daily gain (ADG, g/d). The feed-to-milk ratio was calculated as DMI/milk yield (kg/kg). All milk samples were analyzed within 24 h of collection.
2.4.2. Blood Sampling
Goats: On day 46 (the final day of the formal trial), before the morning feeding, blood samples (10 mL) were collected from the jugular vein into serum separator tubes (BD, Franklin Lakes, NJ, USA). After clotting at room temperature for 30 min, serum was separated by centrifugation at 3000 × g for 10 min, aliquoted, and stored at -80 ℃ for subsequent biochemical and hormonal analyses.
Rats: At the end of the experiment, rats were anesthetized by intraperitoneal injection of sodium pentobarbital (50 mg/kg body weight; Sigma-Aldrich, St. Louis, MO, USA) and then euthanized by exsanguination via the abdominal aorta. Serum separation and storage were performed as described for goats, for antioxidant and cytokine assays.
2.4.3. Rumen Fluid and Tissue Sample Collection
Rumen fluid (goats): Immediately after blood collection, approximately 50 mL of rumen fluid was withdrawn via an esophageal tube, discarding the initial 20 mL to minimize salivary contamination. The fluid was filtered through four layers of gauze, and pH was measured immediately using a portable pH meter (Mettler Toledo, Columbus, OH, USA). For VFA and NH₃-N determination, an aliquot was centrifuged at 10,000 × g for 10 min at 4 ℃, and the supernatant was acidified with 25% metaphosphoric acid (final concentration 2.5%, w/v) and stored at -80 ℃.
Tissues and contents (rats): After exsanguination, the liver was rapidly excised, rinsed with ice-cold saline, minced, snap-frozen in liquid nitrogen, and stored at –80 ℃ for RT-qPCR and Western blot analyses. Cecal contents (for SCFA measurement) and fresh feces (for 16S rRNA sequencing) were aseptically collected, immediately frozen in liquid nitrogen, and stored at -80 ℃.
2.5. Nutrient and Amino Acid Composition Analysis
Dry matter (DM, AOAC 930.15) was determined by oven-drying at 105 ℃ to constant weight. Crude protein (CP, AOAC 984.13) was measured by the Kjeldahl method (N × 6.25). Ether extract (EE, AOAC 920.39) was determined by Soxhlet extraction with petroleum ether. Ash (AOAC 942.05) was measured by incineration at 550 ℃ for 6 h. Neutral detergent fiber (NDF) and acid detergent fiber (ADF) were determined using a fiber analyzer (ANKOM Technology, Macedon, NY, USA) following the method of Van Soest et al. (1991), with heat-stable α-amylase and sodium sulfite added during NDF analysis; both NDF and ADF values are expressed exclusive of residual ash. Calcium and phosphorus were analyzed according to AOAC 975.03 and AOAC 965.17, respectively, after wet digestion with HNO₃-HClO₄. Non-fibrous carbohydrates (NFC) were calculated on a dry matter basis according to NRC (2001): NFC (%) = 100 − (CP + NDF + EE + Ash). All nutrient values were expressed on a 100% dry matter basis. Amino acid profiles were determined using an amino acid analyzer (Hitachi, Tokyo, Japan) after acid hydrolysis with 6 M HCl at 110 ℃ for 24 h; sulfur-containing amino acids (methionine and cysteine) were oxidized with performic acid prior to hydrolysis, and tryptophan was determined separately after alkaline hydrolysis (4 M LiOH, 110 ℃, 24 h).
2.6. Rumen Fermentation Parameters
Rumen fluid was centrifuged at 10,000 × g for 10 min at 4 ℃, and the supernatant was acidified with 25% metaphosphoric acid (final concentration 2.5%, w/v). pH, total VFA, and ammonia-N were measured individually for each goat. For individual VFA molar proportions (acetate, propionate, and butyrate), equal volumes of rumen fluid from six goats per group were pooled, and single measurements were performed using a gas chromatograph (Fuli GC9790Plus, Fuli Instruments, Zhejiang, China) equipped with a flame ionization detector and a DB-FFAP capillary column (30 m × 0.25 mm i.d. × 0.25 μm film thickness; Agilent Technologies, Santa Clara, CA, USA). The injector and detector temperatures were 250 ℃ and 280 ℃, respectively. The oven temperature was programmed from 60 ℃ (held for 2 min) to 120 ℃ at 10 ℃/min, then to 220 ℃ at 20 ℃/min (held for 3 min). Nitrogen was used as the carrier gas at a flow rate of 1.0 mL/min with a split ratio of 1:50, and the injection volume was 1 μL. 2-Ethylbutyric acid (Sigma-Aldrich, St. Louis, MO, USA) was added as the internal standard at a final concentration of 1.0 mM. Ammonia-nitrogen (NH3-N) concentration was measured by the phenol-sodium hypochlorite colorimetric method [12].
2.7. Serum Biochemical and Hormonal Assays (Goats)
Serum total protein (TP), albumin (ALB), blood urea nitrogen (BUN), glucose (GLU), triglycerides (TG), and total cholesterol (T-CHO) were measured using an automatic biochemical analyzer (Beckman Coulter AU5800, Brea, CA, USA). Serum concentrations of insulin (INS), triiodothyronine (T3), thyroxine (T4), and growth hormone (GH) were determined using enzyme-linked immunosorbent assay (ELISA) kits (Elabscience, Wuhan, China) following the manufacturer’s instructions.
2.8. Serum Antioxidant and Immune Factor ELISA (Rats)
Serum total antioxidant capacity (T-AOC), superoxide dismutase (SOD) activity, glutathione peroxidase (GSH-Px) activity, and malondialdehyde (MDA) content were measured using colorimetric assay kits (Nanjing Jiancheng Bioengineering Institute, Nanjing, China) according to the manufacturer’s instructions. Serum levels of interferon-γ (IFN-γ), tumor necrosis factor-α (TNF-α), interleukin-6 (IL-6), interleukin-10 (IL-10), and interleukin-1β (IL-1β) were determined using rat-specific enzyme-linked immunosorbent assay (ELISA) kits (Nanjing Jiancheng Bioengineering Institute).
2.9. Total RNA Extraction and RT-qPCR from Liver
Total RNA was extracted from rat liver tissues using TRIzol reagent (Invitrogen, Carlsbad, CA, USA). RNA concentration and purity (A260/280 ratio > 1.8) were assessed with a NanoDrop 2000 spectrophotometer (Thermo Fisher Scientific, Waltham, MA, USA). One microgram of total RNA was reverse-transcribed into cDNA using PrimeScript™ RT Master Mix (Takara, Shiga, Japan). Quantitative real-time PCR was performed on a LightCycler 480 II (Roche, Basel, Switzerland) using SYBR Premix Ex Taq™ (Takara). The cycling protocol was: 95 ℃ for 30 s, followed by 40 cycles of 95 ℃ for 5 s and 60 ℃ for 30 s, with a melt-curve analysis to verify amplicon specificity. Gapdh served as the internal control, and its stable expression across groups was confirmed by geNorm analysis (M < 0.5). The target genes analyzed were Ifng, Stat1, Irf1, Tnf, Il6, Il1b, Il10, Tlr4, Nfe2l2 (Nrf2), Keap1, Hmox1 (HO-1), Nqo1, Gpx1, Sod1, and Cat. Primers were synthesized by Sangon Biotech (Shanghai, China), and their sequences are provided in Supplementary Table X. Relative gene expression was calculated using the 2−ΔΔCt method.
2.10. Liver Protein Extraction and Western Blot
Liver tissues were homogenized in RIPA lysis buffer supplemented with phosphatase inhibitors (PhosSTOP, Roche, Basel, Switzerland) and protease inhibitors (cOmplete, Roche, Basel, Switzerland) to extract total, cytoplasmic, and nuclear proteins using a nuclear extraction kit (Beyotime, Shanghai, China). Protein concentrations were determined using a BCA protein assay kit (Beyotime). Equal amounts of protein (30 μg per lane) were separated by SDS-PAGE and electrotransferred onto PVDF membranes (Millipore, Billerica, MA, USA). After blocking with 5% non-fat milk for 1 h at room temperature, membranes were incubated overnight at 4 ℃ with primary antibodies against p-STAT1 (Tyr701), total STAT1, TNF-α, IL-6, IL-1β, p-NF-κB p65 (Ser536), total NF-κB p65, Nrf2, Keap1, HO-1, and GPx1 (all from Abcam, Cambridge, UK; diluted according to the manufacturer’s instructions). After washing three times with TBST (Tris-buffered saline with Tween 20), membranes were incubated with HRP-conjugated secondary antibodies (Beyotime, diluted 1:2000) for 1 h at room temperature. Signals were visualized using an enhanced chemiluminescence kit (Thermo Fisher Scientific, Waltham, MA, USA) and captured with a ChemiDoc imaging system (Bio-Rad, Hercules, CA, USA). Densitometric quantification was performed using ImageJ software (National Institutes of Health, Bethesda, MD, USA). β-actin was used as the loading control for total protein, and Lamin B (both from Santa Cruz Biotechnology, Dallas, TX, USA; diluted 1:1000) for nuclear protein.
2.11. 16S rRNA Gene Sequencing and Bioinformatics
Total genomic DNA was extracted from rat fecal samples using a stool DNA extraction kit (Qiagen, Hilden, Germany). The V3-V4 hypervariable regions of the 16S rRNA gene were amplified with primers 338F/806R and sequenced on an Illumina MiSeq platform (Illumina, San Diego, CA, USA) in paired-end mode. Raw reads were quality-filtered, assembled, and denoised using the QIIME 2 pipeline (version 2022.2; QIIME 2 Development Team, https://qiime2.org), and amplicon sequence variants (ASVs) were generated via the DADA2 algorithm. Taxonomic assignment was performed against the SILVA 138 database. Alpha diversity indices (Shannon, Simpson, ACE, and Chao1) and Coverage were calculated. Beta diversity was assessed by Principal Coordinate Analysis (PCoA) based on Bray-Curtis distances, and inter-group differences were tested by ANOSIM. LEfSe analysis (LDA threshold > 2.0) was applied to identify discriminative genera. Spearman correlation analysis and heatmap visualization were performed in R software (version 4.0.0; R Foundation for Statistical Computing, Vienna, Austria).
2.12. Targeted Quantification of Short-Chain Fatty Acids (SCFAs)
Approximately 100 mg of cecal contents were homogenized with ice-cold acidified ultrapure water containing metaphosphoric acid (final concentration 2.5%, w/v) and 2-ethylbutyric acid as the internal standard (final concentration 1.0 mM). After centrifugation (12,000 × g, 10 min, 4 ℃ ), the supernatant was filtered through a 0.22-μm membrane and analyzed using an Agilent 7890A-5975C gas chromatography-mass spectrometry system (Agilent Technologies, Santa Clara, CA, USA). Standard solutions of acetate, propionate, and butyrate, as well as the internal standard, were purchased from Sigma-Aldrich (St. Louis, MO, USA). Concentrations of each SCFA were calculated by the internal standard method and expressed as μmol/g of cecal content.
2.13. Statistical Analysis
All data are presented as mean ± standard deviation (SD). Normality and homogeneity of variance were assessed using the Shapiro-Wilk test and Levene’s test, respectively. Data meeting these assumptions were analyzed by one-way ANOVA. For comparisons among all groups, Tukey’s HSD post-hoc test was used; for comparisons versus the control group, Dunnett’s post-hoc test was applied. When the assumptions were not met, the Kruskal-Wallis test was applied, followed by Dunn’s post-hoc test for pairwise comparisons. Spearman’s rank correlation coefficient was used to evaluate relationships between gut microbiota, metabolites, and host parameters. The resulting P values from all Spearman correlation tests were adjusted for multiple testing using the Benjamini-Hochberg false discovery rate (FDR) method, and a corrected q < 0.05 was considered statistically significant. Analyses were performed using SPSS 26.0 and GraphPad Prism 9.0.
3. Results
3.1. Nutritional Composition and Amino Acid Profile of Raw Apple Pomace
On a dry matter (DM) basis, raw apple pomace contained 4.23% crude protein (CP), 3.61% ether extract (EE), and 2.38% ash; its nutritional composition is summarized in Table 1. It was characterized by high fiber fractions, with neutral detergent fiber (NDF) and acid detergent fiber (ADF) contents of 44.87% and 34.52%, respectively. The non-fiber carbohydrate (NFC) content was 44.91%, resulting in an NDF/CP ratio of 10.61. The calcium (Ca) and phosphorus (P) contents were 0.12% and 0.08%, respectively, giving a Ca/P ratio of 1.50.
The total amino acid content of raw apple pomace was 3.500 g/100 g DM, and its amino acid profile is presented in Figure 2 and Supplementary Table S4. Aspartic acid (0.720 g/100 g) and glutamic acid (0.518 g/100 g) were the most abundant amino acids. Among the essential amino acids, leucine exhibited the highest concentration (0.225 g/100 g), whereas methionine (0.038 g/100 g) and tryptophan (0.050 g/100 g) were the least abundant.
3.2. Effects of Fermented Apple Pomace Inclusion Level on Dietary Nutrient Composition and Amino Acid Profile
Dietary dry matter (DM) content decreased linearly from 89.50% to 88.30% as fermented apple pomace (FAP) inclusion increased from 0% to 20% (P < 0.001). Compared with the control, crude protein (CP) content increased linearly from 16.50% to 16.86% (P < 0.001), accompanied by linear increases in neutral detergent fiber (NDF; 38.50% to 39.04%) and acid detergent fiber (ADF; 22.70% to 23.88%) (P < 0.01). Similarly, ether extract (EE) increased linearly from 3.20% to 3.90% (P < 0.001). Conversely, ash and non-fiber carbohydrates (NFC) decreased linearly from 9.70% to 9.38% and from 32.10% to 30.82%, respectively (P < 0.01). The NDF/CP ratio remained stable across groups (2.33 to 2.32; P > 0.05). Calcium content decreased linearly from 0.740% to 0.652% (P < 0.001), whereas phosphorus content decreased slightly from 0.280% to 0.274% (P = 0.060). Consequently, the Ca/P ratio declined from 2.64 in the control to 2.38 in the 20% FAP group, with the 15% FAP group exhibiting a ratio of 2.44, which fell within the recommended optimal range of 2.0–2.5:1 for ruminants (Figure 3A; Supplementary Table S5).
Regarding the amino acid profile, compared with the control, total amino acid content decreased linearly from 13.820 g/100 g to 12.842 g/100 g in the 20% FAP group (P < 0.05; Supplementary Table S6). The total amino acid content in the 15% FAP group was 13.086 g/100 g, representing a significant decrease compared to the control (P < 0.05). Reductions in essential amino acids, including lysine, methionine, and leucine, were observed across treatments, with significant linear declines (P < 0.001) (Figure 3B; Supplementary Table S6).
3.3. Effects of Graded Levels of Fermented Apple Pomace Supplementation on Growth Performance and Milk Quality in Lactating Dairy Goats
No significant differences were observed in initial body weight among groups (55.0-55.5 kg, P > 0.05), ensuring baseline consistency across experimental treatments (Supplementary Table S7). All productive performance parameters, including dry matter intake (DMI), milk yield, and feed conversion ratio, exhibited distinct curvilinear responses to graded levels of FAP supplementation (Figure 4A). Specifically, DMI increased with increasing FAP inclusion, rising from 1.82 kg/d in the control to 2.16 kg/d in the 15% FAP group (an 18.7% increase, P < 0.001), before slightly declining to 2.09 kg/d in the 20% group (P < 0.01). Milk yield followed a similar inverted U-shaped pattern, increasing progressively from 2.02 kg/d in the control to a peak of 2.83 kg/d in the 15% FAP group (a 40.1% increase, P < 0.0001), and then decreasing to 2.67 kg/d in the 20% group (P < 0.001). The feed-to-milk ratio showed the opposite trend, decreasing from 0.901 in the control to 0.763 in the 15% FAP group (a 15.3% reduction, P < 0.001), and rising to 0.783 in the 20% group (P < 0.01). Concurrently, the 15% FAP group attained the greatest final body weight (61.2 kg, P < 0.05) and an average daily gain (ADG) of 128.3 g/d, representing a 127.1% increase compared with the control (56.5 g/d, P < 0.0001); the 20% group had an ADG of 113.0 g/d (P < 0.01). The magnitude of improvement in ADG closely paralleled that of milk yield, indicating a global anabolic effect of 15% FAP supplementation on whole-body protein and energy metabolism.
Regarding milk quality, the 15% FAP group exhibited the highest milk fat and milk protein contents among all treatments, at 3.94% and 3.41%, respectively, corresponding to 13.2% and 11.4% improvements over the control (3.48% and 3.06%, respectively; P < 0.0001); the 20% group also had significantly higher milk fat (3.82%) and milk protein (3.31%) than the control (P < 0.01). Somatic cell count (SCC), a critical indicator of udder health and raw milk quality, decreased in a dose-dependent manner with increasing FAP inclusion, from 318 × 10³/mL in the control to 112 × 10³/mL in the 15% FAP group, a reduction of 64.8% (P < 0.0001), and was 148 × 10³/mL in the 20% group (P < 0.01). This SCC level was well below the threshold for premium-quality milk, indicating a marked alleviation of subclinical mammary inflammation.
Notably, all measured parameters exhibited a consistent attenuation at the 20% FAP inclusion level. This highly congruent inverted U-shaped dose-response relationship across all evaluated indices unequivocally identifies 15% FAP as the optimal biological window for dietary supplementation in dairy goats (Figure 4A, Supplementary Table S7).
3.4. Regulatory Effects of Fermented Apple Pomace on Serum Metabolic Profiles and Endocrine Indices in Dairy Goats
Dietary FAP supplementation exerted significant regulatory effects on the serum metabolic profile and endocrine indices of dairy goats (Figure 4B; Supplementary Table S8). The changes in serum biochemical indices were highly consistent with the improvements in rumen fermentation. The 15% FAP group exhibited maximal elevations in total protein, albumin, and glucose, which increased from 68.2 g/L, 32.5 g/L, and 3.42 mmol/L in the control to 74.5 g/L, 36.3 g/L, and 3.75 mmol/L, respectively, representing increases of 9.2%, 11.7%, and 9.6% (P < 0.01). In contrast, serum urea nitrogen (BUN) decreased from 5.8 mmol/L in the control to 3.90 mmol/L in the 15% FAP group, a reduction of 32.8% (P < 0.0001), which closely paralleled the decline in ruminal ammonia-nitrogen, thereby corroborating, from a systemic metabolic perspective, the substantially improved nitrogen retention efficiency. The endocrinological profile further elucidated the underlying mechanisms of metabolic modulation: growth hormone (GH) and T3 levels peaked in the 15% FAP group, increasing from 3.52 ng/mL and 1.24 ng/mL to 4.19 ng/mL and 1.53 ng/mL, respectively, representing increases of 19.0% (P < 0.01) and 23.4% (P < 0.001), whereas insulin decreased from 12.4 μIU/mL to 8.4 μIU/mL, a reduction of 32.3% (P < 0.001). Meanwhile, thyroxine (T4) decreased from 48.6 ng/mL to 38.1 ng/mL, a reduction of 21.6% (P < 0.01). These changes were accompanied by reductions in triglycerides and total cholesterol from 0.31 mmol/L and 2.16 mmol/L to 0.23 mmol/L and 1.84 mmol/L, respectively, representing decreases of 25.8% and 14.8% (P < 0.01), collectively indicating a systemic metabolic state characterized by attenuated lipolysis, enhanced protein synthesis, and markedly improved insulin sensitivity. The endocrine combination of low insulin, elevated GH, and elevated T3 typically directs nutrient partitioning toward anabolism, providing an endocrinological basis for the synergistic improvement of growth and lactational performance in dairy goats. Notably, all of the aforementioned serum metabolic and endocrine parameters exhibited clear reversal trends at the 20% FAP inclusion level. Collectively, these findings demonstrate that 15% FAP supplementation, through the optimization of ruminal propionate-type fermentation and nitrogen utilization, systemically reshaped the serum endocrinological profile—characterized by low insulin, elevated GH, and elevated T3, thereby supporting the synergistic optimization of growth and lactational performance in dairy goats through integrated regulation of energy supply, nitrogen retention, and whole-body metabolic homeostasis.
3.5. Regulatory Effects of Fermented Apple Pomace on Rumen Fermentation Patterns in Dairy Goats
Dietary FAP supplementation altered the rumen fermentation pattern in dairy goats (Figure 4C; Supplementary Table S9). Ruminal pH remained relatively stable across treatments, declining only slightly from 6.84 in the control to 6.66 in the 15% FAP group and 6.69 in the 20% group, all within the normal physiological range for ruminants (6.5–7.0). Total volatile fatty acid (TVFA) concentration increased from 89.5 mmol/L in the control to 104.7 mmol/L in the 15% FAP group, before declining to 101.8 mmol/L in the 20% group. Ruminal ammonia-nitrogen concentration decreased from 12.6 mg/dL in the control to 8.6 mg/dL in the 15% FAP group, directly reflecting enhanced capture and utilization of nitrogen by ruminal microorganisms.
In pooled rumen fluid, the molar proportion of propionate appeared to increase from 18.2% in the control to 25.9% in the 15% FAP group, accompanied by an apparent decline in acetate from 64.8% to 58.3%, resulting in an apparent reduction of the acetate-to-propionate ratio from 3.56 to 2.25. Butyrate proportion appeared modestly elevated from 12.1% to 13.7%. However, because these individual VFA and ratio data were obtained from pooled samples (equal volumes from six goats per group) and were single measurements without statistical replication, no significance inference is warranted. These apparent shifts should therefore be interpreted as descriptive trends only. The statistically supported fermentation changes—elevated total VFA and reduced ammonia-N—suggest enhanced rumen fermentation and nitrogen capture. The apparent propionate-type shift may contribute to gluconeogenic precursor supply, but confirmation with individual-animal VFA measurements is required.
At the 20% FAP inclusion level, total VFA and ammonia-N were intermediate between the control and 15% FAP groups, consistent with 15% being the optimum within the tested range. However, individual VFA responses at 20% cannot be statistically evaluated because of the pooled-sample design.
3.6. Dose-Dependent Effects of Fermented Apple Pomace on Serum Antioxidant Parameters in Rats
To preliminarily investigate the mechanistic basis of the antioxidant potential of FAP, a rat model was employed in this study. With increasing FAP supplementation from 0% to 20%, the serum antioxidant profile of rats was significantly modulated (Figure 5; Supplementary Table S10). Serum total antioxidant capacity (T-AOC) exhibited a distinct curvilinear response, rising progressively from 8.25 U/mL in the control group to 10.63, 13.94, and peaking at 16.58 U/mL in the 15% FAP group—a 101.0% increase over the control (P < 0.001)—followed by a decline to 15.32 U/mL at the 20% inclusion level. Superoxide dismutase (SOD) and glutathione peroxidase (GSH-Px) displayed analogous trends, both peaking in the 15% FAP group at 178.6 and 652.7 U/mL, respectively, representing 116.7% (P < 0.001) and 107.1% (P < 0.0001) increases over the control, before decreasing to 165.3 and 605.1 U/mL in the 20% group. In contrast, malondialdehyde (MDA) exhibited an inverse pattern, declining from 6.92 nmol/mL in the control to its nadir of 1.95 nmol/mL in the 15% FAP group (a 71.8% reduction, P < 0.0001), followed by a rebound to 2.38 nmol/mL at 20% inclusion.
Notably, the highest levels of T-AOC, SOD, and GSH-Px, together with the lowest MDA level, all converged in the 15% FAP group. Across the 5% to 15% range, all parameters displayed stepwise improvements (P < 0.05 vs. the control group). The coordinated upregulation of the enzymatic antioxidant defense system (T-AOC, SOD, and GSH-Px) reflects a systemic enhancement of endogenous antioxidant capacity, whereas the marked reduction in MDA provides direct evidence of alleviated oxidative stress in this rodent model. Collectively, the 15% FAP group consistently exhibited the most favorable antioxidant profile, while the 20% group showed a uniform reversal across all indices. These findings in rats provide a preliminary mechanistic reference for the antioxidant potential of FAP, though further validation in dairy goats is warranted to confirm whether similar regulatory effects occur in ruminants.
3.7. Regulatory Mechanisms of Fermented Apple Pomace on Inflammatory Signaling and the Nrf2 Antioxidant Pathway
To elucidate the molecular mechanisms underlying the immunomodulatory and antioxidant effects of FAP, we systematically evaluated the dose-dependent regulation of interferon signaling, classical inflammatory pathways, and the Nrf2 antioxidant pathway at three levels—gene transcription, protein translation (including phosphorylation modifications), and functional secretion—using RT-qPCR, Western blot, and ELISA in rats (Figure 6).
At the level of interferon signaling (Figure 6A,B), FAP supplementation was associated with enhanced immune defense response in rats. With increasing FAP inclusion from 0% to 15%, the mRNA expression of IFN-γ and its downstream signal transducer STAT1, as well as the effector transcription factor IRF1, were upregulated by 3.85-, 2.05-, and 3.12-fold, respectively (Figure 6A; all P < 0.0001). Concurrently, the phosphorylation ratio of STAT1 (p-STAT1/STAT1) increased by 3.45-fold, synchronously peaking in the 15% group (Figure 6B; P < 0.0001). These indices exhibited significant attenuation at the 20% inclusion level.
At the level of classical inflammatory signaling (Figure 6A–C), FAP supplementation was associated with suppression of the TLR4/NF-κB signaling axis and its downstream pro-inflammatory cascade in rats. In the 15% group, TLR4 mRNA expression decreased to 0.28-fold of the control (Figure 6A; P < 0.0001), and phosphorylation of the core transcription factor NF-κB p65 (p-p65/p65) was drastically suppressed to 0.12-fold (Figure 6B; P < 0.0001). The downstream pro-inflammatory cytokines TNF-α and IL-1β were simultaneously reduced to their lowest levels across all groups at the transcriptional (qPCR), intracellular synthetic (Western blot), and secretory (ELISA) levels (Figure 6A–C; all P < 0.0001). Conversely, the anti-inflammatory cytokine IL-10 reached its peak mRNA level in the 15% group (a 3.85-fold increase over the control, P < 0.0001), establishing a robust anti-inflammatory microenvironment.
At the level of the Nrf2 antioxidant signaling pathway (Figure 6A,B), FAP supplementation was associated with alleviation of the constraint of the negative regulator Keap1 and activation of nuclear translocation of the core transcription factor and its downstream defense systems in rats. In the 15% group, Keap1 mRNA expression was suppressed to 0.32-fold of the control (Figure 6A; P < 0.0001), while Western blot analysis revealed a visibly weaker Keap1 protein band. This drove the nuclear Nrf2/total Nrf2 ratio (reflecting Nrf2 nuclear translocation and functional activation) to its highest level across all groups (a 4.35-fold increase over the control, Figure 6B; P < 0.0001). Multiple downstream antioxidant target genes (HO-1, NQO1, GPx1, SOD1, and CAT) exhibited synchronized upregulation at the transcriptional level in the 15% group, with HO-1 mRNA reaching 5.15-fold of the control (Figure 6A; P < 0.0001). Western blot results further confirmed that the protein translation trends of HO-1 and GPx1 were highly consistent with their mRNA trends, both peaking in the 15% group (Figure 6B), confirming that FAP exerts its antioxidant effects coordinately at both the transcriptional and translational levels in this rodent model.
Notably, IL-6 exhibited a distinct regulatory pattern (Figure 6A–C). Despite the strong suppression of upstream NF-κB phosphorylation and classical pro-inflammatory cytokines (TNF-α and IL-1β) by FAP, IL-6 mRNA, intracellular protein, and serum secretion levels (30.2 pg/mL vs. 8.5 pg/mL in the control, Figure 6C; P < 0.0001) were all significantly upregulated in the 15% group. Together with the concurrently elevated IL-10, this observation suggests that the surge in IL-6 under 15% FAP treatment may not be mediated through the classical NF-κB-dependent pro-inflammatory pathway, but rather may involve STAT3-mediated tissue repair and immune remodeling, reflecting the finely tuned bidirectional immunomodulatory function of FAP. However, this speculation requires validation through phospho-STAT3 detection and hepatic proliferation markers.
In summary, in rats, 15% FAP was associated with coordinated regulation of IFN-mediated immune defense activation, classical NF-κB inflammatory suppression, and Nrf2-mediated antioxidant defense enhancement at the transcriptional, translational, and secretory levels. The consistent attenuation of all targets at the 20% inclusion level further corroborates 15% as the optimal supplementation level within the tested range in this rodent model. However, these mechanistic findings should not be directly extrapolated to dairy goats, because hepatic Nrf2/NF-κB signaling and cecal SCFA/microbiota were not measured in goats.
3.8. Effects of Fermented Apple Pomace on Gut Microbiota Remodeling and Host–Microbe Associations
To investigate whether the gut microbiome serves as an upstream driver of FAP-mediated immunomodulatory and antioxidant effects, high-throughput 16S rRNA sequencing of cecal microbiota was performed in rats (Figure 7). Alpha diversity analysis (Figure 7A; Supplementary Table S12) revealed that the Shannon and Simpson indices exhibited an inverted U-shaped trend with increasing FAP inclusion, both peaking in the 15% FAP group (P < 0.001), while the ACE and Chao1 indices followed the same pattern (P < 0.001), indicating that 15% FAP supplementation effectively enhanced both species richness and evenness of the gut microbiota; the Coverage index was approximately 1.00 across all groups, confirming that the sequencing depth was sufficient to capture the vast majority of the microbial community. Principal coordinate analysis based on Bray-Curtis distances (Figure 7B) displayed a clear gradient separation among the five groups (PC1 = 70.88%, PC2 = 17.76%), with the 15% and 20% FAP groups located farthest from the control, and ANOSIM analysis (Figure 7C) further confirmed extremely significant inter-group differences (R = 0.9983, P = 0.001).
At the phylum level (Figure 7D), Firmicutes and Bacteroidetes were the dominant phyla in all groups, and the Firmicutes/Bacteroidetes (F/B) ratio decreased progressively with increasing FAP inclusion, from 1.98 in the control to 1.52 in the 15% FAP group and 1.60 in the 20% FAP group. At the genus level (Figure 7E), the 15% FAP group was significantly enriched in short-chain fatty acid (SCFA)-producing beneficial genera, including Prevotella, Ruminococcus, Butyrivibrio, and Roseburia, whereas potentially opportunistic pathogens such as Escherichia/Shigella were significantly suppressed.
The sample clustering dendrogram (Figure 7F) showed that the 15% and 20% FAP groups clustered closely on the same branch, and LEfSe analysis (LDA > 2.0) further identified the characteristic signature genera of the 15% FAP group as Prevotella (LDA = 4.82), Ruminococcus (LDA = 4.16), and Butyrivibrio (LDA = 3.95) (Figure 7G,H). This microbial remodeling provides an upstream microbiological basis for the subsequent enhancement of SCFA production and activation of the Nrf2 antioxidant pathway.
3.9. Association Analyses Between Gut Microbiota Composition and Host Serum Parameters
To further explore the functional coupling between the gut microbiome and host systemic status, we performed multilevel association analyses (Figure 8). Hierarchical clustering heatmap analysis (Figure 8A) revealed a clear structural separation of the dominant genera among the different treatment groups. The 15% FAP group exhibited a distinct microbial signature, characterized by a marked enrichment of beneficial genera (e.g., Prevotella, Ruminococcus, and Butyrivibrio), which clearly distinguished it from the control and 20% FAP groups.
Venn diagram analysis (Figure 8B) revealed that the five groups shared 47 core OTUs, accounting for the vast majority of the total OTU sequences, indicating that these shared OTUs constituted the core skeleton of the gut microbiota. The number of unique OTUs in each group was extremely low (5 in the control and only 0–1 in the remaining groups). This suggests that the effect of FAP on the gut microbiome does not depend on introducing a large number of novel exogenous species, but rather on precisely modulating the abundance structure of the shared core probiotics to achieve microbial ecological remodeling.
Microbiota–host correlation analysis (Figure 8C) further supported these findings. Spearman correlation heatmaps revealed that Prevotella and Butyrivibrio were significantly positively correlated with serum T-AOC, SOD, and GSH-Px (r = 0.58–0.75, P < 0.05), whereas Ruminococcus showed weaker and partially significant correlations with these parameters. Prevotella and Butyrivibrio were also negatively correlated with MDA and the pro-inflammatory cytokines TNF-α and IL-1β, while the suppressed genus Escherichia/Shigella exhibited the opposite correlation pattern.
In summary, 15% FAP structurally enriched SCFA-producing beneficial genera while suppressing opportunistic pathogens, thereby remodeling the abundance of core gut microbiota. This microbial shift formed a tight functional coupling with systemic antioxidant and anti-inflammatory capacities.
3.10. Fermented Apple Pomace Modulates Gut Microbial Metabolites and Their Associations with Host Antioxidant and Immune Status
To verify whether FAP-induced gut microbiota remodeling translates into functional metabolic signals that activate the downstream Nrf2 antioxidant pathway, we performed targeted quantification of the major short-chain fatty acids (SCFAs)—acetic acid, propionic acid, and butyric acid—in rat cecal contents, and analyzed their correlations with microbial abundance and host antioxidant/immune parameters.
The genera enriched in the 15% FAP group were closely associated with host antioxidant and immune parameters (Figure 9A; Supplementary Table S13). Butyrivibrio showed the strongest positive correlations with serum T-AOC (r = 0.68, P < 0.01), SOD (r = 0.75, P < 0.01), and GSH-Px (r = 0.72, P < 0.01), and strong negative correlations with MDA (r = −0.78, P < 0.001), IFN-γ (r = −0.58, P < 0.05), TNF-α (r = −0.62, P < 0.05), IL-6 (r = −0.48, P < 0.05), and IL-1β (r = −0.65, P < 0.01). Roseburia and Prevotella exhibited similar but somewhat weaker correlation patterns, whereas Escherichia/Shigella showed the opposite trend, with positive correlations with MDA (r = 0.68, P < 0.01), TNF-α (r = 0.71, P < 0.01), and IL-1β (r = 0.64, P < 0.05), and negative correlations with T-AOC (r = −0.52, P < 0.05) and SOD (r = −0.48, P < 0.05).
Increasing FAP inclusion from 0% to 15% significantly increased cecal acetic acid, propionic acid, butyric acid, and total SCFA concentrations (Figure 9B; Supplementary Table S14). In the 15% FAP group, butyric acid reached its highest value (16.3 ± 3.2 μmol/g), representing a 117.3% increase over the control (7.5 ± 2.1 μmol/g, P < 0.001). Acetic acid increased from 42.5 ± 6.8 to 62.4 ± 7.8 μmol/g, propionic acid from 16.2 ± 3.1 to 28.5 ± 4.2 μmol/g, and total SCFAs from 66.2 ± 10.2 to 107.2 ± 13.5 μmol/g (all P < 0.0001). At the 20% FAP level, all SCFAs declined relative to the 15% group (butyric acid, 14.1 ± 2.9 μmol/g; total SCFAs, 98.1 ± 12.8 μmol/g), confirming an inverted U-shaped dose-response relationship and identifying 15% as the optimal biological window for FAP-promoted intestinal SCFA production in rats.
Spearman correlation analysis in the 15% FAP group revealed that butyrate-producing genera were strongly positively correlated with butyric acid concentration (Figure 9C; Supplementary Table S15). Butyrivibrio exhibited the highest correlation coefficient with butyric acid (r = 0.78, P < 0.001), followed by Roseburia (r = 0.72, P < 0.001), Ruminococcus (r = 0.61, P < 0.05), and Prevotella (r = 0.55, P < 0.05). In contrast, the opportunistic pathogen Escherichia/Shigella was negatively correlated with butyric acid (r = −0.61, P < 0.05). Similar positive associations were observed between these genera and acetic and propionic acids, although the correlation coefficients were generally lower than those for butyric acid. These results strongly suggest that FAP drives butyric acid biosynthesis by enriching SCFA-producing functional microbiota.
Further analysis of the relationships between SCFAs and key nodes of the Nrf2 pathway and serum antioxidant parameters revealed that butyric acid was the most tightly associated effector molecule among the three SCFAs (Figure 9D; Supplementary Table S16). Butyric acid concentration was strongly positively correlated with the nuclear Nrf2/total Nrf2 ratio (r = 0.73, P < 0.001), HO-1 mRNA (r = 0.68, P < 0.01), GPx1 mRNA (r = 0.64, P < 0.01), serum T-AOC (r = 0.72, P < 0.01), SOD (r = 0.65, P < 0.01), and GSH-Px (r = 0.63, P < 0.01), and strongly negatively correlated with MDA (r = −0.74, P < 0.001). Acetic acid, propionic acid, and total SCFAs showed similar but generally weaker correlations with these parameters.
Collectively, in rats, 15% FAP was associated with enhanced cecal butyrate production and enrichment of butyrate-producing taxa, particularly Butyrivibrio and Roseburia. Butyrate showed strong correlations with Nrf2 nuclear translocation and downstream antioxidant parameters, suggesting a potential functional link between gut microbial metabolites and host antioxidant defense. However, these data are correlative; they do not establish that butyrate directly activates Nrf2 or that this axis operates in goats. The reduction in butyrate at the 20% FAP level provides a plausible explanation for the attenuated antioxidant and productive responses at this inclusion level, but direct interventional studies are required to establish causality.
4. Discussion
This study identified 15% fermented apple pomace (FAP) as the optimal inclusion level for dairy goat diets within the tested range, based on dose-response evidence from production performance and complementary rodent mechanistic data. At this level, FAP was associated with improved growth and lactation performance, rumen fermentation, systemic antioxidant capacity, and immune-inflammatory homeostasis in goats, whereas the 20% level attenuated these benefits. The following discussion integrates findings across four levels—dietary nutritional composition, rumen metabolism and endocrine responses, tissue-level signaling pathways, and the gut microbiota–metabolite–host axis—to delineate the functional basis and underlying logic of 15% FAP supplementation.
From a nutritional standpoint, FAP inclusion progressively altered dietary crude protein and fiber contents. Raw apple pomace contained only 4.23% crude protein, whereas fermentation increased the crude protein content of apple pomace, as indicated by the linear increase in dietary CP from 16.50% to 16.86% as FAP inclusion increased from 0% to 20% (Supplementary Table S5). This increase may result from microbial biomass protein synthesis; however, residual non-protein nitrogen from urea and ammonium sulfate added during fermentation may also contribute. Fractionation of true protein versus non-protein nitrogen, together with residual urea/ammonium determination, is required before FAP protein quality can be fully evaluated. As FAP inclusion increased from 0% to 20%, dietary CP, NDF, and EE increased linearly, while the 15% FAP group achieved a favorable balance: EE peaked at 3.73% in the 15% FAP group without the excessive elevation observed at 20% (3.90%) (Supplementary Table S5), and the Ca/P ratio was 2.44, falling within the recommended range of 2.0–2.5:1 for ruminants (Figure 3A). The NDF/CP ratio remained constant across all groups (2.32–2.33), indicating that the fiber-to-protein macro-structure was not markedly altered by FAP substitution of corn and wheat bran, providing a basis for comparability among treatments. Notably, raw apple pomace was rich in aspartic acid (0.720 g/100 g) and glutamic acid (0.518 g/100 g), but deficient in methionine (0.038 g/100 g) and tryptophan (0.050 g/100 g). With FAP supplementation, total dietary amino acid content decreased linearly from 13.820 g/100 g in the control to 12.842 g/100 g in the 20% FAP group ((Figure 3B; Supplementary Table S6). Nevertheless, the 15% FAP group maintained a total amino acid content of 13.086 g/100 g, which was 1.9% higher than the 20% group, with manageable reductions in essential amino acids that still met the basic requirements of lactating dairy goats. Previous studies have demonstrated that apple pomace is rich in pectic polysaccharides and polyphenols, which serve as fermentation substrates for rumen microorganisms and promote the proliferation of beneficial bacteria [13]. In the present study, the NFC content of raw apple pomace (44.91%) (Table 1) was higher than that of the replaced wheat bran, providing a readily fermentable energy source and establishing the material basis for improved rumen fermentation efficiency and microbial protein synthesis.
At the rumen level, the 15% FAP group exhibited significantly elevated total volatile fatty acid concentrations and reduced ammonia-N, with pooled-sample analysis suggesting an apparent shift toward propionate-type fermentation (Figure 4C; Supplementary Table S8). Because individual VFA data were obtained from pooled samples without statistical replication, these apparent shifts in acetate, propionate, butyrate, and the acetate-to-propionate ratio should be interpreted as descriptive trends rather than statistically confirmed effects. Since propionate is the primary gluconeogenic precursor in ruminants, its increased supply, if confirmed by individual-animal measurements, could support hepatic glucose production, helping to explain the elevated serum glucose (from 3.42 to 3.75 mmol/L) and reduced blood urea nitrogen (from 5.8 to 3.90 mmol/L). Previous studies have reported that apple pomace silage inclusion in lactating goats increased rumen acetate, propionate, and total volatile fatty acid levels [14], and that apple pomace modulates the microbiota and increases the propionate ratio in in vitro fermentation models [15]. The present study further confirms that FAP supplementation enhanced the capture and utilization efficiency of ammonia-nitrogen by rumen microorganisms (ammonia-N decreased from 12.6 to 8.6 mg/dL, a 31.7% reduction), thereby reducing nitrogen loss through the urea cycle. However, nitrogen retention per se was not directly measured, and nitrogen balance studies are required to confirm this interpretation.
The endocrinological profile further supports this metabolic regulation. The 15% FAP group simultaneously elevated growth hormone (from 3.52 to 4.19 ng/mL) and triiodothyronine (T3, from 1.24 to 1.53 ng/mL) while reducing insulin to its lowest level (from 12.4 to 8.4 μIU/mL), suggesting enhanced peripheral insulin sensitivity. This endocrine milieu—low insulin, elevated GH, and elevated T3—favors reduced lipolysis and augmented protein synthesis, consistent with the observed decreases in serum triglycerides and total cholesterol (25.8% and 14.8% reductions, respectively). Previous studies in beef cattle have shown that fermented apple pomace-based total mixed rations significantly increased average daily gain and apparent digestibility of crude protein [16]. The present study is the first to systematically describe this endocrine-metabolic pattern in lactating dairy goats. Therefore, we propose that 15% FAP, by optimizing dietary energy structure and promoting propionate-type rumen fermentation, may strengthen hepatic gluconeogenic precursor supply and nitrogen utilization efficiency while establishing a hormonally anabolic environment that collectively supports lactation and growth. The attenuated effects at the 20% level may result from excessive fiber dilution or accumulation of anti-nutritional factors beyond microbial tolerance, thereby compromising fermentation efficiency. However, because the goat diets were not formulated to be isonitrogenous or isoenergetic, part of the production response may reflect changes in the overall nutrient matrix rather than a specific functional effect of FAP.
At the tissue-signaling level, in rats, 15% FAP was associated with significant suppression of the TLR4/NF-κB pathway, with the p-p65/p65 ratio reduced to 0.12 times that of the control, accompanied by concordant declines in TNF-α and IL-1β at transcriptional, translational, and secretory levels. Apple pomace polyphenols have been demonstrated to exert anti-inflammatory effects by inhibiting NF-κB and COX-2 [17]. The present study provides molecular evidence in a complementary rodent model; validation of this mechanism in dairy goats is needed. Concurrently, FAP decreased Keap1 expression, promoted Nrf2 nuclear translocation (nuclear/total Nrf2 ratio increased by 4.35-fold), and upregulated antioxidant enzymes including HO-1, GPx1, and SOD1, leading to peak serum total antioxidant capacity and a 71.8% reduction in MDA. Polyphenolic compounds in apple pomace have been shown to modulate redox balance through the Nrf2 pathway and regulate inflammatory responses through the NF-κB pathway [18,19]. These two pathways achieved synergistic optimization in the 15% FAP group, suggesting that FAP simultaneously relieves oxidative stress and inflammatory burden, with possible mutual reinforcement: Nrf2-driven antioxidase upregulation scavenges ROS and attenuates redox-sensitive NF-κB activation, while NF-κB suppression curtails inflammation-induced secondary oxidative bursts.
Notably, IL-6 exhibited an inverse expression pattern relative to other pro-inflammatory cytokines, being significantly elevated at 15% FAP (30.2 pg/mL vs. 8.5 pg/mL in the control) despite strong upstream NF-κB inhibition. Studies have shown that IL-6 can drive hepatocyte regeneration through STAT3 signaling and regulate macrophage polarization by suppressing the pro-inflammatory Ly-6Chi phenotype while promoting reparative Ly-6Clo macrophages [20,21,22,23]. Furthermore, the STAT3–IL-10–IL-6 axis is a positive regulator of macrophage efferocytosis, survival, and phenotypic conversion, directly linking debris engulfment to tissue repair [24]. Therefore, we hypothesize that the IL-6 elevation under 15% FAP treatment may not be mediated through the classical NF-κB-dependent pro-inflammatory pathway, but rather participates in STAT3-mediated tissue repair and immune remodeling, consistent with the concurrent rise in IL-10 and pointing toward an “anti-inflammatory-reparative” immune remodeling state. However, this speculation requires validation through phospho-STAT3 detection and hepatic proliferation markers.
16S rRNA sequencing revealed that, in rats, 15% FAP significantly increased cecal microbial α-diversity and enriched butyrate-producing genera such as Butyrivibrio and Roseburia, while suppressing opportunistic pathogens like Escherichia/Shigella (Figure 7). Concomitantly, cecal butyrate concentration peaked at 15% FAP (16.3 μmol/g, a 117.3% increase over the control) and declined to 14.1 μmol/g at 20% (Figure 9B). Correlation analyses showed strong positive associations between butyrate concentration and Nrf2 nuclear translocation (r = 0.73, P < 0.001) as well as serum T-AOC (r = 0.72, P < 0.01), and a strong negative correlation with MDA (r = −0.74, P < 0.001) (Figure 9D; Supplementary Table S16). These statistical associations outline a candidate transmission chain: FAP supplementation → enrichment of butyrate-producing taxa → enhanced butyrate production → Nrf2 activation and antioxidase upregulation → reduced systemic oxidative damage. Because all evidence for this chain is correlative and derived from rats, it should be regarded as a hypothesis-generating framework rather than a proven cascade in goats. Butyrate, as a histone deacetylase (HDAC) inhibitor and GPR109A agonist, has been extensively demonstrated to induce Nrf2 nuclear translocation through GPR109A receptor recognition, thereby encoding antioxidant enzymes for ROS inactivation [25]. Butyrate also reduces reactive oxygen species levels by activating the Nrf2 antioxidant pathway and enhancing glutathione synthesis, alleviating stress damage to the intestinal barrier and immune cells [26]. Furthermore, SCFAs have been shown to modulate Nrf2 redox signaling through specific free fatty acid receptors, with butyrate inducing epigenetic regulation and/or Nrf2 nuclear translocation [27,28,29,30]. Our results align with these mechanisms and provide, in a complementary rodent model, quantitative correlational support for this potential axis. Direct validation in ruminants is still required. Apple pomace pectic polysaccharides have also been shown to significantly promote lactic acid and short-chain fatty acid production in in vitro fermentation [31].
Nevertheless, correlation does not equate to causation. The potential contributions of other microbial metabolites (e.g., propionate, polyphenolic derivatives) cannot be excluded, nor can the dominant signaling route (HDAC inhibition versus GPR109A) be ascertained. The parallel decline in butyrate and Nrf2 activity at the 20% level further reinforces 15% as the optimal biological window within the tested range, though the underlying cause remains unclear and may involve unidentified antibacterial components in high-dose FAP or reduced substrate accessibility for butyrate producers due to altered fiber structure.
Finally, we acknowledge several limitations. First, the causal inferences regarding the butyrate–Nrf2 axis have not been validated through direct interventions, such as GPR109A antagonists or HDAC inhibitors, nor through Nrf2-knockout models; thus, all mechanistic propositions remain correlative hypotheses. Second, the chemical characterization of bioactive components in FAP—including polyphenols, flavonoids, organic acids, and small peptides—is incomplete, preventing us from distinguishing direct microbiota-modulating agents from host-absorbed compounds. Third, the goat trial covered only 46 days of mid-lactation, without extending to full lactation, reproductive performance, or offspring health, limiting the translational applicability of our findings. Future work should employ intestinal epithelial cell models with exogenous butyrate and specific pathway inhibitors to establish causality, conduct UPLC-MS/MS-based identification of key functional compounds, and perform long-term full-lactation trials with economic analyses to inform practical feeding strategies.
5. Conclusions
In summary, this study identifies 15% fermented apple pomace (FAP) as the optimal dietary inclusion level for dairy goats within the tested range, based on dose-response evidence from production performance and complementary rodent mechanistic data. In goats, 15% FAP was accompanied by improved growth and lactation performance, propionate-type rumen fermentation, enhanced nitrogen capture, and endocrine changes consistent with an anabolic state. In rats, 15% FAP was associated with activation of Nrf2 antioxidant signaling, suppression of TLR4/NF-κB inflammation, enrichment of butyrate-producing genera, and elevated cecal butyrate. Butyrate correlated with Nrf2 activation and systemic antioxidant capacity, suggesting a potential microbiota–butyrate–Nrf2–antioxidant axis. However, because hepatic signaling and cecal SCFA/microbiota were not measured in goats, this axis remains a cross-species hypothesis requiring direct validation in ruminants. All beneficial effects were lower at 20% than at 15%, supporting 15% as the optimal level within the tested range. These findings provide a theoretical basis for precision application of FAP in ruminant nutrition and highlight the gut–host axis as a candidate target for dietary intervention, with butyrate as a critical functional link between microbial remodeling and host defense activation.
Supplementary Materials
The following supporting information can be downloaded at the website of this paper posted on Preprints.org. Table S1: Composition and active ingredient concentrations of the compound vitamin–mineral premix used in the dairy goat diets (per kg of premix); Table S2: Ingredient composition of the experimental total mixed rations for dairy goats containing graded levels of fermented apple pomace (FAP) (% of dietary dry matter); Table S3: Ingredient composition of the AIN-93M purified basal diet and the AIN-93M mineral and vitamin mixes fed to rats (g/kg diet or mix); Table S4: Effects of graded inclusion levels of fermented apple pomace (FAP) on the nutritional composition of experimental diets for dairy goats (% of dry matter); Table S5: Effects of graded inclusion levels of fermented apple pomace (FAP) on the amino acid composition of experimental diets for dairy goats (g/100 g dry matter); Table S6: Effects of graded inclusion levels of fermented apple pomace (FAP) on growth performance, lactation performance, and milk quality of dairy goats; Table S7: Effects of graded inclusion levels of fermented apple pomace (FAP) on the amino acid composition of experimental diets for dairy goats (g/100 g dry matter); Table S8: Effects of graded dietary inclusion levels of fermented apple pomace (FAP) on rumen fermentation parameters in lactating dairy goats; Table S9: Effects of graded inclusion levels of fermented apple pomace (FAP) on serum antioxidant indices in rats; Table S10: Effects of graded inclusion levels of fermented apple pomace (FAP) on serum cytokine concentrations in rats; Table S11: Effects of graded inclusion levels of fermented apple pomace (FAP) on alpha diversity of gut microbiota in rats; Table S12: Spearman correlation coefficients between core gut genera and host antioxidant and immune indices in rats; Table S13: Effects of graded inclusion levels of fermented apple pomace (FAP) on cecal short-chain fatty acid concentrations in rats; Table S14: Spearman correlation coefficients between core gut genera and short-chain fatty acids in the 15% FAP group; Table S15: Spearman correlation coefficients between short-chain fatty acids and the Nrf2 pathway and serum antioxidant indices in rats; Figure S1: Representative original Western blot images of [target protein] expression in rat liver tissues from fermented apple pomace-treated rats, with β-actin as the loading control.
Author Contributions
Conceptualization, L.W. and S.W.; methodology, J.H. and J.G.; software, J.H.; validation, J.H., J.G. and L.W.; formal analysis, J.H.; investigation, J.H. and J.G.; resources, L.W. and S.W.; data curation, J.H.; writing- original draft preparation, J.H.; writing- review and editing, J.H., J.G., L.W. and S.W.; visualization, J.H.; supervision, L.W. and S.W.; project administration, L.W. and S.W.; funding acquisition, S.W. All authors have read and agreed to the published version of the manuscript.
Funding
This research was funded by the National Natural Science Foundation of China (Grant No. 32673923), the Agricultural Science and Technology Innovation Program of the Chinese Academy of Agricultural Sciences (Grant No. 25-LZIHPS-03), the Natural Science Foundation of Gansu Province (Grant No. 24JRRA024), and the Science and Technology Department of Gansu Province (Key Research and Development Program of Gansu Province, Grant No. 26YFNA008). The APC was funded by the Science and Technology Department of Gansu Province (Key Research and Development Program of Gansu Province, Grant No. 26YFNA008). This work was also supported by the Seed Industry Key Research and Science and Technology Support Project (Grant No. KJZC-2026-5).
Institutional Review Board Statement
This study was approved by the Institutional Animal Care and Use Committee of the Lanzhou Institute of Husbandry and Pharmaceutical Sciences of the Chinese Academy of Agricultural Sciences (25 March 2018, LIHPS-2018-022).
Informed Consent Statement
Not applicable.
Data Availability Statement
The original contributions presented in this study are included in the article/Supplementary Material. Further inquiries can be directed to the corresponding author.
Conflicts of Interest
The authors declare no conflicts of interest.
Abbreviations
The following abbreviations are used in this manuscript:
| ADF | acid detergent fiber |
| ADG | average daily gain |
| CP | crude protein |
| DM | dry matter |
| DMI | dry matter intake |
| EE | ether extract |
| FAP | fermented apple pomace |
| GH | growth hormone |
| GSH-Px | glutathione peroxidase |
| HO-1 | heme oxygenase-1 |
| IFN-γ | interferon-γ |
| IL-1β | interleukin-1β |
| IL-6 | interleukin-6 |
| IL-10 | interleukin-10 |
| Keap1 | Kelch-like ECH-associated protein 1 |
| MDA | malondialdehyde |
| NDF | neutral detergent fiber |
| NFC | non-fiber carbohydrates |
| NF-κB | nuclear factor kappa-light-chain-enhancer of activated B cells |
| NH₃-N | ammonia nitrogen |
| NQO1 | NAD(P)H:quinone oxidoreductase 1 |
| Nrf2 | nuclear factor erythroid 2-related factor 2 |
| SCC | somatic cell count |
| SCFA | short-chain fatty acids |
| SOD | superoxide dismutase |
| SSF | solid-state fermentation |
| T-AOC | total antioxidant capacity |
| TLR4 | Toll-like receptor 4 |
| TNF-α | tumor necrosis factor-α |
| TVFA | total volatile fatty acids |
| VFA | volatile fatty acids |
| ADF | acid detergent fiber |
Appendix A

Table A1.
Ingredient composition and inclusion levels of the total mixed ration (TMR) fed to dairy goats (% of DM).
Table A1.
Ingredient composition and inclusion levels of the total mixed ration (TMR) fed to dairy goats (% of DM).
| Items | Content (% of DM) |
| Concentrate mixture | |
| Corn | 21.8 |
| Soybean meal | 3.2 |
| Rapeseed meal | 2.4 |
| Peanut meal | 2.0 |
| Wheat bran | 8.6 |
| Dicalcium phosphate | 0.6 |
| Limestone | 0.4 |
| Salt | 0.4 |
| Sodium bicarbonate | 0.2 |
| Premix | 0.4 |
| Forage | |
| Alfalfa hay | 25.0 |
| Corn silage | 20.0 |
| Chinese wildrye hay | 15.0 |
| Total | 100.0 |
Note: Values are expressed as percentages of dietary dry matter (DM). The TMR was formulated with a concentrate-to-forage ratio of 40:60 on a DM basis; the concentrate mixture and forage accounted for 40% and 60% of dietary DM, respectively. Premix, vitamin–mineral premix. The composition of the vitamin–mineral premix is provided in Supplementary Table S1. Abbreviations: DM, dry matter; TMR, total mixed ration.
Table A2.
Primer sequences used for RT-qPCR analysis of interferon signaling, inflammatory pathways, and the Nrf2 antioxidant pathway.
Table A2.
Primer sequences used for RT-qPCR analysis of interferon signaling, inflammatory pathways, and the Nrf2 antioxidant pathway.
| Gene | Method | Forward primer (5′→3′) | Reverse primer (5′→3′) |
| IFN-γ | Real-time PCR | CCC TCT CTG GCT GTT ACT GC | CTC CTT TTC CGC TTC CTT AG |
| STAT1 | Real-time PCR | TGAGTTCCGACACCTGCAACTGAA | AGGTGGTCTCAAGGTCAATCACCA |
| IRF1 | Real-time PCR (RT-qPCR) | ACGGCTGGGACATCAACAAG | TCCTGCTTTGTATCGGCT |
| TLR4 | Real-time PCR | TCAGTGATTCGGTGGTCAGT | TCCTCATTCTGGCTCAGATA |
| NF-κB p65 | Real-time PCR | AGGCTTCTGGGCCTTATGTG | TGCTTCTCTCGCCAGGAATAC |
| TNF-α | Real-time PCR | GATCGGTCCCAACAAGGAG | CTTGTCACTCGAGTTTTGAGA |
| IL-1β | Real-time PCR | ACCTTCCAGGATGAGGACATGA | AACGTCACACACCAGCAGGTTA |
| IL-6 | Real-time PCR | GATACCACCCACAACAGACCA | CAGAATTGCCATTGCACAACTC |
| IL-10 | Real-time PCR | GCTGCCTTCAGTCAAGTGAAG | CTGACAAGGCTTGGCAACC |
| Keap1 | Real-time PCR | CTGGAGGATCATACCAAGCAGG | GGATACCCTCAATGGACACCAC |
| Nrf2 | Real-time PCR | CCCATGTAGGGCTGTGAT | TTGGCGGTTGTTAGGTC |
| HO-1 | Real-time PCR | TAGTTCATCCCAGACACCG | GGCCCAAGAAAAGAGAGCCA |
| NQO1 | Real-time PCR | CAGCGGCTCCATGTACT | GACCTGGAAGCCACAGAAG |
| GPx1 | Real-time PCR | ATAGAAGCCCTGCTGTCCAA | GAAACCGCCTTTCTTTAGGC |
| SOD1 | Real-time PCR | GCGGATGAAGAGAGGCATGTT | ACGGCCAATGATGGAATGCT |
| CAT | Real-time PCR | ACAACTCCCAGAAGCCTAAGAATG | GCTTTTCCCTTGGCAGCTATG |
| β-actin | Real-time PCR | TATCGGCAATGAGCGGTTCC | AGCACTGTGTTGGCATAGAGG |
References
- Chou, Y.C.; Cheng, K.C.; Hsieh, C.C.; Santoso, S.P.; Ku, W.L.; Lu, Y.H.; Lin, S.P. Fruit pomace-altered kombucha enables dual production of functional beverages and antimicrobial bacterial cellulose films. Int. J. Biol. Macromol. 2026, 378, 153789. [Google Scholar] [CrossRef] [PubMed]
- Rabeeah, I.; Gruber-Schmidt, V.; Murray, H.; Afsharzadeh, N.; Paltram, R.; Marinovic, S.; Zia, H.; Hutabarat, O.S.; Hofsommer, M.; Slatnar, A.; Schlosser, C.; Stich, K.; Halbwirth, H.; Gössinger, M.; Haselmair-Gosch, C. Apple Pomace as a Potential Source of Oxidative Stress-Protecting Dihydrochalcones. Insects 2022, 13, 639. [Google Scholar] [CrossRef] [PubMed]
- Thomas, F.; Abebe, G.; Emenike, C.; Martynenko, A. Sustainable utilization of apple pomace: Technological aspects and emerging applications. Food Res. Int. 2025, 220, 117149. [Google Scholar] [CrossRef] [PubMed]
- Măntăilă, S.; Balan, N.; Milea, Ș.A.; Nistor, O.V.; Andronoiu, D.G.; Mocanu, G.D.; Râpeanu, G.; Stănciuc, N. Apple Pomace as a Source of Valuable Phenolics: From Drying Kinetics to Optimization of Ultrasound-Assisted Extraction Using Conventional and Alternative Solvents. Antioxidants 2026, 15, 429. [Google Scholar] [CrossRef] [PubMed]
- Cui, Y.; Peng, S.; Deng, D.; Yu, M.; Tian, Z.; Song, M.; Luo, J.; Ma, X.; Ma, X. Solid-state fermentation improves the quality of chrysanthemum waste as an alternative feed ingredient. J. Environ. Manag. 2023, 330, 117060. [Google Scholar] [CrossRef] [PubMed]
- Zhang, Y.; Wei, R.; Azi, F.; Jiao, L.; Wang, H.; He, T.; Liu, X.; Wang, R.; Lu, B. Solid-state fermentation with Rhizopus oligosporus RT-3 enhanced the nutritional properties of soybeans. Front. Nutr. 2022, 9, 972860. [Google Scholar] [CrossRef] [PubMed]
- Behera, S.S.; Ray, R.C. Solid state fermentation for production of microbial cellulases: Recent advances and improvement strategies. Int. J. Biol. Macromol. 2016, 86, 656–669. [Google Scholar] [CrossRef] [PubMed]
- Wang, S.; Wang, Z.; Wang, N.; Wang, S.; Zeng, S.; Xu, Z.; Liu, D.; Zhao, X.; Liu, F.; Xu, J.; Cai, Y.; Ying, H. Efficient conversion of corn straw to feed protein through solid-state fermentation using a thermophilic microbial consortium. Waste Manag. 2025, 194, 298–308. [Google Scholar] [CrossRef] [PubMed]
- Zhang, Y.; Gu, Y.; Ren, H.; Wang, S.; Zhong, H.; Zhao, X.; Ma, J.; Gu, X.; Xue, Y.; Huang, S.; Yang, J.; Chen, L.; Chen, G.; Qu, S.; Liang, J.; Qin, L.; Huang, Q.; Peng, Y.; Li, Q.; Wang, X.; Kong, P.; Hou, G.; Gao, M.; Shi, Z.; Li, X.; Qiu, Y.; Zou, Y.; Yang, H.; Wang, J.; Xu, G.; Lai, S.; Li, J.; Ning, G.; Wang, W. Gut microbiome-related effects of berberine and probiotics on type 2 diabetes (the PREMOTE study). Nat. Commun. 2020, 11, 5015. [Google Scholar] [CrossRef] [PubMed]
- Wu, P.; Tian, L.; Zhou, X.Q.; Jiang, W.D.; Liu, Y.; Jiang, J.; Xie, F.; Kuang, S.Y.; Tang, L.; Tang, W.N.; Yang, J.; Zhang, Y.A.; Shi, H.Q.; Feng, L. Sodium butyrate enhanced physical barrier function referring to Nrf2, JNK and MLCK signaling pathways in the intestine of young grass carp (Ctenopharyngodon idella). Fish. Shellfish Immunol. 2018, 73, 121–132. [Google Scholar] [CrossRef] [PubMed]
- Chen, Y.; You, Y.; Wang, X.; Jin, Y.; Zeng, Y.; Pan, Z.; Li, D.; Ling, W. β-Hydroxybutyrate Alleviates Atherosclerotic Calcification by Inhibiting Endoplasmic Reticulum Stress-Mediated Apoptosis via AMPK/Nrf2 Pathway. Nutrients 2024, 17, 111. [Google Scholar] [CrossRef] [PubMed]
- Broderick, G.A.; Kang, J.H. Automated simultaneous determination of ammonia and total amino acids in ruminal fluid and in vitro media. J. Dairy Sci. 1980, 63, 64–75. [Google Scholar] [CrossRef]
- Wang, L.; Huang, J.; Li, Z.; Liu, D.; Fan, J. A review of the polyphenols extraction from apple pomace: novel technologies and techniques of cell disintegration. Crit. Rev. Food Sci. Nutr. 2023, 63, 9752–9765. [Google Scholar] [CrossRef] [PubMed]
- Gurev, A.; Cesko, T.; Dragancea, V.; Ghendov-Mosanu, A.; Pintea, A.; Sturza, R. Ultrasound-and Microwave-Assisted Extraction of Pectin from Apple Pomace and Its Effect on the Quality of Fruit Bars. Foods 2023, 12, 2773. [Google Scholar] [CrossRef] [PubMed]
- Liszkowska-Walisiak, W.; Motyl, I.; Płacheta-Kwiatkowska, B.; Wlaźlak, M.; Ruman, T.; Nizioł, J.; Wilkowska, A.; Maher, A.; Berłowska, J. Apple Pomace Fermented with Non-Saccharomyces Yeast as a Factor Modulating Gut Microbiota. Int. J. Mol. Sci. 2026, 27, 2960. [Google Scholar] [CrossRef] [PubMed]
- Wang, Z.; Tang, H.; Li, Y.; Tian, L.; Ye, B.; Yan, W.; Liu, G.; Yang, Y. Evaluating the dynamic effects of complex probiotics as cellulase replacements during fermentation of apple pomace. Int. J. Food Microbiol. 2024, 425, 110896. [Google Scholar] [CrossRef] [PubMed]
- Pollini, L.; Blasi, F.; Ianni, F.; Grispoldi, L.; Moretti, S.; Di Veroli, A.; Cossignani, L.; Cenci-Goga, B.T. Ultrasound-Assisted Extraction and Characterization of Polyphenols from Apple Pomace, Functional Ingredients for Beef Burger Fortification. Molecules 2022, 27, 1933. [Google Scholar] [CrossRef] [PubMed]
- Wysocki, K.; Matin, M.; Koszarska, M.; Tomasik, C.; Zima-Kulisiewicz, B.; Strzałkowska, N. Apple Pomace as a Promising By-Product with High Antioxidant Potential in the Prevention of Aging Processes. Foods 2026, 15, 1174. [Google Scholar] [CrossRef] [PubMed]
- Papadopoulou, D.; Chrysikopoulou, V.; Rampaouni, A.; Plakidis, C.; Ofrydopoulou, A.; Shiels, K.; Saha, S.K.; Tsoupras, A. Antioxidant, Antithrombotic and Anti-Inflammatory Properties of Amphiphilic Bioactives from Water Kefir Grains and Its Apple Pomace-Based Fermented Beverage. Antioxidants 2025, 14, 164. [Google Scholar] [CrossRef] [PubMed]
- Barry, S.T.; Gabrilovich, D.I.; Sansom, O.J.; Campbell, A.D.; Morton, J.P. Therapeutic targeting of tumour myeloid cells. Nat. Rev. Cancer 2023, 23, 216–237. [Google Scholar] [CrossRef] [PubMed]
- Cressman, D.E.; Greenbaum, L.E.; DeAngelis, R.A.; Ciliberto, G.; Furth, E.E.; Poli, V.; Taub, R. Liver failure and defective hepatocyte regeneration in interleukin-6-deficient mice. Science 1996, 274, 1379–1383. [Google Scholar] [CrossRef] [PubMed]
- Ozaki, M. Cellular and molecular mechanisms of liver regeneration: Proliferation, growth, death and protection of hepatocytes. Semin. Cell Dev. Biol. 2020, 100, 62–73. [Google Scholar] [CrossRef] [PubMed]
- Kumari, N.; Dwarakanath, B.S.; Das, A.; Bhatt, A.N. Role of interleukin-6 in cancer progression and therapeutic resistance. Tumour Biol. 2016, 37, 11553–11572. [Google Scholar] [CrossRef] [PubMed]
- Campana, L.; Starkey Lewis, P.J.; Pellicoro, A.; Aucott, R.L.; Man, J.; O'Duibhir, E.; Mok, S.E.; Ferreira-Gonzalez, S.; Livingstone, E.; Greenhalgh, S.N.; Hull, K.L.; Kendall, T.J.; Vernimmen, D.; Henderson, N.C.; Boulter, L.; Gregory, C.D.; Feng, Y.; Anderton, S.M.; Forbes, S.J.; Iredale, J.P. The STAT3-IL-10-IL-6 Pathway Is a Novel Regulator of Macrophage Efferocytosis and Phenotypic Conversion in Sterile Liver Injury. J. Immunol. 2018, 200, 1169–1187. [Google Scholar] [CrossRef] [PubMed]
- Shi, J.; Mao, W.; Song, Y.; Wang, Y.; Zhang, L.; Xu, Y.; Gu, H.; Yao, S.; Yao, Y.; Liu, Z.; Raghavan, V.; Wang, J. Butyrate alleviates food allergy by improving intestinal barrier integrity through suppressing oxidative stress-mediated Notch signaling. Imeta 2025, 4, e70024. [Google Scholar] [CrossRef] [PubMed]
- González-Bosch, C.; Boorman, E.; Zunszain, P.A.; Mann, G.E. Short-chain fatty acids as modulators of redox signaling in health and disease. Redox Biol. 2021, 47, 102165. [Google Scholar] [CrossRef] [PubMed]
- Kasai, S.; Shimizu, S.; Tatara, Y.; Mimura, J.; Itoh, K. Regulation of Nrf2 by Mitochondrial Reactive Oxygen Species in Physiology and Pathology. Biomolecules 2020, 10, 320. [Google Scholar] [CrossRef] [PubMed]
- Cao, S.; Tai, Y.; Li, S.; Liu, X.; Zheng, Y.; Han, J.; Chen, W.; Han, J.; Zuo, H.X.; Li, M.Y.; Xing, Y.; Zhang, G.; Jin, X.; Ma, J. Network pharmacology and metabolomics reveal Jingfang Granules alleviates DSS-induced colitis via the NF-kappaB/NLRP3/IL-6/STAT3 pathway. Phytomedicine 2026, 150, 157745. [Google Scholar] [CrossRef] [PubMed]
- Dong, X.; Wang, Y.; Zhu, X.; Shen, L.; Chen, L.; Niu, L.; Gan, M.; Zhang, S.; Zhang, M.; Jiang, J.; Chen, D.; Zhu, L.; Zhao, Y. Sodium butyrate protects against rotavirus-induced intestinal epithelial barrier damage by activating AMPK-Nrf2 signaling pathway in IPEC-J2 cells. Int. J. Biol. Macromol. 2023, 228, 186–196. [Google Scholar] [CrossRef] [PubMed]
- Holt, D.A.; Corsato Alvarenga, I.; Donadelli, R.A.; Aldrich, C.G. Substrate degradation and postbiotic analysis of alternative fiber ingredients fermented using an in vitro canine fecal inoculum model. J. Anim. Sci. 2023, 101, skad078. [Google Scholar] [CrossRef] [PubMed]
Figure 1.
Composition of the basal diet (0% FAP) for lactating dairy goats (% of dry matter). The basal diet was formulated with a concentrate-to-forage ratio of 40:60 on a dry matter basis. Values are expressed as percentages of total dietary dry matter. The concentrate mixture included corn, soybean meal, rapeseed meal, peanut meal, wheat bran, dicalcium phosphate, limestone, salt, sodium bicarbonate, and premix; the forage portion comprised alfalfa hay, corn silage, and Chinese wildrye hay. FAP, fermented apple pomace.
Figure 1.
Composition of the basal diet (0% FAP) for lactating dairy goats (% of dry matter). The basal diet was formulated with a concentrate-to-forage ratio of 40:60 on a dry matter basis. Values are expressed as percentages of total dietary dry matter. The concentrate mixture included corn, soybean meal, rapeseed meal, peanut meal, wheat bran, dicalcium phosphate, limestone, salt, sodium bicarbonate, and premix; the forage portion comprised alfalfa hay, corn silage, and Chinese wildrye hay. FAP, fermented apple pomace.
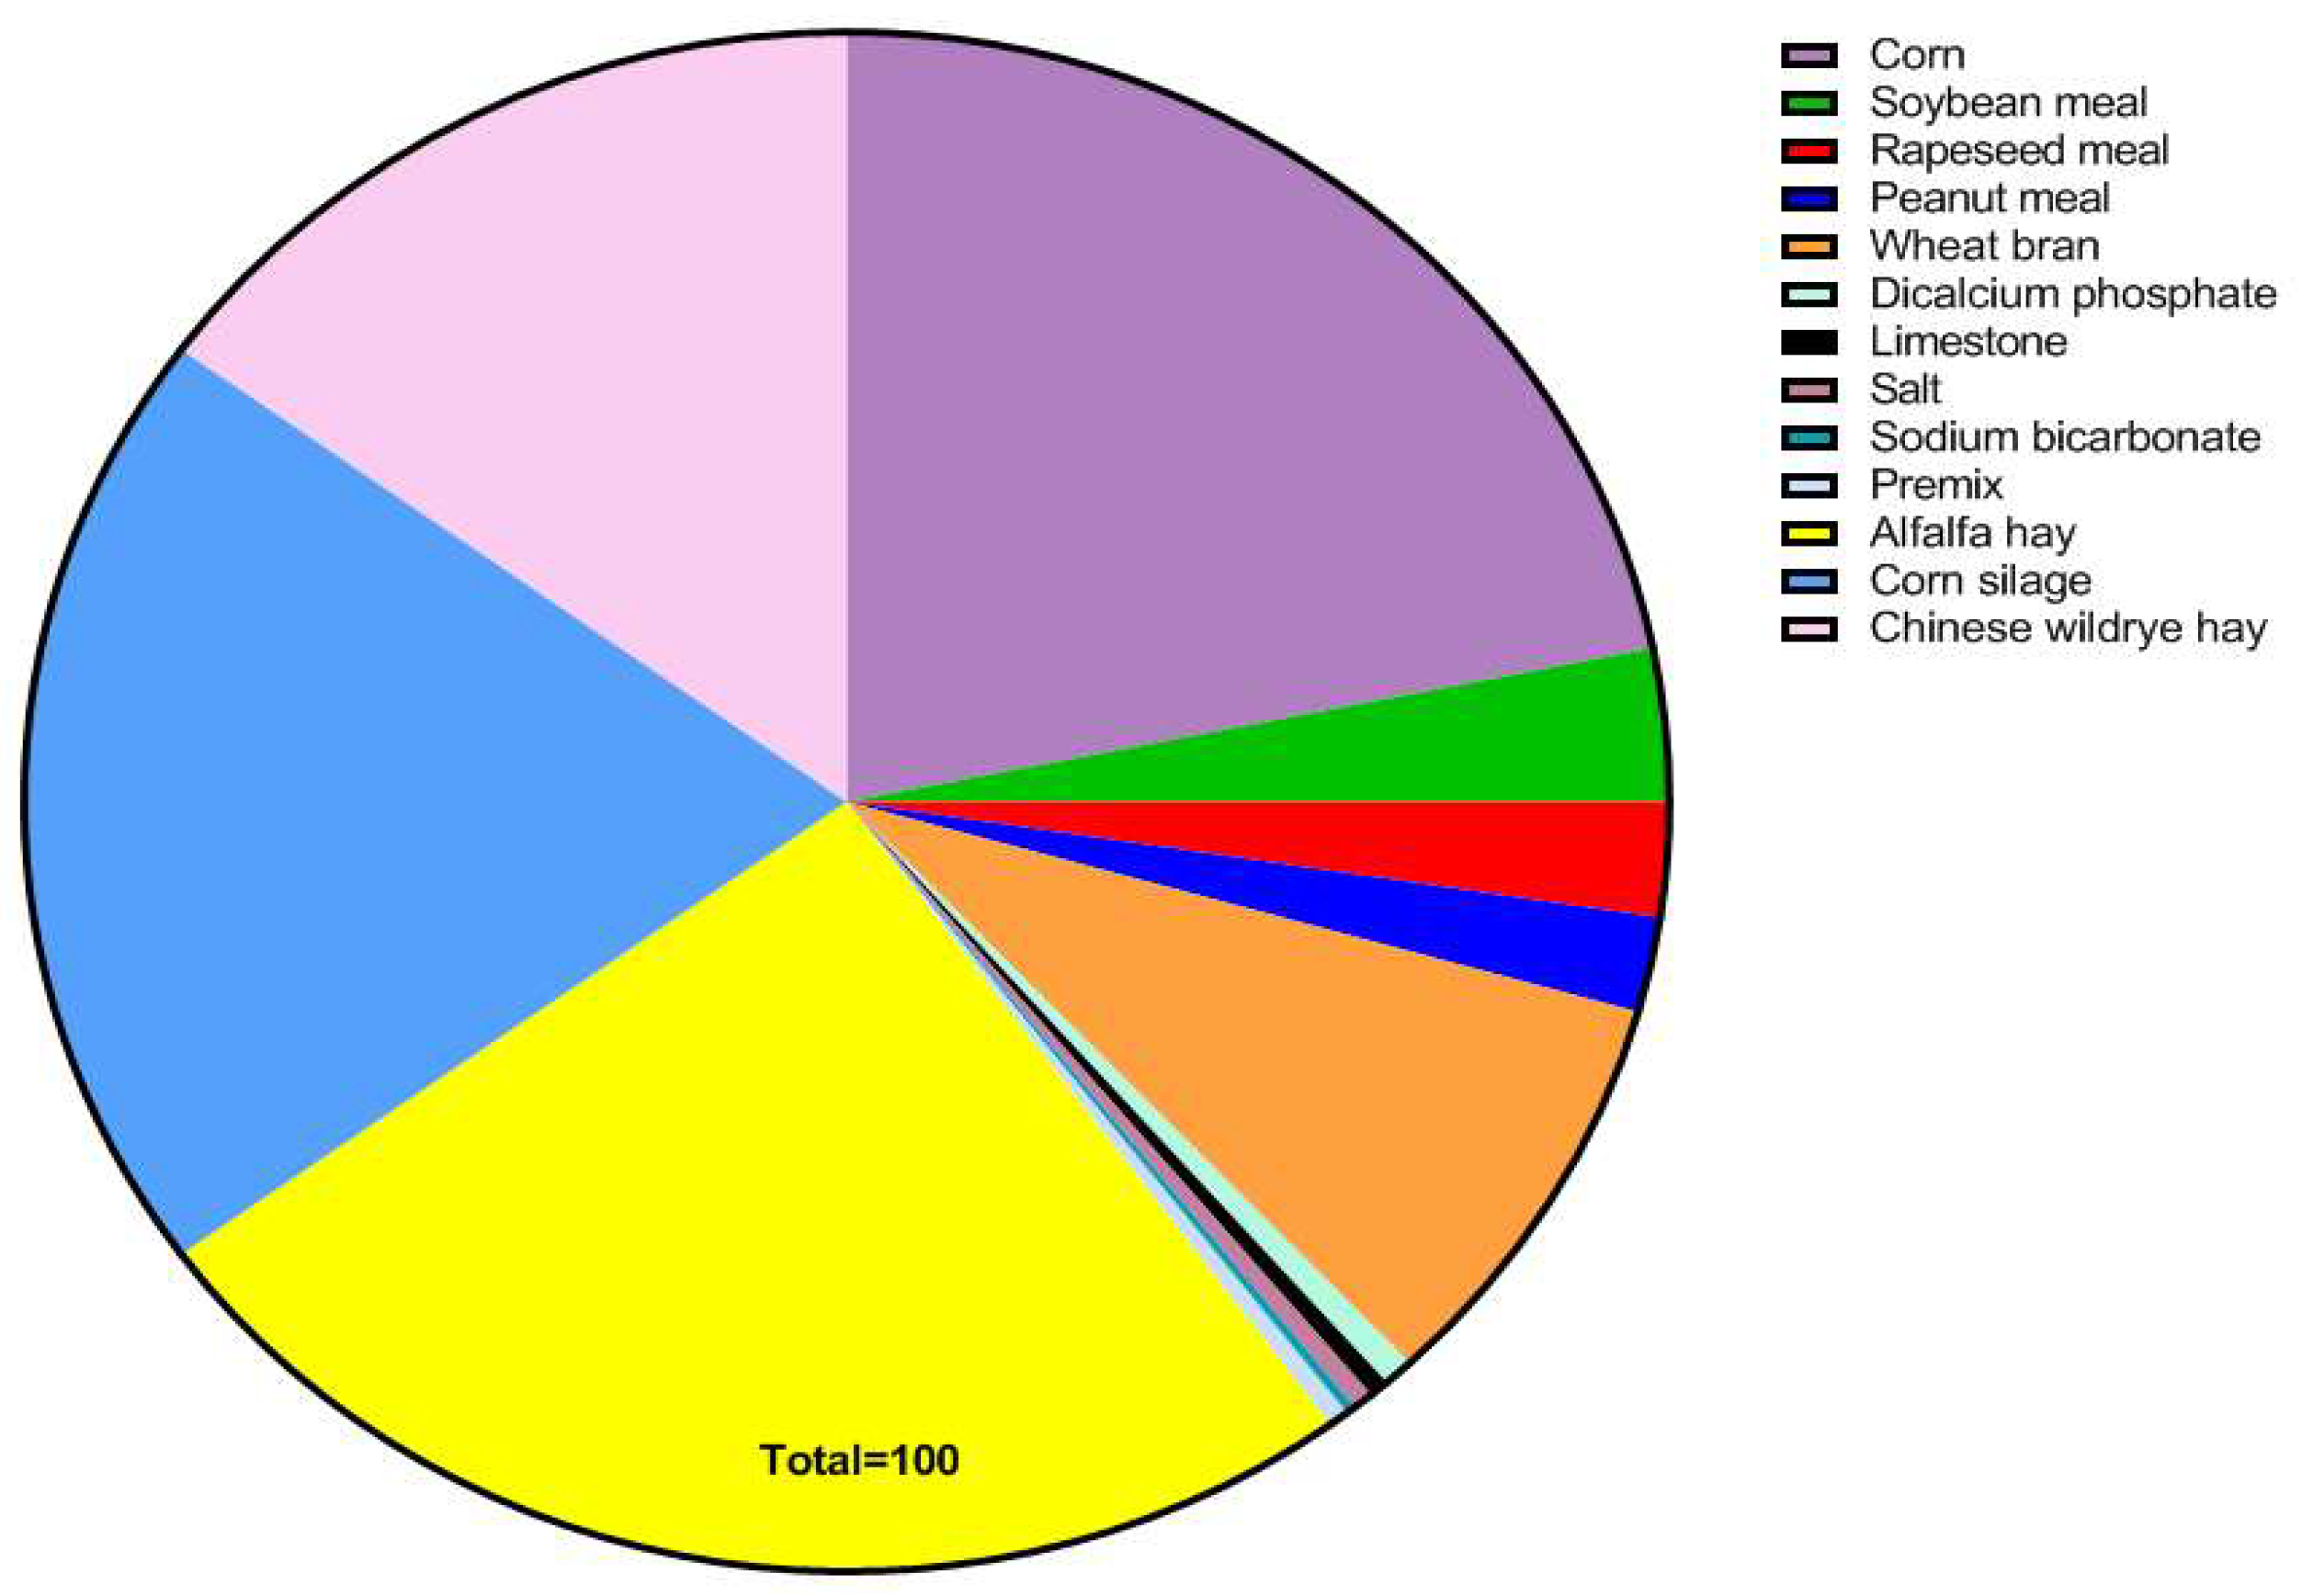
Figure 2.
Amino acid profile of raw apple pomace.
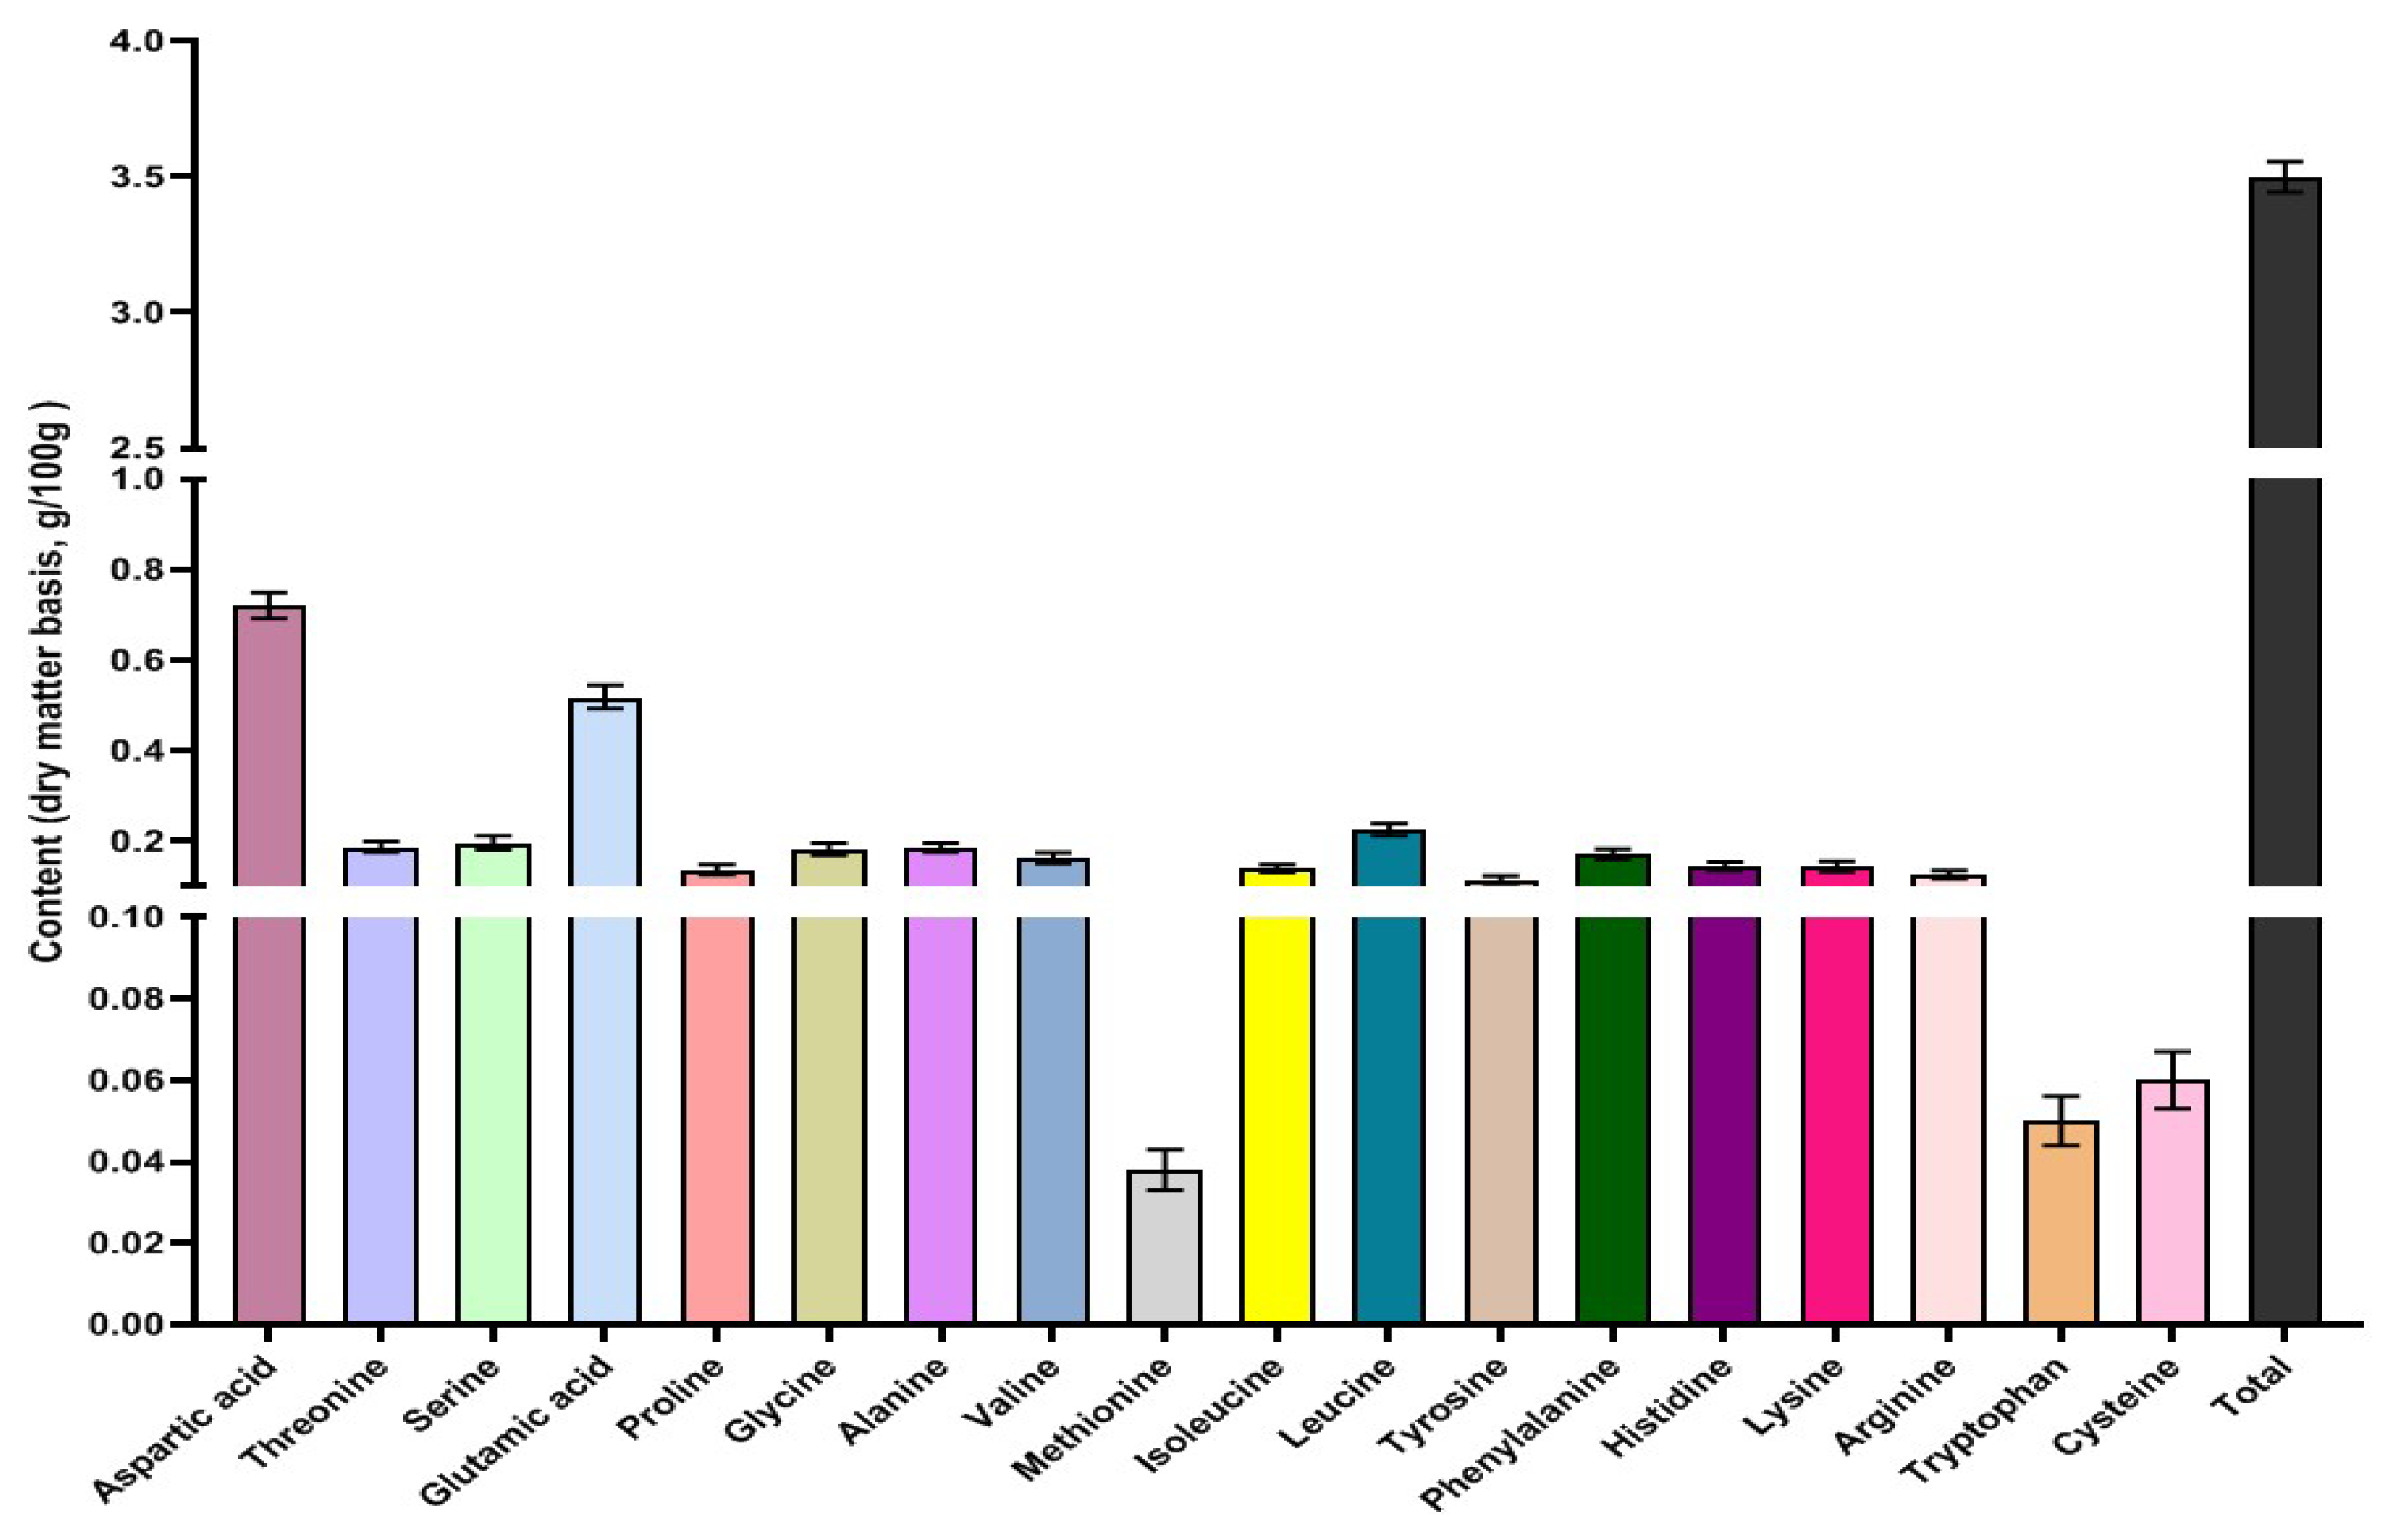
Figure 3.
Effects of graded levels of fermented apple pomace (FAP) on the conventional nutrient composition (A) and amino acid profile (B) of the experimental diets. (A) The x-axis represents the dietary inclusion levels of FAP (Control [basal diet], 5%, 10%, 15%, and 20%). The y-axis represents the nutrient contents. Data points are presented as means ± standard deviation (SD) (n = 6). (B) The horizontal bar chart displays the amino acid contents of the experimental diets. The color-coded bars represent the different dietary treatments: Basal Diet (Control), 5% FAP, 10% FAP, 15% FAP, and 20% FAP. Values are expressed as g/100 g of diet on a dry matter basis. Abbreviations: FAP, fermented apple pomace; DM, dry matter; CP, crude protein; NDF, neutral detergent fiber; ADF, acid detergent fiber; EE, ether extract; NFC, non-fiber carbohydrates; Ca, calcium; P, phosphorus; AA, amino acid.
Figure 3.
Effects of graded levels of fermented apple pomace (FAP) on the conventional nutrient composition (A) and amino acid profile (B) of the experimental diets. (A) The x-axis represents the dietary inclusion levels of FAP (Control [basal diet], 5%, 10%, 15%, and 20%). The y-axis represents the nutrient contents. Data points are presented as means ± standard deviation (SD) (n = 6). (B) The horizontal bar chart displays the amino acid contents of the experimental diets. The color-coded bars represent the different dietary treatments: Basal Diet (Control), 5% FAP, 10% FAP, 15% FAP, and 20% FAP. Values are expressed as g/100 g of diet on a dry matter basis. Abbreviations: FAP, fermented apple pomace; DM, dry matter; CP, crude protein; NDF, neutral detergent fiber; ADF, acid detergent fiber; EE, ether extract; NFC, non-fiber carbohydrates; Ca, calcium; P, phosphorus; AA, amino acid.
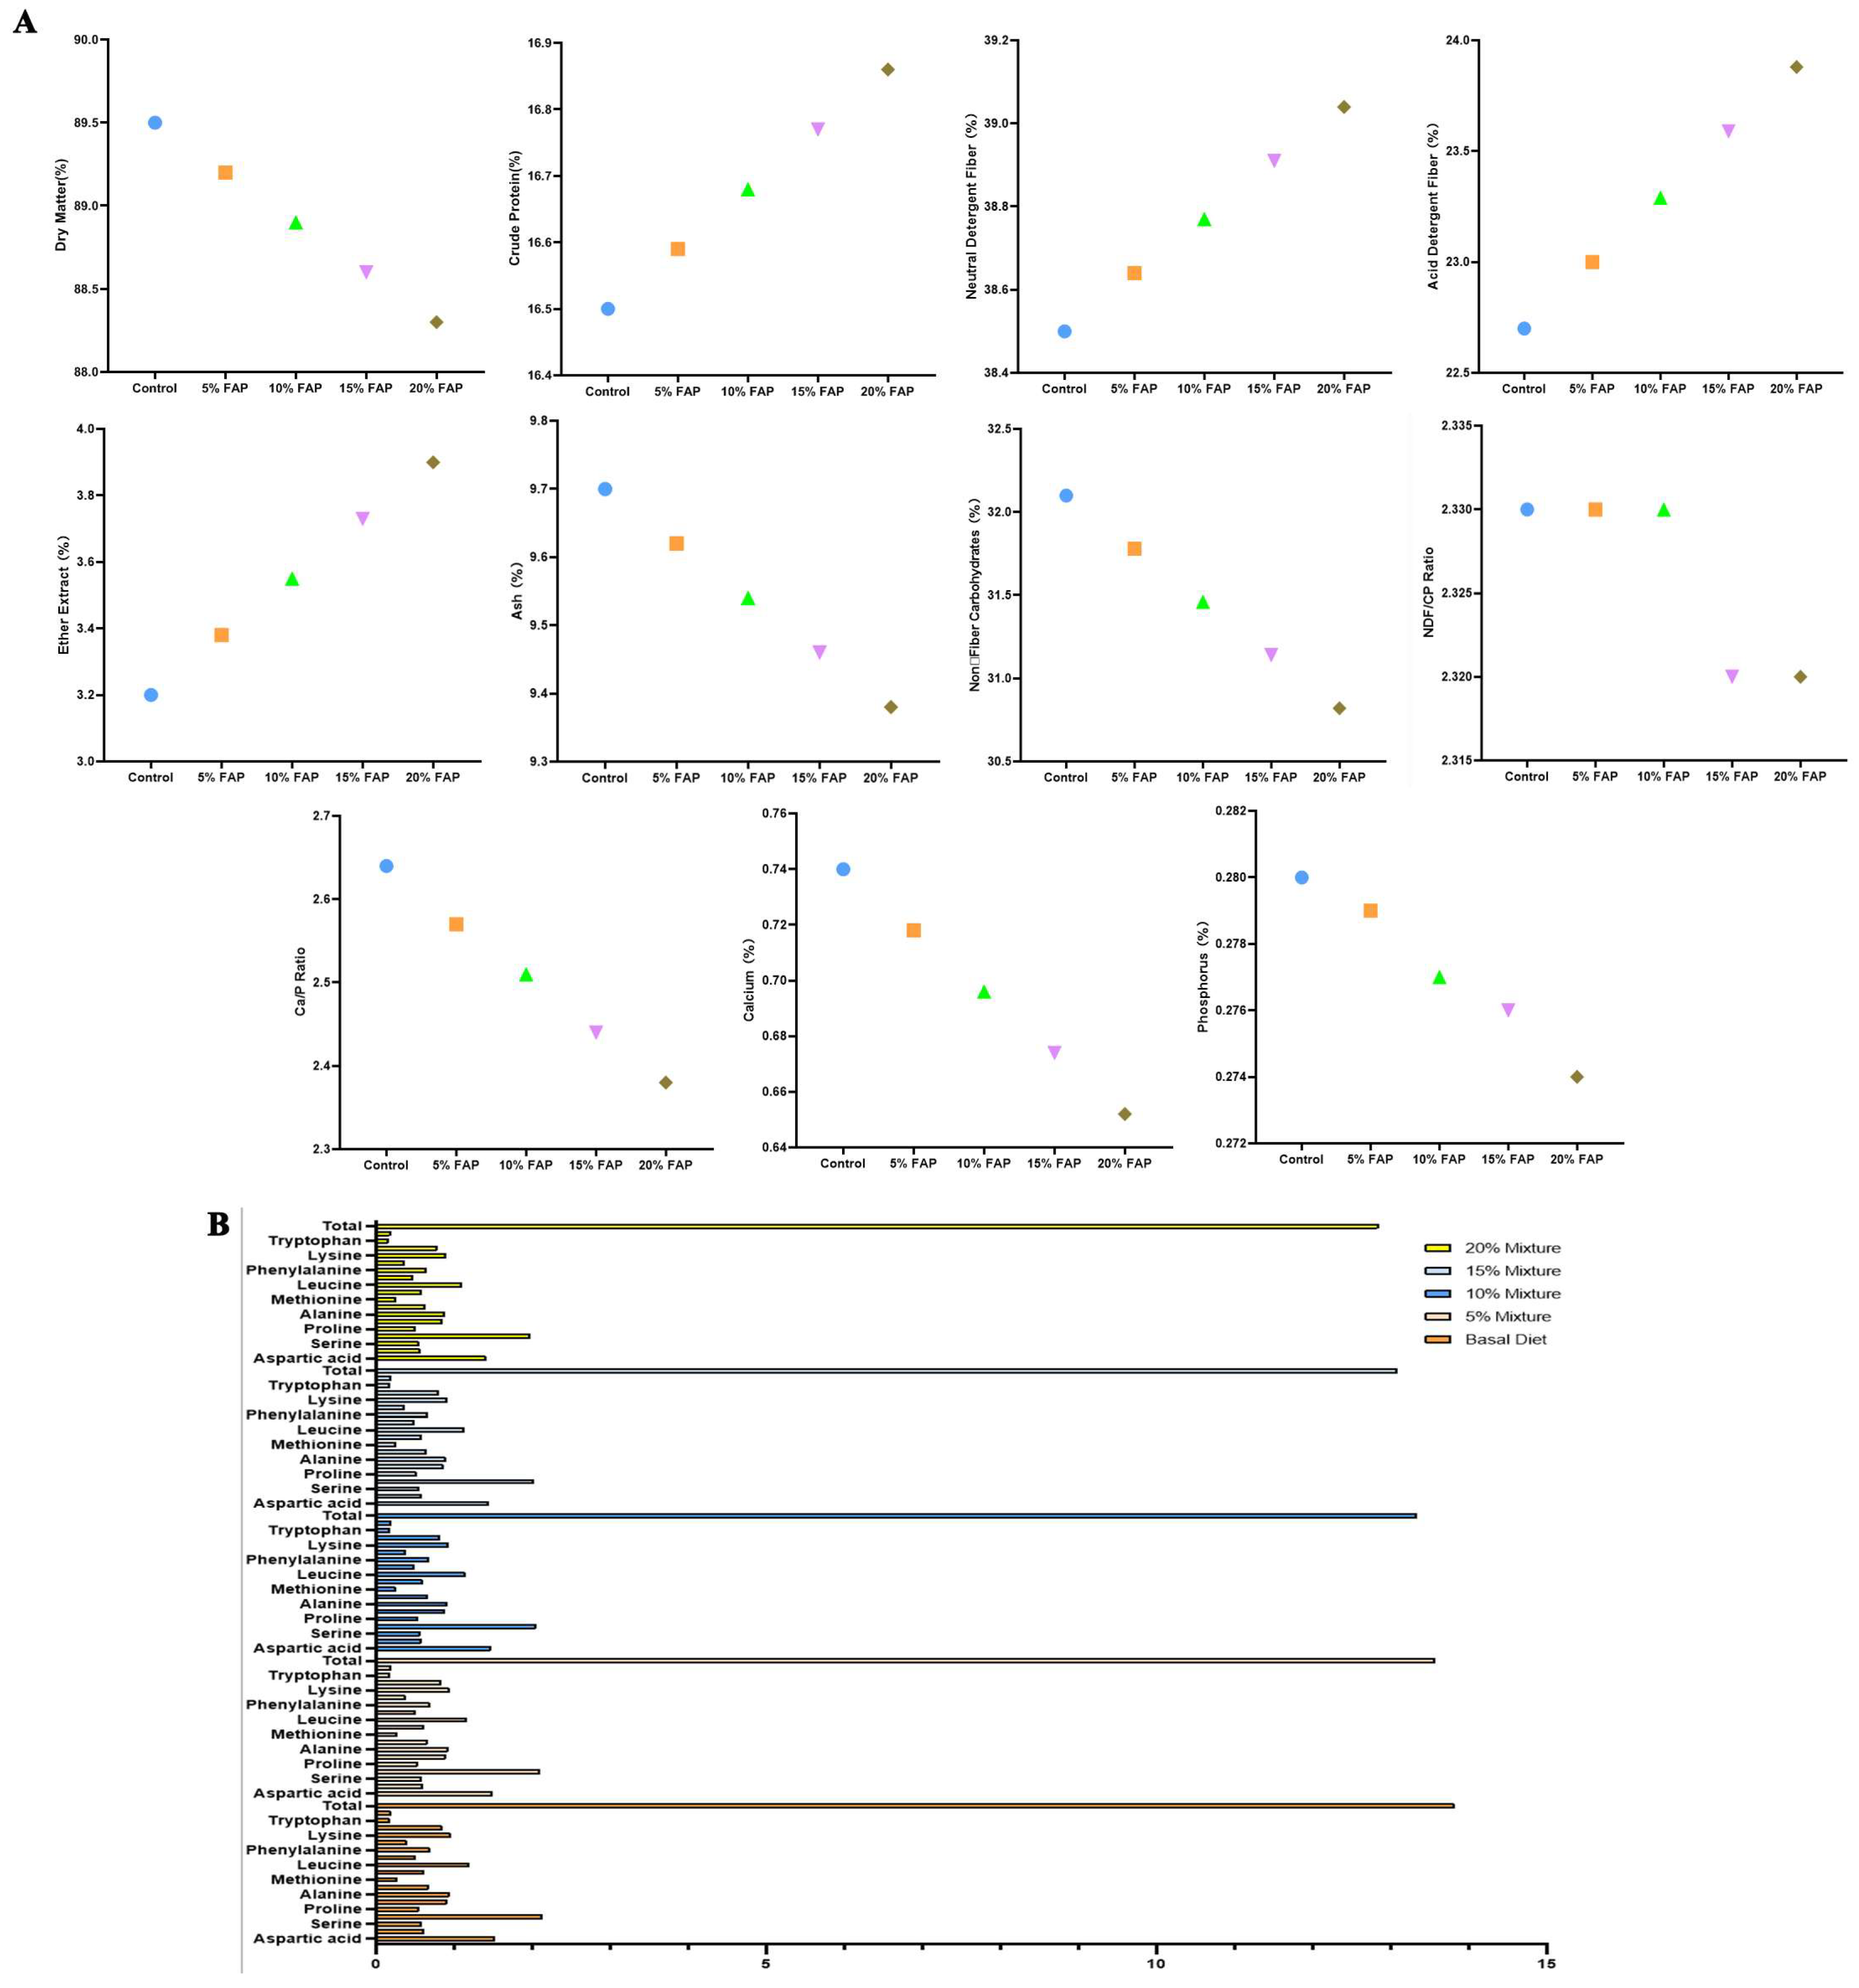
Figure 4.
Effects of graded levels of fermented apple pomace (FAP) supplementation on lactating dairy goats. (A) Growth performance (initial body weight, final body weight, average daily gain, dry matter intake, milk yield, and feed-to-milk ratio) and milk quality (milk fat, milk protein, and somatic cell count). Data are presented as mean ± standard deviation (n = 6). (B) Serum metabolic, biochemical, and hormonal indices (total protein, albumin, blood urea nitrogen, glucose, triglycerides, total cholesterol, insulin, T3, T4, and growth hormone). Values are expressed as a percentage relative to the control (0% FAP) group. (C) Rumen fermentation parameters (pH, total VFA, ammonia-N, acetate, propionate, butyrate, and acetate-to-propionate ratio). Statistical notes: For panels A and C (pH, total VFA, and ammonia-N), data were analyzed using one-way ANOVA followed by Tukey’s HSD post-hoc test. Asterisks indicate significant differences compared to the control group: *P < 0.05, **P < 0.01, ***P < 0.001, ****P < 0.0001. For the acetate, propionate, butyrate, and acetate-to-propionate ratio in panel C, values were determined from pooled rumen fluid samples (equal volumes from six goats per group) and are therefore single measurements without statistical replication; no significance markers are shown (ND, not determined). Detailed statistical results and polynomial contrasts are provided in Supplementary Tables S7, S8, and S9.
Figure 4.
Effects of graded levels of fermented apple pomace (FAP) supplementation on lactating dairy goats. (A) Growth performance (initial body weight, final body weight, average daily gain, dry matter intake, milk yield, and feed-to-milk ratio) and milk quality (milk fat, milk protein, and somatic cell count). Data are presented as mean ± standard deviation (n = 6). (B) Serum metabolic, biochemical, and hormonal indices (total protein, albumin, blood urea nitrogen, glucose, triglycerides, total cholesterol, insulin, T3, T4, and growth hormone). Values are expressed as a percentage relative to the control (0% FAP) group. (C) Rumen fermentation parameters (pH, total VFA, ammonia-N, acetate, propionate, butyrate, and acetate-to-propionate ratio). Statistical notes: For panels A and C (pH, total VFA, and ammonia-N), data were analyzed using one-way ANOVA followed by Tukey’s HSD post-hoc test. Asterisks indicate significant differences compared to the control group: *P < 0.05, **P < 0.01, ***P < 0.001, ****P < 0.0001. For the acetate, propionate, butyrate, and acetate-to-propionate ratio in panel C, values were determined from pooled rumen fluid samples (equal volumes from six goats per group) and are therefore single measurements without statistical replication; no significance markers are shown (ND, not determined). Detailed statistical results and polynomial contrasts are provided in Supplementary Tables S7, S8, and S9.
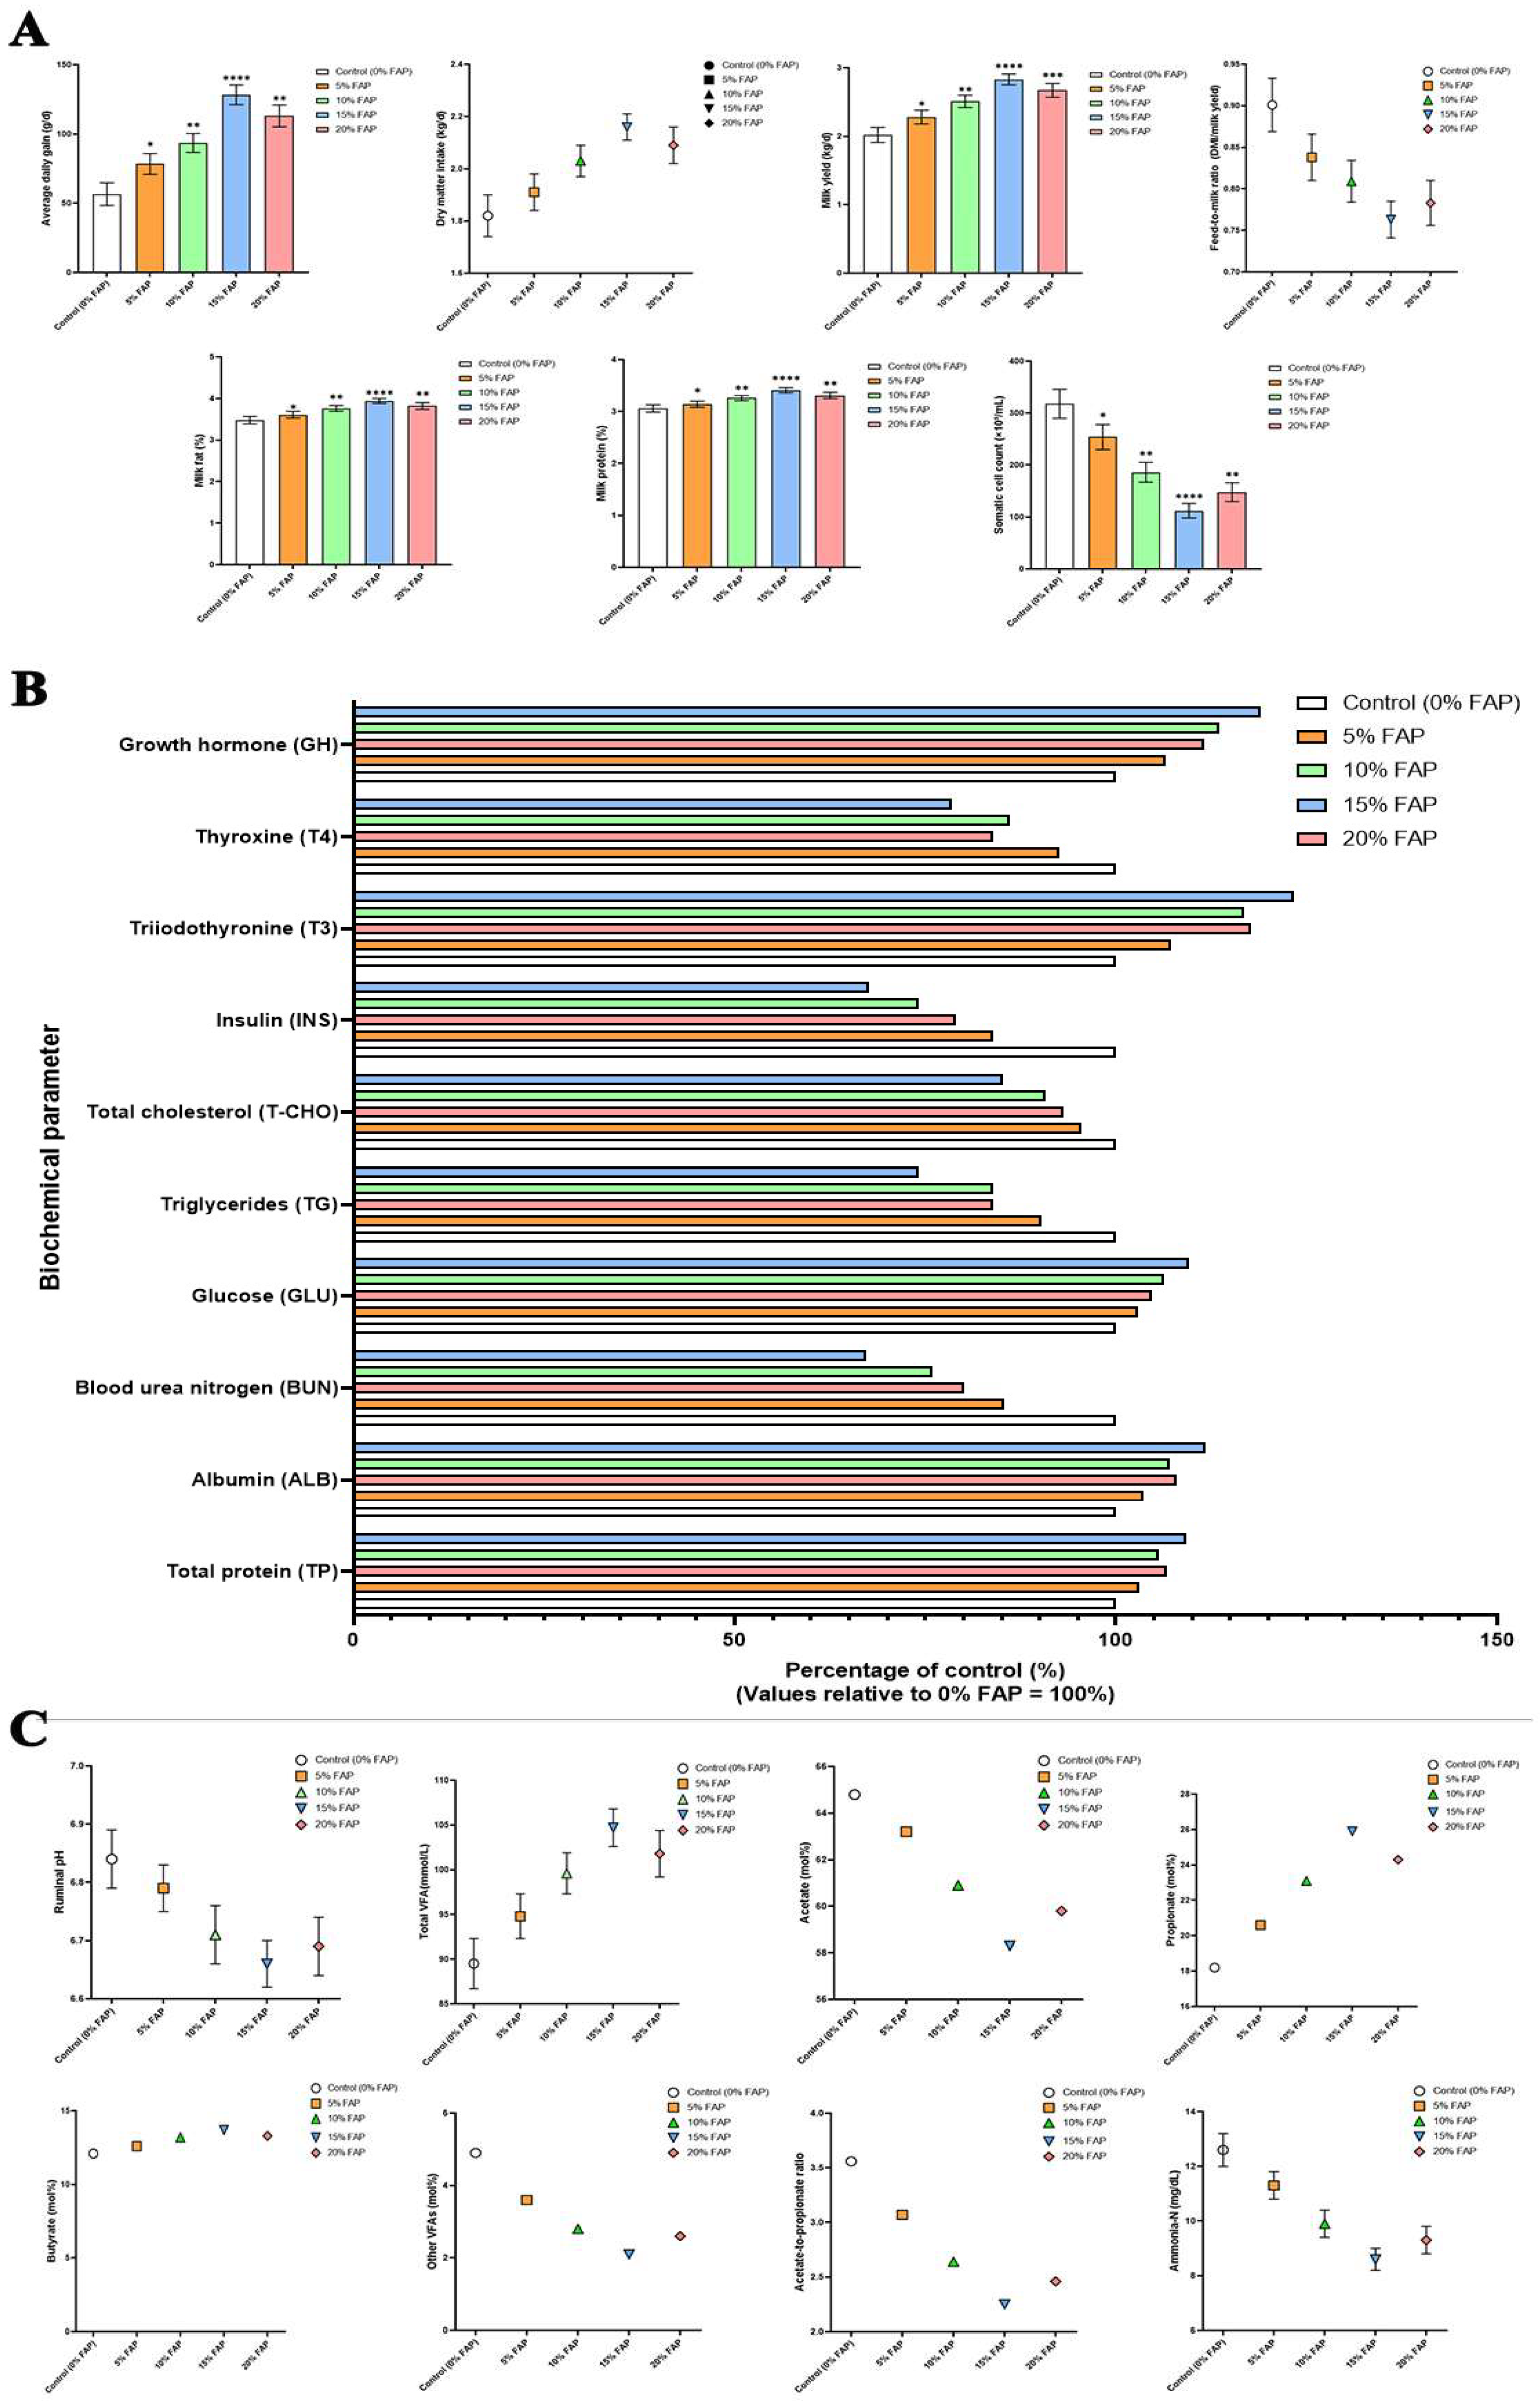
Figure 5.
Effects of fermented apple pomace (FAP) supplementation on serum antioxidant parameters in rats. Values are presented as mean ± standard deviation (n = 10 per group). *P < 0.05, **P < 0.01, ***P < 0.001, ****P < 0.0001 vs. the control group (0% FAP) (one-way ANOVA followed by Dunnett's post-hoc test). T-AOC, total antioxidant capacity; SOD, superoxide dismutase; GSH-Px, glutathione peroxidase; MDA, malondialdehyde.
Figure 5.
Effects of fermented apple pomace (FAP) supplementation on serum antioxidant parameters in rats. Values are presented as mean ± standard deviation (n = 10 per group). *P < 0.05, **P < 0.01, ***P < 0.001, ****P < 0.0001 vs. the control group (0% FAP) (one-way ANOVA followed by Dunnett's post-hoc test). T-AOC, total antioxidant capacity; SOD, superoxide dismutase; GSH-Px, glutathione peroxidase; MDA, malondialdehyde.
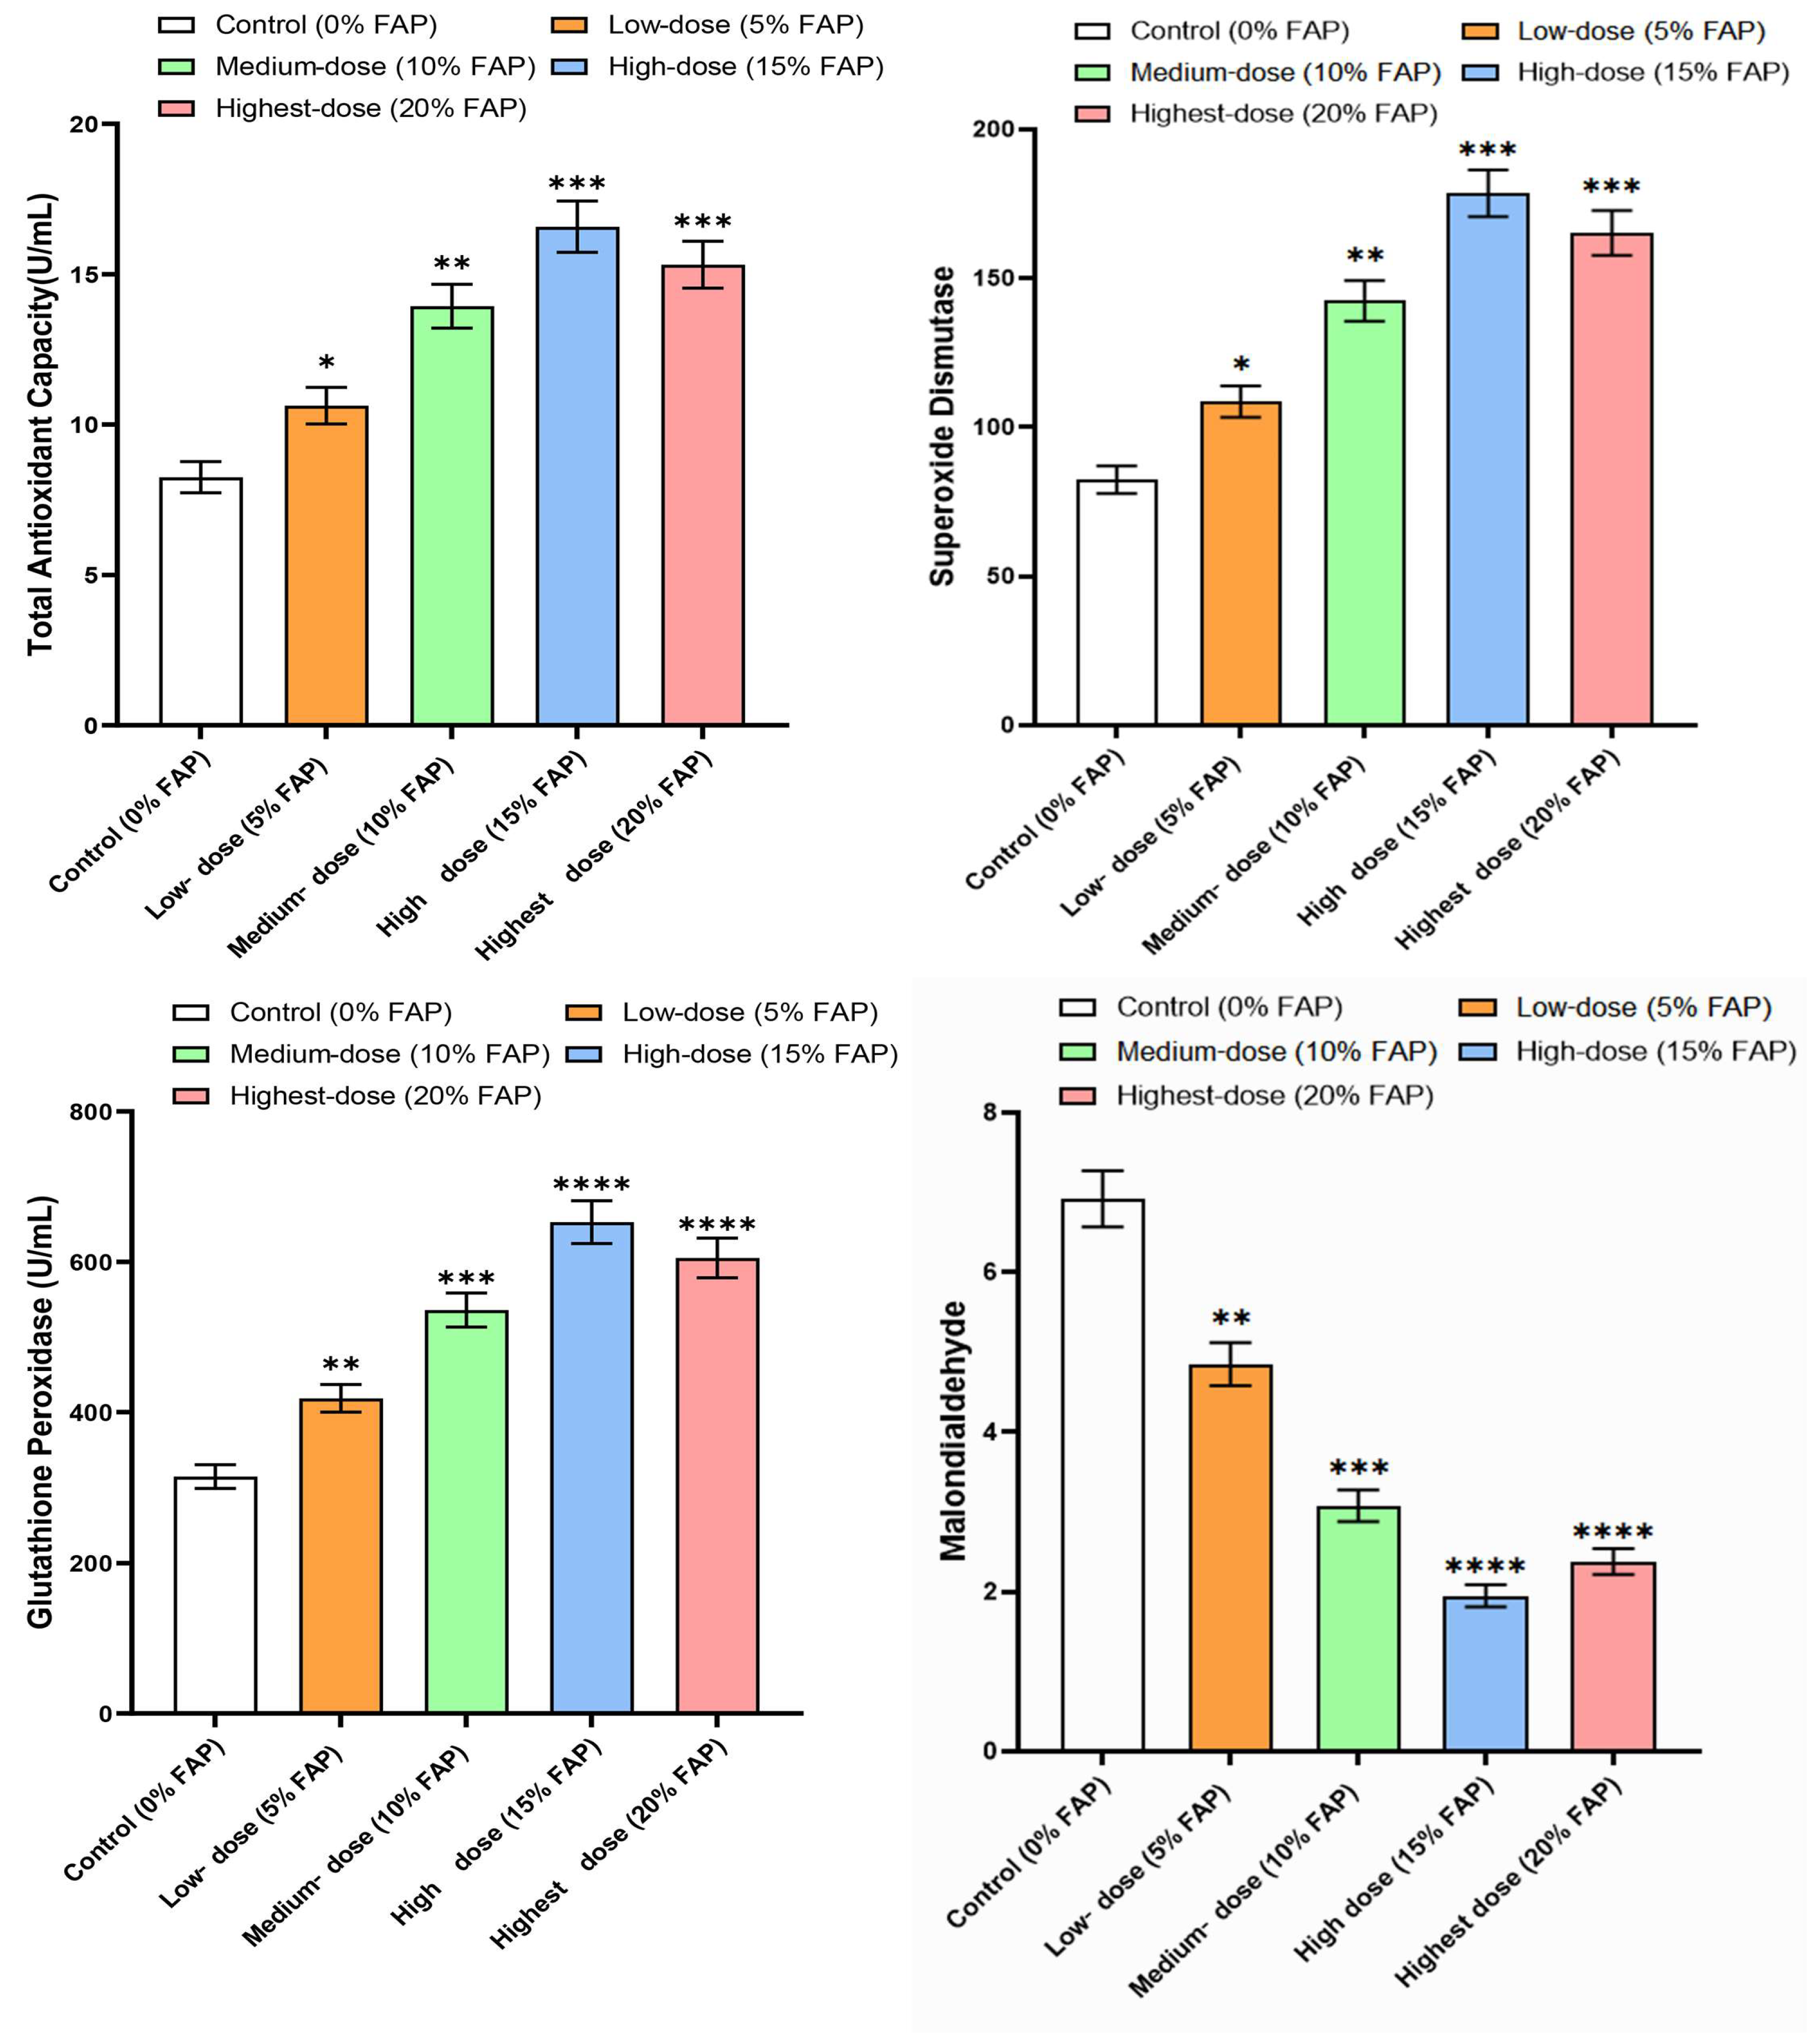
Figure 6.
Multilevel (transcription–translation–secretion) integrative regulation of interferon signaling, classical inflammatory, and Nrf2 antioxidant pathways by fermented apple pomace (FAP) and dose-dependent validation. (A) qPCR analysis of gene expression. (B) Western blot bands and densitometric quantification. (C) ELISA analysis of serum cytokine levels. Values are presented as mean ± standard deviation (n = 6 for qPCR and ELISA; n = 3 for Western blot). *P < 0.05, **P < 0.01, ***P < 0.001, ****P < 0.0001 vs. the control group (0% FAP) (one-way ANOVA followed by Dunnett's post-hoc test).
Figure 6.
Multilevel (transcription–translation–secretion) integrative regulation of interferon signaling, classical inflammatory, and Nrf2 antioxidant pathways by fermented apple pomace (FAP) and dose-dependent validation. (A) qPCR analysis of gene expression. (B) Western blot bands and densitometric quantification. (C) ELISA analysis of serum cytokine levels. Values are presented as mean ± standard deviation (n = 6 for qPCR and ELISA; n = 3 for Western blot). *P < 0.05, **P < 0.01, ***P < 0.001, ****P < 0.0001 vs. the control group (0% FAP) (one-way ANOVA followed by Dunnett's post-hoc test).
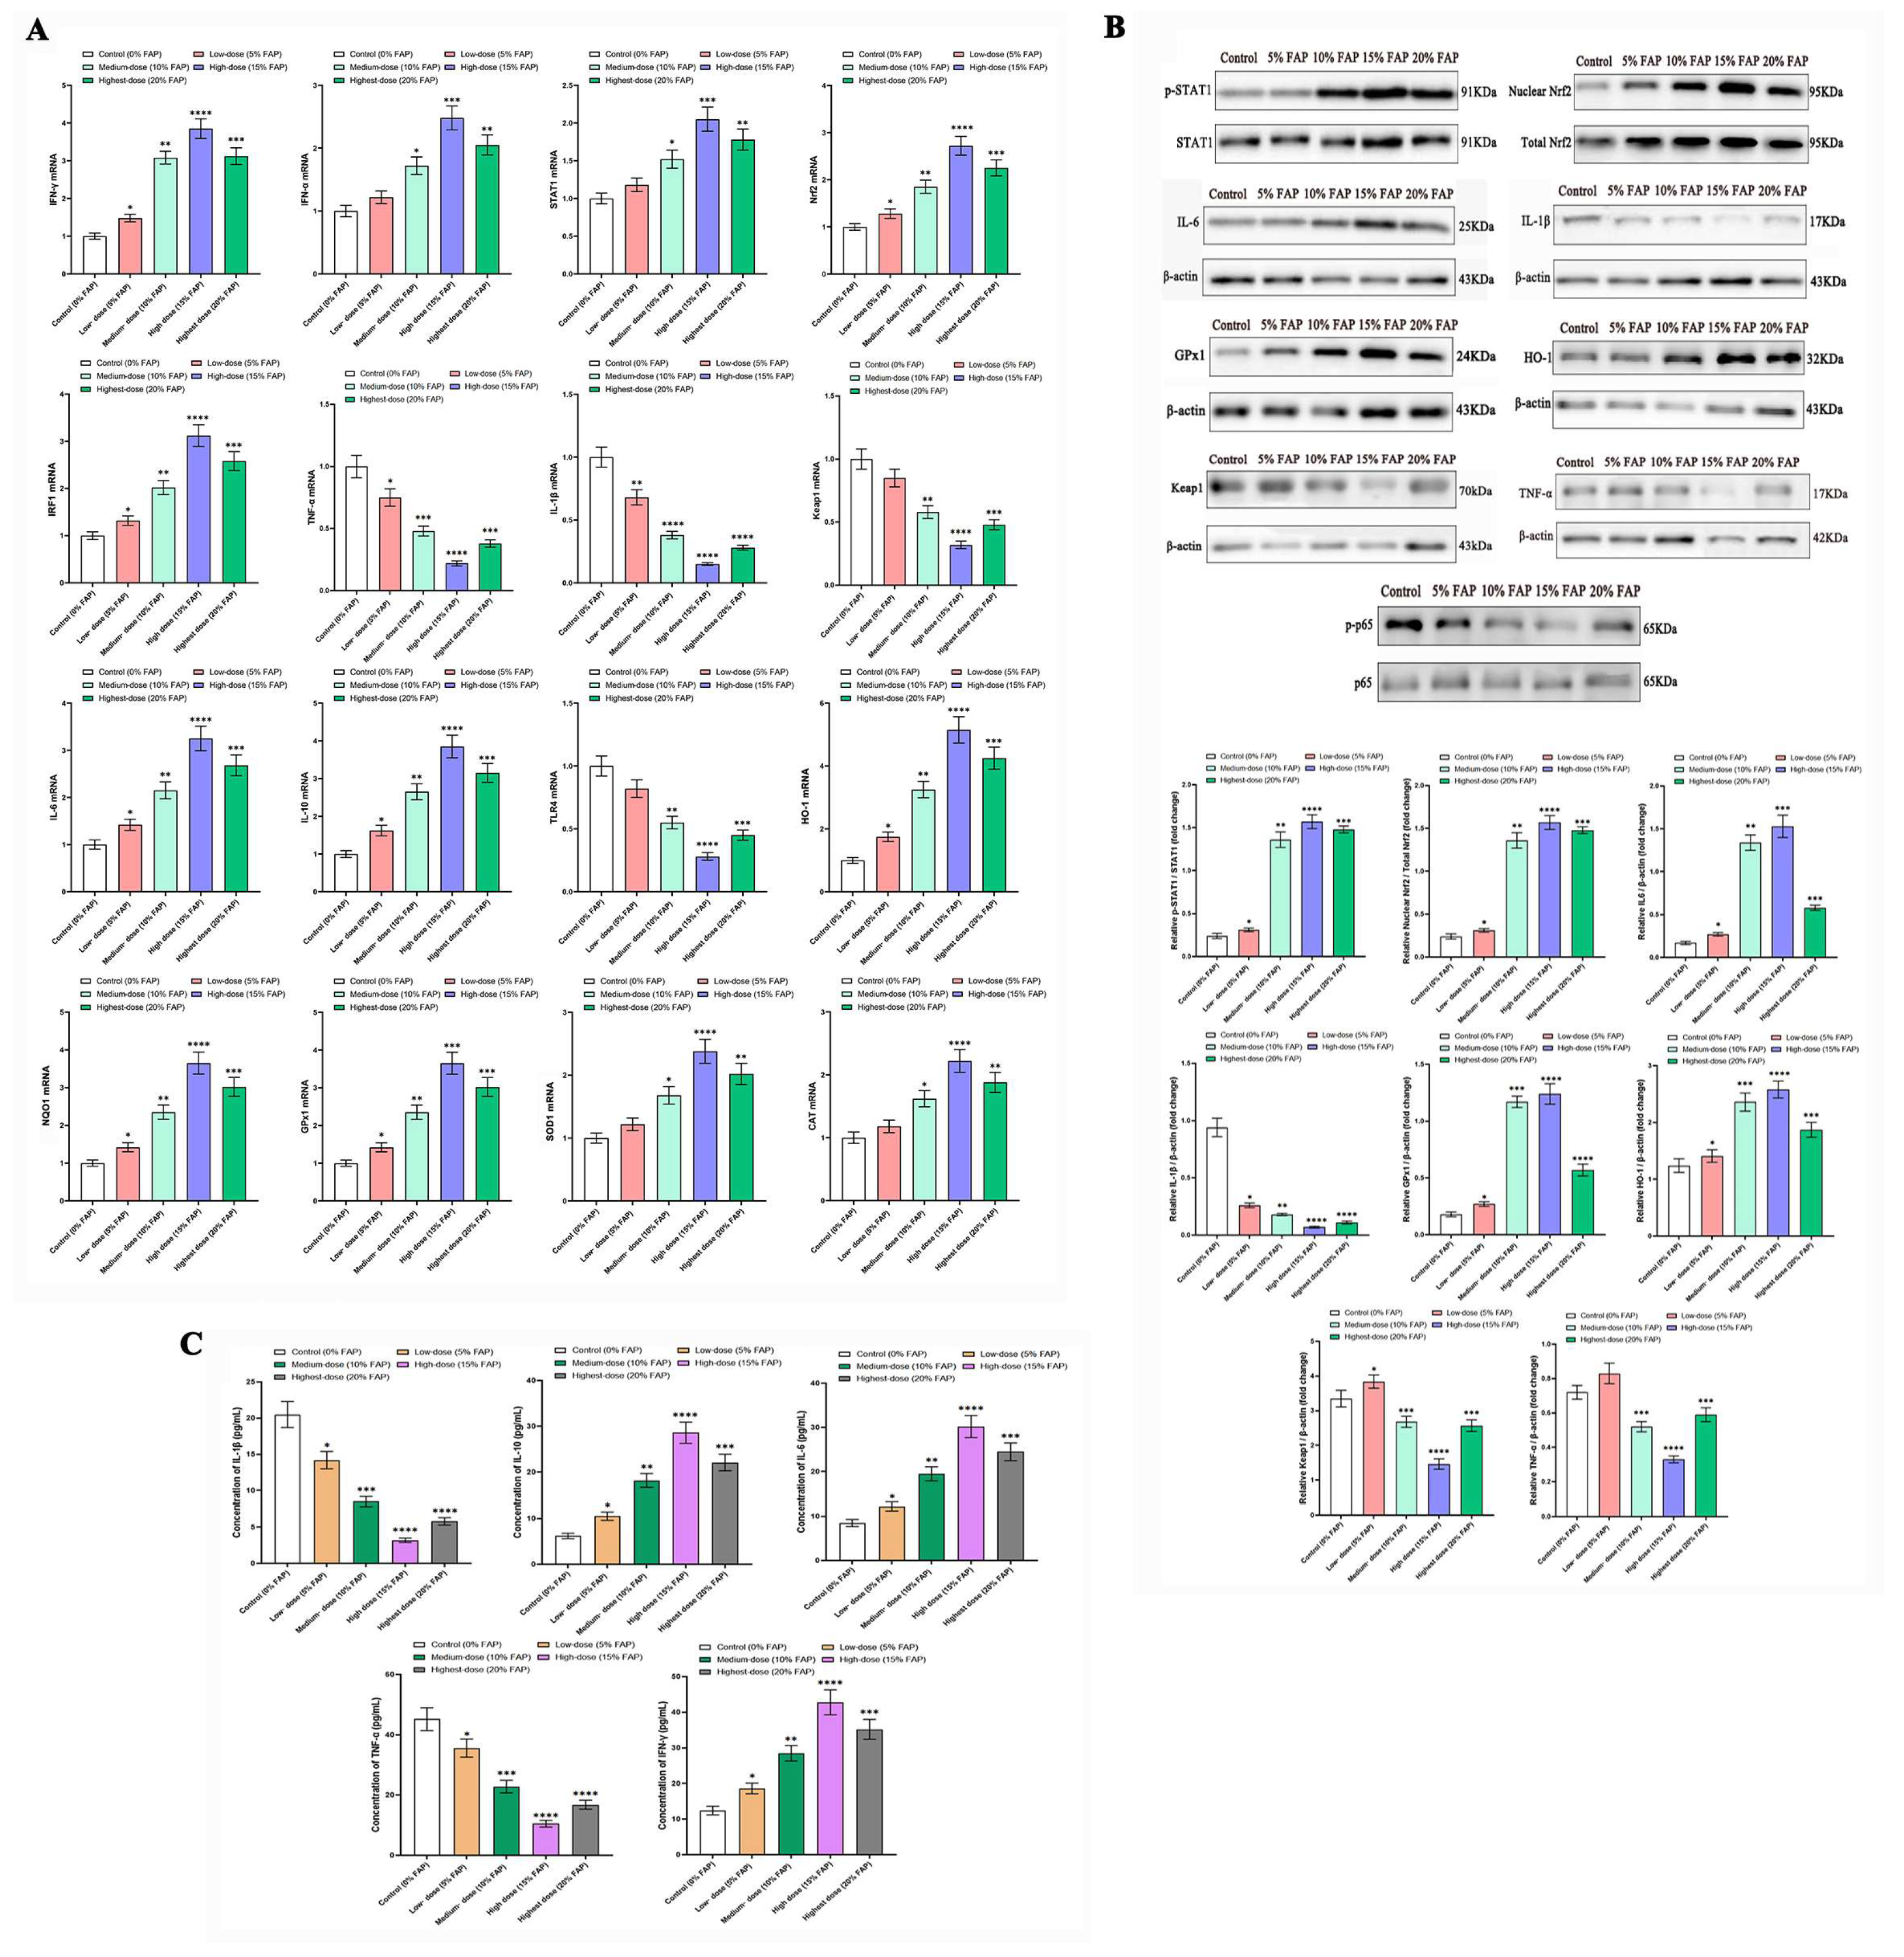
Figure 7.
Effects of fermented apple pomace (FAP) supplementation on the gut microbiota of rats. (A) Alpha diversity indices (Shannon, Simpson, ACE, Chao1, and Coverage). (B) Principal coordinate analysis (PCoA) plot based on Bray-Curtis distances showing overall microbial community structure separation among groups. (C) ANOSIM boxplot confirming significant inter-group differences. (D) Relative abundance at the phylum level. (E) Relative abundance at the genus level. (F) Hierarchical clustering tree combined with the genus-level bar plot. (G) LEfSe cladogram identifying key discriminatory taxa (biomarkers) enriched in each group. (H) LDA score bar plot of differentially abundant genera (LDA > 2.0). For alpha diversity indices in (A), values are presented as mean ± standard deviation (n = 6 per group). *P < 0.05, **P < 0.01 vs. the control group (one-way ANOVA followed by Dunnett's post-hoc test). For panels B, C, F, G, and H, statistical analyses were performed using ANOSIM and LEfSe (LDA > 2.0) based on relative abundance data. FAP, fermented apple pomace; LDA, linear discriminant analysis; PCoA, principal coordinate analysis; ANOSIM, analysis of similarities; SCFA, short-chain fatty acids.
Figure 7.
Effects of fermented apple pomace (FAP) supplementation on the gut microbiota of rats. (A) Alpha diversity indices (Shannon, Simpson, ACE, Chao1, and Coverage). (B) Principal coordinate analysis (PCoA) plot based on Bray-Curtis distances showing overall microbial community structure separation among groups. (C) ANOSIM boxplot confirming significant inter-group differences. (D) Relative abundance at the phylum level. (E) Relative abundance at the genus level. (F) Hierarchical clustering tree combined with the genus-level bar plot. (G) LEfSe cladogram identifying key discriminatory taxa (biomarkers) enriched in each group. (H) LDA score bar plot of differentially abundant genera (LDA > 2.0). For alpha diversity indices in (A), values are presented as mean ± standard deviation (n = 6 per group). *P < 0.05, **P < 0.01 vs. the control group (one-way ANOVA followed by Dunnett's post-hoc test). For panels B, C, F, G, and H, statistical analyses were performed using ANOSIM and LEfSe (LDA > 2.0) based on relative abundance data. FAP, fermented apple pomace; LDA, linear discriminant analysis; PCoA, principal coordinate analysis; ANOSIM, analysis of similarities; SCFA, short-chain fatty acids.
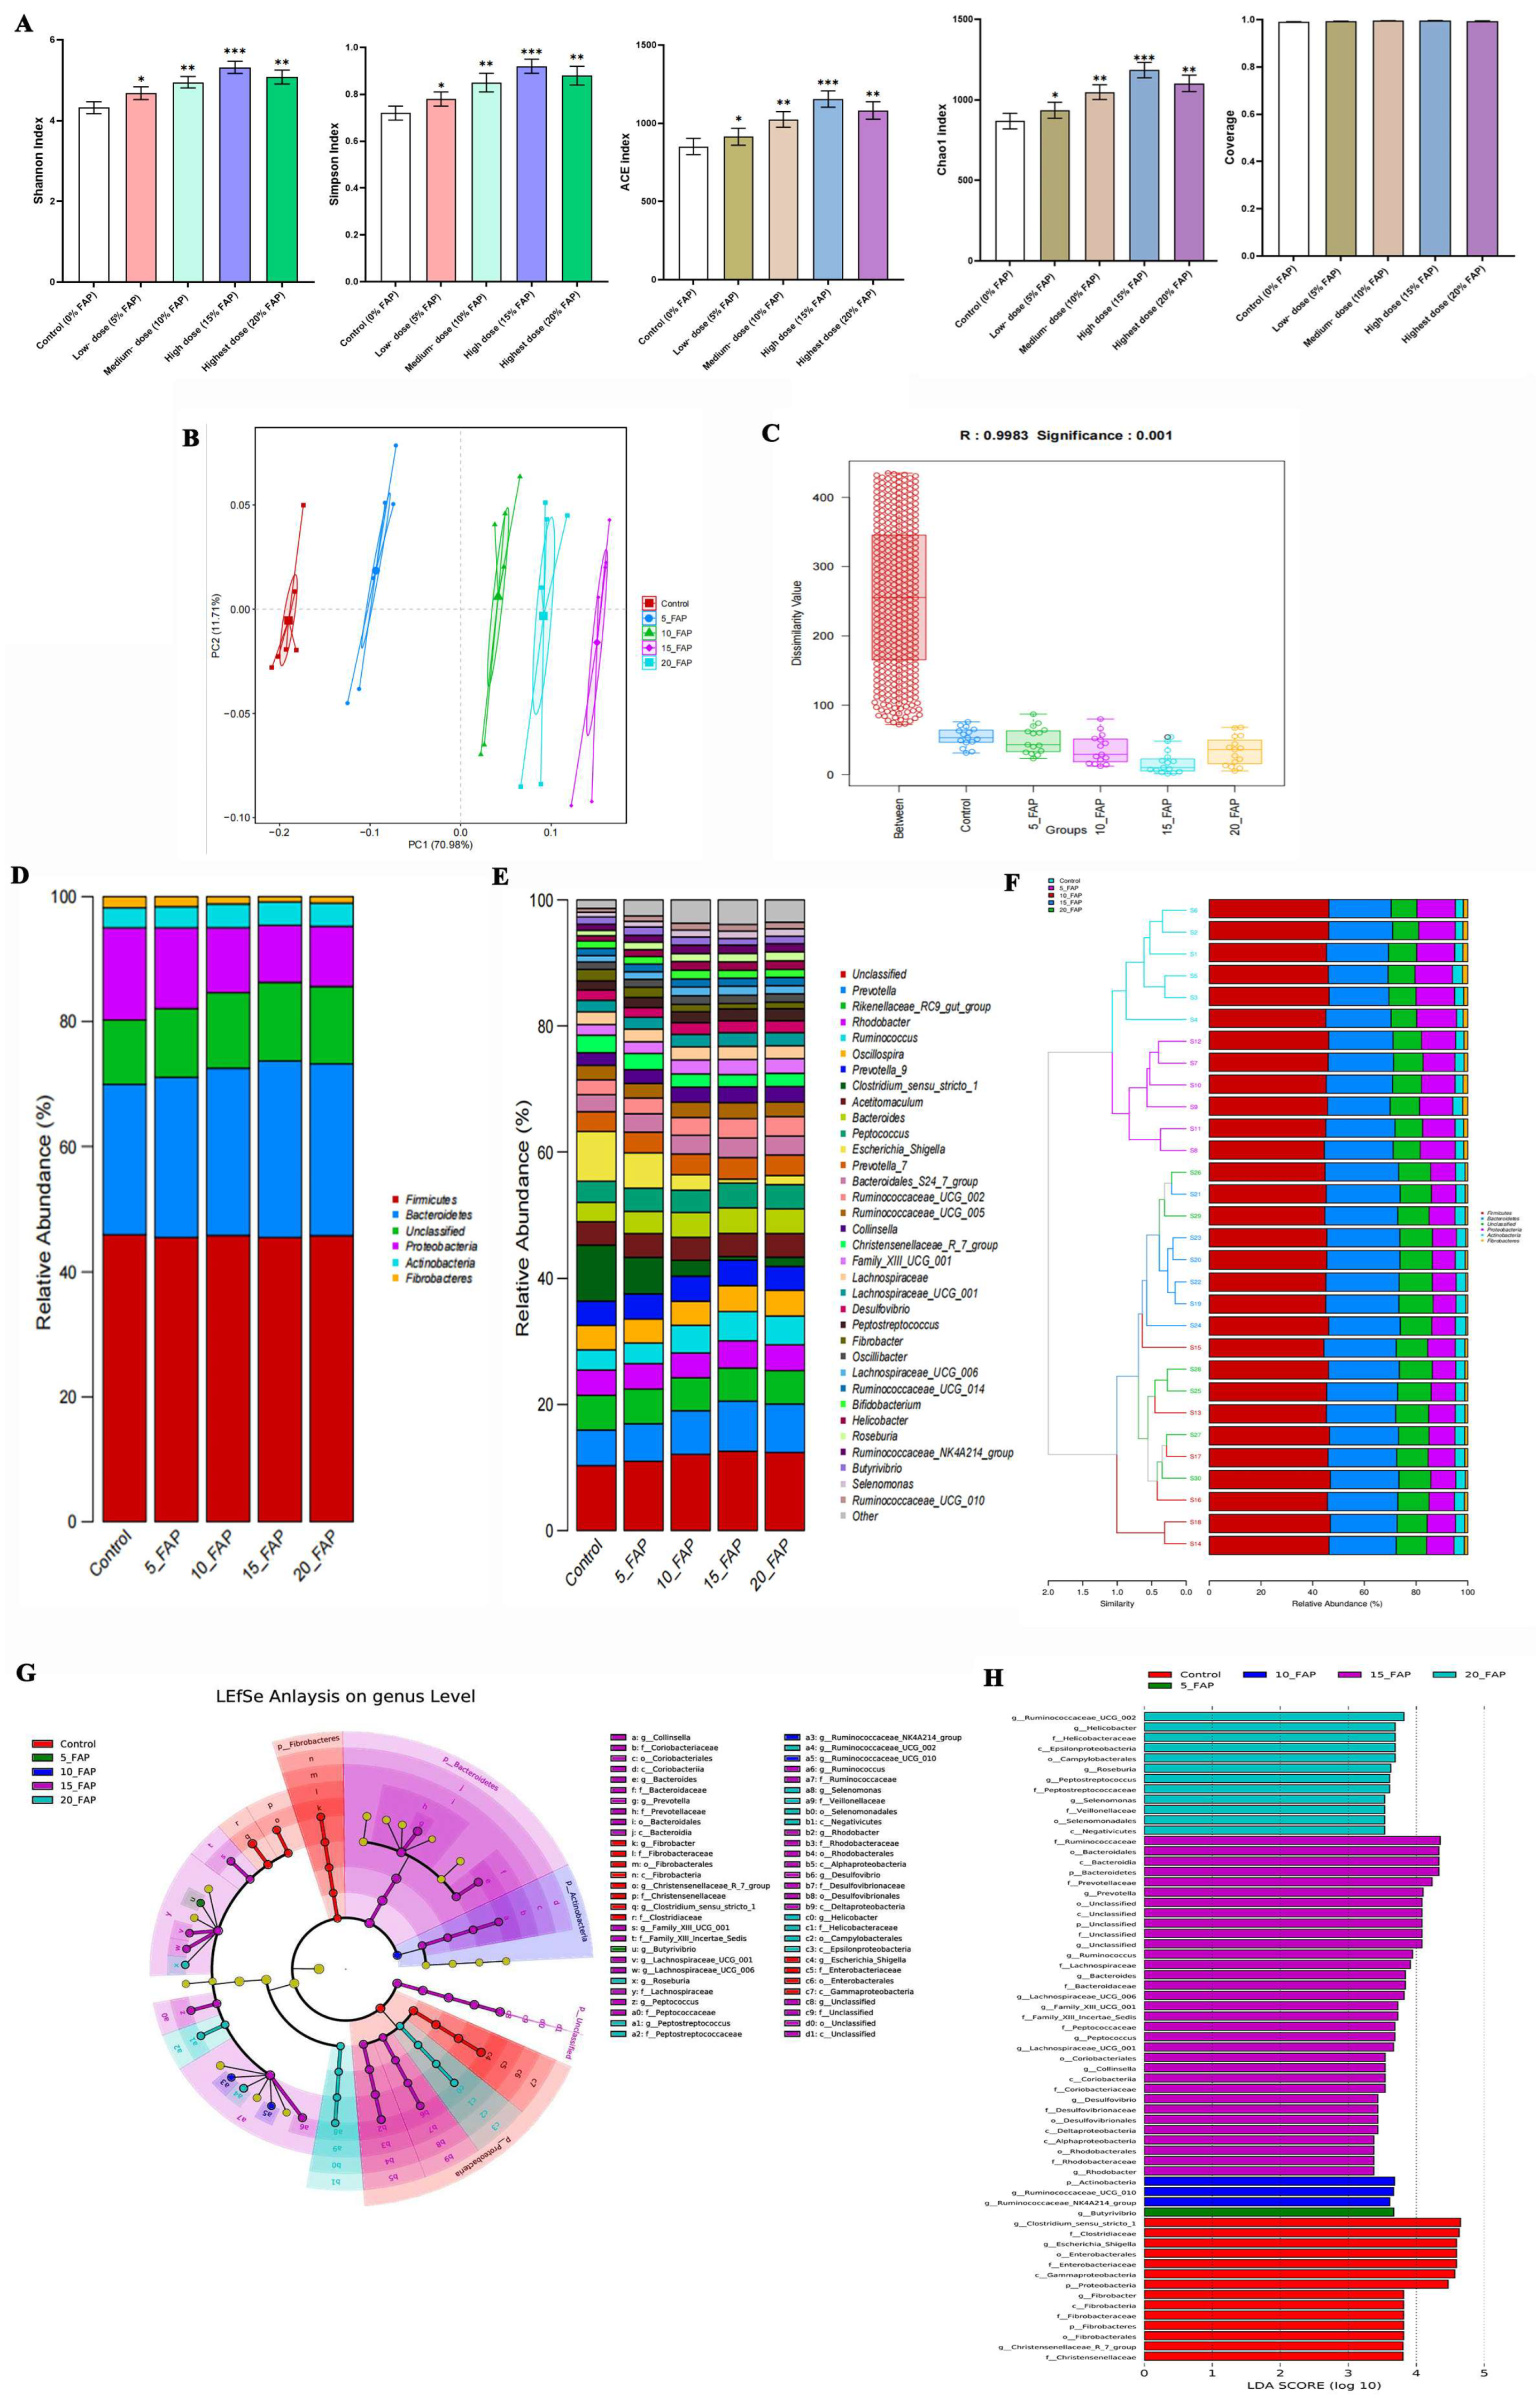
Figure 8.
Association analyses between gut microbiota composition and host serum parameters in rats.(A) Hierarchical clustering heatmap of the relative abundance of dominant genera across groups. Color intensity from green (low abundance) to red (high abundance) represents relative abundance values. Dendrograms on the left and top show the hierarchical clustering of genera and samples, respectively. (B) Venn diagram of shared and unique OTUs among the five groups. The central overlapping region (47) indicates the number of core OTUs shared by all five groups, and each petal indicates the number of unique OTUs specific to the corresponding group. (C) Spearman correlation heatmap between dominant genera and host serum parameters (T-AOC, SOD, GSH-Px, MDA, IFN-γ, TNF-α, IL-6, IL-1β, IL-10). Red indicates positive correlation, and blue indicates negative correlation. *P < 0.05, **P < 0.01. T-AOC, total antioxidant capacity; SOD, superoxide dismutase; GSH-Px, glutathione peroxidase; MDA, malondialdehyde; OTU, operational taxonomic unit; SCFA, short-chain fatty acids.
Figure 8.
Association analyses between gut microbiota composition and host serum parameters in rats.(A) Hierarchical clustering heatmap of the relative abundance of dominant genera across groups. Color intensity from green (low abundance) to red (high abundance) represents relative abundance values. Dendrograms on the left and top show the hierarchical clustering of genera and samples, respectively. (B) Venn diagram of shared and unique OTUs among the five groups. The central overlapping region (47) indicates the number of core OTUs shared by all five groups, and each petal indicates the number of unique OTUs specific to the corresponding group. (C) Spearman correlation heatmap between dominant genera and host serum parameters (T-AOC, SOD, GSH-Px, MDA, IFN-γ, TNF-α, IL-6, IL-1β, IL-10). Red indicates positive correlation, and blue indicates negative correlation. *P < 0.05, **P < 0.01. T-AOC, total antioxidant capacity; SOD, superoxide dismutase; GSH-Px, glutathione peroxidase; MDA, malondialdehyde; OTU, operational taxonomic unit; SCFA, short-chain fatty acids.
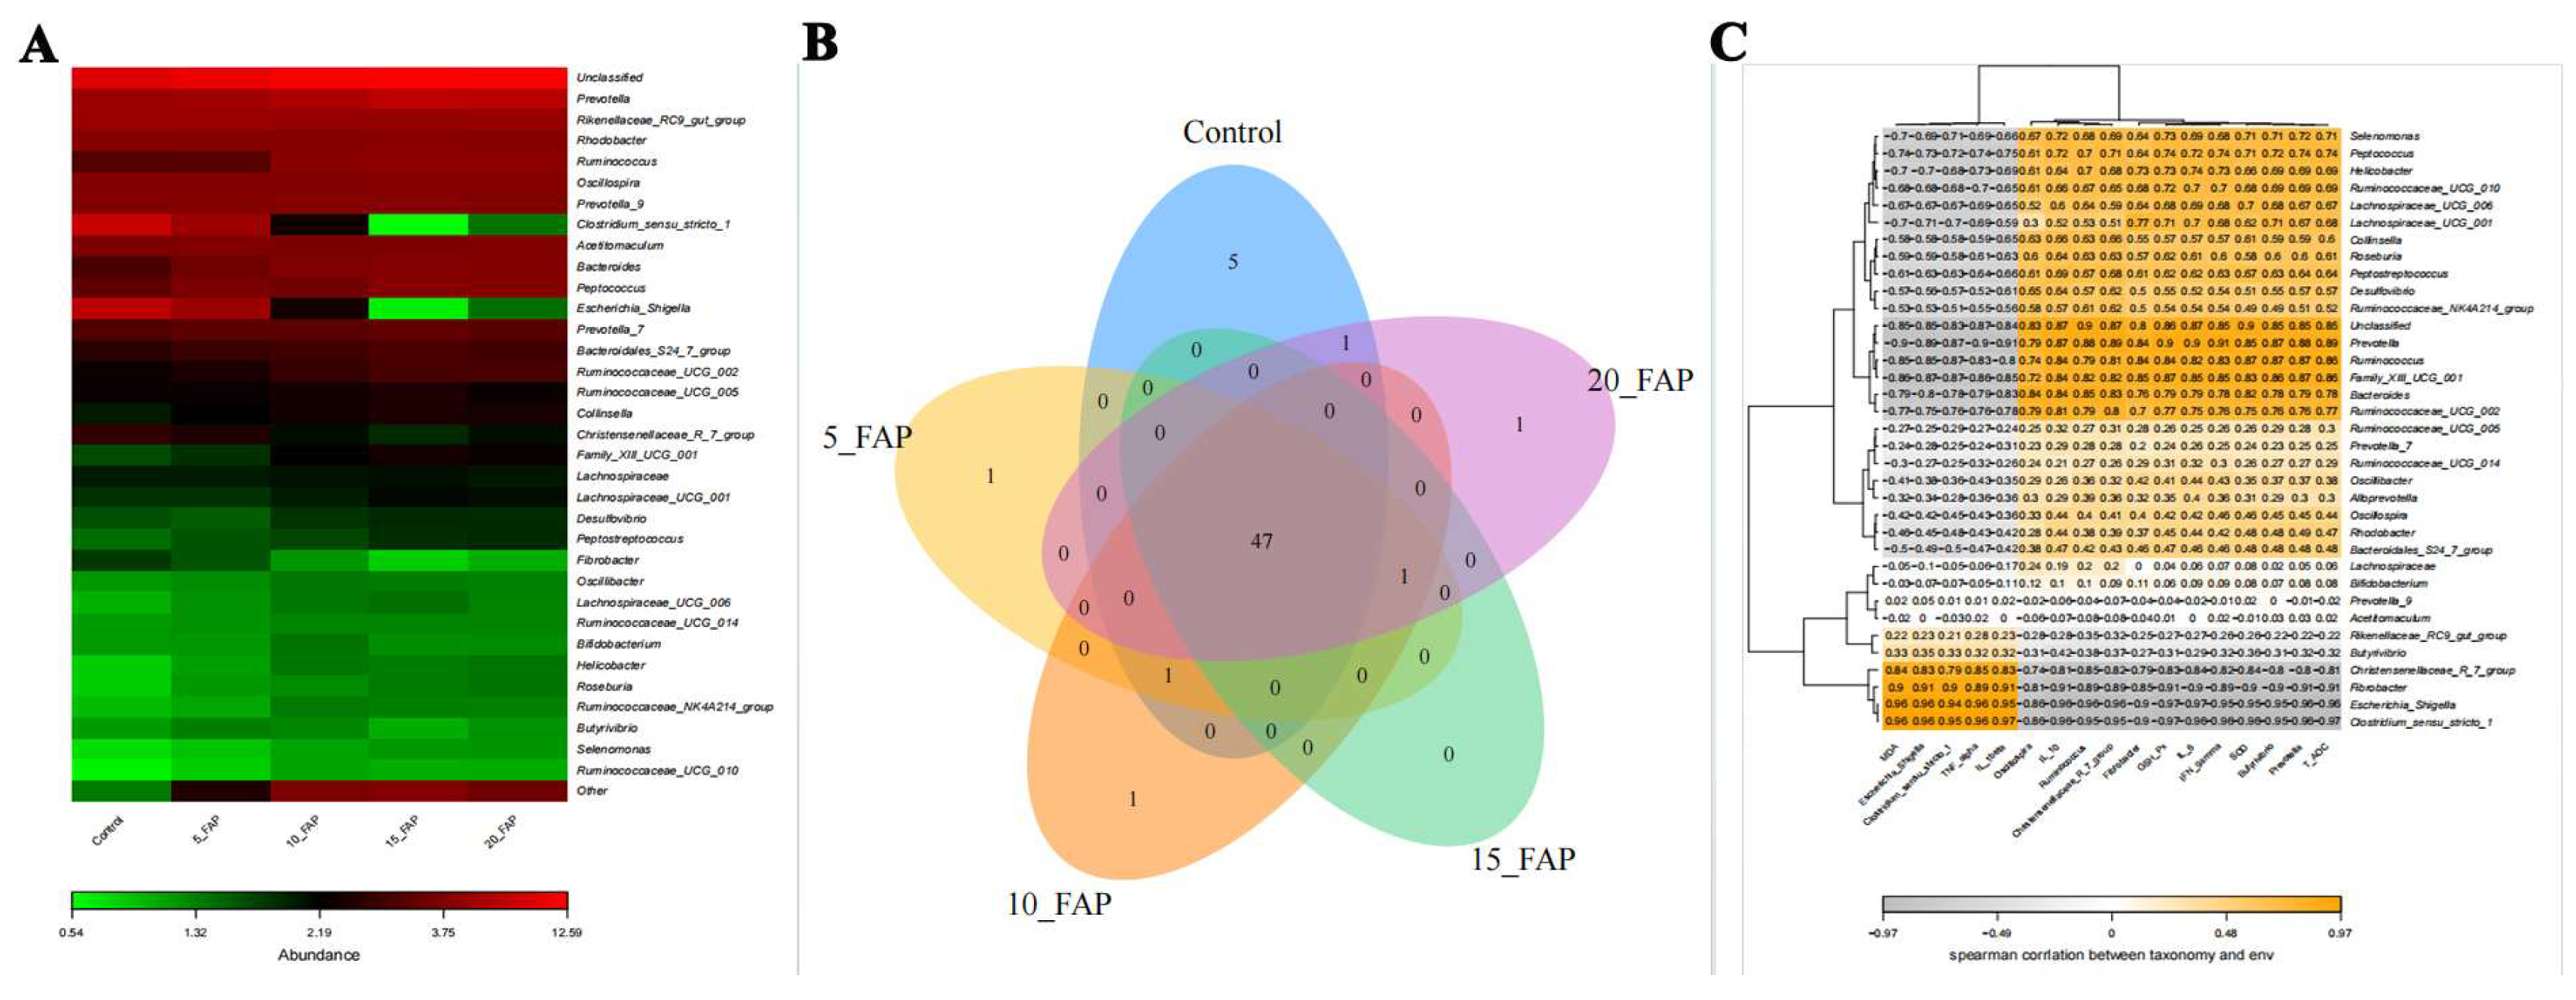
Figure 9.
Fermented apple pomace (FAP) modulates cecal short-chain fatty acid (SCFA) production and its associations with gut microbiota and host antioxidant/immune status in rats. (A) Spearman correlations between core bacterial genera and serum antioxidant/immune parameters. (B)Cecal concentrations of acetic acid, propionic acid, butyric acid, and total SCFAs. (C) Spearman correlations between core bacterial genera and SCFAs. (D) Spearman correlations between SCFAs and Nrf2 pathway/serum antioxidant parameters. Data are presented as mean ± SD (n = 10 for SCFA concentrations; n = 6 for correlation analyses). *P < 0.05, **P < 0.01, ***P < 0.001 vs. control or significant correlation. T-AOC, total antioxidant capacity; SOD, superoxide dismutase; GSH-Px, glutathione peroxidase; MDA, malondialdehyde; IFN-γ, interferon-γ; TNF-α, tumor necrosis factor-α; IL-6, interleukin-6; IL-1β, interleukin-1β; SCFAs, short-chain fatty acids.
Figure 9.
Fermented apple pomace (FAP) modulates cecal short-chain fatty acid (SCFA) production and its associations with gut microbiota and host antioxidant/immune status in rats. (A) Spearman correlations between core bacterial genera and serum antioxidant/immune parameters. (B)Cecal concentrations of acetic acid, propionic acid, butyric acid, and total SCFAs. (C) Spearman correlations between core bacterial genera and SCFAs. (D) Spearman correlations between SCFAs and Nrf2 pathway/serum antioxidant parameters. Data are presented as mean ± SD (n = 10 for SCFA concentrations; n = 6 for correlation analyses). *P < 0.05, **P < 0.01, ***P < 0.001 vs. control or significant correlation. T-AOC, total antioxidant capacity; SOD, superoxide dismutase; GSH-Px, glutathione peroxidase; MDA, malondialdehyde; IFN-γ, interferon-γ; TNF-α, tumor necrosis factor-α; IL-6, interleukin-6; IL-1β, interleukin-1β; SCFAs, short-chain fatty acids.
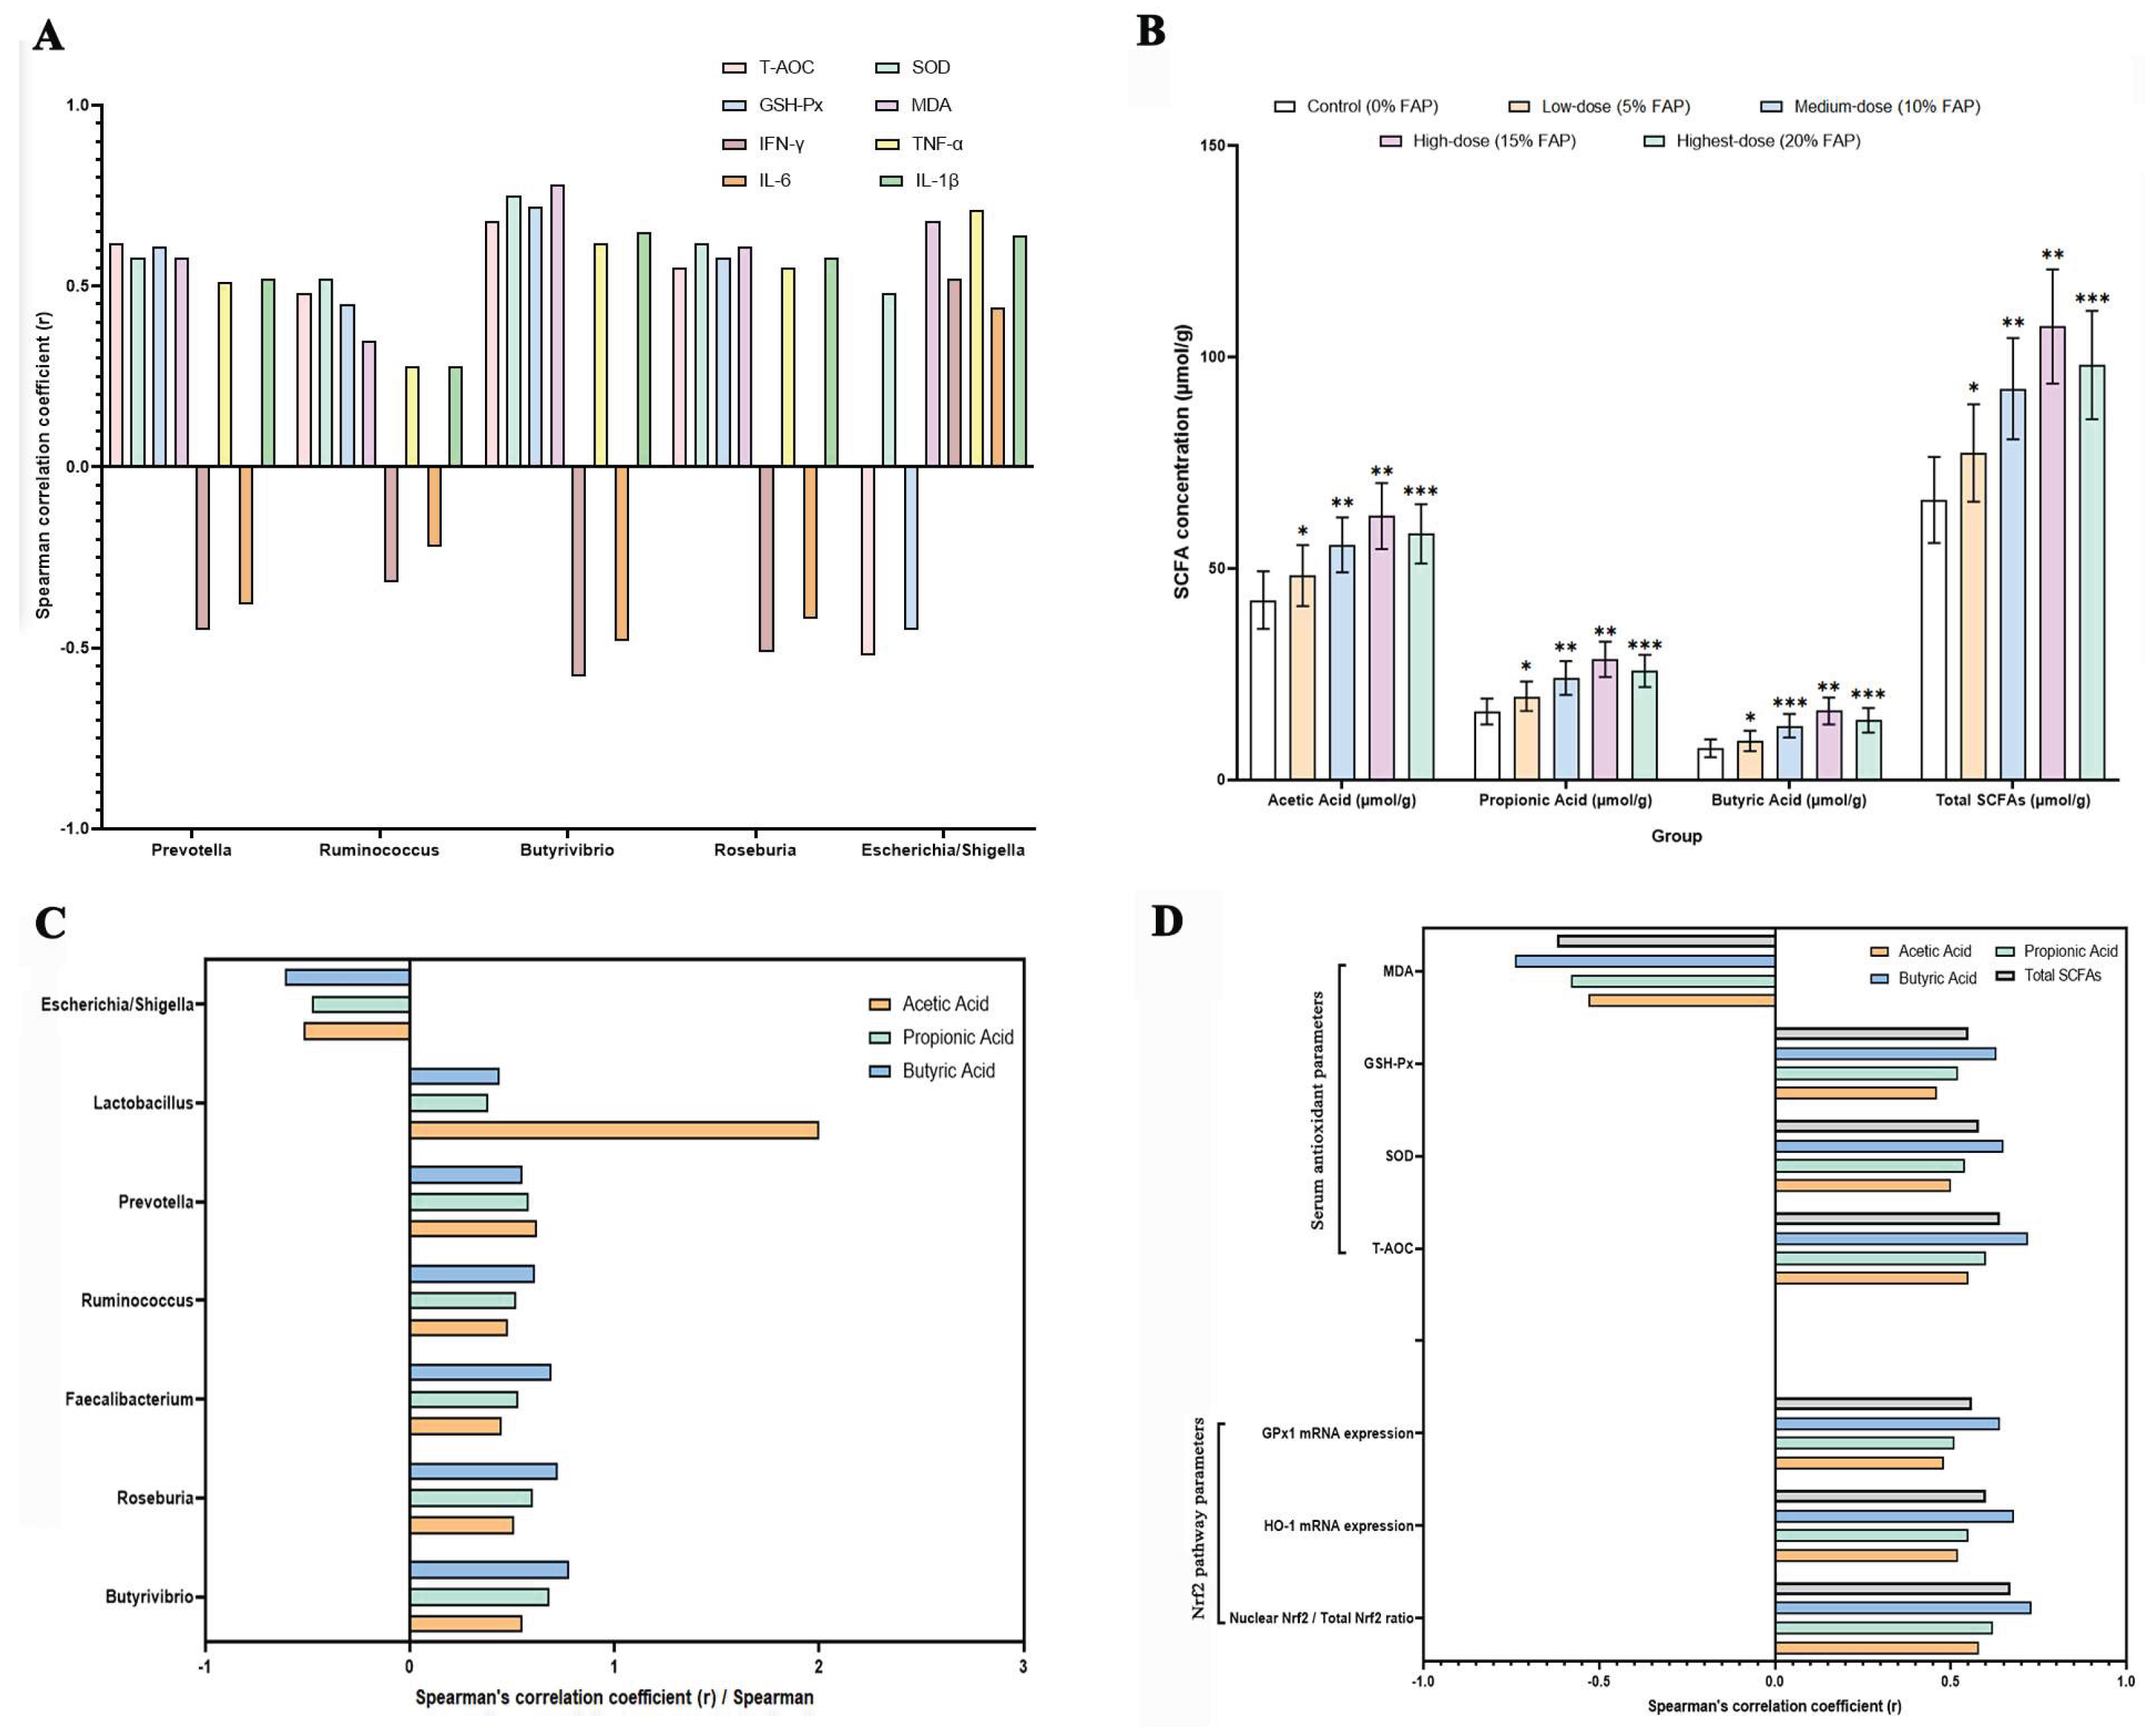
Table 1.
Conventional nutrient and mineral composition of raw apple pomace.
| Item | Value |
| Dry Matter (DM) | 89.20 ± 1.47 |
| Crude Protein (CP) | 4.23 ± 0.49 |
| Neutral Detergent Fiber (NDF) | 44.87 ± 3.56 |
| Acid Detergent Fiber (ADF) | 34.52 ± 2.84 |
| Ether Extract (EE) | 3.61 ± 0.47 |
| Ash | 2.38 ± 0.29 |
| Non-Fiber Carbohydrates (NFC) | 44.91 ± 3.12 |
| NDF/CP Ratio | 10.61 ± 1.37 |
| Calcium (Ca) | 0.12 ± 0.026 |
| Phosphorus (P) | 0.08 ± 0.014 |
| Ca/P Ratio | 1.50 ± 0.21 |
Note: DM, dry matter; CP, crude protein; NDF, neutral detergent fiber; ADF, acid detergent fiber; EE, ether extract; NFC, non-fiber carbohydrates; Ca, calcium; P, phosphorus. Values are presented as means ± SD (n = 3). All values are expressed on a dry matter (DM) basis, except DM, which is expressed on a fresh weight basis. NFC was calculated as 100 − (CP + NDF + EE + Ash) on a DM basis. NDF/CP and Ca/P are presented as ratios. No statistical comparison was performed because only one group was evaluated; therefore, no P-values are reported.
Disclaimer/Publisher’s Note: The statements, opinions and data contained in all publications are solely those of the individual author(s) and contributor(s) and not of MDPI and/or the editor(s). MDPI and/or the editor(s) disclaim responsibility for any injury to people or property resulting from any ideas, methods, instructions or products referred to in the content. |
© 2026 by the authors. Licensee MDPI, Basel, Switzerland. This article is an open access article distributed under the terms and conditions of the Creative Commons Attribution (CC BY) license (http://creativecommons.org/licenses/by/4.0/).
Copyright: This open access article is published under a Creative Commons CC BY 4.0 license, which permit the free download, distribution, and reuse, provided that the author and preprint are cited in any reuse.