

Submitted:
24 September 2026
Posted:
24 September 2026
You are already at the latest version
Abstract
Agenda-setting research emphasizes the role of media visibility in shaping public attention, but longitudinal relationships between recorded crime and media reporting require methods that account for temporal dependence. This study examined national and municipal crime indicators alongside annual Canadian Newsstream mentions of the RCMP, Vancouver Police, and Toronto Police. The national series covered 1969–2023, while the Vancouver and Toronto analyses covered 2002–2023. Initial level-based regressions exhibited severe positive residual autocorrelation. The analysis was therefore repeated using annual first differences, Newey–West standard errors, and AR(1) sensitivity models. After accounting for temporal dependence, none of the national or municipal crime indicators demonstrated a statistically significant and robust association with annual changes in the corresponding media-mention series. The results do not establish that crime rates predict police-related media visibility or that the observed media counts influence public perceptions. Instead, they demonstrate how shared trends and serial dependence can produce misleading relationships in longitudinal media analyses. Interpretation is further limited because organizational mentions do not fully capture crime reporting, and Canadian Newsstream’s archival composition may vary across years.
Keywords:
crime indicators
; police organizations
; media visibility
; Canadian Newsstream
; longitudinal analysis
; time-series regression
1. Introduction
Technological revolutions (e.g., the first and second Industrial Revolutions) have historically reshaped both crime patterns and public perceptions of crime (Jozaghi, 2025a). During the Industrial Revolution, rapid urbanization, economic restructuring, and social dislocation were accompanied by heightened public anxieties about disorder and criminality that often exceeded what official crime statistics reflected (Gershon, 2021; Dressler & Fogleman, 2021; Philips, 2012). In the contemporary period, the Artificial Intelligence (AI) revolution has similarly transformed information environments, accelerating the production, circulation, and amplification of crime narratives through mass media, AI-driven social media platforms, podcasts, and algorithmically curated content (Jozaghi, 2025a; Jozaghi, 2024a, 2024b).
A central concept in criminological scholarship is the distinction between actual crime rates and fear of crime, or more broadly, the perception of crime. Fear of crime does not necessarily correspond to objective measures of criminal activity; instead, it is shaped by social context, media exposure, and political discourse (Ferraro, 1995; Chiricos et al., 1997; Farrall et al., 2009). In recent years, crime-related content has become increasingly visible and repetitive across digital media ecosystems, contributing to heightened perceptions of risk and insecurity even in contexts where crime rates have remained stable or declined (Surette, 2011). These dynamics have been particularly pronounced in public safety debates, where isolated or exceptional incidents are often presented as representative of broader trends (Garland, 2001).
Across multiple jurisdictions, including the United States, Europe, Asia, and Canada, crime narratives circulating in mass and social media have significantly shaped public opinion and policy responses. In some cases, misinformation and disinformation have reinforced associations between crime and marginalized populations, despite extensive empirical evidence showing no consistent links (Cohen, 2011; Garland, 2001; Surette, 2011). At the same time, long-term data demonstrate that crime rates in many industrialized nations have declined since the early 1990s, with Canada’s Crime Severity Index decreasing further in 2024 (Tonry, 2014; Statistics Canada, 2025f). The persistence of punitive criminal justice policies in this context raises important questions about how perceptions of crime form and endure (Ferraro, 1995; Chiricos et al., 1997; Farrall et al., 2009). While criminological research has consistently linked crime to structural factors such as poverty, inequality, unemployment, urban decay, and limited access to education, media-driven narratives often emphasize individual incidents, violence, and disorder in ways that may distort public understanding of broader trends (Sampson & Raudenbush, 2001; Kelly, 2000; Surette, 2011; Hsieh & Pugh, 1993; Sampson et al., 1997). As a result, fear of crime may be amplified independently of actual crime rates, shaping political agendas and public demand for harsher policies (Garland, 2001; Farrall et al., 2009).
Recent systems-theoretical scholarship suggests that democratic societies increasingly operate through interconnected informational ecosystems in which mass media, social media, and algorithmically curated content shape public understanding of social problems (Jozaghi, 2026a). Examining whether organizational media visibility corresponds with objective crime trends provides a preliminary empirical benchmark for communication research. However, because the present study does not measure algorithms, audience exposure, or public responses, it cannot determine how agenda-setting, framing, or cultivation processes operate within algorithmically mediated environments.
Over the past five decades, communication scholars have consistently argued that news media influence public understanding not necessarily by telling audiences what to think, but by shaping what they think about. Agenda-setting theory proposes that the frequency and prominence of media coverage increase the perceived importance of particular issues within the public agenda (McCombs & Shaw, 1972). Applied to crime, repeated reporting of criminal events elevates crime as a salient social concern regardless of whether individuals have direct experience with victimization. Closely related, cultivation theory suggests that prolonged exposure to crime-related media contributes to perceptions that the social world is more dangerous than objective conditions would indicate, a phenomenon often described as the “mean world syndrome” (Gerbner, 1980; Morgan et al., 2015). These theories have become central to understanding how media exposure shapes fear of crime, perceptions of public safety, and support for criminal justice policies.
Beyond determining issue salience, communication research shows that how crime is presented influences how the public interprets criminal events. Framing theory argues that media selectively emphasize certain aspects of reality while downplaying others, thereby shaping how audiences assign responsibility, evaluate risk, and interpret policy solutions (Entman, 1993). Crime reporting frequently privileges violent, unusual, and emotionally engaging incidents because these events possess high news value and attract audience attention (Galtung & Ruge, 1965; Harcup & O’Neill, 2017). Consequently, isolated but highly sensational crimes often receive disproportionate coverage relative to their statistical frequency, reinforcing public perceptions that crime is widespread even when long-term crime rates remain stable or decline. These framing processes have been widely associated with increased fear of crime, punitive policy preferences, and moral panics (Surette, 2011).
The emergence of AI-driven communication environments extends rather than replaces these classical theories. Whereas traditional agenda-setting and framing largely depended on journalists’ and news organizations’ editorial decisions, contemporary digital platforms increasingly use recommendation algorithms that personalize, prioritize, and repeatedly expose users to emotionally engaging content. Algorithmic amplification therefore adds another layer of agenda-setting by increasing the visibility and persistence of selected crime narratives across multiple communication platforms, including mass media, social media, podcasts, and online video services. Examining whether police-organization media visibility corresponds with objective crime trends provides a preliminary empirical benchmark for communication research. Because the study does not measure algorithms, audience exposure, or audience responses, it cannot determine how agenda-setting, framing, or cultivation processes operate within algorithmically mediated environments.
A useful methodological parallel appears in recent public health research examining media engagement and social outcomes (Jozaghi & VANDU, 2022, 2025, 2026). In a longitudinal study of the opioid crisis, annual Canadian Newsstream reports quantified mass media coverage of the Vancouver Area Network of Drug Users (VANDU), treating coverage volume as an indicator of public visibility and advocacy engagement (Jozaghi & VANDU, 2022, 2025, 2026). That study applied correlation and regression analyses to examine the relationship between media engagement and overdose deaths and rates, demonstrating that changes in objective outcome indicators were statistically associated with changes in media attention over time (Jozaghi & VANDU, 2025). Importantly, the study did not assume causality; instead, it empirically assessed whether media engagement tracked underlying conditions (e.g., Overdose rates and death counts) (Jozaghi & VANDU, 2025).
Building on this methodological approach, the present study uses annual Canadian Newsstream counts to examine the media visibility of selected police organizations. Specifically, the analysis evaluates whether annual changes in official crime indicators correspond with annual changes in mentions of the RCMP, Vancouver Police, and Toronto Police. These organizational searches do not fully capture crime reporting, fear-related media attention, public perceptions, or issue salience. Instead, they provide a reproducible indicator of the visibility of selected police organizations within the indexed media archive.
2. Rationale and Focus
Unlike much of the literature on crime framing or audience fear, this study uses a quantitative longitudinal approach to assess the correspondence between recorded crime indicators and the media visibility of selected police organizations; Canadian Newsstream provides a large historical archive, but annual retrieval counts may be affected by changes in source availability, digitization, and indexing (Jozaghi & VANDU, 2022, 2025, 2026). The analysis therefore examines whether year-to-year changes in national and municipal crime indicators are associated with corresponding changes in mentions of the RCMP, Vancouver Police, and Toronto Police. This narrower question matters for communication research because it tests whether changes in an objective social indicator are reflected in a reproducible, though incomplete, measure of organizational media visibility. This approach is especially relevant given recurring policy debates in which law enforcement associations and political actors cite rising crime—often in media narratives—to justify punitive reforms, including stricter bail conditions and mandatory sentencing (Karadeglija, 2025a, 2025b; Kulkarni, 2024). While such claims circulate widely across mass and social media, empirical evidence remains limited on whether media reporting aligns with actual crime trends or amplifies perceptions independently of the underlying data. This issue is particularly relevant during the AI revolution, where algorithmically driven communication systems increasingly prioritize emotionally engaging content (Jozaghi, 2026b, 2026c). Recent theoretical work argues that algorithmic amplification may increase the visibility of crime-related narratives, thereby influencing perceptions of safety and risk independent of objective crime conditions (Jozaghi, 2026a). Examining whether media reporting corresponds with actual crime trends, therefore, provides an important empirical foundation for understanding public perceptions of crime in contemporary information environments.
The study draws on agenda-setting, framing, and cultivation theories, but it does not directly test audience-level agenda-setting or cultivation effects. Instead, it examines one preliminary component of those processes: whether the media visibility of selected police organizations corresponds with recorded crime indicators over time. Close correspondence would indicate that this measure of organizational visibility partly tracks changes in crime, whereas weak correspondence would indicate that crime trends alone cannot explain its annual variation. Neither result, by itself, establishes how audiences interpret crime reporting or whether media exposure changes public perceptions. Accordingly, the study provides evidence about correspondence between recorded crime and organizational media visibility, not about audience perceptions or media effects. Using national and municipal crime indicators for Canada, Vancouver, and Toronto alongside annual Canadian Newsstream mentions of selected police organizations, this study addresses the following research questions:
Are annual changes in national crime rates associated with annual changes in Canadian Newsstream mentions of the RCMP?
Are annual changes in Vancouver and Toronto crime indicators associated with annual changes in mentions of the corresponding municipal police organization?
Are any observed associations robust when temporal dependence is addressed using Newey–West standard errors and AR(1) sensitivity models?
3. Methods
Sampling & Data Source
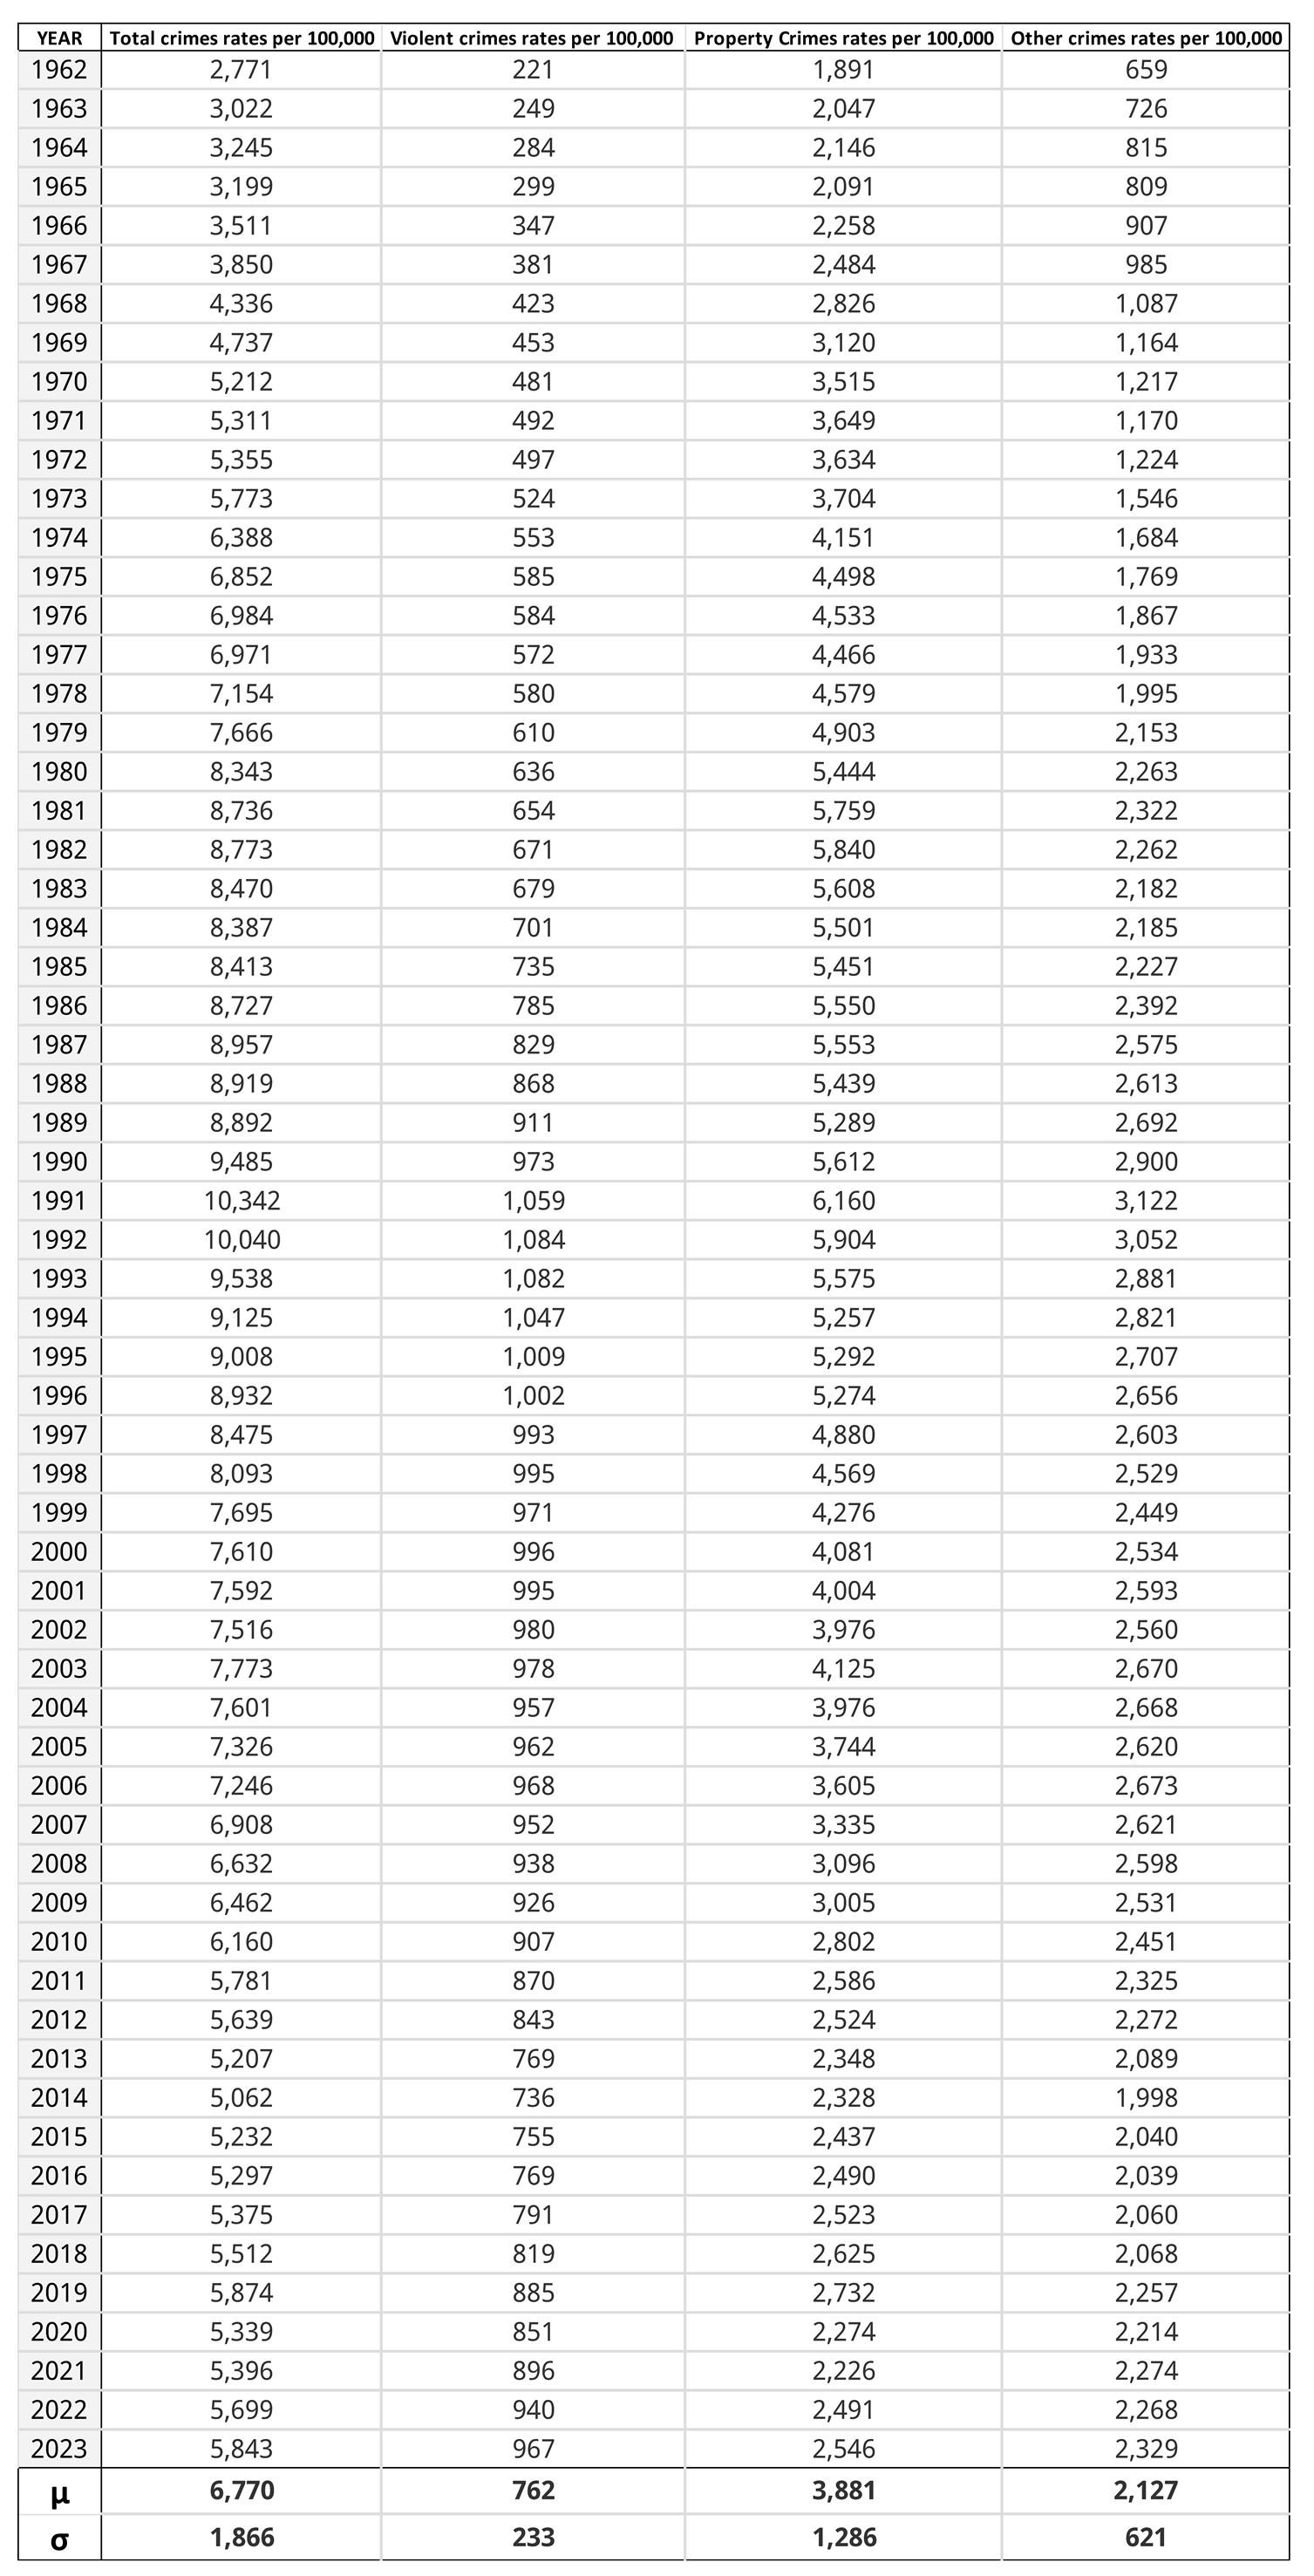
To reflect national crime rates in Canada, crime rates per 100,000 for all types of crime, including violent, property, and other offences, were obtained from Statistics Canada (2025b), as shown in Table 1 below.
Toronto, located in Central Canada, and Vancouver, located in Western Canada, were selected as large Canadian metropolitan areas (Vancouver Police Department, 2025; Statistics Canada, 2025a; Statistics Canada, 2025c; Statistics Canada, 2025d
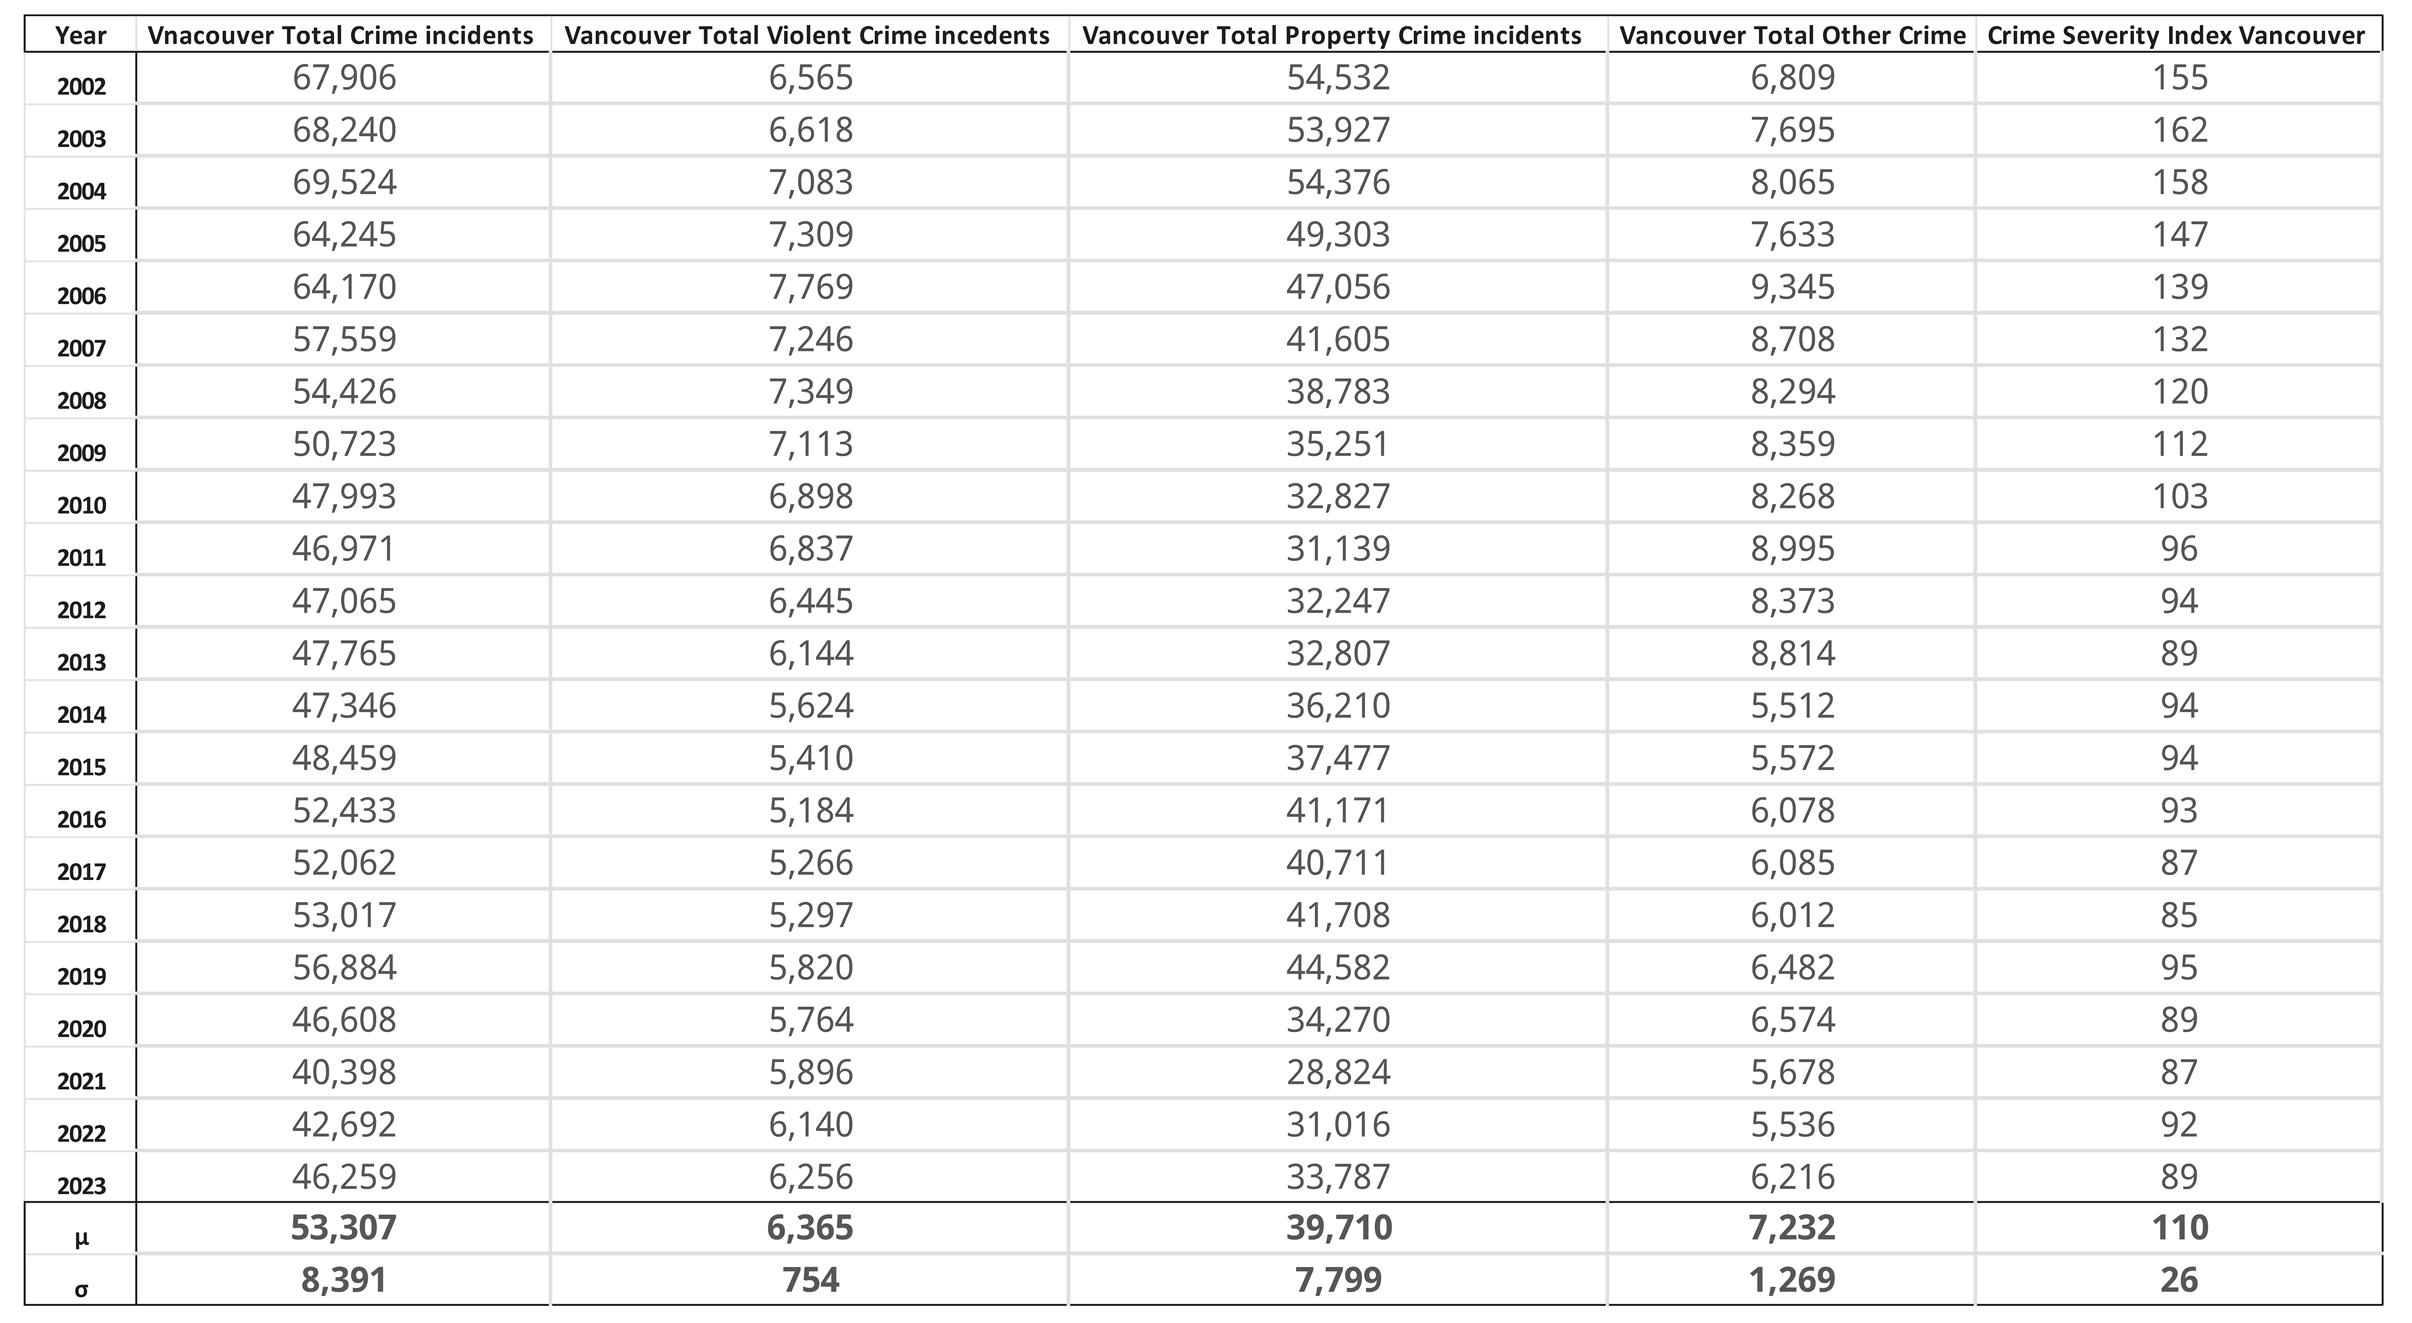
Statistics Canada, 2025e). At the same time, Montreal (the second-largest city) was omitted because the Canadian Newsstream database, used for mass-media articles, may not accurately capture all French-language articles, including newswire items. As shown in Table 2 and Table 3, the crime-related information was obtained from Statistics Canada and the Vancouver Police Department (VPD).
Table 4 describes the complete corpus retrieved through August 2025 by source category. Table 5 presents the annual observations used in the statistical analysis and is restricted to records dated from 1969 through 2023. The totals therefore differ because the descriptive corpus includes records published after the analytical period ended.
Canadian Newsstream is a database provided to libraries across Canada by ProQuest LLC that contains over 700 digital, print, and broadcast sources (audio & video), as well as podcasts, from all Canadian provinces and territories (Jozaghi & VANDU, 2022; Jozaghi, 2025b; Jozaghi & Jozaghi, 2024, 2026). The database, in addition to hosting news articles from national and international newspapers, magazines, and other sources, also hosts and archives numerous local newsprint sources, including The Sudbury Star, The Leader-Post, The Winnipeg Free Press, The Merritt Herald, and The Chronicle–Herald (Jozaghi & VANDU, 2022; Jozaghi, 2025b; Jozaghi & Jozaghi, 2024, 2026). While there are various international archiving news sources, such as Factiva, Nexis Uni, JSTOR, or Periodicals Archive Online, the Canadian Newsstream by ProQuest LLC is the only database that contains Canadian content dating back to the 1970s (Jozaghi & VANDU, 2022; Jozaghi, 2025b; Jozaghi & Jozaghi, 2024, 2026; Jozaghi & VANDU, 2025, 2026).
Data Collection
The media outcome was operationalized as the annual number of Canadian Newsstream records retrieved through searches for “RCMP,” “Vancouver Police,” and “Toronto Police.” These counts measure the indexed media visibility of the selected police organizations, not the total volume of crime reporting in Canada or either municipality. A record could mention a police organization in connection with administration, employment, budgets, community activities, or other matters not principally concerned with crime. Conversely, crime-related reports that did not name one of the selected organizations would not be captured. Accordingly, this study refers to the measure as police-organization media mentions rather than total media mentions of police organizations.
The annual counts were retained in their original form because comparable yearly denominators describing the complete volume and composition of the Canadian Newsstream archive were unavailable. Changes in these counts may therefore reflect both changes in media attention and changes in database coverage, source availability, digitization, and indexing. The analyses evaluate statistical correspondence between recorded crime indicators and the retrieved organizational mentions; they do not estimate the proportion of all news devoted to crime.
Data Preparation and Analysis
The collected data were first entered into Excel for descriptive analysis and later transferred to
SPSS version 30 (IBM Corp).
Longitudinal Statistical Analysis
Annual observations are temporally ordered, and successive observations may therefore be statistically dependent. Preliminary ordinary least-squares models using individual-level variables produced pronounced positive residual autocorrelation. For the national models, Durbin–Watson statistics ranged from 0.036 to 0.090, making the independence assumption underlying conventional regression significance tests untenable.
The primary analysis consequently examined annual changes rather than the untransformed levels. First differences were calculated as:
ΔMt = Mt − Mt−1
And
where Mtis the number of police-organization media mentions and Ctis the corresponding crime indicator in year t. The principal model was:
ΔCt = Ct − Ct−1,
ΔMt = α + βΔCt + εt.
The coefficient βrepresents the contemporaneous association between a one-unit annual change in the crime indicator and the annual change in retrieved media mentions. Heteroskedasticity- and autocorrelation-consistent Newey–West standard errors were calculated using data-dependent lag lengths of three years for the national models and two years for the municipal models. Residual dependence was evaluated using the Durbin–Watson statistic and the lag-one Breusch–Godfrey test. Generalized least-squares models with first-order autoregressive errors were estimated as sensitivity analyses. Results are reported as regression coefficients, standard errors, 95% confidence intervals, exact p-values, and adjusted R² values. Because the models examine contemporaneous annual changes, “association” is used instead of causal or prospective prediction.
4. Results
As seen in Table 1, the time range for crime rates across Canada is from 1962 to the end of 2023. Table 2 and Table 3 show crime data for Vancouver and Toronto from 2002 to the end of 2023. Table 5 presents annual Canadian Newsstream mentions of the selected police organizations from 1969 through 2023. Table 1 and Table 2, and 3 at the bottom also show measures of central tendency for crime rates. Based on Table 1, the mean (μ) for total crime rates, violent crime rates, property crime rates, and other crime rates was 6,770, 762, 3,881, and 2,127, respectively. Moreover, the standard deviation (σ) for total crime rate, violent crime rate, property crime rate, and other crime rate was 1,866, 233, 1,286, and 621, respectively. Based on Table 2, the central tendency measures, specifically the mean (μ) for total crime incidents, violent crime incidents, property crime incidents, other crime incidents, and the Vancouver severity crime index, were 53,307, 6,365, 39,710, 7,232, and 110, respectively. Similarly, the standard deviation (σ) for the city of Vancouver for the total crime incidents, violent crime incidents, property crime incidents, other crime incidents, and severity index was 8,391, 754, 7,799, 1,269, and 26, respectively.
Finally, the central tendency results for the city of Toronto, based on Table 3, for the mean (μ) of the severity index and total incident-based crime were 59 and 132,413, while the standard deviation (σ) was 11 and 20,159, respectively. Table 4 describes the complete corpus retrieved through August 2025. The corpus included 1,454,781 records mentioning the RCMP, 98,195 mentioning Vancouver Police, and 211,631 mentioning Toronto Police. Because these totals include records published after 2023, they differ from the annual analytical series in Table 5, which ends in 2023. In Table 5, the mean annual numbers of RCMP, Vancouver Police, and Toronto Police mentions were 25,427, 1,720, and 3,624, respectively. The corresponding population standard deviations were 23,832, 1,613, and 3,541. The Toronto annual counts from 1969 through 2023 totalled 199,296. The original level-based models showed pronounced positive residual autocorrelation, particularly in the national analyses, with Durbin–Watson statistics ranging from 0.036 to 0.090. As shown in Table 6, none of the four national crime indicators was significantly associated with annual changes in RCMP-related media mentions. The coefficients were negative for total and property crime rates and positive for violent and other crime rates, but all confidence intervals included zero.
None of the Vancouver indicators reached the conventional .05 significance threshold. Annual changes in other crime incidents produced the closest result, β = 0.224, 95% CI [−0.007, 0.455], p = .056, but the association was not statistically significant. Annual changes in the Toronto Crime Severity Index and total incidents were also unrelated to changes in Toronto Police-related media mentions.
First differencing substantially reduced the residual dependence present in the level-based models. Durbin–Watson statistics ranged from 1.460 to 1.546 in the national models and from 1.713 to 2.269 in the municipal models. The AR(1) sensitivity analyses presented in Table 7 produced the same substantive conclusion: no crime indicator was significantly associated with annual changes in the corresponding media-mention series. The Vancouver other-crime coefficient was not significant in the AR(1) model, p = .200. Overall, the revised results do not demonstrate a consistent contemporaneous relationship between annual changes in crime and annual changes in the media visibility of the selected police organizations.
5. Discussion
After addressing temporal dependence, the analysis found no consistent associations between annual changes in recorded crime and annual changes in Canadian Newsstream mentions of the selected police organizations. This differs from the results obtained from the untransformed level series. The earlier apparent relationships were substantially influenced by long-term trends and dependence between successive annual observations. Neither the Newey–West first-difference models nor the AR(1) sensitivity models provided statistically significant evidence that year-to-year changes in the examined crime indicators corresponded with year-to-year changes in organizational media visibility.
These results do not establish that news organizations disregard changes in crime. The media measure captures mentions of selected police organizations rather than a validated census of crime reporting, and the annual counts may also reflect changes in Canadian Newsstream’s archival coverage. Nevertheless, the absence of robust relationships after accounting for temporal structure indicates that the original level-based associations should not be interpreted as evidence that crime rates predict media reporting. The findings instead demonstrate the importance of distinguishing shared historical trends from year-to-year correspondence in longitudinal media research.
From a systems perspective, the revised findings suggest that media visibility should not be understood as a simple reflection of annual crime patterns. After addressing temporal dependence, changes in the selected police-organization media counts were not consistently associated with changes in the corresponding crime indicators. Media attention may therefore reflect factors beyond aggregate crime levels, including exceptional events, journalistic news values, institutional communication practices, editorial priorities, and changes in the composition of the news archive. This interpretation is compatible with theoretical accounts in which informational systems contribute to public understandings of risk, legitimacy, and social order (Jozaghi, 2026a). However, the present results do not directly test how audiences interpret or respond to that information.
The findings should consequently be viewed as establishing a boundary condition for an agenda-setting interpretation rather than as direct evidence supporting agenda-setting effects. The study assesses whether annual crime indicators correspond with annual counts of news items mentioning selected police organizations; it does not measure public issue salience, audience exposure, fear of crime, or changes in public opinion. The absence of statistically significant relationships in the temporally adjusted models indicates that changes in objective crime alone did not consistently explain year-to-year changes in this measure of media visibility. This result does not imply that crime and media attention are entirely unrelated. Instead, it suggests that their relationship is contingent and may depend on crime type, geographic context, prominent incidents, and journalistic selection and framing processes.
The results also provide a cautious point of comparison with previous research. Prieto Curiel et al. (2020) reported that crime-related social media activity was not closely aligned with actual crime levels, despite its potential relationship with fear of crime. Similarly, Awais et al. (2020) examined relationships among crime-related media content and audience perceptions. The present study did not measure fear, perceived risk, or audience behaviour and therefore cannot determine whether the observed media content affected public attitudes. Taken together, this literature indicates the importance of distinguishing between objective crime patterns, media visibility, audience exposure, and public responses rather than treating them as interchangeable dimensions of the same process.
Historical and contemporary changes in communication technologies provide an important context for studying how information about crime circulates (Dressler & Fogleman, 2021; Philips, 2012; Jozaghi, 2026a). Nevertheless, the present data do not isolate an AI-related period, measure algorithmic recommendation, or assess the influence of social-media personalities, podcasters, or alternative media. They also cannot establish that media coverage or AI systems caused changes in sentencing, detention, bail, deportation, or other criminal-justice policies. Comparisons between earlier transformations in mass communication and the contemporary development of AI should therefore be treated as theoretical propositions for future research rather than as conclusions supported by the current analysis. Future studies could test these propositions using validated crime-content measures, information on archive composition and total publication volume, platform-level exposure data, audience surveys, and explicit comparisons between pre-AI and AI-related periods.
5. Limitations and Strengths
A strength of this study is its examination of national and municipal time series using a consistent set of annual crime indicators and reproducible organizational search terms. Despite its noted strength, this study overlooks newer forms of social media, including social networking sites, streaming services, gaming platforms, podcasters, and influencers, which are often powered by AI algorithms. Previous research has shown the significant potential of social media to shape public opinion through an AI-driven influencer economy (Jozaghi, 2025b; Jozaghi & VANDU, 2026; Jozaghi & Jozaghi, 2024, 2026). The Canadian Newsstream measure has two important limitations. First, searches for the RCMP, Vancouver Police, and Toronto Police measure the visibility of selected police organizations rather than the complete volume of crime reporting. Some retrieved records may concern organizational matters unrelated to crime, while crime reports that do not identify these organizations are excluded. Second, annual counts may be affected by changes in the number and composition of sources indexed by Canadian Newsstream.
The isolated RCMP record in 1969, absence of retrieved records from 1970 through 1976, and subsequent increase in counts may reflect incomplete early archive coverage rather than an actual absence or growth of eligible reporting. Because consistent annual denominators and source-composition data were unavailable, the study could not distinguish changes in editorial attention from changes in archive coverage. The results should therefore be interpreted as associations involving retrieved database counts, not as evidence of historical growth in Canadian crime reporting. Finally, the lack of pre-2002 data for Vancouver and Toronto exacerbated the micro-level crime challenge; the shorter municipal series also reduced statistical power and limited the precision of the Vancouver and Toronto estimates.
The study measures visibility within a mixed-source Canadian Newsstream corpus rather than within the broader contemporary information ecosystem. It does not measure algorithmic recommendations, social-media exposure, influencers, or audience engagement. Future studies should examine whether relationships between crime indicators and media visibility differ across traditional news sources, social-media platforms, and algorithmically curated environments.
7. Conclusions
This study examined whether annual changes in national and municipal crime indicators corresponded with changes in Canadian Newsstream mentions of the RCMP, Vancouver Police, and Toronto Police. Although analyses of the untransformed levels initially produced several statistically significant relationships, those models exhibited pronounced residual autocorrelation. After annual first differencing, Newey–West correction, and AR(1) sensitivity analysis, no crime indicator demonstrated a statistically significant and robust association with changes in the corresponding media-mention series. The findings therefore do not support claims that crime rates predict police-related media visibility or that increases in crime consistently generate increased reporting. They also cannot establish effects on public perceptions, agenda-setting, algorithmic exposure, or criminal-justice policy. Instead, the study shows the importance of addressing temporal dependence and archive composition when analyzing long-term media records. Future research should employ validated crime-news searches, normalize annual counts against archive volume, and incorporate direct measures of audience salience and exposure.
Supplementary Materials
All the material is retrieved from open sources on the World Wide Web and is available in the attached tables.
Author Contributions
Not applicable.
Funding
Not applicable.
Institutional Review Board Statement
Not applicable.
Informed Consent Statement
Not applicable.
Data Availability Statement
No new data were created, and all the material is available from the tables.
Acknowledgments
Not applicable.
Conflicts of Interest
Not applicable.
Abbreviations
The following abbreviations are used in this manuscript:
| AI: | Artificial Intelligence |
| UK: | United Kingdom of Great Britain and Northern Ireland |
References
- Awais, M., Abbas, S., Ali, F., & Ashraf, A. (2020). Media exposure and fear about crime: an application of mediated fear model. Journal of Social Sciences Research, 6(7), 720-726.
- Cohen, S. (2011). Folk devils and moral panics. Routledge.
- Chiricos, T., Eschholz, S., & Gertz, M. (1997). Crime, news and fear of crime: Toward an identification of audience effects. Social Problems, 44(3), 342-357.
- Davies, T., & Farrell, G. (2024). Most crime has fallen by 90% in 30 years – so why does the public think it’s increased? The Conversation. Link: https://theconversation.com/most-crime-has-fallen-by-90-in-30-years-so-why-does-the-public-think-its-increased-228797#.
- Dressler, N. K., & Fogleman, A. S. (2021). Criminal Transportation in the Atlantic World. Oxford Bibliographies. Link: https://www.oxfordbibliographies.com/display/document/obo-9780199730414/obo-9780199730414-0205.xml.
- Entman, R. M. (1993). Framing: Towards clarification of a fractured paradigm. McQuail’s reader in mass communication theory, 390, 397.
- Farrall, S. D., Jackson, J., & Gray, E. (2009). Social order and the fear of crime in contemporary times. Oxford University Press.
- Ferraro, K. F. (1995). Fear of crime: Interpreting victimization risk. SUNY press.
- Field, A. (2024). Discovering statistics using IBM SPSS statistics. Sage Publications Limited.
- Garland, D. (2001). The culture of control: Crime and social order in contemporary society. Oxford university press.
- Galtung, J., & Ruge, M. H. (1965). The structure of foreign news: The presentation of the Congo, Cuba and Cyprus crises in four Norwegian newspapers. Journal of Peace Research, 2(1), 64-90.
- Gerbner, G. (1980). The” Mainstreaming” of America: Violence Profile Nr 11. Annenberg School of Communications.
- Gershon, L. (2021). How Crime Stories Foiled Reform in Victorian Britain. JSTOR. Link: https://daily.jstor.org/how-crime-stories-foiled-reform-in-victorian-britain/.
- Harcup, T., & O’neill, D. (2017). What is news? News values revisited (again). Journalism Studies, 18(12), 1470-1488.
- Hsieh, C. C., & Pugh, M. D. (1993). Poverty, income inequality, and violent crime: a meta-analysis of recent aggregate data studies. Criminal Justice Review, 18(2), 182-202.
- Jozaghi, E., & VANDU (2022). The overdose epidemic: a study protocol to determine whether people who use drugs can influence or shape public opinion via mass media. Health & Justice, 10(1), 22.
- Jozaghi, E. (2024a). The initial stage of the Artificial Intelligence revolution: Access to basic income is a human rights issue. Journal of Health Care for the Poor and Underserved, 35(2), xv-xvi.
- Jozaghi, E. (2024b). The opioid epidemic and accessibility to free Wi-Fi: internet access is a human rights issue. Harm Reduction Journal, 21(1), 151.
- Jozaghi, E., & Jozaghi, P. (2024). A new innovative method for evaluating monarchies (crowns): A cost‒benefit analysis via social and mass media in a commonwealth country. [CrossRef]
- Jozaghi, E. (2025a). National Security During the First AI Revolution: The Case for Transforming Canada’s Security Apparatus. Canadian Public Administration/Administration Publique du Canada. [CrossRef]
- Jozaghi, E. (2025b). A new innovative method to evaluate public news broadcasting: Preserving democracy, culture, and identity during the first AI revolution. Journalism, 27(5), 1364-1385 . [CrossRef]
- Jozaghi, E. (2025c). Criminal code reform during the AI revolution and the age of misinformation and disinformation to counter the new form of colonialism of Indigenous peoples. Decolonization of Criminology and Justice, 7(2), 73-104.
- Jozaghi, E., & VANDU (2025). A major stakeholder in the lobbying efforts: The role of people who use drugs in the past and the current opioid crisis. BMC Public Health, 25(1), 1-8. [CrossRef]
- Jozaghi, E., & VANDU (2026). The power of people who use drugs as mass media influencers in changing public opinion during the global overdose epidemic. Substance Abuse Treatment, Prevention, and Policy, 21, 23 (2026). [CrossRef]
- Jozaghi, E. (2026a). The evolution of democracy as an entropic, fragile, emergent system: Industrial and AI revolutions. Philosophies, 11(3), 86. [CrossRef]
- Jozaghi, E. (2026b). “Not My King”: A Qualitative Examination of Anti-Monarchist Movement via YouTube. Journalism and Media, 7(2), 107. [CrossRef]
- Jozaghi, E. (2026c). Code pink: Leverage social media platforms to bypass traditional media gatekeepers and construct alternative public narratives. Journalism and Media, 7(2), 94. [CrossRef]
- Jozaghi, E., & Jozaghi, P. (2026). Monarchy as a mega-influencer: A Cost–benefit analysis of the royal family in the algorithmic driven AI economy. Social Sciences, 15(5), 306; [CrossRef]
- Karadeglija, A. (2025a). Feds to table bill with tougher bail, sentencing provisions in fall: Fraser. The Global News. Link: https://globalnews.ca/news/11260304/canada-tougher-bail-sentencing-conditions-sean-fraser/.
- Karadeglija, A. (2025b). With Ottawa promising bail reform, what’s driving the debate? The National Post.
- Kelly, M. (2000). Inequality and crime. Review of Economics and Statistics, 82(4), 530–539.
- Kulkarni, A. (2024). Premiers send letter to feds demanding bail reform after homicide. CBC News. Link: https://www.cbc.ca/news/canada/british-columbia/premier-letter-bail-reform-tori-dunn-1.7271818.
- McCombs, M. E., & Shaw, D. L. (1972). The agenda-setting function of mass media. Public Opinion Quarterly, 36(2), 176-187.
- Morgan, M., Shanahan, J., & Signorielli, N. (2015). Yesterday’s new cultivation, tomorrow. Mass Communication and Society, 18(5), 674-699.
- Philips, D. (2012). Crime, law, and punishment in the Industrial Revolution. In The Industrial Revolution and British Society (pp. 156–182). [CrossRef]
- Prieto Curiel, R., Cresci, S., Muntean, C. I., & Bishop, S. R. (2020). Crime and its fear in social media. Palgrave Communications, 6(1).
- Sampson, R. J., Raudenbush, S. W., & Earls, F. (1997). Neighborhoods and violent crime: A multilevel study of collective efficacy. Science, 277(5328), 918-924.
- Sampson, R. J., & Raudenbush, S. W. (2001). Disorder in urban neighborhoods: Does it lead to crime? Criminology, 39(4), 887–917.
- Statistics Canada. (2025a). Incident-based crime statistics, by detailed violations, police services in Ontario. Link: https://www150.statcan.gc.ca/t1/tbl1/en/tv.action?pid=3510018001&pickMembers%5B0%5D=1.200&pickMembers%5B1%5D=2.1&cubeTimeFrame.startYear=1998&cubeTimeFrame.endYear=2024&referencePeriods=19980101%2C20240101.
- Statistics Canada. (2025b). Police-reported crime rates, Canada, 1962 to 2023, rate per 100,000 population. Link: https://www150.statcan.gc.ca/n1/daily-quotidien/240725/cg-b002-eng.htm.
- Statistics Canada. (2025c). Police-reported Crime Severity Indexes, Canada, 2014 to 2024. Link: https://www150.statcan.gc.ca/n1/daily-quotidien/250722/t001a-eng.htm.
- Statistics Canada. (2025d). Incident-based crime statistics, by detailed violations, police services in Ontario. Link: https://www150.statcan.gc.ca/t1/tbl1/en/tv.action?pid=3510018001&pickMembers%5B0%5D=1.200&pickMembers%5B1%5D=2.1&cubeTimeFrame.startYear=1998&cubeTimeFrame.endYear=2024&referencePeriods=19980101%2C20240101.
- Statistics Canada. (2025e). Crime severity index and weighted clearance rates, Canada, provinces, territories and Census Metropolitan Areas. Link: https://www150.statcan.gc.ca/t1/tbl1/en/tv.action?pid=3510002601.
- Statistics Canada. (2025f). Police-reported crime statistics in Canada, 2024. Link: https://www150.statcan.gc.ca/n1/daily-quotidien/250722/dq250722a-eng.htm.
- Surette, R. (2011). Media, Crime, and Criminal Justice: Images, Realities, and Policies (4th). Belmont, CA: Wadsworth.
- Tonry, M. (2014). Why crime rates are falling throughout the Western world. Crime and Justice, 43(1), 1–63.
- Vancouver Police Department. (2025). Crime Statistics. Link: https://vpd.ca/crime-statistics/.

Table 1.
Canadian crime rates reported by Statistics Canadaβ.
 |
βStatistics Canada, 2025b.
Table 2.
City of Vancouver crime numbers retrieved from VPD and Statistics Canadaβα£.
 |
βVancouver Police Department, 2025, αStatistics Canada, 2025c, £Statistics Canada, 2025e
Table 3.
City of Toronto crime numbers retrieved from Statistics Canada.βα.
| Year | Toronto Severity Index | Toronto Incident-based crime |
| 2,002 | 79 | 174,398 |
| 2,003 | 77 | 163,760 |
| 2,004 | 72 | 149,169 |
| 2,005 | 72 | 149,135 |
| 2,006 | 73 | 152,286 |
| 2,007 | 71 | 144,156 |
| 2,008 | 67 | 136,434 |
| 2,009 | 64 | 131,791 |
| 2,010 | 60 | 124,737 |
| 2,011 | 56 | 121,024 |
| 2,012 | 53 | 114,273 |
| 2,013 | 47 | 107,823 |
| 2,014 | 45 | 105,459 |
| 2,015 | 46 | 106,400 |
| 2,016 | 48 | 111,171 |
| 2,017 | 50 | 118,330 |
| 2,018 | 54 | 131,527 |
| 2,019 | 54 | 134,902 |
| 2,020 | 47 | 114,134 |
| 2,021 | 46 | 116,471 |
| 2,022 | 53 | 137,380 |
| 2,023 | 59 | 168,328 |
| μ | 59 | 132,413 |
| σ | 11 | 20,159 |
βStatistics Canada, 2025a, αStatistics Canada, 2025d
Table 4.
Retrieved Canadian Newsstream records mentioning selected police organizations, by source category©.
Table 4.
Retrieved Canadian Newsstream records mentioning selected police organizations, by source category©.
| Types of articles | the RCMP | Vancouver Police | Toronto Police |
| News paper | 1,214,932 | 76,390 | 141,468 |
| Blogs, Podcasts, & Websites | 134,659 | 12,468 | 46,379 |
| Wire Feeds | 92,670 | 8,689 | 21,881 |
| Other Sources | 11,641 | 580 | 1,873 |
| Reports | 487 | 3 | 5 |
| Magazines | 238 | 7 | 25 |
| Trade Journals | 154 | 58 | 0 |
| Total | 1,454,781 | 98,195 | 211,631 |
©Data collected in August 2025.
Table 5.
Annual Canadian Newsstream mentions of selected police organizations.
| Year | RCMP | Vancouver Police | Toronto Police |
| 1969 | 1 | 0 | 0 |
| 1970 | 0 | 0 | 0 |
| 1971 | 0 | 0 | 0 |
| 1972 | 0 | 0 | 0 |
| 1973 | 0 | 0 | 0 |
| 1974 | 0 | 0 | 0 |
| 1975 | 0 | 0 | 0 |
| 1976 | 0 | 0 | 0 |
| 1977 | 357 | 1 | 21 |
| 1978 | 1,131 | 18 | 211 |
| 1979 | 694 | 23 | 202 |
| 1980 | 627 | 17 | 365 |
| 1981 | 791 | 22 | 582 |
| 1982 | 706 | 25 | 655 |
| 1983 | 828 | 28 | 674 |
| 1984 | 838 | 51 | 824 |
| 1985 | 1,984 | 43 | 924 |
| 1986 | 3,405 | 89 | 754 |
| 1987 | 5,543 | 674 | 1,238 |
| 1988 | 5,750 | 645 | 1,387 |
| 1989 | 9,036 | 924 | 1,278 |
| 1990 | 9,400 | 923 | 1,000 |
| 1991 | 9,899 | 1,028 | 1,316 |
| 1992 | 9,644 | 1,203 | 2,064 |
| 1993 | 9,697 | 1,097 | 1,582 |
| 1994 | 12,054 | 1,438 | 1,674 |
| 1995 | 11,828 | 1,049 | 1,138 |
| 1996 | 11,840 | 957 | 1,304 |
| 1997 | 13,824 | 1,236 | 1,117 |
| 1998 | 21,303 | 1,444 | 2,420 |
| 1999 | 34,448 | 2,124 | 4,393 |
| 2000 | 43,146 | 2,680 | 5,354 |
| 2001 | 42,708 | 1,875 | 3,535 |
| 2002 | 44,316 | 3,741 | 4,177 |
| 2003 | 41,602 | 3,617 | 5,575 |
| 2004 | 48,539 | 4,108 | 6,043 |
| 2005 | 55,870 | 3,445 | 5,850 |
| 2006 | 58,456 | 4,437 | 4,789 |
| 2007 | 59,035 | 4,548 | 5,170 |
| 2008 | 61,241 | 4,038 | 5,903 |
| 2009 | 61,135 | 4,145 | 5,751 |
| 2010 | 68,694 | 4,644 | 7,685 |
| 2011 | 60,906 | 5,324 | 6,481 |
| 2012 | 56,602 | 3,948 | 6,117 |
| 2013 | 55,198 | 2,615 | 7,961 |
| 2014 | 51,715 | 1,870 | 6,027 |
| 2015 | 55,991 | 1,854 | 8,167 |
| 2016 | 47,992 | 1,812 | 10,950 |
| 2017 | 41,149 | 1,914 | 10,957 |
| 2018 | 51,225 | 3,407 | 13,179 |
| 2019 | 53,833 | 3,214 | 10,037 |
| 2020 | 47,425 | 3,140 | 8,568 |
| 2021 | 40,333 | 3,640 | 7,555 |
| 2022 | 38,880 | 3,204 | 8,322 |
| 2023 | 36,892 | 2,324 | 8,020 |
| Total | 1,398,511 | 94,603 | 199,296 |
| μ | 25,427 | 1,720 | 3,624 |
| σ | 23,832 | 1,613 | 3,541 |
Note. μ denotes the arithmetic mean and σ denotes the population standard deviation across the 55 annual observations from 1969 through 2023.
Table 6.
First-difference regressions of annual changes in police-organization media mentions.
| Crime indicator | n | β | Newey-West SE | 95% CI | p | Adjusted R² | Durbin-Watson | BG p |
| Canada total crime rate | 54 | -1.443 | 1.968 | [-5.391, 2.506] | .467 | -.006 | 1.504 | .073 |
| Canada violent crime rate | 54 | 5.312 | 17.956 | [-30.720, 41.343] | .769 | -.018 | 1.460 | .052 |
| Canada property crime rate | 54 | -2.991 | 2.869 | [-8.748, 2.766] | .302 | .010 | 1.546 | .100 |
| Canada other crime rate | 54 | 0.191 | 4.773 | [-9.388, 9.769] | .968 | -.019 | 1.466 | .053 |
| Vancouver total incidents | 21 | -0.021 | 0.033 | [-0.090, 0.049] | .538 | -.040 | 1.768 | .677 |
| Vancouver violent incidents | 21 | 0.744 | 0.468 | [-0.235, 1.723] | .128 | .052 | 1.870 | .927 |
| Vancouver property incidents | 21 | -0.044 | 0.038 | [-0.125, 0.036] | .264 | -.002 | 1.852 | .810 |
| Vancouver other incidents | 21 | 0.224 | 0.110 | [-0.007, 0.455] | .056 | .042 | 1.776 | .787 |
| Vancouver Crime Severity Index | 21 | -18.012 | 12.792 | [-44.787, 8.763] | .175 | -.029 | 1.713 | .591 |
| Toronto Crime Severity Index | 21 | 59.305 | 72.380 | [-92.187, 210.798] | .423 | -.030 | 2.269 | .455 |
| Toronto total incidents | 21 | 0.008 | 0.020 | [-0.034, 0.050] | .681 | -.048 | 2.249 | .451 |
Note. The dependent variable is the annual change in retrieved Canadian Newsstream mentions of the corresponding police organization. National models use Newey-West lag 3; municipal models use lag 2. BG = lag-one Breusch-Godfrey test.
Table 7.
AR(1) sensitivity analysis of annual changes in police-organization media mentions.
| Crime indicator | β | SE | 95% CI | p | AR(1) ρ |
| Canada total crime rate | -0.901 | 1.937 | [-4.790, 2.988] | .644 | .253 |
| Canada violent crime rate | 9.675 | 21.179 | [-32.844, 52.195] | .650 | .271 |
| Canada property crime rate | -2.039 | 2.719 | [-7.499, 3.420] | .457 | .237 |
| Canada other crime rate | 0.014 | 6.030 | [-12.091, 12.119] | .998 | .265 |
| Vancouver total incidents | -0.015 | 0.045 | [-0.111, 0.080] | .738 | .104 |
| Vancouver violent incidents | 0.735 | 0.530 | [-0.379, 1.850] | .183 | .022 |
| Vancouver property incidents | -0.041 | 0.047 | [-0.139, 0.057] | .392 | .059 |
| Vancouver other incidents | 0.224 | 0.169 | [-0.130, 0.579] | .200 | .063 |
| Vancouver Crime Severity Index | -19.822 | 31.371 | [-85.730, 46.086] | .535 | .118 |
| Toronto Crime Severity Index | 67.862 | 85.181 | [-111.097, 246.821] | .436 | -.164 |
| Toronto total incidents | 0.016 | 0.028 | [-0.044, 0.075] | .589 | -.156 |
Note. AR(1) ρ is the estimated first-order residual autocorrelation coefficient.
Disclaimer/Publisher’s Note: The statements, opinions and data contained in all publications are solely those of the individual author(s) and contributor(s) and not of MDPI and/or the editor(s). MDPI and/or the editor(s) disclaim responsibility for any injury to people or property resulting from any ideas, methods, instructions or products referred to in the content. |
© 2026 by the authors. Licensee MDPI, Basel, Switzerland. This article is an open access article distributed under the terms and conditions of the Creative Commons Attribution (CC BY) license (http://creativecommons.org/licenses/by/4.0/).
Copyright: This open access article is published under a Creative Commons CC BY 4.0 license, which permit the free download, distribution, and reuse, provided that the author and preprint are cited in any reuse.