

Submitted:
21 September 2026
Posted:
24 September 2026
You are already at the latest version
Abstract
Graphene oxide (GO) is a widely used biocompatible nanomaterial, whose unique carbon-based structure bears an abundance of oxygen-containing functional groups. An increasing number of investigations have been implemented on the effects of GO on plants due to its hydrophilicity and biocompatibility. Employing the GO (6 mg/L) synthesized by our group it was found that GO promoted the growth rate of poplar roots tissue culture seedlings. The intuitive TEM images of these root cell samples depicted that high concentrations of GO ( > 6 mg/L) can lead to two physiological changes (plasmolysis and an increased number of starch grains). From these images, it can be seen that GO adhered to the cell membrane on the inner side of the cell wall. In order to gain insight about GO’s oxidation on the adventitious roots, antioxidant enzymes’activities, such as polyphenol oxidase (POD), catalase (CAT) and superoxide dismutase (SOD) were measured.The data showed that SOD、POD and CAT were increased significantly compared with the control group, the range of the increase in multiples is between 2.8 and 4.5. Transcriptome gene testing data indicated that related gene expressions were enhanced at low concentration of GO, but inhibited at high concentration. This work confirms that GO of appropriate size and concentration can promote the growth of poplar tissue culture seedlings.
Keywords:
graphene oxide
; tissue culture seedlings of poplar
; plant-growth-promoting
Introduction
In recent years, there has been an increasing amount of literature on carbon nano-fertilizers used in agriculture[1,2,3]. Graphene oxide (GO) is classfied as carbon nanomaterials with the two-dimensional planar structure. After the graphene is oxidized, C=O, C-OH, -COOH and other oxygen-containing hydrophilic functional groups are created forming a dense carbon surface. The GO layers combine to form a covalent-bond graphite which is a hydrophilic polymer with good water solubility and biocompatibility[4,5,6].
There are a number of studies on the potential application of GO in agriculture. Exploring the effect of GO on plant growth and development as well as its mechanism of action is necessary to evaluate their potential application in agriculture[7,8]. Even-though it has been reported that in water cultures GO showed toxicity on plants’ growing. For example, rice has experienced oxidative damage under 100 and 250 mg/L GO treatment[9]. GO (0.1-10 mg/L) significantly inhibited the growth of microalgae cells after 6 days of exposure[10]. Severe inhibition of oat root length was observed in hydroponic cultures with GO concentrations of 0.8 and 2.0 mg/ml[11]. However, under the conditions of soil culture and medium culture, a low concentration of GO has a positive effect on plants. GO (0.1 mg/L) treatment reduced the time required for adventitious root formation and changed the way of adventitious root formation; 0.1 and 1 mg/L GO increased the rooting rate[12]. The treatment of 0.1-10 mg/L GO can increase the root length, leaf area, leaf number and flower bud formation of watermelon. Furthermore, GO affected the maturity of watermelon, increased the perimeter and sugar content of the fruit[13]. One of the explanations for these observations is that the interaction between GO and soil or culture medium limited the transportation of GO in soil which reduces the contact between GO and root and greatly reduces its toxicity.
The Datong area of Shanxi province, which belongs to the alluvial plain of Sanggan River Basin, has huge reserves of coal and graphite. Because of the Sanggan River, there are also fast-growing and high-yielding forests in which poplar trees are harvested for timber, protection, water conservation, carbon sequestration, improvement of microclimate, and vegetation restoration. As a model plant for forestry research, poplar has excellent experimental characteristics: it has strong adaptability, fast growth and good yield; it is easy to carry out interspecific hybridization and asexual reproduction; it has established a complete genetic transformation system; its genome is relatively small, about 450-550 Mbp, which is good for performing genetic research[14,15]. Populus tremula linn or poplar is a tree species belonging to the genus populus. This tree species has similar excellent characteristics such as rapid growth, good wood properties, and strong resistance to diseases and insect pests. It is an excellent tree species for growing timber forests and shelter forest[16,17].
In this study, under the influence of GO, the alterations of cell architecture and root morphology of poplar tissue culture seedlings were investigated using TEM and a root scanner. The oxidative stress of poplar tissue culture seedlings from the GO were also studied. As well as its molecular mechanisms on plant growth and inhibition based on transcriptome genomics information, i.e. the relative expression of CYP81, WOX and TPR genes were tested. Thus, we determined the effect on the growth of poplar tissue culture seedlings from GO under the optimal GO concentration, which could provide help for industrial seedling cultivation.
Materials and Methods
Materials
Graphene (GO) sol was provided by Carbon Materials of Shanxi Datong University. We used the high-quality seedlings reserved in the tissue culture room of the Science and Technology Center of the Poplar Bureau of Shanxi Province. We took the same parts of the European Populus spp. tissue culture seedlings, trimmed them into 2 cm long stems with no top buds and no leaves, and add different concentrations (1, 2, 3, 4, 5, 6, 7, 8, 9, 10mg/L) GO sol medium (1/2 Murashige and Skoog, MS, + 0.05mg/L α-naphthaleneacetic acid+0.3mg/L indolebutyric acid) for rooting culture. MS is a commercially available tissue culture medium. The sample codes of S1-S10 correspond to the 10 aforementioned concentrations, and control group (no GO sol) was coded CK. In the experiment, 30 bottles of tissue cultures were processed for each GO concentration. All tissue cultur seedlings were exposed to the same light, with an intensity of 2 000 LX for 14 h per day, and the culture was conducted for 30 days at 25 ± 2 ℃.
The analytical balance used was a FA1104, the centrifuge used was a TGL-21M, the flatbed scanner used was a Epson Perfection V850 Pro, and the oven used was a DHG-903A. The transmission electron microscope ( TEM ) and energy dispersive spectrometer ( EDS ) were provided by China Agricultural University, and the model was HITACH H-7500.
Peroxidase (POD), superoxide dimutase (SOD), catalase (CAT) activities were analyzed with the kits (POD-2-Y, SOD-2-Y, CAT-2-Y, MDA-2-Y) from the Nanjing Jiancheng Bioengineering Institute, Nanjing, China.
Determination of Relative Water Content of Poplar Tissue Culture Seedlings
The plants of each experimental group and the control group were harvested. The plantlets were cut off from the root base, and the fresh mass (FM) of the roots was weighed with an analytical balance. Then they were quickly immersed in distilled water, soaked for 6-8 h. The surface water was gently absorbed with filter paper, and the mass was called turgid mass (TM). The root was next put in the oven, first dried at 105 ℃ for 30min, then at 80 ℃ for 2h, then the mass was weighed for the first time, and then it was dried for 1 h and re-weighed. If the mass is consistent within the allowable range of error, it is recorded as the dry mass (DM). The relative water content (RWC) in the root is calculated as follows:
Determination of Root Morphology of Poplar Tissue Culture Seedlings
The seedlings samples were imaged by a flatbed scanner (Epson Perfection V850 Pro.) and the image data of the plant roots was analyzed by the software (winRHIZO) to determine the total root length, total root surface area, total root volume and root tip number. Three repetitions were measured and the averaged values were obtained to represent the actual measured values.
Determination of Protective Enzyme Activity in Poplar Tissue Culture Seedlings
The activities of protective enzymes (i.e. POD, CAT, SOD) were determined by the method reported in Chen et al[18]. POD, CAT, SOD activity assay kits were obtained from the Nanjing Jiancheng Bioengineering Institute, Nanjing, China, and used in accordance with the instructions of the kits. The tissue culture seedlings of poplar were treated with liquid nitrogen and homogenized, and then centrifuged at 3000 rpm for 5 min. The supernatant liquid was taken as the samples, and SOD, POD, CAT activities were measured with the assay kits.
Microscopic Morphology and Imaging of Cell Interior of Poplar Tissue Culture Seedlings
TEM and EDS are provided by China Agriculture University & The Agricultural Products Processing Institute of the Academy of Sciences provides technical support. The instrument model is HITACH H-7500. The samples are the root tissues of the control group, and two test group 6mg/Land 9mg/L GO.
Gene Expression of Tissue Cultured Poplar Seedlings
The samples of the test group (6, 9 mg/L GO treatment) and the control group were washed and blotted dry with absorbent paper. After a brief treatment with liquid nitrogen, the samples are sent to Shanghai Ouyi Biomedical Technology Co., Ltd. for processing. After the extraction of the total RNA and digestion of the DNA with DNase, the mRNA was enriched using magnetic beads with oligonucleotides (dT); The mRNA was fragmented into short segments. With the fragmented mRNA as the template, cDNA was synthesized with six-base random primers, and then a two-strand reaction system was prepared to synthesize the double-stranded cDNA which was purified with the kit. The purified double-stranded cDNA was subjected to terminal repair and a tail was added. The cDNA was sequenced, then the fragment size was selected, and finally amplified by PCR; After the constructed library passed the quality inspection with Agilent 2100 Bioanalyzer, the library was sequenced with Illumina HiSeq 2500 to generate double-ended sequencing data. Based on the results, protein-coding gene expression analysis was performed. According to the expression level of protein coding genes in different samples, differential screening was performed. After five relevant differential genes were found, RT-qPCR was performed for validation.
Statistical Analysis
EXCEL was used for data presentation and preliminary processing, then SPSS Statistics 19.0 was used for data analysis, and Origin 8.5 was used for data visualization. The bar graphs were expressed in the form of mean ± standard deviation. The mean values of S1-10 were compared with CK using one-way ANOVA followed by the least significant difference (LSD) test.
Results
Characterization of Graphene Oxide
GO has many oxygen-containing functional groups, and the electrostatic repulsion generated by the edge-ionized carboxyl groups prevents the agglomeration of GO in the aqueous medium, thus resulting in the stable gel with water. The GO particles used in this work were synthesized by our group. The TEM images (Figure 1A) indicated that the GO sheets are spherically stacked, and the average diameter was approximately 200 nm. The longitudinal size of GO corresponds to its number of layers. It is well known that the interlayer spacing of graphene is 0.334 nm. Which when combined with the thickness of graphene, it can be deduced that the number of these graphene layers is about 5 layers[17,19]. After ultrasonic dispersion, GO sheets do not have clear boundaries (Figure 1B) and exhibit the typical features of superposition and corrugation. Our previous study used the same GO gel, its surface contains a certain amount of -COOH and -OH. The C/O of the GO is about 7/3, which can form hydrogen bonds with H2O and can maintain a stable gel dispersion in water[20].
Effects of GO on Root Growth of Tissue Cultured Poplar Seedlings
The dry weight of poplar tissue culture seedlings exposed to 5-8 mg/L GO increased significantly compared with CK. In addition, 6 mg/L GO has the maximum effect on poplar tissue culture seedlings, its dry weight was 1.7-fold that of the CK (Figure 2A). The relative water content increased significantly when the concentration of GO was 3-6mg/L, its maximum value (6mg/L) was 1.2-fold that of CK, but it decreased significantly when [GO] > 9 mg/L (Figure 2B). The root tip was the most active area of the root system. The absorption of inorganic salts and water are mainly through ion exchange and active absorption by the adventitious root tip[21]. After 4-7 mg/L GO treatment, the number of root tips of poplar tissue culture seedlings increased significantly, among which 6 mg/L GO treatment was the largest, 3.3-fold that of CK (Figure 2C). When the concentration of GO was 5-7 mg/L, the total root surface area increased significantly. The root surface area treated with 6mg/L GO was 1.9-fold that of CK (Figure 2D). Compared with CK, the total root length increased significantly after treatment with 5-6 mg/L GO, and the root length of poplar tissue culture seedlings with 6 mg/L GO was 2.6-fold that of CK (Figure 2E, 2F). The effect of GO on the total root volume of poplar tissue culture seedlings was similar to the total root surface area. When the GO concentration was 5-7mg/L, the root volume increased significantly. Compared with CK, the total root volume of poplar treated with 6mg/L GO was 2.8-fold that of CK. The aforementioned data and images clearly illustrate the observed trends that appropriate concentration of GO had a positive effect on the root development of poplar tissue culture seedlings. With the affection of GO, the root biomass of poplar tissue culture seedlings accumulated significantly, which improved the self-anchoring ability of the tissue culture seedlings. Stronger, more resilient roots promoted the better absorption of nutrients and water. When the GO concentration was > 5 mg/L, their root system was denser than CK and grown in multiple directions (Figure 2G). Comprehensive consideration the root morphological indices, 6 mg/L of GO was applied as the best treatment. In light of the chemical structure of GO, we undertook the investigation into its growth-promoting mechanism by assessing antioxidant enzyme activity.
Effects of GO on Protective Enzyme Activities in Poplar Tissue Culture Seedlings
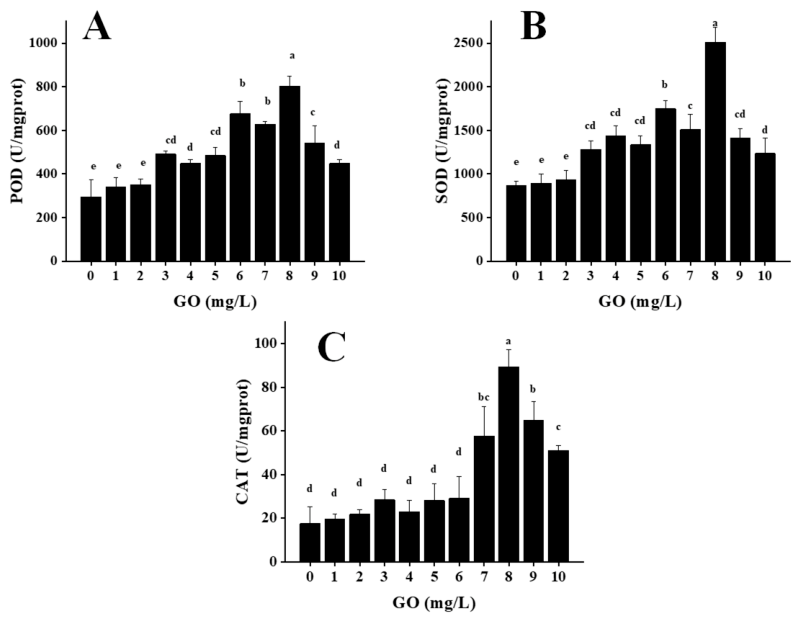
The test was conducted to determine the effects of GO on the activities of protective enzymes. From Figure 3, the results showed that, under 1-8mg/L treatments, the activities of superoxide dismutase (SOD), catalase (CAT), and peroxidase (POD) in roots increased gradually, but then declined at high concentrations (9 and 10 mg/L). The determination of activities of CAT and POD and contents of SOD were according to the reported methods. Which vary for each of the three antioxidant enzymes, data of POD was from 300-850 U/mgpro, data of SOD was from 800-2500 U/mgpro , and the data of CAT was 20-90 U/mgpro. However, despite the concentration difference, the amplification factors of the anzyme activity were close, at 2.833, 3.125 and 4.5 times, respectively. SOD is one of the crucial enzymes that protects cells against the oxidative damages, the activity of SOD in plants with strong stress resistance is greater than that of plants with weak stress resistance[22,23]. Higher POD activity can resist the increase of reactive oxygen species (ROS) in plants caused by environmental changes[24].The activity of CAT provides plants with antioxidant defense capabilities[25]. When the CAT activity is high, it results in damage to a variety of proteins, fats, carbohydrates and DNA in animal and plant cells, then the growth of cells negative [24,25].
A general trend we measured was that the enzyme activity of poplar tissue culture seedlings treated with GO was different from CK (Figure 5). The POD activity in poplar tissue culture seedlings exposed to 1-10mg/L GO increased, and there was a significant difference at 3-10mg/L. The POD activity was the highest at 8mg/L (804.3 U/mgpro), which was 2.7-fold that of CK (294.8 U/mgpro). Although there was a 3-fold difference, when GO> 8mg/L, POD activity decreased with the increase of GO concentration in poplar tissue culture seedlings (Figure 5a).
The change trend of SOD activity was similar to that of POD. When the concentration of GO was 3-10mg/L, POD activity increased significantly compared with CK. At 8mg/L, SOD activity was the highest (2512.3 U/mgpro), which was 2.9-fold that of CK (869.6 U/mgprot). When GO > 8mg/L, SOD activity decreased in poplar tissue culture seedlings.
Even-though, there was no significant difference in CAT activity between poplar tissue culture seedlings in 1-6mg/L GO and CK, but when GO > 6mg/L, CAT activity increased sharply and reached the maximum at 8mg/L GO, and then CAT activity decreased with the increase of GO concentration.
Under high concentration GO (> 8mg/L), the activities of the three enzymes decreased, which reflected the toxic effect of high concentration GO on poplar tissue culture seedlings. When the concentration of GO was 1-6mg/L, the activities of SOD and pod increased, indicating the improvement of oxidative stress ability of poplar tissue culture seedlings. When GO > 6mg/L, CAT activity increased sharply, and excessive CAT inhibited the growth of poplar tissue culture seedlings. This is consistent with the results of root morphological indexes.
From these physiological and biochemical indexes, it is estimated that these root tip cells can effectively eliminate accumulated peroxides through a synergistic enhancement of antioxidant enzymes, thereby mitigating oxidative stress induced by GO. Then the analysis of the microscopic morphology, elemental types and content within cell sections located in the root tip growth area using transmission electron microscopy (TEM) and energy dispersive spectrometry (EDS) were conducted.
Effects of GO on Morphology and Cell Interior of Tissue Culture Seedlings of Poplar
TEM tests of root tip cells shown that high concentration treatments would cause premature aging of tissue culture seedlings. It was observed from TEM that the root cells of poplar seedlings tissue culture exposed to 6mg / L GO had complete cell membrane and cell wall structure, and black GO particles attached to the cell edge (Figure 4A). These GO adhered to the cell membrane on the inner side of the cell wall, then enhanced the toughness and mechanical strength of the adventitious root cell, forming a solid protective layer, which is difficult for bacteria to invade, and is easy for root tip cells to elongate. TEM at the cell edge showed that GO and cell wall were significantly layered, and GO was attached to the cell membrane (Figure 4B). GO enters the cell and adheres to the inner wall of the cell membrane. There are obvious layers of GO, cell membrane, and cell wall (Figure 4C).
The EDS results indicated that the black particles are composed of carbon and oxygen, of which carbon accounts for about 82.31%, and oxygen accounts for about 17.69%. This resulted in a carbon /oxygen retio of ca. 4:1 since no other elements were identified (Figure 4.D, E, F and G). The carbon / oxygen ratio of GO was similar to the experimental results. The difference in carbon / oxygen may be due to the influence of the carbon-based structure in the cell, which leads to an increase in carbon/oxygen This indicates that the main component of black particles is GO.
When poplar tissue culture seedlings were exposed to 3 mg/L and 6 mg/L GO, the number of starch granules increased compared to the CK with the latter showing the greater improvement (Figure 4H, I and J). The significant increase in the number of starch granules is considered a cellular self-defense strategy. Accumulated starch granules may delay granule maturation, and may be related to mechanisms that adapt to the stress caused by nanomaterials[10,26].
When poplar tissue culture seedlings were exposed to high concentration of GO (9mg/L), significant plasmolysis was observed compared to the CK (Figure 4K, L and M). We believe that this is one kind of the toxic effects of high concentration GO on plant cells ached showing plasmolytic separation.
Effect of GO on Gene Expression of Poplar Tissue Culture Seedlings
From the transcriptome gene analysis, there were expression of multiple genes that participated in the regulation of root growth. The different genes expressed between poplar tissue culture seedlings treated with 3mg/L and 6mg/L GO and CK were analyzed by DESeq. The results showed that there were 518 genes expressed at different levels between the CK and 6 mg/L, of which 388 were up-regulated genes and 130 were down-regulated (Figure 5A). On the other hand, there were 1202 different genes expressed between the 9 mg/L GO and CK, of which 682 are up-regulated genes, and 520 are down-regulated genes (Figure 5B).
Cytochrome P450 family 81 (CYP81) are responsible for the activities of antioxidative enzymes[27]. WUSCHEL-related homeobox (WOX) genes are known to play important roles in regulating the development of plant tissues and organs by determining cell fate[28,29]. Tetratricopeptide repeat family (TPR), which are involved in mitosis and RNA synthesis[30]. In the present study, we analyzed the highest expression levels of five genes in poplar tissue culture seedlings. Where the primer sequences are shown in Table 1.
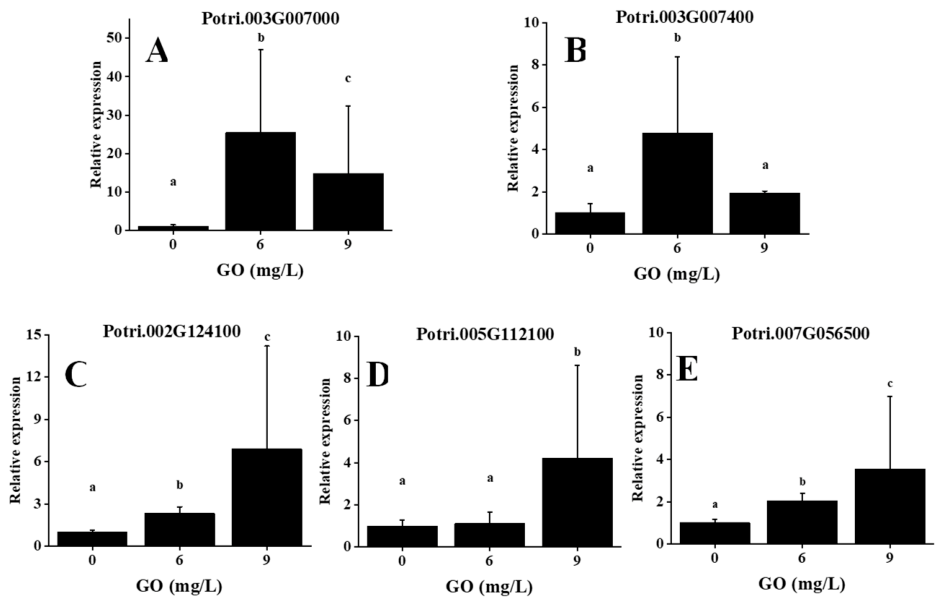
As shown in Figure 6, GO increased the expression levels of WOX and TPR family in a concentration-dependent way. When treated with GO at 9 mg/L, the expression levels of WOX family gene potri.002g124100 increased approximately 6.89-fold over the control levels (Figure 6.C), and the expression levels of TPR family gene potri.005G112100 and potri.007G056500 increased approximately 4.42 and 3.56-fold respectively over the control (Figure 6.D and E). It indicated that GO could increase the expression levels of cyp 81. When treated with GO at 6 mg/L, the expression levels of CYP81 family gene potri.003G007000 and potri.003G007400 increased approximately 25.47 and 4.77-fold respectively over the control levels (Figure 6.A and B). When the concentration of GO was 9 mg/L, the expression levels decreased to 14.80, it was 1.92-fold of the control (Figure 6.A and B). This result indicated that cell division, proliferation and root growth and development of the poplar tissue culture seedlings root can be significantly facilitated by GO application. But high concentrations of GO (≥9mg/L) will inhibit the expression levels of antioxidant enzyme genes and cause rapid accumulation of ROS in the plants, this negatively affects the growth rate compared to when low concentrations of GO are used.
Figure 4.
TEM images of root cells, (A) 5000x, (B) 100000x, (C) 200000x. (D) TEM images of cell edges. (E-F) shows the EDS microanalysis of carbon (red) and oxygen (green) in this selected area. (G) EDS spectra of image D. After treatment of 3 mg/L GO (I) and 6 mg/L GO (J), the cell membrane was intact and the number of starch granules increased as compared to the control CK (H). After treatment of 9 mg/mL GO (K-M), the cell membrane was detached showing plasmolysis.
Figure 4.
TEM images of root cells, (A) 5000x, (B) 100000x, (C) 200000x. (D) TEM images of cell edges. (E-F) shows the EDS microanalysis of carbon (red) and oxygen (green) in this selected area. (G) EDS spectra of image D. After treatment of 3 mg/L GO (I) and 6 mg/L GO (J), the cell membrane was intact and the number of starch granules increased as compared to the control CK (H). After treatment of 9 mg/mL GO (K-M), the cell membrane was detached showing plasmolysis.
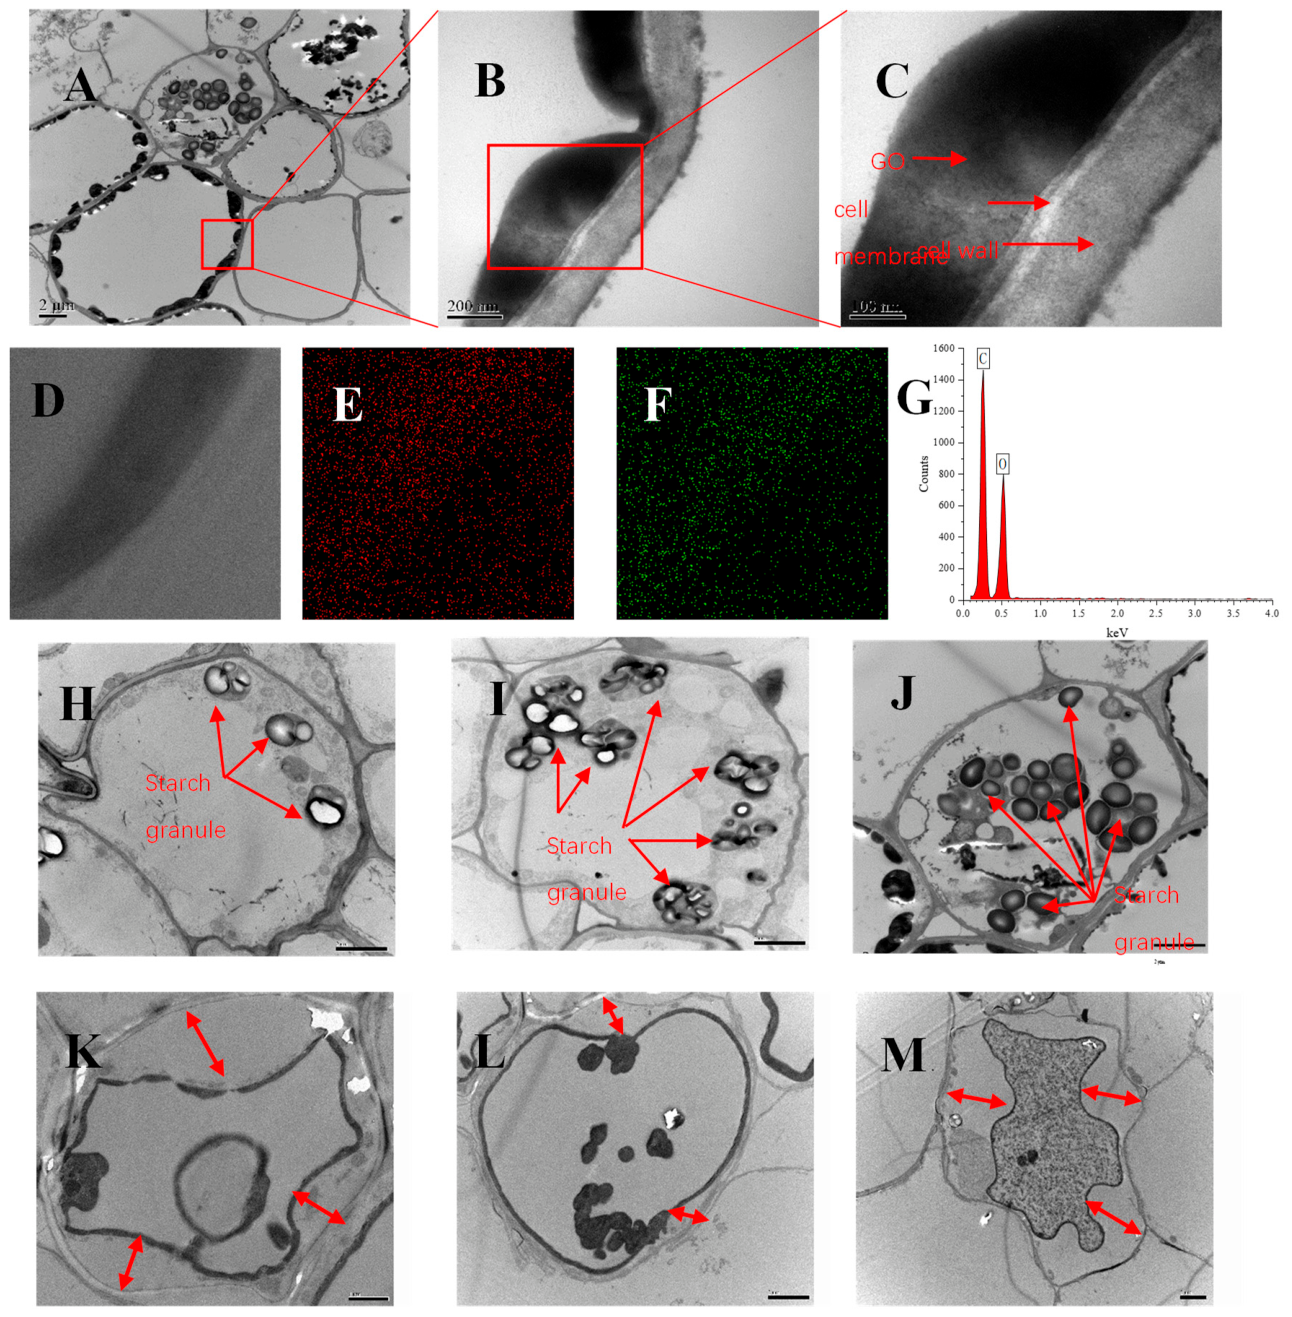
Figure 5.
Volcano plot of the distribution of genes expressed at different levels. (A) 6mg / ml GO and CK were compared. (B) 9mg / ml GO and CK were compared. Each point in the differential expression volcano plot represents a gene. Gray is the gene with nonsignificant difference in expression levels, and red (up-regulated) and green (down-regulated) are the genes with significant difference in expression levels.
Figure 5.
Volcano plot of the distribution of genes expressed at different levels. (A) 6mg / ml GO and CK were compared. (B) 9mg / ml GO and CK were compared. Each point in the differential expression volcano plot represents a gene. Gray is the gene with nonsignificant difference in expression levels, and red (up-regulated) and green (down-regulated) are the genes with significant difference in expression levels.
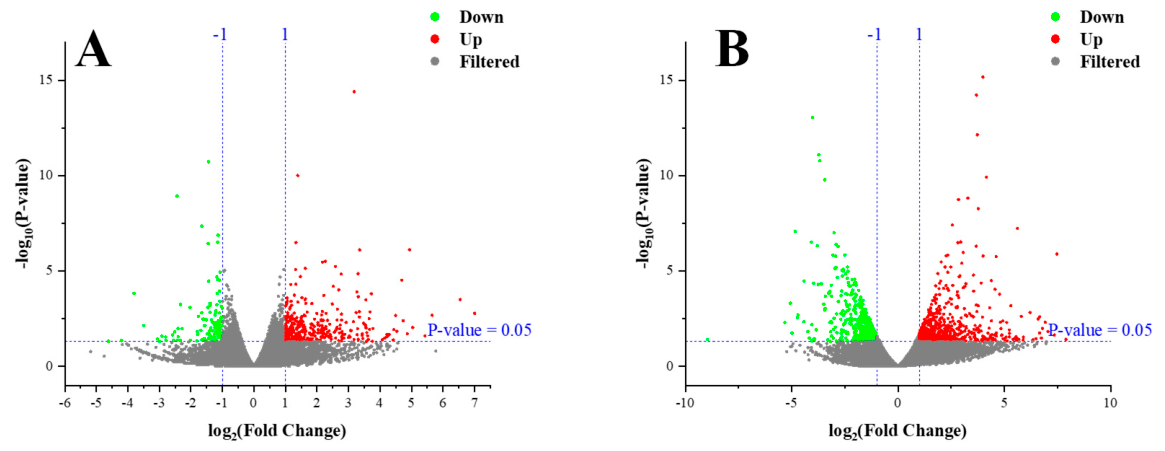

Table 1.
Primers for qRT-PCR.
| Gene name | Forward primer(5->3) | Reverse primer(5->3) | Product length(bp) | Tm(℃) |
|---|---|---|---|---|
| Potri.003G007000 | AGAGACTGCTGCTACATCTAT | TCTCCAACTTGAGCGTCC | 102 | 60 |
| Potri.003G007000 | TACTCAACCATCCAGACGTG | TTCTCCGAGATGATGCTCTGAA | 124 | 60 |
| Potri.002G124100 | GCTGGGTTTCAAGCGTTTAC | GCAAGATTTCTAGGGCCAC | 117 | 60 |
| Potri.005G112100 | GATGTGGAAGATTGGATGACC | CCTTGCAGTCTTTGTTCGT | 101 | 60 |
| Potri.007G056500 | AGCCCAAGAGTCTCTCGATAA | GCTTCAACAATGCTATTTGGTC | 83 | 60 |
Figure 6.
Relative expression levels of five genes in poplar seedlings treated with GO for 30 days. (A) and (B) are the expressions levels of the CYP81 genes (000 and 400); (C) is the expression of the WOX gene; (D) and (E) are the expression of the TPR genes (005 and 007). Mean values ± SD (n = 3). Different superscript letters indicate significant differences at P < 0.05 between groups.
Figure 6.
Relative expression levels of five genes in poplar seedlings treated with GO for 30 days. (A) and (B) are the expressions levels of the CYP81 genes (000 and 400); (C) is the expression of the WOX gene; (D) and (E) are the expression of the TPR genes (005 and 007). Mean values ± SD (n = 3). Different superscript letters indicate significant differences at P < 0.05 between groups.
Discussion
We believed that under the condition of agar medium, the appropriate concentration of GO can promote the length and toughness adventitious roots and the number of lateral roots. As well as have a positive impact on growth and stress resistance. At present, the response mechanism of GO regulating root development is not fully understood. We found that GO can be absorbed by root and concentrated in the inner face of the cell membrane, and increased cell wall toughness when the root samples were sliced for electron microscopic image.
After GO treatment, the number of starch granules in the cell was increased. Low concentrations of GO (6mg/L) will not cause obvious cells’ morphology changes, but when the concentration is higher (9mg/L), the cell wall is clarify. After 1-2mg/L GO treatment, the antioxidant enzymes in the plant did not increase significantly. However, 3-8mg/L GO did increase the expression of antioxidant enzymes in plant, while at 9-10 mg/L, the expression level of antioxidant enzymes began to decrease. We believed that high concentrations of GO (≥9mg/L) will inhibit the expression of antioxidant enzyme genes (i.e. CYP81) and cause rapid accumulation of ROS in plants. And when the GO concentration is 7-8mg/L, the CAT expression level is high. CAT is a kind of a metabolic waste when the content is high, which will damage a variety of proteins, fats, sugars and DNA in plant cells, which is detrimental for cell growth. According to the above results, GO can promote high expression of genes that regulate cell division, proliferation and root growth and development. However, when the GO concentration is too high, the cells will undergo plasmolysis, and excessive CAT or ROS will damage the cells. The results of root growth index and cell morphology showed that the growth was lower for poplar tissue cultured seedlings treated with high concentration of GO than that treated with low GO concentration.
In conclusion, under special conditions, GO could be used as a good kind of agricultural nano fertilizer. Compared with the effects of other additives on human health[31,32,33], myeloperoxidase from human neutrophils can biodegrade GO in the presence of a low concentration hydrogen peroxide[34]. Other than human health, GO can have great potential in agricultural production and biotechnology. However, the interaction between plants and GO is highly complex and depends on the shape, size, concentration, surface features of the GO, the species genotype, age of plant, and the environmental conditions. Thus, it is necessary to further study optimal application conditions of GO for different plants. Perhaps, it is more biocompatible than silicon fertilizer.
Acknowledgments
We thank the assistance of Dr. Yue Zhang from Institute of Genetics and Developmental Biology, Chinese Academy of Sciences and Dr. Jin Zhang and Dr. Zhiwen Chen of Institute of Carbon Materials Science, Shanxi Datong University for their support with data analysis. We would also like to thank Prof. Mingsheng Fan of China Agricultural University for his TEM technical support. This research supported by the Shanxi Scholarship Council of China (2021-144), Pingcheng District Science and Technology Project of Datong City (202107). We also acknowledge the funding from the Science and Technology Achievements Transformation Guide Project of Shanxi (201804D131041).
Notes
The authors declare no competing financial interest.
Abbreviations
GO, graphene oxidized; TEM, Transmission Electron Microscope; SOD, superoxide dismutase; POD, peroxidase; CAT, catalase; ROS, reactive oxygen species; CK, control check; FM, fresh mass; TM, turgid mass; DM, dry mass; RWC, Relative water content; EDS, Energy Dispersive Spectrometer; MS, Murashige and Skoog.
References
- Zhao, L.; Lu, L.; Wang, A.; Zhang, H.; Huang, M.; Wu, H.; Xing, B.; Wang, Z.; Ji, R. Nano-Biotechnology in Agriculture: Use of Nanomaterials to Promote Plant Growth and Stress Tolerance. J. Agric. Food Chem. 2020, 68(7), 1935–47. [Google Scholar] [CrossRef] [PubMed]
- Raliya, R.; Saharan, V.; Dimkpa, C.; Biswas, P. Nanofertilizer for Precision and Sustainable Agriculture: Current State and Future Perspectives. J. Agric. Food Chem. 2018, 66(26), 6487–503. [Google Scholar] [CrossRef] [PubMed]
- Chhipa, H. Nanofertilizers and nanopesticides for agriculture. Environ. Chem. Lett. 2017, 15(1), 15–22. [Google Scholar] [CrossRef]
- Yang, H.; Shan, C.; Li, F.; Han, D.; Zhang, Q.; Niu, L. Covalent functionalization of polydisperse chemically-converted graphene sheets with amine-terminated ionic liquid. Chem. Commun. (Camb) 2009, ((26)), 3880–2. [Google Scholar] [CrossRef] [PubMed]
- He, H.; Klinowski, J.; Forster, M.; Lerf, A. A new structural model for graphite oxide. Chem. Phys. Lett. 1998, 287(1-2), 53–56. [Google Scholar] [CrossRef]
- Chen, D.; Feng, H.; Li, J. Graphene oxide: preparation, functionalization, and electrochemical applications. Chem. Rev. 2012, 112(11), 6027–53. [Google Scholar] [CrossRef] [PubMed]
- Yang, Y.; Zhang, R.; Zhang, X.; et al. Effects of Graphene Oxide on Plant Growth: A Review[J]. Plants 2022, 11(21), 2826. [Google Scholar] [CrossRef] [PubMed]
- Zhang, X.; Cao, H.; Wang, H.; et al. The Effects of Graphene-Family Nanomaterials on Plant Growth: A Review[J]. Nanomaterials 2022, 12(6), 936. [Google Scholar] [CrossRef] [PubMed]
- Zhang, P.; Guo, Z.; Luo, W.; Monikh, F. A.; Xie, C.; Valsami-Jones, E.; Lynch, I.; Zhang, Z. Graphene Oxide-Induced pH Alteration, Iron Overload, and Subsequent Oxidative Damage in Rice (Oryza sativa L.): A New Mechanism of Nanomaterial Phytotoxicity. Environ. Sci. Technol. 2020, 54(6), 3181–90. [Google Scholar] [CrossRef] [PubMed]
- Hu, X.; Lu, K.; Mu, L.; Kang, J.; Zhou, Q. Interactions between graphene oxide and plant cells: Regulation of cell morphology, uptake, organelle damage, oxidative effects and metabolic disorders. Carbon 2014, 80, 665–76. [Google Scholar] [CrossRef]
- Chen, L.; Yang, S.; Liu, Y.; Mo, M.; Guan, X.; Huang, L.; Sun, C.; Yang, S.-T.; Chang, X.-L. Toxicity of graphene oxide to naked oats (Avena sativa L.) in hydroponic and soil cultures. RSC Adv. 2018, 8(28), 15336–43. [Google Scholar] [CrossRef] [PubMed]
- Li, F.; Sun, C.; Li, X.; Yu, X.; Luo, C.; Shen, Y.; Qu, S. The effect of graphene oxide on adventitious root formation and growth in apple. Plant Physiol. Biochem 2018, 129, 122–29. [Google Scholar] [CrossRef] [PubMed]
- Park, S.; Choi, K. S.; Kim, S.; Gwon, Y.; Kim, J. Graphene Oxide-Assisted Promotion of Plant Growth and Stability. Nanomaterials 2020, 10, 758. [Google Scholar] [CrossRef] [PubMed]
- Bradshaw, H. D.; Ceulemans, R.; Davis, J.; Stettler, R. Emerging Model Systems in Plant Biology: Poplar (Populus) as A Model Forest Tree. J. Plant Growth Regul. 2000, 19(3), 306–13. [Google Scholar] [CrossRef]
- Brunner, A. M.; Busov, V. B.; Strauss, S. H. Poplar genome sequence: functional genomics in an ecologically dominant plant species. Trends Plant Sci. 2004, 9(1), 49–56. [Google Scholar] [CrossRef] [PubMed]
- Caudullo, G.; de Rigo, D. Populus tremula in Europe: distribution, habitat, usage and threats. In European Atlas of Forest Tree Species; San-Miguel-Ayanz, J., de Rigo, D., Caudullo, G., Houston Durrant, T., Mauri, A., Eds.; Publ. Off. EU, Luxembourg, 2016; pp. 138–9. [Google Scholar]
- Jian-zhong, Y.; Zhan-cai, Z.; Bin-long, X.; Yu-quan, Z.; Xiao-fei, H.; Bao-yan, X.; Hai-yan, W.; He-he, B.; Xin-jie, L.; Jian-guo, Z. Effect of Graphene on Adventitious Roots’Morphology of Tissue Culture Seedlings of Populus Davidiana (in china). J. Shanxi Datong Univ. (Natural Science) 2018, 34, 6–9. [Google Scholar]
- Chen, L.; Wang, C.; Li, H.; Qu, X.; Yang, S. T.; Chang, X. L. Bioaccumulation and Toxicity of (13)C-Skeleton Labeled Graphene Oxide in Wheat. Environ. Sci. Technol. 2017, 51(17), 10146–53. [Google Scholar] [CrossRef] [PubMed]
- Chen, Zhiwen; Zhao, Jianguo; Liu, Zehui; Bai, Xiuli; Li, Weijia; Guan, Zhifang; Zhou, Ming; Zhu, Hongwei. Graphene-Delivered Insecticides against Cotton Bollworm. Nanomaterials 2022, 12, 2731. [Google Scholar] [CrossRef] [PubMed]
- Hu, X.-f.; Zhao, J.-g.; Gao, L.-y.; Wang, H.-y.; Xing, B.-y.; Yao, J.-z.; Zhou, Y.-q.; Xue, B.-l.; Xue, W. Effect of graphene on the growth and development of Raspberry tissue culture seedlings (in china). New Carbon Mater. 2019, 34(5), 447–454. [Google Scholar]
- Wang, H.; Inukai, Y.; Yamauchi, A. Root Development and Nutrient Uptake. Crit. Rev. Plant Sci. 2006, 25(3), 279–301. [Google Scholar] [CrossRef]
- Li, Z.; Han, X.; Song, X.; Zhang, Y.; Jiang, J.; Han, Q.; Liu, M.; Qiao, G.; Zhuo, R. Overexpressing the Sedum alfredii Cu/Zn Superoxide Dismutase Increased Resistance to Oxidative Stress in Transgenic Arabidopsis. Front Plant Sci. 2017, 8, 1010. [Google Scholar] [CrossRef] [PubMed]
- Wang, W.; Xia, M. X.; Chen, J.; Yuan, R.; Deng, F. N.; Shen, F. F. Gene Expression Characteristics and Regulation Mechanisms of Superoxide Dismutase and Its Physiological Roles in Plants under Stress. Biochemistry (Mosc) 2016, 81(5), 465–80. [Google Scholar] [CrossRef] [PubMed]
- Sofo, A.; Scopa, A.; Nuzzaci, M.; Vitti, A. Ascorbate Peroxidase and Catalase Activities and Their Genetic Regulation in Plants Subjected to Drought and Salinity Stresses. Int. J. Mol. Sci. 2015, 16(6), 13561–78. [Google Scholar] [CrossRef] [PubMed]
- Chakravarty, D.; Banerjee, M.; Bihani, S. C.; Ballal, A. A Salt-Inducible Mn-Catalase (KatB) Protects Cyanobacterium from Oxidative Stress. Plant Physiol. 2016, 170(2), 761–73. [Google Scholar] [CrossRef] [PubMed]
- Kang, W.; Li, X.; Sun, A.; Yu, F.; Hu, X. Study of the Persistence of the Phytotoxicity Induced by Graphene Oxide Quantum Dots and of the Specific Molecular Mechanisms by Integrating Omics and Regular Analyses. Environ. Sci. Technol. 2019, 53(7), 3791–801. [Google Scholar] [CrossRef] [PubMed]
- Wang, M.; Yuan, J.; Qin, L.; Shi, W.; Xia, G.; Liu, S. TaCYP81D5, one member in a wheat cytochrome P450 gene cluster, confers salinity tolerance via reactive oxygen species scavenging. Plant Biotechnol. J. 2020, 18(3), 791–804. [Google Scholar] [CrossRef] [PubMed]
- Zhang, X.; Zong, J.; Liu, J.; Yin, J.; Zhang, D. Genome-Wide Analysis of WOX Gene Family in Rice, Sorghum, Maize, Arabidopsis and Poplar. J. Integr. Plant Biol. 2010, 52(11), 1016–26. [Google Scholar] [CrossRef] [PubMed]
- van der Graaff, E.; Laux, T.; Rensing, S. A. The WUS homeobox-containing (WOX) protein family. Genome Biol. 2009, 10(12), 248. [Google Scholar] [CrossRef] [PubMed]
- Sikorski, R. S.; Boguski, M. S.; Goebl, M.; Hieter, P. A repeating amino acid motif in CDC23 defines a family of proteins and a new relationship among genes required for mitosis and RNA synthesis. Cell 1990, 60(2), 307–317. [Google Scholar] [CrossRef] [PubMed]
- Ahmed, M.; Rauf, M.; Mukhtar, Z.; Saeed, N. A. Excessive use of nitrogenous fertilizers: an unawareness causing serious threats to environment and human health. Environ. Sci. Pollut. Res. 2017, 24(35), 26983–87. [Google Scholar] [CrossRef] [PubMed]
- Gupta, S. K.; Roy, S.; Chabukdhara, M.; Hussain, J.; Kumar, M. Risk of Metal Contamination in Agriculture Crops by Reuse of Wastewater: An Ecological and Human Health Risk Perspective. In Water Conservation, Recycling and Reuse: Issues and Challenges; Singh, R. P., Kolok, A. S., Bartelt-Hunt, S. L., Eds.; Springer Singapore: Singapore, 2019; pp. 55–79. [Google Scholar]
- Ugulu, I.; Ahmad, K.; Khan, Z. I.; Munir, M.; Wajid, K.; Bashir, H. Effects of organic and chemical fertilizers on the growth, heavy metal/metalloid accumulation, and human health risk of wheat (Triticum aestivum L.). Environ. Sci. Pollut. Res. 2021, 28(10), 12533–45. [Google Scholar] [CrossRef] [PubMed]
- Kurapati, R.; Russier, J.; Squillaci, M. A.; Treossi, E.; Ménard-Moyon, C.; Del Rio-Castillo, A. E.; Vazquez, E.; Samorì, P.; Palermo, V.; Bianco, A. Dispersibility-Dependent Biodegradation of Graphene Oxide by Myeloperoxidase. Small 2015, 11(32), 3985–94. [Google Scholar] [CrossRef] [PubMed]
Figure 1.
Transmission electron micrographs of GO (200000x): (A) agglomerated GO, (B) flake GO.
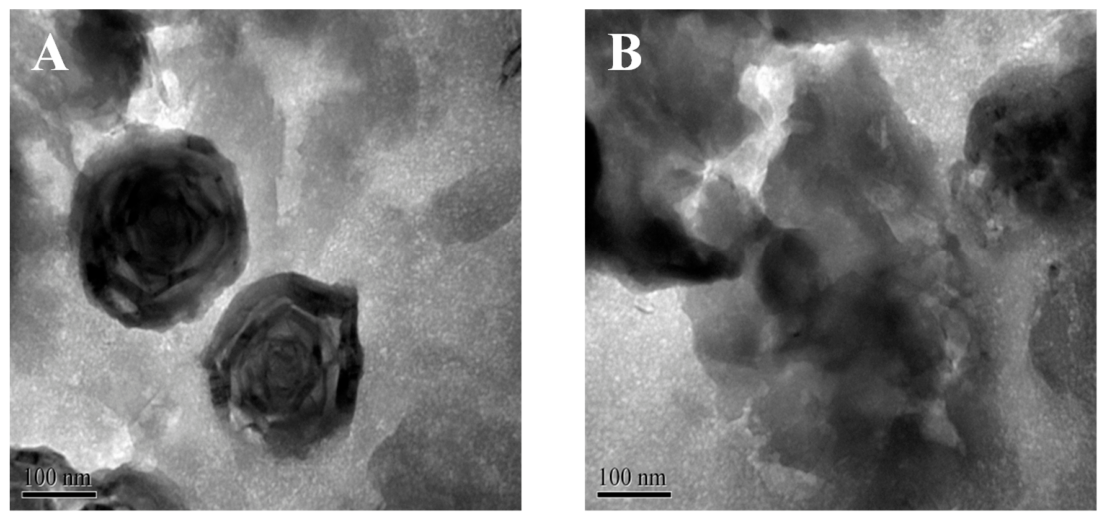
Figure 2.
Effects of GO on root growth by the treatment of GO at the concentrations of 0-10 mg/L. (A) dry weight (B) relative water content (RWC), (C) number of root tips, (D) root surface area, (E) total root length, (F) total root volume, (G) images of root system. The values of the bar graphs represent mean +/- SD (n = 5). Different superscript letters indicate significant differences at P < 0.05 between groups.
Figure 2.
Effects of GO on root growth by the treatment of GO at the concentrations of 0-10 mg/L. (A) dry weight (B) relative water content (RWC), (C) number of root tips, (D) root surface area, (E) total root length, (F) total root volume, (G) images of root system. The values of the bar graphs represent mean +/- SD (n = 5). Different superscript letters indicate significant differences at P < 0.05 between groups.
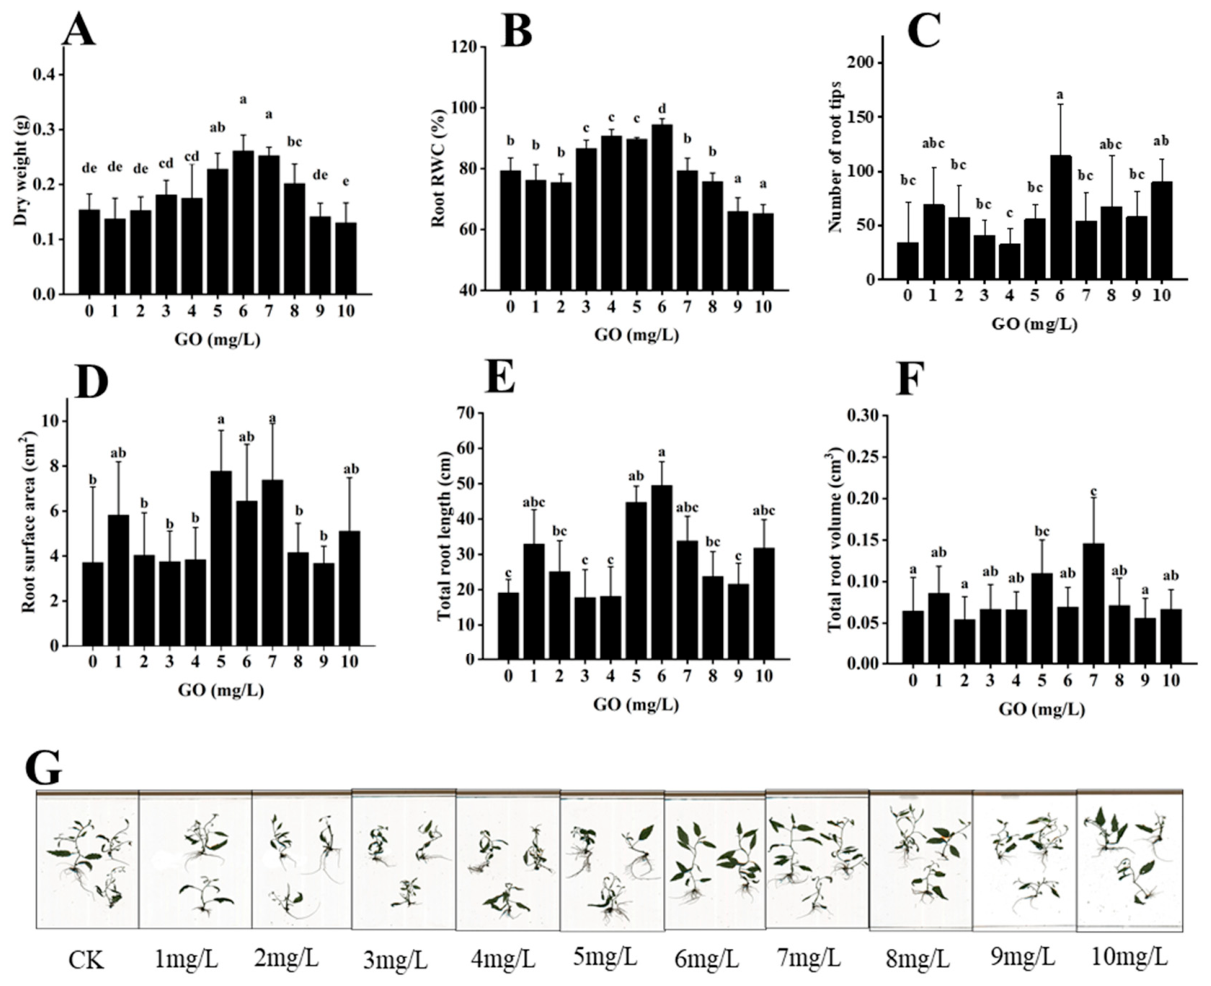
Figure 3.
Effects of GO on the activities of SOD (A), POD (B), and CAT (C) in poplar tissue cultured seedlings. Values are the means ± SD (n = 10). Different superscript letters indicate significant differences at P < 0.05 between groups.
Figure 3.
Effects of GO on the activities of SOD (A), POD (B), and CAT (C) in poplar tissue cultured seedlings. Values are the means ± SD (n = 10). Different superscript letters indicate significant differences at P < 0.05 between groups.
Disclaimer/Publisher’s Note: The statements, opinions and data contained in all publications are solely those of the individual author(s) and contributor(s) and not of MDPI and/or the editor(s). MDPI and/or the editor(s) disclaim responsibility for any injury to people or property resulting from any ideas, methods, instructions or products referred to in the content. |
© 2026 by the authors. Licensee MDPI, Basel, Switzerland. This article is an open access article distributed under the terms and conditions of the Creative Commons Attribution (CC BY) license (http://creativecommons.org/licenses/by/4.0/).
Copyright: This open access article is published under a Creative Commons CC BY 4.0 license, which permit the free download, distribution, and reuse, provided that the author and preprint are cited in any reuse.