
Submitted:
23 September 2026
Posted:
24 September 2026
You are already at the latest version
Abstract
This study evaluated the effects of supplemental LED lighting on the photomorphogenesis and phytochemical characteristics of flowers of Chrysanthemum indicum L. Four lighting treatments were applied, including three red and blue LED spectral ratios (30:70, 55:45, and 78:22) under 6 h of daily supplemental lighting, and a natural sunlight control. Supplemental photosynthetic photon flux density was maintained at 100 µmol·m⁻²·s⁻¹. The highest average flower number (196.2 flowers·plant⁻¹) was obtained under the control treatment (F1), whereas the greatest average fresh flower biomass (55.5 g·plant⁻¹), dry flower biomass (7.4 g·plant⁻¹), essential oil content (0.695%, DW), and essential oil yield (10.01 kg·ha⁻¹) were achieved under F4 (R:B = 78:22). These parameters gradually declined with decreasing red light proportions. Gas chromatography revealed that the flower essential oil was dominated by 2,2,6-trimethyl-3-keto-6-vinyl tetrahydropyran, with the highest relative abundance under F3 (R:B = 55:45; 39.9%) and the lowest under F2 (32.5%). No significant differences were observed in the antimicrobial activity of the essential oils, whereas the strongest anti-inflammatory activity was detected under F3. These findings provide a scientific basis for optimizing supplemental LED spectra to maximize flower productivity, essential oil quality, and pharmaceutical value of C. indicum in cultivation systems.
Keywords:
2
; 6-trimethyl-3-keto-6-vinyl tetrahydropyran
; anti-inflammatory activity
; essential oil composition
; Indian chrysanthemum
; LED spectrum ratio
; supplemental lighting
1. Introduction
Chrysanthemum indicum L. (Asteraceae) is a perennial herbaceous species widely distributed in East and Southeast Asia and has long been used as a medicinal plant in traditional Asian medicine. The species is characterized by erect and branched stems, alternate and variably lobed leaves, and terminal yellow capitula. Its flowers, commonly known as Flos Chrysanthemi indici, have traditionally been used for the treatment of inflammatory and infectious disorders and have attracted considerable scientific interest because of their diverse phytochemical composition and pharmacological properties [1]. Phytochemical investigations have identified more than 190 compounds in C. indicum, including flavonoids, terpenoids, phenylpropanoids, and phenolic acids, highlighting its importance as a medicinal and aromatic plant [1]. Review report indicated that antimicrobial, anti-inflammatory, antioxidant, and immunomodulatory properties of C. indicum attracted a lot of studies [2,3]. Due to the well-known medicinal properties of the C. indicum flower, its extract was studied and processed into jelly candies [4] and dietary supplements [5].
The flowers of C. indicum are also an important source of essential oil (EO), which contains a complex mixture of monoterpenes and sesquiterpenes. However, the chemical composition of C. indicum EO can vary considerably depending on the plant material, geographic origin, developmental stage, and processing or extraction conditions. Shunying et al. (2005) [6] identified 1,8-cineole, camphor, borneol, and bornyl acetate as major constituents of C. indicum flower EO and demonstrated substantial differences in their relative proportions among fresh, air-dried, and processed flowers. Similarly, Jung et al. (2009) [7] identified 73 compounds accounting for 96.65% of the EO, with α-pinene, 1,8-cineole, α-thujone, camphor, borneol, bornyl acetate, germacrene D, and β-caryophyllene among the major constituents. More recently, camphor was reported as a predominant component in some C. indicum EOs, although considerable variation in the abundance of other terpenoid constituents was also observed [8]. Such compositional variability is of particular importance because the chemical profile of an EO is closely associated with its biological properties.
The EO of C. indicum demonstrated a broad range of biological activities, particularly antimicrobial and antioxidant effects. Shunying et al. (2005) [6] reported significant antimicrobial activity of C. indicum EOs against several bacterial and fungal microorganisms, while Jung et al. (2009) [7] demonstrated antibacterial activity against oral pathogenic bacteria. Notably, the complete EO showed stronger activity than several of its major individual constituents, suggesting that interactions among multiple components may contribute to the overall biological activity of the oil [7]. Comparative investigations have further shown that C. indicum EO possesses antimicrobial, antiviral, antimycobacterial, anti-Helicobacter pylori, antitrypanosomal, and antioxidant activities, with several activities being stronger than those observed for C. morifolium EO [8]. It was reported that dimeric guaianolide-type sesquiterpenoids from the flowers of C. indicum can help improve fatty liver disease [9]. Another study showed that C. indicum extract obtained via supercritical CO2 extraction exhibited anti-cancer activity against ultraviolet-induced skin cancer in a mouse model [10] and protective effect against ultraviolet -induced skin aging in mice [11]. In addition, it was indicated that inhaling C. indicum EO helps lower blood pressure and can promote both mental and physical relaxation [12]. On the other hand, a previous study showed that changes in extraction procedures can alter both EO composition and biological activity. This further emphasizes the close relationship between EO chemical profile and functional properties [13]. Therefore, approaches that can regulate EO accumulation and composition during cultivation may provide an opportunity to improve both the production and functional quality of C. indicum flowers.
Light is a major environmental factor governing plant growth and development because it provides energy for photosynthesis while also acting as an important source of photoregulatory signals. Light quantity, photoperiod, and spectral composition can influence plant architecture, flowering, biomass accumulation, resource allocation, and secondary metabolism. These effects are particularly relevant to chrysanthemum because many species and cultivars exhibit strong photoperiodic responses. In chrysanthemum, extension of the photoperiod with supplemental lighting can promote vegetative growth and biomass accumulation while delaying or inhibiting flowering, particularly under long-day conditions [14]. More recent studies have demonstrated that these responses also depend on the spectral composition and spatial distribution of supplemental light, indicating that both the quality and timing of illumination can influence vegetative and reproductive development [15].
Among the spectral components of LED lighting, red (R) and blue (B) wavelengths are particularly important because they are detected by different photoreceptor systems and can induce distinct photomorphogenic and physiological responses. Studies in Chrysanthemum morifolium have shown that supplemental B light can promote stem and internode elongation, whereas the duration and spectral composition of R–B illumination can modify flower-bud development and flowering responses [16]. Similarly, different combinations and timing of R and B LED illumination have produced distinct effects on flowering in C. morifolium, demonstrating that spectral quality can interact with photoperiodic regulation [17]. Other studies comparing B, R, mixed, and white light reported differences in plant morphology, gas exchange, metabolism, and physiological responses even when total biomass was not substantially altered [18,19]. These findings indicate that the response to spectral composition is not necessarily linear and that the ratio between different parts of the visual optical radiation may influence how assimilates and developmental resources are distributed among vegetative growth, flowering, and biomass accumulation. Recent evidence further suggests that spectral composition can interact with photoreceptor signaling and sugar metabolism to regulate flowering in chrysanthemum [20].
Importantly, the effects of spectral quality may extend beyond growth and flowering to secondary metabolism and the accumulation of specialized metabolites. Ouzounis et al. (2014) [18] reported distinct morphological and physiological responses of C. morifolium to supplemental spectra containing different proportions of B and R light, including differences in plant height and biomass. Sommer et al. (2023) [19] likewise showed that B, R, and mixed R light induced distinct patterns of gas exchange and metabolism in C. morifolium, despite relatively similar total biomass. Such findings suggest that light quality may modify plant metabolic status independently of changes in total biomass. Evidence from other aromatic plants supports this possibility; for example, recent work in Tagetes erecta demonstrated that variation in R composition affected shoot and flower production as well as EO content, EO yield, and EO composition [21]. B and R light (in a 2:1 ratio) was reported to yield the greatest leaf area, chlorophyll and carotenoid content, and vegetative growth in Rubus fruticosus seedlings [22]. While another study indicated the highest concentration of total protein in kale and broccoli under BR lights [23]. Thus, spectral manipulation represents a potentially useful strategy not only for modifying plant growth and flowering but also for regulating the accumulation and quality of economically and pharmacologically important secondary metabolites.
A few studies conducted specifically on C. indicum demonstrated that both light intensity and photoperiod strongly influence vegetative growth and reproductive development Xuan et al. (2020) [24] evaluated C. indicum under 20–100% of natural sunlight and found that plant height and stem diameter were greatest at approximately 60% of full natural light, whereas higher light levels induced leaf yellowing and lower light intensities were associated with reductions in chloroplast development and starch accumulation. Photosynthetic pigments and net photosynthetic rate also varied with light intensity, indicating that C. indicum has a relatively broad light-acclimation capacity but exhibits optimal physiological performance under an intermediate light regime [24]. A recent study showed that the use of green shade netting (50% shading) increases plant height, the number of branches, leaf area index, the number of flowers per plant, flower diameter, and fresh flower weight (per bloom). Collectively, these benefits resulted in a significant increase in total yield (a 50.6% rise) compared to outdoor conditions [25]. These findings demonstrate that light quantity can substantially modify both plant growth and photosynthetic physiology in this medicinal species.
Photoperiodic manipulation has likewise been shown to have pronounced effects on flowering of C. indicum. Recent work demonstrated that C. indicum exhibits an obligate short-day flowering response, with plants reaching anthesis under short-day conditions but failing to complete floral development under prolonged long-day conditions [26]. Consistent with this photoperiodic behavior, a greenhouse study using night-break LED lighting showed that a 90-min light interruption at 03:00 h, applied for 40 consecutive nights, delayed flowering by 27.9 days while maintaining relatively good vegetative growth and flower quality [27]. In addition, LED lighting has been investigated for the propagation of C. indicum in Vietnam. Do et al. (2022) [28] reported that a B–R LED system combining 450-nm B and 660-nm R light improved shoot multiplication of the yellow C. indicum cultivar ‘Pha Le’ compared with compact fluorescent lamp lighting, while maintaining comparable seedling quality. Together, these studies confirm that light quantity, photoperiod, and spectral composition can all influence the growth and developmental responses of C. indicum.
Despite the growing body of evidence on light-regulated responses in chrysanthemum, most previous studies have focused on ornamental C. morifolium species. For the species C. indicum, previous studies have largely focused on light intensity, photoperiodic flowering control, or propagation. In contrast, relatively little is known about how different supplemental R:B ratios affect the coordinated production of flowers and EO in the medicinal and aromatic species C. indicum. In particular, the relationships among supplemental spectral composition, flower number, individual flower biomass, total flower yield, EO accumulation, EO chemical composition, and biological activity have not been sufficiently characterized. This knowledge gap is important because spectral manipulation may generate trade-offs between the number of flowers and the biomass of individual flowers, while simultaneously altering secondary metabolism and, consequently, the functional quality of the EO.
Therefore, the present study evaluated the effects of three supplemental R–B LED spectral ratios (R:B = 30:70, 55:45, and 78:22) at a fixed total supplemental PPFD of 100 μmol m⁻² s⁻¹ for 6 h d⁻¹, with natural sunlight as the control, on the growth, flowering characteristics, flower biomass, EO content and yield, chemical composition, antibacterial activity, and anti-inflammatory activity of C. indicum. By integrating production-related traits with EO chemical composition and biological activities, this study aimed to determine whether spectral manipulation could shift the balance among flower production, individual flower biomass, EO accumulation, and functional quality, and to identify supplemental lighting conditions suited to different production objectives in C. indicum.
2. Materials and Methods
2.1. Plant Materials and Supplemental LED Lighting Conditions
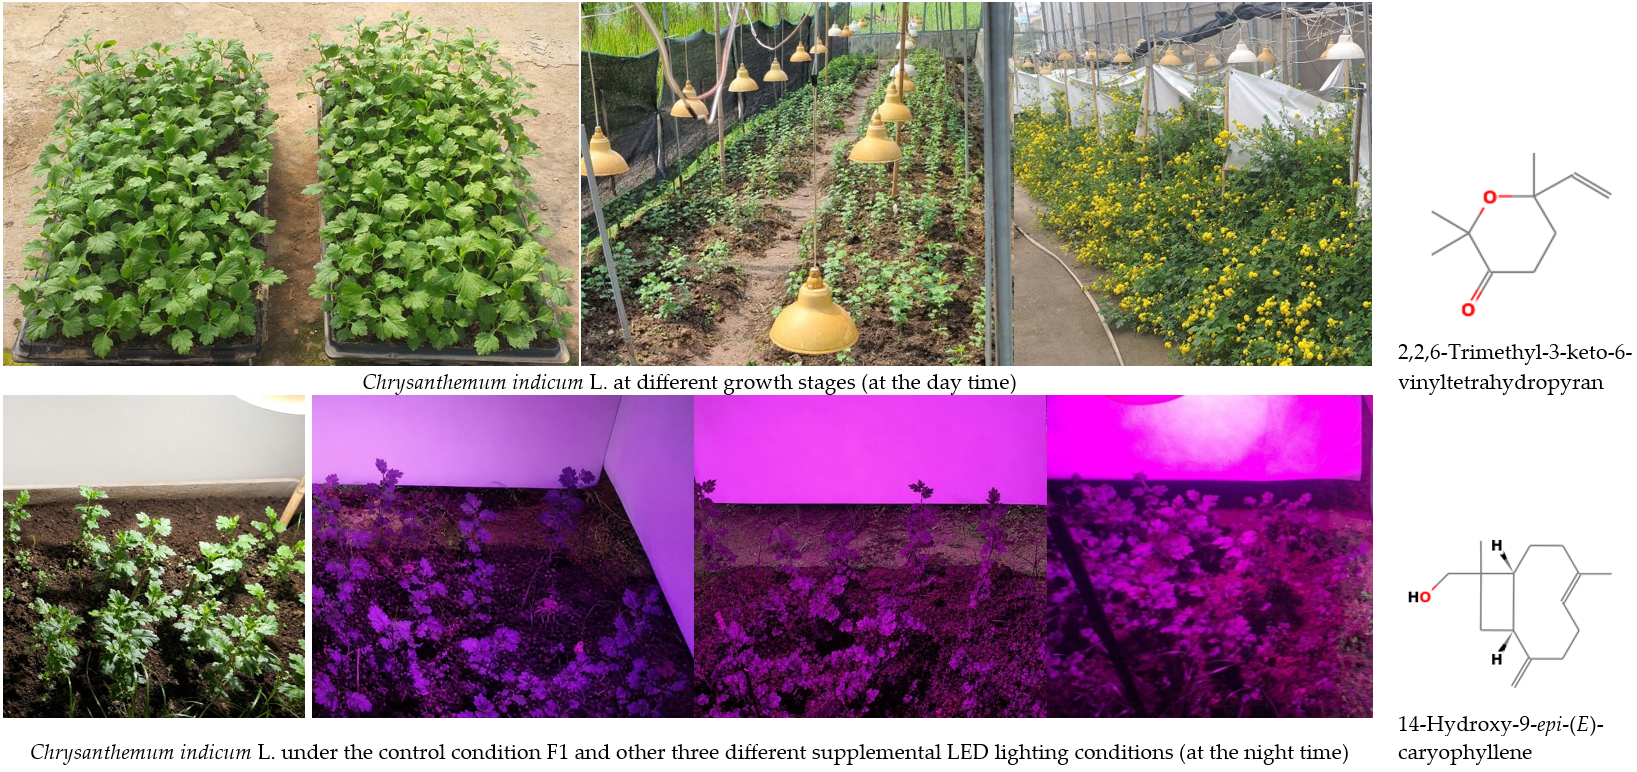
The experiment on supplemental LED lighting for Chrysanthemum indicum L. was conducted in an open-field environment in Hanoi, Vietnam (N21°04ʹ08ʺ, E105°45ʹ50ʺ) from September 2024 to February 2025. Plant material was sourced from a farm in Nhu Quynh Commune, Hung Yen Province, in June 2024. Subsequently, seedlings were produced via tissue culture and acclimatized to field conditions at the Institute of Biology, Vietnam Academy of Science and Technology, over a two-month period. A total of 360 seedlings were selected and transplanted into 12 experimental plots, with 30 plants per plot, at a spacing of 20 × 20 cm. Each plot measured 1.2 × 1.0 m. Three weeks after planting, when the plants had become established and reached approximately 20 cm in height, supplemental LED lighting was initiated and maintained for two months. Supplemental lighting was terminated when the plants reached approximately 60–70 cm in height and had developed multiple branches. During the experimental period, ambient temperatures ranged from 17.8 to 27.4 °C and relative humidity from 80.9% to 87.2% (based on meteorological data for the Hanoi site), while fertilization and irrigation regimens followed the protocols established previously [29].
Four light treatments were evaluated, including three supplemental LED lighting treatments with R:B ratios of 30:70, 55:45, and 78:22, and a control treatment exposed only to natural sunlight. Supplemental LED lighting was provided at a PPFD of 100 µmol·m⁻²·s⁻¹ for 6 h per day from the 6:30 p.m. (sunset) on. The peak wavelength of the B-light is about 440 nm and of the R-light about 660 nm. The corresponding supplemental daily light integral (DLI) was 2.16 mol·m⁻²·d⁻¹. The total daily DLI, including natural sunlight and supplemental LED lighting, was 11.98 mol·m⁻²·d⁻¹ for the control and 14.14 mol·m⁻²·d⁻¹ for the supplemental-lighting treatments, respectively. Each treatment was assigned to three independent experimental plots, resulting in three biological replicates per treatment. Detailed lighting conditions are presented in Table 1 and Figure 1.
Approximately 1.5 to 2.0 months (depending on each lighting treatment) after the cessation of supplemental lighting—specifically at the peak flowering stage—all above-ground biomass was harvested. Plant height was measured, flower numbers and weights were recorded, and essential oil (EO) was distilled from the flowers to evaluate the parameters of interest. Growth-related parameters were measured on 30 plants per replicate across three replicates for each treatment. Regarding EO samples, three distillation batches were performed for each treatment, and the resulting oils were subsequently pooled for each specific treatment.
2.2. Essential Oil Isolation
Fresh flower samples of C. indicum (1.2–1.5 kg per sample) harvested from each treatment were subjected to hydrodistillation for 4.5 h using a Clevenger-type apparatus, with the extraction performed in three independent replicates [30]. The resulting EOs were separated from the distillate and stored at –5 °C until further analysis. The EOs obtained from the three replications were subsequently pooled for each treatment and analyzed in triplicate (each oil sample was injected three times) for chemical composition using gas chromatography coupled with both mass spectrometry and a flame ionization detection (GC/MS-FID).
2.3. Essential Oil GC/MS-FID Analysis
Essential oil samples were analyzed by GC/MS-FID using an Agilent 7890A gas chromatograph equipped with an Agilent 5975C Mass Selective Detector. Separation was achieved on an HP-5MS fused-silica capillary column (60 m × 0.25 mm i.d., 0.25 μm film thickness), with helium used as the carrier gas at a constant flow rate of 1.0 mL min⁻¹. For each analysis, 1 μL of EO was injected at 250 °C with a split ratio of 1:100. The oven temperature was held at 60 °C initially and subsequently programmed to 240 °C at 4 °C min⁻¹. The detector temperature was maintained at 230 °C. Mass spectra were acquired in electron ionization (EI) mode at 70 eV, with the interface temperature set to 280 °C, a scan rate of 4.0 scans s⁻¹, and a mass acquisition range of m/z 35–450. FID quantification was performed under the same chromatographic conditions, with the FID detector temperature also maintained at 250 °C. EO compound identification was based on comparison of relative retention indices (RIs), calculated using a homologous series of n-alkanes (C7–C₃₀), and mass spectral data with those available in the NIST08, Wiley09, and HPCH1607 spectral libraries [31,32]. Chromatographic data were processed using MassFinder version 4.0 [33]. The relative abundance of each identified constituent was determined from its corresponding FID peak area as a percentage of the total FID peak area, without applying response-factor correction.
2.4. Tested Microbial Strains
The antimicrobial activity of the EOs was assessed against a panel of seven microorganisms, comprising three Gram-positive bacteria (Staphylococcus aureus ATCC 13709, Bacillus subtilis ATCC 6633, and Lactobacillus fermentum VTCC N4), three Gram-negative bacteria (Salmonella enterica VTCC, Escherichia coli ATCC 25922, and Pseudomonas aeruginosa ATCC 15442), and one yeast (Candida albicans ATCC 10231). The ATCC reference strains were sourced from the American Type Culture Collection, whereas the VTCC strains were obtained from the Vietnam Type Culture Collection, Institute of Microbiology and Biotechnology, Vietnam National University, Hanoi.
2.5. Assessment of the Antimicrobial Activity of Essential Oils
The minimum inhibitory concentration (MIC) and half-maximal inhibitory concentration (IC₅₀) of the EOs were assessed in triplicate using the broth microdilution assay [34,35]. Briefly, EO stock solutions were prepared in dimethyl sulfoxide (DMSO) and serially diluted two-fold with sterile distilled water to obtain concentrations ranging from 16,000 to 250 μg/mL (7concentrations). The resulting dilutions were prepared in microtubes and subsequently transferred to 96-well microplates. Bacterial cultures were prepared in double-strength Mueller–Hinton broth or double-strength tryptic soy broth, whereas fungal cultures were maintained in double-strength Sabouraud dextrose broth. The microbial inocula were adjusted to 5 × 10⁵ CFU·mL⁻1 for bacteria and 1 × 10³ CFU·mL⁻1 for fungi. Wells containing culture medium alone (without EO dilutions and microorganisms) served as negative controls, while wells containing culture medium and microbial inocula (without EO dilutions) served as positive controls. The microplates were incubated at 37 °C for 24 h. The MIC was defined as the lowest EO concentration at which no visible microbial growth was observed. The IC₅₀ values were calculated from the percentage inhibition of microbial growth relative to the untreated growth control, based on turbidity measurements obtained using an EPOCH2C spectrophotometer (BioTek Instruments, Winooski, VT, USA). The resulting data were processed using Raw Data software (Intercity Business Park Mechelen Noord, Mechelen, Belgium) according to the following equations:
where:
OD denotes optical density. The positive control (control (+)) consisted of microorganisms cultured in medium without an antimicrobial agent, whereas the negative control (control (-)) contained culture medium without microorganisms. The test agent refers to the EO or reference antimicrobial agent at the specified concentration. HighConc/LowConc represent the high and low concentrations of the test agent, respectively, while HighInh%/LowInh% indicate the corresponding percentage of microbial growth inhibition at high and low concentrations, respectively.
Reference antimicrobial agents: Ampicillin was used as the reference antibiotic for Gram-positive bacteria, with IC₅₀ and MIC values ranging from 0.02 to 3.62 µg·mL⁻1 and 0.125 to 32.0 µg·mL⁻1, respectively. Cefotaxime was used as the reference agent for Gram-negative bacteria, with IC₅₀ values of 0.07–4.34 µg·mL⁻1 and MIC values of 0.5–32.0 µg·mL⁻1. For fungal strains, nystatin was employed as the reference antifungal agent, with an IC₅₀ of 1.32 µg·mL⁻1 and an MIC of 8.0 µg·mL⁻1.
2.6. Inhibitory Effects of Essential Oils on NO Production in RAW264.7 Cells
The murine macrophage cell line RAW 264.7 (ATCC® TIB-71™) was cultured in Dulbecco’s modified Eagle medium (DMEM) supplemented with 10% fetal bovine serum (FBS), 100 U·mL⁻1 penicillin, 100 µg·mL⁻1 streptomycin, and 0.25 µg·mL⁻1 amphotericin B (Gibco, Grand Island, NY, USA). Cells were seeded in 96-well microplates at a density of 2 × 10⁵ cells/well and incubated at 37 °C for 24 h in a humidified atmosphere containing 5% CO₂. The culture medium was then replaced with serum-free DMEM (DMEM without FBS), and the cells were allowed to equilibrate for an additional 3 h. For evaluation of anti-inflammatory activity, cells were pretreated with EOs or the reference inhibitor (positive control) Nᴳ-methyl-L-arginine acetate (L-NMMA) (Sigma-Aldrich, St. Louis, MO, USA) at concentrations of 4000, 2000, 1000, 500, 250, and 125 µg·mL⁻1 for 2 h. Inflammation was subsequently induced by adding lipopolysaccharide (LPS) at a final concentration of 10 µg·mL⁻1, followed by incubation for 24 h. Nitric oxide (NO) production was quantified using the Griess Reagent System (Promega Corporation, Fitchburg, WI, USA). Briefly, nitrite (NO₂⁻) accumulation in the culture supernatants was measured spectrophotometrically at 540 nm (A₅₄₀) using a microplate reader and quantified against a sodium nitrite (NaNO₂) standard calibration curve. L-NMMA was used as the positive control. All experiments were conducted in triplicate. The IC₅₀ values for NO production inhibition were calculated using TableCurve 2D v4 software. Cell viability was assessed in parallel using the methyl thiazolyl tetrazolium (MTT) colorimetric assay based on 3-(4,5-dimethylthiazol-2-yl)-2,5-diphenyl-tetrazolium bromide [36,37] to exclude false-positive effects resulting from cytotoxicity.
The formulas used to calculate the percentage of cell viability (3) and percentage ofNO production inhibition (4) are as follows:
where:
ODcontrol (+) represents the optical density of the positive control, consisting of cells cultured in medium without the cytotoxic agent or EO. ODtest agent denotes the optical density measured for each test sample at a specified concentration of the cytotoxic agent or EO, whereas ODcontrol (−) refers to the optical density of the negative control containing culture medium without cells.
The percentage inhibition of NO production was determined only at concentrations maintaining cell viability above 80%, thereby minimizing the risk of false-positive results.
2.7. Statistical Analysis
Data were analyzed by one-way analysis of variance (ANOVA) based on a completely randomized design, with experimental plots considered as biological replicates (n = 3 per treatment). Differences among treatment means were evaluated using the least significant difference (LSD) test at a significance level of p ≤ 0.05, using software tool IRRISTAT version 5.0 (International Rice Research Institute, Philippines). Principal component analysis (PCA) was performed using the CropGenoViz—Exploring Crop Genetic Diversity platform (Nguyen, Trung Duc; https://ntducphd.shinyapps.io/cropgenoviz/; accessed on 18 August 2026) to visualize the overall structure of the dataset, distinguish plants’ responses among supplemental lighting treatments, and identify the variables contributing most strongly to variation in plant growth, flower biomass, EO content and yield, and the major EO constituent. Pearson’s correlation coefficients were calculated with IBM SPSS Statistics version 27.0.1 (IBM Corp., Armonk, NY, USA) to determine the correlations between main EO compound/compound groups and anti-inflammatory activity (inhibition of NO production) in the murine macrophage cell line RAW 264.7.
3. Results
3.1. Supplemental LED Lighting Regulates Growth and Essential Oil Production in Chrysanthemum indicum
The different LED light spectra had distinct effects on growth, development, and EO biosynthesis in the flowers of Chrysanthemum indicum L. The time to full flowering (defined as at least 10% of flower per plant turn brown and dry out) ranged from 41 days to 59 days after turning off the LED supplemental lighting. Control treatment only receives sunlight (F1) promoted earlier flowering (41 days) compared to treatments combining R and B supplemental light at different ratios (52 days in treatment F4, 59 days in treatments F2 and F3). Plant height increased from 101.1 ± 7.4 cm in the control (F1) to 126.1 ± 8.2, 127.1 ± 9.8, and 140.5 ± 7.1 cm under F2, F3, and F4, respectively. Although F4 produced the tallest plants, F2–F4 did not differ significantly from one another, but all were significantly taller than F1 (p < 0.05). In contrast, the number of flowers was highest in F1 (196.2 ± 14.8 flowers·plant⁻¹), whereas supplemental LED lighting significantly reduced flower number to 130.2 ± 10.1, 152.6 ± 12.4, and 171.1 ± 11.2 flowers·plant⁻¹ under F2, F3, and F4, respectively. Despite the lower flower number, F4 substantially enhanced flower biomass, producing the highest fresh and dry flower biomass of 55.5 ± 1.6 and 7.4 ± 0.21 g·plant⁻¹, respectively, compared with 38.9 ± 1.3 and 6.1 ± 0.20 g·plant⁻¹ in F1. Followed by F3 which showed intermediate values of 37.3 ± 1.2 and 5.7 ± 0.19 g·plant⁻¹, while F2 resulted in the lowest values (32.9 ± 1.1 and 5.1 ± 0.18 g·plant⁻¹, respectively), see Figure 2. Overall, the R:B = 78:22 treatment (F4) was most effective in promoting vegetative elongation and significantly increasing the individual flower biomass, although it reduced the total number of flowers compared with the non-LED-illuminated control.
Supplemental spectral LED lighting substantially influenced flower yield and EO production in C. indicum. The F4 treatment (R:B = 78:22) produced the highest fresh weight of flower (0.324 ± 0.009 g·flower⁻¹) and fresh yield of flower (10.824 ± 0.304 ton·ha⁻¹), representing increases of approximately 63.8% and 42.8%, respectively, compared with the control treatment F1. Similarly, F4 resulted in the highest dry weight of flower (0.043 ± 0.001g·flower⁻¹) and dry yield of flower (1.440 ± 0.040 ton·ha⁻¹), corresponding to increases of 38.7% and 21.0%, respectively, relative to the condition of F1. Regarding F2 and F3 treatments, although the individual flower weight was significantly greater than that of the control, the substantially lower number of flowers per plant resulted in lower overall flower yields than in the control. The water concentration of flowers also varied significantly among treatments, increasing from 84.300 ± 0.200% in F1 to 86.700 ± 0.265% in F4. In terms of EO accumulation, the EO concentration increased progressively from 0.504 ± 0.020% in F1 to 0.617 ± 0.011%, 0.663 ± 0.016%, and 0.695 ± 0.011% under F2, F3, and F4, respectively. Consequently, EO yields under supplemental lighting treatments were higher than that of the control. Specifically, the yield peaked in treatment F4 (10.009 ± 0.434 kg·ha⁻¹), significantly (p < 0.05) exceeding F3 (7.333 ± 0.192 kg·ha⁻¹), F2 (6.139 ± 0.241 kg·ha⁻¹), and the control F1 (5.999 ± 0.320 kg·ha⁻¹) (Table 2). Overall, the R:B = 78:22 treatment (F4) was the most effective lighting regime, simultaneously enhancing flower yield, EO concentration and yield in C. indicum.
3.2. Effect of Supplemental LED Light Conditions on Chemical Composition of Chrysanthemum indicum Essential Oil
The EO composition of C. indicum was markedly influenced by the supplemental LED spectra (Table 3). A total of 53–58 compounds were identified across the four treatments, accounting for 80.64–83.37% of the total oil composition. The identified oils were predominantly composed of oxygenated monoterpenoids, which ranged from 40.21% in F2 to 48.84% in F3, followed by oxygenated sesquiterpenoids (15.86–17.86%) and sesquiterpene hydrocarbons (8.95–14.23%). The major individual constituent in the EO of C. indicum flower under the present experimental conditions was 2,2,6-trimethyl-3-keto-6-vinyltetrahydropyran, accounting for 35.74%, 32.54%, 39.94%, and 38.13% in treatments F1–F4, respectively, with the highest proportion observed under F3. Other prominent compounds included 14-hydroxy-9-epi-(E)-caryophyllene (4.92–3.29%), cis-spiroether (2.20–3.37%), lavandulyl acetate (2.73–3.42%), and 1,8-cineole (2.75–3.02%). Notably, the proportion of sesquiterpene hydrocarbons increased substantially under F2 (14.23%) compared with the control (8.95%), whereas F3 promoted the accumulation of oxygenated monoterpenoids (48.84%). F4, in contrast, resulted in the highest proportion of monoterpene hydrocarbons (4.45%) among the treatments. Overall, these results indicate that supplemental LED lighting, particularly variation in the R:B ratio, altered the relative distribution of major chemical classes and individual constituents of C. indicum EO, although the dominant compound remained 2,2,6-trimethyl-3-keto-6-vinyltetrahydropyran across all lighting conditions.
Principal component analysis (PCA) provided a clear multivariate separation of the four lighting treatments and identified the variables most strongly associated with their responses in C. indicum (Figure 3). The first two principal components (Dim1 and Dim2) explained 91.0% of the total variance, with Dim1 accounting for 64.2% and Dim2 for 26.8%, indicating that the two-dimensional PCA plot captured most of the variation among treatments. Dim1 was positively associated with most productivity- and essential-oil-related variables, particularly EO yield (EOY), fresh flower biomass (FFB), dry flower biomass (DFB), water concentration (CW), and the concentration of 2,2,6-Trimethyl-3-keto-6-vinyltetrahydropyran—the main compound of EO of C. indicum (MCC), whereas Dim2 mainly distinguished flower number (FN) from plant height (PH) and EO concentration (EOC). Among the treatments, F4 was positioned farthest along the positive Dim1 axis and showed a close association with EOY, FFB, DFB, CW, and MCC, reflecting its superior flower biomass and EO yield and its relatively high concentration of the main compound. F1, in contrast, was located in the upper-left quadrant and was strongly associated with FN, consistent with its highest number of flowers per plant. F2 was positioned in the lower-left quadrant and was more closely related to PH and EOC, indicating a response pattern characterized by relatively greater plant height and EO concentration but lower flower biomass and EO yield. F3 was located near the origin, suggesting an intermediate multivariate response and weaker associations with the measured variables compared with F1, F2, and F4. The variable vectors also showed a strong positive relationship among FFB, DFB, and EOY, while PH and EOC exhibited similar directional patterns along Dim2. Overall, the PCA demonstrates that changing the R:B ratio of supplemental LED lighting generated distinct phenotypic and EO responses, with treatment F4 (R:B = 78:22) exhibiting the most favorable overall profile in terms of flower biomass, EO yield, and productivity of the main EO constituent.
3.3. The Effect of Supplemental LED Light Conditions on Antimicrobial Activity of Chrysanthemum indicum Essential Oil
The antimicrobial activity of C. indicum EOs varied markedly among the tested microorganisms and was generally stronger against Gram-positive bacteria than Gram-negative bacteria and Candida albicans, as reflected by both IC₅₀ and MIC values. Staphylococcus aureus and Bacillus subtilis were relatively susceptible, with IC₅₀ values of 750–963 and 1231–1500 µg·mL⁻¹, respectively, while their MIC remained consistently low at 2000 µg·mL⁻¹ across all lighting treatments. For S. aureus, F3 (55R: 45B) produced the most active EO, giving the lowest IC₅₀ (750 ± 32.1 µg·mL⁻¹), whereas F2 was most effective against B. subtilis (1231 ± 61.3 µg·mL⁻¹), although the identical MIC values indicated limited effects of the light treatments on the minimum inhibitory concentration. In contrast, Lactobacillus fermentum showed a pronounced treatment-dependent response, with IC₅₀ values ranging from 1556 ± 74.6 to 1588 ± 78.1 µg·mL⁻¹ under F1 and F3 to 12,000 ± 548.6 µg·mL⁻¹ under F2, accompanied by MIC values of 2000 µg mL⁻¹ under F2 and F3 and 4000 µg·mL⁻¹ under F1 and F4. Among the Gram-negative bacteria, S. enterica was the least susceptible, with IC₅₀ and MIC >16,000 µg·mL⁻¹ under all treatments. Escherichia coli showed moderate susceptibility, with the lowest IC₅₀ under F4 (1617 ± 84.2 µg·mL⁻¹), although its MIC values remained relatively high (4000–16,000 µg·mL⁻¹). By comparison, Pseudomonas aeruginosa exhibited a consistent improvement in susceptibility following supplemental LED lighting, with IC₅₀ values of approximately 1500 µg·mL⁻¹ and MIC values of 2000 µg·mL⁻¹ under F2–F4, compared with 1659 ± 81.3 µg·mL⁻¹ and 4000 µg·mL⁻¹, respectively, under natural sunlight. Candida albicans was comparatively resistant, showing high IC₅₀ values (from 6000 ± 305.5 to 7922 ± 357.9 µg·mL⁻¹) and MIC values of 8000–16,000 µg·mL⁻¹, with the strongest activity observed under F1. Overall, the IC₅₀ and MIC results consistently demonstrate that supplemental R-B LED lighting systems can modify the antimicrobial potency of C. indicum EOs, but the magnitude and direction of this effect were strongly dependent on the target microorganism, with F3 particularly enhancing activity against S. aureus and LED treatments generally improving inhibition of P. aeruginosa.

Table 4.
MIC and IC50 values of essential oils of Chrysanthemum indicum cultivated under the control condition F1 and other three supplemental spectral LED lighting conditions against tested microorganisms.
Table 4.
MIC and IC50 values of essential oils of Chrysanthemum indicum cultivated under the control condition F1 and other three supplemental spectral LED lighting conditions against tested microorganisms.
| Treatments |
Values (µg·mL−1) |
The concentration of essential oil inhibiting the tested microorganisms | ||||||
| Gram (+) bacteria | Gram (-) bacteria | Yeast | ||||||
| Staphylococcus aureus | Bacillus subtilis | Lactobacillus fermentum | Salmonella enterica | Escherichia coli | Pseudomonas aeruginosa | Candida albicans | ||
| F1 | IC50 | 1500 ± 84.5c | 1500 ± 89.2b | 1588 ± 78.1a | >16.000 | 3290 ± 165.1b | 1659 ± 81.3b | 6000 ± 305.5a |
| MIC | 2000 ± 0.0 | 2000 ± 0.0 | 4000 ± 0.0 | >16.000 | 8000 ± 0.0 | 4000 ± 0.0 | 8000 ± 0.0 | |
| F2 | IC50 | 963 ± 49.2b | 1231 ± 61.3a | 12.000 ± 548.6c | >16.000 | 3652 ± 189.5c | 1500 ± 77.1a | 6299 ± 325.4a |
| MIC | 2000 ± 0.0 | 2000 ± 0.0 | 16.000 ± 0.0 | >16.000 | 16.000 ± 0.0 | 2000 ± 0.0 | 16.000 ± 0.0 | |
| F3 | IC50 | 750 ± 32.1a | 1438 ± 87.1b | 1556 ± 74.6a | >16.000 | 1704 ± 85.3a | 1500 ± 79.5a | 7922 ± 357.9b |
| MIC | 2000 ± 0.0 | 2000 ± 0.0 | 2000 ± 0.0 | >16.000 | 8000 ± 0.0 | 2000 ± 0.0 | 16.000 ± 0.0 | |
| F4 | IC50 | 1412 ± 76.3c | 1451 ± 74.6b | 2950 ± 102.6b | >16.000 | 1617 ± 84.2a | 1500 ± 71.6a | 6133 ± 324.4a |
| MIC | 2000 ± 0.0 | 2000 ± 0.0 | 4000 ± 0.0 | >16.000 | 4000 ± 0.0 | 2000 ± 0.0 | 16.000 ± 0.0 | |
| Ampicillin | IC50 | 0.02 ± 0.005 | 3.62 ± 0.15 | 1.03 ± 0.07 | ||||
| MIC | 0.125 ± 0.0 | 32 ± 0.0 | 32 ± 0.0 | |||||
| Cefotaxime | IC50 | 0.43 ± 0.05 | 0.007 ± 0.002 | 4.34 ± 0.15 | ||||
| MIC | 32 ± 0.0 | 0.5 ± 0.0 | 8 ± 0.0 | |||||
| Nystatin | IC50 | 1.32 ± 0.05 | ||||||
| MIC | 8 ± 0.0 | |||||||
Note: Mean values followed by the same letter within a column are not statistically different at a 0.05 significance level (n = 3). Statistical analyses were conducted using IRRISTAT ver. 5.0 (International Rice Research Institute, Laguna, Philippines).
3.4. The Effect of Supplemental LED Light Conditions on Anti-Inflammatory Activity of Chrysanthemum indicum Essential Oil
The EOs of C. indicum exhibited a concentration- and lighting-dependent inhibitory effect on nitric oxide (NO) production in LPS-stimulated RAW 264.7 macrophages (Figure 4A). At the lowest concentration of 125 µg·mL⁻¹, the oils showed only weak inhibitory activity, with NO inhibition remaining from 0 to 7% for all treatments. Increasing the concentration to 250 and 500 µg·mL⁻¹ markedly enhanced NO inhibition, particularly for F2 (30R:70B) and F3 (55R:45B), which reached approximately 30–37% and 62–64% inhibition, respectively. At 1000 µg·mL⁻¹, the inhibitory effects further increased to approximately 60%, 83%, 90%, and 88% for F1, F2, F3, and F4, respectively, indicating that the EOs obtained under supplemental LED lighting, especially F3 and F4, were more effective than that obtained under natural sunlight. At 2000 µg·mL⁻¹, NO production was almost completely inhibited by the supplemental LED-derived oils, with F2, F3, and F4 reaching 100% inhibition, while F1 showed a slightly lower inhibition of 88%. At 4000 µg·mL⁻¹, complete inhibition was observed for the treatments F1 and F4 shown in the figure. Importantly, the inhibition of NO production was not associated with substantial cytotoxicity at concentrations up to 2000 µg·mL⁻¹, as cell viability remained 100% for all treatments (Figure 4B). At 4000 µg·mL⁻¹, however, the effects became treatment-dependent: cell viability remained 100% for treatments F1 and F4, whereas it decreased to 43% and 70% for treatments F2 and F3, respectively, falling below the 80% cell viability threshold. These results indicate that the EOs can strongly suppress LPS-induced NO production at concentrations that maintain high macrophage viability, suggesting a potential anti-inflammatory activity of C. indicum EOs.
The EOs exhibited concentration-dependent inhibitory activity of NO production, with IC₅₀ values varying significantly among the supplemental LED lighting treatments. The EO from treatment F3 produced the strongest inhibitory effect, with the lowest IC₅₀ value of 370 ± 25.50 µg·mL⁻¹, followed by F2 (406 ± 40.20 µg·mL⁻¹), F4 (548 ± 45.80 µg·mL⁻¹), and F1 (643 ± 50.11 µg·mL⁻¹). Although F3 showed the numerically lowest IC₅₀, its activity was not significantly different from F2, as both treatments shared the same statistical grouping. In contrast, the higher IC₅₀ values observed for F1 and F4 indicate weaker NO-inhibitory activity, with F1 showing the weakest activity among the LED treatments. The reference inhibitor L-NMMA exhibited a much lower IC₅₀ (3.45 ± 0.50 µg·mL⁻¹), confirming its substantially stronger NO-inhibitory potency (Table 5). Overall, these results indicate that supplemental LED spectral conditions markedly influenced the anti-inflammatory potential of C. indicum EOs, with the F2 and particularly F3 lighting treatments favoring the production of oils with greater capacity to suppress NO production in activated macrophages.
The Pearson correlation analysis revealed that the anti-inflammatory activity of C. indicum EOs, expressed as the IC₅₀ for inhibition of NO production in LPS-stimulated RAW 264.7 macrophages, was significantly associated with the abundance of 1,8-cineole. A very strong positive correlation was observed between 1,8-cineole content and IC₅₀ (r = 0.986, p < 0.05), indicating that samples with higher 1,8-cineole levels tended to exhibit higher IC₅₀ values and, therefore, weaker NO-inhibitory activity. This result suggests that 1,8-cineole was unlikely to be the major contributor to the enhanced anti-inflammatory activity observed under the more effective LED treatments. In contrast, the other major individual constituents and chemical groups showed no statistically significant correlations with IC₅₀. Moderate positive correlations were observed for monoterpene hydrocarbons (r = 0.735), cis-spiroether (r = 0.675), and 14-hydroxy-9-epi-(E)-caryophyllene (r = 0.148), whereas sesquiterpene hydrocarbons showed a moderate negative correlation (r = −0.590). The remaining groups, including oxygenated monoterpenoids (r = 0.198), oxygenated sesquiterpenoids (r = 0.168), benzenoids (r = −0.178), and other constituents (r = 0.675), also did not reach statistical significance (Table 6). Overall, these findings indicate that the variation in NO-inhibitory activity among the EOs was not broadly explained by the abundance of the major chemical groups, while the significant positive relationship with 1,8-cineole suggests that changes in this compound may be associated with reduced anti-inflammatory potency. However, given the small number of samples, these correlations are interpreted as associations rather than evidence of direct causal effects.
4. Discussion and Outlook
The contrasting responses of plant height, flowering, and flower biomass indicate that supplemental LED lighting altered the balance between vegetative growth and reproductive biomass allocation in C. indicum. The marked increase in plant height under the supplemental spectra, particularly under the R-enriched F4 treatment, may be associated with R-light-mediated phytochrome signaling, which regulates stem elongation and shoot architecture. In chrysanthemum (Chrysanthemum × morifolium), light quality and the red-to-far red ratio (far red at about 730 nm) have been shown to affect stem elongation, internode development, and shoot architecture, indicating that spectral composition can act not only as an energy source for photosynthesis but also as a developmental signal [17]. In addition, supplemental B light has been reported to promote stem and internode elongation in cut chrysanthemum, further demonstrating that spectral quality can modify plant architecture independently of its role in carbon assimilation [16].
In addition to its role in photosynthesis, spectral composition can modify plant morphology, physiological activity, carbohydrate accumulation, and biomass partitioning. For example, Moosavi-Nezhad et al. [38] reported that different R, B, R–B, and R–B–Fr spectra altered biomass partitioning in chrysanthemum cuttings. R-light promoted carbohydrate accumulation in leaves and directed a greater proportion of biomass toward below-ground tissues, whereas B light promoted above-ground growth and higher photosynthetic performance [38]. Similarly, Sommer et al. [19] demonstrated that different light spectra substantially altered morphology, gas exchange, and metabolism in chrysanthemum, even though total biomass accumulation was relatively unaffected. These findings support the interpretation that spectral composition can modify assimilate distribution and developmental patterns without necessarily producing a proportional increase in total biomass.
This spectral regulation may help explain why supplemental lighting increased plant height but did not increase flower number in the present study. Chrysanthemum is an obligate short-day plant, and both the duration and spectral composition of illumination can influence floral induction [17]. In particular, R light has a strong photoperiodic effect on chrysanthemum flowering through phytochrome-mediated signaling, although the response depends on cultivar, timing, duration, and spectral composition of the supplemental illumination [17]. Therefore, the increased vegetative growth observed under supplemental LED treatments may have occurred concurrently with changes in the photoperiodic signals controlling reproductive development.
The lower flower number under F2–F4 compared with the natural-light control suggests that supplemental lighting may have altered the balance between vegetative expansion and reproductive development. However, photosynthetic carbon assimilation and assimilate partitioning were not directly measured in the present experiment. Previous studies demonstrate that light quality can influence photosynthetic performance, carbohydrate accumulation, and the distribution of biomass among plant organs in chrysanthemum [19,38]. Thus, the lower number of flower heads under F2–F4 may reflect changes in developmental signaling and/or source–sink relationships rather than simply a reduction in photosynthetic carbon supply.
Interestingly, F2 and F3 produced heavier individual flowers than F1, but their lower flower numbers resulted in lower total flower biomass. This pattern suggests a possible trade-off between the number of reproductive sinks and biomass accumulation per flower. From a source–sink perspective, developing flowers represent strong sinks for assimilates, and changes in sink number may influence the amount of assimilate available to individual reproductive organs. Although direct evidence for such a trade-off was not obtained in the present study, the observed increase in individual flower biomass under F2 and F3 is consistent with the possibility that fewer established reproductive sinks allowed greater biomass accumulation per flower. This interpretation is also compatible with evidence that light quality can modify carbohydrate accumulation and biomass partitioning in chrysanthemum [38].
In contrast, F4 combined a relatively high flower number, although lower than F1, with the greatest individual flower biomass, resulting in the highest total flower biomass. This response suggests that F4 may have provided a comparatively favorable balance between reproductive sink establishment and biomass accumulation per flower. The higher biomass per flower under F2, F3, and F4 further suggests that the supplemental spectra may have favored biomass accumulation in individual developing flower heads once reproductive sinks had been established. However, because carbohydrate concentration, photosynthetic rate, and assimilate transport were not measured, this interpretation is considered a physiological hypothesis rather than a demonstrated mechanism.
Thus, among the tested spectra, F4 appeared to provide a favorable balance between the number of reproductive sinks and biomass accumulation per flower. An R:B ratio of 78:22 was associated with relatively favorable reproductive biomass allocation under the conditions of the present experiment. This result is not, however, interpreted as evidence that an R ratio of 78:22 is universally optimal for C. indicum, because the effects of spectral composition are dependent on genotype, light intensity, photoperiod, developmental stage, and the duration of supplemental lighting [17,19]. Nevertheless, the present findings suggest that an R-enriched spectrum may have potential for improving reproductive biomass production under the specific environmental and experimental conditions used in this study.
The physiological mechanisms underlying these responses, particularly those involving photosynthetic activity, carbohydrate partitioning, sink strength, and hormonal regulation, require further investigation through direct physiological measurements. Measurements of net photosynthetic rate, stomatal conductance, chlorophyll fluorescence, soluble sugars, starch, and relevant phytohormones would help determine whether the observed differences in flower number and flower biomass were associated with changes in carbon assimilation, carbohydrate availability, or developmental signaling. In future, such measurements are necessary to provide a stronger mechanistic basis for interpreting the effects of supplemental LED spectra on growth and reproductive biomass allocation in C. indicum.
Supplemental spectral LED lighting substantially influenced flower yield and EO production in C. indicum. The positive response of flower biomass to a combined R–B spectrum is consistent with previous findings in chrysanthemum showing that spectral composition can strongly modify plant growth, biomass partitioning, photosynthetic performance, and carbohydrate accumulation [18,19,38]. These findings provide a physiological basis for the enhanced flower biomass observed under F4 in the present study. The lighting treatment with a R:B ratio of 78:22 treatment may have provided favorable conditions for assimilate production and subsequent allocation to developing flower heads, although this proposed mechanism requires direct measurements of photosynthetic rate and carbohydrate status for confirmation.
The higher water content under F4 contributed to the greater fresh flower weight observed under this treatment. However, the increase in dry flower weight under F4 demonstrates that the response was not attributable solely to greater water accumulation. The simultaneous increase in fresh and dry biomass suggests that F4 enhanced the accumulation of structural and/or storage dry matter in developing flowers in addition to affecting tissue water status.
In terms of EO accumulation, the EO concentration increased progressively from F1 to F2, F3, and F4 suggesting that supplemental LED spectra affected not only flower biomass but also the accumulation of secondary metabolites in the flower tissue. Light is recognized as an important environmental signal regulating plant secondary metabolism, and spectral composition can modify the accumulation of specialized metabolites through photoreceptor-mediated regulation of metabolic pathways [18,39]. In chrysanthemum, supplementary LED spectra have been reported to modify secondary metabolite profiles, demonstrating that changes in spectral quality of plant lighting can induce metabolic responses beyond those associated with primary growth and photosynthesis [18]. More specifically, recent work in chrysanthemum has demonstrated that light-responsive regulatory networks can affect genes involved in phenylpropanoid and flavonoid biosynthesis, confirming that light signaling can directly influence secondary metabolism [39]. Although EOs are chemically distinct from flavonoids and phenolic compounds, these findings support the broader concept that spectral light quality can regulate specialized metabolism.
The increase in EO concentration under F2–F4 may also be associated with enhanced carbon availability and changes in the allocation of assimilates toward secondary metabolic pathways. R and B light can differentially affect photosynthetic activity and carbohydrate accumulation in chrysanthemum [38], and these primary metabolic changes may provide carbon skeletons and energy required for the biosynthesis of specialized metabolites. In aromatic and medicinal plants, LED spectral manipulation has likewise been shown to influence biomass and EO accumulation. For example, a recent study on Coriandrum sativum demonstrated that supplemental LED spectra significantly affected biomass and EO yield, with an optimized R-enriched spectrum producing substantially greater EO yield than the natural-light control [40]. Similarly, a recent study of Tagetes erecta showed that manipulating R and B spectral proportions significantly affected shoot biomass, flower yield, and EO production, with an R-enriched treatment producing higher oil yield than the control [21]. Although these species differ from C. indicum, these findings provide comparative evidence that spectral quality can simultaneously regulate biomass production and EO accumulation in aromatic plants.
Consequently, the higher EO yields observed under supplemental lighting in the present study can be interpreted as the combined result of increased flower biomass and increased oil concentration. EO yield is effectively determined by the amount of plant material available for extraction and the proportion of EO contained in that material. In the present experiment, F4 had both the highest dry flower yield and the highest EO concentration, resulting in the highest EO yield. Thus, the superior EO yield under F4 was not attributable solely to an increase in oil concentration but also to the greater amount of dry flower biomass available for oil production.
The increase in EO production under F4 is particularly relevant because flowers of C. indicum are known to contain a complex mixture of volatile compounds, including monoterpenes and sesquiterpenes. Previous chemical profiling of C. indicum flower oil identified numerous volatile constituents, with α-pinene, 1,8-cineole, and chrysanthenone among the major compounds [41]. EOs from C. indicum also show considerable variation in chemical composition among geographical populations, indicating that environmental and genetic factors can influence the accumulation of volatile metabolites [42].
In general, the lighting treatment with the ratio R:B = 78:22 (F4) was the most effective lighting regime among the treatments tested, simultaneously enhancing flower yield, individual flower biomass, EO concentration, and EO yield in C. indicum. This response is consistent with the broader evidence that spectral quality can simultaneously influence biomass accumulation, photosynthetic activity, biomass partitioning, and secondary metabolism in chrysanthemum and other aromatic plants [18,19,21,38,39,40]. Nevertheless, the present results do not establish that an R:B ratio of 78:22 is universally optimal for C. indicum. Rather, this ratio should be considered a promising spectral condition under the specific environmental, photoperiodic, light-intensity, cultivar, and cultivation conditions used in the present experiment.
The predominance of oxygenated monoterpenoids observed in the present study is consistent with previous reports showing that oxygenated monoterpenes can constitute a major fraction of C. indicum flower EO [42,43]. The major individual constituent in the present study was 2,2,6-trimethyl-3-keto-6-vinyltetrahydropyran, with the highest proportion observed under F3. Other prominent compounds included 14-hydroxy-9-epi-(E)-caryophyllene, cis-spiroether, lavandulyl acetate, and 1,8-cineole. Although the relative abundance of these compounds differed among the LED treatments, the persistence of the dominant constituent across all treatments indicates that supplemental light modified the quantitative distribution of the volatile profile rather than completely changing the qualitative identity of the EO.
The variation observed among F1–F4 suggests that supplemental LED spectra acted primarily as a quantitative regulator of EO composition. This interpretation is supported by broader evidence that light spectral quality can modify terpenoid profiles without necessarily causing the appearance or disappearance of all major compounds. A review by Contreras-Avilés et al. [44] concluded that spectral quality primarily modifies terpenoid profiles, whereas light intensity and photoperiod tend to influence overall metabolite abundance. The authors further identified HY5 as a central regulator linking light perception to transcriptional regulation of terpenoid biosynthesis under R and B light. Similarly, Liu et al. [45] reviewed evidence showing that light regulates specialized metabolism through light-responsive transcriptional and post-transcriptional mechanisms and that R and B wavelengths can differentially regulate genes associated with terpenoid biosynthetic pathways. Therefore, changes in the R:B ratio in the present experiment may have altered the relative activity of different branches of terpene metabolism, resulting in the observed quantitative shifts in oxygenated monoterpenoids and sesquiterpenes.
Notably, the proportion of sesquiterpene hydrocarbons increased substantially under F2 compared with the control F1. This response suggests that the F2 spectral environment may have favored the accumulation of hydrocarbon sesquiterpenes relative to other classes of volatile compounds. Light-dependent changes in sesquiterpene accumulation have been reported in other aromatic plants [46]. More recently, Tsiaparas et al. [47] demonstrated that R- and B-dominated spectra altered the relative abundance of individual mono- and sesquiterpenes in peppermint EO, although the overall EO yield and composition were not necessarily changed to the same extent. These findings indicate that spectral light can regulate specific branches or individual compounds within terpene metabolism rather than producing a uniform increase in all terpene classes.
In contrast, F3 promoted the accumulation of oxygenated monoterpenoids to the highest proportion among the treatments. Oxygenated monoterpenes are important constituents of C. indicum EO, and compounds such as 1,8-cineole, camphor, borneol, and related oxygenated monoterpenoids have frequently been reported among the principal volatile constituents of the species [8,43]. The higher proportion of oxygenated monoterpenoids under F3 may therefore indicate that this spectral combination favored metabolic flux toward oxygenated monoterpene formation or reduced the relative contribution of other terpene classes. However, because enzyme activities, precursor pools, and expression of terpene synthase or terpene-modifying genes were not measured in the present study, the precise biochemical mechanism cannot be established. Thus, the observed response can be interpreted as a spectral association with oxygenated monoterpene accumulation rather than direct evidence of enhanced activity of a specific biosynthetic pathway.
F4 resulted in the highest proportion of monoterpene hydrocarbons among the treatments. Although the magnitude of this change was small, it further demonstrates that relatively small changes in the R:B ratio can modify the balance among different terpene classes. Evidence from other aromatic plants supports this interpretation [46]. These results indicate that combined R and B illumination can influence the quantitative distribution of monoterpene and sesquiterpene constituents rather than simply increasing the total EO content.
The present results are therefore consistent with the concept that spectral composition acts as a metabolic signal in addition to its role in photosynthesis. Light perception through photoreceptors can activate downstream signaling networks involving transcription factors such as HY5, which regulate genes associated with specialized metabolism, including terpenoid biosynthesis [44,45]. In addition, changes in photosynthetic carbon fixation and carbohydrate availability under different R:B ratios may influence the supply of carbon precursors for terpene biosynthesis. Terpenoids are synthesized through the plastidial methylerythritol phosphate (MEP) pathway and the cytosolic mevalonate (MVA) pathway, both of which depend on primary metabolic intermediates. Consequently, changes in photosynthetic activity, carbon allocation, and light-responsive signaling could collectively contribute to the different terpene profiles observed among F1–F4. Evidence from LED studies in aromatic plants supports this connection between spectral quality, photosynthetic metabolism, and EO composition [46,47].
The fact that the dominant compound, 2,2,6-trimethyl-3-keto-6-vinyltetrahydropyran, remained predominant under all lighting conditions while its relative proportion varied from 32.54% to 39.94% is particularly noteworthy. This pattern suggests that the compound may represent a relatively stable characteristic of the volatile profile under the experimental conditions in the present study, whereas its relative accumulation was sensitive to the spectral environment. However, this compound has not consistently been reported as the dominant constituent in previous studies of C. indicum. Previous investigations have instead identified compounds such as camphor, 1,8-cineole, borneol, bornyl acetate, germacrene D, and caryophyllene oxide among the major constituents, with substantial variation among geographical populations and processing conditions [7,8,42,43]. Such differences highlight the strong influence of genotype, geographical origin, developmental stage, extraction method, and environmental conditions on the chemical profile of C. indicum EO.
Overall, these results demonstrate that supplemental LED lighting, particularly variation in the R:B ratio, altered the relative distribution of major chemical classes and individual constituents of C. indicum EO. EO from F2 was associated with a higher proportion of sesquiterpene hydrocarbons, F3 with the highest proportion of oxygenated monoterpenoids, and F4 with the highest proportion of monoterpene hydrocarbons. These treatment-specific responses support the hypothesis that spectral quality can be used as a tool to modulate the chemical profile of C. indicum EO. Similar spectral effects on EO composition have been reported in other aromatic plants, including Melissa officinalis and Mentha × piperita, although the direction and magnitude of the response are species- and compound-dependent [46,47]. The present results can be interpreted as evidence of spectral regulation of the relative chemical profile rather than proof of a specific biochemical mechanism.
EOs generally exert antimicrobial effects through multiple mechanisms, including disruption of membrane integrity, increased membrane permeability, leakage of intracellular ions and metabolites, and interference with cellular energy and enzyme systems [48]. Importantly, the antimicrobial effect of an EO cannot necessarily be attributed to a single major compound because interactions among constituents, including additive or synergistic effects, can substantially influence the overall activity. Indeed, previous work on C. indicum reported that the antimicrobial activity of the oil varied with changes in the relative abundance of its major constituents, and the complete EO could be more active than individual major compounds [43]. Therefore, the superior activity of F3 against S. aureus can be interpreted as a possible consequence of a favorable chemical profile generated under the 55R:45B spectrum rather than as evidence that a single compound was responsible for the observed inhibition.
The response of P. aeruginosa is particularly noteworthy because its susceptibility increased following supplemental LED illumination. Although Gram-negative bacteria are generally less susceptible to EOs because of their outer membrane barrier, some EO constituents can interact with or destabilize this barrier and thereby facilitate penetration into the cell [49]. The present result may consequently indicate that supplemental R–B illumination promoted a chemical composition of C. indicum EO that was more effective against the particular envelope and membrane characteristics of P. aeruginosa. Comparable evidence that light conditions can influence antimicrobial performance has been reported for other EOs: R and B LED exposure was shown to modify antibacterial responses in Eugenia EOs, while B LED treatment can enhance the antibacterial effects of EOs in combination with conventional antibiotics [50]. Nevertheless, because the present experiment did not directly determine the contribution of individual compounds to the antimicrobial response, this explanation is only regarded as a plausible interpretation rather than a demonstrated mechanism.
The comparatively weak activity against C. albicans, particularly under the LED treatments, may also reflect fundamental differences between fungal and bacterial cellular structures and targets. Unlike bacteria, C. albicans possesses a eukaryotic cell structure with a rigid cell wall and a sterol-containing plasma membrane. EOs can affect C. albicans through membrane perturbation, interference with ergosterol-related functions, oxidative stress, and inhibition of biofilm and cellular development, but their antifungal efficacy varies substantially among oils and fungal strains [51]. Interestingly, the strongest activity against this yeast was retained under F1 (natural sunlight), suggesting that the spectral composition of supplemental LED lighting may have shifted the oil profile away from the combination of constituents most effective against this fungal target.
The concentration-dependent inhibition of NO production observed in the present study is consistent with the well-established anti-inflammatory behavior of plant EOs in LPS-stimulated macrophage models. LPS activates macrophages through pattern-recognition receptors and downstream MAPK and NF-κB signaling, leading to the transcriptional induction of inducible nitric oxide synthase (iNOS) and consequently increased NO production. Therefore, suppression of NO release is widely used as an indicator of the anti-inflammatory potential of natural products and EOs. Previous study showed that several EOs can suppress LPS-induced NO production in RAW 264.7 macrophages in a concentration-dependent manner, often accompanied by reduced iNOS and/or COX-2 expression [52].
The present results are also consistent with previous evidence specifically for C. indicum. Although most previous studies examined extracts rather than EOs, C. indicum extracts have demonstrated clear anti-inflammatory activity in the same RAW 264.7/LPS model. Cheon et al. [53] reported that C. indicum extract inhibited NO production in a dose-dependent manner and simultaneously suppressed iNOS and COX-2 expression, NF-κB p65 nuclear translocation, IκBα phosphorylation, and ERK/JNK activation. Thus, the inhibition of LPS-induced NO production observed for the present C. indicum EOs provides further support for the anti-inflammatory potential of this species and suggests that its volatile fraction may contribute to the overall biological activity previously reported for C. indicum flowers.
The differences among the LED treatments suggest that spectral quality affected the anti-inflammatory potential of the resulting EOs. R and B lights were reported can regulate the biosynthesis and accumulation of phenolics, terpenoids, and other specialized metabolites, although the magnitude and direction of the response are strongly species- and compound-dependent [54]. Previous studies demonstrated that changing LED spectral composition can modify both the qualitative and quantitative composition of EOs in Melissa officinalis [46] and Mentha × piperita [47]. The enhanced anti-inflammatory activity under F2, F4, and particularly F3 of the present study may be associated with light-induced changes in the relative abundance and/or interactions of bioactive terpenoids in the EOs. This interpretation is particularly relevant because C. indicum EO contains several oxygenated monoterpenes and sesquiterpenoids with known biological activities [43,55,56].
The Pearson correlation analysis revealed a very strong positive correlation was observed between 1,8-cineole content and IC₅₀. However, previous studies have demonstrated that 1,8-cineole can suppress LPS-induced NO production and iNOS activity in macrophages [55]. Thus, the positive correlation observed in the present study may reflect changes in the overall chemical matrix of the EOs. The relationship between individual constituents and the overall anti-inflammatory activity of an EO should not be interpreted as a simple one-compound/one-effect relationship. EOs are complex mixtures in which additive, synergistic, or antagonistic interactions among constituents can influence biological activity. This interpretation is further supported by broader reviews showing that the effects of LED lighting on specialized metabolites, including terpenoids, are highly dependent on species, spectral composition, and the specific metabolite examined [57]. Therefore, the superior NO-inhibitory activity of F3 may reflect a favorable overall chemical profile produced under the 55R:45B spectrum rather than the increased accumulation of a single compound. Studies comparing chemically different EOs have shown that anti-inflammatory activity may arise from synergistic interactions among constituents and, in some cases, from minor rather than major components [58]. This interpretation is particularly relevant to C. indicum, whose EOs contain variable proportions of several main constituents were independently reported to inhibit NO production in LPS-activated macrophages [43,56]. Therefore, the enhanced NO-inhibitory activity of some LED-derived oils may reflect a favorable combination of multiple bioactive constituents rather than an increase in any single compound.
The IC₅₀ results provide further quantitative support for the spectral effect. The much lower IC₅₀ of the reference inhibitor L-NMMA confirms that the EOs were considerably less potent than a specific NOS inhibitor, as expected for complex natural mixtures containing multiple compounds with potentially different molecular targets. However, the present results demonstrated the meaningful anti-inflammatory potential of C. indicum EOs, especially when the plants are cultivated under the suitable supplemental lighting conditions.
Overall, the present findings suggest that supplemental R–B LED lighting for cultivating C. indicum can substantially modify the anti-inflammatory potential of its EO, most notably under the F2 and F3 spectral regimes. The stronger NO-inhibitory activity of these oils, together with their high macrophage viability at concentrations up to 2000 µg·mL⁻¹, indicates that spectral adjustment during cultivation may be a promising strategy for producing C. indicum EOs with enhanced anti-inflammatory properties. This interpretation is consistent with the broader literature demonstrating that LED spectral quality can reshape specialized-metabolite accumulation and the biological properties of medicinal and aromatic plants [57]. Nevertheless, direct mechanistic confirmation would require further analysis of iNOS, NF-κB/MAPK signaling, and the contribution of individual EO constituents under each lighting treatment. In addition, further experiments using isolated compounds, defined compound combinations, and a larger number of independent EO samples would be required to identify the constituents and interactions primarily responsible for the enhanced NO-inhibitory activity.
On the other hand, based on the PCA results, future studies should further refine the R:B ratio of supplemental LED lighting within the R-dominant spectral range, particularly around the favorable response observed at R:B = 78:22. A gradient experiment using intermediate R:B ratios, for example 65:35, 70:30, 75:25, 78:22, 80:20, 85:15, and 90:10, would help to answer the question whether the response observed under F4 represents an optimum or falls within a broader favorable spectral range. Such an approach would allow the identification of an appropriate balance between vegetative growth and reproductive development while maximizing flower biomass, EO yield, and accumulation of the major EO constituent. Because the PCA indicated that plant height and EO concentration responded differently from flower biomass, EO yield, and major-compound concentration, future optimization should consider these traits simultaneously rather than maximizing a single growth or quality parameter. In addition, direct measurements of photosynthetic performance, carbohydrate allocation, and secondary-metabolite biosynthesis would be valuable for elucidating the physiological mechanisms underlying the responses to different R:B ratios.
5. Conclusions
Supplemental R–B LED lighting altered plant growth, flowering, biomass allocation, EO production, and bioactivities of Chrysanthemum indicum compared with natural sunlight alone. While the control lighting treatment with the natural global light (F1) promoted earlier flowering and a greater number of flowers, supplemental lighting between sunset and midnight in these experiments produced taller plants with fewer but heavier flowers, accompanied by higher EO content and yield. Among the tested spectra, F4 (R:B = 78:22) showed the best overall performance for flower biomass and EO production, whereas F3 (R:B = 55:45) enhanced the bioactive quality of the oil, with the highest content of 2,2,6-trimethyl-3-keto-6-vinyltetrahydropyran and the strongest anti-inflammatory activity. These results demonstrate the potential of supplemental R–B LED lighting to regulate the balance between flower production, biomass accumulation, and EO quality, with the optimal spectrum depending on the intended production objective. Further studies covering a broader range of R:B ratios, light intensities, and photoperiods (with different illumination durations between 4 hours and 8 hours, with different time points of the supplemental lighting applications as directly after sunset or from midnight on), together with physiological measurements, are needed to clarify the underlying mechanisms and optimize supplemental lighting strategies for C. indicum cultivation.
Author Contributions
Conceptualization, H.T.T.C. and T.N.V.; methodology, H.T.T.C., T.N.V. and P.T.D.; validation, H.T.T.C. and K.Q.T.; formal analysis, H.T.T.C. and K.X.L.; investigation, H.T.T.C., T.N.V., P.T.D. and K.X.L.; resources, P.T.D. and K.Q.T.; data curation, H.T.T.C.; writing—original draft preparation, H.T.T.C.; writing—review and editing, H.T.T.C., T.N.V., P.T.D., K.X.L. and K.Q.T.; project administration, H.T.T.C.; funding acquisition, H.T.T.C. All authors have read and agreed to the published version of the manuscript.
Funding
This research was funded by Vietnam Academy of Science and Technology, grant number ĐL0000.06/24-26.
Data Availability Statement
All data are available in this publication.
Acknowledgments
The authors gratefully acknowledge Dinh Thi Thu Thuy for technical support.
Conflicts of Interest
The authors declare no conflicts of interest.
Abbreviations
The following abbreviations are used in this manuscript:
| B | blue |
| DLI | daily light integral |
| DMEM | dulbecco’s modified eagle medium |
| DMSO | dimethyl sulfoxide |
| EI | electron ionization |
| EO | essential oil |
| FBS | fetal bovine serum |
| GC/MS-FID | gas chromatography/ mass spectrometry – flame ionization detection |
| IC₅₀ | half-maximal inhibitory concentration |
| LED | light-emitting diode |
| L-NMMA | Nᴳ-methyl-L-arginine acetate |
| LPS | lipopolysaccharide |
| LSD | least significant difference |
| MIC | minimum inhibitory concentration |
| MTT | methyl thiazolyl tetrazolium |
| NO | nitric oxide |
| OD | optical density |
| PCA | principal component analysis |
| PPFD | photosynthetic photon flux density |
| R | red |
| RI | retention index |
| NaNO₂ | sodium nitrite |
| Tr | trace |
References
- Shao, Y.; Sun, Y.; Li, D.; Chen, Y. Chrysanthemum Indicum L.: A Comprehensive Review of Its Botany, Phytochemistry and Pharmacology. Am. J. Chin. Med. 2020, 48, 871–897. [Google Scholar] [CrossRef]
- Liang, Y.; Liu, T.; Wang, D.; Liu, Q. Exploring the Antimicrobial, Anti-Inflammatory, Antioxidant, and Immunomodulatory Properties of Chrysanthemum Morifolium and Chrysanthemum Indicum: A Narrow Review. Front. Pharmacol. 2025, 16, 1538311. [Google Scholar] [CrossRef]
- Rushendran, R.; Chitra, V.; Kaliappan, I.; Pathak, S. A Review on Medicinal Profile of Chrysanthemum Indicum: Network Analysis. Heal. Sci. Rev. 2025, 16, 100239. [Google Scholar] [CrossRef]
- Baiti, Q.A.N.; Salsabila, Z.; Apsari, W.H.P.; Ramadhan, M.B.; Karen, E.; Valencia, V.; Sahid, M.N.A.; Darsih, C.; Laksitorini, M.D. The Development of Plant-Based Jelly Candy for Chrysanthemum Indicum L. Flower Extract and Evaluation of the Antioxidant Activity’. Indones. J. Pharm. 2024, 35, 292–304. [Google Scholar] [CrossRef]
- Mukherjee, S.; Gupta, A.; Bhatnagar, T. Plant-Mediated Green Synthesis of A-Fe2O3 Nanoparticles from Chrysanthemum Indicum Flower Extract: Applications in Photolytic Dextromethorphan Degradation, Dye Removal, and Antibacterial Activity Assessment. ChemistrySelect 2025, 10, e202404574. [Google Scholar] [CrossRef]
- Shunying, Z.; Yang, Y.; Huaidong, Y.; Yue, Y.; Guolin, Z. Chemical Composition and Antimicrobial Activity of the Essential Oils of Chrysanthemum Indicum. J. Ethnopharmacol. 2005, 96, 151–158. [Google Scholar] [CrossRef]
- Jung, E.-K. Chemical Composition and Antimicrobial Activity of the Essential Oil of Chrysanthemum Indicum against Oral Bacteria. J. Bacteriol. Virol. 2009, 39, 61–69. [Google Scholar] [CrossRef]
- Youssef, F.S.; Eid, S.Y.; Alshammari, E.; Ashour, M.L.; Wink, M.; El-Readi, M.Z. Chrysanthemum Indicum and Chrysanthemum Morifolium: Chemical Composition of Their Essential Oils and Their Potential Use as Natural Preservatives with Antimicrobial and Antioxidant Activities. Foods 2020, 9. [Google Scholar] [CrossRef]
- Liu, Y.; Zhou, F.; Zhao, H.; Song, J.; Song, M.; Zhu, J.; Wang, Y.; Hoi, M.P.M.; Lin, L.; Zhang, Q. Dimeric Guaianolide Sesquiterpenoids from the Flowers of Chrysanthemum Indicum Ameliorate Hepatic Steatosis through Mitigating SIRT1-Mediated Lipid Accumulation and Ferroptosis. J. Adv. Res. 2025. [Google Scholar] [CrossRef]
- Luo, Q.-H.; Chen, H.-J.; Zhong, Q.-Y.; He, H.-E.; Huang, Y.-Q.; Liu, Y.-C.; Lan, B.; Wen, Y.-Q.; Deng, S.-L.; Du, X.-H. Prevention of Supercritical Carbon Dioxide Fluid Extract from Chrysanthemum Indicum Linnén on Cutaneous Squamous Cell Carcinomas Progression Following UV Irradiation in Mice. Exp. Ther. Med. 2024, 28, 330. [Google Scholar] [CrossRef]
- Zhang, X.; Xie, Y.; Yu, X.; Su, Z.; Yuan, J.; Li, Y. Protective Effect of Supercritical-Carbon Dioxide Fluid Extract from Flowers and Buds of Chrysanthemum Indicum Linné n against UV-Induced Photoaging in Mice; pp. 1–41.
- Kim, D.-S.; Goo, Y.-M.; Cho, J.; Lee, J.; Lee, D.Y.; Sin, S.M.; Kil, Y.S.; Jeong, W.M.; Ko, K.H.; Yang, K.J. Effect of Volatile Organic Chemicals in Chrysanthemum Indicum Linné on Blood Pressure and Electroencephalogram. Molecules 2018, 23, 2063. [Google Scholar] [CrossRef]
- Jing, C.-L.; Huang, R.-H.; Su, Y.; Li, Y.-Q.; Zhang, C.-S. Variation in Chemical Composition and Biological Activities of Flos Chrysanthemi Indici Essential Oil under Different Extraction Methods. Biomolecules 2019, 9, 518. [Google Scholar] [CrossRef]
- Sharathkumar, M.; Heuvelink, E.; Marcelis, L.F.M.; Ieperen, W. Van Floral Induction in the Short-Day Plant Chrysanthemum Under Blue and Red Extended Long-Days. 2021, 11. [Google Scholar] [CrossRef]
- Yang, J.; Song, J.; Park, Y.G.; Jeong, B.R. Both the Positioned Supplemental or Night-Interruptional Blue Light and the Age of Leaves (or Tissues) Are Important for Flowering and Vegetative Growth in Chrysanthemum. Plants 2024, 13, 2874. [Google Scholar] [CrossRef]
- Jeong, S.W.; Hogewoning, S.W.; van Ieperen, W. Responses of Supplemental Blue Light on Flowering and Stem Extension Growth of Cut Chrysanthemum. Sci. Hortic. . 2014, 165, 69–74. [Google Scholar] [CrossRef]
- Nissim-Levi, A.; Kitron, M.; Nishri, Y.; Ovadia, R.; Forer, I.; Oren-Shamir, M. Effects of Blue and Red LED Lights on Growth and Flowering of Chrysanthemum Morifolium. Sci. Hortic. . 2019, 254, 77–83. [Google Scholar] [CrossRef]
- Ouzounis, T.; Fretté, X.; Rosenqvist, E.; Ottosen, C.O. Spectral Effects of Supplementary Lighting on the Secondary Metabolites in Roses, Chrysanthemums, and Campanulas. J. Plant Physiol. 2014, 171, 1491–1499. [Google Scholar] [CrossRef]
- Sommer, S.G.; Castro-Alves, V.; Hyötyläinen, T.; Strid, Å.; Rosenqvist, E. The Light Spectrum Differentially Influences Morphology, Physiology and Metabolism of Chrysanthemum× Morifolium without Affecting Biomass Accumulation. Physiol. Plant. 2023, 175, e14080. [Google Scholar] [CrossRef]
- Yang, J.; Cheng, Z.; Song, J.; Jeong, B.R. High-Blue/Low-Red Mixed Light Modulates Photoperiodic Flowering in Chrysanthemum via Photoreceptor and Sugar Pathways. Plants 2025, 14, 3151. [Google Scholar] [CrossRef]
- Chu, H.T.T.; Nguyen, N.H.; Phan, Q.; Dinh, T.T.T.; Hoang, T.H.T.; Van Nguyen, T.; Chu, H.H.; Tong, Q.C.; Tien, T.Q.; Setzer, W.N. LED Light-Quality Optimization to Enhance Shoot and Essential Oil Yield of Tagetes Erecta L. in Controlled Environment. Molecules 2026, 31, 1491. [Google Scholar] [CrossRef]
- Microshoots, R.; Dewir, Y.H.; Al-ali, A.M.; Rihan, H.Z.; Alshahrani, T.; Alwahibi, M.S.; Almutairi, K.F.; Naidoo, Y.; Fuller, M.P. Effects of Artificial Light Spectra and Sucrose on the Leaf Pigments, Growth, and Rooting of Blackberry. 2023. [Google Scholar] [CrossRef]
- Vaštakaitė-Kairienė, V.; Jurkonienė, S.; Rasiukevičiūtė, N.; Karklelienė, R.; Samuolienė, G. The Influence of Pre-Harvest Leds on Phytochemical Constituents and Antioxidant Activity of Microgreens during Short-Term Storage. Agronomy 2023, 13, 2188. [Google Scholar] [CrossRef]
- Xuan, H.-M.; Shi, H.-Z.; Guo, Q.-S.; Zhang, H.-N.; Lei, M.; Wang, C.-L. Effects of Light Intensity on Physio-Biochemical Characteristics of Chrysanthemum Indicum. Zhongguo Zhong yao za zhi= Zhongguo Zhongyao Zazhi= China J. Chinese Mater. Medica 2020, 45, 1620–1626. [Google Scholar]
- Korachar, Manjunatha Marappa; Deep, Akash; Shrikant S., Adarsha; gouda, A. Microclimate Modification through Green Shade Nets Enhances Growth, Yield, and Water Productivity of Chrysanthemum Indicum L. under Semi-Tropical Conditions. Int. J. Res. Agron. 2025, 8, 714–722. [Google Scholar] [CrossRef]
- Liu, X.; Han, M.; Jiang, T.; Liu, L.; Luo, J.; Lu, Y.; Zhao, Y.; Jiang, C.-Z.; Gao, J.; Hong, B. AGAMOUS-LIKE 24 Senses Continuous Inductive Photoperiod in the Inflorescence Meristem to Promote Anthesis in Chrysanthemum. Plant Cell 2024, 36, 4658–4671. [Google Scholar] [CrossRef]
- Hung, Truong Thanh; Dung, Ngo Minh; Luan, Pham Cong; Thach, Nguyen Quang. Research on Night-Break Effects of Lighting from Specialized LED on Growth and Flowering Control of Chrysanthemum (Chrysanthemum Indicum L.) on a Hydroponic System. J. Sci. Technol. Nguyen Tat Thanh Univ. 2024, 7, 40–47. [Google Scholar]
- Do, T. G.; Hoang, T. H.; Do, T. P.; et al. Study on the Application of LED Lighting in Seedling Production of Some Chrysanthemum Varieties in Hanoi. Vietnam J. Sci. Technol. 2022, 64, 48–53. [Google Scholar] [CrossRef]
- Bich, Do Huy; Chung, Dang Quang; Chuong, Bui Xuan; Dong, Nguyen Thuong; Dam, Do Trung; Van Hien, Pham; Lo, Vu Ngoc; Mai, Pham Duy; Man, Pham Kim; Nhu, Doan Thi; Nguyen Tap, T.T. Medicinal Plants and Medicinal Animals in Vietnam; Science and Technology Publishing House: Ha Noi, 2004. [Google Scholar]
- Ministry of Health Vietnamese Pharmacopoeia; Medical Publishing House: Hanoi, Vietnam, 2017.
- Adams, R.P. Identification of Essential Oil Components by Gas Chromatography, Mass Spectrometry, 4th ed.; Allured Publishing Corporation: Carol Stream: IL, USA, 2017; ISBN 978-1-932633-21. [Google Scholar]
- Linstrom, P. J.; Mallard, W.G. NIST Chemistry Webbook, NIST Standard Reference Database Number 69; National Institute of Standards and Technology: Gaithersburg MD, USA, 2024. [Google Scholar]
- König, W. A.; Joulain, D.; Hochmuth, D.H. Terpenoids and Related Constituents of Essential Oils 2004. Volume 2.
- Hadacek, F.; Greger, H. Testing of Antifungal Natural Products: Methodologies, Comparability of Results and Assay Choice; 2000. [Google Scholar]
- Cos, P.; Vlietinck, A.J.; Berghe, D. Vanden; Maes, L. Anti-Infective Potential of Natural Products: How to Develop a Stronger in Vitro “Proof-of-Concept.”. J. Ethnopharmacol. 2006, 106, 290–302. [Google Scholar] [CrossRef]
- Cheenpracha, S.; Park, E.-J.; Rostama, B.; Pezzuto, J.M.; Chang, L.C. Inhibition of Nitric Oxide (NO) Production in Lipopolysaccharide (LPS)-Activated Murine Macrophage RAW 264.7 Cells by the Norsesterterpene Peroxide, Epimuqubilin A. Mar. Drugs 2010, 8, 429–437. [Google Scholar] [CrossRef]
- Marques, R.V.; Sestito, S.E.; Bourgaud, F.; Miguel, S.; Cailotto, F.; Reboul, P.; Jouzeau, J.-Y.; Rahuel-Clermont, S.; Boschi-Muller, S.; Simonsen, H.T. Anti-Inflammatory Activity of Bryophytes Extracts in LPS-Stimulated RAW264. 7 Murine Macrophages. Molecules 2022, 27, 1940. [Google Scholar] [CrossRef]
- Moosavi-Nezhad, M.; Alibeigi, B.; Estaji, A.; Gruda, N.S.; Aliniaeifard, S. Growth, Biomass Partitioning, and Photosynthetic Performance of Chrysanthemum Cuttings in Response to Different Light Spectra. Plants 2022, 11, 3337. [Google Scholar] [CrossRef]
- Zheng, L.; Van Labeke, M.-C. Effects of Different Irradiation Levels of Light Quality on Chrysanthemum. Sci. Hortic. . 2018, 233, 124–131. [Google Scholar] [CrossRef]
- Vu, T.N.; Chu, H.T.T.; Dinh, T.T.T.; Tien, T.Q.; Do, P.T.; Tran, K.Q.; Setzer, W.N. Enhanced Biomass and Essential Oil Yield in Coriandrum Sativum L. through Optimized Additional Night-Time LED Light Spectra and Dose. Hortic. Environ. Biotechnol. 2026. [Google Scholar] [CrossRef]
- Chang, K.-M.; Kim, G.-H. Volatile Aroma Composition of Chrysanthemum Indicum L. Flower Oil. J. Food Sci. Nutr. 2008, 13, 122–127. [Google Scholar] [CrossRef]
- Zhang, C.; Qin, M. J.; Shu, P.; Hong, J. L.; Lü, L.; He, D.X. Chemical Variations of the Essential Oils in Flower Heads of Chrysanthemum Indicum L. from China. Chem. Biodivers. 2010, 7, 2951–2962. [Google Scholar] [CrossRef]
- Shunying, Z.; Yang, Y.; Huaidong, Y.; Yue, Y.; Guolin, Z. Chemical Composition and Antimicrobial Activity of the Essential Oils of Chrysanthemum Indicum. J. Ethnopharmacol. 2005, 96, 151–158. [Google Scholar] [CrossRef]
- Contreras-Avilés, W.; Heuvelink, E.; Marcelis, L.F.M.; Kappers, I.F. Ménage à Trois: Light, Terpenoids, and Quality of Plants. Trends Plant Sci. 2024, 29, 572–588. [Google Scholar] [CrossRef]
- Liu, Y.; Singh, S.K.; Pattanaik, S.; Wang, H.; Yuan, L. Light Regulation of the Biosynthesis of Phenolics, Terpenoids, and Alkaloids in Plants. Commun. Biol. 2023, 6, 1055. [Google Scholar] [CrossRef]
- Ahmadi, T.; Shabani, L.; Sabzalian, M.R. LED Light Sources Improved the Essential Oil Components and Antioxidant Activity of Two Genotypes of Lemon Balm (Melissa Officinalis L.). Bot. Stud. 2021, 62, 9. [Google Scholar] [CrossRef]
- Tsiaparas, S.; Kuchem, P.; Krämer, J.; Hubert-Schöler, C.; Luhmer, K.; Moll, M.D.; Pude, R.; Schieber, A.; Wüst, M.; Passon, M. Influence of Red-and Blue-Dominant Light Spectra on the Biosynthesis of Mono-and Sesquiterpenes in Mint (Mentha× Piperita) Essential Oil. Food Chem. 2025, 146731. [Google Scholar] [CrossRef]
- Angane, M.; Swift, S.; Huang, K.; Butts, C.A.; Quek, S.Y. Essential Oils and Their Major Components: An Updated Review on Antimicrobial Activities, Mechanism of Action and Their Potential Application in the Food Industry. Foods 2022, 11, 464. [Google Scholar] [CrossRef]
- Aelenei, P.; Miron, A.; Trifan, A.; Bujor, A.; Gille, E.; Aprotosoaie, A.C. Essential Oils and Their Components as Modulators of Antibiotic Activity against Gram-Negative Bacteria. Medicines 2016, 3, 19. [Google Scholar] [CrossRef]
- Pereira, N.L.F.; Aquino, P.E.A.; Júnior, J.G.A.S.; Cristo, J.S.; Vieira Filho, M.A.; Moura, F.F.; Ferreira, N.M.N.; Silva, M.K.N.; Nascimento, E.M.; Correia, F.M.A. In Vitro Evaluation of the Antibacterial Potential and Modification of Antibiotic Activity of the Eugenia Uniflora L. Essential Oil in Association with Led Lights. Microb. Pathog. 2017, 110, 512–518. [Google Scholar] [CrossRef]
- Hou, G.; Huang, T. Essential Oils as Promising Treatments for Treating Candida Albicans Infections: Research Progress, Mechanisms, and Clinical Applications. Front. Pharmacol. 2024, 15, 1400105. [Google Scholar] [CrossRef]
- Chou, S.-T.; Peng, H.-Y.; Hsu, J.-C.; Lin, C.-C.; Shih, Y. Achillea Millefolium L. Essential Oil Inhibits LPS-Induced Oxidative Stress and Nitric Oxide Production in RAW 264.7 Macrophages. Int. J. Mol. Sci. 2013, 14, 12978–12993. [Google Scholar] [CrossRef]
- Cheon, M.S.; Yoon, T.; Choi, G.; Moon, B.C.; Lee, A.-Y.; Choo, B.K.; Kim, H.K. Chrysanthemum Indicum Linné Extract Inhibits the Inflammatory Response by Suppressing NF-ΚB and MAPKs Activation in Lipopolysaccharide-Induced RAW 264.7 Macrophages. J. Ethnopharmacol. 2009, 122, 473–477. [Google Scholar] [CrossRef]
- Trivellini, A.; Toscano, S.; Romano, D.; Ferrante, A. The Role of Blue and Red Light in the Orchestration of Secondary Metabolites, Nutrient Transport and Plant Quality. Plants 2023, 12, 2026. [Google Scholar] [CrossRef]
- Ma, S.; Yang, B.; Du, Y.; Lv, Y.; Liu, J.; Shi, Y.; Huang, T.; Xu, H.; Deng, L.; Chen, X. 1, 8-Cineole Ameliorates Colon Injury by Downregulating Macrophage M1 Polarization via Inhibiting the HSP90-NLRP3-SGT1 Complex. J. Pharm. Anal. 2023, 13, 984–998. [Google Scholar] [CrossRef]
- Tung, Y.-T.; Chua, M.-T.; Wang, S.-Y.; Chang, S.-T. Anti-Inflammation Activities of Essential Oil and Its Constituents from Indigenous Cinnamon (Cinnamomum Osmophloeum) Twigs. Bioresour. Technol. 2008, 99, 3908–3913. [Google Scholar] [CrossRef]
- Appolloni, E.; Pennisi, G.; Zauli, I.; Carotti, L.; Paucek, I.; Quaini, S.; Orsini, F.; Gianquinto, G. Beyond Vegetables: Effects of Indoor LED Light on Specialized Metabolite Biosynthesis in Medicinal and Aromatic Plants, Edible Flowers, and Microgreens. J. Sci. Food Agric. 2022, 102, 472–487. [Google Scholar] [CrossRef]
- Genčić, M.S.; Aksić, J.M.; Stošić, M.Z.Ž.; Randjelović, P.J.; Stojanović, N.M.; Stojanović-Radić, Z.Z.; Radulović, N.S. Linking the Antimicrobial and Anti-Inflammatory Effects of Immortelle Essential Oil with Its Chemical Composition–The Interplay between the Major and Minor Constituents. Food Chem. Toxicol. 2021, 158, 112666. [Google Scholar] [CrossRef]
Figure 1.
Normalized spectral distribution of the different light treatments.
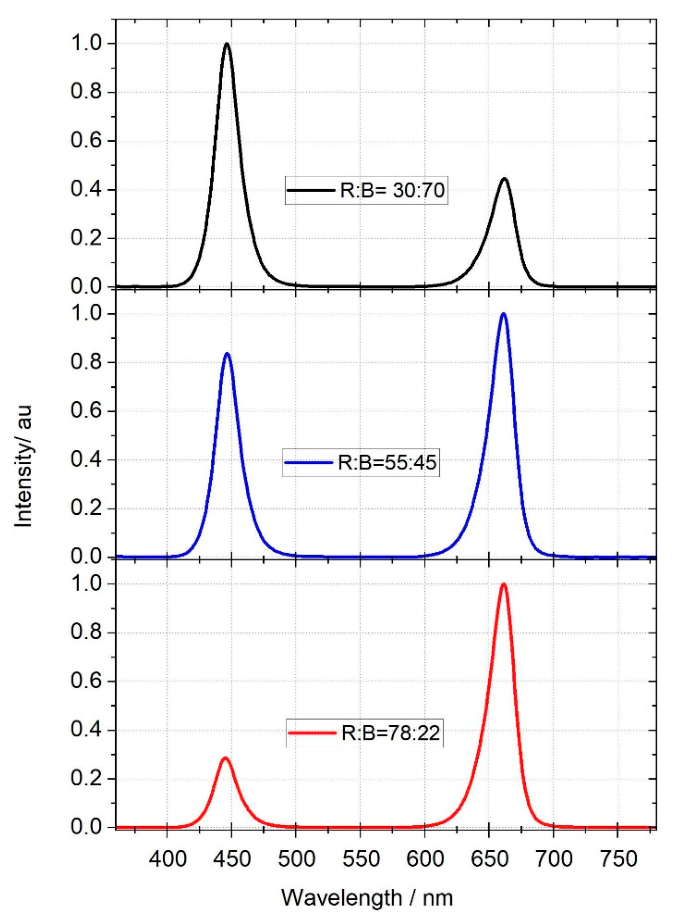
Figure 2.
Plant height and flower characteristics of Chrysanthemum indicum cultivated under the control condition F1 and other three supplemental spectral LED lighting conditions. Note: Mean values followed by the same letter within a chart are not statistically different for 0.05 significant level (n=3). Statistical analyses were performed using IRRISTAT ver. 5.0 (International Rice Research Institute, Laguna, Philippines).
Figure 2.
Plant height and flower characteristics of Chrysanthemum indicum cultivated under the control condition F1 and other three supplemental spectral LED lighting conditions. Note: Mean values followed by the same letter within a chart are not statistically different for 0.05 significant level (n=3). Statistical analyses were performed using IRRISTAT ver. 5.0 (International Rice Research Institute, Laguna, Philippines).
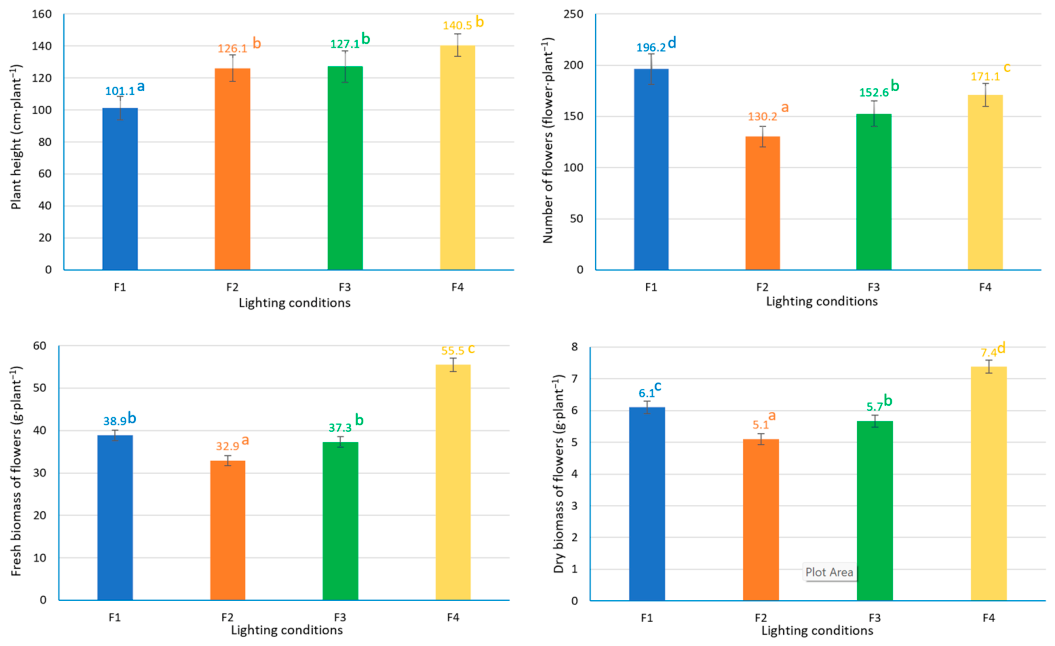
Figure 3.
PCA of treatment effects and key contributors in Chrysanthemum indicum cultivated under the control condition F1 and other three supplemental spectral LED lighting conditions. Note: PCA analysis was performed using software tool CropGenoViz—Exploring Crop Genetic Diversity, ver. 1.0 (Nguyen, Trung Duc, https://ntducphd.shinyapps.io/cropgenoviz/; accessed on 18 August 2026); PH = Plant height; FN = Number of flowers; FFB = Fresh biomass of flower; CW = Concentration of water; DFB = Dry biomass of flower; EOC = Essential oil concentration; EOY = Essential oil yield; MCC = Concentration of main compound (2,2,6-Trimethyl-3-keto-6-vinyltetrahydropyran).
Figure 3.
PCA of treatment effects and key contributors in Chrysanthemum indicum cultivated under the control condition F1 and other three supplemental spectral LED lighting conditions. Note: PCA analysis was performed using software tool CropGenoViz—Exploring Crop Genetic Diversity, ver. 1.0 (Nguyen, Trung Duc, https://ntducphd.shinyapps.io/cropgenoviz/; accessed on 18 August 2026); PH = Plant height; FN = Number of flowers; FFB = Fresh biomass of flower; CW = Concentration of water; DFB = Dry biomass of flower; EOC = Essential oil concentration; EOY = Essential oil yield; MCC = Concentration of main compound (2,2,6-Trimethyl-3-keto-6-vinyltetrahydropyran).
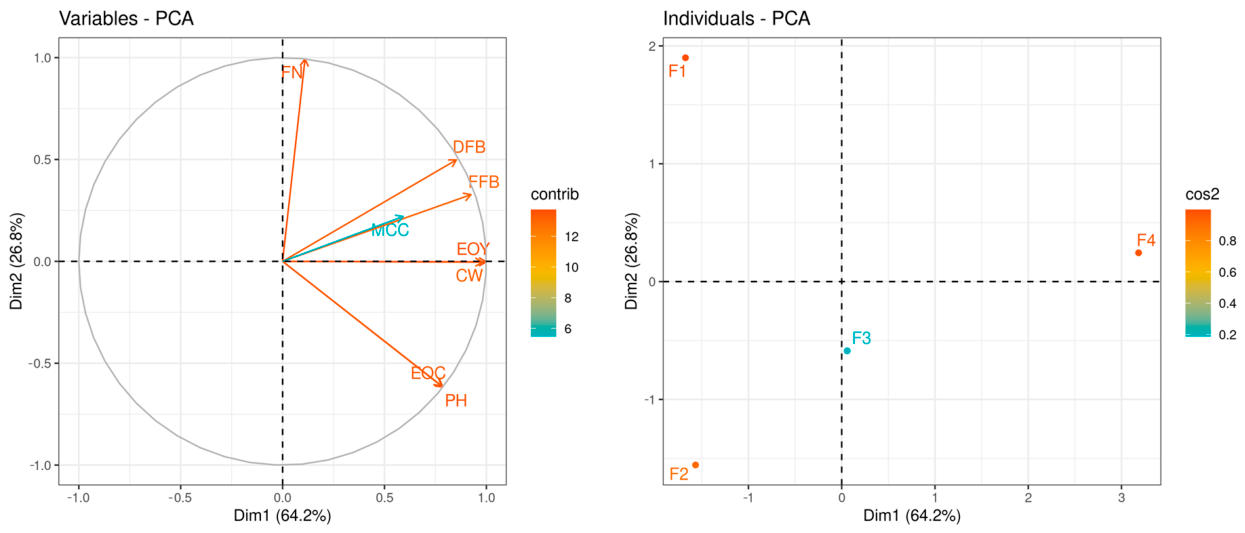
Figure 4.
Inhibitory effect of essential oils of Chrysanthemum indicum cultivated under the control condition F1 and other three supplemental spectral LED lighting conditions on NO production in LPS-mediated macrophage RAW 264.7 cells (A) and cell viability of RAW 264.7 cells (B) (the dashed green line represents 80% of cell viability). Note: L-NMMA: NG-Methyl-L-arginine acetate; NO: nitric oxide; mean values followed by the same letter within each concentration are not statistically different at 0.05 significance level (n = 3). Statistical analyses were performed using the software tool IRRISTAT ver. 5.0 (International Rice Research Institute, Laguna, Philippines).
Figure 4.
Inhibitory effect of essential oils of Chrysanthemum indicum cultivated under the control condition F1 and other three supplemental spectral LED lighting conditions on NO production in LPS-mediated macrophage RAW 264.7 cells (A) and cell viability of RAW 264.7 cells (B) (the dashed green line represents 80% of cell viability). Note: L-NMMA: NG-Methyl-L-arginine acetate; NO: nitric oxide; mean values followed by the same letter within each concentration are not statistically different at 0.05 significance level (n = 3). Statistical analyses were performed using the software tool IRRISTAT ver. 5.0 (International Rice Research Institute, Laguna, Philippines).
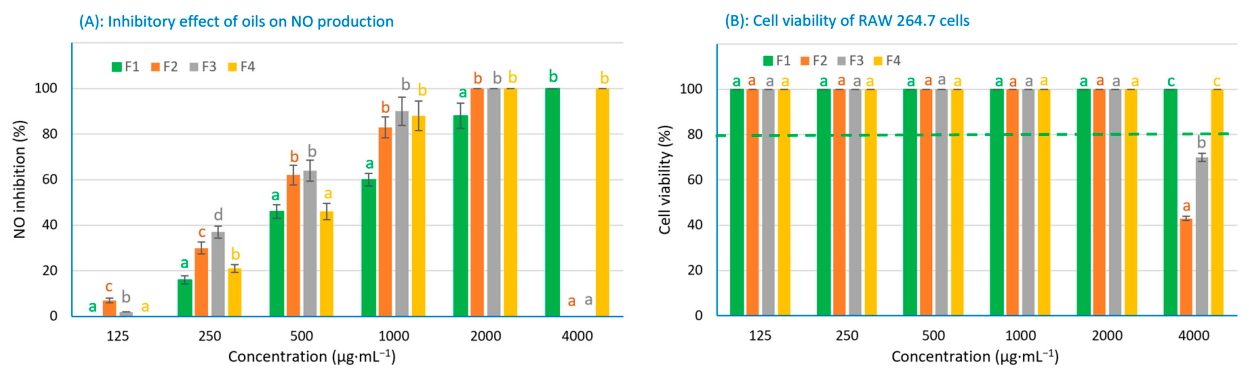
Table 1.
Supplemental LED lighting treatments for Chrysanthemum indicum.
| Treatments | R:B ratio | Supplemental lighting duration (h·d−1) | Lighting time |
Total LED light intensity (µmol·m-2·s-1) |
Supplemental daily light integral (mol·m-2·d-1) |
Sunlight -nethouse (mol·m−2·d −1) |
Total daily light integral (mol·m-2·d-1) |
| F1 | 0 | 0 | 0 | 0 | 0 | 11.98 | 11.98 |
| F2 | R:B=30:70 | 6 | 18:30-24:30 | 100 | 2.16 | 11.98 | 14.14 |
| F3 | R:B=55:45 | 6 | 18:30-24:30 | 100 | 2.16 | 11.98 | 14.14 |
| F4 | R:B=78:22 | 6 | 18:30-24:30 | 100 | 2.16 | 11.98 | 14.14 |
Table 2.
Flower biomass and essential oil yield of Chrysanthemum indicum cultivated under the control condition F1 and other three supplemental spectral LED lighting conditions.
Table 2.
Flower biomass and essential oil yield of Chrysanthemum indicum cultivated under the control condition F1 and other three supplemental spectral LED lighting conditions.
| Treatments | F1 | F2 | F3 | F4 |
| Fresh weight of flower (g·flower−1) | 0.198 ± 0.006a | 0.253 ± 0.009b | 0.245 ± 0.008b | 0.324 ± 0.009c |
| Fresh yield of flower (ton·ha−1)* | 7.580 ± 0.245b | 6.419 ± 0.223a | 7.274 ± 0.239b | 10.824 ± 0.304c |
| Water concentration (%) | 84.300 ± 0.200a | 84.500 ± 0.173ab | 84.800 ± 0.173b | 86.700 ± 0.265c |
| Dry weight of flower (g·flower−1) | 0.031 ± 0.001a | 0.039 ± 0.001b | 0.037 ± 0.001b | 0.043 ± 0.001c |
| Dry yield of flower (ton·ha−1)* | 1.190 ± 0.038c | 0.995 ± 0.035a | 1.106 ± 0.036b | 1.440 ± 0.04d |
| Essential oil concentration (%) | 0.504 ± 0.020a | 0.617 ± 0.011b | 0.663 ± 0.016c | 0.695 ± 0.011c |
| Essential oil yield (kg·ha−1) | 5.999 ± 0.320a | 6.139 ± 0.241a | 7.333 ± 0.192b | 10.009 ± 0.434c |
Note: Mean values sharing the same letter within a column do not differ significantly at the 5% significance level (n = 3). Statistical analyses were conducted using IRRISTAT ver. 5.0 (International Rice Research Institute, Laguna, Philippines). *Estimated values were calculated based on a cultivation spacing of 20 × 20 cm for C. indicum, corresponding to an estimated density of 195,000 plants·ha⁻¹.
Table 3.
Composition of essential oils of Chrysanthemum indicum cultivated under the control condition F1 and other three supplemental spectral LED lighting conditions.
Table 3.
Composition of essential oils of Chrysanthemum indicum cultivated under the control condition F1 and other three supplemental spectral LED lighting conditions.
| Compoundsa | RIb | F1c | F2c | F3c | F4c |
| α-Thujene | 929 | 0.21 | Tr | Tr | 0.23 |
| Sabinene | 978 | 0.23 | 0.15 | 0.17 | 0.20 |
| β-Pinene | 984 | 0.11 | Tr | 0.12 | Tr |
| Myrcene | 991 | 1.56 | 1.54 | 1.55 | 1.16 |
| o-Cymene | 1029 | 0.14 | 0.11 | 0.12 | 0.13 |
| Limonene | 1033 | 0.26 | Tr | Tr | 1.57 |
| β-Phellandrene | 1036 | 1.29 | 1.21 | 1.31 | 1.02 |
| 1,8-Cineole | 1038 | 3.02 | 2.83 | 2.75 | 2.93 |
| (E)-β-Ocimene | 1048 | 0.32 | 0.32 | 0.33 | 0.27 |
| cis-Linalool oxide (furanoid) | 1077 | 0.26 | 0.23 | 0.36 | 0.59 |
| Linalool | 1102 | 1.17 | 0.84 | 1.39 | 0.91 |
| Isoamyl isovalerate | 1105 | 0.33 | 0.21 | 0.19 | 0.22 |
| 2,2,6-Trimethyl-3-keto-6-vinyltetrahydropyran | 1114 | 35.74 | 32.54 | 39.94 | 38.13 |
| β-Thujone (= trans-Thujone) | 1124 | 0.36 | 0.30 | 0.31 | 0.36 |
| δ-Terpineol | 1174 | 0.19 | Tr | 0.17 | 0.27 |
| iso-Menthol | 1179 | Tr | 0.18 | Tr | Tr |
| Menthol | 1179 | Tr | Tr | 0.18 | Tr |
| Umbellulone | 1180 | 1.34 | Tr | Tr | 2.10 |
| Terpinen-4-ol | 1185 | 0.21 | Tr | 0.13 | 0.26 |
| α-Terpineol | 1197 | 0.26 | 0.16 | 0.27 | 0.21 |
| (E)-Cinnamaldehyde | 1278 | 0.35 | Tr | Tr | Tr |
| Lavandulyl acetate | 1290 | 3.42 | 3.13 | 3.34 | 2.73 |
| Thymol | 1292 | 0.40 | Tr | Tr | 0.31 |
| 1-Octen-3-yl 2-methylbutyrate | 1324 | Tr | 0.13 | Tr | Tr |
| Eugenol | 1364 | Tr | 0.18 | Tr | Tr |
| α-Copaene | 1389 | 0.15 | 0.20 | 0.18 | 0.17 |
| Ylanga-2,4(15)-diene | 1420 | 0.17 | 0.30 | 0.23 | 0.25 |
| (E)-β-Caryophyllene | 1437 | 0.15 | 0.26 | 0.17 | 0.21 |
| (Z)-β-Farnesene | 1460 | 0.47 | 0.89 | 0.53 | 0.62 |
| 9-epi-(E)-Caryophyllene | 1479 | 0.15 | 0.25 | 0.19 | 0.20 |
| trans-Cadina-1(6),4-diene | 1488 | 0.17 | 0.25 | 0.13 | 0.18 |
| ar-Curcumene | 1491 | 0.16 | 0.23 | 0.20 | 0.22 |
| β-trans-Bergamotene | 1496 | Tr | 0.35 | 0.18 | 0.25 |
| Germacrene D | 1498 | 0.75 | 1.36 | 0.89 | 1.02 |
| α-Zingiberene | 1503 | 0.59 | 1.70 | 0.67 | 1.13 |
| trans-Muurola-4(14),5-diene | 1510 | 0.93 | 1.28 | 1.10 | 1.06 |
| α-Muurolene | 1513 | 0.13 | 0.19 | 0.15 | 0.13 |
| Bicyclogermacrene | 1514 | 0.13 | 0.19 | 0.15 | 0.13 |
| γ-Cadinene | 1531 | 2.20 | 2.43 | 2.61 | 2.11 |
| β-Sesquiphellandrene | 1534 | 1.09 | 2.74 | 1.19 | 1.87 |
| δ-Cadinene | 1536 | 1.07 | 1.48 | 1.22 | 1.27 |
| Palustrol | 1588 | 0.13 | 0.18 | 0.14 | 0.15 |
| Scapanol | 1593 | 0.33 | 0.17 | 0.32 | 0.17 |
| β-Copaen-4-α-ol | 1597 | 1.26 | 1.34 | 1.33 | 1.21 |
| Caryophyllene oxide | 1604 | Tr | Tr | 0.23 | Tr |
| Lemnalol | 1608 | 1.22 | 1.31 | 1.07 | 1.15 |
| Zingiberenol | 1624 | 0.12 | 0.19 | Tr | Tr |
| Ledol | 1625 | 0.31 | 0.42 | 0.36 | 0.36 |
| β-Oplopenone | 1629 | 1.29 | 1.11 | 1.41 | 1.08 |
| epoxy allo-Alloaromadendrene | 1642 | 2.11 | 1.28 | 2.04 | 1.34 |
| 1-epi-Cubenol | 1646 | 0.53 | 0.91 | 0.70 | 0.80 |
| γ -Eudesmol | 1650 | Tr | Tr | Tr | 0.95 |
| epi-α-Cadinol (= τ-Cadinol) | 1657 | 0.41 | 0.52 | 0.51 | 0.43 |
| epi-α-Muurolol (= τ-Muurolol) | 1659 | 1.00 | 1.00 | 1.00 | 1.00 |
| α-Muurolol (= δ-Cadinol) | 1661 | 0.48 | 0.59 | 0.51 | 0.54 |
| α-Cadinol | 1672 | 1.50 | 1.40 | 1.46 | 1.35 |
| 14-Hydroxy-9-epi-(E)-caryophyllene | 1690 | 4.92 | 3.29 | 4.89 | 3.3 |
| epi-α-Bisabolol | 1695 | 0.32 | 0.36 | Tr | 0.36 |
| 6α-Hydroxygermacra-1(10),4-diene | 1714 | 0.24 | Tr | 0.21 | Tr |
| 14-hydroxy-α-Humulene | 1735 | 0.43 | 0.28 | 0.39 | 0.28 |
| 2α-Hydroxyamorpha-4,7(11)-diene | 1738 | 1.00 | 1.03 | 0.92 | 0.92 |
| Benzyl benzoate | 1780 | 0.61 | 3.18 | 0.31 | 0.20 |
| 7,14-Anhydroamorpha-4,9-diene | 1787 | 0.56 | 0.36 | 0.47 | 0.29 |
| 14-hydroxy-δ-Cadinene | 1818 | 0.50 | 0.55 | 0.44 | 0.47 |
| cis-Spiroether | 1899 | 3.37 | 3.01 | 2.20 | 2.60 |
| Total | 82.12 | 80.64 | 83.33 | 83.37 | |
| Monoterpene hydrocarbon | 3.98 | 3.22 | 3.48 | 4.45 | |
| Oxygenated monoterpenoids | 45.97 | 40.21 | 48.84 | 48.49 | |
| Sesquiterpene hydrocarbons | 8.95 | 14.23 | 10.27 | 10.89 | |
| Oxygenated sesquiterpenoids | 17.86 | 15.93 | 17.72 | 15.86 | |
| Benzenoids | 1.66 | 3.70 | 0.63 | 0.86 | |
| Others | 3.70 | 3.35 | 2.39 | 2.82 | |
| Number of identified compounds | 58 | 53 | 55 | 56 |
Note: aCompounds are listed in order of elution from the HP-5MS column; bRI, retention index on the HP-5MS column; cNon-significant standard deviations were omitted for clarity (n = 3); Tr: trace amount (concentration < 0.1%).
Table 5.
IC50 values for inhibition of nitric oxide production in LPS-stimulated RAW 264.7 macrophages by essential oils of Chrysanthemum indicum cultivated under supplemental spectral LED lighting conditions.
Table 5.
IC50 values for inhibition of nitric oxide production in LPS-stimulated RAW 264.7 macrophages by essential oils of Chrysanthemum indicum cultivated under supplemental spectral LED lighting conditions.
| Inhibition of NO Production | F1 | F2 | F3 | F4 | L-NMMA * |
| IC50 (µg·mL−1) | 643 ± 50.11d | 406 ± 40.20b | 370 ± 25.50b | 548 ± 45.80c | 3.45 ± 0.50a |
Note: Mean values followed by the same letter within a column are not statistically different at a 0.05 significance level (n = 3). Statistical analyses were conducted using IRRISTAT ver. 5.0 (International Rice Research Institute, Laguna, Philippines).
Table 6.
Pearson correlation coefficients between major essential oil constituents/groups of Chrysanthemum indicum cultivated under supplemental spectral LED lighting conditions and their anti-inflammatory activity.
Table 6.
Pearson correlation coefficients between major essential oil constituents/groups of Chrysanthemum indicum cultivated under supplemental spectral LED lighting conditions and their anti-inflammatory activity.
| Compounds | 1,8-Cineole | 2,2,6-Trimethyl-3-keto-6-vinyltetrahydropyran | Lavandulyl acetate | 14-Hydroxy-9-epi-(E)-caryophyllene | cis-Spiroether | Monoterpene hydrocarbon | Oxygenated monoterpenoids | Sesquiterpene hydrocarbons | Oxygenated sesquiterpenoids | Benzenoids | Others |
| IC50 (mg·mL−1) | 0.986* | -0.084 | -0.036 | 0.148 | 0.675 | 0.735 | 0.198 | -0.590 | 0.168 | -0.178 | 0.675 |
Note: *. Correlation is significant at the 0.05 level (2-tailed).
Disclaimer/Publisher’s Note: The statements, opinions and data contained in all publications are solely those of the individual author(s) and contributor(s) and not of MDPI and/or the editor(s). MDPI and/or the editor(s) disclaim responsibility for any injury to people or property resulting from any ideas, methods, instructions or products referred to in the content. |
© 2026 by the authors. Licensee MDPI, Basel, Switzerland. This article is an open access article distributed under the terms and conditions of the Creative Commons Attribution (CC BY) license.
Copyright: This open access article is published under a Creative Commons CC BY 4.0 license, which permit the free download, distribution, and reuse, provided that the author and preprint are cited in any reuse.