

Submitted:
23 September 2026
Posted:
24 September 2026
You are already at the latest version
Abstract
As modelling the synthesis of metallic nanoparticles leads to useful insights to guiding experiments, we propose a novel numerical suite, NPGrowth based on LAMMPS. NPGrowth enables to simulate the seeded-mediated growth under a variety of conditions, even mimicking the growth under extreme conditions. It allows one-by-one or N-by-N atomic deposition, either when deposited atoms are uniformly distributed or through directional deposition, and atomic deposition onto selected targets, including those remiscent of a chiral molecule. moreover, NPGrowth enables the formation through sintering of two or more seeds, directional, soft-landed or through coalescence. After presenting a few toy models, we discuss the effect of directionality during the sintering of four Cu icosahedral seeds and the importance to identify a sintering geometry following a pySNOW characterisation and classification.
Keywords:
classical MD
; Cu nanoparticles
; sintering
; orientational attachment
; atomic deposition
1. Introduction
As synthesis is the art of manipulating atoms at the nanoscale, a fundamental understanding of nucleation and growth mechanisms is essential to leverage the highly sensitive, morphology-dependent chemophysical properties of metallic nanoparticles [1,2,3,4,5]. Nanoparticle morphology, which encompasses size, shape, structural motif, and chemical ordering, is crucial for a range of applications, including catalysis, optoelectronics, biomedical applications and sensing. The appearance of a given nanoparticle morphology depends on our ability to engineer synthetic outcomes precisely.[6,7,8,9,10,11] As an example, in catalysis, tuning nanoparticle morphology can significantly influence their catalytic activity; for instance, a CO molecule cannot adsorb at mixed sites on AuRh nanoparticles [12], and oxygen reduction reaction activity can be estimated from geometric considerations of nanoparticle adsorption sites [13,14,15,16].
Proposing a robust simulation tool to model metallic nanoparticle (MNP) formation requires detecting, analysing, and incorporating a variety of individual mechanisms that occur on different time scales and with different activation energies. The interplay of these subprocesses, spanning from quantum-level chemical bonds to macroscale fluid dynamics, shapes the final morphology of the nanomaterial. Because of this complexity, a multiscale modelling approach is needed. Mechanism-Enabled population balance modelling accounts for not only primary phenomena such as nucleation and growth but also for particle agglomeration and breakage, with a focus on reproducing the particle size distribution. For sizes larger than 5 nm, the model presented in Ref.[17], based on classical nucleation theory and heterogeneous nucleation using the general aerosol dynamic equation should be considered.
In the size range between 1 and 10 nm, classical Molecular Dynamics (cMD), which solves Newton’s laws of motion, enables tracking of structural trajectories and elucidates structural transformations during synthesis across different timescales and temperatures. The resulting nanoparticle morphology can be compared with the putative global minimum, which defines the thermodynamic endpoint the cluster inherently drives toward. Comparisons are usually based on geometric descriptors. Bochicchio et al. [18] focus on global optimisation, thermodynamic stability, and chemical ordering layouts -such as core-shell, onion-like, or random alloy nanoalloys. However, it was recently shown that far-from-equilibrium morphology can ensure better performance.[2,19,20,21,22] With recent developments in machine-learned potentials (MLPs) designed specifically for nanoparticles [23,24,25], the quantum description of 1-10 nm objects can be incorporated into the interparticle potential. Nonetheless, cMD applied to MNP growth relies heavily on semi-empirical potentials, such as tight-binding second-moment approximation potentials or the embedded-atom method (EAM), with a few cases described by machine-learning potentials.[26]
Figure 1.
TOC: Schematic representation of how to model seeded-mediated growth of metallic nanoparticles. We distinguish between (i) atomic deposition that can happen either from fixed directions or randomly; (ii) sintering of several seeds. Besides temperature and kinetic velocity, key parameters of atom deposition include the deposition rate, , the number of sources, and the directionality of the incoming atoms. In the latter, the initial sintering geometry and the initial seed displacement.
Figure 1.
TOC: Schematic representation of how to model seeded-mediated growth of metallic nanoparticles. We distinguish between (i) atomic deposition that can happen either from fixed directions or randomly; (ii) sintering of several seeds. Besides temperature and kinetic velocity, key parameters of atom deposition include the deposition rate, , the number of sources, and the directionality of the incoming atoms. In the latter, the initial sintering geometry and the initial seed displacement.
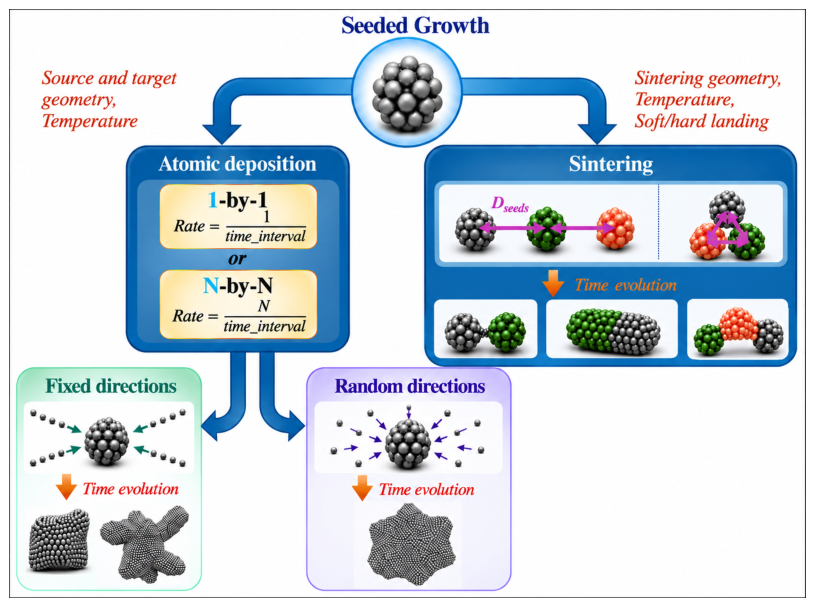
Among the several cMD studies reported in the last three decades following the pioneering works of Manninen [27] - inspired by surface growth models - and Mariscal,[28,29] Grammatikopoulos [30] and Baletto [31,32,33] proposed three growth routes onto an existing metallic seed: (i) one-by-one atomic deposition from random positions tuned by different deposition rates and temperatures; (ii) the coalescence of two or three seeds along their centre of mass axis; (iii) the formation of a seed as obtained from the freezing of a nanodroplet. The effects of relative orientation of facets, e.g.(111)/(111), (111)/(100), have been widely investigated[26,34,35,36,37]. There is agreement that when the impact velocity or initial temperature is high enough, the kinetic energy supply allows surface restructuring, followed by reordering of atoms at the core. Zinzani et al.[38,39] recently showed that the neck has a short lifetime of a few ps, at least for Au-based nanoalloys.
These computational approaches highlight the importance of kinetic trapping, out-of-equilibrium pathways, and structural transitions, and show how competition between flux-landing rates and surface-diffusion energy barriers leads to metastable, faceted geometries or amorphous traps. Their work details how distinct, preformed seeds collide in flight, undergoing structural rearrangements, rigid-body reorientation, eventually temporary interfacial melting, neck formation and surface adatom diffusion to fill necks.[30,31,37,38,39,40,41,42,43,44,45,46]
However, the main limitation of existing approaches is their neglect of directionality/oriented attachment in atomic deposition and/or cluster sintering, and thus its failure to model seeded-growth under certain conditions. While random deposition can mimic gas-phase formation, it may fail when the nanoparticles grow in wet environments where molecules can shadow certain regions of the growing seed, or during cluster-beam deposition.
To overcome such limits, we provide an open-source software tool, NPGrowth, to model the growth of metallic nanoparticles based on cMD as embedded in LAMMPS [47]. The LAMMPS-core was chosen being compatible with a wide range of interatomic potentials including MLPs, EAM, and Rosato-Guillope-Legrande (RGL). NPGrowth allows the deposition of individual atoms/clusters from random or oriented deposition, from one or more sources, onto one or more designed targets. NPGrowth enables the formation of elongated, prolate, and even chiral metallic nanoparticles. NPGrowth also provides tools to simulate nanoparticle sintering events with flexibility in the initial configuration. To demonstrate the capabilities of NPGrowth, we present a few toy-model simulations pf oriented atomic deposition on copper seeds. We, further, discuss in detail the dynamics during directional sintering of four Cu seeds. To highlight the morphological differences, we employ a recently developed general characterisation tool, pySNOW [48,49,50]. Following the current development of morphological descriptors [26,50,51], we introduce a nanoparticle ID that reports a small set of geometric descriptors to identify and classify nanoparticles, that we hope to be flexible enough to interest the community.
2. Methodology
NPGrowth is a lightweight, open-source code that enables workflows by coupling a declarative description of the deposition/sintering geometry with a modified version of the fix deposit command in LAMMPS. The code is openly available at https://github.com/nanoMLMS/NPGrowth_V2, together with example input files. The SI Appendix A provides an overview of the code and its use. To provide a consistent framework for describing the different growth scenarios, we summarise the terminology adopted throughout this work in Table 1.
As depicted in Figure 2, NPGrowth automates the modelling of seeded-mediated growth, enabling the modelling of the formation of metallic nanoparticles even under extreme conditions, i.e. chemical supersaturation, where any corner or vertex acts like an exposed peak[8,9,37,52], leading to branched and chiral structures too.
Simulating MNP growth by atomic deposition requires a standard molecular dynamics setup and a deposition protocol that specifies the deposition parameters. NPGrowth keeps the cMD setup and the deposition setup fully decoupled, with LAMMPS handling the cMD engine. The user writes the cMD setup as an ordinary LAMMPS input script. The deposition setup is described declaratively in JSON files and compiled by a Python script, generate_depo_input.py, into a LAMMPS include file containing the corresponding source and target regions, and fix deposit commands. This separation lets the user reuse the same deposition configuration across different potentials, thermostats, or seed geometries without modification.
Related to the deposition protocol, LAMMPS’s native fix deposit inserts atoms with a velocity sampled independently along each Cartesian axis, which does not allow a beam to be aimed at a chosen location on an arbitrarily shaped, off-centre seed cluster. When a highly directed, collimated atomic beams hits the nanoseed, mimicking a Glancing Angle Deposition or any experimental set ups with preferential direction, atoms preferentially land on the “windward” sides of the seed leading to surface bumps, in a highly non-equilibrium kinetic regime governed by ballistic shadowing, forcing an isotropic seed into an elongated nanoparticle, nanoneedle or even a nanorod [53,54]. The key methodological novelty of NPGrowth is a pre-processing modification of LAMMPS fix_deposit.cpp: instead of accepting a fixed target point, the target keyword is redefined to accept the ID of a LAMMPS region. At each insertion attempt, a candidate position is drawn inside the source region (subject to a minimum-distance constraint from existing atoms), a point is drawn uniformly inside the associated target region, and the velocity direction of the inserted particle is set to point from the former to the latter. In contrast, its magnitude is drawn independently from a user-specified speed range. This makes the deposition direction a direct, geometric consequence of the relative placement of both the source and target regions. Atoms are classified by their coordination number and assigned to the growing seed. Only atoms that have become part of the growing seed are coupled to the thermostat. In contrast, newly deposited atoms evolve under plain NVE dynamics until they attach, mimicking the physically distinct regimes of an incoming versus an incorporated atom.
2.1. Nanoparticle Characterisation Using pySNOW
We employ our recently developed pySNOW -a Python Suite for the NanO-World-[49] to characterise the morphology of MNPs. pySNOW is an agile and open access numerical tool that reads nanoparticles’ trajectories/position and calculates various geometrical descriptors, i.e. the maximum pair distance, the maximum radial distance, the radius of gyration, and the relative shape anisotropy, structural descriptors, like the common neighbour analysis (CNA)[5,42,55], and local atomic environment descriptors, such as the atop generalized coordination number (aGCN) [56,57], and the CNA patterns (CNAPs)[49,50,58].
As in Ref. [50,59], the pair distance distribution function (PDDF) is crucial in determining the architecture of a MNP. Indeed, the PDDF provides: (i) its first minimum is the best estimate of the cutoff radius to identify the nearest neighbours; (ii) if the position of its second peak does not correspond to the lattice parameter, the structure is amorphous; (iii) the maximum pair-atomic distance, , is an estimate of the nanoparticle size. In addition, the shape of the PDDF relates to the shape of the nanoparticle [59,60]. In general, the shape and sharpness of subsequent peaks and minima highlight the degree of ordering of the structure over the range of distances considered.
Another robust global descriptor is the radial atomic density (RAD), which counts atoms in concentric shells around the nanoparticle center of mass (CoM). Twice the maximum distance of RAD, , provides an estimate of the dimension of the whole MNP as it defines the sphere needed to include the whole nanoparticle. Moreover, integrating the RAD gives the number of atoms within a sphere of radius r, . We introduce the branching factor f by fitting:
Completely packed spheres have , while branched or dendritic structures have . f values close in between show the formation of grooves and reentrances or flattened/oblate shapes.
The radius of gyration of a rigid body is defined as the radial distance from a point having a moment of inertia equal to the effective mass distribution of the body if the total mass of the body is concentrated at that point. One can refer to the radius of gyration of a nanoparticle, i.e. the measure of the extent by which atoms are spread away from the center of mass () of the nanoparticle.
We also use the gyration radius variation over time
to quantify distortion relative to the atom initial distribution. In particular, during sintering simulations we compute the per-seed value of , to investigate seed-specific, geometry-dependent distortions during the processes. In this case, the sum in Eq. runs over the number of atoms in each seed, .
The ratio gives information regarding the sphericity of the nanoparticle, with sphere featuring 0.63, while elongated/rod-like shapes showing below 0.58.
Several global shape descriptors derive from the gyration tensor, :
where is the th Cartesian component of the position-vector of the i-th atom, and . Among them, the relative shape anisotropy ,
where the are the eigenvalues of S, is a robust shape descriptor. ranges from 0 for spheres and Platonic solids, such as icosahedra (Ih) or cubes (Cb). In contrast, flattened/pancake geometries yield low but non-zero anisotropy, with a non-zero below 0.25. For elongated shapes such as nanorods, scales directly with the aspect ratio, approaching 1 for nanochains/nanotubes, with prolate shapes having a non-zero .
On the basis of f, and , we can classify the MNP shape into: branched (), compact (). For the latter, one can distinguish spheroids, oblate and prolate depending on their and : for spheroids, with stands for prolate, otherwise the shape is likely oblate or a concave spherical geometry.
We perform a CNA and CNAP to classify a MNP into geometrical families. CNA labels each pair of nearest neighbours from the local connectivity of their common neighbours. Each pair exhibits a signature, a triplet of integers, - where r is the number of nearest-neighbours common to both atoms; s is the number of bonds between shared neighbours and t is the longest chain which can be made from bonding s atoms if they are nearest neighbours-. The CNAP of an atom i is the string containing all the CNA-signatures i is in. We note that the frequency of each signature correlates with the nominal coordination of the atom i, .
Here we consider FCC, twin FCC, and multiple-twinned nanoparticles,[3] as decahedral (Dh) and Ih. Counting how many pairs contribute to selected CNA signatures provides information on the overall nanoparticle’s structure: FCC requires a zero (5,5,5) and a zero (4,2,2), while twin FCC has a non-zero (4,2,2). Multiple-twinned NPs have a positive (5,5,5) and a high (4,2,2). The FCC inner core can contain other defects, with a significant (4,1,1) component, mainly during the sintering process. Surface faceting follows: (111) facets features a high (3,1,1), while (2,1,1) labels (100) facets. Distortions contribute as (3,2,2) for multiple-twinned shapes. To further distinguish decahedra from icosahedra, we consider the local environment of each atom through its CNA pattern. For example following Ref.[50], [12(4,2,1)] is a FCC bulk; [6(4,2,1), 6(4,2,2)] labels atoms on a twin plane; [10,(4,2,2), 2(5,5,5)] is those atoms lying on fivefold axis. The [12,(5,5,5)] pattern refers to the Ih-centre. On the other hand, a zero [12,(5,5,5)] with a high [10(4,2,2), 2(5,5,5)] stands for a Dh.
Besides the importance of associating atoms to their CNAPs, and each CNAP with specific atomic environments, we provide a short CNAP-summary as (i) the number of different CNAPs, and (ii) the number of singleton CNAPs -CNAPs appearing for only one atom. decreases when the symmetry of the shape increases, being 1 in a perfect bulk. to for a completely disordered situation. Singleton CNAP, provides a further estimate of the number of local defects, such as surface adatoms, islands, vacancy, and interstitial.
3. Results
As the novelty of NPGrowth lies in its ability to mimic directional deposition, we present a few examples, summarised in Table 2, that can lead to asymmetric, grooved or branched shapes. Although we do not pretend to reproduce any specific experimental situation our examples would represent synthesis under far-from-equilibrium conditions. For the sake of completeness, we contrast this with random 1-by-1 and N-by-N atomic deposition, see Figure 3. We further consider the soft-landing of four Cu seeds from three different sintering geometries: (i) along a line, (ii) at the vertices of a square, (iii) at the vertices of a tetrahedron. Figure 4 depicts these sintering geometries.
3.1. Oriented Atomic Deposition on Cu-Seeds
We consider and discuss the four examples reported in Figure 3 and their shape classification, as in Table 2. Oriented atomic deposition simulations are carried out using a timestep of 2 fs and a Langevin thermostat with a damping parameter of 0.1 ps. Interatomic interactions are described using the embedded-atom method (EAM) potential Cu.u3, developed by Foiles et al. [61]. After each deposition event, the system evolves using thermostat-coupled MD, allowing the deposited atoms and the initial seed to relax and evolve according to the imposed deposition conditions. Temperature is kept at 300K.
Figure 3 reports the pySNOW analysis of the final snapshots of four examples listed in Table 2. The final snapshots are (a) a concave cube, (b) a branched, spiky shape, (c) a flattened disk resembling an "onigiri," and (d) a star shape with small reentrances/grooves, but still classified as a spheroid.
The PDDF exhibits a second peak for all structures, indicating a geometrical order. At the same time, we note that the PDDF profiles vary significantly. A branched shape leads to an almost flat region after reaching a peak. Grooves/reentrances of starred shapes are present but not too deep, the MNP retains a PDDF profile and a value similar to that of compact shapes, although with less peaks at large distances. Moreover, the atop generalised coordination number (aGCN, [57]) distribution reveals a notably higher concentration of low-coordinated atoms, with aGCN below 4, while flattened and compact shapes have clear peaks in correspondence of facets coordination and a drop of atoms with aGCN around 8.5 and 10. Concavities of all sorts lead to a significant number of atoms with aGCN mainly around 10.
We note that branched MNPs, named spike, exhibit a wide variety , with 56% being singletons and with a 2% of atoms exhibiting an individual local environment, against the 0.6% from random deposition.
In all the examples, the combination of an initial FCC seed, a fast deposition rate and a low simulation temperature, show that the outcomes have a twinned FCC structure, with a zero (5,5,5), no sign of fivefold symmetries, and the (4,2,2) spanning from 5-10%, with the highest occurrence on the onigiri. The CNAP analysis shows no Ih centres in any snapshot, as is zero. A common feature is the surface, with (3,1,1) being considerably high in all snapshots, suggesting the formation of (111) facets and indicating that reentrances have a (111) character, as the star has a (3,1,1) occurrence around 14.5%.
3.2. Oriented Sintering of Four Cu-Seeds
We soft-land four Cu-Ih147 seeds from an equilibrated NVT MD trajectory. We run simulations with a 2.5 fs timestep and a Langevin thermostat with a time-coupling constant of 100 timesteps. We model the system’s potential energy surface with a custom machine learning potential (MLP) built using the FLARE package [63,64]. Supplementary information (Sec. B) provides more details on the MLP derivation.
First, we carry out a series of short simulations to characterise the occurrence of four-way sintering as a function of the sintering geometry and of the initial displacement between the centre of mass of the seeds, , which spans from a distance such that atoms from different seeds are in contact to the one such that they are at a minimum distance close to the cutoff of the potential, where inter-seed interactions are negligible. For each of the three geometries, we perform 10 independent simulations over a range of initial displacement distances, using different random seeds that generate distinct initial cluster orientations. Each simulation runs for 1 ns at 300 K.
Figure 4 reports the probability of forming a certain number of NPs as a function of the initial separation and sintering geometry. The final number of distinct MNPs varies, with simultaneous sintering of all four seeds occurring only under certain conditions. Sintering geometry plays a key role - more compact arrangements (Square or Tetrahedron) generally lead to a single nanoparticle up to relatively large . In contrast, for the Line geometry, this happens only when is less than roughly 16 Å; for larger values, the seeds tend to sinter pairwise or in similar, separated ways. This behaviour arises from stochastic, thermostat-induced displacements, which can push seeds beyond the potential’s interaction range. These kicks, together with the different relative orientations of the seeds, are also responsible for the variability of results at fixed geometry and .
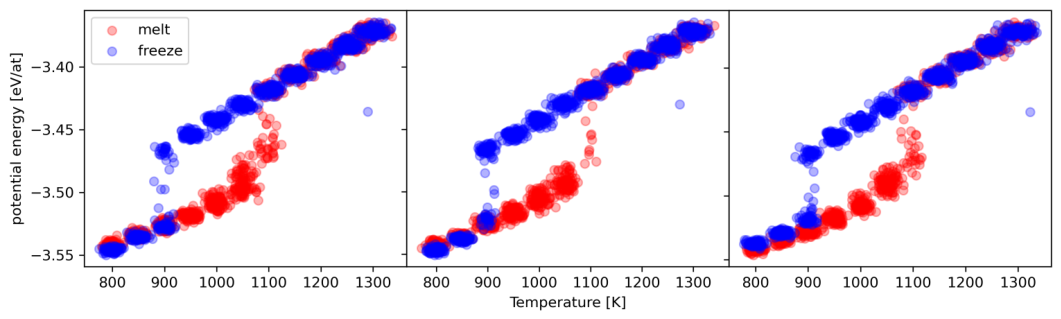
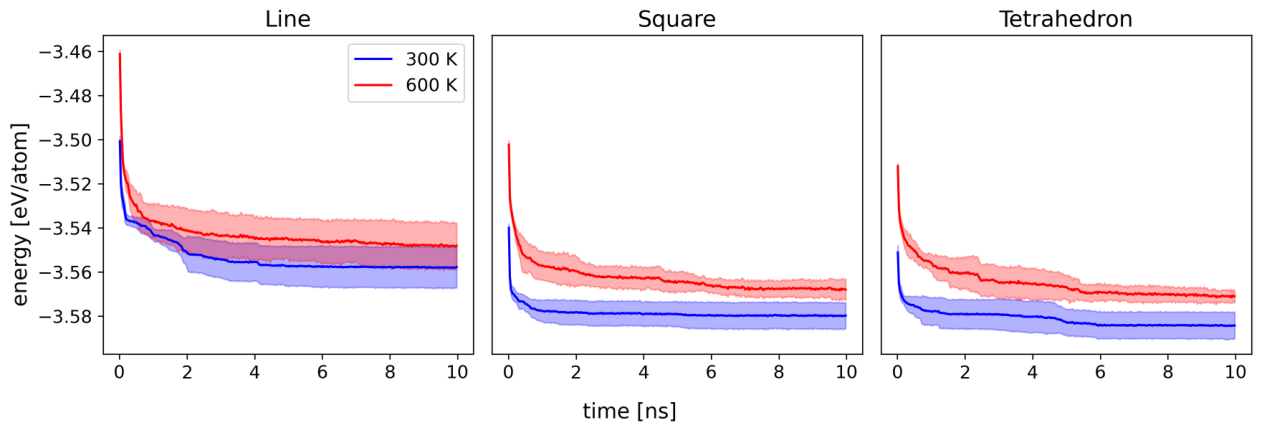
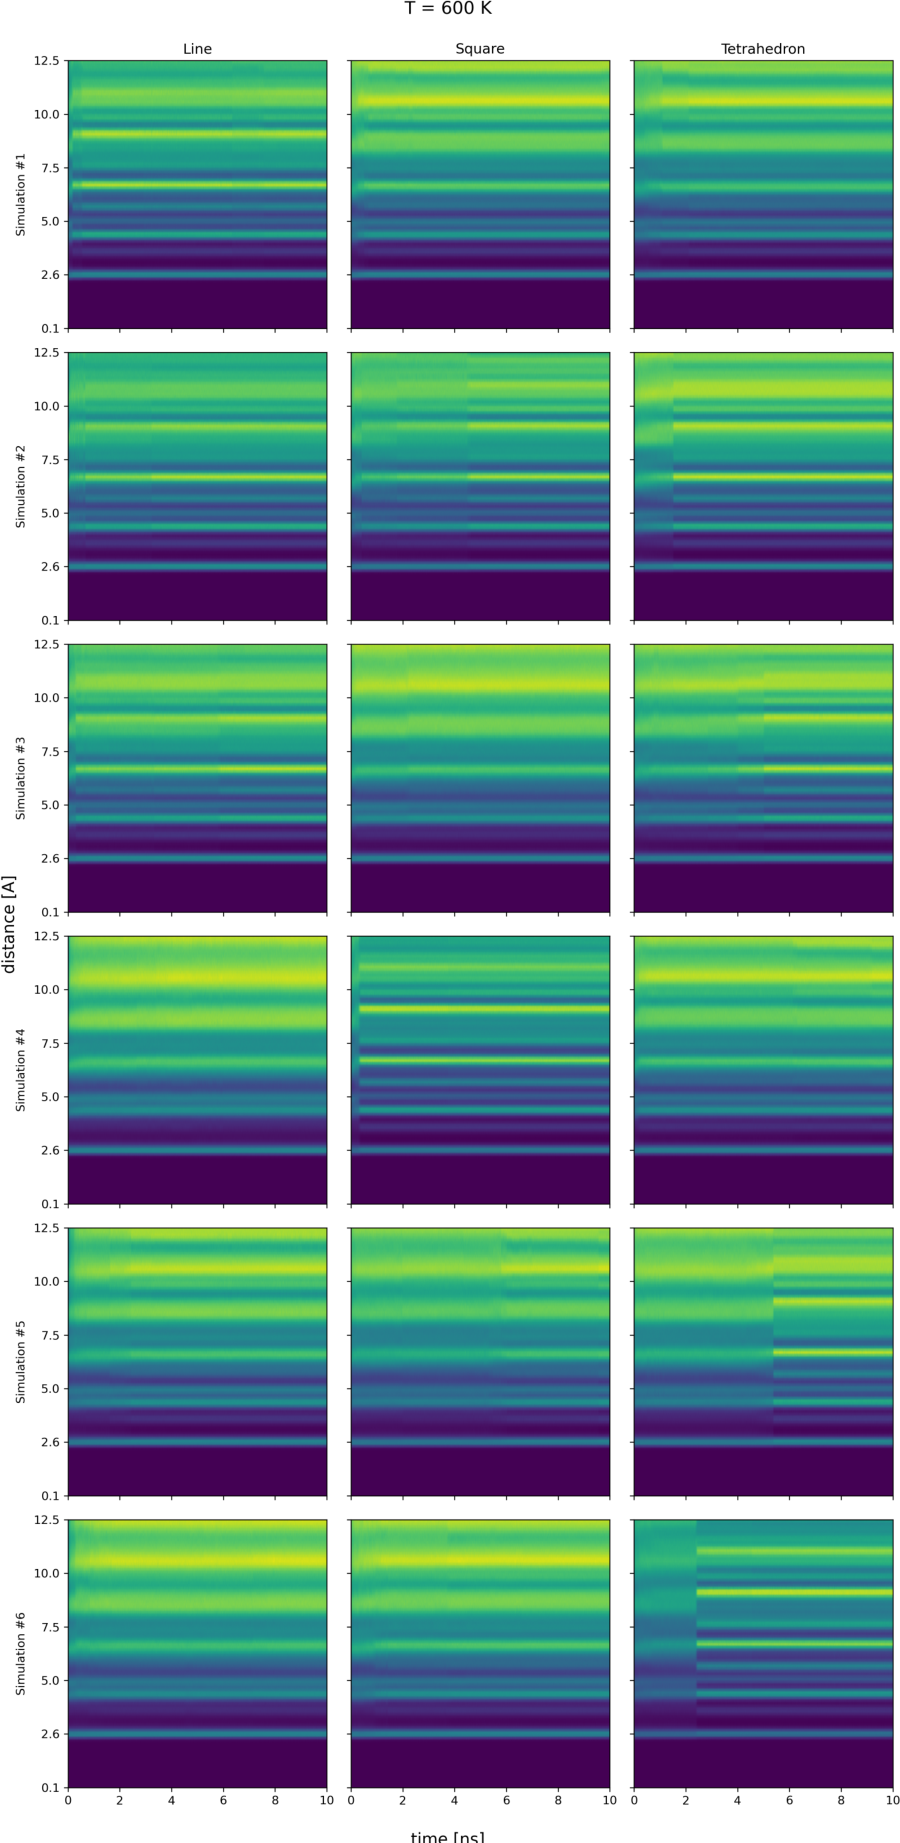
Then, we perform longer simulations to investigate the dynamics of the sintering processes at 300 K and 600 K. Both temperatures are well below the melting temperature of a 588-atom Cu-NP, as shown from melting and freezing cycles reported in Suppl. Info (Figure A4). For each sintering geometry, we run six independent simulations, ensuring significant variation in the randomised initial relative orientations of the seeds to improve the statistical significance of the results. Energy differences between these isomers are significant, e.g. ≈ 20 meV/atom (≈ 11.76 eV in total) comparing line vs tetrahedron geometry at 300 K (see Suppl. Info. Figure A5). Let us discuss the architectures obtained from the sintering process and their dependence on the initial geometry of the four seeds. Results of individual simulations are in the IDs reported in Suppl. Info. Figures A6-A11. Looking at the time evolution of the PDDF, we note that after the initial sintering stages, a clear peak corresponding to the lattice parameter suggests the formation of ordered architectures. We note that only one simulation ended in a structure that should be identified as amorphous (inline attachment at 600 K, Figure A7, fourth panel). Figure 5 compares the PDDF of the last snapshots, collected at 10 ns, averaged over the six simulations per each case.
The impact of the initial sintering geometry is clear, especially on the nanoparticles’ size. At 300 K, the maximum of the PDDF ranges from 25 Å to more than 35 Å, with sizes longer than 32 Å only in the Line case. At 600 K, surface diffusion is faster and tends to smooth differences among the sintering geometries, but it is still not enough on the 10 ns timescale to eliminate them. Indeed, we see well-defined peaks up to Å and no size differences between Tetrahedron and Square sintering geometries, with an average MNP size around 25 Å. In contrast, Line sintering yields sizes of about 30 Å. The PDDF profile at short distances is similar to all cases, with the second peak being more pronounced at 600 K than at 300 K. The long-distance region, Å, of the PDDF highlights significant structural differences in the MNP shape. While the PDDF drops sharply for the Tetrahedron and Square sintering geometry, it decays smoothly for the Line case (Figure 5).
Figure 6 shows the time evolution of key shape descriptors of the grown nanoparticles in terms of and the per-seed gyration radius variation, .
A clear effect of the sintering geometry on the overall shape is evident. Sintering from a Tetrahedron geometry yields spherical nanoparticles ( ) for both temperatures. In contrast, MNPs adopt a prolate shape with when sintered in the Line arrangement. Square-like initial geometries give an intermediate result with a strong temperature dependence. The dynamical mechanisms governing the sintering are also different depending on the initial sintering geometry, as quantified by (Figure 6). While sintering from Square and Tetrahedron geometries leads to distortion relative to the initial positions that is uniform across the seeds, this is not the case in the Line geometry, where the two innermost seeds change considerably, with the two outermost significantly less deformed. This analysis highlights how, in this case, the external seeds compress the internal ones, which are deformed by this process, while the former substantially retain their initial shape, as further highlighted by the number of conserved Ih centres - panel c of Figure 7. We also note the change in at 5 ns for the Tetrahedron geometry, which reveals a thermally activated process for all MNPs. This change should be related with Figure 7 and indicates an increment in the FCC signature associated to a restructuring of the MNP.
Figure 7 helps in quantifying structural ordering and local atomic environments. The individual CNA and aGCN analysis per each individual simulations is in Suppl. Info., mid and right columns of Figures A6-A11. As expected, structural rearrangements depend on temperature, but they also differ due to the sintering geometry. At 300 K, the contribution of FCC-bulk atoms is lower than other cases. The counts of CNA patterns for FCC, twinning plane, and fivefold-axis environments remain stable after a brief initial variation, and the number of conserved Ih centre environments is not cancelled, indicating that the initial seed structure is largely unchanged. As reported in Suppl. Info. Table A2, if the sintering occurs simultaneously on different facets of the seed(s), it leads to structures with a higher degree of disorder, as quantified by the number of and , with a clear trend as Tetrahedron>Square>Line at 300 K. Furthermore, almost 40% of the atoms in MNP sintered from a Tetrahedron geometry have their own local environment, and among them three quarters are defects. At 600 K, however, there is sufficient kinetic energy to allow restructuring, as several diffusion mechanisms are activated. In this case, the number of different patterns is much lower, but still clearly depends on the initial geometry (Line>Square>Tetrahedron). Prominent Ih-related patterns rapidly drop (right column of Figure 7), with [12(5,5,5)] being zero below 1 ns, showing that the initial atomic environment-level structure is lost. FCC and twinning-plane environments grow significantly throughout the simulations as internal ordering develops. The kinetics differ between the sintering geometries. Line and Square show similar timescales for forming the first FCC-like environments, but are less prone to increasing them. The combination of a high final count of twinning-plane environments with the near-complete absence of Ih centres and the presence of fivefold axes suggests the possible formation of decahedral structures as an outcome of these simulations, as is in fact observed (e.g. in Table 2).
4. Conclusions
We present a new and open source software package, NPGrowth, to model seed-mediated growth on metallic nanoparticles in various situations, including those that can lead to dendritic, spiky, chiral, and non-spherical nanoparticles. The key feature of NPGrowth is a modification of LAMMPS’ fix deposit that allows simulation of a variety of deposition routes compatible with LAMMPS features, including machine-learning potentials.
We aim to introduce the capabilities of the proposed package, not to exhaust or investigate all cases but to show the effect of oriented attachment for the synthesis of copper nanoparticles.
We discuss oriented attachment onto cubic and truncated octahedral seeds, showing how to set up NPGrowth source and target regions to get both branched, star, concave and flattened/oblate motifs. We propose a morphological classification of the obtained nanoparticles employing the pySNOW descriptors. We introduce a nanoparticle ID that includes the PDDF, the CNA and the aGCN distributions plus a few shape and structural quantities. We stress that shape and structure here refer to the envelope enclosing the nanoparticle and to its geometrical shape, respectively. The nanoparticle geometrical character, instead, refers to whether it belongs to FCC, FCC twin, or multiple-twinned (Ih, polyIh, and Dh) geometry. Our examples show the variety of morphologies we can generate with NPGrowth, but they are not exhaustive.
We then analyse in detail the sintering of four Cu-Ih nanoparticles, each with 147 atoms, soft-landed onto one another in three different orientations or sintering geometries. We show an effect on the size distribution due to orientational attachment, with a higher probability of forming a single nanoparticle for 2D or 3D sintering geometries. Inline attachment favours two-by-two aggregation of seeds. In soft-landing sintering at short relative distances among seeds, the initial geometry affects the final shape of the nanoparticle. Analysing the first 10 ns after sintering, we show that inline attachment leads to strongly elongated shapes even at 600 K. A planar attachment, modelled as squarely displaced seeds, generates highly faceted but concave shapes. 3D, isotropic (Tetrahedron) soft-landing favours the formation of an individual, mostly spherical, convex, architecture. Significant internal restructuring occurs depending on the system temperature, and a detailed analysis of the CNA signatures and patterns allows a deep understanding of the underlying physical processes. This analysis shows that the kinetic timescale depends on sintering geometry, with a 5 ns window for major FCC reordering in 3D Tetrahedron sintering while the kinetics is slower for the other initial geometry.
We believe NPGrowth will help the scientific community working on nanosystems to gain atomistic insights into their formation processes and build a sufficiently diverse structural database to screen the best candidates from a large set. Furthermore, the proposed pySNOW characterisation and classification should establish a common nomenclature for identifying nanoparticle morphology (size, shape, motif).
Author Contributions
FB: Conceptualization, analysis, supervision, funding acquisition and administration. LS and SZ Methodology and software; characterization software SZ and GN; analysis validation, SZ and GN; analysis and investigation GN and SZ. All authors contribute equally to data curation, writing, review and editing. All authors have read and agreed to the published version of the manuscript.
Funding
S.Z. acknowledges the Università degli Studi di Milano and ISC-SrL for financially supporting her PhD studentship (D.M. 118/2023 PNRR). F.B. and G.N. thank the financial support by MONSTER, a project of the Italian National Centre for HPC, Big Data and Quantum computing (ICSC, CUP B93C22000620006) funded by the European Union – NextGenerationEU, through PNNR. This publica- tion benefits of the network provided by the EU-COST Action COSY. All authors benefit of INDACO, a High-Performance Computing platform at the Università degli Studi di Milano, for computational resources. We further acknowledge ISCRA for awarding this project access to the LEONARDO supercomputer, owned by the EuroHPC Joint Undertaking, hosted by CINECA (Italy).
Data Availability Statement
Our codes are available at https://github.com/nanoMLMS. At the page https://github.com/nanoMLMS/NPGrowth_V2 the interest Reader could find the input file used for the toy model. Cu-sintering trajectories will be available on Dataverse Unimi.
Conflicts of Interest
“The authors declare no conflicts of interest.”
Abbreviations
The following abbreviations are used in this manuscript:
| MNP | Metallic Nanoparticle |
| cMD | Classical Molecular Dynamics |
| MLP | Machine Learning Potential |
| EAM | Embedded-Atom Method |
| RGL | Rosato-Guillope-Legrande |
| SR | Source region |
| CNA | Common Neighbour Analysis |
| CNAP | Common Neighbour Analysis Pattern |
| aGCN | Atop Generalized Coordination Number |
| PDDF | Pair Distance Distribution Function |
| RAD | Radial Atomic Density |
| CoM | Center of Mass |
| FCC | Face Centered Cubic |
| Ih | Icosahedron |
| Dh | Decahedron |
Appendix A. NPGrowth Overview and Inputs
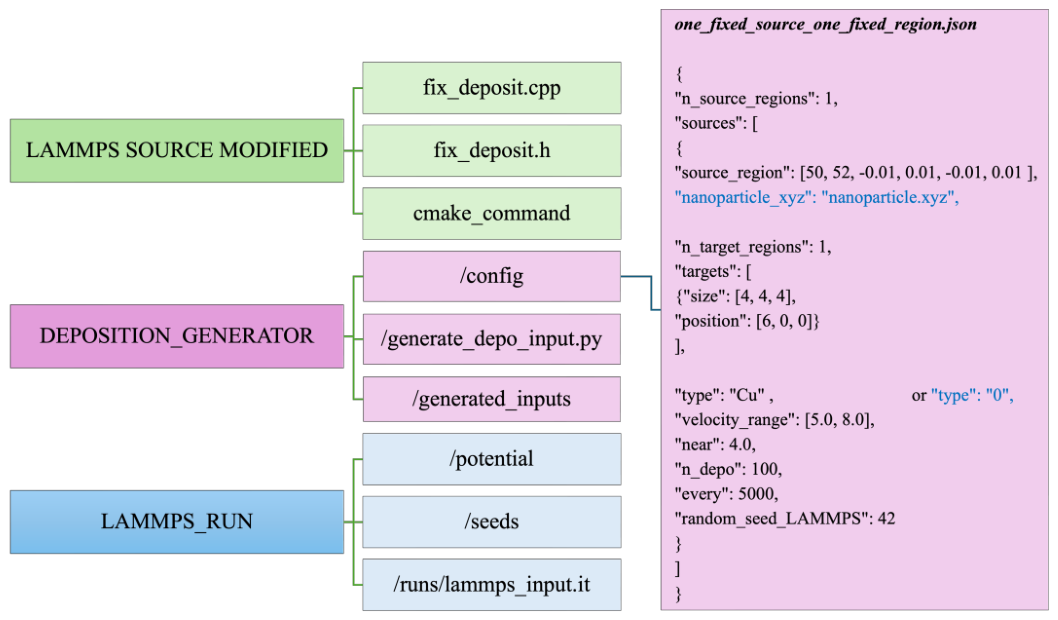
The NPGrowth_V2 workflow is designed to guide the user through the preparation and execution of nanoparticle growth simulations, from the installation of the required software to the generation of the deposition input file and the subsequent simulation run. The main steps of this procedure are summarized in Figure A1. The code is openly available on GitHub at https://github.com/nanoMLMS/NPGrowth_V2 with more input examples and tutorials.
After cloning the repository and completing the installation using the modified LAMMPS source files, the user can access the core component of NPGrowth_V2: the DEPOSITION_GENERATOR directory; while the LAMMPS_RUN directory contains the files required to perform the simulations with LAMMPS, including: (i) the simulation input file, specified in LAMMPS format at runs/lammps_input.in, (ii) the initial seed onto which deposition takes place, and (iii) the interatomic potential.
The deposition process is configured through the DEPOSITION_GENERATOR procedure. The user first prepares a JSON file containing the required deposition parameters. This JSON file is then provided as input to generate_depo_input.py, together with the destination path for the generated file. The script produces a LAMMPS-formatted input file containing the instructions required to perform the deposition simulation. The parameters required in the JSON configuration file are described below. An example of atomic one-by-one deposition from a fixed source to a fixed target is shown in Figure A1.
- "n_source_regions": specifies the number of source regions to be defined by the user.
-
"sources": defines the properties of each source region. When multiple sources are used, they are specified as an array of JSON objects, with each object enclosed in curly braces and separated by commas.The first parameter, "source_region", defines the spatial extent of the source as . These coordinates specify the lower and upper bounds along each Cartesian direction, thereby determining the position and dimensions of the source region. "nanoparticle_xyz" is an optional parameter used for sintering simulations. When specified, it provides the path to the XYZ file containing the atomic coordinates of the nanoparticle to be deposited.Each source must also be associated with a target region. The target can consist of a single rectangular parallelepiped or a union of multiple parallelepipeds. The n_target_regions define how many target regions are expected. A target is defined as a list of parallelepipeds, and deposition is directed on the lines connecting the center of the source to the center of each target region. Each target parallelepiped is specified by its dimensions, "size": , and the coordinates of its center, "position": .
- The type of deposited object must be specified. For atomic deposition, this parameter identifies the chemical element of the deposited atoms. For sintering simulations, the value must be set to 0.
- "velocity_range": specifies the range of initial velocities assigned to atoms extracted from the source, expressed in Å/ps.
- "near": specifies the minimum allowed distance between a newly inserted atom and the atoms already present in the simulation. This parameter prevents the insertion of atoms at excessively short distances, thereby avoiding unphysically large repulsive forces and potential numerical instabilities.
- "n_depo": specifies the total number of atoms or molecules to be deposited from the corresponding source.
-
"every": specifies the number of integration steps between successive deposition events from a given source. The corresponding physical time interval is obtained by multiplying every by the integration timestep, .For one-by-one deposition, the deposition rate is thereforeFor an N-by-N deposition scheme, in which objects are deposited per event, the rate becomesWhen expressed in units of objects per integration step, the factor is omitted.
- Finally, the user must provide a random_seed_LAMMPS for the stochastic operations performed by LAMMPS. Using the same seed and simulation parameters enables reproducibility, whereas changing the seed generates a different stochastic realization under the same conditions. Independent realizations can therefore be used to accumulate statistics and assess the variability of the simulation results.
Some considerations should be taken into account when defining the deposition geometry. First, the deposition direction is determined by the line connecting the source region to the target region, without explicitly accounting for the geometry of the initial nanoparticle seed. Consequently, if the selected source and target coordinates define a trajectory that intersects the seed, the deposited atoms or nanoparticles will encounter the first surface along that trajectory, which may differ from the intended deposition site. For this reason, when using random source regions, we recommend directing deposition toward the center of mass of the initial seed. This choice reduces the likelihood of unintended deposition trajectories and helps ensure that the resulting growth process is consistent with the intended simulation setup.
Figure A1.
NPGrowth workflow and an example JSON configuration file for the simplest deposition setup, consisting of one fixed source and one fixed target. The example illustrates the input parameters required to configure NPGrowth, which are described in detail in the text.
Figure A1.
NPGrowth workflow and an example JSON configuration file for the simplest deposition setup, consisting of one fixed source and one fixed target. The example illustrates the input parameters required to configure NPGrowth, which are described in detail in the text.
Appendix B. Machine Learning Potential for Cu nanoparticles
The machine learning potential (MLP) employed in this work was trained using the FLARE code [63,64], and tested with the mlputils package (https://github.com/gilbogilb/mlp_codes_utils). The MLP is trained on a custom-built dataset of configurations gathered with on-the-fly MD runs, the content of which is described in Table A1. We have employed the B2 term of Atomic Cluster Expansion [65] as descriptors, with squared normalized dot product as the GP kernel and the following hyperparameters: radial basis size , max angular basis terms , cutoff radius Å.
The energy, forces and stress of these reference atomic configurations was computed within the density functional theory framework using PBEsol as the exchange-correlation functional. We used a wavefunction cutoff of 55 Ry, a charge density cutoff of 440 Ry, and employed electronic smearing within the Marzari-Vanderbilt scheme [66] with a smearing parameter of 0.2 eV. All calculations were performed with Quantum Espresso [67,68].

Table A1.
Dataset composition for training and testing the machine learning potential employed in the sintering simulations.
Table A1.
Dataset composition for training and testing the machine learning potential employed in the sintering simulations.
| Configuration type | Train | Test |
|---|---|---|
| Bulk | 31 | 3 |
| Surfaces | 57 | 6 |
| Nanoparticles | 98 | 10 |
| Total | 186 | 19 |
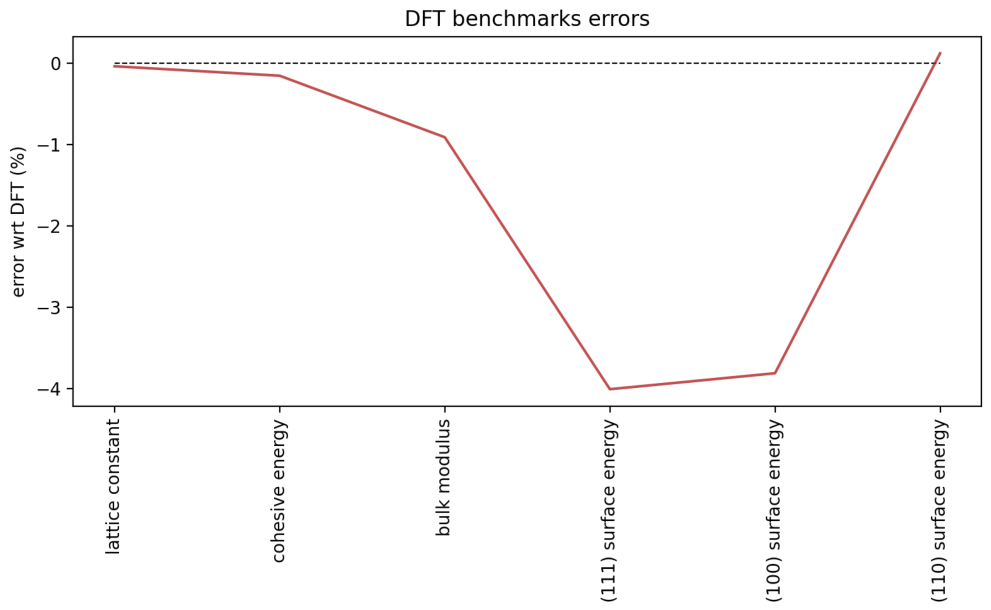
The potential is evaluated by means of its test set errors and errors on reproducing key derived quantities computed with DFT (cohesive energy, lattice constant, bulk modulus, surface energy of low-Miller-index surfaces). Results are shown in Figure A2-Figure A3.
Figure A2.
Parity plots of test set configurations for energy, forces, and stress with the employed potential. In the title of each plot are reported the mean absolute error (mae) and, in parentheses, the mean absolute error/mean absolute value ratio.
Figure A2.
Parity plots of test set configurations for energy, forces, and stress with the employed potential. In the title of each plot are reported the mean absolute error (mae) and, in parentheses, the mean absolute error/mean absolute value ratio.
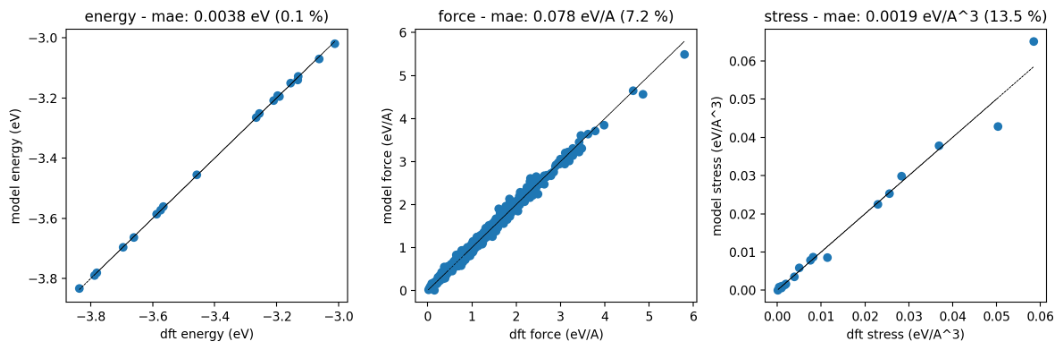
Figure A3.
Relative percentage error of the MLP in reproducing key quantities computed at the reference DFT level.
Figure A3.
Relative percentage error of the MLP in reproducing key quantities computed at the reference DFT level.
Appendix C. Sintering Simulations
Sintering simulations are performed at T=300 K and T=600 K. Both these temperatures are well below the melting temperature of a 588-atom cluster ( K). The melting temperature is estimated from melting-freezing hysteresis curves obtained with iterative MD simulations [69]. These are shown in Figure A4.
Figure A4.
Melting-freezing hysteresis curves for a 588-atoms Cu nanoparticle. The estimated melting temperature 1000 K is well below the sintering temperatures considered in the current work.
Figure A4.
Melting-freezing hysteresis curves for a 588-atoms Cu nanoparticle. The estimated melting temperature 1000 K is well below the sintering temperatures considered in the current work.
Appendix C.1. Potential Energy of Sintered Configurations
We report here the evolution of the per-atom potential energy in sintering simulations. The plot in Figure A5 shows that a significant energy difference is present between sintered nanoparticles starting with a different geometry.
Figure A5.
Potential energy per atom in sintering simulations for different initial geometries and thermostat temperatures.
Figure A5.
Potential energy per atom in sintering simulations for different initial geometries and thermostat temperatures.
Appendix C.2. Final structures analysis
Table A2 contains statistical informations about the values of , and their ratio for the last snapshots of the simulations.
Table A2.
Number of unique CNA patterns (), singleton patterns () and ratio for the final snapshot of sintering simulations. For all represented quantities, the main value is the average across the 6 simulations and the value in parentheses is the standard deviation across simulations.
Table A2.
Number of unique CNA patterns (), singleton patterns () and ratio for the final snapshot of sintering simulations. For all represented quantities, the main value is the average across the 6 simulations and the value in parentheses is the standard deviation across simulations.
| K | K | |||||
|---|---|---|---|---|---|---|
| Line | Square | Tetrahedron | Line | Square | Tetrahedron | |
| 203.8 (24.1) | 217.5 (23.2) | 232.6 (32.2) | 115.1 (47.6) | 98.5 (40.7) | 60.1 (21.2) | |
| 144.8 (21.7) | 157.3 (23.7) | 171.8 (29.9) | 68.0 (33.2) | 60.1 (31.4) | 30.0 (16.1) | |
| ratio | 0.71 (0.03) | 0.72 (0.03) | 0.73 (0.03) | 0.57 (0.07) | 0.59 (0.07) | 0.48 (0.08) |
Appendix C.3. IDs of Final Structures
We report here the IDS of the final structures obtained from sintering simulations.
Figure A6.
IDs of final structures from simulations with the Line geometry at T=300 K
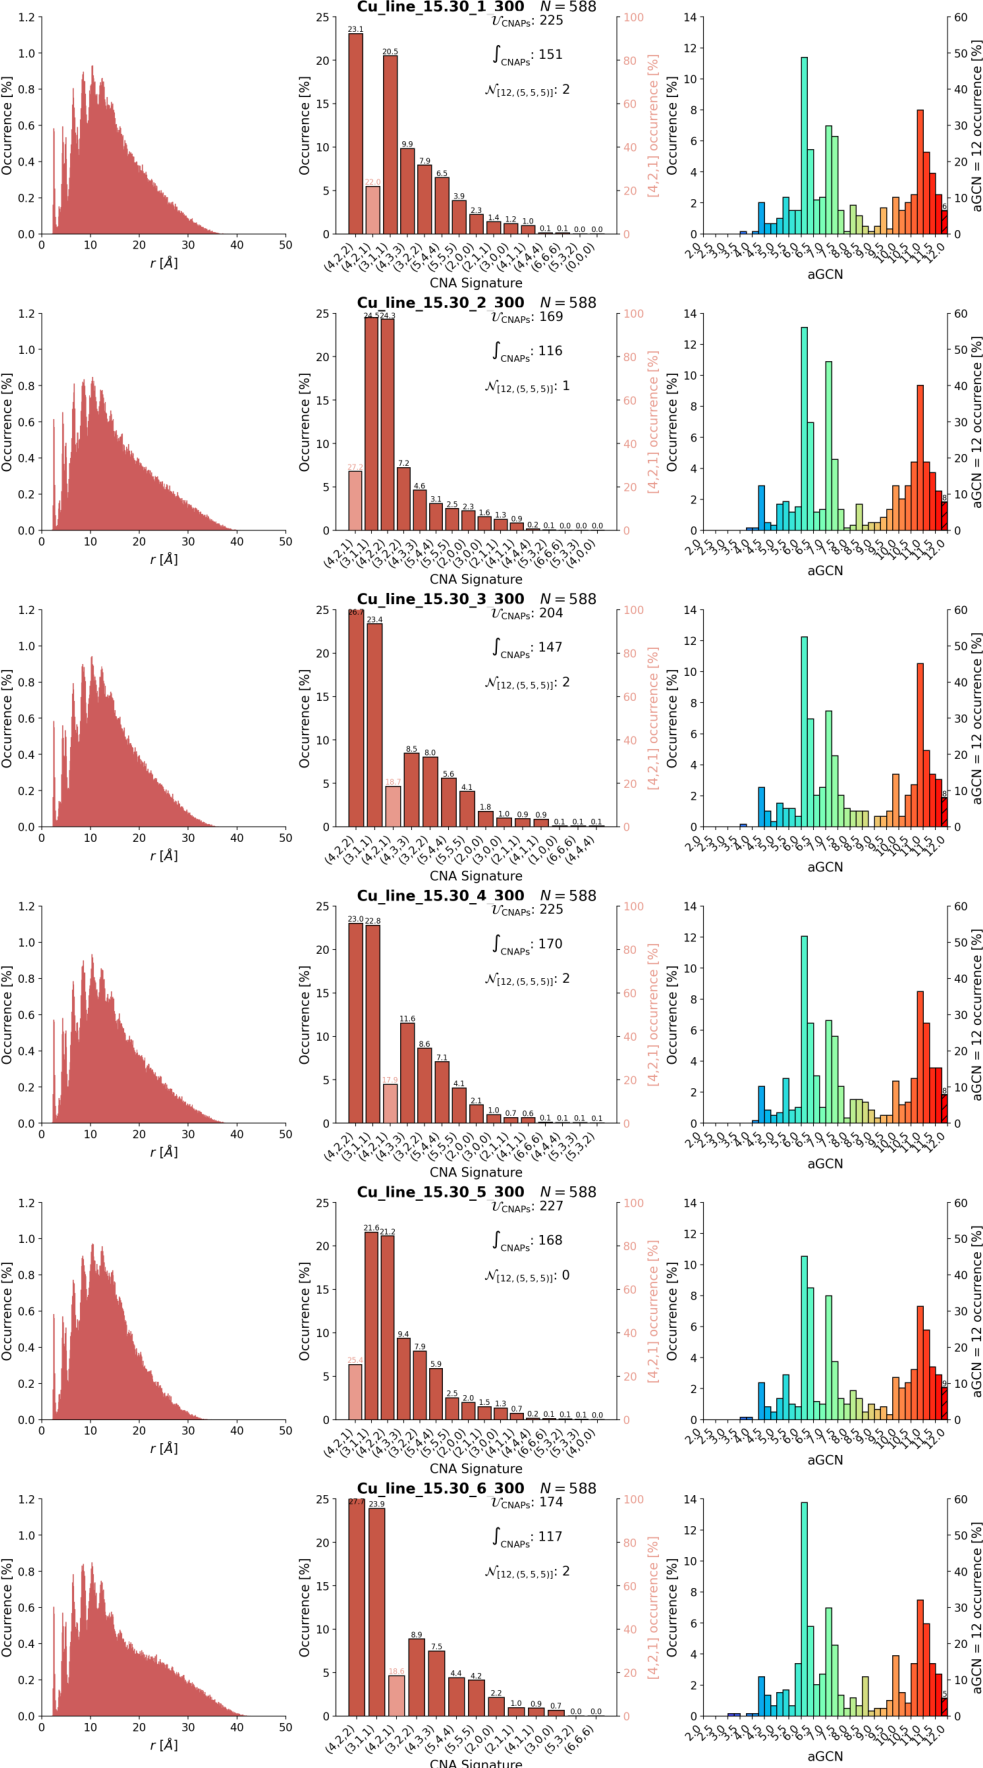
Figure A7.
IDs of final structures from simulations with the Line geometry at T=600 K
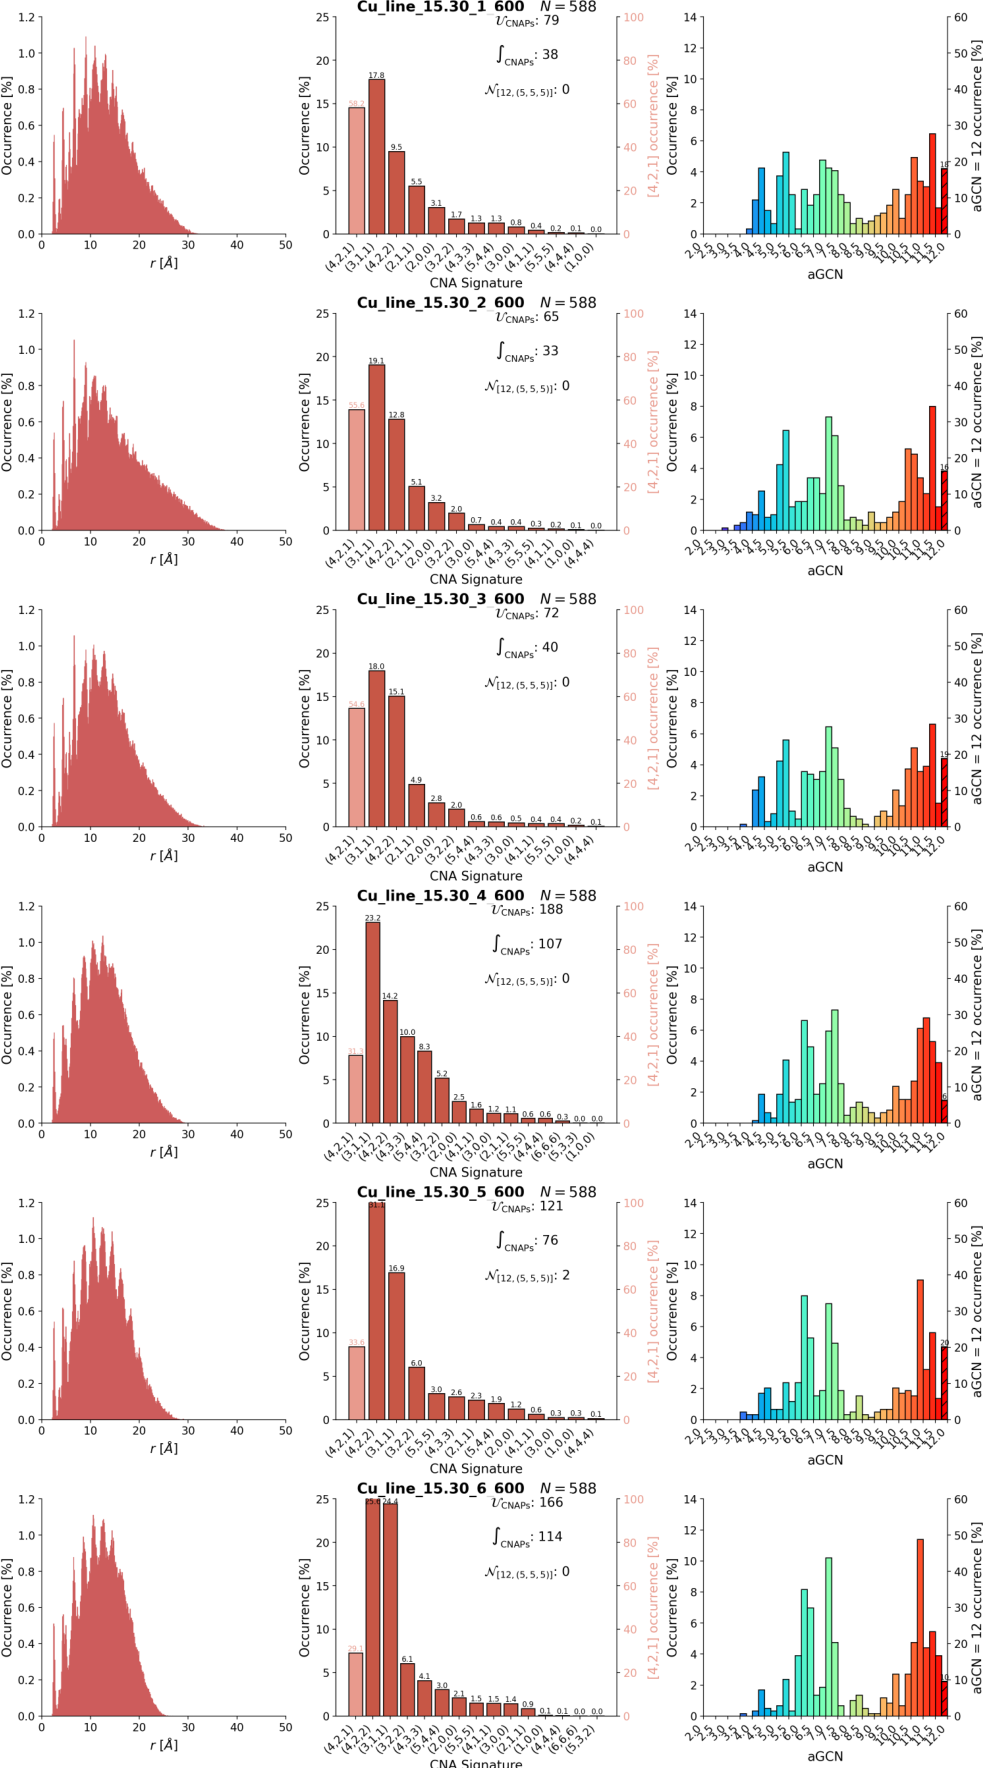
Figure A8.
IDs of final structures from simulations with the Square geometry at T=300 K
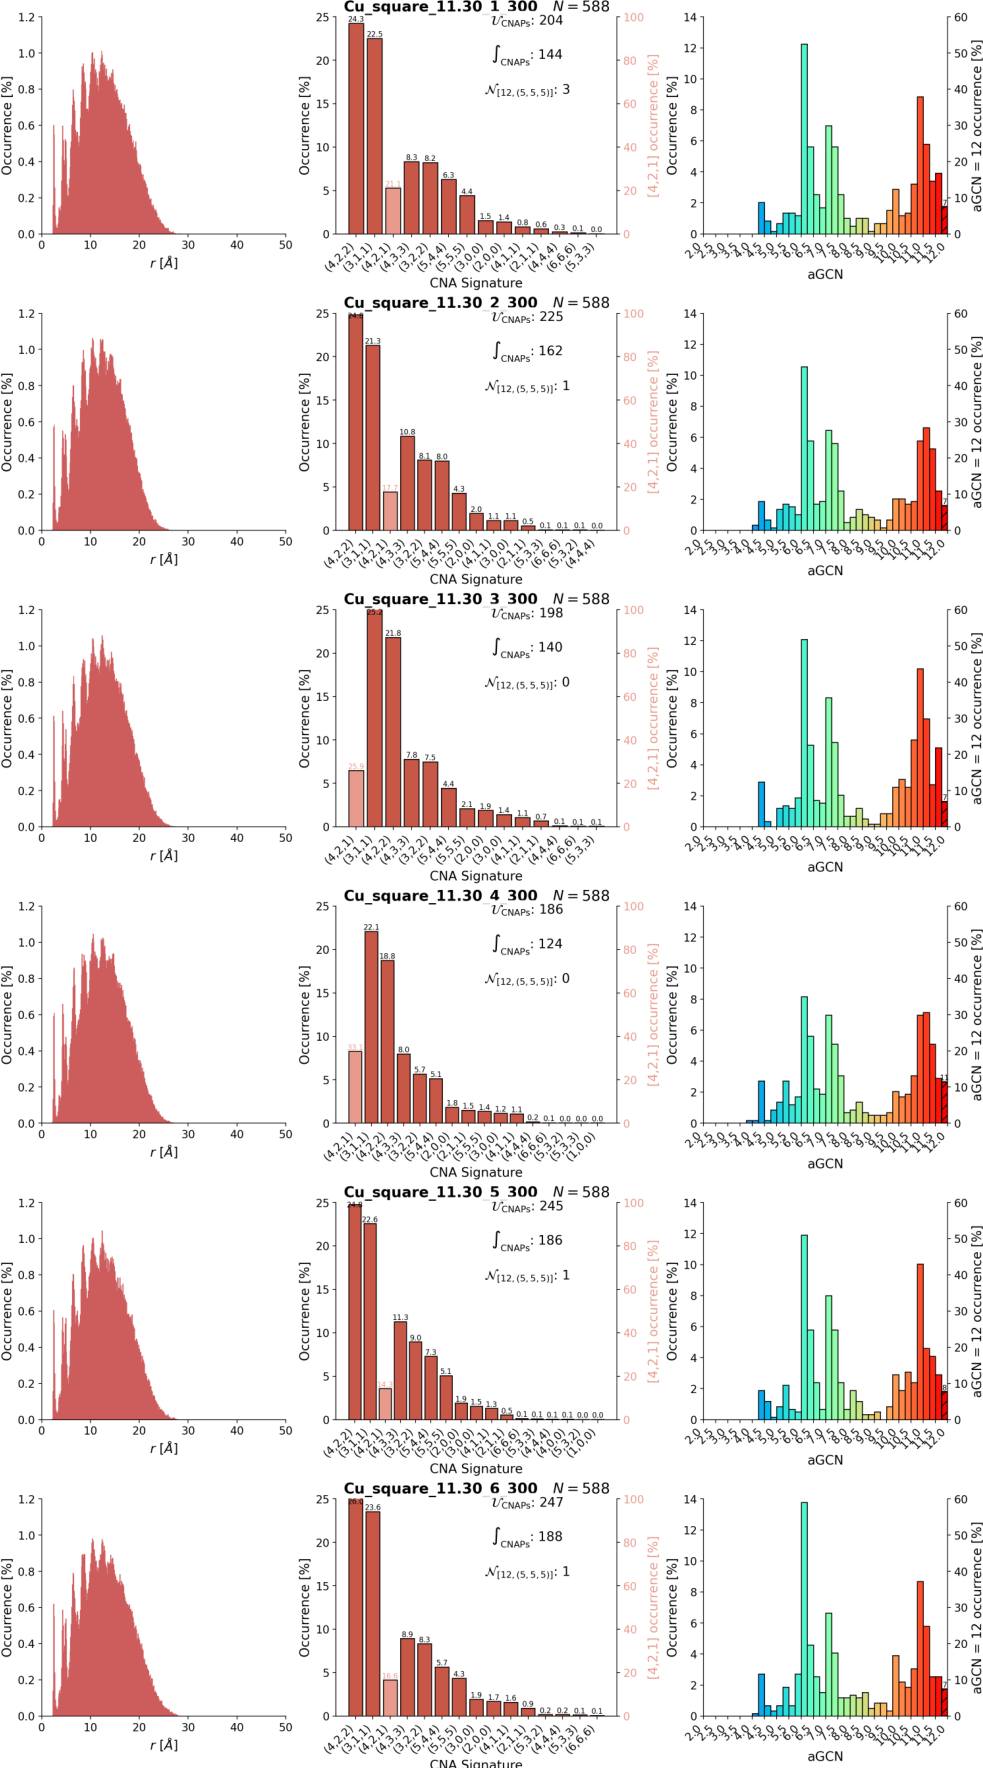
Figure A9.
IDs of final structures from simulations with the Square geometry at T=600 K
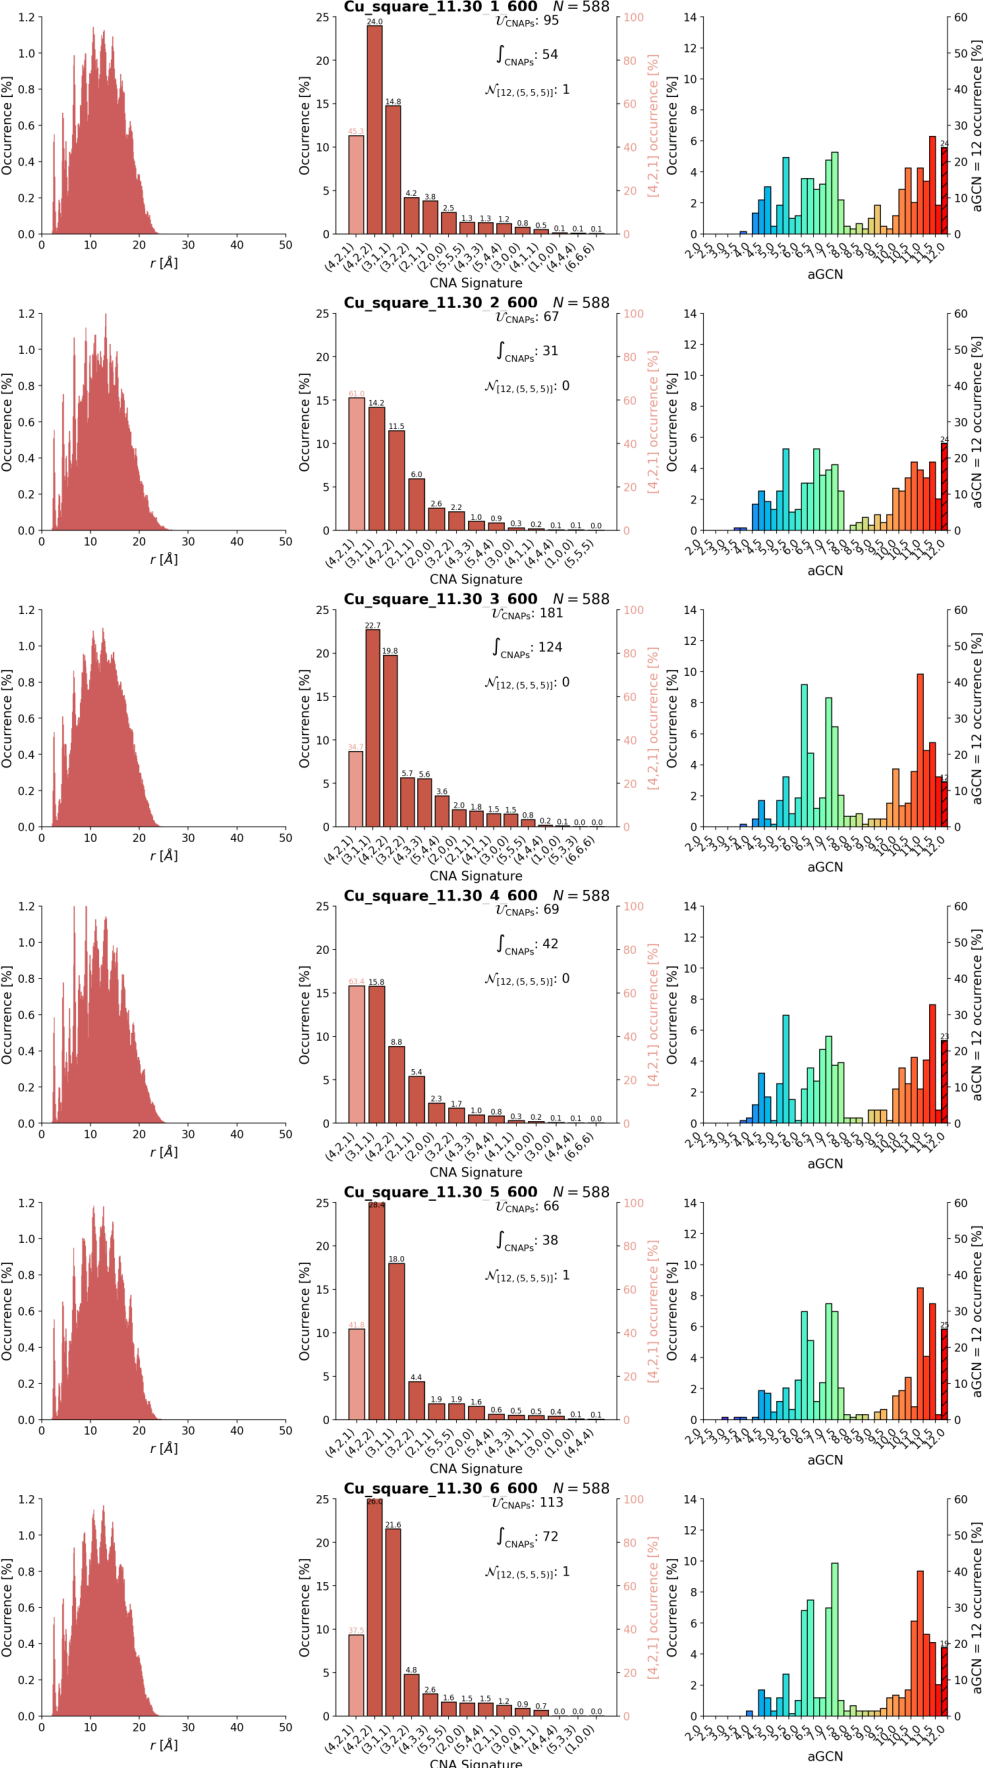
Figure A10.
IDs of final structures from simulations with the Tetrahedron geometry at T=300 K
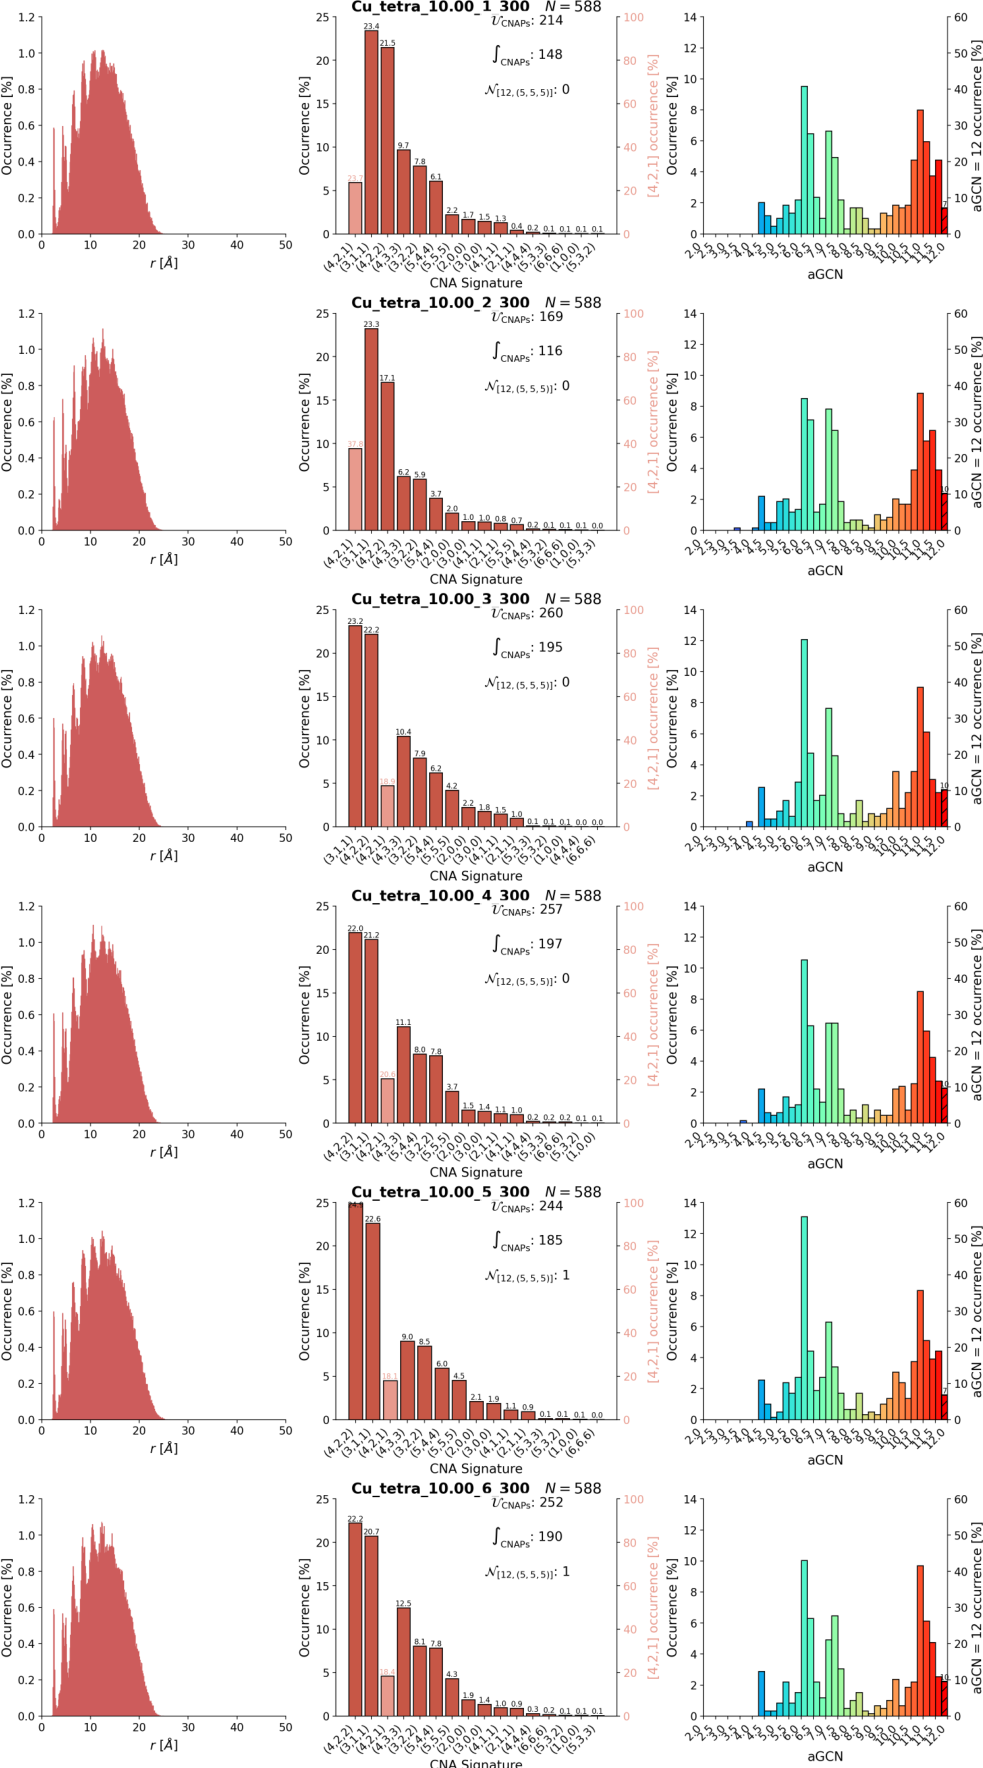
Figure A11.
IDs of final structures from simulations with the Tetrahedron geometry at T=600 K
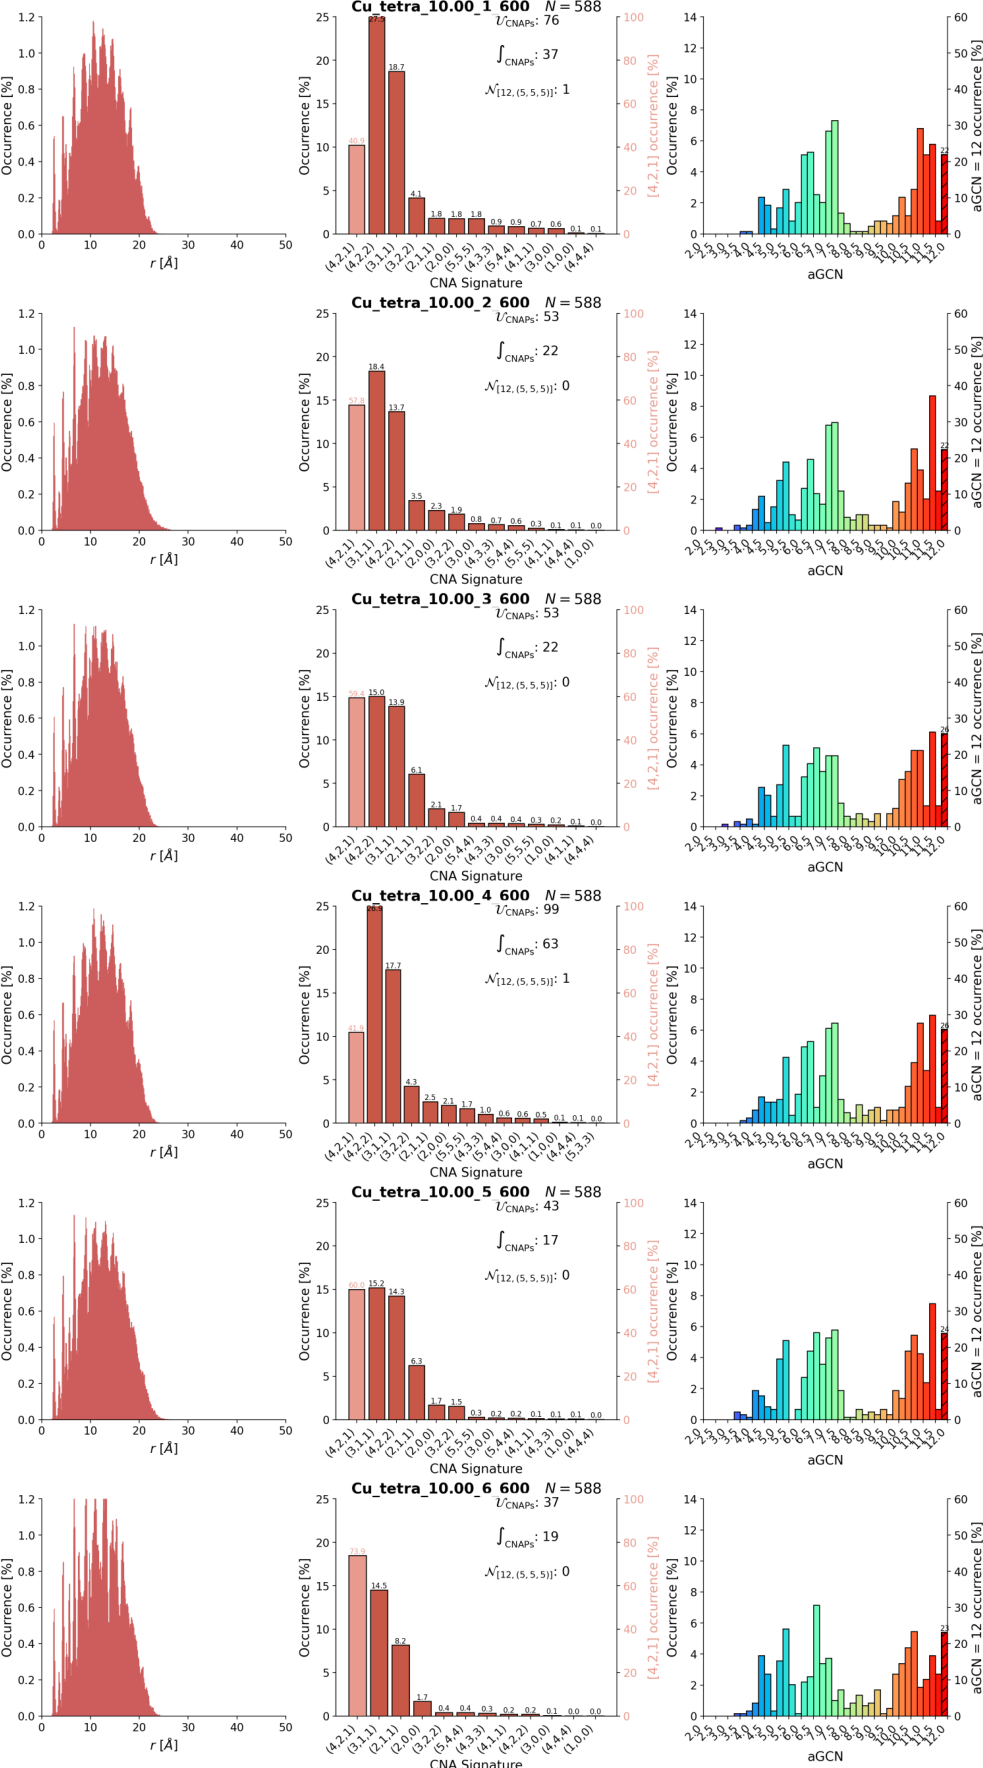
Appendix C.4. Time Evolution of Pair Distance Distribution Functions
Figure A12.
PDDF time evolution for the sintering simulations at T=300 K. We note that at low T, the PDDF profile are quite similar, with mild deviations at 5 Å.
Figure A12.
PDDF time evolution for the sintering simulations at T=300 K. We note that at low T, the PDDF profile are quite similar, with mild deviations at 5 Å.
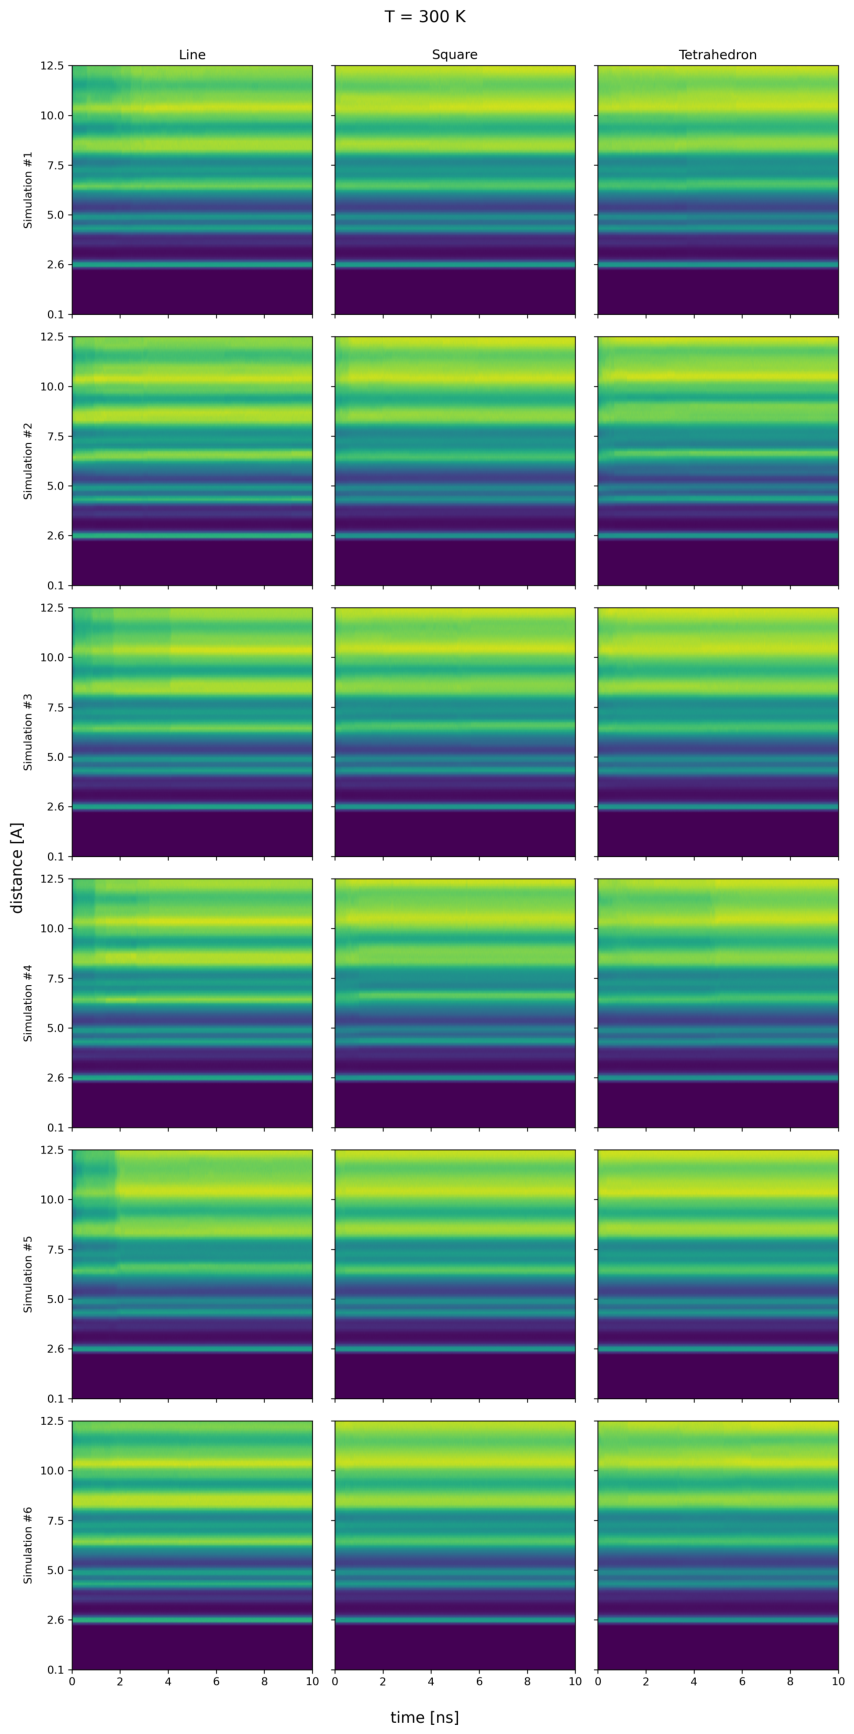
Figure A13.
PDDF time evolution for the sintering simulations at T=600 K. the PDDF differ for all the cases, supporting the presence of various structural motifs, as discussed.
Figure A13.
PDDF time evolution for the sintering simulations at T=600 K. the PDDF differ for all the cases, supporting the presence of various structural motifs, as discussed.
References
- Baletto, F.; Ferrando, R. Structural properties of nanoclusters: Energetic, thermodynamic, and kinetic effects. Reviews of Modern Physics 2005, 77, 371–423. [CrossRef]
- Yu, Y.; Qin, Z.; Zhang, X.; Chen, Y.; Qin, G.; Li, S. Far-From-Equilibrium Processing Opens Kinetic Paths for Engineering Novel Materials by Breaking Thermodynamic Limits. ACS Materials Letters 2024, 7, 319–332, [https://pubs.acs.org/amlcef/article-pdf/7/1/319/66115312/acsmaterialslett.4c01952.pdf]. [CrossRef]
- L. D. Marks, L.P. Nanoparticle shape, thermodynamics and kinetics. J. Phys. Condens. Matter 2016, 28, 053001.
- Espenti, C.S.; Rao, K.M.; Rao, K.K.; Mettu, M.R.; Han, S.S. Advancements in transmission and scanning electron microscopy for nanomaterials: Insights into structural, morphological, and functional characteristics. Applied Materials Today 2025, 45, 102829. [CrossRef]
- Fasce, S.; Nelli, D.; Benzi, L.; Förster, G.D.; Ferrando, R. Geometry-controlled competition between axis centering and detwinning in fivefold-twinned gold nanoparticles. Computational Materials Science 2026, 273, 114930. [CrossRef]
- K. Wang, Y. Ding, K.T.e.a. Grain-Boundary-Free Fusion of Non-Oriented Nanocrystals via Transient Amorphization. Small 2026, 22, e14681. [CrossRef]
- Yufan Zhou, Wenxin Wen, S.Y.X.L.J.L.F.Z.P.X.P.C.C. In Situ TEM Observation of the Coalescence between Immiscible Au and Rh Nanoparticles to Form AuRh Heterostructures. ACS Nanosci. Au 2026, p. just now. [CrossRef]
- Ni, B.; González-Rubio, G.; Van Gordon, K.; Bals, S.; Kotov, N.A.; Liz-Marzán, L.M. Seed-Mediated Growth and Advanced Characterization of Chiral Gold Nanorods. Advanced Materials 2024, 36, 2412473. [CrossRef]
- et al., M.S. Oriented attachment induces fivefold twins by forming and decomposing high-energy grain boundaries. Science 2019, 367, 40–45.
- Satyavolu, N.S.R.; Loh, K.Y.; Tan, L.H.; Lu, Y. Discovery of and Insights into DNA “Codes” for Tunable Morphologies of Metal Nanoparticles. Small 2019, 15, 1900975. [CrossRef]
- Zhao, H., Q.W.J.W.e.a. Large Marks-decahedral Pd nanoparticles synthesized by a modified hydrothermal method using a homogeneous reactor. J Nanopart Res. 2017, 19, 162. [CrossRef]
- Basso, L.F.; Vanzan, M.; Prati, L.; Rigo, V.A.; Baletto, F. Gold Decoration To Improve Rh-Nanoalloys for CO-Adsorption. The Journal of Physical Chemistry C 2025, 129, 10854–10865, [. [CrossRef]
- Rossi, K.; Asara, G.G.; Baletto, F. A genomic characterisation of monometallic nanoparticles. Physical Chemistry Chemical Physics 2018, 21, 4888–4898, [1805.09210]. [CrossRef]
- Rossi, K.; Asara, G.G.; Baletto, F. Structural Screening and Design of Platinum Nanosamples for Oxygen Reduction. ACS Catalysis 2020, 10, 3520–3533. [CrossRef]
- Zinzani, S.; Baletto, F.; Rossi, K. Bridging structure and activity in nanocatalysts via machine learning and global structure representations. Reaction Chemistry & Engineering 2026, [https://pubs.rsc.org/re/article-pdf/doi/10.1039/d6re00180g/13586530/d6re00180g.pdf]. [CrossRef]
- Gao, Jingyu, F.Z.X.L.e.a. A Review of Grain Boundaries: Formation Mechanism, Synthesis Strategy, and Application in Electrocatalysis. EcoEnergy 2026, p. e70074. [CrossRef]
- La Civita, G.; Ugolini, E.; Patelli, N.; Piccioni, A.; Migliori, A.; Pasquini, L.; Ghedini, E. Numerical and Experimental Study of Gas Phase Nanoparticle Synthesis Using NanoDOME. Nanomaterials 2023, 13. [CrossRef]
- Panizon, E.; Bochicchio, D.; Rossi, G.; Ferrando, R. Tuning the Structure of Nanoparticles by Small Concentrations of Impurities. Chemistry of Materials 2014, 26, 3354–3356, [https://pubs.acs.org/cmatex/article-pdf/26/11/3354/8086799/cm501001f.pdf]. [CrossRef]
- Nguyen, Q.N.; Wang, C.; Shang, Y.; Janssen, A.; Xia, Y. Colloidal Synthesis of Metal Nanocrystals: From Asymmetrical Growth to Symmetry Breaking. Chemical Reviews 2022, 123, 3693–3760, [https://pubs.acs.org/chreay/article-pdf/123/7/3693/2716711/cr2c00468.pdf]. [CrossRef]
- McDonald, M.N.; Zhu, Q.; Paxton, W.F.; Peterson, C.K.; Tree, D.R. Active control of equilibrium, near-equilibrium, and far-from-equilibrium colloidal systems. Soft Matter 2023, 19, 1675–1694, [https://pubs.rsc.org/sm/article-pdf/19/9/1675/8808871/d2sm01447e.pdf]. [CrossRef]
- Xia, Y.; Gilroy, K.; Peng, H.; Xia, X. Seed-Mediated Growth of Colloidal Metal Nanocrystals. Angewandte Chemie 2017, 56 1, 60–95. [CrossRef]
- Pearce, A.K.; Wilks, T.R.; Arno, M.C.; O’Reilly, R. Synthesis and applications of anisotropic nanoparticles with precisely defined dimensions. Nature Reviews Chemistry 2020, 5, 21–45. [CrossRef]
- Zeni, C.; Rossi, K.; Glielmo, A.; Baletto, F. On machine learning force fields for metallic nanoparticles. Advances in Physics: X 2019, 4, 1654919, [. [CrossRef]
- Zeni, C.; Rossi, K.; Baletto, F.; Gironcoli, S.; Pavloudis, T.; Palmer, R.; Kioseoglou, J. Data-driven simulation and characterisation of gold nanoparticle melting. Nature Communications 2021, 12. [CrossRef]
- Alimonti, D.; Baletto, F. Machine-learnt potential highlights melting and freezing of aluminum nanoparticles. The Journal of Chemical Physics 2025, 162, 144302, [https://pubs.aip.org/aip/jcp/article-pdf/doi/10.1063/5.0253649/20477720/144302_1_5.0253649.pdf]. [CrossRef]
- Grammatikopoulos, P. Progress in atomistic modelling of nanoparticle coalescence. Advances in Physics: X 2026, 11, 2611995, [. [CrossRef]
- Valkealahti, S.; Manninen, M. Diffusion on aluminum-cluster surfaces and the cluster growth. Phys. Rev. B 1998, 57, 15533–15540. [CrossRef]
- Paz, S.A.; Leiva, E.P.M.; Jellinek, J.; Mariscal, M.M. Properties of rotating nanoalloys formed by cluster collision: A computer simulation study. The Journal of Chemical Physics 2011, 134, 094701, [https://pubs.aip.org/aip/jcp/article-pdf/doi/10.1063/1.3556530/13305954/094701_1_online.pdf]. [CrossRef]
- Mariscal, M.M.; Velázquez-Salazar, J.J.; Yacaman, M.J. Growth mechanism of nanoparticles: theoretical calculations and experimental results. CrystEngComm 2012, 14, 544–549, [https://pubs.rsc.org/ce/article-pdf/14/2/544/2310269/c1ce05602f.pdf]. [CrossRef]
- Grammatikopoulos, P.; Sowwan, M.; Kioseoglou, J. Nanoparticle Coalescence: Computational Modeling of Nanoparticle Coalescence (Adv. Theory Simul. 6/2019). Advanced Theory and Simulations 2019, 2, 1970019. [CrossRef]
- Parsina, I.; Baletto, F. Tailoring the Structural Motif of AgCo Nanoalloys: Core/Shell versus Janus-like. The Journal of Physical Chemistry C 2010, 114, 1504–1511. [CrossRef]
- Baletto, F.; Cavazzoni, C.; Scandolo, S. Surface Trapped Excess Electrons on Ice. Phys. Rev. Lett. 2005, 95, 176801. [CrossRef]
- Baletto, F.; Mottet, C.; Ferrando, R. Freezing of silver nanodroplets. Chemical Physics Letters 2002, 354, 82–87. [CrossRef]
- Farigliano, L.M.; Villarreal, M.A.; Leiva, E.P.M.; Paz, S. Thermodynamics of Nanoparticle Coalescence at Different Temperatures via Well-Tempered Metadynamics. The Journal of Physical Chemistry C 2020, 124, 24009–24016. [CrossRef]
- Nelli, D.; Cerbelaud, M.; Ferrando, R.; Minnai, C. Tuning the coalescence degree in the growth of Pt–Pd nanoalloys. Nanoscale Adv. 2021, 3, 836–846. [CrossRef]
- Thanh, N.T.K.; Maclean, N.; Mahiddine, S. Mechanisms of Nucleation and Growth of Nanoparticles in Solution. Chemical Reviews 2014, 114, 7610–7630. [CrossRef]
- Antúnez-García, J.; Mejía-Rosales, S.; Pérez-Tijerina, E.; Montejano-Carrizales, J.M.; José-Yacamán, M. Coalescence and Collisions of Gold Nanoparticles. Materials 2011, 4, 368–379. [CrossRef]
- Zinzani, S.; Vanzan, M.; Jones, R.M.; Baletto, F. Morphological Stability of Au-Core Nanosatellites. Small Structures 2026, 7, e202500891, [https://onlinelibrary.wiley.com/doi/pdf/10.1002/sstr.202500891]. [CrossRef]
- Zinzani, S.; Baletto, F. Coalescence of AuPd nanoalloys in implicit environments. Phys. Chem. Chem. Phys. 2024, 26, 21965–21973. [CrossRef]
- Mottet, C.; Goniakowski, J.; Baletto, F.; Ferrando, R.; Treglia, G. Modeling free and supported metallic nanoclusters: structure and dynamics. Phase Transitions 2004, 77, 101–113, [. [CrossRef]
- Baletto, F.; Mottet, C.; Rapallo, A.; Rossi, G.; Ferrando, R. Growth and energetic stability of AgNi core–shell clusters. Surface Science 2004, 566-568, 192–196. Proceedings of the 22nd European Conference on Surface Science, . [CrossRef]
- Baletto, F. Structural properties of sub-nanometer metallic clusters. Journal of Physics: Condensed Matter 2019, 31, 113001.
- Nelli, D.; Rossi, G.; Wang, Z.; Palmer, R.; Ferrando, R. Structure and orientation effects in the coalescence of Au clusters. Nanoscale 2020. [CrossRef]
- Nelli, D.; Rossi, G.; Wang, Z.; Palmer, R.E.; Ferrando, R. Structure and orientation effects in the coalescence of Au clusters. Nanoscale 2020, 12, 7688–7699, [https://pubs.rsc.org/nr/article-pdf/12/14/7688/6757744/c9nr10163b.pdf]. [CrossRef]
- Xia, Y.; Nelli, D.; Ferrando, R.; Yuan, J.; Li, Z.Y. Shape control of size-selected naked platinum nanocrystals. Nature Communications 2021, 12, 3019. [CrossRef]
- El koraychy, E.y.; Roncaglia, C.; Nelli, D.; Cerbelaud, M.; Ferrando, R. Growth mechanisms from tetrahedral seeds to multiply twinned Au nanoparticles revealed by atomistic simulations. Nanoscale Horizons 2022, 7, 883–889, [https://pubs.rsc.org/nh/article-pdf/7/8/883/7949650/d1nh00599e.pdf]. [CrossRef]
- Thompson, A.P.; Aktulga, H.M.; Berger, R.; Bolintineanu, D.S.; Brown, W.M.; Crozier, P.S.; in ’t Veld, P.J.; Kohlmeyer, A.; Moore, S.G.; Nguyen, T.D.; et al. LAMMPS - a flexible simulation tool for particle-based materials modeling at the atomic, meso, and continuum scales. Comp. Phys. Comm. 2022, 271, 108171. [CrossRef]
- Zinzani, S.; Nardi, G.; Becatti, G.; Alimonti, D.; Baletto, F. nanoMLMS/pySNOW: v0.1.0, 2026. [CrossRef]
- Zinzani, S.; Nardi, G.; Becatti, G.; Alimonti, D.; Basso, L.F.; Rossi, K.; Baletto, F. ’pySNOW’: a Python Suite for the NanO-World, 2026, [arXiv:cond-mat.mtrl-sci/2609.02492].
- Jones, R.M.; Rossi, K.; Zeni, C.; Vanzan, M.; Vasiljevic, I.; Santana-Bonilla, A.; Baletto, F. Structural characterisation of nanoalloys for (photo)catalytic applications with the Sapphire library. Faraday Discussions 2023, 242, 326–352, [https://pubs.rsc.org/fd/article-pdf/doi/10.1039/d2fd00097k/8495712/d2fd00097k.pdf]. [CrossRef]
- Diana Nelli, C.R.; Minnai, C. Strain engineering in alloy nanoparticles. Advances in Physics: X 2023, 8, 2127330, [. [CrossRef]
- Ye, E.; Regulacio, M.D.; Zhang, S.Y.; Loh, X.J.; Han, M.Y. Anisotropically branched metal nanostructures. Chemical Society Reviews 2015, 44, 6001–6017. [CrossRef]
- Sanchez-Valencia, J.R.; Longtin, R.; Rossell, M.D.; Gröning, P. Growth Assisted by Glancing Angle Deposition: A New Technique to Fabricate Highly Porous Anisotropic Thin Films. ACS Applied Materials & Interfaces 2016, 8, 8686–8693, [https://pubs.acs.org/aamick/article-pdf/8/13/8686/7820039/am6b00232.pdf]. [CrossRef]
- Fang, Y.; Yang, L.; Huang, Z. Advanced Optoelectronic Applications of Nanopillar Arrays Fabricated by Glancing Angle Deposition. Nanomaterials 2025, 15. [CrossRef]
- Honeycutt, J.D.; Andersen, H.C. Molecular dynamics study of melting and freezing of small Lennard-Jones clusters. The Journal of Physical Chemistry 2002, 91, 4950–4963, [https://pubs.acs.org/jpchax/article-pdf/91/19/4950/11138971/j100303a014.pdf]. [CrossRef]
- Calle-Vallejo, F.; Martínez, J.I.; García-Lastra, J.M.; Sautet, P.; Loffreda, D. Fast Prediction of Adsorption Properties for Platinum Nanocatalysts with Generalized Coordination Numbers. Angewandte Chemie International Edition 2014, 53, 8316–8319, [https://onlinelibrary.wiley.com/doi/pdf/10.1002/anie.201402958]. [CrossRef]
- Calle-Vallejo, F. The ABC of Generalized Coordination Numbers and Their Use as a Descriptor in Electrocatalysis. Advanced Science 2023, 10, 2207644, [https://onlinelibrary.wiley.com/doi/pdf/10.1002/advs.202207644]. [CrossRef]
- Cesare Roncaglia, R.F. Machine Learning Assisted Clustering of Nanoparticle. J. Chem. Inf. Model. 2023, 63, 459–473.
- Delgado-Callico, L.; Rossi, K.; Pinto-Miles, R.; Salzbrenner, P.; Baletto, F. A universal signature in the melting of metallic nanoparticles. Nanoscale 2021, 13, 1172–1180, [https://pubs.rsc.org/nr/article-pdf/13/2/1172/7378979/d0nr06850k.pdf]. [CrossRef]
- Bose, S.; Floris, A.; Rajendiran, M.; D’Aguanno, B. When does a nanoparticle become a cluster? The Journal of Chemical Physics 2025, 163, 164108, [https://pubs.aip.org/aip/jcp/article-pdf/doi/10.1063/5.0280263/20769582/164108_1_5.0280263.pdf]. [CrossRef]
- Foiles, S.M.; Baskes, M.I.; Daw, M.S. Embedded-atom-method functions for the fcc metals Cu, Ag, Au, Ni, Pd, Pt, and their alloys. Phys. Rev. B 1986, 33, 7983–7991. [CrossRef]
- Stukowski, A. Visualization and analysis of atomistic simulation data with OVITO–the Open Visualization Tool. Modelling and Simulation in Materials Science and Engineering 2010, 18, 015012. [CrossRef]
- Vandermause, J.; Torrisi, S.B.; Batzner, S.; Xie, Y.; Sun, L.; Kolpak, A.M.; Kozinsky, B. On-the-fly active learning of interpretable Bayesian force fields for atomistic rare events. npj Computational Materials 2020, 6, 20. [CrossRef]
- Vandermause, J.; Xie, Y.; Lim, J.S.; Owen, C.J.; Kozinsky, B. Active learning of reactive Bayesian force fields applied to heterogeneous catalysis dynamics of H/Pt. Nature Communications 2022, 13, 5183. [CrossRef]
- Drautz, R. Atomic cluster expansion for accurate and transferable interatomic potentials. Phys. Rev. B 2019, 99, 014104. [CrossRef]
- Marzari, N.; Vanderbilt, D.; De Vita, A.; Payne, M.C. Thermal Contraction and Disordering of the Al(110) Surface. Phys. Rev. Lett. 1999, 82, 3296–3299. [CrossRef]
- Giannozzi, P.; Andreussi, O.; Brumme, T.; Bunau, O.; Buongiorno Nardelli, M.; Calandra, M.; Car, R.; Cavazzoni, C.; Ceresoli, D.; Cococcioni, M.; et al. Advanced capabilities for materials modelling with Quantum ESPRESSO. Journal of Physics: Condensed Matter 2017, 29, 465901. [CrossRef]
- Giannozzi, P.; Baroni, S.; Bonini, N.; Calandra, M.; Car, R.; Cavazzoni, C.; Ceresoli, D.; Chiarotti, G.L.; Cococcioni, M.; Dabo, I.; et al. QUANTUM ESPRESSO: a modular and open-source software project for quantum simulations of materials. Journal of Physics: Condensed Matter 2009, 21, 395502. [CrossRef]
- Rossi, K.; Pártay, L.B.; Csányi, G.; Baletto, F. Thermodynamics of CuPt nanoalloys. Scientific Reports 2018, 8, 9150. [CrossRef]
Figure 2.
Pictorial representation of processes simulated by NPGrowth: 1-by-1 atomic deposition: As time progresses at each every step, atoms are deposited from (i-left) one fixed source to a fixed target region; (ii-middle) one fixed source towards two fixed target regions; (iii-right) randomly selected sources toward the seed centre-of-mass (CoM). N-by-N atomic deposition: N atoms are deposited simultaneously at each deposition event, here 2-by-2 coming from (i-left) two fixed sources onto a fixed target region; (ii-middle) two fixed sources onto a target region with an S-geometry; (iii) from randomly selected positions toward the CoM. Source regions are in green and target regions in red, with red crosses indicating the CoM. Arrows connecting the source and target regions are the deposition trajectories. Deposited atoms are shown in blue, while the seed atoms are in orange. Sintering stages: (upper) two Cu cubes positioned initially at and approaching along the line connecting their CoM; (bottom) three Cu cubes initially in a triangular geometry.
Figure 2.
Pictorial representation of processes simulated by NPGrowth: 1-by-1 atomic deposition: As time progresses at each every step, atoms are deposited from (i-left) one fixed source to a fixed target region; (ii-middle) one fixed source towards two fixed target regions; (iii-right) randomly selected sources toward the seed centre-of-mass (CoM). N-by-N atomic deposition: N atoms are deposited simultaneously at each deposition event, here 2-by-2 coming from (i-left) two fixed sources onto a fixed target region; (ii-middle) two fixed sources onto a target region with an S-geometry; (iii) from randomly selected positions toward the CoM. Source regions are in green and target regions in red, with red crosses indicating the CoM. Arrows connecting the source and target regions are the deposition trajectories. Deposited atoms are shown in blue, while the seed atoms are in orange. Sintering stages: (upper) two Cu cubes positioned initially at and approaching along the line connecting their CoM; (bottom) three Cu cubes initially in a triangular geometry.
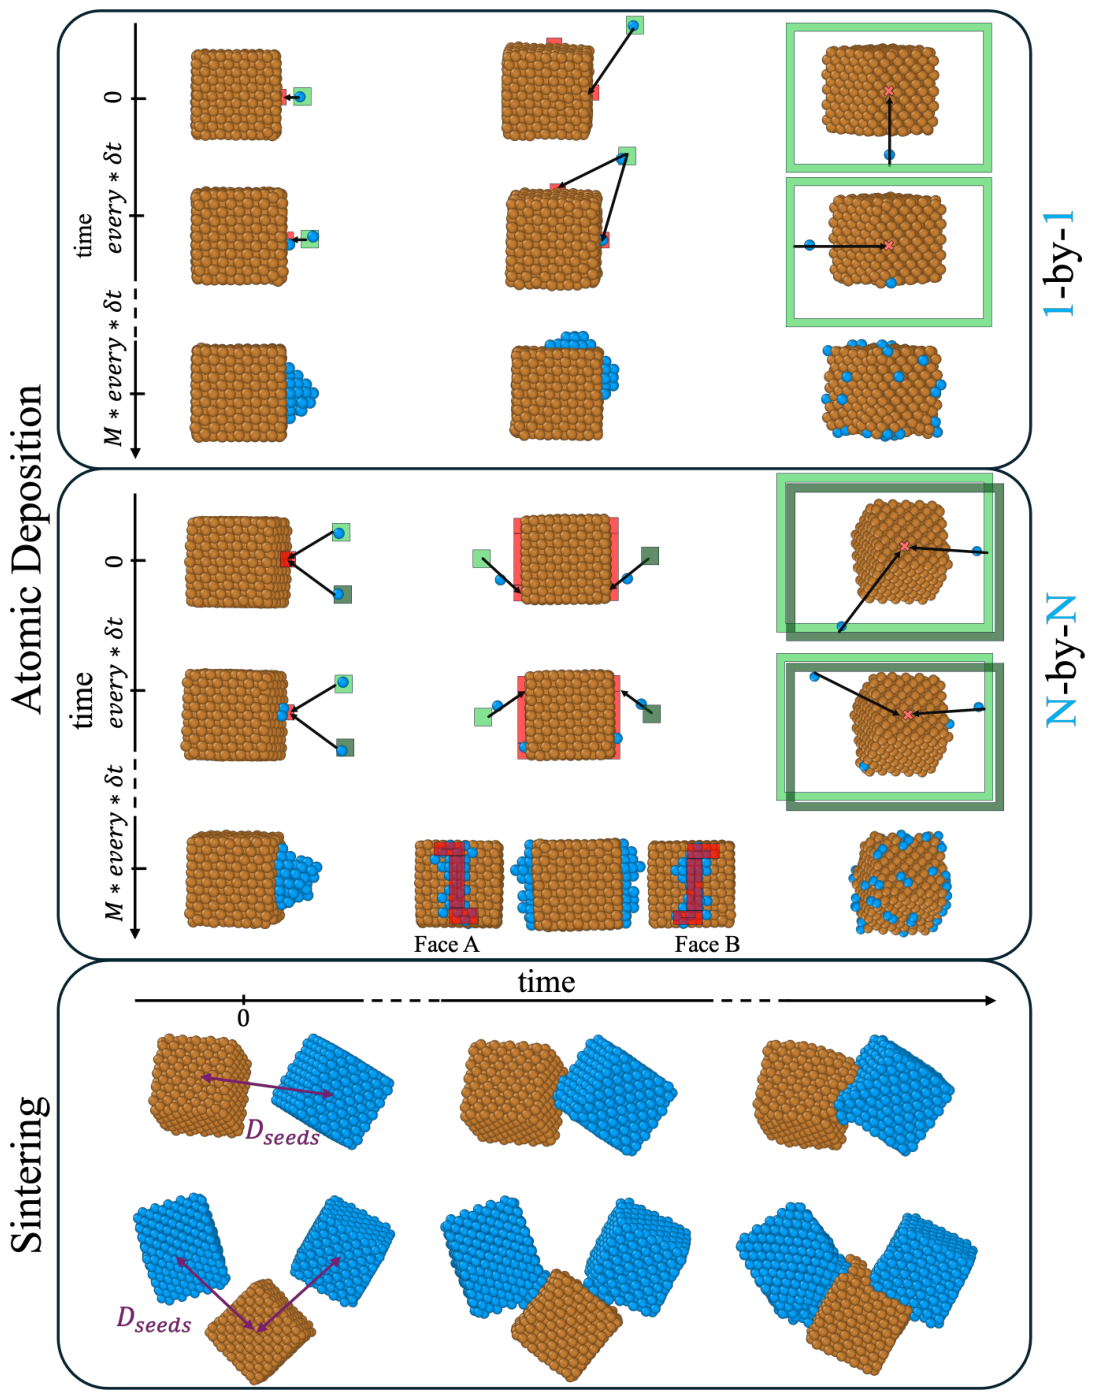
Figure 3.
pySNOW characterization of last frame of Cu-NPs from the example listed in Table 2. (a) and (b) 5400 atoms deposited upon a Cb4361; (c) and (d) atomic deposition upon a TO201 after 264 and 655 atoms, respectively. NP size as total number of atoms, N, at the top of each panel. From left to right: PDDF and snapshot of reference, with atoms coloured in dark-orange; CNA signature and CNAP summary. Values (4,2,1) occurrence (pink) to be read on the right axis-; atop-GCN distribution and relative snapshot with atoms coloured accordingly to it. The occurrence of aGCN=12 (bulk environment) is tenfold and reported on the right axis. Representative snapshots are generated using OVITO. [62]
Figure 3.
pySNOW characterization of last frame of Cu-NPs from the example listed in Table 2. (a) and (b) 5400 atoms deposited upon a Cb4361; (c) and (d) atomic deposition upon a TO201 after 264 and 655 atoms, respectively. NP size as total number of atoms, N, at the top of each panel. From left to right: PDDF and snapshot of reference, with atoms coloured in dark-orange; CNA signature and CNAP summary. Values (4,2,1) occurrence (pink) to be read on the right axis-; atop-GCN distribution and relative snapshot with atoms coloured accordingly to it. The occurrence of aGCN=12 (bulk environment) is tenfold and reported on the right axis. Representative snapshots are generated using OVITO. [62]
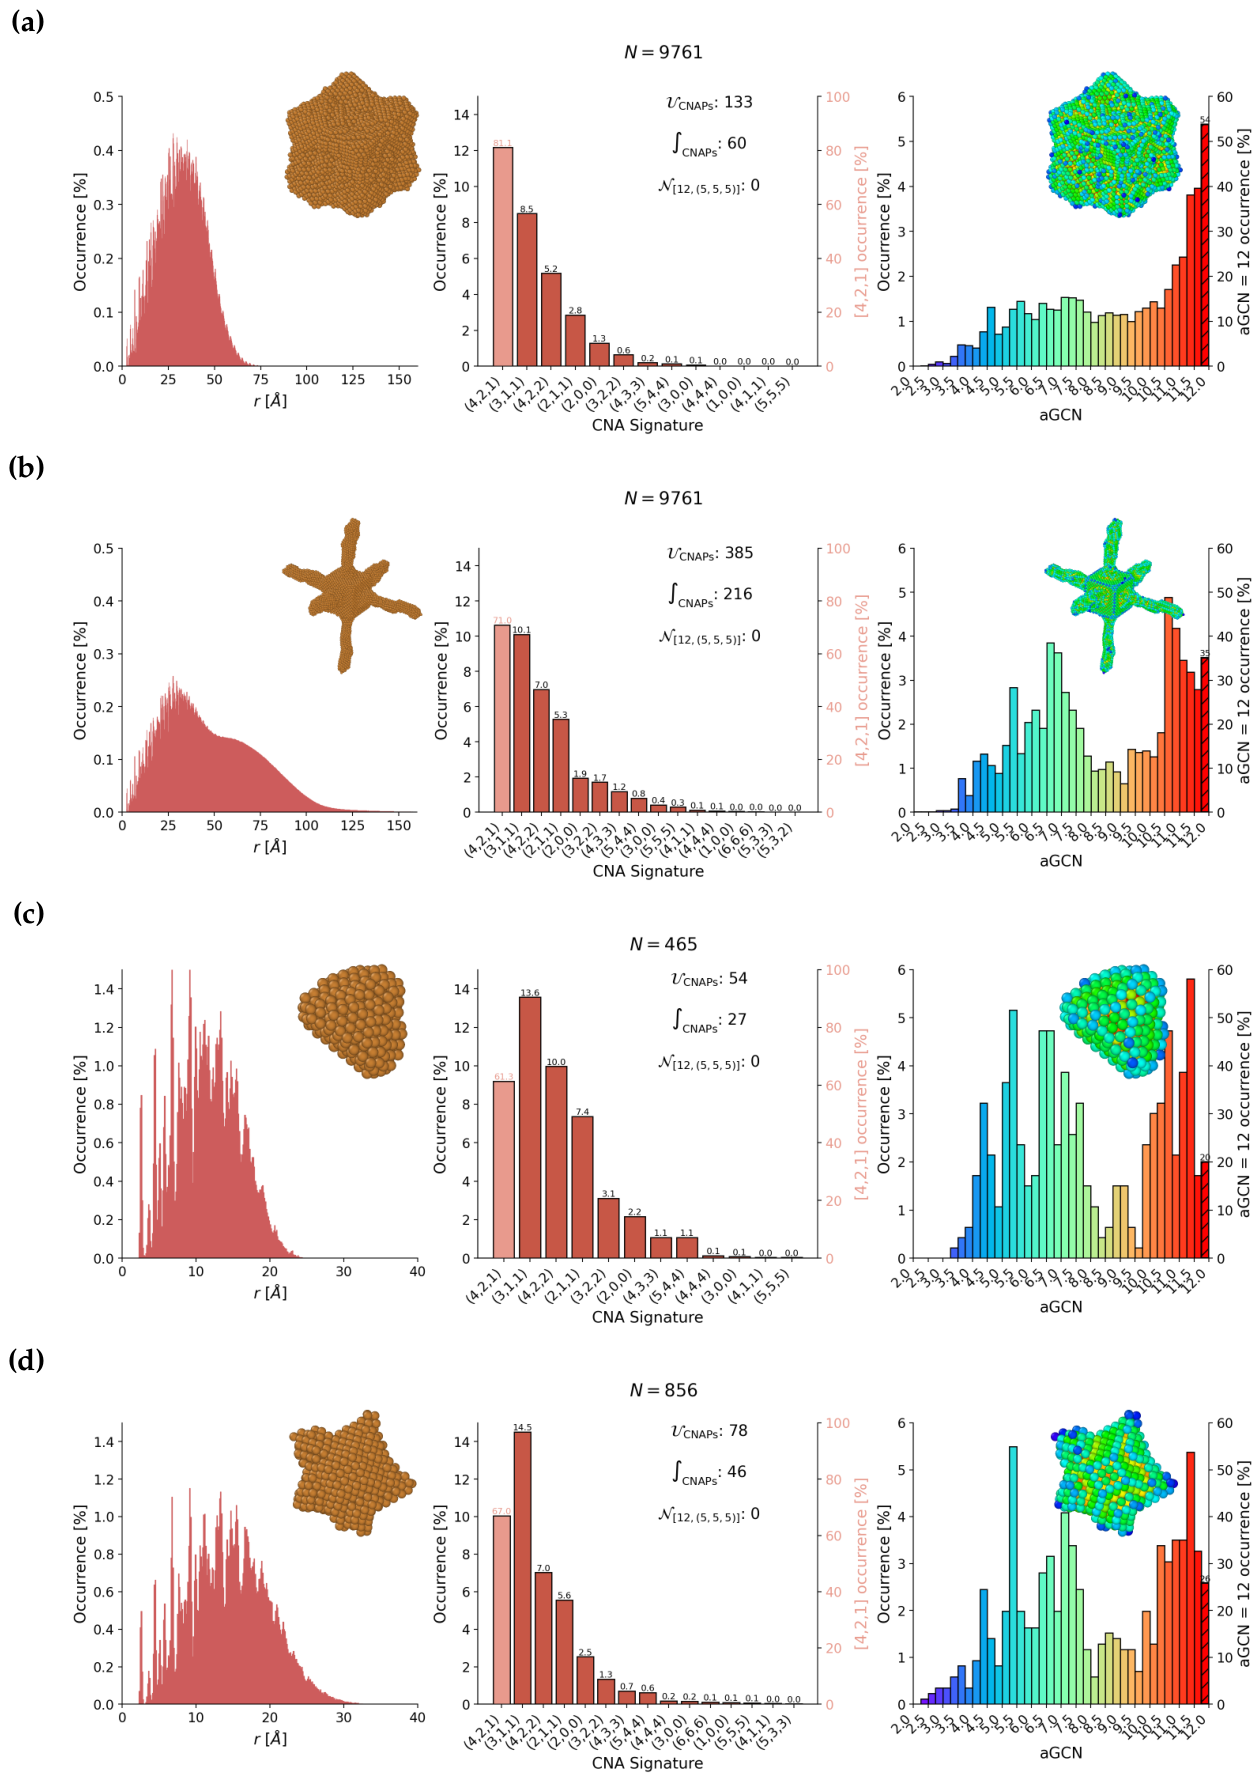
Figure 4.
Top row: Sintering geometries with four seeds with respect to the relative position of their CoM, initially at a distance : anisotropic (Line); 2-D (Square); and a 3D isotropic arrangement (Tetrahedron). Bottom Row: Probability of forming a certain number of MNPs when four sinter in different initial geometries as a function of their relative displacement, .
Figure 4.
Top row: Sintering geometries with four seeds with respect to the relative position of their CoM, initially at a distance : anisotropic (Line); 2-D (Square); and a 3D isotropic arrangement (Tetrahedron). Bottom Row: Probability of forming a certain number of MNPs when four sinter in different initial geometries as a function of their relative displacement, .
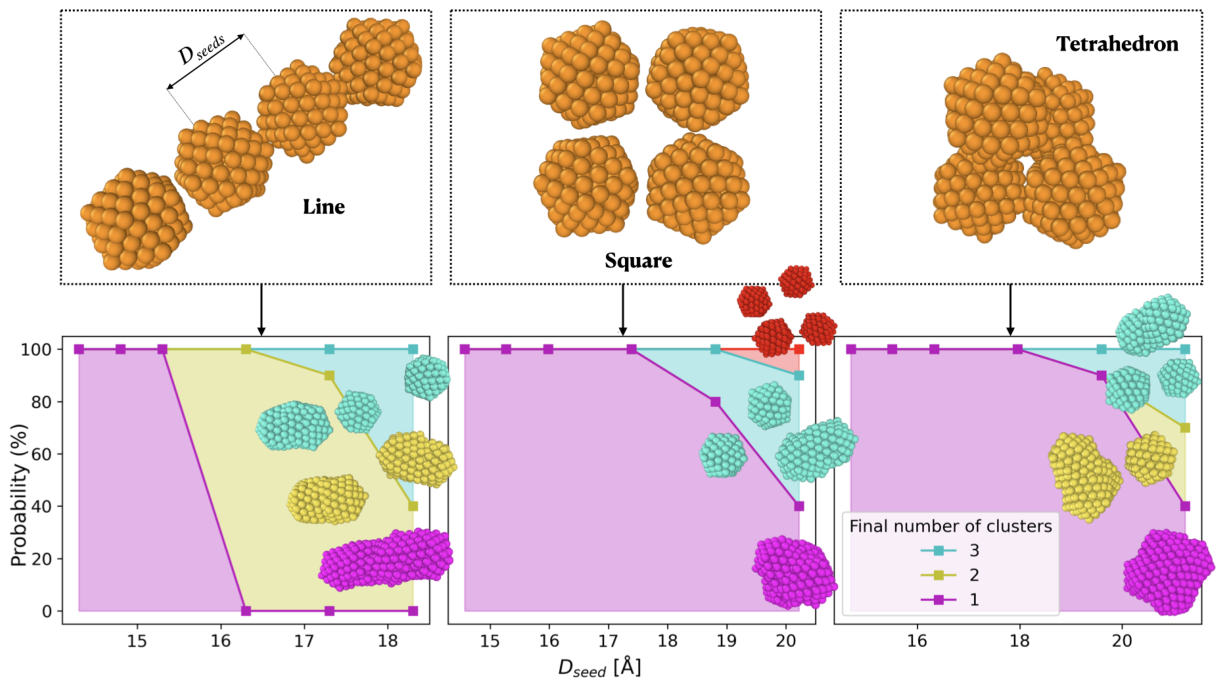
Figure 5.
PDDFs profiles for the MNP architectures obtained after 10 ns of simulation with different sintering geometries at 300 K (left) and 600 K (right). Solid lines and shaded areas represent the averages and standard deviations across multiple runs, respectively. The red and green lines represent the Line and Square geometries, respectively, while Tetrahedron sintering is in blue.
Figure 5.
PDDFs profiles for the MNP architectures obtained after 10 ns of simulation with different sintering geometries at 300 K (left) and 600 K (right). Solid lines and shaded areas represent the averages and standard deviations across multiple runs, respectively. The red and green lines represent the Line and Square geometries, respectively, while Tetrahedron sintering is in blue.
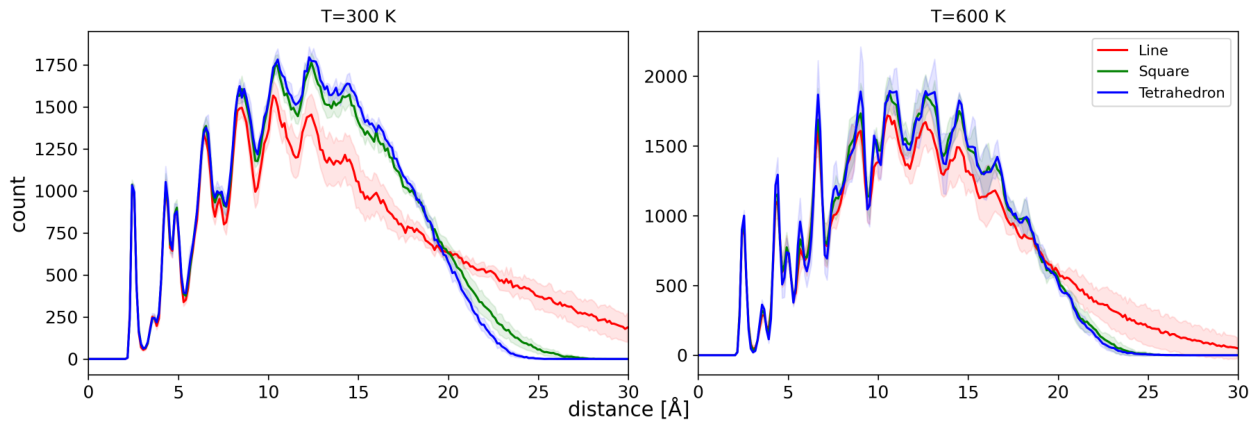
Figure 6.
Top row: relative shape anisotropy as a function of simulation time for different sintering geometries at 300 K (blue) and 600K (red). Bottom row: per-seed gyration radius variation at T=300 K. Final simulation snapshots with per-seed colour-coded atoms to highlight the merging and atoms diffusion among the seeds.
Figure 6.
Top row: relative shape anisotropy as a function of simulation time for different sintering geometries at 300 K (blue) and 600K (red). Bottom row: per-seed gyration radius variation at T=300 K. Final simulation snapshots with per-seed colour-coded atoms to highlight the merging and atoms diffusion among the seeds.
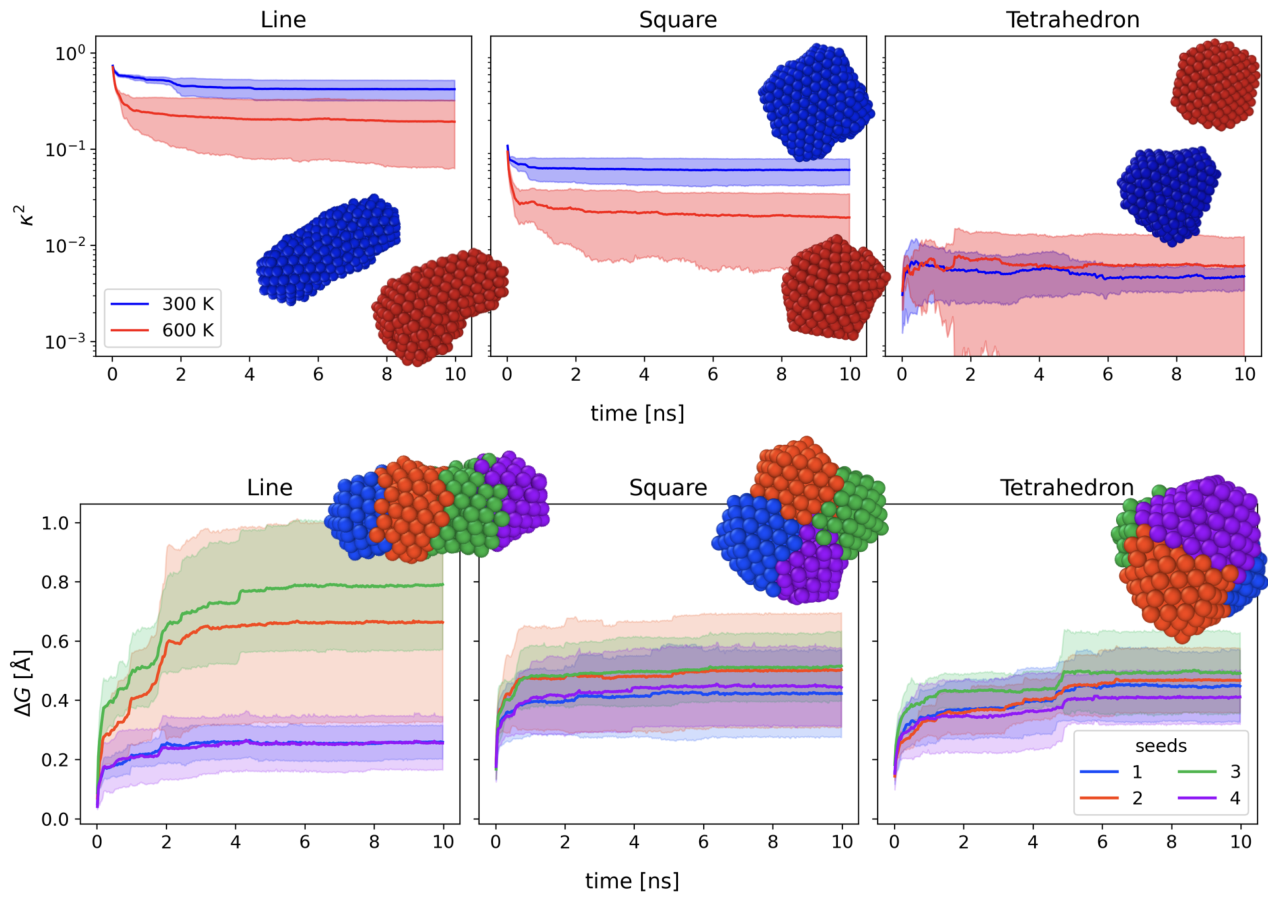
Figure 7.
Time evolution of the number of specific CNA patterns at different temperatures and for different sintering geometries. a) [12(4,2,1)] signatures, corresponding to bulk fcc, b) [6(4,2,1), 6x(4,2,2)] signatures corresponding to twinning plane environments, c) [12(5,5,5)] signatures, corresponding to Ih-centre environments, d) [2(5,5,5), 10(4,2,2)] signatures, corresponding to 5-fold symmetry axes environments. Full lines and shaded regions represent the averages and standard deviations across simulations, respectively.
Figure 7.
Time evolution of the number of specific CNA patterns at different temperatures and for different sintering geometries. a) [12(4,2,1)] signatures, corresponding to bulk fcc, b) [6(4,2,1), 6x(4,2,2)] signatures corresponding to twinning plane environments, c) [12(5,5,5)] signatures, corresponding to Ih-centre environments, d) [2(5,5,5), 10(4,2,2)] signatures, corresponding to 5-fold symmetry axes environments. Full lines and shaded regions represent the averages and standard deviations across simulations, respectively.
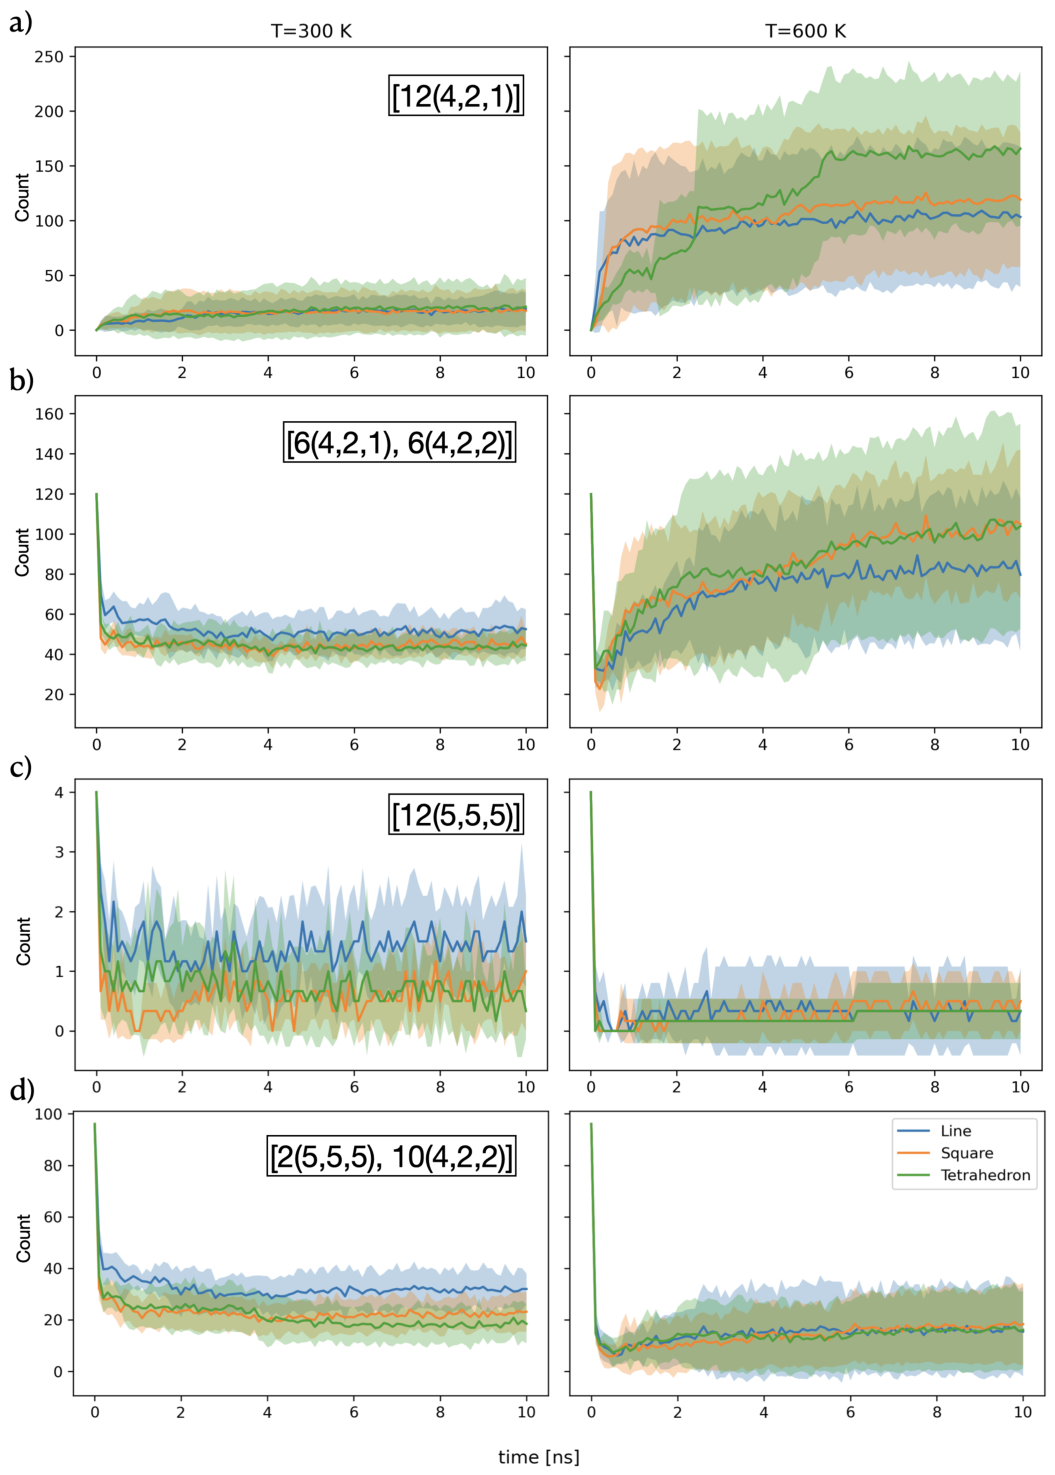
Table 1.
NPGrowth-related dictionary adopted in this work.
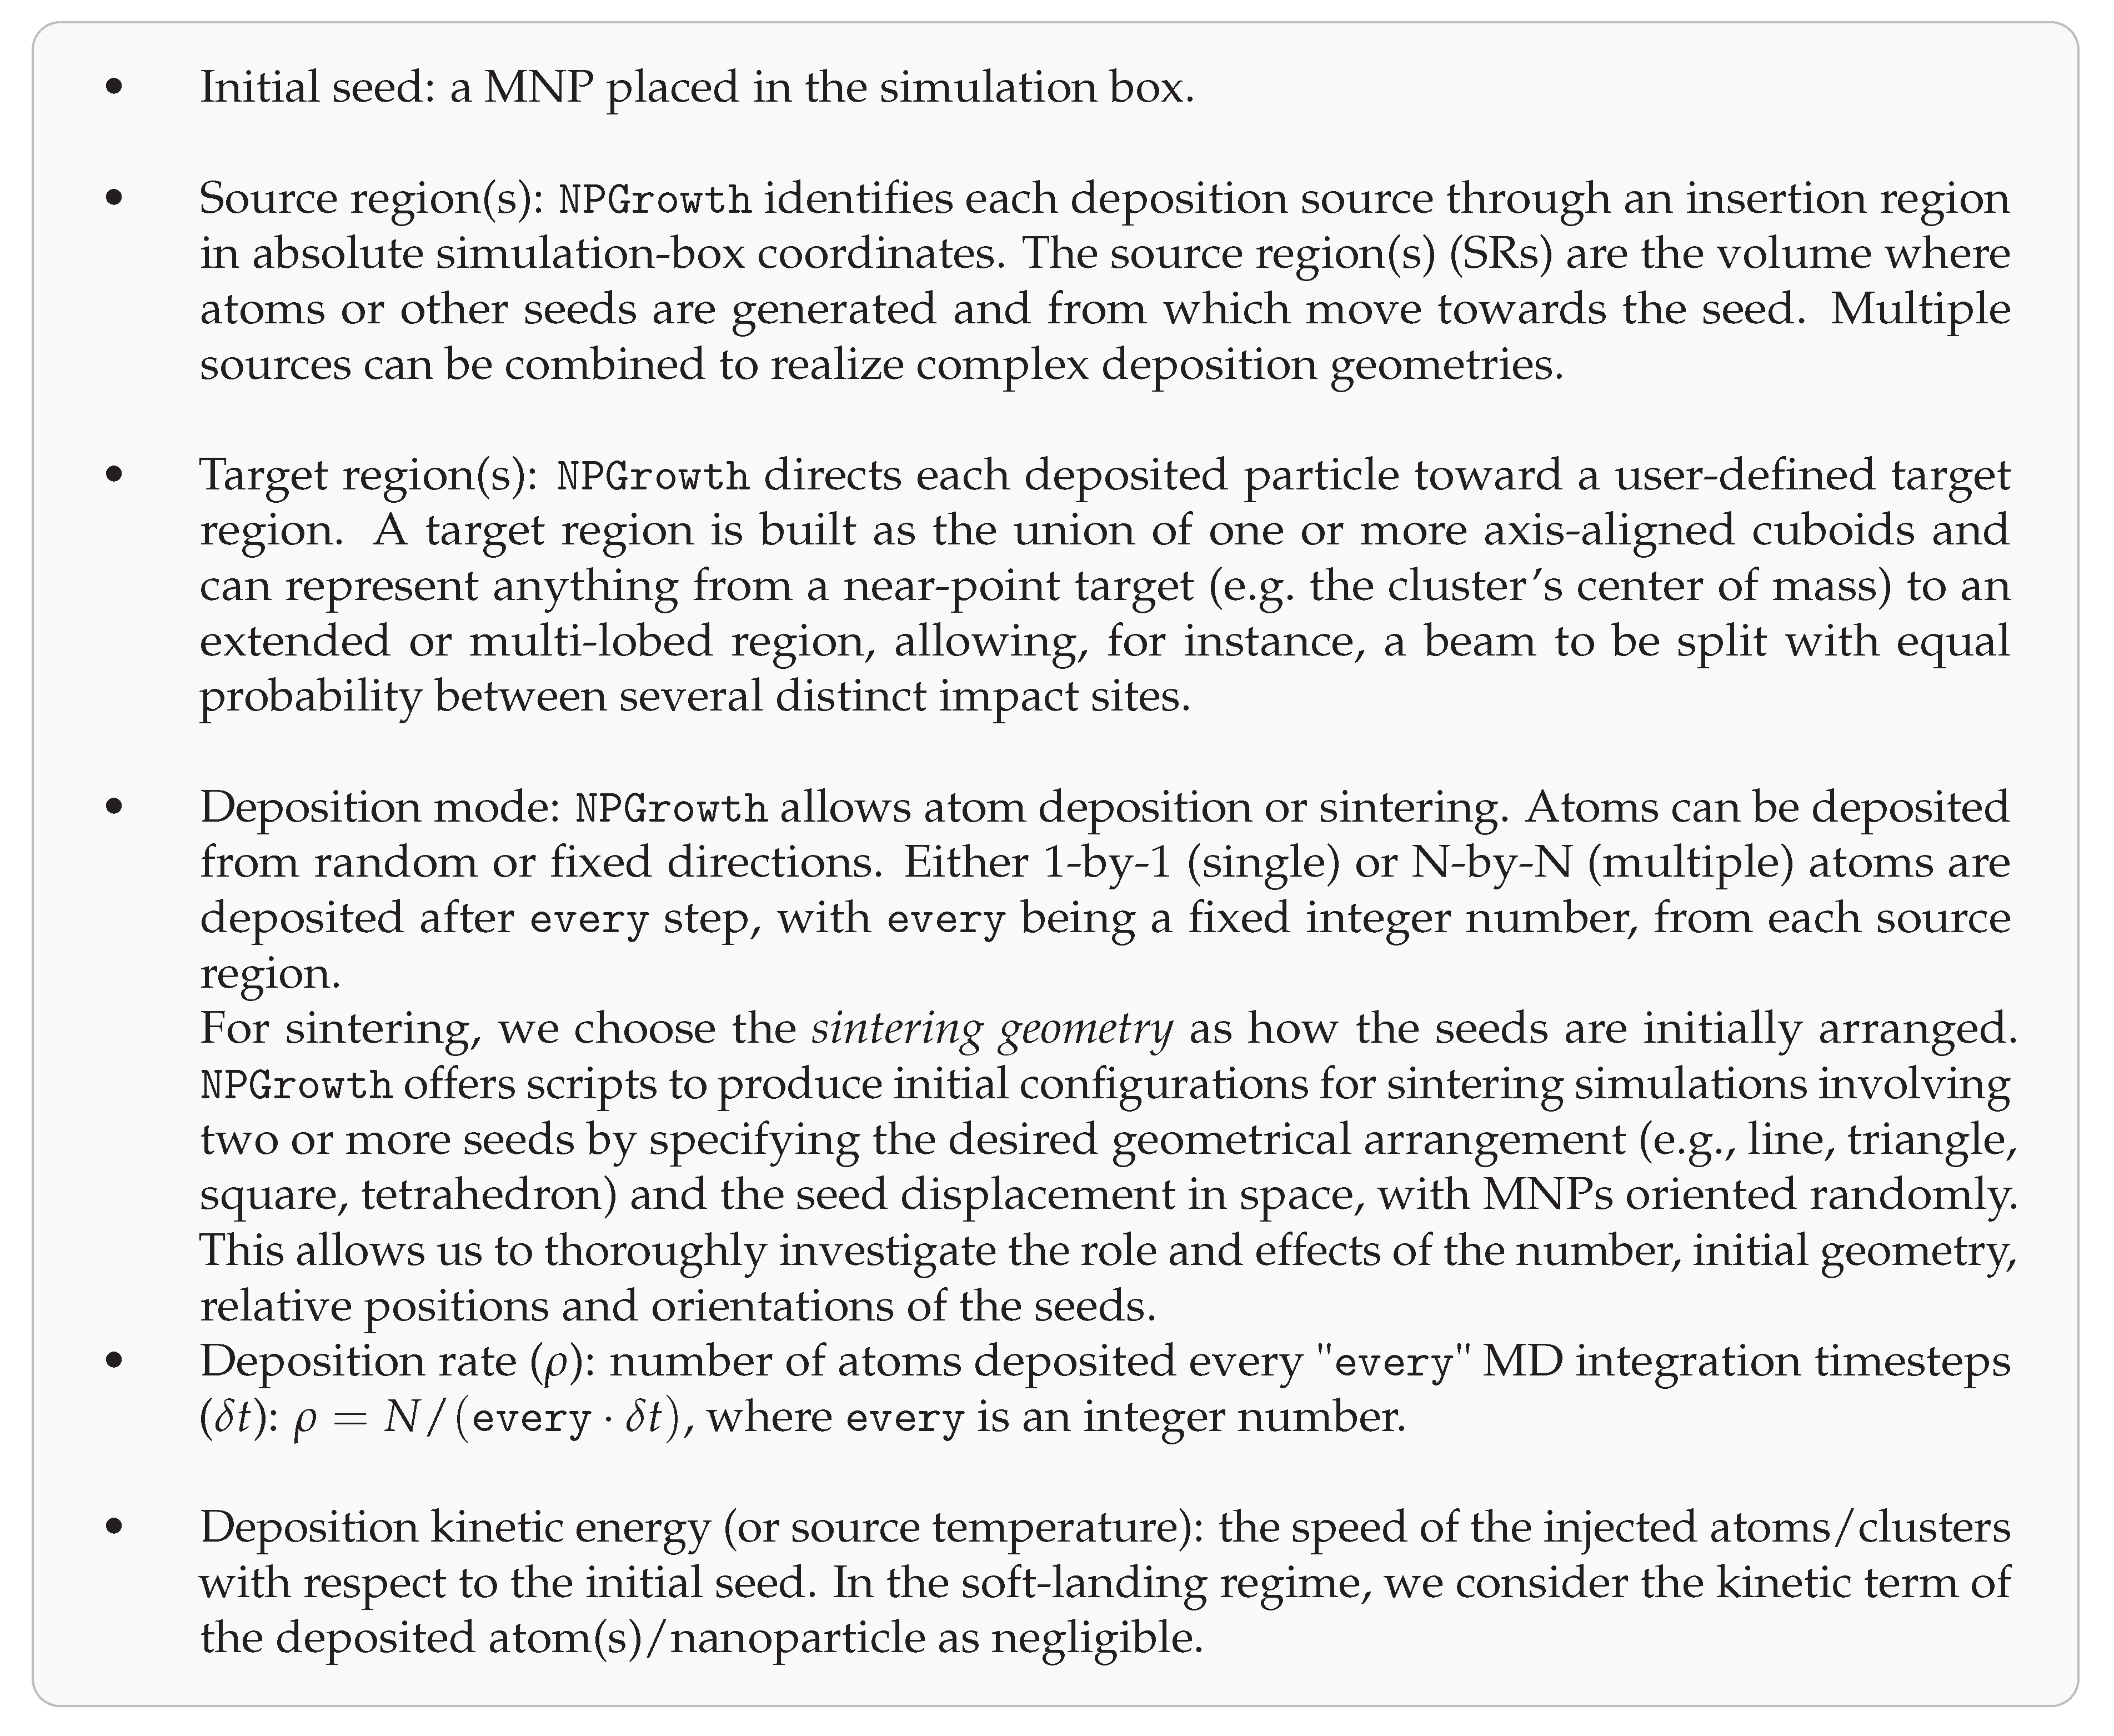 |
Table 2.
NPGrowth examples and relative settings, definition of the initial seed, and following pySNOW characterization. the last column reports the name given to easily identified the final structures. The * highlights cases where different names are assigned although similar shape descriptors because the CNA and aGCN distributions differ, see Figure 3.
Table 2.
NPGrowth examples and relative settings, definition of the initial seed, and following pySNOW characterization. the last column reports the name given to easily identified the final structures. The * highlights cases where different names are assigned although similar shape descriptors because the CNA and aGCN distributions differ, see Figure 3.
| NPGrowth set-up | Initial seed | N | f | Shape identification | Structural taxonomy | Name | ||
|---|---|---|---|---|---|---|---|---|
| 1-by-1 random | ||||||||
| from 100 Å seed-centered cubic SR; | ||||||||
| CoM-target; | Cb4361 | 9761 | 3 | Compact-spheroid | FCC | Concave Cb | ||
| 6-by-6 | ||||||||
| from 6 fixed SRs at 310 Å and normal to the initial cube facets; | ||||||||
| CoM-target; | Cb4361 | 9761 | Branched | FCC | Spike | |||
| 8-by-8 | ||||||||
| from 8 fixed SRs at 40 Åfrom CoM, normal to (111) facets; | ||||||||
| CoM-target; | TO201 | 465 | Compact-oblate | FCC | Onigiri * | |||
| 5-by-5 | ||||||||
| from 5 fixed SRs lying on a xy plane at 40 Åfrom CoM; | ||||||||
| CoM-target; | TO586 | 856 | Compact-oblate | FCC | Star * | |||
| Sintering line geometry, T=300K | four Ih147 | 588 | 2.3 | 0.58 | Compact-prolate | Poly-Ih | Elongated | |
| Sintering tetrahedron geometry, T=600 K | four Ih147 | 588 | 2.83 | 0.70 | Compact-spheroid | Dh | Dh |
Disclaimer/Publisher’s Note: The statements, opinions and data contained in all publications are solely those of the individual author(s) and contributor(s) and not of MDPI and/or the editor(s). MDPI and/or the editor(s) disclaim responsibility for any injury to people or property resulting from any ideas, methods, instructions or products referred to in the content. |
© 2026 by the authors. Licensee MDPI, Basel, Switzerland. This article is an open access article distributed under the terms and conditions of the Creative Commons Attribution (CC BY) license (http://creativecommons.org/licenses/by/4.0/).
Copyright: This open access article is published under a Creative Commons CC BY 4.0 license, which permit the free download, distribution, and reuse, provided that the author and preprint are cited in any reuse.