

Submitted:
21 September 2026
Posted:
22 September 2026
You are already at the latest version
Abstract
Taro (Colocasia esculenta) is a root crop that supports the livelihoods and food security of millions of people globally. Its production is severely constrained by taro leaf blight (TLB), caused by the aggressive oomycete Phytophthora colocasiae, which can inflict major losses in leaf and corm yield. This review synthesizes current knowledge of the global spread and economic impact of TLB, and then examines the limits of conventional breeding in the face of TLB. It evaluates metagenomics to identify disease-suppressive communities within plant-associated microbiomes, and metabolomics to resolve defense-related compounds and pathways. The review further establishes phenomics as the field-scale bridge between molecular variation and breeding decisions. Red, Green and Blue (RGB), multispectral, hyperspectral, thermal, and three-dimensional sensing can provide repeatable measurements of TLB lesion development, canopy physiology, structural damage, and yield-associated responses, while machine-learning models can transform these measurements into resistance scores and disease-progress traits. Evidence from taro and analogous crop–Phytophthora pathosystems is used to define appropriate platforms, sensor combinations, analytical methods, and validation requirements. Finally, we propose an integrated phenomics, metagenomics, genomics, and metabolomics framework for predicting durable TLB resistance and validating biomarkers across environments. This framework offers a practical pathway for accelerating resistance breeding while reducing dependence on subjective visual scoring and chemical disease control.
Keywords:
taro leaf blight
; phenomics
; metagenomics
; metabolomics
; machine learning
; disease resistance breeding
1. Introduction
The global population reached approximately 8.2 billion in 2024 and is projected to rise to about 9.7 billion by 2050 (United Nations 2024). This continued growth intensifies one of humanity’s most pressing challenges: ensuring adequate food supply for all. The issue is further complicated by the interaction of multiple constraints, including finite natural resources, environmental degradation, persistent global inequalities, and climate change (IPCC 2023). Climate change, in particular, is increasingly undermining agricultural productivity through elevated temperatures, altered rainfall patterns, more frequent and severe droughts and floods, soil erosion, declining soil fertility, heightened pest and disease pressure, and accelerated biodiversity loss (Amoah et al. 2024). Together, these pressures underscore the urgent need to breed and deploy climate-resilient crops, such as taro, that can sustain productivity under changing environmental conditions and contribute to future food security.
Taro (Colocasia esculenta) is a perennial, monocotyledonous, herbaceous corm crop of global socio-economic and nutritional significance. It is widely cultivated and consumed across tropical and subtropical regions, where it contributes to food and livelihood security (Wang et al. 2020; FAOSTAT 2024). Taro sold at market also provides income and livelihood support for small-scale farmers (Woldekiros 2022). Unlike many other crops, taro additionally yields broad leaves, robust petioles, and flowers that are prepared as vegetables rich in vitamins, fiber, and protein (Fufa et al. 2023). The corm is the most widely consumed part and is rich in carbohydrates, micro and macronutrients (Fufa et al. 2021). Global taro production is estimated at 18.21 million tonnes from 2.43 million hectares, with most output coming from West Africa (10.64 million tonnes), particularly Nigeria and Ghana (FAOSTAT 2024).
Taro production, like that of many crops, is constrained by both biotic and abiotic factors. Among the biotic constraints, more than 20 pathogens have been reported to infect taro across nearly all taro-growing regions (Ooka 1990; Kohler et al. 1997). Of these, TLB, caused by Phytophthora colocasiae Raciborski, is the most economically important disease. It causes severe epidemics that can result in up to 95% loss of leaf yield, a consequent loss of corm yield of up to 50%, and substantial post-harvest corm decay, thereby threatening food security and farmers’ livelihoods (Singh et al. 2012).
TLB was first described by Raciborski following its occurrence on taro in Java, Indonesia, in 1900 (Raciborski 1900; Packard 1975). Since its initial discovery, the disease has spread from Java to virtually all major taro-growing regions worldwide through the movement of infected planting material, aided by favorable environmental conditions (Trujillo 1967). The pathogen then dispersed throughout the Pacific along three principal routes: the North, Central, and South Pacific. Along the northern route, the disease spread from Java to Taiwan, the Philippines, Guam, Hawaiʻi, China, and Japan, among other countries (Butler and Kulkarni 1913; Trujillo 1967; Zhang et al. 1994; Fullerton et al. 2000; Brunt et al. 2001). Through the Central Pacific route, P. colocasiae reached islands including the Federated States of Micronesia and the Marshall Islands (Liloqula et al. 1996). The pathogen also spread into the South Pacific via Papua New Guinea before extending to Australia, the Solomon Islands, and Fiji, where it was first reported in 1948 by Parham (1949). Beyond the Pacific, TLB reached the Caribbean and Africa. In the Caribbean, the disease has been reported in the Dominican Republic, while in Africa it has been documented in Equatorial Guinea, Nigeria, Ethiopia, Cameroon, Ghana, Burundi, Madagascar, Rwanda, Benin and the Central African Republic (Bandyopadhyay et al. 2011; Oladimeji et al. 2022; Singh et al. 2012; Paudel et al. 2023; Quenum 2023).
Historically, conventional breeding has enabled the development of resistant germplasm and the release of improved cultivars in several countries. Nonetheless, resistance to TLB is a quantitatively inherited trait influenced by multiple genes, environmental factors, and genotype × environment interactions. Furthermore, rapidly evolving P. colocasiae populations can overcome resistance conferred by a small number of resistance genes, making conventional phenotypic selection alone insufficient for achieving durable resistance (Donkor et al. 2023). Recent genome-wide association studies (GWAS) on taro have identified significant single nucleotide polymorphisms (SNPs) and candidate genes associated with TLB resistance, providing valuable genomic resources for marker-assisted selection and genomic selection (Jiwuba et al. 2026). However, host genetics alone cannot fully explain the mechanisms underlying disease resistance, emphasizing the need for innovative breeding strategies that integrate additional layers of biological information through metagenomics, metabolomics, and phenomics (Nyadanu et al. 2025).
Metagenomics is an approach for understanding the composition and functional potential of microbial communities associated with the plant rhizosphere and phyllosphere. Microbiome-informed breeding could improve pathogen resistance, as plants differ genetically in their ability to recruit beneficial microbes through root architecture and root exudates. Integrating these microbiome-associated traits into breeding programs could therefore enable selection of genotypes capable of recruiting and sustaining disease-suppressive microbial communities (Berg et al. 2020; Nyadanu et al. 2025). Complementing metagenomics, metabolomics provides comprehensive profiling of small-molecule metabolites involved in plant defense. Such analyses can identify resistance-associated biomarkers that may be incorporated into breeding pipelines alongside genomic markers, improving selection accuracy while reducing breeding cycle duration. These multi-omics-assisted breeding approaches could thus bolster the stability of resistance across environments, reduce reliance on chemical disease control, and contribute to sustainable taro production and global food security (Berg et al. 2020; Nyadanu et al. 2025). Their breeding value, however, depends on accurate and scalable measurement of disease expression. Phenomics addresses this bottleneck by converting RGB, spectral, thermal, and structural observations into quantitative traits such as lesion burden, disease progress, canopy temperature, pigment status, and recovery (Tanner et al. 2022).
Integrating these phenotypes with genomic, metagenomic, metabolomic, and environmental information could improve selection accuracy, separate resistance from disease escape, and reveal markers that remain predictive across environments (Rohart et al. 2017; Yoosefzadeh-Najafabadi et al. 2021). Despite increasing evidence that genetic, microbial, biochemical and phenotypic factors contribute to TLB resistance in taro, these dimensions have largely been investigated independently. Consequently, it remains unclear how host genetic variation, rhizosphere microbial communities and metabolite profiles interact to produce measurable resistance phenotypes and how these relationships can be translated into practical breeding strategies. This critical narrative review, therefore, is the first of its kind to propose an integrated multi-omics and phenomics framework for linking genotype, microbiome, metabolome and disease phenotype to accelerate the identification and validation of biomarkers and breeding targets for durable TLB resistance. It then examines the emergence and impact of TLB, the limitations of conventional breeding relative to it.
1.1. Literature Selection and Evidence Classification
The review leveraged literature search engines encompassing Scopus, Web of Science and Google Scholar while some materials were also accessed via ResearchGate. The keywords for sourcing the literature include “taro leaf blight,” “Phytophthora colocasiae,” “taro resistance,” “taro breeding,” “phenomics,” “genomics,” “GWAS,” “metagenomics,” “rhizosphere microbiome,” “metabolomics,” “induced systemic resistance,” and “multi-omics.” Relevant publications were retrieved and screened based on their relevance to TLB resistance, host–pathogen interactions, disease phenotyping, breeding, microbial-mediated disease suppression, and omics-based approaches. Priority was given to primary experimental studies in the taro–P. colocasiae pathosystem, while studies from related Phytophthora–crop and plant–microbe systems were included where taro-specific evidence was limited. The literature reviewed ranged from the earliest documented reference to TLB by Raciborski (1900) to recent studies published in 2026.
1.2. Evidence Classification Used Throughout the Review
Level I — Direct taro evidence: demonstrated experimentally in the Colocasia esculenta–Phytophthora colocasiae system. Level II — Closely analogous evidence: evidence from another Phytophthora–crop interaction or a closely related root, tuber, or banana pathosystem. Level III — General biological evidence: evidence from unrelated host–pathogen or plant–microbe systems that informs methodology or mechanism. Level IV — Hypothesis/proposed application: a proposed breeding application that has not yet been experimentally validated in taro. Labels are applied to major evidence transitions rather than every factual sentence.
2. Moving Beyond Conventional Breeding to Accelerated Taro Improvement
Despite taro’s fundamental role in food security, its extensive geographic cultivation, and its considerable economic value, relatively few genetically improved cultivars with TLB resistance have reached farmers’ fields (Lebot and Ivančič, 2022). This is largely due to poor and unpredictable flowering, high heterozygosity with unpredictable segregation, complex cytogenetics, weak relationships between seedling and clonal-generation traits, and limited funding. The crop also has an uneven genetic base, with limited diversity in many African and Pacific populations, making access to diverse germplasm challenging. TLB resistance is quantitative and polygenic, with multiple Quantitative Trait Loci (QTL) and Single Nucleotide Polymorphisms (SNPs) contributing to resistance rather than a single major gene. Resistance is further influenced by genotype × environment interactions, variation within P. colocasiae populations, and nascent molecular tools (Lebot and Ivančič, 2022; Lebot et al. 2023). These challenges highlight the need for integrated approaches to improve the efficiency of resistance breeding and selection.
2.1. Metagenomics and Its Application
Handelsman et al. (1998) coined the term “metagenomics” to describe the cloning and functional screening of DNA extracted directly from soil, bypassing the need to culture individual microorganisms. This marked a deliberate break from a century of culture-dependent microbiology: most environmental and plant-associated microorganisms, including most rhizosphere bacteria, cannot be grown under standard laboratory conditions (Nwachukwu and Babalola 2022). Table 1 compares the two available sequencing strategies, and Figure 1 outlines the standard metagenomic workflow.
2.1.1. The Soil Microbiome as a Reservoir of Natural Disease Suppression
Level III (General biological evidence). Soils vary greatly in how readily a pathogen causes disease, and this variation is often microbial rather than physicochemical in origin. In suppressive soils, pathogens either fail to establish, establish without causing economically significant disease, or cause disease that declines over time despite continued pathogen persistence. This suppression is mediated by the biological activity of the resident soil microbiome rather than by the absence of the pathogen itself. This pattern is documented across fungal, oomycete, bacterial, and nematode pathogens, and increasingly attributed to specific microbial consortia rather than a single organism (Gómez Expósito et al. 2017). Suppressive soils behave analogously to an adaptive immune response: suppressiveness can take time to develop, shows specificity toward particular pathogens, and in some cases exhibits a microbial “memory” of prior pathogen exposure (Gómez Expósito et al. 2017). Because this capacity is transferable, adding suppressive soil to a conducive soil confers at least partial protection. Thus, suppressive soils are a rich and practical resource for discovering novel biocontrol organisms.
Plants are not passive beneficiaries of this suppressive capacity; they actively assemble it. In response to pathogen attack, plants modify root exudation to recruit and enrich protective microbial taxa, with the immune system screening which microbes are permitted to colonize the root (Spooren et al. 2024) (Figure 2). This reframes the rhizosphere as a dynamic, host-influenced defense structure, one that could, in principle, be characterized, monitored, and engineered for a crop such as taro facing a single, well-defined biotic threat (P. colocasiae).
3. Comparative Evidence from Other Root Tuber and Banana (RTB) Crops
Level II (Closely analogous evidence). Given the scarcity of dedicated metagenomic studies on the soil and phyllosphere microbiomes of taro, the strongest evidence for the potential of these approaches comes from analogous investigations in vegetatively propagated tropical root and tuber crops (Table 2). In cassava, culture-independent 16S rDNA sequencing of fourteen genotypes revealed markedly greater bacterial richness in the rhizosphere (36 phyla, 906 genera) than in the tuber endosphere (21 phyla, 310 genera), with consistent enrichment of Lactococcus and Bacillus, both linked to resistance against bacterial blight and root rot (Ha et al. 2021). In a complementary cassava study, a microbiome-wide association study integrating 16S/ITS amplicon profiling with shotgun metagenomic sequencing across ten cassava varieties identified a rhizosphere Lactococcus sp. whose nisin production was significantly associated with resistance to cassava bacterial blight (Xanthomonas axonopodis pv. manihotis). In vitro and in vivo studies confirmed that nisin not only inhibited the pathogen directly but also activated the plant’s immune response (Zhang et al. 2021). Although developed in cassava, this study provides a methodological framework for integrating metagenomic profiling, functional characterization, and experimental validation in future investigations of the taro–P. colocasiae pathosystem.
Level II (Closely analogous evidence). In banana, another vegetatively propagated staple frequently intercropped with taro and threatened by the soilborne pathogen Fusarium oxysporum f. sp. cubense, rhizosphere profiling using 16S rRNA amplicon sequencing showed that community composition responds measurably to seasonal edaphoclimatic conditions and crop management (De la Torre-González et al. 2021). This finding suggests that a beneficial consortium identified for one tropical root/tuber crop is likely to be site- and management-dependent rather than universally transferable.
4. Identification of Beneficial Microbial Consortia
Level III (General biological evidence). In nature, microbial communities act collectively, with different microorganisms performing complementary functions that maintain community stability and activity. The literature converges on two broad, complementary strategies for assembling an effective consortium: top-down and bottom-up. The top-down approach starts with a natural microbial community that already performs a useful function, such as a disease-suppressive soil community. Researchers then use sequencing and functional analyses to identify the microorganisms responsible for disease suppression and reconstruct a smaller, well-defined version of the community that can be tested under controlled conditions. In contrast, the bottom-up approach begins with individual microbial strains that have already been isolated and tested for beneficial traits (Figure 3). These strains are selected based on genomic information, gene expression, or laboratory tests showing characteristics such as pathogen antagonism, effective plant colonization, or plant growth promotion. The selected strains are then combined step by step into a synthetic community, with their interactions and collective performance evaluated as the consortium is assembled (Shayanthan et al. 2022).
4.1. Selection Criteria and Screening Pipelines
Level III (General biological evidence). Regardless of the starting strategy, selecting strains for a candidate consortium generally proceeds through a staged screening pipeline (Table 3): an initial, high-throughput assessment of individual strain traits relevant to the target function; pairwise or small-group compatibility testing; and finally validation in planta, first under controlled greenhouse conditions and subsequently under field conditions, given the well-documented tendency for consortium performance to degrade when moving from controlled to open, competitive field environments (Marín et al. 2021; Folorunso et al. 2026). This pipeline is increasingly accelerated by high-throughput culturing methods, multi-omics profiling, metabolic modeling of predicted strain interactions, and adaptive laboratory evolution, allowing researchers to move beyond trial-and-error combination testing toward rationally engineered, ecologically balanced consortium design (Folorunso et al. 2026).
4.2. Applying Learnings from Other Crops to Taro: Revisiting Existing Evidence
Level I (Direct taro evidence). Kelbessa et al. (2022) screened seven beneficial bacterial strains (six Serratia isolates and one Pseudomonas fluorescens isolate) for multiple plant growth-promoting and disease-suppressive traits, including extracellular enzyme production (chitinase, protease, cellulase, and amylase), IAA synthesis, siderophore production, and phosphate solubilization. The researchers then tested each strain alone and in sixteen different microbial combinations. Performance was evaluated systematically using laboratory assays, detached-leaf tests, and greenhouse experiments (Kelbessa et al. 2022). Similar to findings in wheat, not all combinations of microbes outperformed individual strains. However, some consortia significantly reduced TLB, achieving 88.75–99.37% disease reduction in greenhouse trials, a range the study reports for effective strains applied both singly and in combination (Table 4). In addition, some strains appeared to limit the pathogen’s spread beyond the initial infection site, suggesting they activated the plant’s defense system, whereas other strains directly inhibited pathogen growth.
Level I (Direct taro evidence). Overall, the broader consortium literature and the available taro evidence converge on the same conclusion: although the study by Kelbessa et al. (2022) produced encouraging results, it is only an initial step and does not yet constitute a biocontrol product ready for field use. Further research is needed to follow the stepwise framework outlined in Table 3. This should include screening a broader collection of beneficial microorganisms obtained through systematic metagenomic studies and comparing the performance of individual strains with carefully designed microbial consortia, as highlighted in the study on wheat (Yin et al. 2022) (Table 4). It should also validate promising consortia through laboratory, greenhouse, and multi-location field trials in the major taro-growing regions affected by TLB. In addition, future studies should identify the genes and metabolic pathways responsible for the beneficial activities of consortium members rather than relying only on phenotypic characterization.
5. Functional Metagenomics Across the Taro–P. colocasiae System
Level I (Direct taro evidence). Functional metagenomics offers a two-sided opportunity for the TLB system. On the pathogen side, the RXLR and CRN effector repertoires already annotated in the P. colocasiae genome (Vetukuri et al. 2018; Wang et al. 2021) are known molecular targets that any protective microbial consortium’s functional gene complement must overcome or circumvent to succeed in the field. On the beneficial-microbe side, several functional traits (chitinase, protease, cellulase, and amylase production, siderophore formation, phosphate solubilization, and indole acetic acid production) have already been documented in taro-associated strains by culture-based assays (Kelbessa et al. 2022), and these same trait classes can be recovered from sequence data through KEGG, COG, and CAZy annotation and BGC mining (Table 5). Applying functional metagenomics to taro’s soil and phyllosphere communities would therefore screen an entire microbial community for these functional gene classes in a single sequencing experiment, expanding the pool of candidate consortium members well beyond what the single existing culture-based taro study could achieve.
5.1. From Functional Potential to Functional Activity
Level III (General biological evidence). Functional metagenomics, whether based on prediction or direct shotgun sequencing, shows the genetic potential of a microbial community. However, the presence of a gene does not necessarily mean that it is active or that its products are being produced under natural field conditions. Determining which genes are actively functioning requires additional approaches: metatranscriptomics identifies genes that are being actively expressed, while metabolomics measures the small molecules produced through microbial and plant metabolism (Figure 4). Because the chemical signals exchanged between the plant, its microbiome, and the pathogen are central to these interactions, metabolomics provides particularly important insights.
6. Metabolomics and Its Application
Level III (General biological evidence). Metabolomics is the systems-level analysis of the small-molecule metabolites in a biological sample, including sugars, amino acids, organic acids, lipids, and secondary metabolites such as alkaloids, flavonoids, and phenolics. Unlike genomics or transcriptomics, it captures the functional endpoints most closely linked to the observable phenotype (Manickam et al. 2023). Where functional metagenomics characterizes genetic potential, metabolomics characterizes biochemistry: which molecules are present, and at what concentration, at a given moment. It is therefore an essential complement to, not a substitute for, genomic and metagenomic approaches, and it is the layer of information needed to close the “genes-to-function” gap. The two complementary strategies used in metabolomics studies, the four major analytical platforms, and the overall workflow are summarized in Table 6, Table 7, and Figure 5, respectively.
6.1. Metabolic Responses of Taro to Phytophthora colocasiae Infection
Like most oomycetes in its genus, Phytophthora colocasiae is hemibiotrophic, passing through an initial biotrophic phase, during which host cells remain alive and metabolically active around the infection site, before a necrotrophic phase in which host tissue is killed and colonized (Figure 6) (Kelbessa et al. 2022). Taro’s metabolic response cannot be interpreted independently of this two-phase biology, because the host’s biochemical strategy during the biotrophic window (surveillance, signaling, and restrained defense activation) differs qualitatively from its strategy once necrotrophy begins, when rapid, localized biochemical “scorched-earth” responses become the dominant and often decisive form of resistance (Mandy et al. 2009).
6.2. The Hypersensitive Response as the Central Organizing Event
Level I (Direct taro evidence). The most thoroughly documented metabolic response of taro to P. colocasiae infection is the hypersensitive response (HR), a localized, genetically programmed cell-death mechanism that restricts pathogen development around the infection site (Table 8). Mandy et al. (2009) showed that resistant genotypes developed HR-associated cellular changes within 48–72 h of inoculation, whereas HR was delayed in susceptible cultivars and failed to prevent hyphal spread, resulting in extensive sporulation and tissue collapse. Consistent with this, Sahoo et al. (2009) reported substantially greater increases in total phenolics (52.7–68.0%) and polyphenol oxidase activity in resistant genotypes, while Devi et al. (2020) demonstrated genotype-dependent activation of the ascorbate–glutathione antioxidant pathway. Mishra et al. (2009, 2010) further showed that P. colocasiae elicitors rapidly induced HR-like lesions and defense-related enzymes, whereas Sharma et al. (2009) identified several defense-associated genes, including putative resistance genes, transcription factors, pathogenesis-related genes, and lipid-transfer proteins, that were more highly expressed in resistant genotypes. More recently, Djeuani et al. (2023) demonstrated that arbuscular mycorrhizal fungi reduced TLB severity by 48.3–55.7% while modulating antioxidant responses, suggesting that both host biochemical defenses and beneficial microbial interactions contribute to TLB resistance.
6.3. Comparative Evidence from the Potato–Phytophthora infestans Pathosystem
Level II (Closely analogous evidence). A striking gap in the taro literature is the near-total absence of untargeted LC-MS or GC-MS metabolomic profiling of the taro–P. colocasiae interaction: the biochemical evidence reviewed above derives almost entirely from targeted enzymatic and colorimetric assays. The most directly relevant metabolomic precedent instead comes from potato and its congeneric pathogen Phytophthora infestans, the causal agent of late blight. Zhu et al. (2022) profiled compatible and incompatible potato–P. infestans interactions using comparative metabolomics and found that incompatible (resistant) interactions were characterized by earlier, more pronounced accumulation of phenylpropanoid and flavonoid intermediates, alongside a shift in primary carbon and amino acid metabolism away from growth-associated pathways and toward defense-associated biosynthesis. Given the close taxonomic relationship between the two oomycete pathogens and their shared reliance on phenylpropanoid-based defense, this comparative evidence provides a reasonable basis for hypothesizing that untargeted metabolomic profiling would reveal a broadly analogous, taro-specific metabolic signature.
6.4. Microbiome-Modulated Antioxidant Response
Level I (Direct taro evidence). A field and greenhouse study carried out by Djeuani et al. (2023) offers a directly relevant extension to the biochemical evidence and addresses a gap in the taro-specific literature reviewed in this section. Working with three Cameroonian taro cultivars (Banlah, Macoumba, and Ekwanfre) challenged with P. colocasiae under controlled artificial inoculation, the researchers showed that prior colonization by arbuscular mycorrhizal fungi (Gigaspora margarita and Acaulospora tuberculata) reduced disease severity by 48.3–55.7% at 20 days post-inoculation relative to non-mycorrhizal infected plants, and that this protection coincided with measurable modulation of the same antioxidant system: catalase, ascorbate peroxidase, and guaiacol peroxidase activity, together with hydrogen peroxide accumulation, all rose sharply upon infection but were partly attenuated in previously mycorrhizal plants (Djeuani et al. 2023). This finding appears to be the first demonstration in taro that a microbiome-mediated intervention converges on the same host biochemical pathway already characterized for genetic resistance, a convergence that merits further study.
6.5. Defense-Related Metabolites and Biomarkers Associated with TLB Resistance
Level I (Direct taro evidence). Total phenolic content and polyphenol oxidase (PPO) activity remain the most extensively validated candidate biomarkers for TLB resistance to date. Sahoo et al. (2009) recorded phenolic increases of 52.7% to 68.0% following inoculation across the resistant genotypes (DP-25, Duradim and Jhankri), against 11.5% in the susceptible genotype (N-118), with a corresponding genotype-stratified rise in PPO activity and a distinct isoenzyme banding pattern resolved by native-PAGE (Table 9).
Level I (Direct taro evidence). This study reported a negative correlation between phenolic and PPO levels and both disease incidence and yield reduction, thereby establishing the agronomic relevance of the induction and its statistical significance (Sahoo et al. 2009). The principal limitation on deploying the biomarker is assay specificity: total phenolic and colorimetric PPO assays are inexpensive and high-throughput but chemically nonspecific, meaning that a resistant-looking phenolic signal cannot distinguish which individual phenolic compounds, such as caffeic acid, ferulic acid, or coumaric acid, are functionally responsible for resistance.
6.6. A Biomarker Panel for Metabolomic Deepening and Field-Scale Validation
Level I (Direct taro evidence). The evidence reviewed in this section supports a provisional, three-tier biomarker panel for TLB resistance (Table 9). A cost-effective, high-throughput screening strategy could begin with a rapid phenolic and PPO assay for primary genotype screening, followed by a secondary assessment of the ascorbate–glutathione antioxidant enzyme system. Where resources permit, molecular markers targeting the resistance-gene and lipid transfer protein (LTP) transcripts identified by Sharma et al. (2009) could provide an additional layer of selection (Figure 7). However, field-scale validation across diverse pathogen isolates should remain the mandatory final stage before any candidate marker is adopted for breeding applications. What is still lacking is chemical specificity: knowledge of exactly which phenylpropanoid compounds drive the phenolic signal, and whether additional, currently unmeasured metabolite classes (flavonoids, oxylipins, or others well documented in other plant–Phytophthora pathosystems but not yet assayed in taro) might offer superior discriminatory power. This gap between a validated but chemically coarse biochemical panel and the finer-grained biomarkers that modern metabolomics could deliver motivates the next stage of this review’s argument: that microbial and host biomarkers need to be considered together, since it is the interaction between host biochemistry and the rhizosphere microbiome that ultimately determines whether a genetically resistant genotype expresses that resistance fully under field conditions.
7. Microbe-Derived Metabolites and Their Role in Induced Systemic Resistance
A biochemically distinct and complementary mechanism of TLB suppression is induced systemic resistance (ISR). This is a primed, whole-plant defensive state triggered not by direct microbial antagonism of the pathogen but by specific microbial metabolites that the plant’s immune system perceives as a signal to pre-activate its defenses. Pieterse et al. (2014), in a comprehensive review, characterized ISR as typically dependent on jasmonic acid and ethylene signaling rather than the salicylic acid pathway associated with pathogen-triggered systemic acquired resistance (SAR). These authors noted that ISR-eliciting mutualists, including Pseudomonas, Bacillus, and Trichoderma species, sensitize rather than directly activate plant defenses; thus, a primed plant responds faster and more strongly to a subsequent pathogen challenge without the fitness cost of constitutive defense activation. This priming is also linked to phenolic compounds and antioxidant defenses. If ISR-promoting microbes enhance the same defense responses already observed in biochemical studies, then microbiome management and host resistance complement each other by strengthening the same defense pathway through different mechanisms (Table 10).
7.1. Evidence from Biocontrol Agents Active in the Taro–P. colocasiae Pathosystem
Level I (Direct taro evidence). Kelbessa et al. (2022) screened seven bacterial strains and their pairwise combinations against P. colocasiae and observed production of protease, cellulase, amylase, lipase, and chitinase among the isolates. Although this lytic enzyme profile primarily supports a mechanism of direct pathogen antagonism, the authors suggested that it may also contribute to host-defense priming through ISR, a mechanism well documented for Pseudomonas species in other plant pathosystems but not yet confirmed in the taro–P. colocasiae interaction (Pieterse et al., 2014). Comparable evidence exists for Serratia species: Serratia plymuthica IC1270 has independently been shown to elicit ISR against leaf pathogens in rice (De Vleesschauwer et al. 2009), a result that could be tested in taro-derived Serratia strains as a direct, low-cost extension. Additionally, Nath et al. (2014) characterized 18 Trichoderma isolates representing T. asperellum, T. longibrachiatum, and T. harzianum for antagonism against P. colocasiae; 8 isolates showed more than 75% in vitro inhibition, together with glucanase production. Although the study did not investigate host immune responses, the well-established capacity of Trichoderma species to elicit ISR in other plant pathosystems (Pieterse et al. 2014) suggests that these isolates are promising candidates for future research to determine whether their protective effects in taro also involve host defense mechanisms.
7.2. Considerations for Harnessing ISR Metabolites in Taro Disease Management
Translating this evidence into practical taro disease management raises three considerations. First, because TLB is a foliar disease while most well-characterized ISR-eliciting strains are rhizosphere or root-associated organisms, the effectiveness of root-applied bioinoculants will depend on the strength and speed of long-distance systemic signaling to above-ground tissues. It also depends on how well findings transfer to taro, a monocot with distinct corm physiology, from the dicot model systems in which most ISR mechanisms have already been characterized, notably Arabidopsis and bean. Second, ISR responses already documented in other crops are genotype-dependent, indicating that the priming efficacy of a given microbial strain may not translate uniformly across genetically diverse taro germplasm and would require multi-genotype validation to develop biomarkers. Third, because ISR primes defense rather than directly activating it, its practical benefit depends on the host’s enhanced defensive readiness, making it necessary to assess seasonal P. colocasiae epidemiology.
8. Phenomics for High Throughput Screening of TLB Resistance
Level III (General biological evidence). Phenomics is the quantitative measurement of plant traits at high throughput and across biological scales. For TLB resistance breeding, its central value lies less in automated diagnosis than in converting infection and host responses into reproducible quantitative traits that can be analyzed genetically and linked to underlying biological mechanisms.
Across plant–pathogen systems, digital imaging enables non-destructive, repeated assessment of the same genotype and quantitative characterization of disease development using traits such as symptom onset, lesion number, lesion area, lesion expansion, and disease severity over time (Pavicic et al. 2021; Elliott et al. 2022; Méline et al. 2023; Anderegg et al. 2024). Compared with conventional visual end-point scoring, image-based phenotyping can improve objectivity and reproducibility while detecting subtle spatial and temporal differences in disease development that may otherwise be overlooked.
Level I (Direct taro evidence). In taro, lesion-based assays have successfully differentiated genotypes with contrasting responses to Phytophthora colocasiae. Lesion diameter or area measured approximately 4–5 days after inoculation has distinguished resistant and susceptible materials in detached-leaf and leaf-disc assays, with laboratory responses showing agreement with subsequent field performance (Brooks 2007; Tyson et al. 2015; Nath et al. 2016). More specifically, Donkor et al. (2023) demonstrated that lesion area measured five days after inoculation differentiated taro genotypes and was positively associated with field disease incidence and severity. However, because that study used a single assessment time, it supports end-point lesion measurement rather than repeated time-course phenotyping.
8.1. Platform Selection: Controlled, Ground-Based, and Aerial Systems
Level III (General biological evidence). No single platform is optimal for every stage of a taro breeding program. Controlled imaging chambers and handheld sensors provide high spatial and spectral fidelity for detached leaf assays, inoculation experiments, and mechanistic studies. They therefore suit the identification of subtle presymptomatic responses and the construction of well-labeled calibration datasets (Mahlein 2016; Tanner et al. 2022). Ground platforms, including tripods, carts, tractors, and handheld devices, operate close to the canopy and resolve individual leaves and small lesions with less mixed pixel contamination than aerial systems. They are therefore well suited to early-generation nurseries or moderate-sized field trials that require resolution at the level of the individual plant (Araus and Cairns 2014; Tanner et al. 2022).
Across crop-breeding and research phenotyping applications, UAV platforms differ in throughput, maneuverability, coverage, and spatial detail, so platform choice depends on whether the priority is large-area efficiency or high-resolution observation of smaller plots (Boon et al. 2017; Guo et al. 2021; Garg 2022; Gano et al. 2024). By inference, these capabilities make UAVs promising for repeated assessment of replicated taro trials across multiple environments. Fixed-wing UAVs suit surveys of large areas because of their greater endurance and flight efficiency, whereas multirotor systems offer greater maneuverability and stable operation at low altitude and are therefore better suited to smaller breeding trials requiring fine spatial detail (Guo et al. 2021; Gano et al. 2024). Red–green–blue (RGB) and multispectral cameras can rapidly map plot-level disease distribution, canopy cover, senescence, and missing plants, while thermal and hyperspectral payloads can capture physiological stress before complete canopy collapse (Mahlein 2016; Xie and Yang 2020; Gano et al. 2024).
8.2. Sensor Systems and Disease-Relevant Traits
Level I (Direct taro evidence). RGB imaging provides a practical operational baseline for TLB phenotyping because visible disease symptoms can be captured inexpensively and analyzed using image classification, object detection, and segmentation approaches. Nwaneto et al. (2024) evaluated multiple deep image classification architectures for early TLB detection using images collected in West Africa, and Nwaneto et al. (2025) extended this work with You Only Look Once version 8 (YOLOv8) object detection framework. For breeding applications, segmentation may be particularly informative because lesion area can be expressed relative to total leaf area and monitored repeatedly, which yields quantitative measures of disease progression rather than categorical disease presence alone (Mutka and Bart, 2015; Cockerton et al. 2019; Tanner et al. 2022).
Multispectral and hyperspectral imaging extend phenotyping beyond visible symptoms because physiological and structural changes induced by the pathogen can modify plant reflectance before or during symptom development. Candidate phenotypes therefore include individual reflectance bands, red edge characteristics, the normalized difference vegetation index (NDVI), the normalized difference red edge index (NDRE), pigment sensitive indices, indices related to water status, and hyperspectral features. Hyperspectral imaging is particularly valuable during trait discovery because its contiguous narrow spectral bands can identify wavelength regions associated with disease responses; informative regions may then guide development of multispectral indices of lower dimension, or of targeted sensors for breeding applications at higher throughput (Mahlein et al. 2018; Tanner et al. 2022). However, spectral responses to infection are not inherently specific to the pathogen. Nutrient deficiency, drought, senescence, other diseases, and additional abiotic or biotic stresses can generate overlapping physiological and spectral responses; consequently, candidate TLB signatures should be validated against relevant confounding stresses before being interpreted as specific to the disease (Mahlein 2016; Tanner et al. 2022).
Thermal imaging provides leaf or canopy temperature information related to transpiration and stomatal regulation and can therefore complement spectral assessment of physiological responses associated with disease (Mahlein 2016; Tanner et al. 2022). Changes in stomatal conductance, transpiration, and tissue integrity may alter leaf temperature, but thermal measurements are also strongly influenced by radiation, wind, humidity, soil water availability, canopy architecture, and viewing conditions. Thermal phenotyping should therefore rely on standardized acquisition windows and, where possible, incorporate coincident environmental measurements and suitable temperature references (Tanner et al. 2022). Three dimensional information derived from structure from motion (SfM) photogrammetry or light detection and ranging (LiDAR) can additionally quantify traits such as plant height, projected canopy area, canopy volume, architecture, and structural decline. These measurements provide complementary information on plant vitality and can help account for architectural variation when interpreting spectral or thermal responses (Mahlein 2016; Xie and Yang 2020; Gano et al. 2024; Table 11).
Level II (Closely analogous evidence). Ground-penetrating radar (GPR) is not a primary sensor for detecting a foliar disease such as TLB. However, GPR has been used to estimate below-ground root biomass in cassava, demonstrating its potential for non-destructive phenotyping in a clonally propagated root crop (Agbona et al. 2021). Its possible contribution to a TLB phenomics framework should therefore be considered exploratory and restricted to below-ground traits, such as corm position, dimensions, or biomass, where soil properties, water content, target depth, and antenna frequency permit sufficient signal penetration. Accordingly, GPR would be better evaluated as an optional end-of-season technology for relating cumulative above-ground disease trajectories to below-ground corm development rather than as an alternative to RGB, spectral, or thermal assessment of TLB symptoms.
8.3. Early Detection, Severity Quantification, and Prediction of Yield Loss
Early detection and estimation of yield loss are related but distinct modeling objectives. Models for early detection should be developed on plants with confirmed inoculation, sampled at presymptomatic or minimally symptomatic stages and evaluated using metrics that capture both detection performance and timing, including sensitivity at low disease severity, rates of false positives, and performance across independent genotypes and environments (Lowe et al. 2017; Tanner et al. 2022). Hyperspectral imaging is particularly promising in this context because pathogen-induced physiological changes can alter spectral responses before symptoms are visible to the human eye (Mahlein 2016; Lowe et al. 2017).
Models of disease severity require reliable reference phenotypes and, for approaches based on imagery, annotations at the lesion or pixel level when the objective is spatial quantification of symptomatic tissue. Segmentation performance should be evaluated using appropriate image analysis metrics and compared with standardized disease assessments (Mutka and Bart 2015; Cockerton et al. 2019). Repeated measurements can then characterize temporal disease development through traits such as symptom onset, lesion expansion, disease progression, relative area under the disease progress curve, canopy decline, and recovery, providing richer phenotypes than single observations at a single end point (Mutka and Bart 2015; Tanner et al. 2022).
Modeling of yield loss requires paired phenomic trajectories and plot-level measurements of corm yield or marketable yield. Disease severity measured at a single time point may not adequately represent yield consequences because infection timing, plant vigor, compensatory growth, and environmental conditions influence the relationship between disease development and productivity. Mixed-effects models and machine learning approaches such as partial least squares regression, random forests, gradient boosting, and temporal deep learning models can integrate repeated disease measurements with thermal, spectral, structural, environmental, and yield information. Model validation should preserve biological independence by separating genotypes, locations, seasons, or experimental units between training and testing whenever the intended application requires prediction across these domains, rather than allowing highly related observations from the same plants or plots to occur in both sets.
8.4. Analytical Algorithms and Application Scenarios
Level III (General biological evidence). Vegetation indices and linear mixed models provide interpretable phenotypes at the plot level and remain valuable for screening large breeding populations. Partial least squares regression, support vector machines, random forests, and related machine learning approaches are particularly useful for high-dimensional spectral datasets when sample sizes are moderate (Lowe et al. 2017; Tanner et al. 2022). Convolutional neural networks, vision transformers, object detectors of the You Only Look Once (YOLO) family, and segmentation architectures such as U-Net can learn spatial disease features from RGB or spectral imagery, although their successful application depends on representative training datasets, accurate annotations, and validation beyond the data used for model development (Mutka and Bart 2015; Nwaneto et al. 2024 2025).
Phenomic information can also be integrated with genomic information to strengthen breeding decisions. In soybean, Yoosefzadeh-Najafabadi et al. (2021) used hierarchical data integration combining hyperspectral phenotypes, machine learning, and genome-wide association analyses. The study identified yield-associated hyperspectral bands in the visible, red edge, and near-infrared regions, linked these spectral phenotypes to underlying genetic loci, and proposed informative hyperspectral bands as potential indirect selection criteria to improve genetic gain. This provides a useful conceptual model for future integration of disease phenomics and genomics in taro breeding.
Level IV (Hypothesis/proposed application). A tiered phenotyping strategy is therefore recommended for taro: controlled hyperspectral and thermal imaging can first be used to discover candidate early physiological signatures; promising signatures can then be validated using proximal or ground sensors across genetically diverse taro material; stable wavelengths and image-derived traits can subsequently be translated into multispectral, RGB, or thermal protocols of lower cost; and UAV platforms can ultimately enable repeated screening of larger breeding populations (Mahlein 2016; Tanner et al. 2022).
9. A Proposed Taro-Specific Breeding Pipeline
Level IV (Hypothesis/proposed application). Integrating phenomics with genomic, metagenomic, and metabolomic information could provide an opportunity to better understand and predict TLB resistance by linking underlying biological mechanisms with their phenotypic expression (Pang et al. 2024; Table 12). Level IV — Hypothesis/proposed application. Thus, a TLB multi-omics pipeline would proceed through eight stages: (1) Characterization of diverse taro germplasm for TLB response, agronomic performance, and disease-related phenotypic traits to identify contrasting resistant and susceptible genotypes; (2) Screening of genotypes under controlled P. colocasiae inoculation using RGB, multispectral, hyperspectral, or thermal imaging to quantify disease severity and progression; (3) Genotyping the diverse germplasm and conducting GWAS/QTL analysis to identify SNPs, resistance-associated loci, and candidate genes; (4) Profiling the rhizosphere microbiome of resistant and susceptible genotypes to identify microbial taxa, functional genes, and pathways associated with TLB resistance; (5) Characterization of resistant and susceptible genotypes before and after infection to identify differential metabolites and defense-related metabolic pathways; (6) Integration of phenotypic, genomic, microbiome, and metabolomic datasets to identify relationships and predictive signatures associated with TLB resistance; (7) Prioritization of genomic loci, microbial features, metabolites, and phenomic traits that consistently predict TLB resistance as candidate biomarkers; (8) Validation of candidate biomarkers and resistance signatures using independent genotypes, environments, and field populations before their deployment in breeding selection (Figure 8). This integrated approach could therefore support more accurate prediction, biomarker discovery, and selection of taro genotypes with durable TLB resistance.
10. Conclusion
Developing durable resistance to TLB remains a major challenge because resistance is quantitative and influenced by host genetics, pathogen variability, and environmental conditions. Although conventional breeding remains the foundation of taro improvement, integrating phenomics, genomics, metagenomics, and metabolomics offers a more comprehensive approach for dissecting resistance and improving selection efficiency. Genomics can help identify inherited resistance factors, while metagenomics can uncover microbial communities and functions associated with disease suppression, and metabolomics can reveal defense-related biochemical signatures. Phenomics provides the essential link between these molecular layers and actual disease expression by enabling objective and repeated assessment of lesion development, physiological stress, and plant recovery. Ultimately, combining robust phenotypes with genomic, microbial, and metabolic information could accelerate the identification and deployment of taro germplasm with durable TLB resistance.
Author Contributions
PA, BA, JSN and MHB conceived the review, developed the review framework, conducted the literature search and synthesis, classified the evidence, and drafted the manuscript. PA, RB, JSN and MB contributed to the interpretation of the literature and critically revised the manuscript. RB, JSN, NGN, HM, PAA, HOO and MB contributed to manuscript review and editing. All authors read and approved the final manuscript.
Funding
This research received no specific grant from any funding agency in the public, commercial, or not-for-profit sectors.
Ethics approval
Ethics approval was not required for this study because it is a critical narrative review of previously published literature and did not involve human participants, animals, or the collection of primary biological data.
Code availability
Not applicable. This study is a critical narrative review and did not involve the development or use of custom computational code.
Data availability
No new datasets or genetic materials were generated for this review.
Competing interests
The authors declare that they have no competing interests relevant to the content of this article.
References
- Agbona, A.; Teare, B.; Ruiz-Guzman, H.; et al. Prediction of root biomass in cassava based on ground-penetrating radar phenomics. Remote Sens. 2021, 13(23), 4908. [Google Scholar] [CrossRef]
- Amoah, P.; Mahamane, A.R. Oumarou; Byiringiro, M.H.; et al. Genome editing in Sub-Saharan Africa: a game-changing strategy for climate change mitigation and sustainable agriculture. GM Crops Food 2024, 15(1), 279–302. [Google Scholar] [CrossRef] [PubMed]
- Araus, J. L.; Cairns, J. E. Field high-throughput phenotyping: The new crop breeding frontier. Trends Plant Sci. 2014, 19(1), 52–61. [Google Scholar] [CrossRef] [PubMed]
- Anderegg, J.; Zenkl, R.; Kirchgessner, N.; Hund, A.; Walter, A.; McDonald, B. A. SYMPATHIQUE: Image-based tracking of symptoms and monitoring of pathogenesis to decompose quantitative disease resistance in the field. Plant Methods 2024, 20, 170. [Google Scholar] [CrossRef] [PubMed]
- Boon, M. A.; Drijfhout, A. P.; Tesfamichael, S. Comparison of a fixed-wing and multi-rotor UAV for environmental mapping applications: A case study. In The International Archives of the Photogrammetry, Remote Sensing and Spatial Information Sciences XLII-2/W6; 2017; pp. 47–54. [Google Scholar] [CrossRef]
- Brooks, F. E. Detached-leaf bioassay for evaluating taro resistance to Phytophthora colocasiae. Plant Dis. 2008, 92(1), 126–131. [Google Scholar] [CrossRef] [PubMed]
- Bandyopadhyay, R.; Sharma, K.; Onyeka, T. J.; Aregbesola, A.; Kumar, P.L. First report of taro (Colocasia esculenta) leaf blight caused by Phytophthora colocasiae in Nigeria. Plant Dis. 2011, 95(5), 618. [Google Scholar] [CrossRef] [PubMed]
- Berg, G.; Rybakova, D.; Fischer, D.; et al. Microbiome definition re-visited: Old concepts and new challenges. Microbiome 2020, 8, 103. [Google Scholar] [CrossRef] [PubMed]
- Blin, K.; Shaw, S.; Steinke, K.; et al. “antiSMASH 5.0: Updates to the secondary metabolite genome mining pipeline.”. Nucleic Acids Res. 2019, 47(W1), W81–W87. [Google Scholar] [CrossRef] [PubMed]
- Brunt, J.; Hunter, D.; Delp, C. “A Bibliography of Taro Leaf Blight.”; Secretariat of the Pacific Community: Noumea, New Caledonia, 2001; pp. 1–10. [Google Scholar]
- Butler, E. J.; Kulkarni, G. S. Colocasia blight caused by Phytophthora colocasiae Racib. Mem. Dep. Agric. India 1913, 5, 233–259. [Google Scholar]
- Cantalapiedra, C. P.; Hernández-Plaza, A.; Letunic, I.; Bork, P.; Huerta-Cepas, J. “eggNOG-mapper v2: Functional annotation, orthology assignments, and domain prediction at the metagenomic scale.”. Mol. Biol. Evol. 2021, 38(12), 5825–5829. [Google Scholar] [CrossRef] [PubMed]
- Cockerton, H. M.; Li, B.; Vickerstaff, R.J. Identifying Verticillium dahliae resistance in strawberry through disease screening of multiple populations and image-based phenotyping. Front. Plant Sci. 2019, 10, 924. [Google Scholar] [CrossRef] [PubMed]
- De la Torre-González, F. J.; Fernández-Castillo, E.; Azaharez-Llorente, D.; et al. Response to edaphoclimatic conditions and crop management of the bacterial microbiome of Musa acuminata rhizosphere profiled by 16S rRNA gene amplicon sequencing. Microbiol. Resour. Announc. 2021, 10(10), e01437-20. [Google Scholar] [CrossRef] [PubMed]
- De Vleesschauwer, D.; Chernin, L.; Höfte, M. M. Differential effectiveness of Serratia plymuthica IC1270-induced systemic resistance against hemibiotrophic and necrotrophic leaf pathogens in rice. BMC Plant Biol. 2009, 9, 9. [Google Scholar] [CrossRef] [PubMed]
- Devi, Y. I.; Dasgupta, M.; Mandal, J.; Sahoo, M. R. Role of ascorbate–glutathione (AsA–GSH) pathways in Phytophthora leaf blight disease resistance in taro (Colocasia esculenta L. Schott). Int. Res. J. Pure Appl. Chem. 2020, 21(12), 66–75. [Google Scholar] [CrossRef]
- Djeuani, A. C.; Mbouobda, H.D.; Wadawa, J.; et al. Mycorrhization of three cultivars of Colocasia esculenta L. Schott and evaluation of their resistance to mildew caused by Phytophthora colocasiae. Aust. J. Crop Sci. 2023, 17(12), 919–928. [Google Scholar] [CrossRef]
- Donkor, E. F.; Nyadanu, D.; Akromah, R.; Osei, K. Genotype by Phytophthora colocasiae isolate interaction in breeding for resistance to taro [Colocasia esculenta var esculenta (L.) Schott] leaf blight disease. Heliyon 2023, 9(6), e16350. [Google Scholar] [CrossRef] [PubMed]
- Douglas, G. M.; Maffei, V. J.; Zaneveld, J. R.; et al. PICRUSt2 for prediction of metagenome functions. Nat. Biotechnol. 2020, 38(6), 685–688. [Google Scholar] [CrossRef] [PubMed]
- Elliott, K.; Berry, J. C.; Kim, H.; Bart, R. S. A comparison of ImageJ and machine learning-based image analysis methods to measure cassava bacterial blight disease severity. Plant Methods 2022, 18, 86. [Google Scholar] [CrossRef] [PubMed]
- FAOSTAT. “FAOSTAT Web site”. 2024. Available online: http://faostat.fao.org/.
- Folorunso, T. R.; Akwabeng, P. M.; Rowaiye, A. B.; Iduu, N. V.; Bur, D. High-throughput design of defined microbial consortia for crop protection. Ann. Bot. 2026, 137(5), 1141–1155. [Google Scholar] [CrossRef] [PubMed]
- Fufa, T. W.; Oselebe, H. O.; Amadi, C. O.; Menamo, T. M.; Abtew, W. G. Genetic Diversity and Association of Yield-Related Traits in Taro (Colocasia esculenta (L.) Schott) Sourced from Different Agroecological Origins of Nigeria. Int. J. Agron. 2023. [Google Scholar] [CrossRef]
- Fufa, T.W., H.O. Oselebe, C. Veronica, C.A. Afiukwa, and E. Aniedi. 2021. “Systematic Review on Farmers ’ Perceptions, Preferences and Utilization Patterns of Taro [Colocasia Esculenta ( L .) Scott] for Food and Nutrition Security in Nigeria.” September. [CrossRef]
- Fullerton, R. A.; Tyson, J.; Hunter, D. G.; Fonoti, P. Plant Pathology Progress Report. In Taro Genetic Resources Committee Meeting, Lae, Papua New Guinea, 18 April 2000. [Google Scholar]
- Gano, B.; Bhadra, S.; Vilbig, J. M.; Ahmed, N.; Sagan, V.; Shakoor, N. Drone-based imaging sensors, techniques, and applications in plant phenotyping for crop breeding: A comprehensive review. Plant Phenome J. 2024, 7(1), e20100. [Google Scholar] [CrossRef]
- Gómez Expósito, R.; de Bruijn, I.; Postma, J.; Raaijmakers, J. M. Current insights into the role of rhizosphere bacteria in disease suppressive soils. Front. Microbiol. 2017, 8, 2529. [Google Scholar] [CrossRef] [PubMed]
- Guo, W.; Carroll, M. E.; Singh, A.; et al. UAS-based plant phenotyping for research and breeding applications. Plant Phenomics 2021, 9840192. [Google Scholar] [CrossRef] [PubMed]
- Garg, P. K. Characterisation of fixed-wing versus multirotors UAVs/drones. J. Geomat. 2022, 16(2), 152–159. [Google Scholar] [CrossRef]
- Ha, J.; Gao, Y.; Zhang, R.; et al. Diversity of the bacterial microbiome associated with the endosphere and rhizosphere of different cassava (Manihot esculenta Crantz) genotypes. Front. Microbiol. 2021, 12, 729022. [Google Scholar] [CrossRef] [PubMed]
- Handelsman, J. Metagenomics: Application of genomics to uncultured microorganisms. Microbiol. Mol. Biol. Rev. 2004, 68(4), 669–685. [Google Scholar] [CrossRef] [PubMed]
- Handelsman, J.; Rondon, M. R.; Brady, S. F.; Clardy, J.; Goodman, R. M. Molecular biological access to the chemistry of unknown soil microbes: A new frontier for natural products. Chem. Biol. 1998, 5(10), R245–R249. [Google Scholar] [CrossRef] [PubMed]
- Intergovernmental Panel on Climate Change. Climate Change 2023: Impacts, Adaptation and Vulnerability; Cambridge University Press, 2023. [Google Scholar]
- Jiwuba, L.; Onyeka, J.; Amadi, C.; et al. Genome-wide association study of resistance to taro leaf blight and yield traits in taro (Colocasia esculenta (L.) Schott). Sci. Rep. 2026, 16, 13315. [Google Scholar] [CrossRef] [PubMed]
- Jovel, J.; Patterson, J.; Wang, W.; et al. Characterization of the gut microbiome using 16S or shotgun metagenomics. Front. Microbiol. 2016, 7, 459. [Google Scholar] [CrossRef] [PubMed]
- Kanehisa, M.; Goto, S. KEGG: Kyoto Encyclopedia of Genes and Genomes. Nucleic Acids Res. 2000, 28(1), 27–30. [Google Scholar] [CrossRef] [PubMed]
- Kelbessa, B. G.; Ghadamgahi, F.; Kumar, P. L.; et al. Antagonistic and plant growth promotion of rhizobacteria against Phytophthora colocasia in taro. Front. Plant Sci. 2022, 13, 1035549. [Google Scholar] [CrossRef] [PubMed]
- Kifle, B. A.; Sime, A. M.; Gemeda, M. T.; Woldesemayat, A. A. Shotgun metagenomic insights into secondary metabolite biosynthetic gene clusters reveal taxonomic and functional profiles of microbiomes in natural farmland soil. Sci. Rep. 2024, 14, 15096. [Google Scholar] [CrossRef] [PubMed]
- Kohler, F.; F.; Pellegrin, G.V.H. Jackson, and E. MacKenzie1997. Taro. In Diseases of Cultivated Crops in Pacific Island Countries; Secretariat of the Pacific Community: Noumea, New Caledonia, 1997. [Google Scholar]
- Lebot, V.; Ivančič, A. Taro (Colocasia esculenta (L.) Schott), breeding history, objectives, methods and strategies: A review of fifty years of sporadic efforts. Euphytica 2022, 218, 166. [Google Scholar] [CrossRef]
- Lebot, V.; Komolong, B.; Labouisse, J. P.; et al. Conventional breeding of Pacific Island staple crops: A paradox. CABI Rev. 2023, 18, 1–15. [Google Scholar] [CrossRef]
- Li, J.; Wang, C.; Liang, W.; Liu, S. Rhizosphere microbiome: The emerging barrier in plant–pathogen interactions. Front. Microbiol. 2021, 12, 772420. [Google Scholar] [CrossRef] [PubMed]
- Liloqula, R., and J. Saelea. 1996. “Taro disease situation in Solomon Islands”. Taro Leaf Blight Seminar. Proceedings. Alafua, Western Samoa, 22–26 November, 1993. (pp. 57–61). Noumea, New Caledonia: South Pacific Commission. Unpublished.
- Lowe, A.; Harrison, N.; French, A. P. Hyperspectral image analysis techniques for the detection and classification of the early onset of plant disease and stress. Plant Methods 2017, 13, 80. [Google Scholar] [CrossRef] [PubMed]
- Mahlein, A.-K. Plant disease detection by imaging sensors, Parallels and specific demands for precision agriculture and plant phenotyping. Plant Dis. 2016, 100(2), 241–251. [Google Scholar] [CrossRef] [PubMed]
- Mahlein, A.-K.; Kuska, M. T.; Behmann, J.; Polder, G.; Walter, A. Hyperspectral sensors and imaging technologies in phytopathology: State of the art. Annu. Rev. Phytopathol. 2018, 56, 535–558. [Google Scholar] [CrossRef] [PubMed]
- Mandy, S.; Banerjee, A.; Tarafdar, J.; Somnath, R. Cytological analysis of defense-related mechanisms induced in taro (Colocasia esculenta var. antiquorum) leaf tissues in response to Phytophthora colocasiae infection. J. Root Crops 2009, 35(2), 196–205. [Google Scholar]
- Manickam, S.; Rajagopalan, V. R.; Kambale, R.; Rajasekaran, R.; Kanagarajan, S.; Muthurajan, R. Plant metabolomics: Current initiatives and future prospects. Curr. Issues Mol. Biol. 2023, 45(11), 8894–8906. [Google Scholar] [CrossRef] [PubMed]
- Marín, O.; González, B.; Poupin, M. J. From microbial dynamics to functionality in the rhizosphere: A systematic review of the opportunities with synthetic microbial communities. Front. Plant Sci. 2021, 12, 650609. [Google Scholar] [CrossRef] [PubMed]
- Mishra, A. K.; Sharma, K.; Misra, R. S. Purification and characterization of elicitor protein from Phytophthora colocasiae and basic resistance in Colocasia esculenta. Microbiol. Res. 2009, 164(6), 688–693. [Google Scholar] [CrossRef] [PubMed]
- Mishra, A. K.; Sharma, K.; Misra, R. S. Cloning and characterization of cDNA encoding an elicitor of Phytophthora colocasiae. Microbiol. Res. 2010, 165(2), 97–107. [Google Scholar] [CrossRef] [PubMed]
- Mistry, J.; Chuguransky, S.; Williams, L.; et al. Pfam: The protein families database in 2021. Nucleic Acids Res. 2021, 49(D1), D412–D419. [Google Scholar] [CrossRef] [PubMed]
- Mutka, A. M.; Bart, R. S. Image-based phenotyping of plant disease symptoms. Front. Plant Sci. 2015, 5, 734. [Google Scholar] [CrossRef] [PubMed]
- Méline, V.; Caldwell, D. L.; Kim, B. S.; et al. Image-based assessment of plant disease progression identifies new genetic loci for resistance to Ralstonia solanacearum in tomato. Plant J. 2023, 113(5), 887–903. [Google Scholar] [CrossRef] [PubMed]
- Nath, V. S.; Basheer, S.; Jeeva, M. L.; et al. A rapid and efficient method for in vitro screening of taro for leaf blight disease caused by Phytophthora colocasiae. J. Phytopathol. 2016, 164(7–8), 520–527. [Google Scholar] [CrossRef]
- Nath, V. S.; Sankar, M. S.; Hegde, V. M.; et al. Characterization of Trichoderma spp. antagonistic to Phytophthora colocasiae associated with leaf blight of taro. Ann. Microbiol. 2014, 64(4), 1513–1522. [Google Scholar] [CrossRef]
- Nwachukwu, B. C.; Babalola, O. O. Metagenomics: A tool for exploring key microbiome with the potentials for improving sustainable agriculture. Front. Sustain. Food Syst. 2022, 6, 886987. [Google Scholar] [CrossRef]
- Nwaneto, C. B.; Yinka-Banjo, C.; Ugot, O. An object detection solution for early detection of taro leaf blight disease in the West African sub-region. Frankl. Open 2025, 10, 100197. [Google Scholar] [CrossRef]
- Nwaneto, C.; Yinka-Banjo, C.; Ugot, O. A.; Annor, T.; Umeugochukwu, O. Early detection of the Taro Leaf Blight disease in the West African sub-region using deep image classification models. Smart Agric. Technol. 2024, 9, 100636. [Google Scholar] [CrossRef]
- Nyadanu, D.; Oselebe, H. O.; et al. Genome-wide association study of resistance to taro leaf blight and yield traits in taro (Colocasia esculenta). BMC Plant Biol. 2025. [Google Scholar] [CrossRef] [PubMed]
- Oladimeji, J.J.; Kumar, P. L.; Abe, A.; Vetukuri, R. R.; Bhattacharjee, R. Taro in West Africa: status, challenges, and opportunities. Agronomy 2022, 12(9), 2094. [Google Scholar] [CrossRef]
- Ongena, M.; Jacques, P. Bacillus lipopeptides: Versatile weapons for plant disease biocontrol. Trends Microbiol. 2008, 16(3), 115–125. [Google Scholar] [CrossRef] [PubMed]
- Ongena, M.; Jourdan, E.; Adam, A.; et al. Surfactin and fengycin lipopeptides of Bacillus subtilis as elicitors of induced systemic resistance in plants. Environ. Microbiol. 2007, 9(4), 1084–1090. [Google Scholar] [CrossRef] [PubMed]
- Ooka, J. J. Phytophthora leaf blight of taro; University of Hawaii Cooperative Extension Service, 1990. [Google Scholar]
- Packard, J.C. The Bougainville taro blight. In Pacific Islands Studies Program, Miscellaneous Work Papers; University of Hawai’i: Honolulu, 1975; p. 144 p. [Google Scholar]
- Pang, Z.; Lu, Y.; Zhou, G.; et al. MetaboAnalyst 6.0: Towards a unified platform for metabolomics data processing, analysis and interpretation. Nucleic Acids Res. 2024, 52(W1), W398–W406. [Google Scholar] [CrossRef] [PubMed]
- Parham, B.E.V. Annual report of the economic botanist for the year 1948. Fiji Legis. Coun. Pap. 1949, 24, 31–35. [Google Scholar]
- Paudel, R.; Bartlett, B.; Zamora, C.; et al. Breeding and selection of taro (Colocasia esculenta) for improved disease-resistance in Hawaiʻi. Plants People Planet 2023, 5(1), 123–145. [Google Scholar] [CrossRef]
- Pieterse, C. M. J.; Zamioudis, C.; Berendsen, R. L.; et al. Induced systemic resistance by beneficial microbes. Annu. Rev. Phytopathol. 2014, 52, 347–375. [Google Scholar] [CrossRef] [PubMed]
- Pavicic, M.; Overmyer, K.; Rehman, A. U.; Jones, P.; Jacobson, D.; Himanen, K. Image-based methods to score fungal pathogen symptom progression and severity in excised Arabidopsis leaves. Plants 2021, 10(1), 158. [Google Scholar] [CrossRef] [PubMed]
- Quenum, Z. N. J.; Kumar, P. L.; Akoroda, M. O.; Dansi, A.; Vetukuri, R. R.; Bhattacharjee, R. Ethnobotany and perceptions on the value of taro (Colocasia esculenta) among farmers in Benin Republic. Afr. J. Agric. Res. 2023, 19(5), 466–481. [Google Scholar] [CrossRef]
- Raciborski, M. Parasitic algae and fungi, Java’s. Batavia Bull. N. Y. State Mus. 1900, 19, 189. [Google Scholar]
- Rohart, F.; Gautier, B.; Singh, A.; Cao, K. A. Lê. “mixOmics: An R package for ‘omics feature selection and multiple data integration.”. PLoS Comput. Biol. 2017, 13(11), e1005752. [Google Scholar] [CrossRef] [PubMed]
- Ryu, C.-M.; Farag, M. A.; Hu, C. H.; Reddy, M. S.; Kloepper, J. W.; Paré, P. W. Bacterial volatiles induce systemic resistance in Arabidopsis. Plant Physiol. 2004, 134(3), 1017–1026. [Google Scholar] [CrossRef] [PubMed]
- Sahoo, M. R.; Kole, P. C.; Dasgupta, M.; Mukherjee, A. Changes in phenolics, polyphenol oxidase and its isoenzyme patterns in relation to resistance in taro against Phytophthora colocasiae. J. Phytopathol. 2009, 157(3), 145–153. [Google Scholar] [CrossRef]
- Sharma, K.; Mishra, A. K.; Misra, R. S. Identification and characterization of differentially expressed genes in the resistance reaction in taro infected with Phytophthora colocasiae. Mol. Biol. Rep. 2009, 36(6), 1291–1297. [Google Scholar] [CrossRef] [PubMed]
- Shayanthan, A.; Ordoñez, P. A. C.; Oresnik, I. J. The role of synthetic microbial communities (SynCom) in sustainable agriculture. Front. Agron. 2022, 4, 896307. [Google Scholar] [CrossRef]
- Singh, A.; Ganapathysubramanian, B.; Singh, A. K.; Sarkar, S. Machine learning for high-throughput stress phenotyping in plants. Trends Plant Sci. 2016, 21(2), 110–124. [Google Scholar] [CrossRef] [PubMed]
- Singh, D.; Jackson, G.; Hunter, D.; et al. Taro leaf blight—A threat to food security. Agriculture 2012, 2(3), 182–203. [Google Scholar] [CrossRef]
- Spooren, J.; Shao, Y.; Tarrant, T.; et al. Downy mildew disease-suppressive soils transmit a protective core microbiome to the phyllosphere. ISME J. 2026, 19(1), wrag016. [Google Scholar] [CrossRef] [PubMed]
- Spooren, J.; van Bentum, S.; Thomashow, L. S.; Pieterse, C. M. J.; Weller, D. M.; Berendsen, R. L. Plant-driven assembly of disease-suppressive soil microbiomes. Annu. Rev. Phytopathol. 2024, 62, 1–30. [Google Scholar] [CrossRef] [PubMed]
- Srinivas, M.; O’Sullivan, O.; Cotter, P. D.; van Sinderen, D.; Kenny, J. G. The application of metagenomics to study microbial communities and develop desirable traits in fermented foods. Foods 2022, 11(20), 3297. [Google Scholar] [CrossRef] [PubMed]
- Tanner, F.; Tonn, S.; de Wit, J.; Van den Ackerveken, G.; Berger, B.; Plett, D. Sensor-based phenotyping of above-ground plant–pathogen interactions. Plant Methods 2022, 18, 35. [Google Scholar] [CrossRef] [PubMed]
- Tatusov, R. L.; Galperin, M. Y.; Natale, D. A.; Koonin, E. V. The COG database: A tool for genome-scale analysis of protein functions and evolution. Nucleic Acids Res. 2000, 28(1), 33–36. [Google Scholar] [CrossRef] [PubMed]
- Trivedi, P.; Leach, J. E.; Tringe, S. G.; Sa, T.; Singh, B. K. Plant–microbiome interactions: From community assembly to plant health. Nat. Rev. Microbiol. 2020, 18, 607–621. [Google Scholar] [CrossRef] [PubMed]
- Trujillo, E. E. 1967. “Diseases of the genus Colocasia in the Pacific area and their control.” In Proceedings of the Second International Symposium on Tropical Root Crops (pp. 136–140). University of the West Indies, St. Augustine, Trinidad.
- Tyson, J. L.; Fullerton, R. A. A leaf disc assay for determining resistance of taro to Phytophthora colocasiae. N. Z. Plant Prot. 2015, 68, 415–419. [Google Scholar] [CrossRef]
- United Nations. World Population Prospects 2024; United Nations Department of Economic and Social Affairs, Population Division, 2024. [Google Scholar]
- Vetukuri, R. R.; Kushwaha, S. K.; Sen, D.; et al. Genome sequence resource for the oomycete taro pathogen Phytophthora colocasiae. Mol. Plant-Microbe Interact. 2018, 31(9), 903–905. [Google Scholar] [CrossRef] [PubMed]
- Vleeshouwers, V. G. A. A.; van Dooijeweert, W.; Govers, F.; Kamoun, S.; Colon, L. T. The hypersensitive response is associated with host and nonhost resistance to Phytophthora infestans. Planta 2000, 210(6), 853–864. [Google Scholar] [CrossRef] [PubMed]
- Wang, Z.; Bao, J.; Lv, L.; et al. Genome sequence resource of Phytophthora colocasiae from China using Nanopore sequencing technology. Plant Dis. 2021, 105(12), 4141–4145. [Google Scholar] [CrossRef] [PubMed]
- Wang, Z.; Sun, Y.; Huang, X.; et al. Genetic diversity and population structure of eddoe taro in China using genome-wide SNP markers. PeerJ 2020, 8, e10485. [Google Scholar] [CrossRef] [PubMed]
- Woldekiros, B. Evaluating Intercropping Taro (Colocasia esculenta L.) with Common Bean (Phaseolus vulgaris L.) in Cheha and Silti Districts, Southern Ethiopia. J. Hortic. 2022, 9(4), 3–5. [Google Scholar] [CrossRef]
- Xie, C.; Yang, C. A review on plant high-throughput phenotyping traits using UAV-based sensors. Comput. Electron. Agric. 2020, 178, 105731. [Google Scholar] [CrossRef]
- Yin, C.; Casa Vargas, J. M.; Schlatter, D. C.; Hagerty, C. H.; Hulbert, S. H.; Paulitz, T. C. Synthetic microbial consortia derived from rhizosphere soil protect wheat against a soilborne fungal pathogen. Front. Microbiol. 2022, 13, 829717. [Google Scholar] [CrossRef] [PubMed]
- Yoosefzadeh-Najafabadi, M.; Torabi, S.; Tulpan, D.; Rajcan, I.; Eskandari, M. Genome-wide association studies of soybean yield-related hyperspectral reflectance bands using machine learning-mediated data integration methods. Front. Plant Sci. 2021, 12, 777028. [Google Scholar] [CrossRef] [PubMed]
- Zhang, H.; Yohe, T.; Huang, L.; et al. dbCAN2: A meta server for automated carbohydrate-active enzyme annotation. Nucleic Acids Res. 2018, 46(W1), W95–W101. [Google Scholar] [CrossRef] [PubMed]
- Zhang, J.; Hieno, A.; Otsubo, K.; Feng, W.; Kageyama, K. Population genetic analysis of Phytophthora colocasiae from taro in Japan using SSR markers. J. Fungi 2023, 9(4), 391. [Google Scholar] [CrossRef] [PubMed]
- Zhang, K. M.; Zheng, F. C.; Li, Y. D.; Ann, P. J.; Ko, W. H. Isolates of Phytophthora colocasiae from Hainan Island in China: Evidence suggesting an Asian origin of this species. Mycologia 1994, 86(1), 108–112. [Google Scholar] [CrossRef]
- Zhang, L.; Zhang, J.; Wei, Y.; Hu, W.; Liu, G.; Zeng, H.; Shi, H. Microbiome-wide association studies reveal correlations between the structure and metabolism of the rhizosphere microbiome and disease resistance in cassava. Plant Biotechnol. J. 2021, 19(4), 689–701. [Google Scholar] [CrossRef] [PubMed]
- Zhu, J.; Tang, X.; Sun, Y.; et al. Comparative metabolomic profiling of compatible and incompatible interactions between potato and Phytophthora infestans. Front. Microbiol. 2022, 13, 857160. [Google Scholar] [CrossRef] [PubMed]
Figure 1.
Generalized four-stage metagenomic workflow, from sample DNA extraction through bioinformatic analysis, showing the amplicon and shotgun branches. Original schematic constructed by the first author for this review, synthesizing workflow stages from Srinivas et al. (2022) and the amplicon/shotgun comparison of Jovel et al. (2016). Evidence classification: Level III (General biological evidence).
Figure 1.
Generalized four-stage metagenomic workflow, from sample DNA extraction through bioinformatic analysis, showing the amplicon and shotgun branches. Original schematic constructed by the first author for this review, synthesizing workflow stages from Srinivas et al. (2022) and the amplicon/shotgun comparison of Jovel et al. (2016). Evidence classification: Level III (General biological evidence).
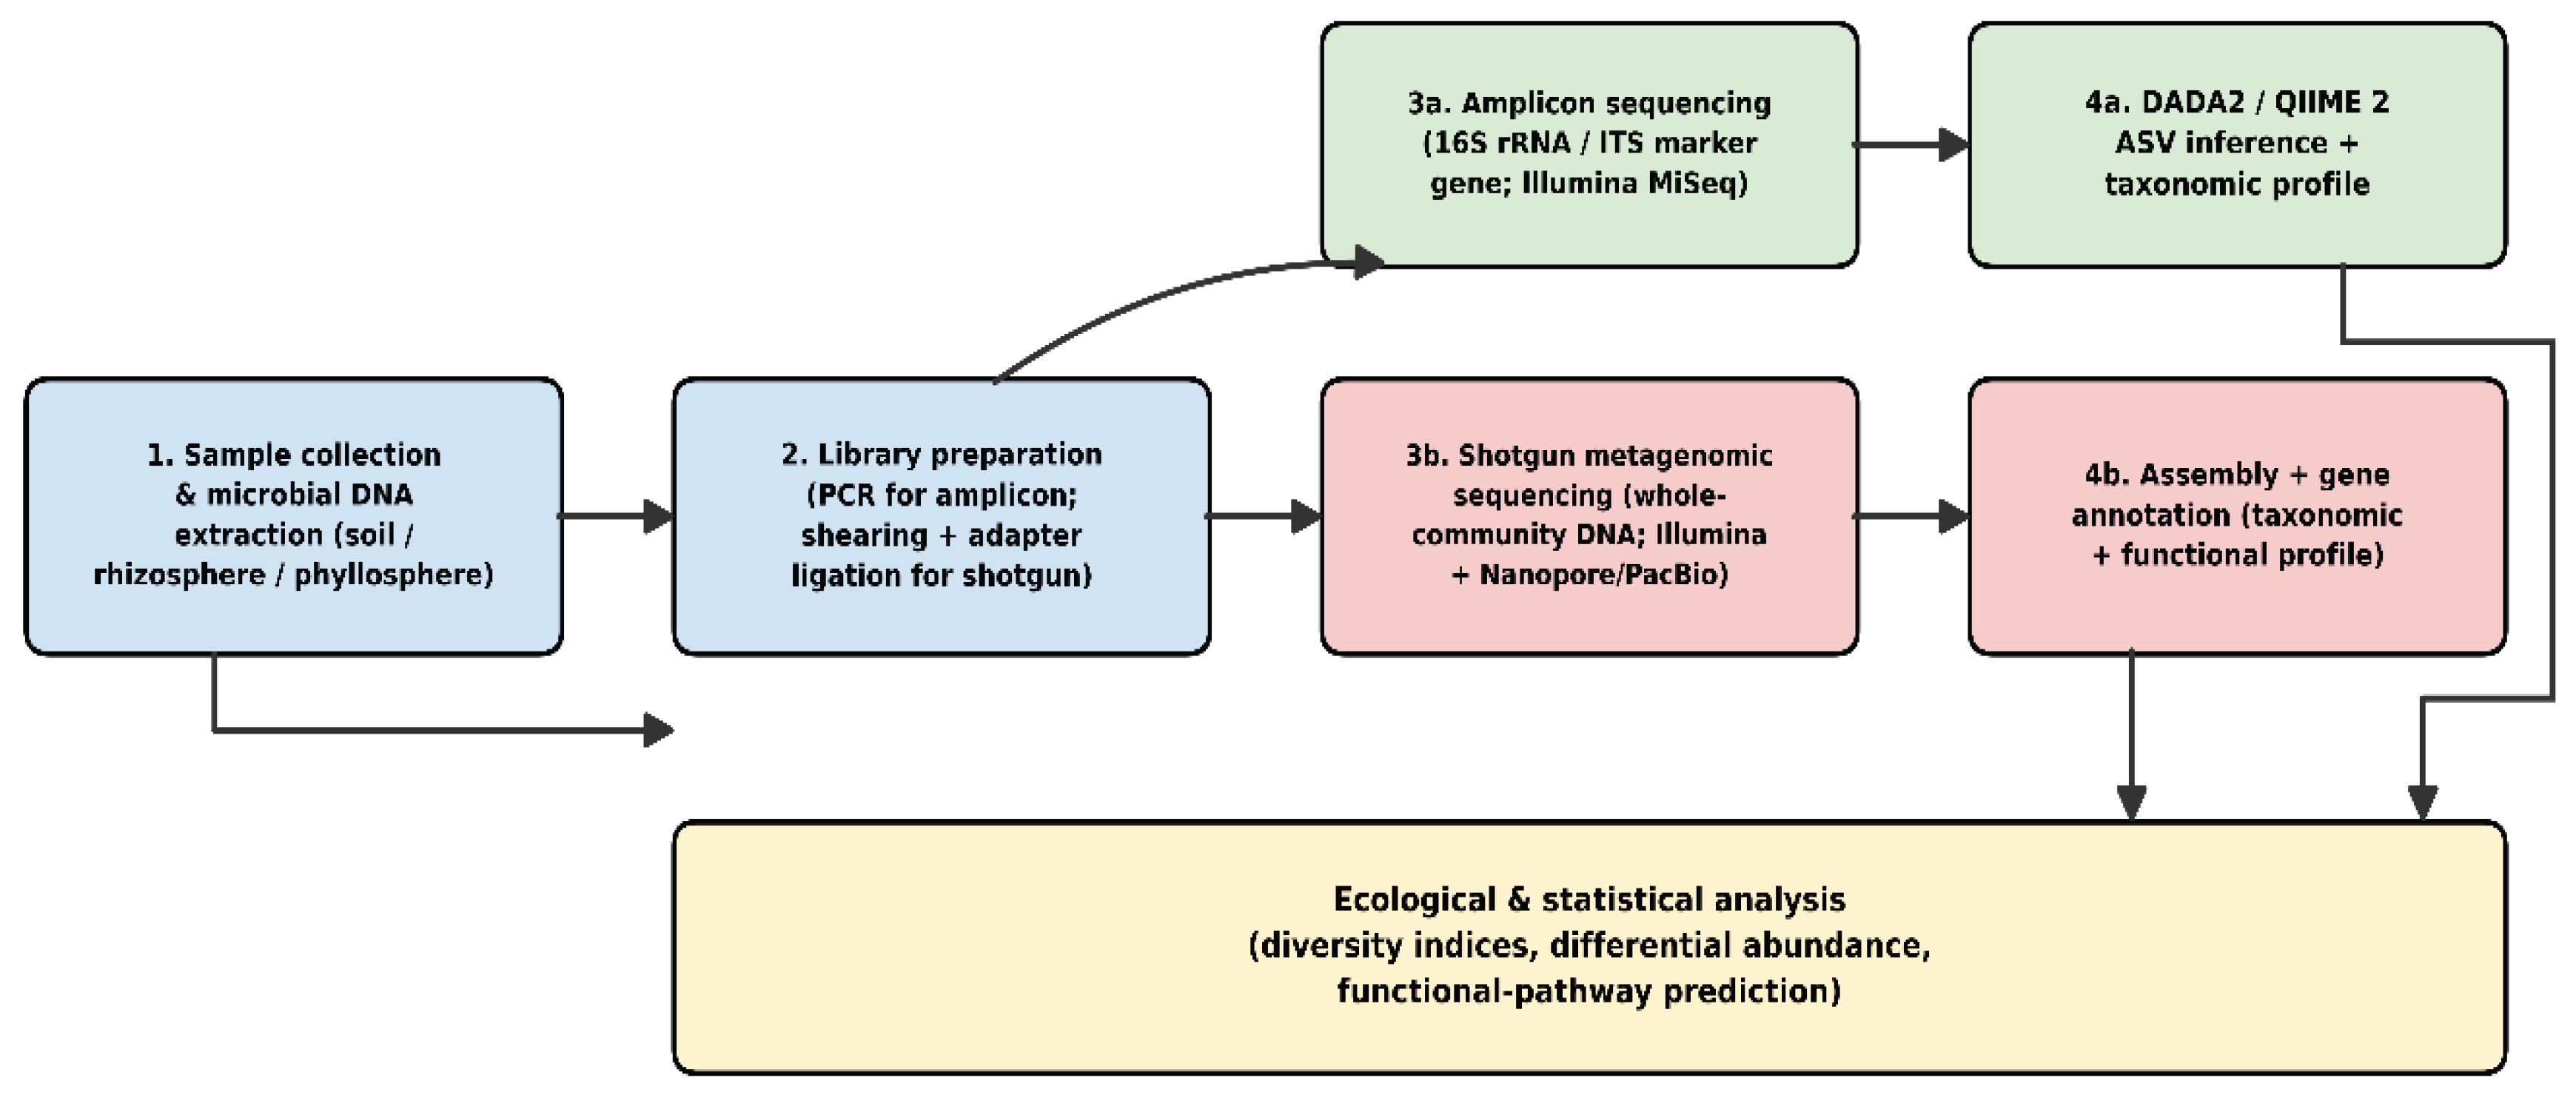
Figure 2.
Proposed soilborne-legacy cycle linking foliar TLB infection to cross-compartment microbial disease suppression in taro. Original conceptual diagram constructed by the first author for this review, extending the plant-driven suppressive-soil assembly model of Spooren et al. (2024) and the soil-to-phyllosphere transmission mechanism of Spooren et al. (2026) to the taro–P. colocasiae pathosystem. Evidence classification: Level IV (hypothesis/proposed application).
Figure 2.
Proposed soilborne-legacy cycle linking foliar TLB infection to cross-compartment microbial disease suppression in taro. Original conceptual diagram constructed by the first author for this review, extending the plant-driven suppressive-soil assembly model of Spooren et al. (2024) and the soil-to-phyllosphere transmission mechanism of Spooren et al. (2026) to the taro–P. colocasiae pathosystem. Evidence classification: Level IV (hypothesis/proposed application).
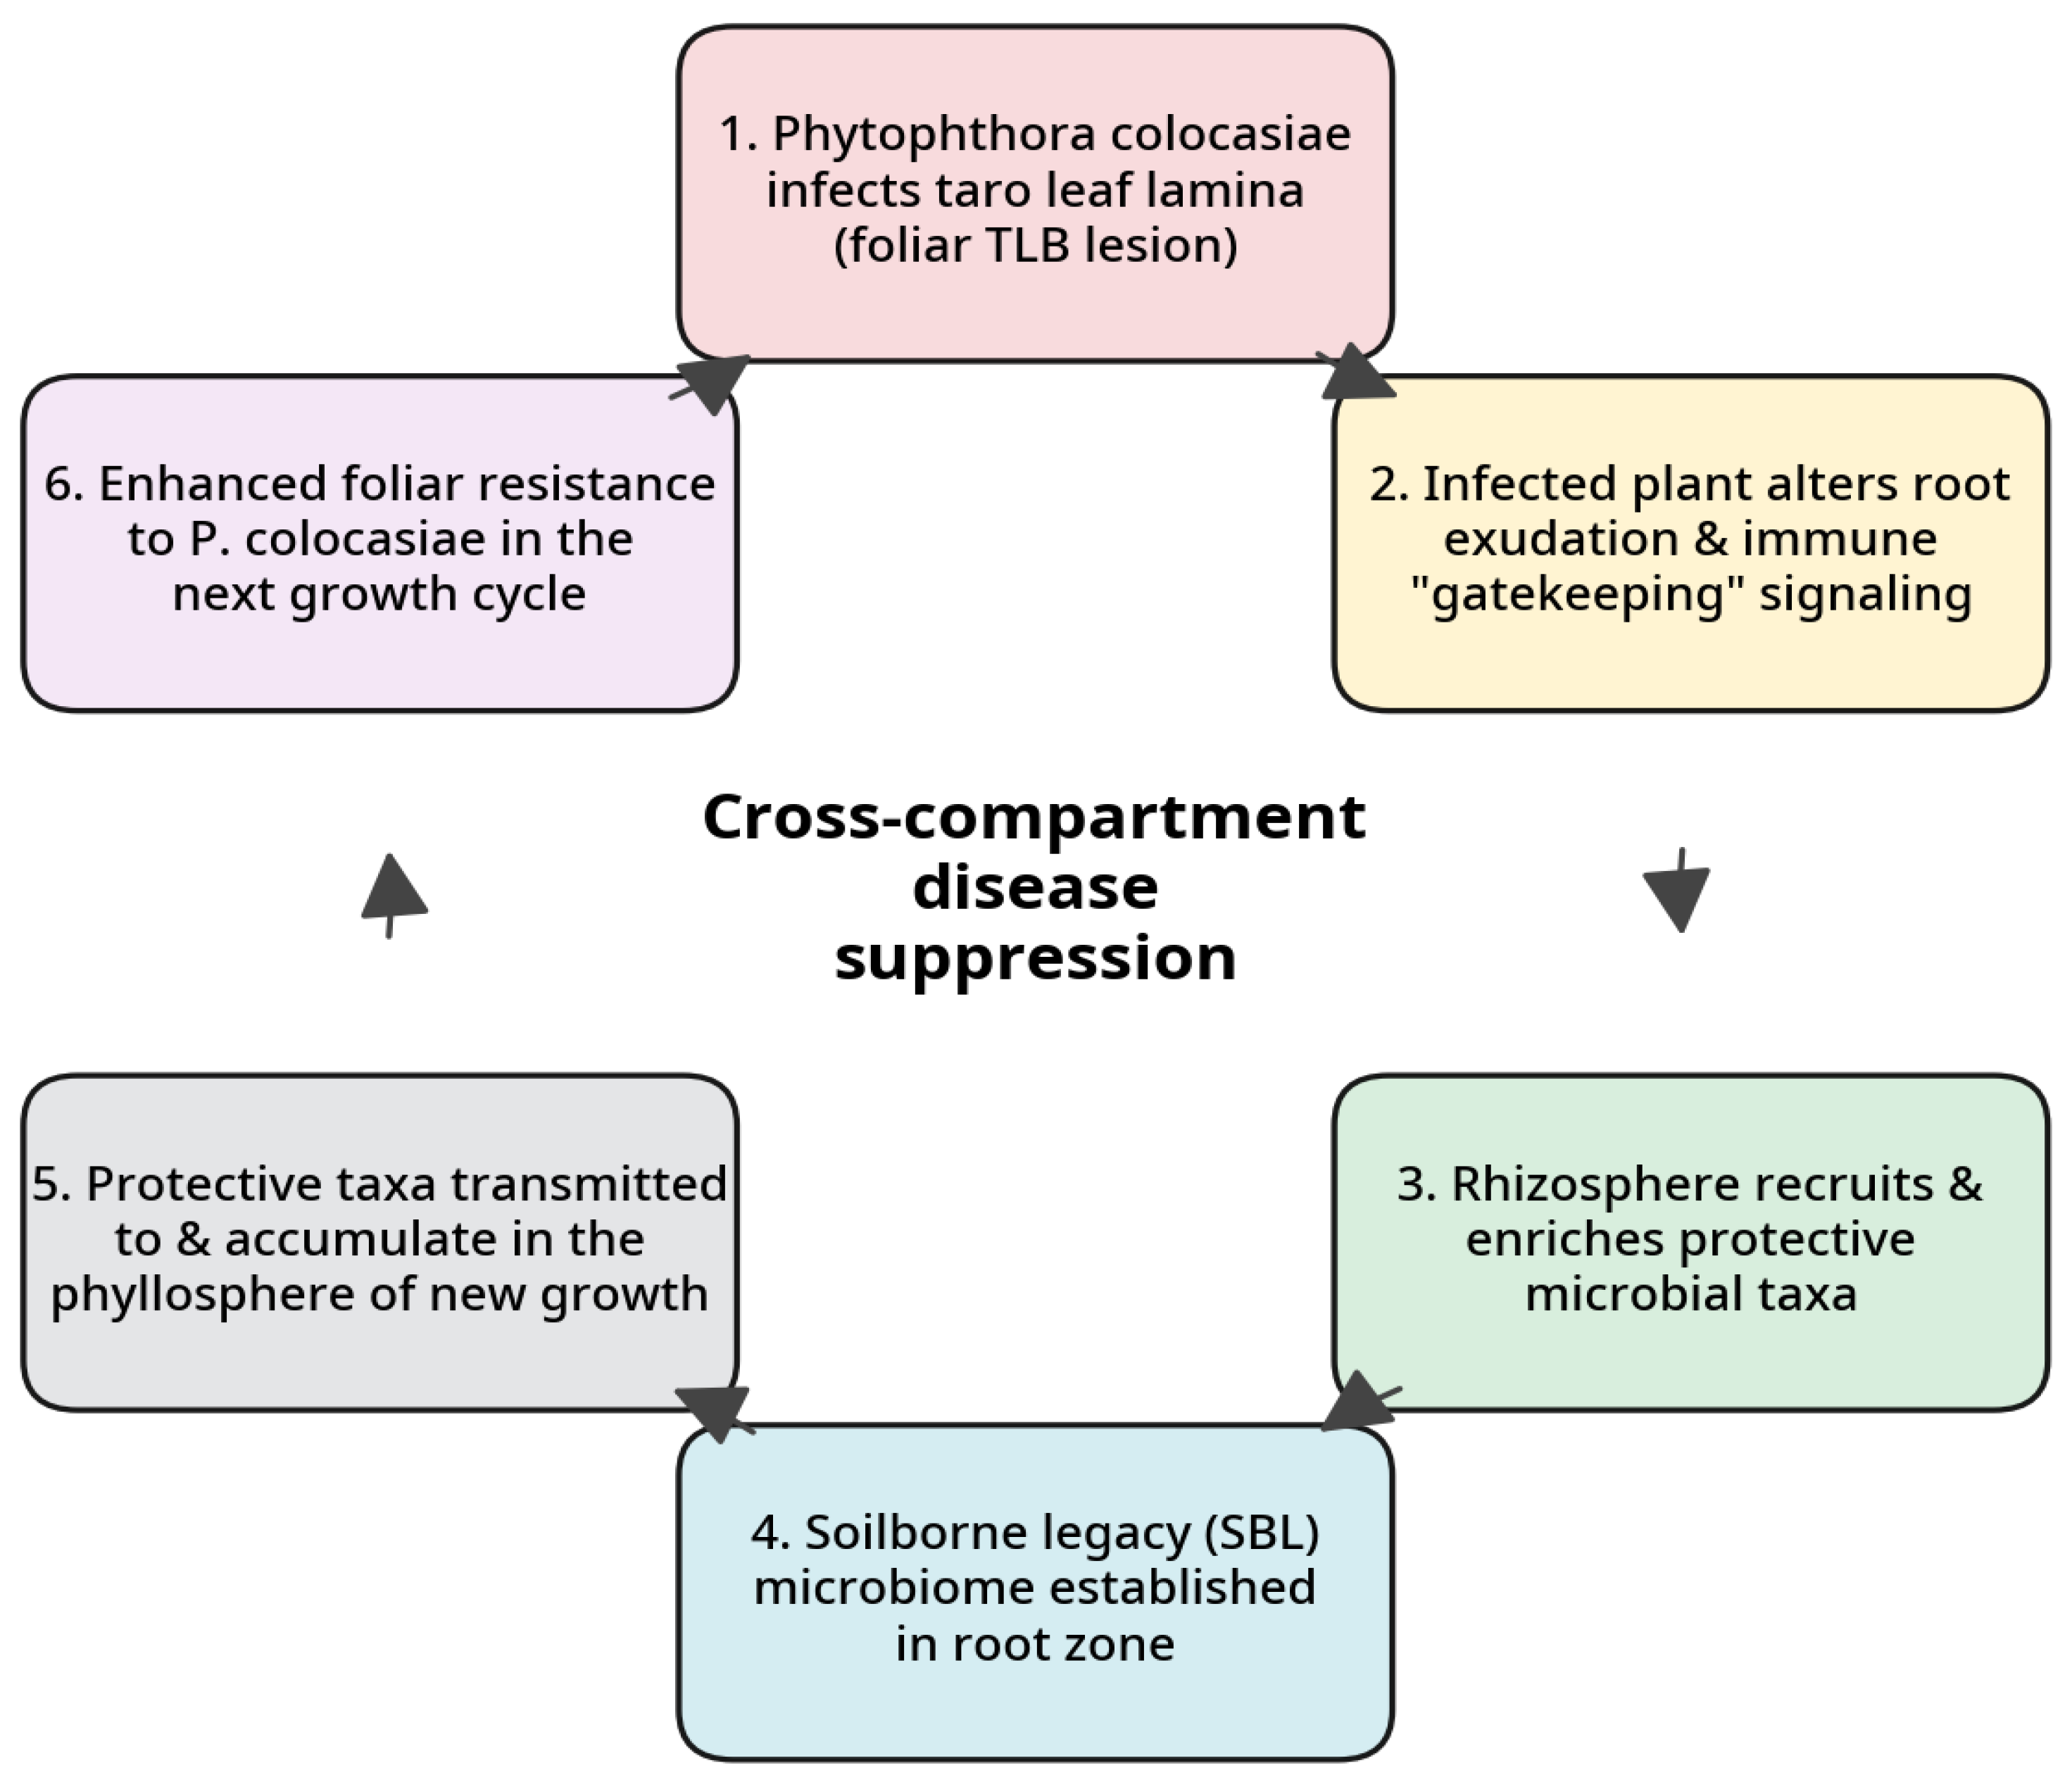
Figure 3.
A conceptual framework integrating top-down and bottom-up approaches for designing and validating microbial consortia against Phytophthora colocasiae. Original conceptual diagram constructed by the first author for this review. Evidence classification: Level IV (hypothesis/proposed application).
Figure 3.
A conceptual framework integrating top-down and bottom-up approaches for designing and validating microbial consortia against Phytophthora colocasiae. Original conceptual diagram constructed by the first author for this review. Evidence classification: Level IV (hypothesis/proposed application).
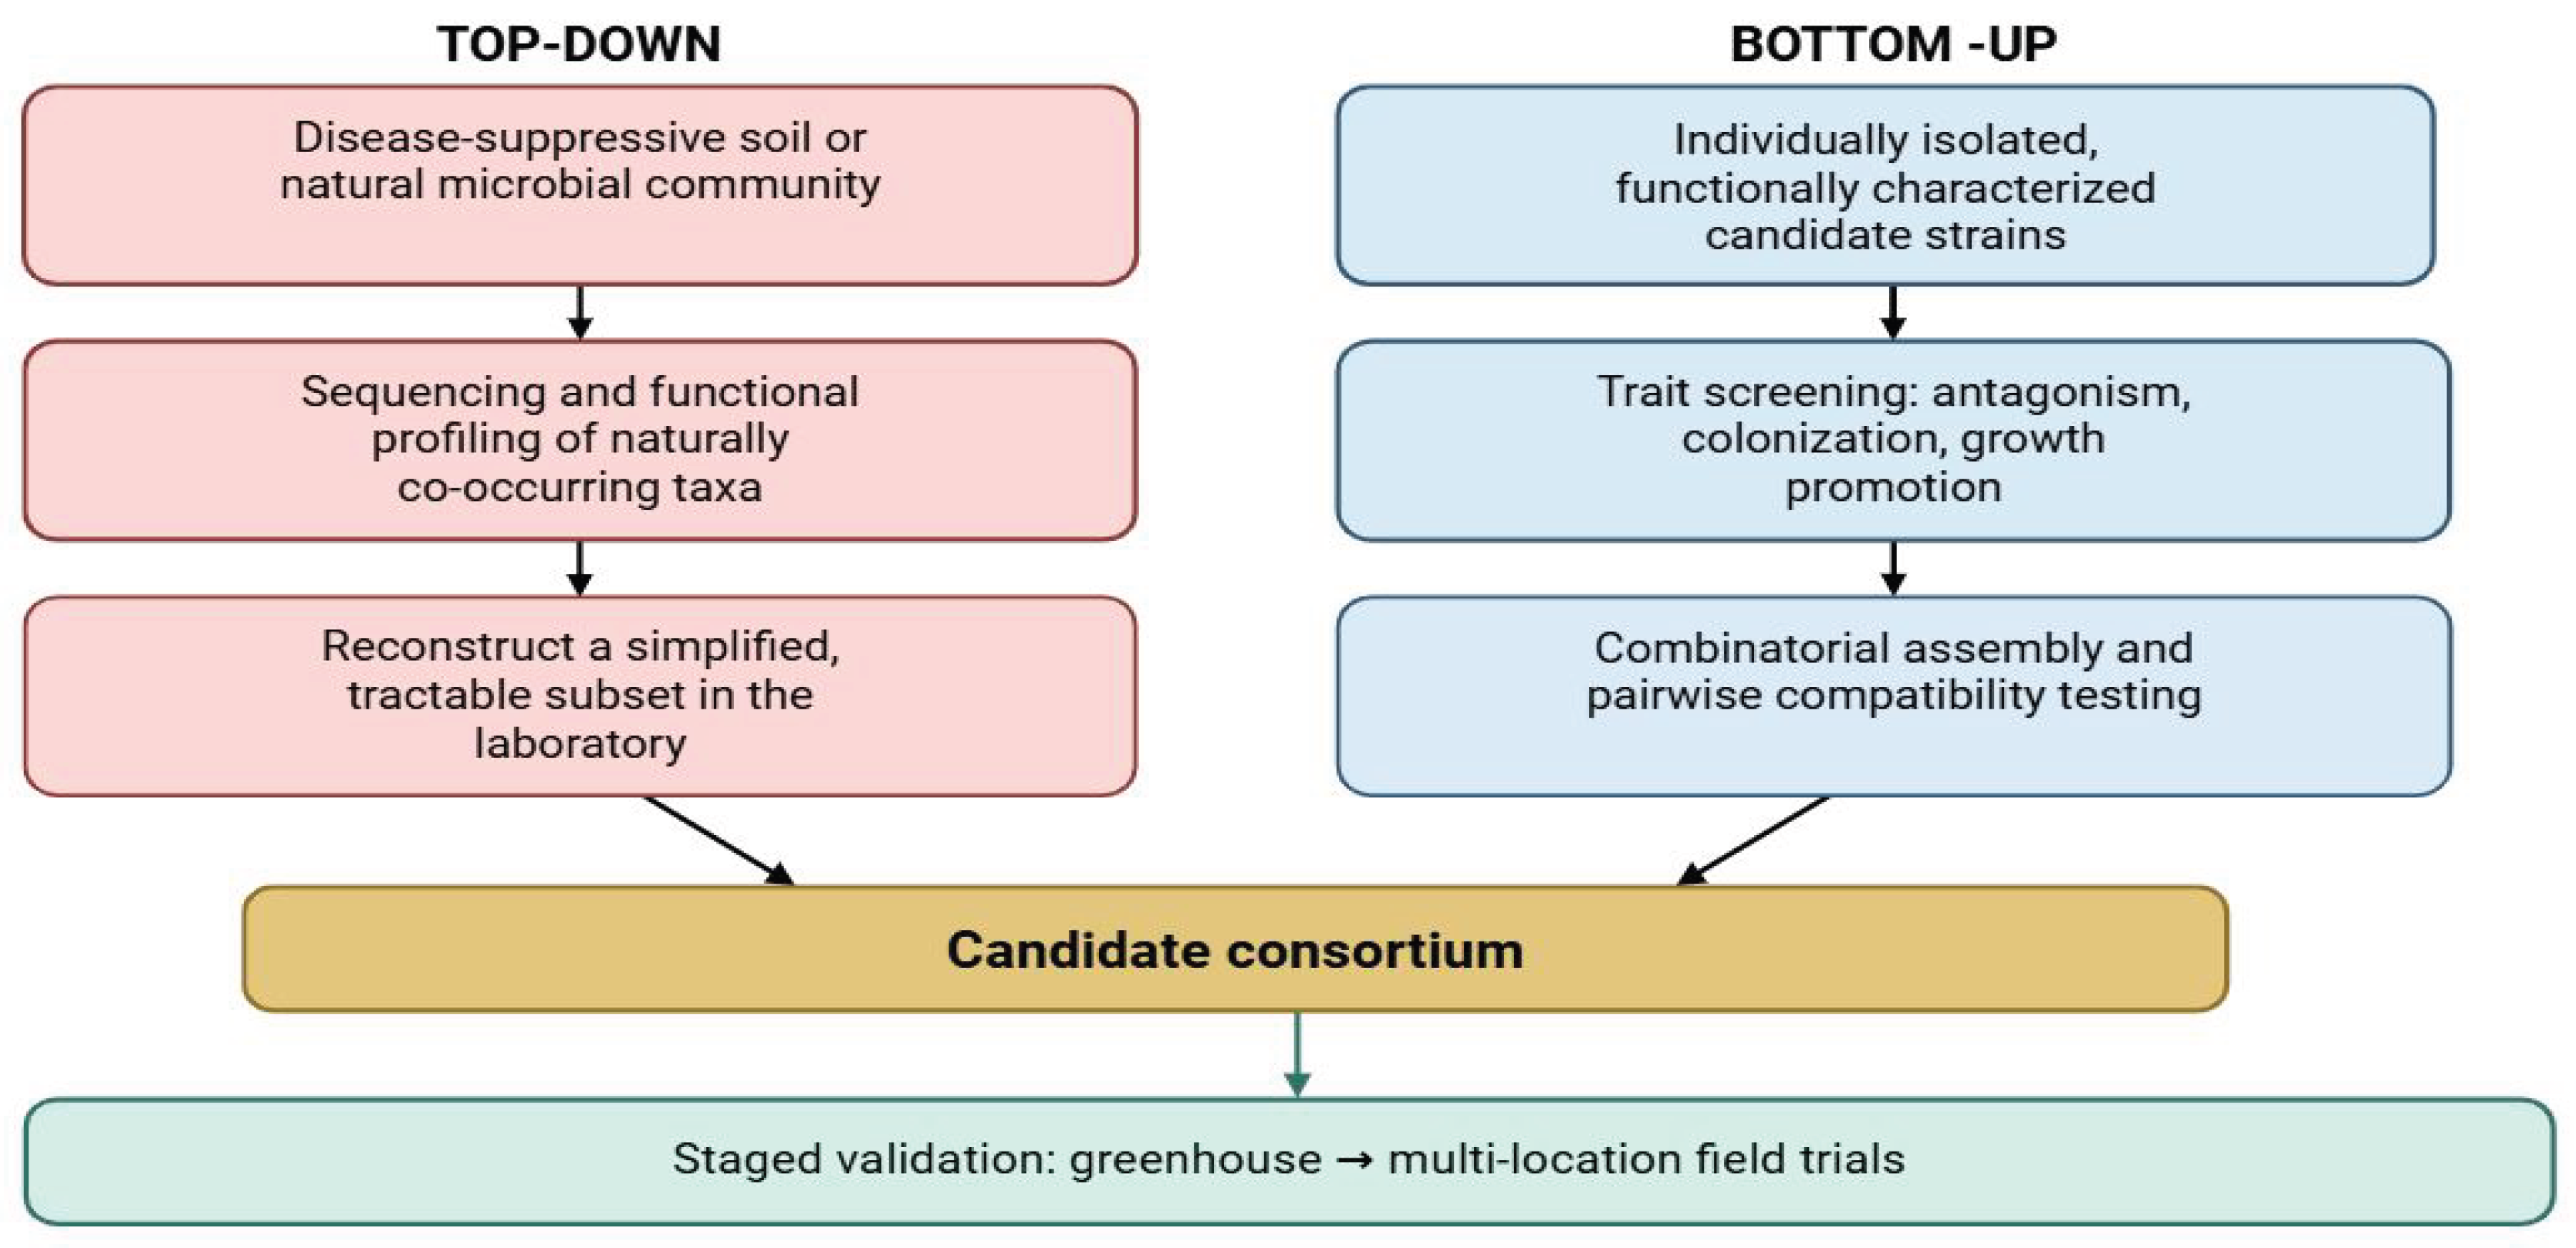
Figure 4.
Functional metagenomics workflow for the taro rhizosphere and phyllosphere microbiome, from sample collection through candidate functional-gene shortlisting for consortium validation. Original schematic prepared for this review by the first author; not reproduced from another source. Evidence classification: Level IV (hypothesis/proposed application).
Figure 4.
Functional metagenomics workflow for the taro rhizosphere and phyllosphere microbiome, from sample collection through candidate functional-gene shortlisting for consortium validation. Original schematic prepared for this review by the first author; not reproduced from another source. Evidence classification: Level IV (hypothesis/proposed application).
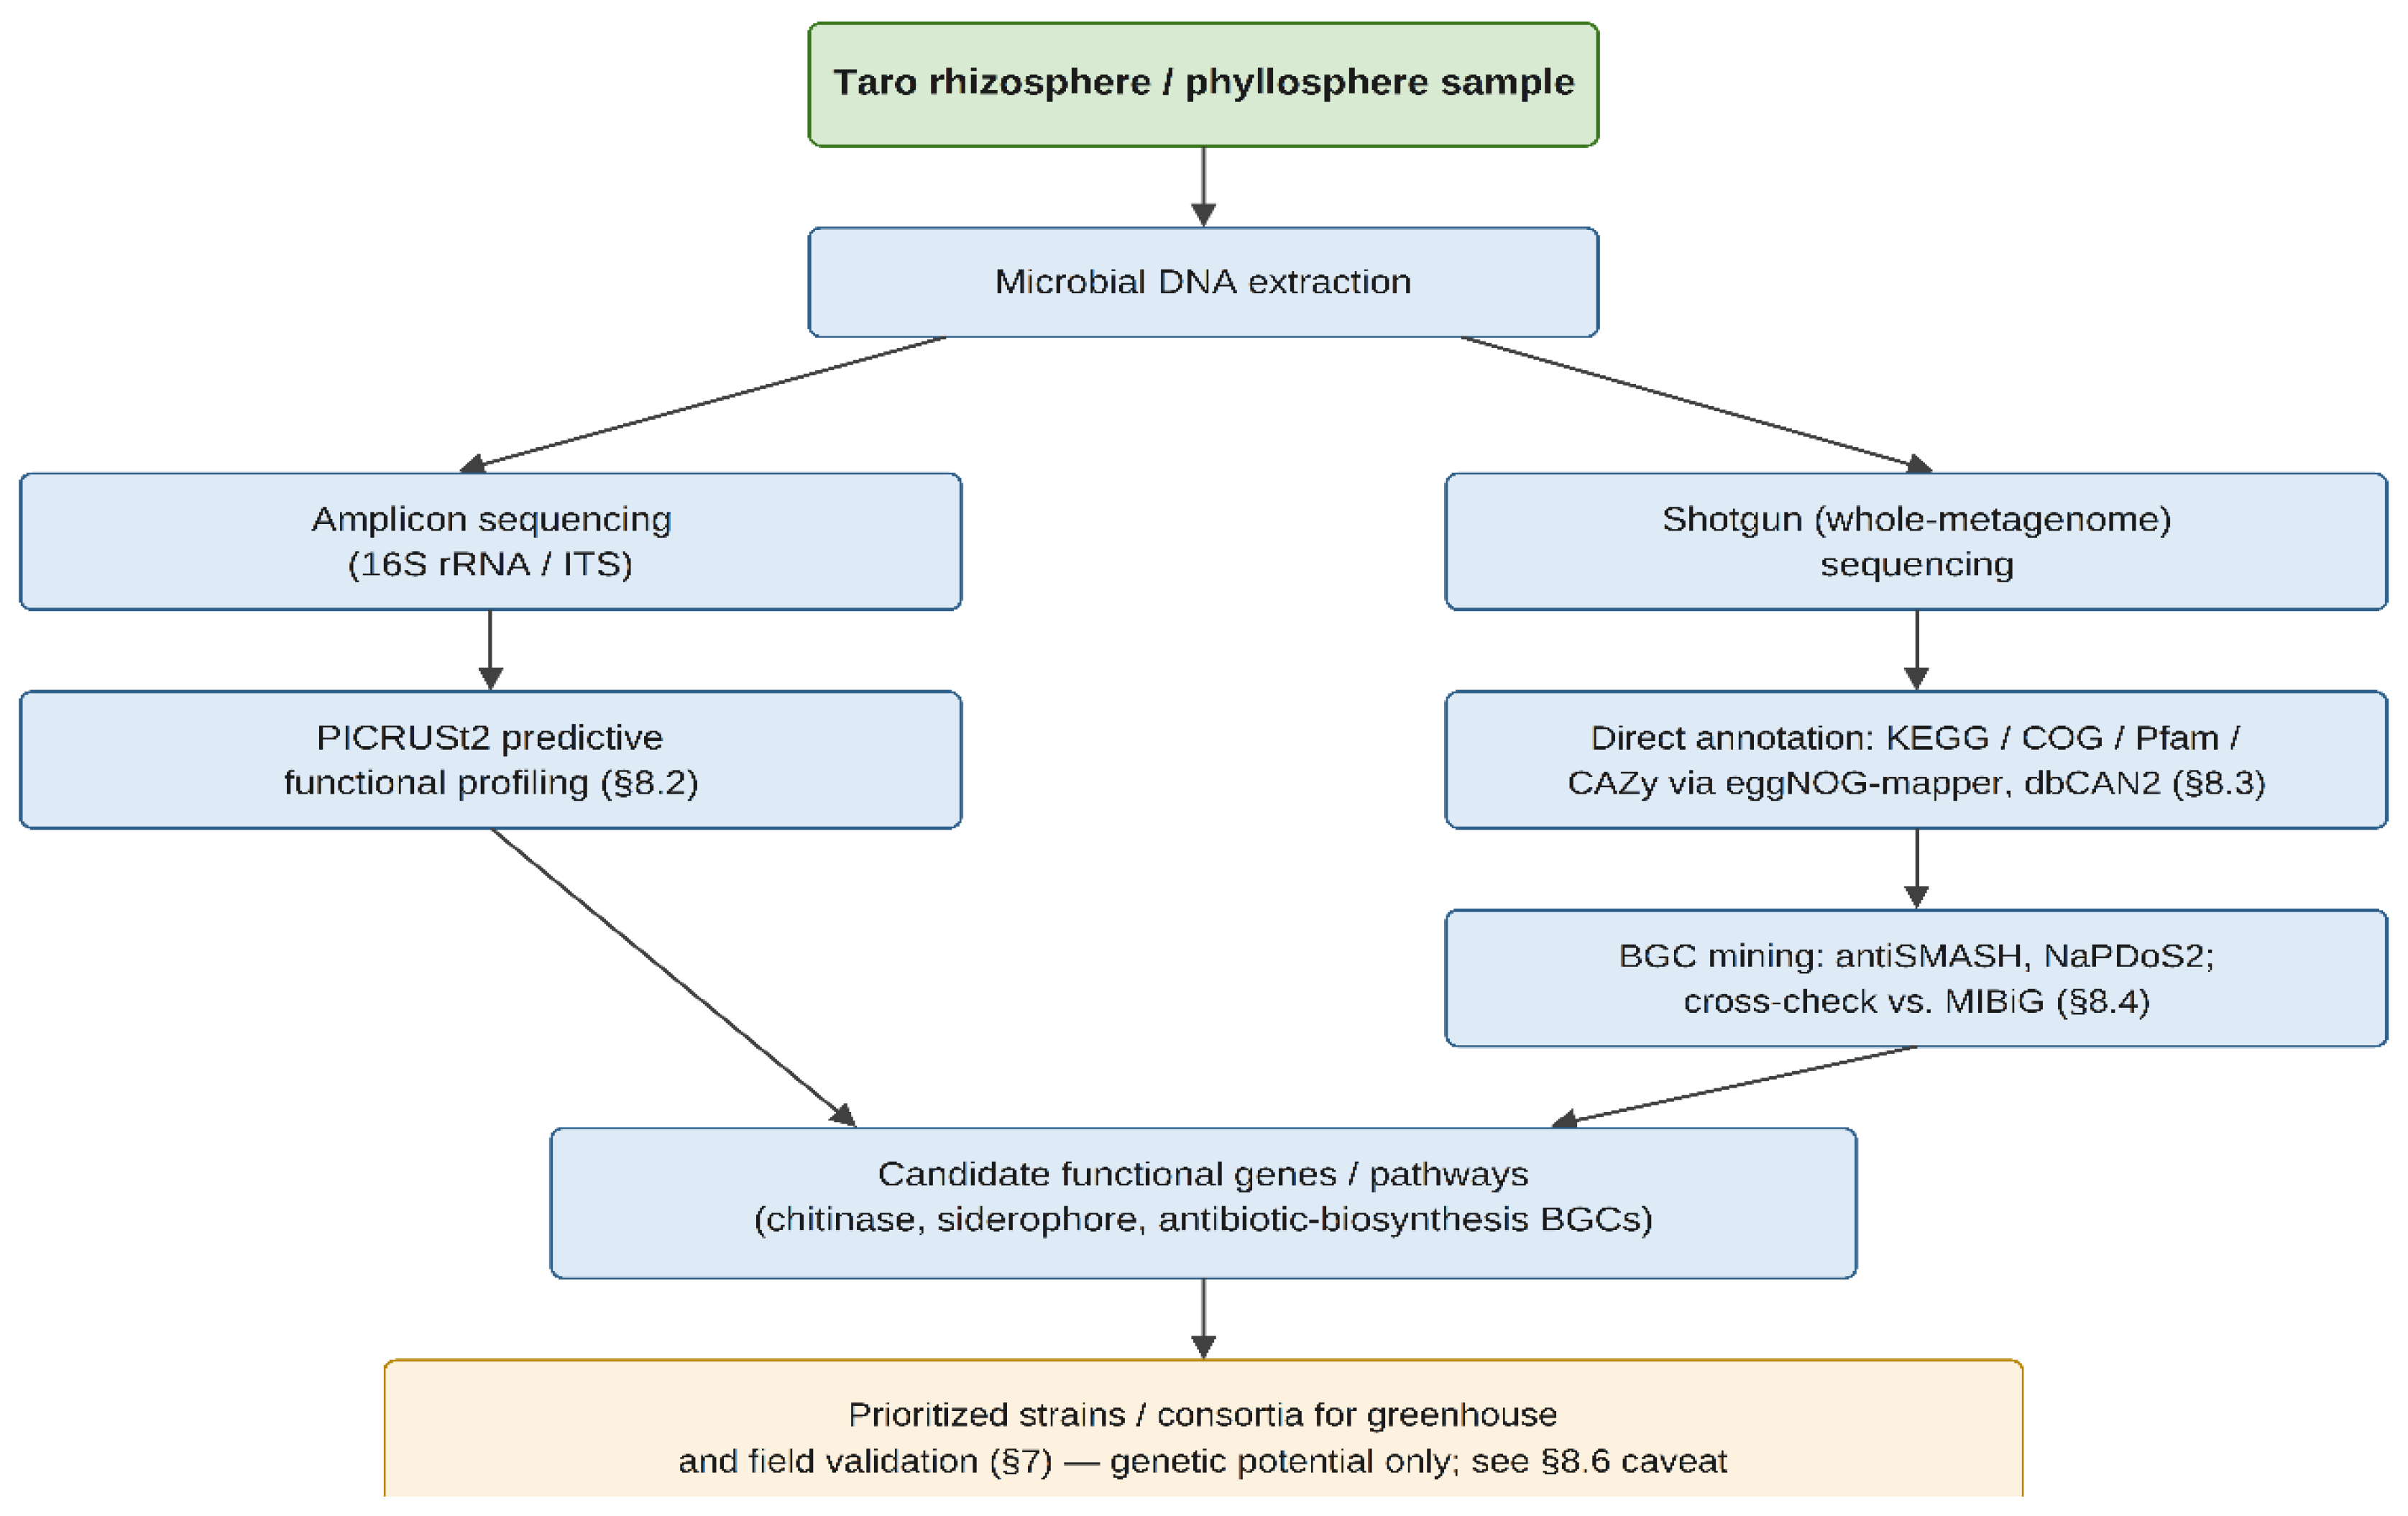
Figure 5.
Generalized workflow for plant metabolomics analysis, from sample preparation and metabolite extraction through instrumental data acquisition, peak detection and alignment, multivariate statistical analysis, and metabolite structural identification. Original conceptual diagram constructed by the first author for this review. Evidence classification: Level III (General biological evidence).
Figure 5.
Generalized workflow for plant metabolomics analysis, from sample preparation and metabolite extraction through instrumental data acquisition, peak detection and alignment, multivariate statistical analysis, and metabolite structural identification. Original conceptual diagram constructed by the first author for this review. Evidence classification: Level III (General biological evidence).

Figure 6.
Time-resolved biochemical defense cascade in Taro infected with Phytophthora colocasiae, contrasting resistant and susceptible genotypes, with the microbiome-linked antioxidant modulation reported by Djeuani et al. (2023). Evidence classification: Level I (Direct taro evidence).
Figure 6.
Time-resolved biochemical defense cascade in Taro infected with Phytophthora colocasiae, contrasting resistant and susceptible genotypes, with the microbiome-linked antioxidant modulation reported by Djeuani et al. (2023). Evidence classification: Level I (Direct taro evidence).
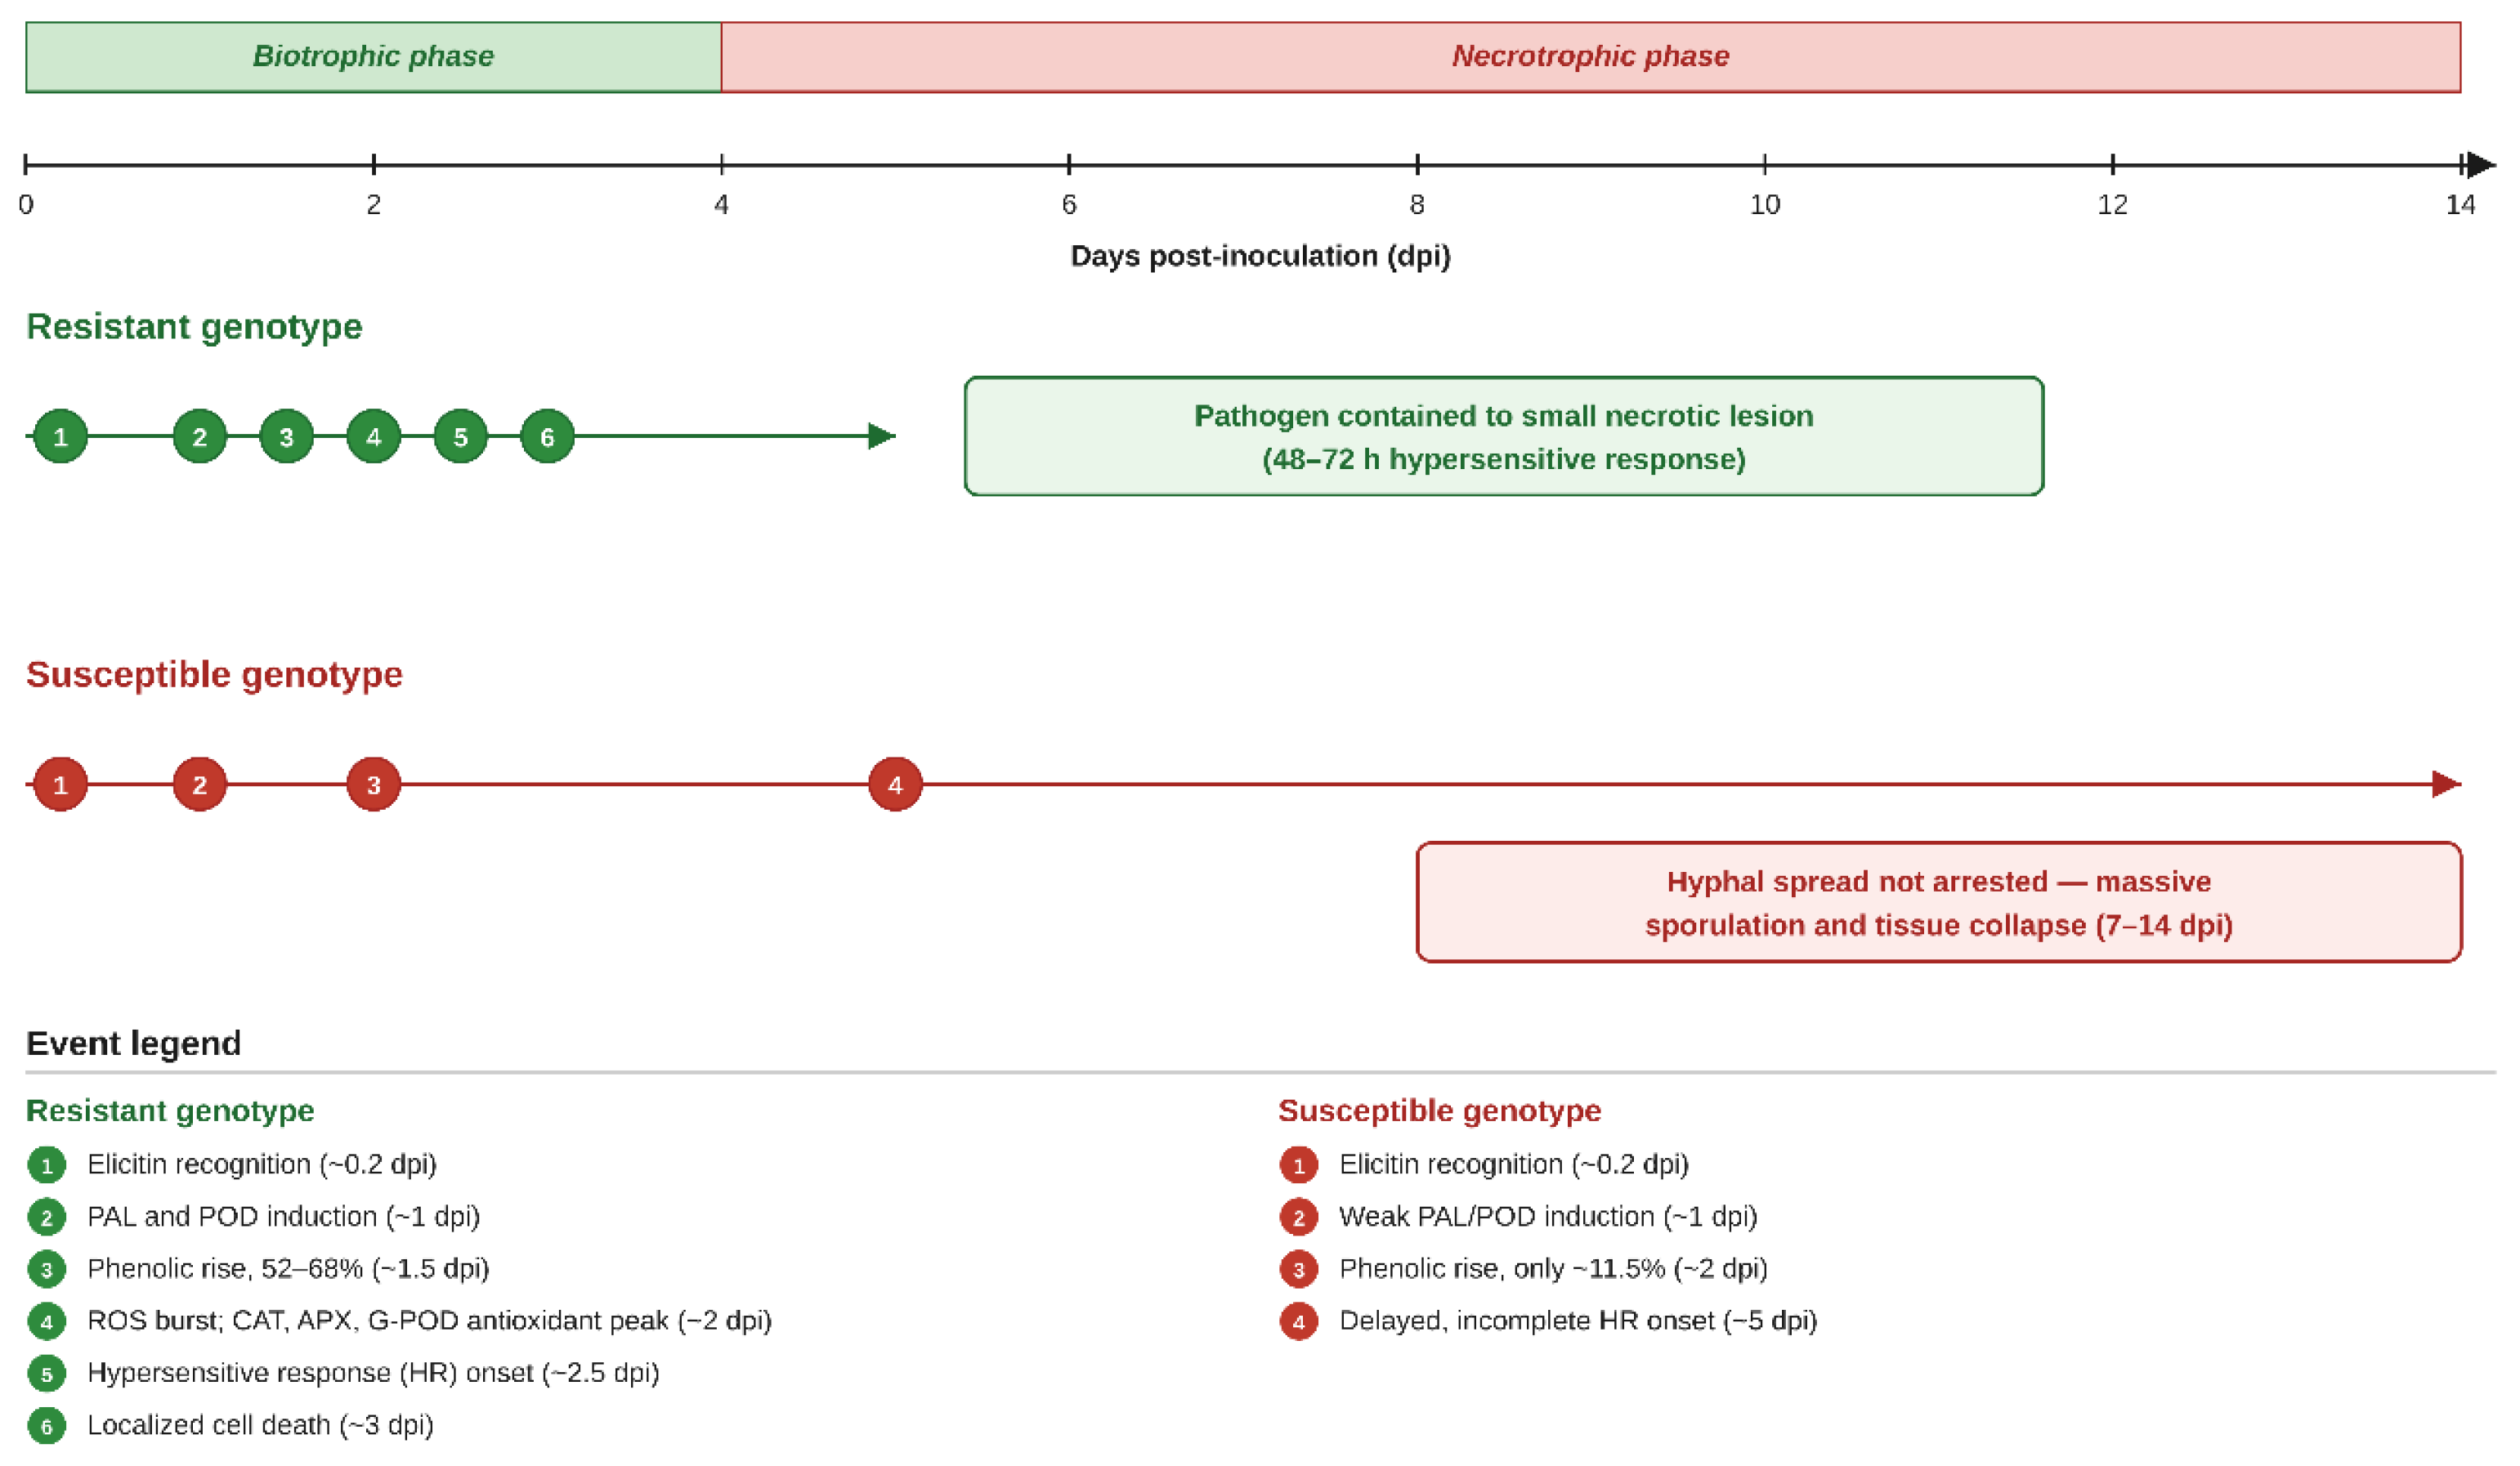
Figure 7.
Proposed three-tier biomarker screening pipeline for TLB resistance. Original schematic prepared by the first author for this review; not reproduced from a copyrighted source. Evidence classification: Level IV (hypothesis/proposed application).
Figure 7.
Proposed three-tier biomarker screening pipeline for TLB resistance. Original schematic prepared by the first author for this review; not reproduced from a copyrighted source. Evidence classification: Level IV (hypothesis/proposed application).
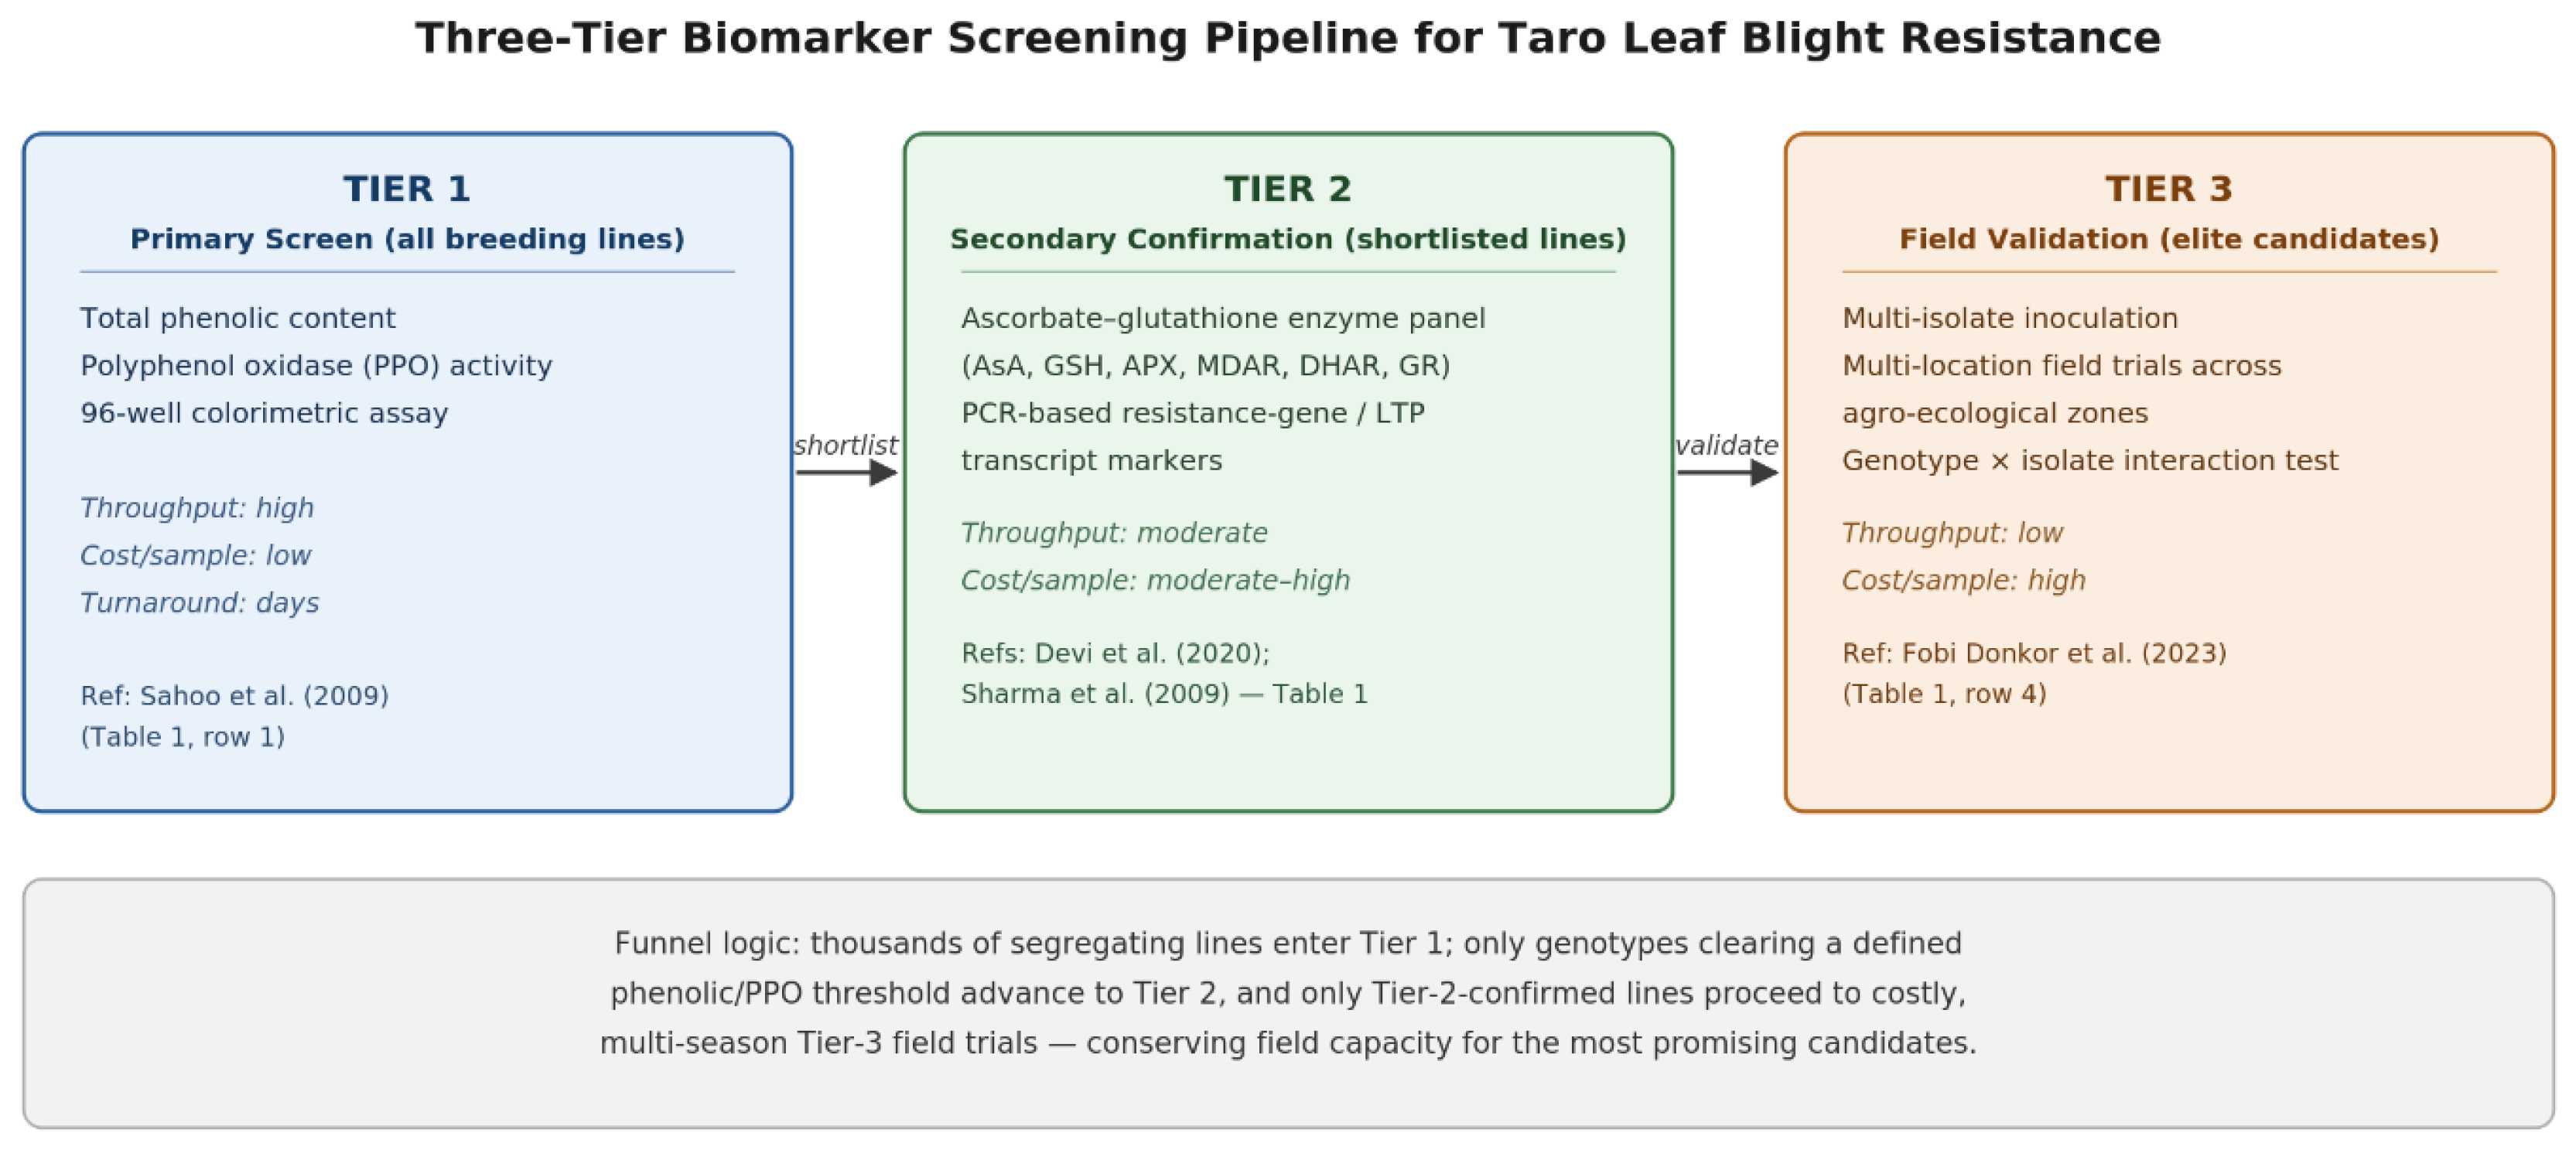
Figure 8.
Proposed taro-specific breeding pipeline integrating phenomics, genomics, metagenomics, and metabolomics for the prediction and validation of TLB resistance in taro breeding populations. Evidence classification: Level IV (hypothesis/proposed application).
Figure 8.
Proposed taro-specific breeding pipeline integrating phenomics, genomics, metagenomics, and metabolomics for the prediction and validation of TLB resistance in taro breeding populations. Evidence classification: Level IV (hypothesis/proposed application).
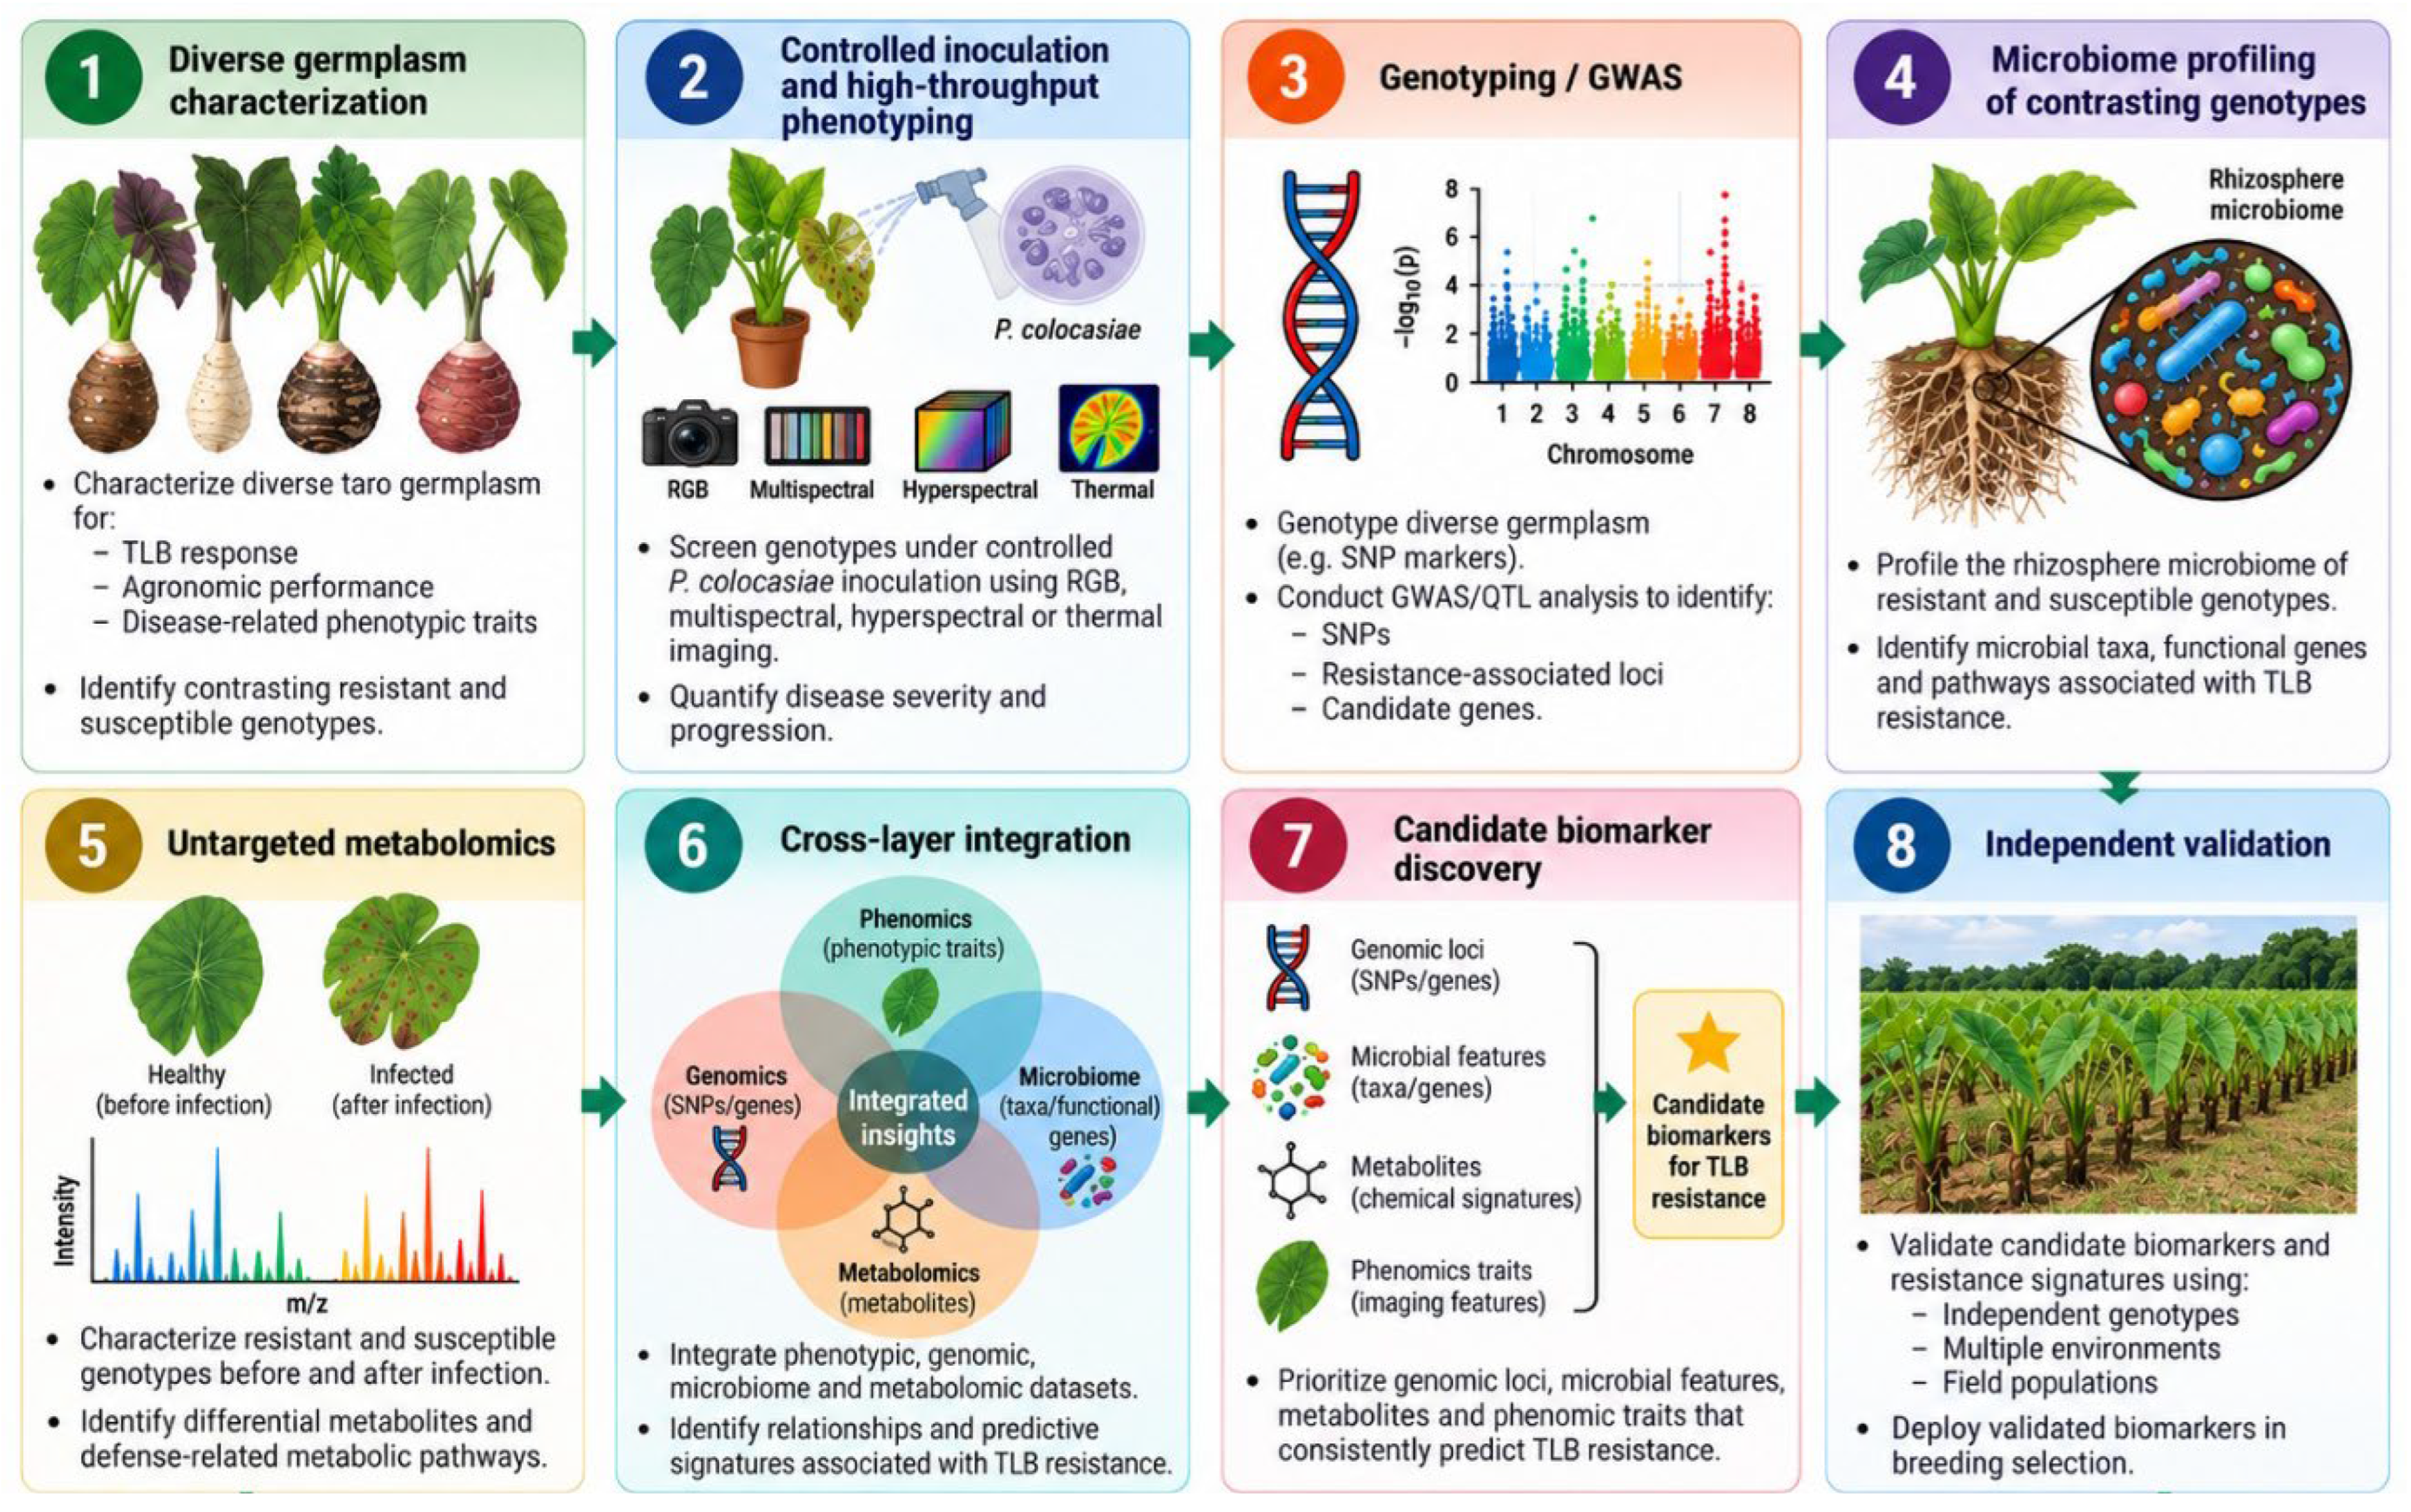

Table 1.
Comparison of amplicon and shotgun metagenomic sequencing for plant-microbiome studies.
| Feature | Amplicon (16S rRNA / ITS) sequencing | Shotgun metagenomic sequencing |
|---|---|---|
| Target | Single taxonomic marker gene region | All DNA present in the sample |
| Relative cost | Low | High; greater sequencing, storage, and computational requirements |
| Taxonomic resolution | Genus- to near species-level | Strain-level in well-characterized taxa |
| Functional gene information | Inferred only, not directly observed | Full functional gene complement recovered |
| Main bias / limitation | PCR primer bias; chimera artifacts | Reference-database incompleteness for environmental taxa |
| Typical bioinformatic tools | DADA2; QIIME 2 | MetaPhlAn; Kraken2; HUMAnN; assembly-based pipelines |
| Best use in the taro–P. colocasiae system | Initial survey of soil / phyllosphere community structure | Discovery of functional traits (biocontrol, plant growth promotion genes) in candidate consortia |
Source: Jovel et al. (2016), Nwachukwu & Babalola (2022), and Srinivas et al. (2022).
Table 2.
Comparative culture-independent microbiome findings across taro and analogous vegetatively propagated tropical root/tuber crops.
Table 2.
Comparative culture-independent microbiome findings across taro and analogous vegetatively propagated tropical root/tuber crops.
| Crop | Compartment(s) studied | Method | Key finding |
|---|---|---|---|
| Cassava | Rhizosphere vs. tuber endosphere (14 genotypes) |
16S rDNA amplicon sequencing |
Rhizosphere far more diverse (36 phyla, 906 genera) than endosphere (21 phyla, 310 genera); genotype- specific Lactococcus/Bacillus linked to blight and root-rot resistance (Ha et al. 2021) |
| Cassava | Rhizosphere (10 varieties) |
16S/ITS amplicon + shotgun metagenomics |
Rhizosphere Lactococcus sp. nisin production significantly associated with bacterial blight resistance; confirmed functionally in vitro/in vivo (Zhang et al. 2021) |
| Banana | Rhizosphere | 16S rRNA amplicon sequencing |
Community composition shaped by edaphoclimatic conditions and crop management, not host genotype alone (De la Torre-González et al. 2021) |
| Taro | Rhizosphere (culture-based only) |
Isolation & in vitro/ in vivo screening |
Candidate rhizobacterial biocontrol strains active against P. colocasiae identified; no amplicon or shotgun profiling performed to date (Kelbessa et al. 2022) |
Table 3.
Staged screening pipeline for assembling a candidate microbial consortium, illustrated with trait examples relevant to TLB biocontrol.
Table 3.
Staged screening pipeline for assembling a candidate microbial consortium, illustrated with trait examples relevant to TLB biocontrol.
| Stage | Objective | Typical methods / assays | Illustrative traits assessed for TLB biocontrol |
|---|---|---|---|
| 1. Individual strain screening | Identify candidates with relevant single-strain functions | In vitro dual-culture antagonism assays; enzymatic and metabolite assays | Direct antagonism against P. colocasiae; chitinase, protease, cellulase and amylase production |
| 2. Pairwise / small-group compatibility testing | Exclude strains that competitively exclude or antagonize one another | Co-culture compatibility assays | Growth interaction and antibiosis between candidate strains |
| 3.Combinatorial consortium assembly | Build tractable multi-strain consortia from compatible strains | Combinatorial in vitro and detached-leaf assays | Sixteen combinatorial consortia assembled and screened (Kelbessa et al. 2022) |
| 4.Greenhouse validation | Test consortium performance under controlled whole-plant conditions | Whole-plant inoculation trials | 88.75-99.37% disease reduction achieved by best consortia (Kelbessa et al. 2022) |
| 5. Field validation | Confirm performance under open, competitive field conditions | Multi-location field trials across representative agroecological zones | Not yet conducted for any TLB-targeted consortium |
Table 4.
Comparative design and outcomes of single-strain-versus-consortium disease control trials in two pathosystems.
Table 4.
Comparative design and outcomes of single-strain-versus-consortium disease control trials in two pathosystems.
| Feature | Wheat root rot (Yin et al. 2022) | Taro leaf blight (Kelbessa et al. 2022) |
|---|---|---|
| Target pathogen | Rhizoctonia solani AG8 | Phytophthora colocasiae |
| Source of candidate isolates | Wheat rhizosphere soil | Taro phyllosphere / rhizosphere |
| Candidate strains characterized | 14 bacterial isolates | 7 isolates (6 Serratia spp. + 1 Pseudomonas fluorescens) |
| Consortia tested | 10 synthetic consortia | 16 combinatorial consortia |
| Consortia conferring measurable protection | 7 of 10 | Multiple; best-performing combinations identified |
| Consortium performance vs. best single strain | Not superior overall | Substantially higher disease reduction (88.75-99.37%) than any single strain |
| Proposed protective mechanism(s) | Not differentiated | Direct antagonism plus apparent induced resistance (pathogen containment at infection site) |
| Furthest validation stage reached | Greenhouse | In vitro → detached leaf → greenhouse |
Table 5.
Functional-annotation resources relevant to taro–P. colocasiae functional metagenomics.
| Tool / database | Data type | Primary function | Relevance to TLB-biocontrol screening |
|---|---|---|---|
| PICRUSt2 | 16S rRNA amplicon (ASVs) | Predicts community gene content by phylogenetic placement onto a reference genome tree | Low-cost first-pass flag of taxa carrying putative chitinase, siderophore, or antibiotic-biosynthesis genes (8.2) (Douglas et al. 2020) |
| KEGG | Shotgun reads / assembled genes | Maps genes to metabolic pathways and orthologs | Places candidate biocontrol genes in pathway context (e.g., siderophore biosynthesis) (Kanehisa and Goto 2000) |
| COG | Shotgun reads | Broad orthologous-group functional classification | Rapid, community-wide functional-category screening (Tatusov et al. 2000) |
| Pfam | Protein sequences (shotgun) | Protein family / domain identification | Detects lytic-enzyme domains: chitinase, protease, cellulase (Mistry et al. 2021) |
| eggNOG-mapper | Shotgun reads / genomes | Fast orthology-based functional annotation (KEGG, GO, COG) | High-throughput annotation of defense-related orthologs across a whole community (Cantalapiedra et al. 2021) |
| CAZy / dbCAN2 | Shotgun reads / genomes | Carbohydrate-active enzyme (CAZyme) classification | Identifies chitinases and cellulases central to direct antagonism (4, 7) (Zhang et al. 2018) |
| antiSMASH | Assembled contigs / genomes | Biosynthetic gene cluster (BGC) mining | Detects novel antimicrobial secondary-metabolite gene clusters (Blin et al. 2019) |
| NaPDoS2 | Assembled contigs | NRPS/PKS domain-based BGC discovery | Complements antiSMASH for additional novel biosynthetic domains (Applied in Kifle et al. 2024) |
| MIBiG repository | Predicted BGC sequences | Cross-references BGCs against experimentally validated clusters | Distinguishes known vs. entirely novel candidate clusters (Applied in Kifle et al. 2024) |
Table 6.
Targeted versus untargeted metabolomics: objectives, outputs, and typical use cases.
| Feature | Untargeted metabolomics | Targeted metabolomics |
|---|---|---|
| Objective | Detect and relatively quantify as many metabolites as possible, with no prior assumption of which matter | Detect and precisely quantify a pre-defined panel of known compounds |
| Prior knowledge required | None — hypothesis-generating, discovery-oriented | Yes — hypothesis-testing, confirmatory |
| Quantification | Relative (peak-area based) | Absolute (calibration-curve based) |
| Typical role in a study | First-pass screen to flag candidate biomarkers | Follow-up validation of candidates flagged by an untargeted screen |
| Best suited for | Novel or unexpected stress/disease biomarkers | Confirming a specific compound class, e.g., defense-related phenolics |
Table 7.
Comparison of the principal analytical platforms used in plant metabolomics.
| Platform | Metabolite coverage | Sensitivity | Reproducibility | Key limitation | Best suited for |
|---|---|---|---|---|---|
| NMR | Broad, non-selective; best for abundant metabolites | Lower than MS-based methods | Excellent | Poor sensitivity for low-abundance compounds | Structural characterization; highly reproducible, quantitative profiling |
| GC-MS | Volatile and derivatizable polar, low-molecular weight compounds | High | High | Requires derivatization; limited to volatile/derivatizable compounds | Primary metabolism — sugars, organic acids, amino acids |
| LC-MS (incl. LC-MS/MS) | Broadest — polar to semi-polar primary and secondary metabolites | Very high | Good | Matrix effects; heavy dependence on spectral-library coverage | General-purpose “workhorse” for targeted and untargeted plant metabolomics |
| CE-MS | Charged, highly polar metabolites poorly retained by chromatography | High for its niche | Moderate | Narrower routine adoption; method development intensive | Charged polar metabolites (e.g., organic acids, amines) as a complement to LC-MS |
NMR= Nuclear magnetic resonance spectroscopy, GC-MS= Gas chromatography–mass spectrometry, LC-MS= Liquid chromatography–mass spectrometry, CE-MS= Capillary electrophoresis–mass spectrometry.
Table 8.
Documented biochemical and cytological resistance responses of taro genotypes challenged with Phytophthora colocasiae.
Table 8.
Documented biochemical and cytological resistance responses of taro genotypes challenged with Phytophthora colocasiae.
| Study | Genotype(s) compared | Response measured | Key quantitative finding | Approx. timeframe |
|---|---|---|---|---|
| Mandy et al. (2009) | R: Muktakeshi, BCC-1, Topi, Jhankri | Hypersensitive response (HR) cytology | R: cell wall thickening, granulation, hyphal coagulation; S: HR delayed, fails to arrest hyphal spread | 48–72 h (R) vs. delayed (S) |
| Sahoo et al. (2009) | R: DP-25, Duradim, Jhankri | Total phenolics; PPO activity | Phenolics +52.7 to +68.0% (R) vs. +11.5% (S); PPO +49.1% (DP-25) vs. +17.1% (N-118); 4 PPO isoforms | Post-inoculation |
| Devi et al. (2020) | 30 genotypes; notably RCMC-5, DP-25, Jhankri, TSL | Ascorbate–glutathione (AsA–GSH) pathway | RCMC-5: broad pathway induction; DP-25/Jhankri/TSL: strongest signal in glutathione reductase | Post-inoculation |
| Mishra et al. (2009, 2010) | Elicitor-focused (not genotype-specific) | Elicitin-triggered signaling | Purified elicitor alone triggers HR-like lesions; induces PAL, POD, LOX, endochitinase; primes systemic resistance | Rapid, dose-dependent |
| Sharma et al. (2009) | Resistant vs. susceptible (SSH library) | Differential gene expression | 2 putative R genes, 1 transcription factor, multiple PR genes and LTPs upregulated in resistant genotypes | Transcriptional |
| Djeuani et al. (2023) | Banlah, Macoumba, Ekwanfre (± AMF colonization) | Disease severity; CAT, APX, G-POD; H2O2 | AMF colonization reduced severity 48.3–55.7% at 20 dpi; antioxidant induction partly attenuated in mycorrhizal plants | 0–20 days post-inoculation |
R = resistant genotype(s); S = susceptible genotype(s); PPO = polyphenol oxidase; PAL = phenylalanine ammonia-lyase; POD = peroxidase; LOX = lipoxygenase; AMF = arbuscular mycorrhizal fungi; CAT = catalase; APX = ascorbate peroxidase; G-POD = guaiacol peroxidase; DPI = days post-inoculation, LTPs= lipid-transfer proteins.
Table 9.
Candidate biomarkers for TLB resistance evaluated against inducibility, throughput/affordability and reproducibility.
Table 9.
Candidate biomarkers for TLB resistance evaluated against inducibility, throughput/affordability and reproducibility.
| Marker class | Key compounds / enzymes | Genotypes evaluated | Key quantitative finding | Throughput / cost | Principal limitation |
|---|---|---|---|---|---|
| Phenylpropanoid phenolics + PPO | Total phenolics; PPO isoenzymes (native-PAGE) | Resistant: DP-25, Duradim, Jhankri Susceptible: N-118 | Phenolics +52.7 to +68.0% (resistant) vs +11.5% (susceptible); PPO +49.1% (DP-25) vs +17.1% (N-118) | High; 96-well colorimetric | Chemically nonspecific – cannot identify individual phenolics (Sahoo et al. (2009)) |
| Ascorbate–glutathione (AsA–GSH) pathway | AsA, GSH, APX, MDAR, DHAR, GR | 30 genotypes; RCMC-5, DP-25, Jhankri, TSL highlighted | RCMC-5: broad induction across pathway; DP-25/Jhankri/TSL: strongest signal in GR only | Moderate; enzymatic assays | Genotype-heterogeneous response; needs multi-enzyme panel, not single marker (Devi et al. (2020) |
| Molecular / transcript markers | 2 putative R-genes, 1 transcription factor, PR genes, LTP transcripts | Resistant vs susceptible taro (SSH + cDNA library screen) | Consistently higher transcript abundance in resistant genotypes | Low–moderate; PCR-based, assay not yet developed | Indicates genetic potential only; not yet a validated diagnostic assay (Sharma et al. (2009) |
| Cross-isolate / cross-environment stability | Lesion area; disease severity index | 25 dasheen parents/hybrids × 3 P. colocasiae isolates × 3 agro-ecological zones (Ghana) | Genotype effect significant; isolate and genotype×isolate effects not significant | Low; multi-season field trial | Only 3 isolates from a single country; provisional evidence (Donkor et al. (2023) |
PPO = polyphenol oxidase; AsA–GSH = ascorbate–glutathione; APX = ascorbate peroxidase; MDAR = monodehydroascorbate reductase; DHAR = dehydroascorbate reductase; GR = glutathione reductase; PR = pathogenesis-related; LTP = lipid transfer protein; SSH = suppression subtractive hybridization.
Table 10.
Principal classes of microbial metabolites implicated in induced systemic resistance (ISR), and their documented or inferred relevance to the taro–Phytophthora colocasiae pathosystem.
Table 10.
Principal classes of microbial metabolites implicated in induced systemic resistance (ISR), and their documented or inferred relevance to the taro–Phytophthora colocasiae pathosystem.
| Metabolite class | Representative producing taxa | Signaling / mechanism | Documented effect (host system studied) | Status in taro-associated strains |
|---|---|---|---|---|
| Cyclic lipopeptides | Bacillus spp. | Direct antibiosis plus JA/ET-dependent ISR priming, independent of pathogen contact | ISR elicitation in bean and other dicots | Inferred: Bacillus is a validated direct antagonist of P. colocasiae; ISR activity not yet tested in taro (Ongena and Jacques 2008) |
| Volatile organic compounds | Bacillus subtilis, B. amyloliquefaciens | Vapor-phase signal; no root contact required | Reduced severity of Erwinia carotovora in Arabidopsis | Not tested; taro is a foliar pathosystem, so above-ground translocation of the signal is unconfirmed (Ryu et al. (2004)) |
| Siderophores | Pseudomonas spp., Trichoderma spp. | Iron sequestration (direct) plus host perception of iron deficiency (indirect signal) | Dual competitive suppression and defense priming (multiple pathosystems) | Inferred: Pseudomonas and Trichoderma strains already validated as direct antagonists (Pieterse et al. 2014) |
| Lytic enzymes / cell-wall-degrading elicitors | Serratia spp., Pseudomonas fluorescens | Direct antagonism; enzymatic breakdown products may act as elicitors | Suppression of P. colocasiae in vitro and in planta | Directly documented in taro; ISR contribution not yet isolated from direct antagonism (Kelbessa et al. 2022) |
| Uncharacterized ISR activity by taxonomic inference | Serratia plymuthica (incl. strains S412, S414, AS13) | Presumed JA/ET-dependent priming, by analogy to a congeneric strain | ISR against leaf pathogens in rice (different host, same species) | Not yet tested in taro; flagged here as the highest-priority follow-up experiment (De Vleesschauwer et al. 2009) |
Table 11.
Comparison of sensor and platform technologies for phenotyping TLB resistance, including measurable traits related to disease, application scales, major strengths, and key limitations.
Table 11.
Comparison of sensor and platform technologies for phenotyping TLB resistance, including measurable traits related to disease, application scales, major strengths, and key limitations.
| Sensor/platform | Primary TLB traits | Best scale | Major strengths | Key limitations |
|---|---|---|---|---|
| RGB: handheld/ground/UAV | Lesion count and area; chlorosis; necrosis; canopy loss | Leaf, plant, plot | Low cost; high spatial detail; compatible with detection and segmentation | Visible symptoms may follow physiological change; illumination and background effects |
| Multispectral | Pigment status; red-edge response; canopy vigor | Plant to field | Faster processing and easier UAV deployment than hyperspectral sensing | Limited bands may not separate TLB from other stresses |
| Hyperspectral | Presymptomatic spectral change; pigment, structure, and water related features | Leaf to plot | Discovers informative wavelengths and physiological signatures | High cost, calibration burden, dimensionality, and mixed pixels |
| Thermal | Canopy temperature; transpiration response | Plant to field | Potential early physiological indicator; rapid mapping | Strong dependence on weather and canopy structure |
| SfM/LiDAR | Height, leaf area, canopy volume, inclination, defoliation | Plant to field | Separates structural decline from spectral effects | Occlusion beneath large overlapping leaves |
| GPR (exploratory) | Corm position/size and below-ground biomass | Plant/plot | Possible non-destructive link between disease trajectory and corm development | Not a direct sensor of foliar disease; soil and depth strongly constrain performance |
Table 12.
Core bioinformatics tools and platforms for phenomics, genomics, metagenomics, metabolomics, and multi-omics integration applicable to taro–Phytophthora colocasiae research.
Table 12.
Core bioinformatics tools and platforms for phenomics, genomics, metagenomics, metabolomics, and multi-omics integration applicable to taro–Phytophthora colocasiae research.
| Data layer | Representative tools/approaches | Major outputs | Application to TLB resistance |
|---|---|---|---|
| Phenomics | RGB, multispectral, hyperspectral and thermal imaging; image analysis; ML/DL | Lesion area, disease progression, spectral and thermal stress traits | Quantitative and longitudinal assessment of disease response |
| Genomics | GWAS, QTL mapping, genomic prediction | SNPs, QTLs, candidate genes, genomic breeding values | Identification and prediction of inherited TLB resistance |
| Metagenomics | QIIME 2; shotgun functional profiling | Microbial taxa, diversity, genes and pathways | Identification of microbial communities and functions associated with resistance |
| Metabolomics | MetaboAnalyst 6.0; GNPS | Metabolites and metabolic pathways | Identification of biochemical signatures associated with host defense |
| Multi-omics integration | mixOmics; sPLS and multi-block analysis | Cross-layer feature associations and predictive signatures | Integration of phenotypic and molecular information for resistance prediction |
| Network analysis | Cytoscape | Integrated biological networks and hub features | Prioritization of candidate biomarkers and resistance mechanisms |
Disclaimer/Publisher’s Note: The statements, opinions and data contained in all publications are solely those of the individual author(s) and contributor(s) and not of MDPI and/or the editor(s). MDPI and/or the editor(s) disclaim responsibility for any injury to people or property resulting from any ideas, methods, instructions or products referred to in the content. |
© 2026 by the authors. Licensee MDPI, Basel, Switzerland. This article is an open access article distributed under the terms and conditions of the Creative Commons Attribution (CC BY) license (http://creativecommons.org/licenses/by/4.0/).
Copyright: This open access article is published under a Creative Commons CC BY 4.0 license, which permit the free download, distribution, and reuse, provided that the author and preprint are cited in any reuse.