
Submitted:
21 September 2026
Posted:
22 September 2026
You are already at the latest version
Abstract
Background/Objectives: Misophonia is characterized by disproportionate emotional and physiological responses to specific "trigger" sounds, often accompanied by self-reported difficulty maintaining focus. Here, we sought to provide objective evidence of such cognitive disruptions by combining behavioral measures of auditory working memory with electroencephalographic (EEG) indices of neural processing. Methods: Fifty-five participants (23 Misophonic, 32 control) completed a pitch-matching WM task under three distractor conditions: individualized trigger sounds, neutral sounds, and silence. EEG was analyzed using a time-frequency approach to assess alpha (8-12 Hz) oscillatory activity during working memory retention at the source level with Independent Component Analyses (ICA). Results: Behaviorally, Misophonic participants exhibited reduced overall working memory performance compared to controls, with no difference between neutral and trigger conditions, suggesting a general deficit in distractor inhibition. EEG results showed lower alpha power across all conditions in the misophonia group, consistent with diminished inhibitory control rather than trigger-specific effects. This lower Alpha appeared to occur for sources in parietal and somatomotor areas. Group differences were apparent in alpha suppression around trigger onset times and alpha enhancements occurring later in retention intervals. Conclusions: Results are consistent with claims made in the literature that Misophonics show impaired attentional control and motor regulation. Implications for Misophonia theoretical models and directions for future research are discussed.
Keywords:
Event-Related Spectral Perturbation (ERSP)
; interference
; attention
; neural oscillations
; sensory disorder
; misophonia
1. Introduction
Misophonia is a condition characterized by disproportionately aversive emotional and physiological responses to seemingly innocuous sounds (Abramovitch et al., 2023; Swedo et al., 2022). These sounds, commonly referred to as “triggers”, can induce abnormally intense feelings of fear, anxiety, anger, and disgust (Ferrer-Torres & Giménez-Llort, 2022; Yilmaz & Hocaoglu, 2021). Prevalence estimates vary, ranging from 15-20% in general populations to 20-25% in college populations (for a review, see Yashitha, 2025). As of this writing, Misophonia lacks official diagnostic criteria, with estimates and classification based on a combination of self-identification and an ever-expanding array of self-assessment scales. Identification of Misophonics has also been made difficult by the condition’s frequent comorbidity with other disorders, including ADHD (Rodrigues & Aazh., 2025; Shan et al., 2026; Woolley et al., 2024), Autism spectrum disorder (Rodrigues & Aazh., 2025; Yamazawa & Midorikawa., 2026), and mood disorders (Karaytug et al., 2026; Shan et al., 2026). Despite these comorbidities, evidence is converging on the conclusion that Misophonia has a unique set of characteristics. These are most apparent in its dissociation from sound level, and in findings that negative reactions are specific to instances when the individual identifies a sound source as a trigger (for extensive discussion, see Jastreboff & Jastreboff, 2023).
Though Misophonia studies have focused heavily on emotional reactions to triggers, there are consequences of trigger presentations for general ongoing cognitive processes as well. In interviews, Misophonics often describe cognitive problems alongside the emotional responses that they experience. Notably, it is commonly reported that Misophonics have trouble shifting attention away from trigger sources: “…The teacher just gets drowned out, so it makes it sometimes hard to learn” (Guzick et al., 2024, p. 40). Using a behavioral measure of cognitive control, Daniels et al. (2020) found that individuals who reported stronger responses to trigger sounds exhibited significantly longer reaction times when trigger sounds were presented during a Stroop task. This was observed specifically for exposure to trigger sounds (e.g., chewing), not to universally unpleasant ones (e.g., crying baby). Those authors took this to mean that misophonia is associated with functional depletion of cognitive control during symptom-provoking contexts (Daniels et al., 2020). In another recent study, Özdeş et al. (2025) examined speech-in-noise performance in two different masking conditions: speech-shaped noise versus speech-shaped noise combined with a buzzing fly sound. The presence of the buzzing fly impaired speech perception for the Misophonia group more so than controls, with no between-group difference apparent in the noise-only condition. Taken together, Misophonia appears to affect ongoing cognitive control processes related to attention allocation (e.g., an inability to inhibit processing of irrelevant sounds). However, more research is needed to establish the specificity of these effects to trigger sounds and to characterize how cognitive control is disrupted.
Cognitive neuroscience research has begun to examine the mechanisms underlying Misophonics’ cognitive disruptions. Using fMRI, Kumar et al. (2017) demonstrated that trigger sounds activate the insula’s salience network more strongly in Misophonics than in controls. This was later replicated by Schröder et al. (2019), who observed heightened activation in the insula, along with other areas that included the anterior cingulate and superior temporal areas of the cortex. In a structural MRI study, Eijsker et al. (2021) found that compared to controls, Misophonics had greater white matter volume and denser nerve fibers in three key pathways: the inferior fronto-occipital fasciculus, the anterior thalamic radiation, and the body of the corpus callosum. These abnormalities were concentrated in circuits governing social-emotional processing and the automatic capture of attention by aversive or threatening stimuli, both of which are centrally relevant to the misophonic experience (Eijsker et al., 2021). These works suggest that Misophonics have problems with inhibiting attention to sound stimuli. Interestingly, some work extends this to the motor system by showing stronger resting-state connectivity between auditory, visual, and ventral premotor (orofacial) cortices, increased auditory–orofacial motor coupling during sound perception, and heightened orofacial motor activation specifically to trigger sounds (Kumar et al., 2021; also see Hansen et al., 2022; 2026). In a 2022 study, a classical conditioning paradigm was applied to misophonia, in which tones of a specific pitch were paired with loud white noise bursts. Participants gave self-reported valence/arousal ratings to each sound while EEG was recorded across habituation and acquisition phases. They found parieto-occipital alpha suppression specific to the conditioned stimulus, and that this suppression was greater in individuals scoring higher on the Misophonia Symptom Scale. Following theoretical frameworks proposing that alpha oscillations are associated with functional inhibition in the brain (e.g., Jensen & Mazaheri, 2010), this could be taken as evidence that Misophonics attend more intently to previously conditioned negative sounds than non-Misophonics.
Although methodologies differ and the specific reported behavioral and neural differences between Misophonics and controls vary, the data generally converge on Misophonics having difficulty disengaging attention from triggering stimuli. This, in turn, could lead to the types of behavioral disruptions that have been observed. Here, we extend this line of inquiry by characterizing working memory disruption at the behavioral level, along with the spatio-temporal dynamics of EEG abnormalities during memory and trigger-sound processing. In our task, individuals attempted to remember the pitch of a “Target” sound during a retention interval under three distraction conditions (Trigger sound, Neutral sound, and silence). After a retention interval (RI), participants attempted to match the target pitch with a continuous response pad that controlled the pitch of a new sound. We assessed behavioral disruptive effects via the accuracy and precision of pitch matches. EEG alpha dynamics were examined at the source level with time-frequency analyses to characterize the temporal and spatial characteristics of cortical inhibition (i.e., as it relates to attention; see Cruz et al., 2025; Jensen & Mazaheri, 2010; Klimesch et al., 1998; Wisniewski et al., 2017). We expected Misophonics to show worse pitch-matching performance than non-Misophonics, with potential specificity to the trigger-exposure condition. Based on cognitive neuroscience literature suggesting heightened activation in fMRI for Misophonics and, in one case, lower alpha (Ward et al., 2022), we expected Misophonics to show a parallel relative decrease in alpha power. We used independent components analysis (ICA) to unmix temporally independent source signals contributing to the channel EEG data (Delorme et al., 2012; Makeig & Onton, 2009). Single-equivalent current dipole modeling of the resulting brain sources enabled spatial resolution of Alpha, while time-frequency decomposition of event-related source dynamics enabled examination of Alpha’s temporal dynamics. This approach allowed us to characterize the spatial and temporal differences between Misophonics and controls to a level not yet achieved with MRI and standard EEG analyses.
2. Materials and Methods
2.1. Participants
Participants were recruited from the Kansas State University community and received course credit or $15/hr for their participation. All gave informed consent. Procedures were pre-approved by Kansas State University’s Institutional Review Board (#IRB-12421) on November 4th, 2024, and were conducted in accordance with the Declaration of Helsinki. Recruitment occurred in two phases. Participants first filled out an online survey. This survey contained the Duke Misophonia Questionnaire (DMQ; Rosenthal et al., 2021), a hyperacusis questionnaire (Khalfa et al., 2002), a self-report of hearing status, and a demographics probe. Further details on the Duke Misophonia and hyperacusis questionnaires are given below. There were 172 respondents for this initial survey.
The top panel of Figure 1 depicts steps taken in the second phase of recruitment to obtain informative Misophonia and control groups. Any individual who reported non-normal hearing or scored ≥22 on the Hyperacusis Questionnaire (for further discussion, see Aazh & Moore, 2017) was deemed ineligible for recruitment. For the remaining individuals, the 12-item Impairment subscale of the DMQ, designed to assess the severity of misophonia-related impairments in daily life, was used to identify Misophonics using predetermined cutoffs in the literature. Those scoring <14 (the cutoff for moderate severity) were classified as controls, and those scoring 14 or higher as Misophonics. This cutoff ensured that participants in the misophonia group exhibited at least moderate impairment, while still allowing a reasonable range of symptom intensity among misophonic participants, rather than biasing the sample by selecting only the end of the scale.
From the survey respondents, 88 participants were recruited. After accounting for participants’ data that was dropped due to technical issues or insurmountable EEG noise, the sample contained 32 controls (21 females, mean age = 25.9 (SD = 12.48) and 23 Misophonics (15 females, mean age = 25.2 (SD =5.77).
2.2. Equipment
Participants sat in a sound-attenuating booth (WhisperRoom, Knoxville, TN) for in-person data collection. During Session 1, all auditory stimuli were presented over Sennheiser HD-280 closed-back headphones connected to an RME UC audio interface (RME Audio, Germany). In Session 2, auditory stimuli were played over two Reftone LD-3 stereo speakers (RefTone, Woodland Hills, California) connected to the same device. On both days, sounds were presented at a comfortable listening level not exceeding 80 dB SPL. Participants used a mouse or moved their finger along a pressure-sensitive Roli Lightpad Block MIDI controller to enter responses, depending on the task. All in person study procedures were programmed in MATLAB (MathWorks, Natick, MA). EEG was collected with a 70-channel BioSemi Active II system (BioSemi, Netherlands). Further details on EEG acquisition are provided in the EEG acquisition and initial processing section.
2.3. Stimuli
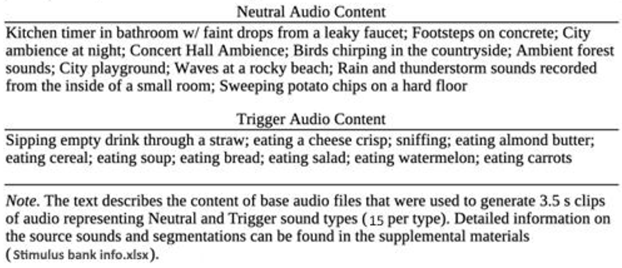
Target sounds for the pitch matching task consisted of 1-second pure tones that ranged in frequency from 200 to 800 Hz. Neutral and trigger sounds used as distractors were 3.5-second sound clips (10 ms on- and off-ramps) taken from larger sound files. These larger sound files consisted of various environmental and human-made sounds sourced from online repositories (Hansen et al., 2021; Samermit et al., 2022). Additionally, all stimuli were edited to be maximally identifiable (Savard et al., 2022). Sounds were all normalized to equal RMS amplitude. Details of each sound clip, including length, description, and original source, are available in the supplemental document ‘Stimulus Bank info.xlsx’ . A description of neutral and trigger stimulus content is given in Table 1.
2.4. Procedures
In-person participation was split into 2 separate sessions (see Figure 1). For Session 1, the first task was a distractor evaluation task in which participants were presented with the 3.5 s clips of all potential distractors. The clips were presented in individually randomized orders. After each clip, the Self-Assessment Manikin (SAM; Bradley & Lang, 1994) was presented on screen. The SAM is a visual tool to assess emotional responses to stimuli. It consists of three sequences of humanoid pictures that function as non-verbal indicators of subjective feelings of pleasure (positive/negative), arousal (minimal/intense), and dominance (feeling in control/out of control) (Bradley & Lang, 1994). This tool has been a staple in emotion research since its inception and continues to be used in clinical and research settings (Adalarasu, 2017; Yang et al., 2018). We used the pleasure (i.e., valence) and arousal aspects of the SAM. Figure 2 shows how the SAM appeared to participants during distractor evaluation.
The ratings were used to assign individualized trigger and neutral stimuli. Specifically, the five trigger sounds that scored lowest in valence and highest in arousal were presented to the participant. This was to ensure that trigger sounds were perceived as sufficiently aversive and intense to maximize the likelihood of producing the expected effects, if they exist. Likewise, neutral sounds were presented only when they had a valence of 5 and an arousal of ≤ 5, ensuring they were neutral and avoiding overly arousing stimuli that could confound the results.
After the Distractor Evaluation part of Session 1, participants all completed practice of the Pitch Matching task (see Figure 3). This practice served to acclimate participants to the unique pitch matching task before we tested them with EEG and distractors. Each trial began with on-screen text displaying the word “Target,” with the target sound being played. This was followed by a 7.5-second silent retention interval (RI). Following the RI, the text prompt “match now” was displayed, prompting participants to use the touchpad to produce a sound with a pitch that matched their memory of the target. Here, moving one’s finger along the pad’s horizontal axis changed the response tone’s pitch from low to high as finger position moved from left to right (ranging from 200 to 800 Hz). Participants had 4 seconds to make their match, after which the last produced pitch was recorded, and the trial ended. At the end of each block, a screen displayed the relationship between the actual pitch of targets and the produced pitch to provide performance feedback. Blocks of training were repeated until a participant displayed an overall median response error of < 3 semitones (see below for measurement details).
For Session 2, participants were informed about the major differences between training and testing. This included adding distractor sounds during the first 3.5 s of the retention interval of the pitch matching task, and that EEG would be recorded throughout their participation in the session. Distractors in the matching task were played during the first 3.5 s of the RI, with the last 4 s being silent, except in the case of the silence condition, in which the entire RI was silent. Participants completed 15 blocks (5 of each type: Trigger, Neutral, and Silence), with each block containing 15 trials. The order of block type was random. Figure 3 depicts what pitch matching trials looked like for Session 2.
To help counter any emotional distress caused by exposure to Misophonia triggers, 2 minutes of neutral silent videos were played at the end of the final block of pitch matching. Our research group has a bank of such videos that we have used in previous research to stave off fatigue (e.g., Wisniewski et al., 2019), and they acted equally well to ensure participants left the session in a neutral emotional state. Participants were also informed of the counseling services offered at Kansas State University should they require them.
2.5. EEG Acquisition and Initial Processing.
EEG data was collected from 70 electrodes with the BioSemi Active II gel-based system. There were 2 single electrodes placed at the mastoids, 2 below the eyes, and 2 to the side of the eyes. The remaining 64 electrodes were fitted within a flexible cap and had locations mapping onto the 10-20 system. EEG data was collected at a 2048 Hz sample rate with 24-bit A/D resolution. Data was referenced online to CMS/DRL of the BioSemi Active II system.
All offline EEG analyses were conducted with EEGLAB (Delorme & Makeig, 2004) and custom MATLAB scripts. The data was down-sampled to 256 Hz, band-pass filtered between 0.5 and 100 Hz, and re-referenced with an average reference. After rejecting data contaminated with excessive noise or movement artifacts through visual inspection, the data were submitted to Infomax independent component analysis (Bell & Sejnowski, 1995). Independent components (ICs) were then labeled as “brain”, "eye", "heart", "muscle", "line noise", "channel noise", or "other" using the ICLabel classifier plugin for EEGLAB (Pion-Tonachini et al., 2019). Examining the first 20 components, those labeled as "eye" with a confidence level≥ 80% by ICLabel were marked and then rejected as eye movement artifacts. No more than 6 components were removed for any individual participant. Data channels removed during the cleaning process were interpolated using spherical interpolation. Epochs were extracted from -4 to 9 seconds surrounding the onset of the RI. The average voltage in the 3 s before RI onset was subtracted for time-domain baseline correction.
2.6. IC Dipole Fitting.
ICs identified as brain by visual inspection of component properties were submitted to single equivalent current dipole fitting of their scalp maps using the dipfit plugin for EEGLAB. Electrode locations were warped to a 3 layer Montreal Neurological Institute (MNI) head model. A best fitting single-equivalent current dipole model was then determined for each IC scalp map through the autofit process in the dipfit plugin. This involved a coarse determination for starting positions in the brain volume, followed by an iterative fine fitting for each IC using nonlinear optimization to minimize the residual variance in accounting for scalp maps.
2.7. IC Clustering.
ICs that were labeled as "brain" through visual inspection of component properties were clustered within and across subjects using k-means, with k set to the mean number of identified brain ICs per subject. This was determined to be 8 after rounding (M = 8.33 brain ICs, SD = 4.89). Input vectors for each IC were made up of dipole model location (X, Y, and Z Talairach coordinates), PCA reduced spectra (3 dimensions) in the range of 3-25 Hz, and PCA reduced scalp maps (3 dimensions), then were fed to k-means. The resulting clusters were then reduced to contain a single IC for each participant originally contributing to the cluster. This was to avoid disproportionate contribution from a single participant (e.g., if that participant contributed several ICs to a cluster).
2.8. Event-Related Spectral Perturbations (ERSPs).
Time-frequency decompositions for ICs were computed using complex Morlet wavelets with 3 cycles at the lowest frequency of 3 Hz to 10 cycles at the highest frequency of 50 Hz. Time-frequency baseline correction was applied using the mean power in a pre-stimulus period (-3 s to -2s), converting raw power to baseline relative power in decibels. This generated the ERSPs used to inspect alpha dynamics.
2.9. Statistical Analysis of Behavioral Data.
Separate accuracy and precision measurements were extracted from the matching data, following the same approach as in previous works (Tollefsrud et al., 2024; Wisniewski, 2024; Wisniewski & Tollefsrud, 2023). This involved fitting individual linear regressions for each participant in each distractor condition, predicting participant pitch matches as a function of the target pitch. Accuracy is then reflected in the mean absolute difference between unity and the regression line (in semitones), while precision is reflected in the standard deviations of the residuals.
These accuracy and precision values were evaluated using linear mixed-effects models fitted via maximum likelihood in MATLAB's Statistics Toolbox. Accuracy and precision were evaluated using separate models. Distractor type (reference-coded to the "neutral" condition), Group (reference-coded to the control group), and their interaction were treated as fixed effects. Individual participant intercepts and slopes for Distractor type and the interaction were included as random effects. In inferential statistical tests, these full models were compared to models with the fixed effect of interest removed. Comparison was made via likelihood ratio tests, with the χ2 degrees of freedom equal to the difference in the number of coefficients between the models being compared. Alpha was set to 0.05.
2.10. Statistical Analyses of EEG Cluster Data.
After identifying topographically significant IC clusters, models were fit separately for each cluster based on visual inspection of the cluster-level ERSP data. Following the approach used for behavioral data, we fit a series of linear mixed-effects models using maximum likelihood estimation in MATLAB's Statistics and Machine Learning Toolbox, with mean power as the dependent variable. Each model included fixed effects of trial condition, time (Time 1 vs. Time 2), and Group (reference-coded to the control group), along with their interactions, to assess whether the neural impact of interference varied across time and Group. Random intercepts and random slopes for time, condition, and their interactions were included for each participant to account for individual variability in power dynamics. Inferential statistical tests were conducted as described for the behavioral data.
3. Results
3.1. Behavioral Data
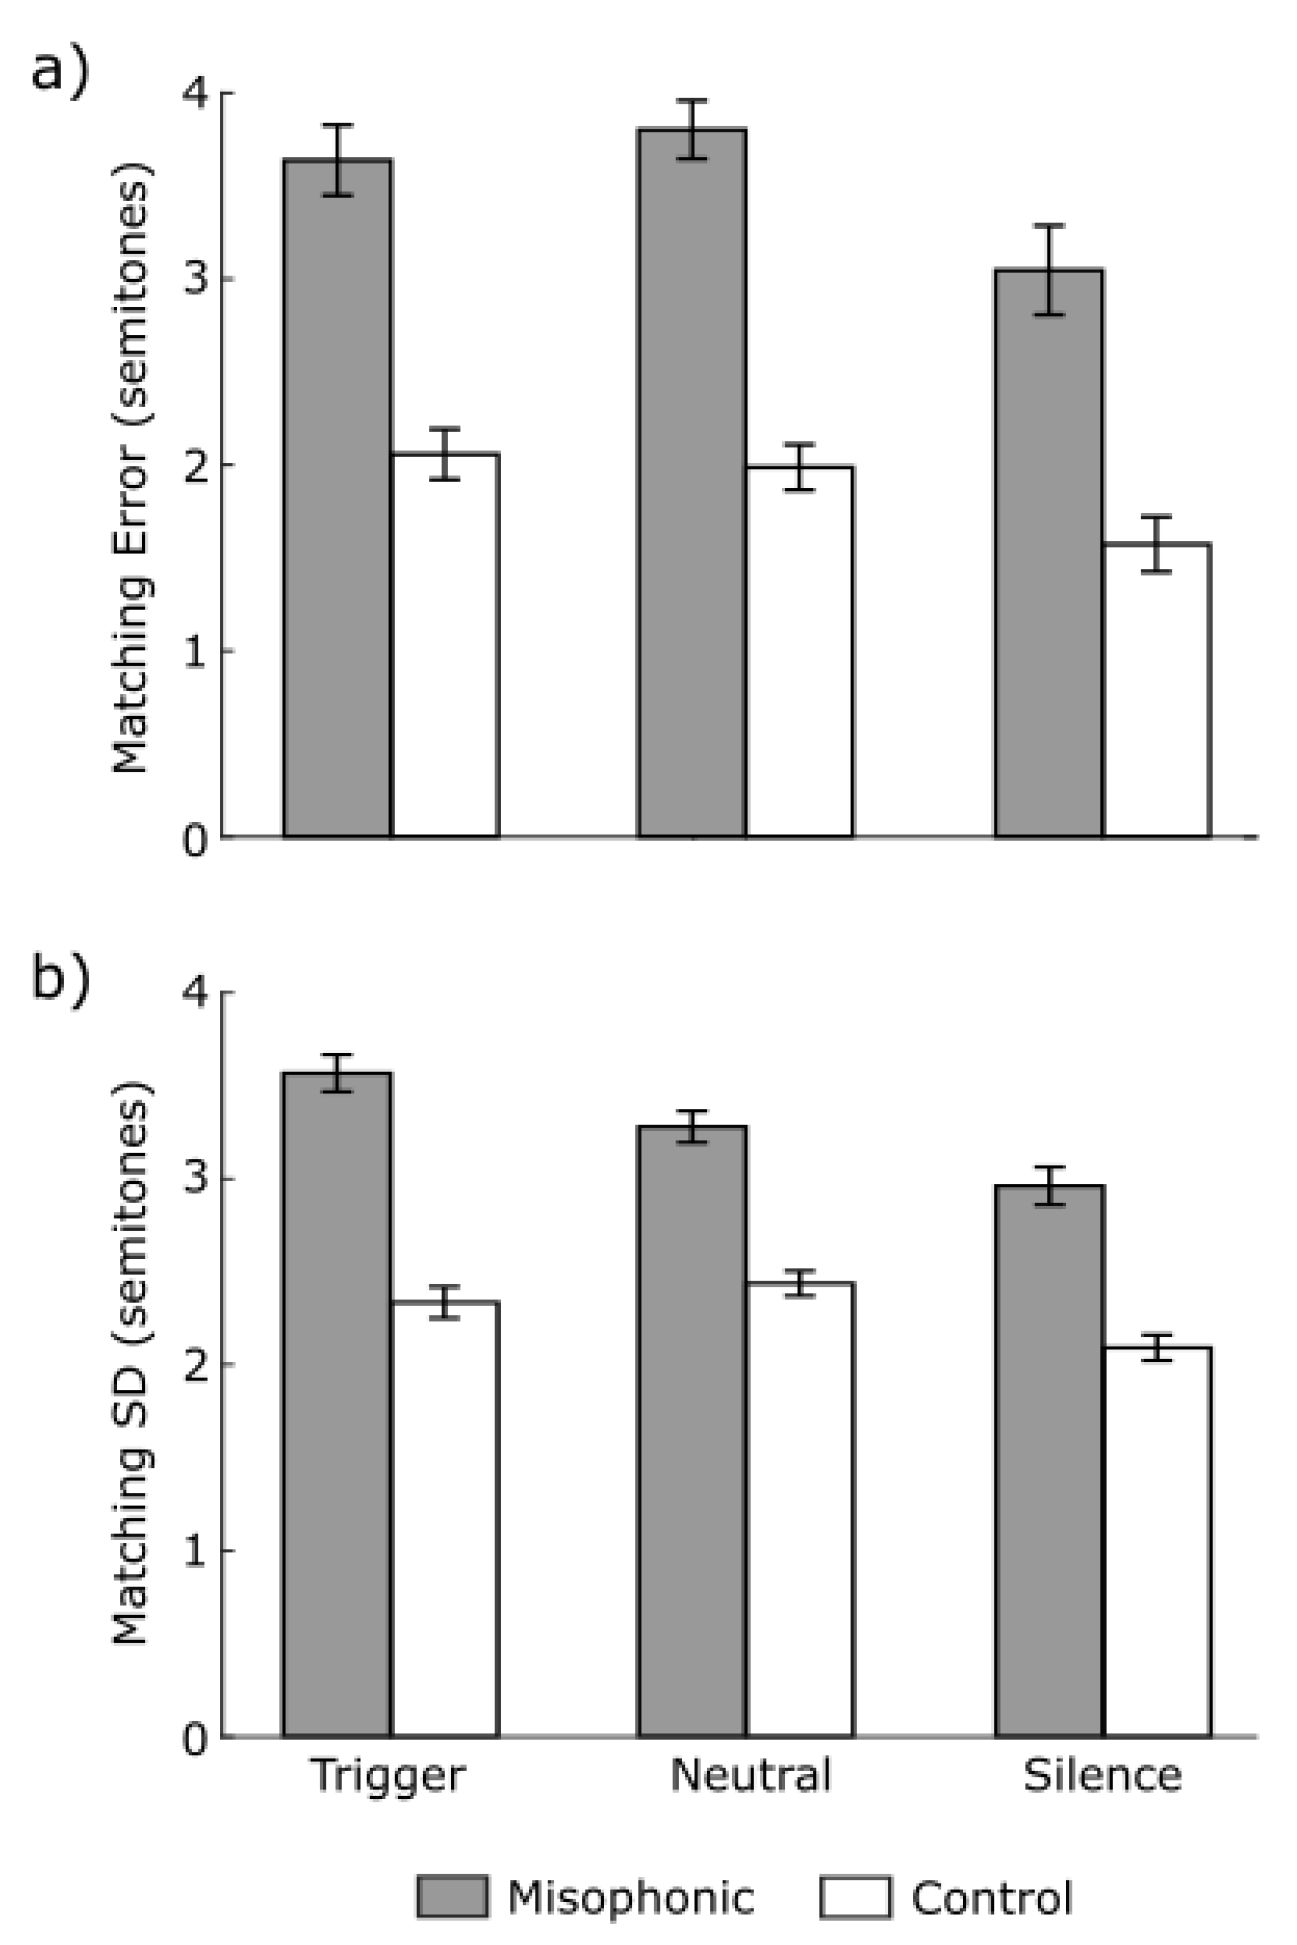
Figure 5 shows the mean accuracy (top) and precision (bottom) data for both the Misophonic Group (filled bars) and the control group (open bars). For the accuracy of target matches, there was a significant effect of distractor type, χ2(2) = 7.69, p = .021, owing largely to more error in the trigger and neutral stimulus conditions compared to the silence condition. Indeed, there was a significant difference between silence and trigger, βcond_trigger = 0.484, t(159) = 2.74, p = .007, and silence and neutral, βcond_neutral = 0.414, t(159) = 2.16, p = .032, but no significant difference between neutral and trigger conditions, βcond_trigger = 0.07, t(159) = 0.31, p = .754. There was, however, a significant effect of Group, χ2(1) = 8.33, p = .004, owing to Misophonics being less accurate overall, βMisophonic = 1.81, t(159) = 2.91, p = .004. The interaction failed to reach significance, χ2(2) = 1.04, p = .594.
The precision of target matches showed similar trends, with a significant effect of distractor type, χ2(2) = 15.35, p < .001, and an overall effect of Group, χ2(1) = 5.15, p = .023, owing to worse precision for Misophonics, βMisophonic = 0.843, t(159) = 2.16, p = .032. As with accuracy, the distractor type effect was driven by the difference between trials with vs without any distractions as evidenced by the silence/trigger difference, βcond_trigger = 0.243, t(159) = 2.03, p = .044, the silent and neutral conditions, βcond_neutral = 0.346, t(159) = 4.21, p < .001, and the lack of difference between trigger and neutral trials, βcond_trigger = -0.102, t(159) = -0.767, p = .444. The Distractor Type x Group interaction was nonsignificant, χ2(2) = 4.13, p = .127.
Figure 4.
(a) Accuracy of pitch matches for groups across the different distractor types. (b) Precision of matches for groups across the different distractor types. Error bars show within-subject standard errors of the mean (Cousineau, 2005).
Figure 4.
(a) Accuracy of pitch matches for groups across the different distractor types. (b) Precision of matches for groups across the different distractor types. Error bars show within-subject standard errors of the mean (Cousineau, 2005).
3.2. ERSPs and Alpha Dynamics
We focused EEG analyses on two clusters of ICs with spectra that had clear peaks in the alpha band. These were a central parietal cluster and a right somatomotor mu rhythm cluster. Several previous studies have revealed clusters of ICs with similar scalp and spectral characteristics (e.g., Delorme et al., 2012; Wisniewski et al., 2017).
3.2.1. Parietal Cluster
The average parietal cluster scalp maps, individual modeled equivalent current dipole locations, and average ERSPs for each Group and distractor type are shown in Figure 5. There were 41 subjects that contributed to this cluster of ICs. The centroid of modeled dipoles was located at or near the posterior cingulate cortex, though the individual modeled dipoles ranged throughout various parietal structures. ERSPs for the parietal cluster seemed to show strong alpha enhancement during retention regardless of the distractor type (~2 s to the retention interval's end). This is consistent with several other studies showing alpha enhancement in parietal areas during the retention of auditory information (e.g., Obleser et al., 2012; Wisniewski et al., 2017). Even more interesting is an apparent difference in the ERSPs of Misophonics compared to controls around the onset of the retention interval. There is alpha suppression before and shortly after the onset of the interval where distractor sounds are presented. This even occurs for the silence condition where no distracting sounds were presented.
Figure 5.
(a) Average scalp map of the ICs (1 per contributing subject) in the parietal cluster. (b) Locations of single equivalent current dipole models for individual ICs within the parietal cluster (blue spheres), plotted within the MNI brain. The red sphere depicts the cluster centroid. (c) Average ERSPs for each group and distractor condition. Dotted lines mark key event times.
Figure 5.
(a) Average scalp map of the ICs (1 per contributing subject) in the parietal cluster. (b) Locations of single equivalent current dipole models for individual ICs within the parietal cluster (blue spheres), plotted within the MNI brain. The red sphere depicts the cluster centroid. (c) Average ERSPs for each group and distractor condition. Dotted lines mark key event times.
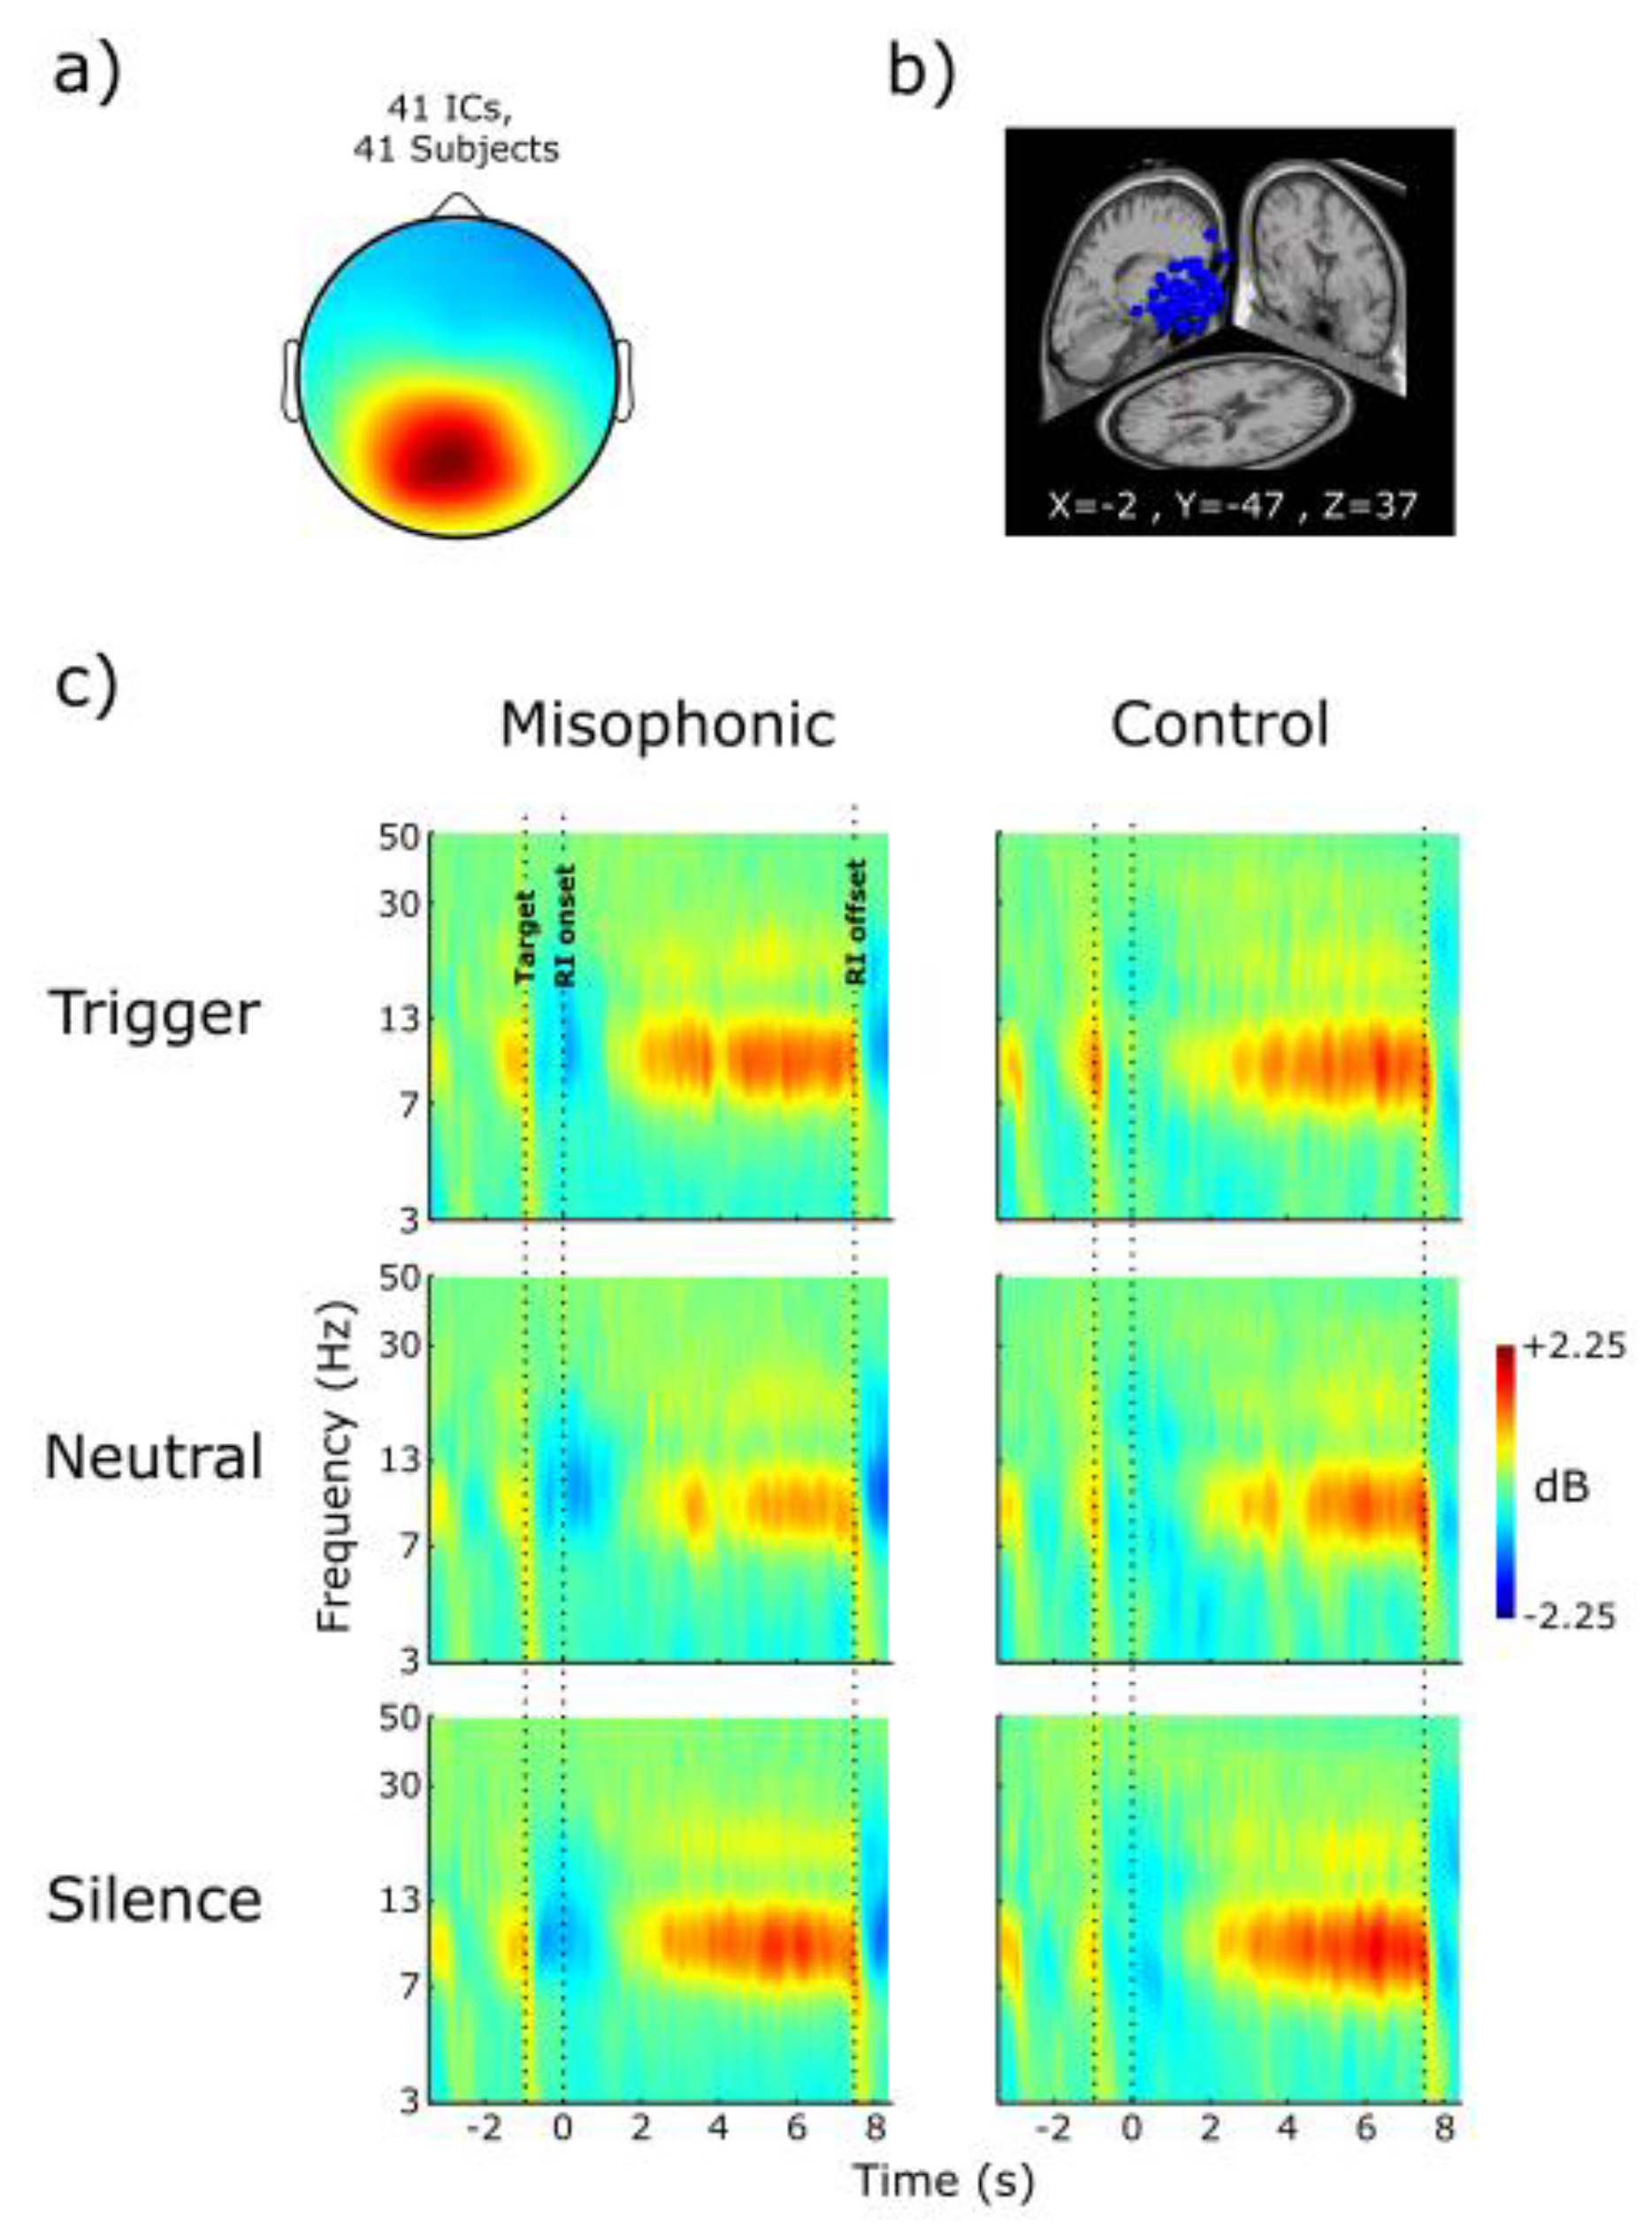
Initial analysis looked at average ERSP values for time 0-3500ms. In this time span, Likelihood ratio tests showed Insignificant main effects of Group, χ2(1) < 0.001, p = .994, trial type, χ2(2) = 2.15, p = .342, and Group × trial type interaction, χ2(4) =1.77, p = .778. Finding no effect for the larger time window, an additional analysis was performed focused on the visually apparent suppression at time -500:500ms for the misophonia group compared to the control group. Within this time window, likelihood ratio tests showed a significant main effect of Group, χ2(1) = 5.35, p = .021, and trial type, χ2(2) = 10.45, p = .005, but an insignificant Group × trial type interaction, χ2(4) = 3.43, p = .489. Looking at the model coefficients showed that the misophonia group had significantly reduced Alpha at time 1 compared to controls overall, βGroup_Misophonic = -1.22, t(234) = -2.38, p = .018, indicating a condition independent suppression in the misophonia group compared to the control group. Additionally, the trial type effect was driven by a significantly higher alpha in trigger trials compared to neutral trials for the control group, βtrialType_Neu = -0.44, t(234) = -2.07, p = .04, with no significant difference between the neutral and silent conditions, βtrialType_Silent = -0.17, t(234) = -0.88, p = .378.
3.2.2. Somatomotor Cluster
The average right somatomotor mu cluster scalp maps, individual modeled equivalent current dipole locations, and average ERSPs for each Group and distractor type are shown in Figure 6. There were 48 participants that contributed to this cluster. The dipole centroid of the cluster was at or near the right primary motor cortex, but some individual dipole models also fell near the right insula. Similar to the parietal cluster, there was strong alpha enhancement during the later parts of the retention interval. There was also enhancement in the beta range as well, a feature that reflects the alpha and beta subparts of somatomotor mu rhythms (for review, see Inamoto et al., 2023). The alpha enhancement during retention appears to be much stronger for the control group than the Misophonic Group.
As with the parietal cluster, an initial analysis was conducted at the 0:3500ms time window. Likelihood ratio tests found Insignificant main effects of group, χ2(1) = 2.80, p = .094, trial type, χ2(2) = 5.66, p = .059, nor their interaction, χ2(4) = 8.60, p = .072. Follow up analysis on the -500:500ms time window found significant main effects of group, χ2(1) = 4.37 , p = .037, but no effect of trial type, χ2(2) = 4.13, p = .127, nor their interaction, χ2(4) = 6.42, p = .170. Inspecting the models showed that, much like in the parietal cluster, the misophonic Group had a significant alpha suppression around the onset of the distractor period across all conditions, βGroup_Misophonic = -0.90, t(276) = -2.14, p = .034, again demonstrating broad processing differences for the misophonia group that are condition independent. A final analysis was done on the somatomotor cluster, focusing on the time window with the visually apparent alpha enhancement for the control group that was absent in the misophonia group (3500:7500ms). The likelihood ratio test found that there was an insignificant difference in alpha enhancement between groups, χ2(1) = 1.10, p = .295.
4. Discussion
Exposure to trigger sounds in Misophonia is often proposed to affect cognitive function in those with the condition. Support for this has relied primarily on anecdotal evidence and self-reports, with few meaningful attempts to objectively measure this impairment (although, see Daniels et al., 2020; Özdeş et al., 2025). This study aimed to experimentally assess whether trigger sounds disrupt auditory working memory in individuals with Misophonia, and whether parallel effects are apparent in the alpha dynamics of EEG. Groups of Misophonic and Control participants performed a pitch matching auditory working memory task under conditions in which retention intervals contained trigger sounds, neutral sounds, or silence. High-density EEG (70-channel) was recorded throughout, then decomposed by ICA offline to characterize alpha power dynamics of brain sources during memory retention.
In behavior, distractors (triggers and neutral sounds) reduced both the accuracy and precision of pitch-matching responses relative to silence for both groups of subjects. There was no statistically detectable interaction between distractor type and Group. However, Misophonics did perform worse for pitch matching across all distractor types. Though this finding is consistent with self-reports from Misophonics that exposure to triggers impairs concentration (Edelstein et al., 2013; Johnson et al., 2013), the distractor type generalizability of this impairment runs counter to some data showing that disruptions in Stroop task performance are specific to triggers in Misophonics (Daniels et al., 2020). The generally worse performance that we see could be because Misophonics have a general deficiency in auditory working memory. We believe this to be unlikely based on several studies finding that Misophonics perform similarly to control groups in a variety of other cognitive tasks (Abramovitch et al., 2023; Eijsker et al., 2021). An alternative possibility is that the disruption of trigger presentation for Misophonics extends long after a single trial to impact performance in subsequent trials. This could happen, for instance, if the potential for hearing a trigger makes Misophonics hypervigilant (Murphy et al., 2024). This idea has been likened to a similar concept in pain research describing how those with chronic pain use more cognitive resources for self-regulation and attention than healthy people (Savard & Coffey, 2025). Under this framing, it could be inferred that the common strain of dealing with misophonia triggers could result in reduced cognitive resources for tasks when the possibility of triggers is present, even without direct exposure at any given moment.
The alpha results are somewhat consistent with the latter possibility. The most widely held current view on the functional role of Alpha in the brain is that it serves to control the balance of excitation and inhibition in the cortex (Jensen & Mazaheri, 2010; Klimesch, 2012). Strong Alpha inhibits processing, as evidenced by the Alpha phase dependent gating of action potentials. The suppression of Alpha oscillations releases cortex from this inhibition (for review, see Klimesch et al., 2007). We found here that Alpha power in both a parietal and somatomotor cluster of ICs was lower for Misophonics than the control group. Like the behavioral data, this effect was nonspecific to distractor type. Lower Alpha in the parietal cluster for Misophonics could be interpreted as a kind of hypervigilance in anticipatory attention, especially since differences in the suppression of Alpha were observed prior to, and during, the period in which distractors could be presented. The significant early alpha reduction for the Misophonia group's somatomotor cluster, where enhancement has been associated with inhibition of the motor system during auditory working memory tasks (e.g., Wisniewski & Zakrzewski, 2023), draws a parallel with other neuroimaging data showing stronger motor system activation for Misophonics (Kumar et al., 2021; Hansen et al., 2022; 2026). For instance, one resting state fMRI study found that Misophonic versus control group differences were not confined to orofacial areas, but instead spanned primary motor and somatosensory regions more broadly (Hansen et al., 2022). This included finger-related motor and somatosensory connectivity differences in the Misophonia group (Hansen et al., 2022). One model of misophonia proposed by Kumar and colleagues (Kumar et al., 2021) suggests that heightened distress in Misophonia arises from aberrant salience attribution and atypical interoception associated with dysfunction of insular areas (Kumar et al., 2017). This distress may be further amplified by hyperactivity in oral–facial motor regions. Though our findings were not trigger-specific and included parietal alpha effects, the data are generally consistent with this model. It is possible that attentional control mediated by parietal networks sets up Misophonics for the exaggerated salience responses observed in the insular cortex (e.g., Behrmann et al., 2004).
Some considerations need to be made in the interpretation of our findings. First, while participants were screened for hyperacusis and gross hearing abnormalities, formal clinical interviews were not conducted, meaning that undiagnosed comorbidities (e.g., anxiety or attentional disorders) could have influenced group differences. The incorporation of clinical interviews would allow greater control over potential confounding comorbidities in Misophonia by identifying them in potential samples. Another area of limitation involves the working memory task that we employed. Although the pitch-matching task provides a controlled and sensitive measure of auditory working memory, it may not fully capture the complexity of cognitive disruptions experienced by Misophonics in real-world environments. For instance, verbal communication often takes place in environments where Misophonic triggers are common, such as during meals. Given that pitch information can be processed independently from verbal content (Deutsch, 1970), performance on the pitch-based task used in this study may not fully generalize to more ecologically valid situations, such as holding a conversation while exposed to trigger sounds. Future work could include alternative working memory tasks to examine whether the observed effects generalize beyond the current paradigm. In particular, adding a continuous visual working memory task alongside audio-visual stimuli would help determine whether the effects are domain-general or specific to the auditory modality.
5. Conclusions
This study represents a comprehensive effort to empirically assess the cognitive consequences of Misophonic trigger exposure using both behavioral and EEG measures. The work demonstrates that Misophonics experience measurable disruptions to working memory fidelity and exhibit distinct neural signatures of impaired attentional control and motor inhibition. While effects were not specific to a specific distractor type (e.g., triggers), the overall pattern suggests that Misophonia is associated with heightened vulnerability to distraction and abnormalities in attention. These findings lay the groundwork for future research aimed at clarifying the mechanisms of Misophonia, developing ecologically valid assessments, and evaluating intervention strategies with objective performance-based measures.
Supplementary Materials
The following supporting information can be downloaded at the website of this paper posted on Preprints.org, ‘Stimulus Bank info.xlsx’.
Author Contributions
Conceptualization, M.A.T; methodology, M.A.T and M.G.W; formal analysis, M.A.T; investigation, M.A.T; resources, M.G.W; writing—original draft preparation, M.A.T; writing—review, M.G.W; visualization, M.G.W; supervision, M.G.W; project administration, M.A.T; funding acquisition, M.G.W. All authors have read and agreed to the published version of the manuscript.
Funding
This work was supported in part by the National Science Foundation [#2341582] and National Institutes of Health [#P20GM113109].
Institutional Review Board Statement
Procedures were pre-approved by Kansas State University’s Institutional Review Board and were conducted in accordance with the Declaration of Helsinki.
Informed Consent Statement
Written informed consent was obtained from all participants.
Data Availability Statement
The original data presented in the study are openly available in openneuro.org, at https://doi.org/10.18112/openneuro.ds008003.v1.1.0.
Acknowledgments
Special thanks are given to Stormont vail for help in recruiting Misophonic participants.
Conflicts of Interest
The authors declare no conflicts of interest, and the funders had no role in the design of the study; in the collection, analyses, or interpretation of data; in the writing of the manuscript; or in the decision to publish the results.
References
- Aazh, H.; Moore, B. C. J. Factors related to uncomfortable loudness levels for patients seen in a tinnitus and hyperacusis clinic. Int. J. Audiol. 2017, 56(10), 793–800. [Google Scholar] [CrossRef] [PubMed]
- Abramovitch, A.; Herrera, T. A.; Etherton, J. L. A neuropsychological study of misophonia. J. Behav. Ther. Exp. Psychiatry 2023, 101897. [Google Scholar] [CrossRef] [PubMed]
- Adalarasu, K. Emotion analysis using SAM (Self-Assessment Manikin) scale. BioMed Res. 2017. [Google Scholar]
- Behrmann, M.; Geng, J. J.; Shomstein, S. Parietal cortex and attention. Curr. Opin. Neurobiol. 2004, 14(2), 212–217. [Google Scholar] [CrossRef] [PubMed]
- Bell, A. J.; Sejnowski, T. J. An Information-Maximization Approach to Blind Separation and Blind Deconvolution. Neural Comput. 1995, 7(6), 1129–1159. [Google Scholar] [CrossRef] [PubMed]
- Bradley, M. M.; Lang, P. J. Measuring emotion: The self-assessment manikin and the semantic differential. J. Behav. Ther. Exp. Psychiatry 1994, 25(1), 49–59. [Google Scholar] [CrossRef] [PubMed]
- Cousineau, D. Confidence intervals in within-subject designs: A simpler solution to Loftus and Masson’s method. Tutor. Quant. Methods Psychol. 2005, 1(1), 42–45. [Google Scholar] [CrossRef]
- Cruz, G.; Melcón, M.; Sutandi, L.; Matias Palva, J.; Palva, S.; Thut, G. Oscillatory Brain Activity in the Canonical Alpha-Band Conceals Distinct Mechanisms in Attention. J. Neurosci. 2025, 45(1), e0918242024. [Google Scholar] [CrossRef] [PubMed]
- Daniels, E. C.; Rodriguez, A.; Zabelina, D. L. Severity of misophonia symptoms is associated with worse cognitive control when exposed to misophonia trigger sounds. PLoS ONE 2020, 15(1), e0227118. [Google Scholar] [CrossRef] [PubMed]
- Delorme, A.; Makeig, S. EEGLAB: An open source toolbox for analysis of single-trial EEG dynamics including independent component analysis. J. Neurosci. Methods 2004, 134(1), 9–21. [Google Scholar] [CrossRef] [PubMed]
- Delorme, A.; Palmer, J.; Onton, J.; Oostenveld, R.; Makeig, S. Independent EEG sources are dipolar. PLoS ONE 2012, 7, 30135. [Google Scholar] [CrossRef] [PubMed]
- Deutsch, D. Tones and Numbers: Specificity of Interference in Immediate Memory. Science 1970, 168(3939), 1604–1605. [Google Scholar] [CrossRef] [PubMed]
- Edelstein, M.; Brang, D.; Rouw, R.; Ramachandran, V. S. Misophonia: Physiological investigations and case descriptions. Front. Hum. Neurosci. 2013, 7. [Google Scholar] [CrossRef] [PubMed]
- Eijsker, N.; Schröder, A.; Liebrand, L. C.; Smit, D. J. A.; van Wingen, G.; Denys, D. White matter abnormalities in misophonia. NeuroImage Clin. 2021, 102787. [Google Scholar] [CrossRef] [PubMed]
- Ferrer-Torres, A.; Giménez-Llort, L. Misophonia: A Systematic Review of Current and Future Trends in This Emerging Clinical Field. Int. J. Environ. Res. Public Health 2022, 19(11), 6790. [Google Scholar] [CrossRef] [PubMed]
- Guzick, A. G.; Rast, C. E.; Maddox, B. B.; Rodriguez Barajas, S.; Clinger, J.; McGuire, J.; Storch, E. A. “How Can I Get Out of This?”: A Qualitative Study of the Phenomenology and Functional Impact of Misophonia in Youth and Families. Psychopathology 2024, 1–11. [Google Scholar] [CrossRef] [PubMed]
- Hansen, H. A.; Leber, A. B.; Saygin, Z. M. What sound sources trigger misophonia? Not just chewing and breathing. J. Clin. Psychol. 2021, 77(11), 2609–2625. [Google Scholar] [CrossRef] [PubMed]
- Hansen, H. A.; Norris, J. E.; Bain, C. M.; Ethridge, L. E.; Tardif, C. L. Selective Disruption of Salience-Network Anterior Insula Connectivity in Misophonia: A Disorder-Specific Neural Signature. Hum. Brain Mapp. 2026, 47(3), e70468. [Google Scholar] [CrossRef] [PubMed]
- Hansen, H. A.; Stefancin, P.; Leber, A. B.; Saygin, Z. M. Neural evidence for non-orofacial triggers in mild misophonia. Front. Neurosci. 2022, 16, 880759. [Google Scholar] [CrossRef] [PubMed]
- Inamoto, T.; Ueda, M.; Ueno, K.; Shiroma, C.; Morita, R.; Naito, Y.; Ishii, R. Motor-Related Mu/Beta Rhythm in Older Adults: A Comprehensive Review. Brain Sci. 2023, 13(5), 751. [Google Scholar] [CrossRef] [PubMed]
- Jastreboff, P.; Jastreboff, M. The neurophysiological approach to misophonia: Theory and treatment. Front. Neurosci. 2023, 17, 895574. [Google Scholar] [CrossRef] [PubMed]
- Jensen, O.; Mazaheri, A. Shaping functional architecture by oscillatory alpha activity: Gating by inhibition. Front. Hum. Neurosci. 2010, 4, 186. [Google Scholar] [CrossRef] [PubMed]
- Johnson, P. L.; Webber, T. A.; Wu, M. S.; Lewin, A. B.; Murphy, T. K.; Storch, E. A. When selective audiovisual stimuli become unbearable: A case series on pediatric misophonia. Neuropsychiatry 2013, 3(6), 569–575. [Google Scholar] [CrossRef]
- Karaytuğ, M. O.; Tamam, L.; Demirkol, M. E.; Namlı, Z.; Yeşiloğlu, C.; Çetin Demirtaş, S.; Kurt, A. M.; Çakar, H. N.; Altın, E. D.; Gürbüz, M. Misophonia in Individuals with Obsessive–Compulsive Disorder: Its Relationship with Anxiety Sensitivity and Mindfulness. Medicina 2026, 62(1), 216. [Google Scholar] [CrossRef] [PubMed]
- Khalfa, S.; Dubal, S.; Veuillet, E.; Perez-Diaz, F.; Jouvent, R.; Collet, L. Psychometric Normalization of a Hyperacusis Questionnaire. ORL 2002, 64(6), 436–442. [Google Scholar] [CrossRef] [PubMed]
- Klimesch, W. Alpha-band oscillations, attention, and controlled access to stored information. Trends Cogn. Sci. 2012, 16, 606–617. [Google Scholar] [CrossRef] [PubMed]
- Klimesch, W.; Doppelmayr, M.; Russegger, H.; Pachinger, T.; Schwaiger, J. Induced alpha band power changes in the human EEG and attention. Neurosci. Lett. 1998, 244(2), 73–76. [Google Scholar] [CrossRef] [PubMed]
- Klimesch, W.; Sauseng, P.; Hanslmayr, S. EEG alpha oscillations: The inhibition–timing hypothesis. Brain Res. Rev. 2007, 53(1), 63–88. [Google Scholar] [CrossRef] [PubMed]
- Kumar, S.; Dheerendra, P.; Erfanian, M.; Benzaquén, E.; Sedley, W.; Gander, P. E.; Lad, M.; Bamiou, D. E.; Griffiths, T. D. The Motor Basis for Misophonia. J. Neurosci. 2021, 41(26), 5762–5770. [Google Scholar] [CrossRef] [PubMed]
- Kumar, S.; Tansley-Hancock, O.; Sedley, W.; Winston, J. S.; Callaghan, M. F.; Allen, M.; Cope, T. E.; Gander, P. E.; Bamiou, D.-E.; Griffiths, T. D. The Brain Basis for Misophonia. Curr. Biol. 2017, 27(4), 527–533. [Google Scholar] [CrossRef] [PubMed]
- Makeig, S.; Debener, S.; Onton, J.; Delorme, A. Mining event-related brain dynamics. Trends Cogn. Sci. 2004, 8(5), 204–210. [Google Scholar] [CrossRef] [PubMed]
- Makeig, S.; Onton, J. ERP Features and EEG Dynamics: An ICA Perspective; 2011. [Google Scholar]
- Murphy, N.; Lijffijt, M.; Guzick, A. G.; Cervin, M.; Clinger, J.; Smith, E. E. A.; Draper, I.; Rast, C. E.; Goodman, W. K.; Schneider, S.; Storch, E. A. Alterations in attentional processing in youth with misophonia: A phenotypical cross-comparison with anxiety patients. J. Affect. Disord. 2024, 347, 429–436. [Google Scholar] [CrossRef] [PubMed]
- Obleser, J.; Weisz, N. Suppressed Alpha Oscillations Predict Intelligibility of Speech and its Acoustic Details. Cereb. Cortex 2012, 22(11), 2466–2477. [Google Scholar] [CrossRef] [PubMed]
- Özdeş, N. Ö.; Yılmaz, S. T. When Everyday Sounds Become Barriers: The Effect of Misophonia on Speech Perception. Brain Behav. 2025, 15(10), e70924. [Google Scholar] [CrossRef] [PubMed]
- Pion-Tonachini, L.; Kreutz-Delgado, K.; Makeig, S. ICLabel: An automated electroencephalographic independent component classifier, dataset, and website. NeuroImage 2019, 198, 181–197. [Google Scholar] [CrossRef] [PubMed]
- Rodrigues, A. L. M.; Aazh, H. Psychiatric Comorbidities in Hyperacusis and Misophonia: A Systematic Review. Audiol. Res. 2025, 15(4), 101. [Google Scholar] [CrossRef] [PubMed]
- Rosenthal, M. Z.; Anand, D.; Cassiello-Robbins, C.; Williams, Z. J.; Guetta, R. E.; Trumbull, J.; Kelley, L. D. Development and Initial Validation of the Duke Misophonia Questionnaire. Front. Psychol. 2021, 12, 709928. [Google Scholar] [CrossRef] [PubMed]
- Samermit, P.; Young, M.; Allen, A. K.; Trillo, H.; Shankar, S.; Klein, A.; Kay, C.; Mahzouni, G.; Reddy, V.; Hamilton, V.; Davidenko, N. Development and Evaluation of a Sound-Swapped Video Database for Misophonia. Front. Psychol. 2022, 13, 890829. [Google Scholar] [CrossRef] [PubMed]
- Savard, M.-A.; Coffey, E. B. J. Toward cognitive models of misophonia. Hear. Res. 2025, 109184. [Google Scholar] [CrossRef] [PubMed]
- Schröder, A.; van Wingen, G.; Eijsker, N.; San Giorgi, R.; Vulink, N. C.; Turbyne, C.; Denys, D. Misophonia is associated with altered brain activity in the auditory cortex and salience network. Sci. Rep. 2019, 9(1), 7542. [Google Scholar] [CrossRef] [PubMed]
- Shan, Y.; Chen, B.; Moskovich, A. A.; Siepsiak, M.; Wang, S.; Rosenthal, M. Z. Real-time emotional responses to trigger sounds in misophonia: An ecological momentary assessment study. J. Affect. Disord. 2026, 403, 121429. [Google Scholar] [CrossRef] [PubMed]
- Swedo, S. E.; Baguley, D. M.; Denys, D.; Dixon, L. J.; Erfanian, M.; Fioretti, A.; Jastreboff, P. J.; Kumar, S.; Rosenthal, M. Z.; Rouw, R.; Schiller, D.; Simner, J.; Storch, E. A.; Taylor, S.; Werff, K. R. V.; Altimus, C. M.; Raver, S. M. Consensus Definition of Misophonia: A Delphi Study. Front. Neurosci. 2022, 16, 841816. [Google Scholar] [CrossRef] [PubMed]
- Tollefsrud, M. A.; Joyner, C. N.; Zakrzewski, A. C.; Wisniewski, M. G. Not fully remembered, but not forgotten: Interfering sounds worsen but do not eliminate the representation of pitch in working memory. In Attention, Perception, & Psychophysics; 2024. [Google Scholar] [CrossRef] [PubMed]
- Ward, R. T.; Gilbert, F. E.; Pouliot, J.; Chiasson, P.; McIlvanie, S.; Traiser, C.; Riels, K.; Mears, R.; Keil, A. The Relationship Between Self-Reported Misophonia Symptoms and Auditory Aversive Generalization Leaning: A Preliminary Report. Front. Neurosci. 2022, 16, 899476. [Google Scholar] [CrossRef] [PubMed]
- Wisniewski, M. G. Indices of Effortful Listening Can Be Mined from Existing Electroencephalographic Data. Ear Hear. 2017, 38(1), e69–e73. [Google Scholar] [CrossRef] [PubMed]
- Wisniewski, M. G.; Church, B. A.; Mercado, E.; Radell, M. L.; Zakrzewski, A. C. Easy-to-hard effects in perceptual learning depend upon the degree to which initial trials are “easy.”. Psychon. Bull. Rev. 2019, 26(6), 1889–1895. [Google Scholar] [CrossRef] [PubMed]
- Wisniewski, M. G.; Joyner, C. N.; Zakrzewski, A. C.; Makeig, S. Finding tau rhythms in EEG: An independent component analysis approach. Hum. Brain Mapp. 2024, 45(2), e26572. [Google Scholar] [CrossRef] [PubMed]
- Wisniewski, M. G.; Tollefsrud, M. A. Auditory short-term memory for pitch loses precision over time. JASA Express Lett. 2023, 3(3), 034402. [Google Scholar] [CrossRef] [PubMed]
- Wisniewski, M. G.; Zakrzewski, A. C. Effortful Listening Produces Both Enhancement and Suppression of Alpha in the EEG. Audit. Percept. Cogn. 2023, 6(3–4), 289–299. [Google Scholar] [CrossRef] [PubMed]
- Woolley, M. G.; Capel, L. K.; Bowers, E. M.; Petersen, J. M.; Muñoz, K.; Twohig, M. P. Clinical characteristics of a treatment seeking sample of adults with misophonia: Onset, course, triggers, context, and comorbidity. J. Obsessive-Compuls. Relat. Disord. 2024, 43, 100915. [Google Scholar] [CrossRef]
- Yamazawa, Y.; Midorikawa, A. Relationships among hyperacusis, misophonia, and autistic traits in a non-clinical population. Int. J. Dev. Disabil. 2026, 1–12. [Google Scholar] [CrossRef]
- Yang, W.; Makita, K.; Nakao, T.; Kanayama, N.; Machizawa, M. G.; Sasaoka, T.; Sugata, A.; Kobayashi, R.; Hiramoto, R.; Yamawaki, S.; Iwanaga, M.; Miyatani, M. Affective auditory stimulus database: An expanded version of the International Affective Digitized Sounds (IADS-E). Behav. Res. Methods 2018, 50(4), 1415–1429. [Google Scholar] [CrossRef] [PubMed]
- Yashitha M. P., H. Y. D. (2025). Misophonia: A Scientific Review on Etiology, Pathophysiology, and Therapeutic Approaches. [CrossRef]
- Yilmaz, Y.; Hocaoglu, C. Misophonia: A Review. Psikiyatr. Guncel Yaklasimlar-Curr. Approaches Psychiatry 2021, 13(2), 383–393. [Google Scholar]
Figure 1.
Depiction of the order of procedures and key aspects of group and stimulus assignment.
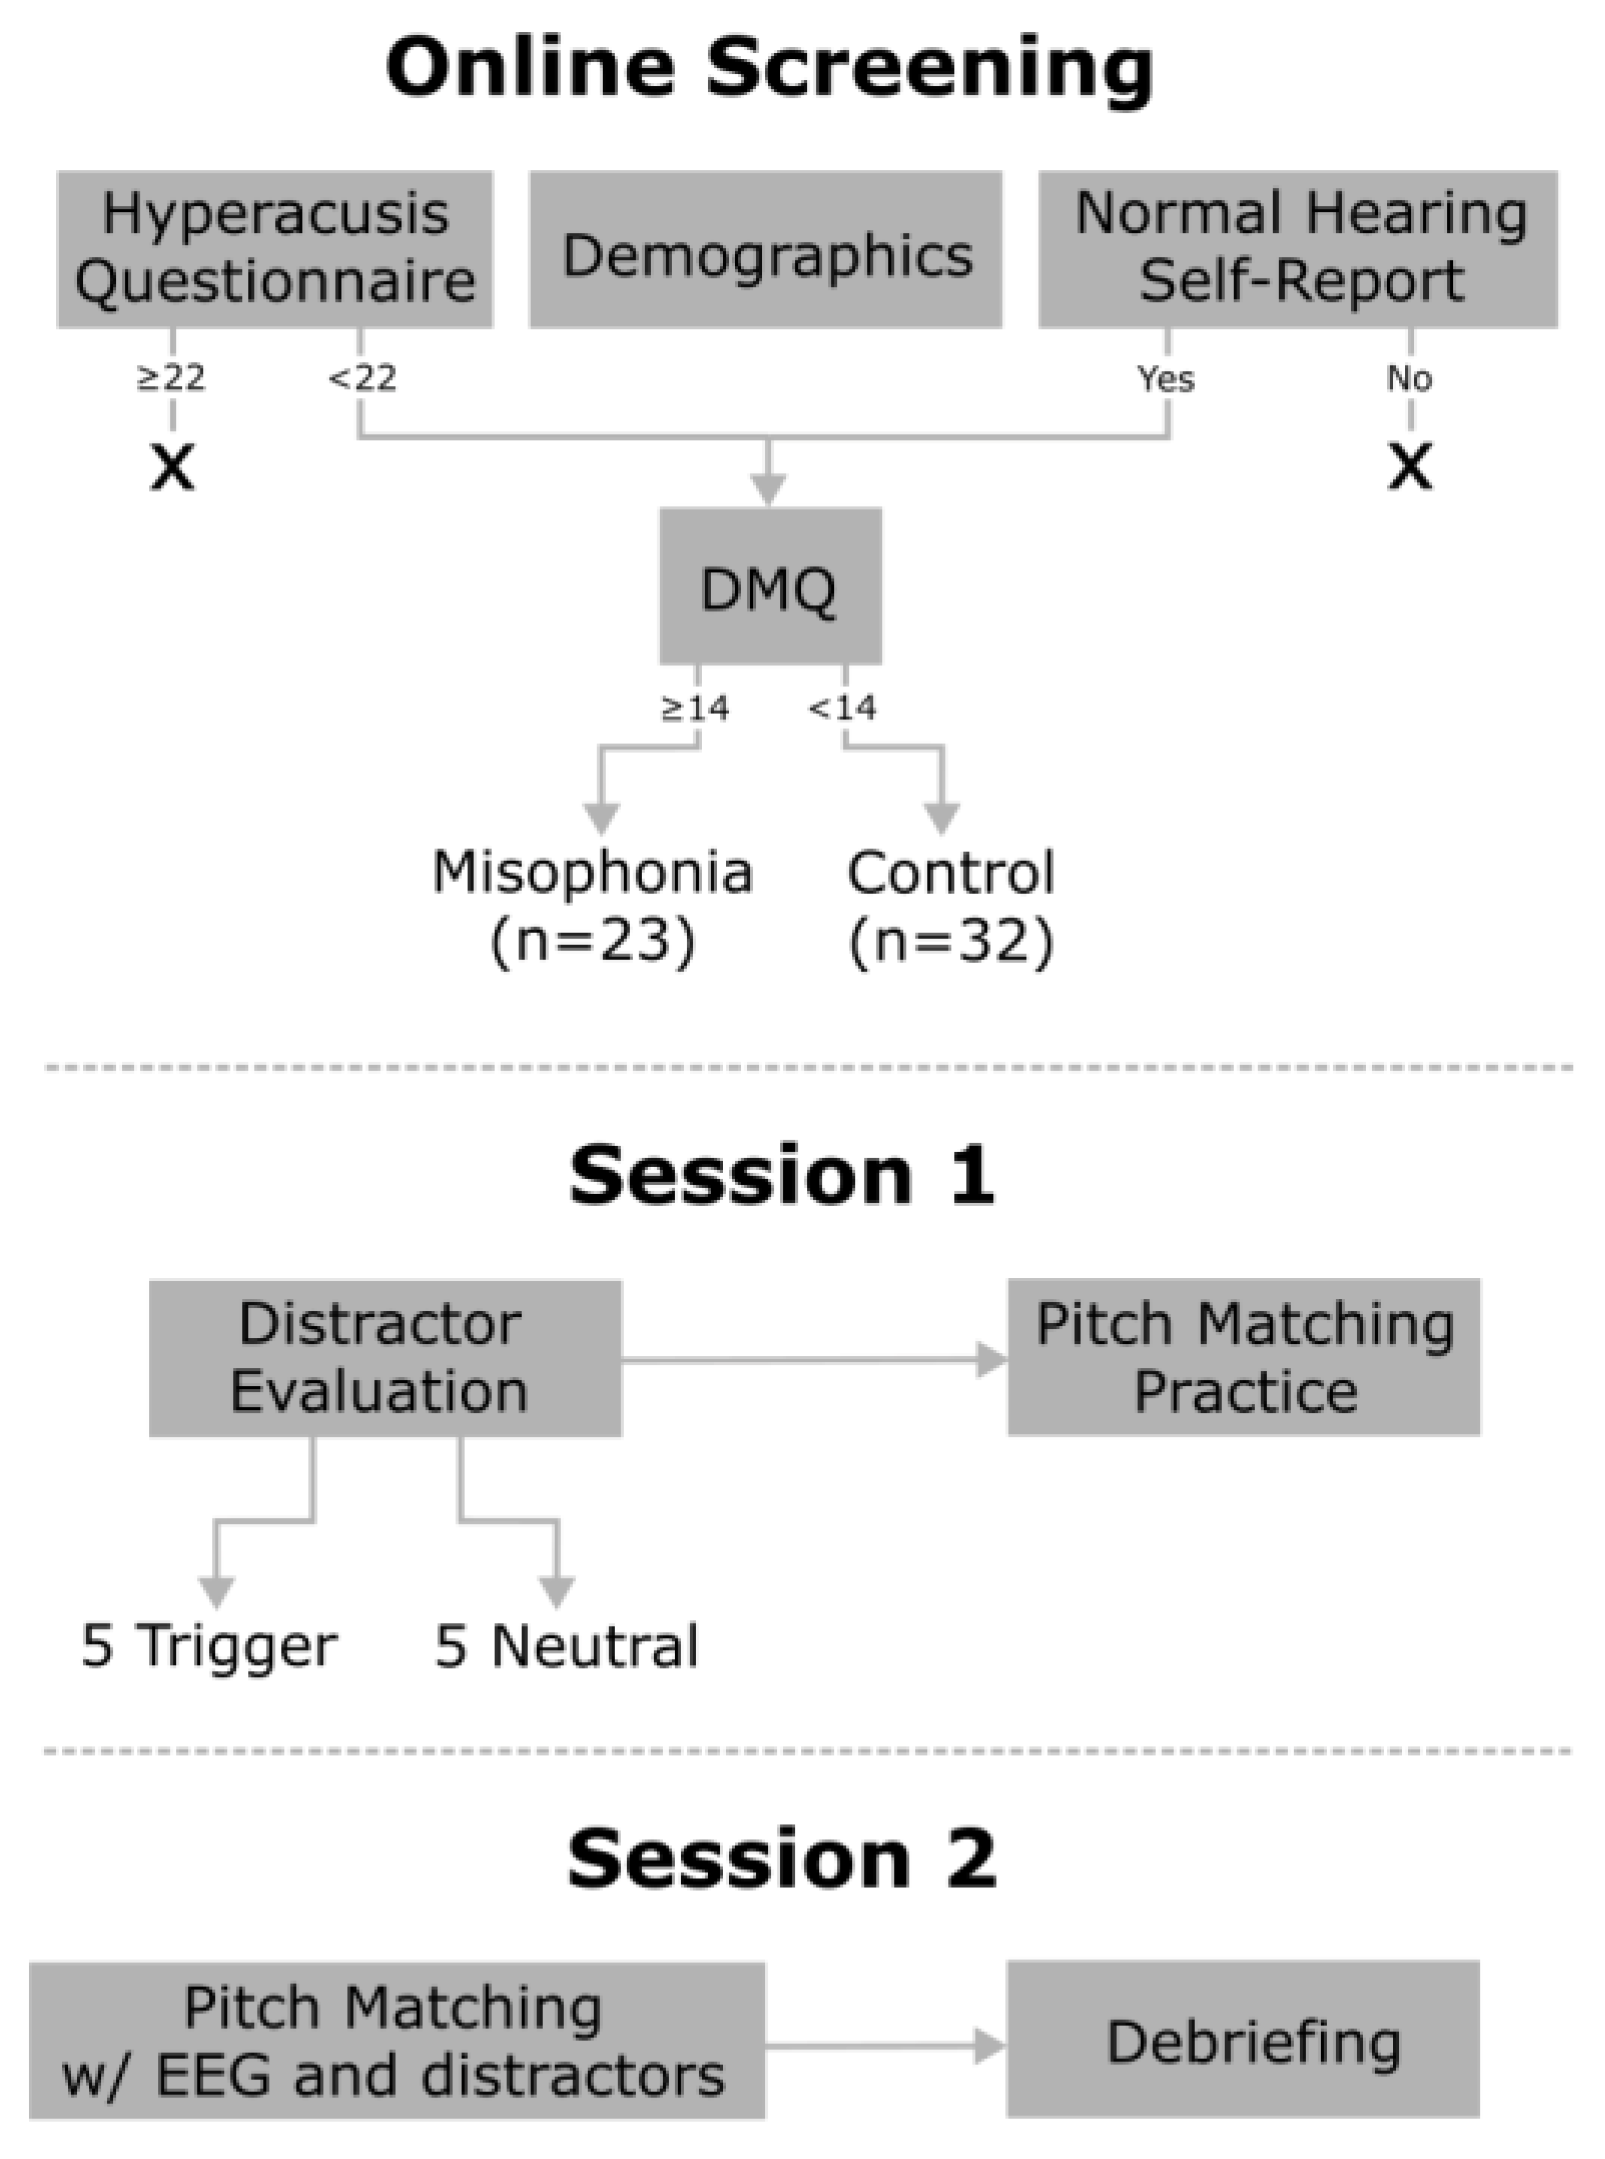
Figure 2.
Depiction of the SAM screen that was presented to participants after presentation of a potential distractor sound. The screen depicts humanoid figures illustrating various levels of valence (negative on the left and positive on the right) and arousal (calm on the left and aroused on the right). Note that the response toggle circles represent 1-9 from the left to the right on the scale.
Figure 2.
Depiction of the SAM screen that was presented to participants after presentation of a potential distractor sound. The screen depicts humanoid figures illustrating various levels of valence (negative on the left and positive on the right) and arousal (calm on the left and aroused on the right). Note that the response toggle circles represent 1-9 from the left to the right on the scale.
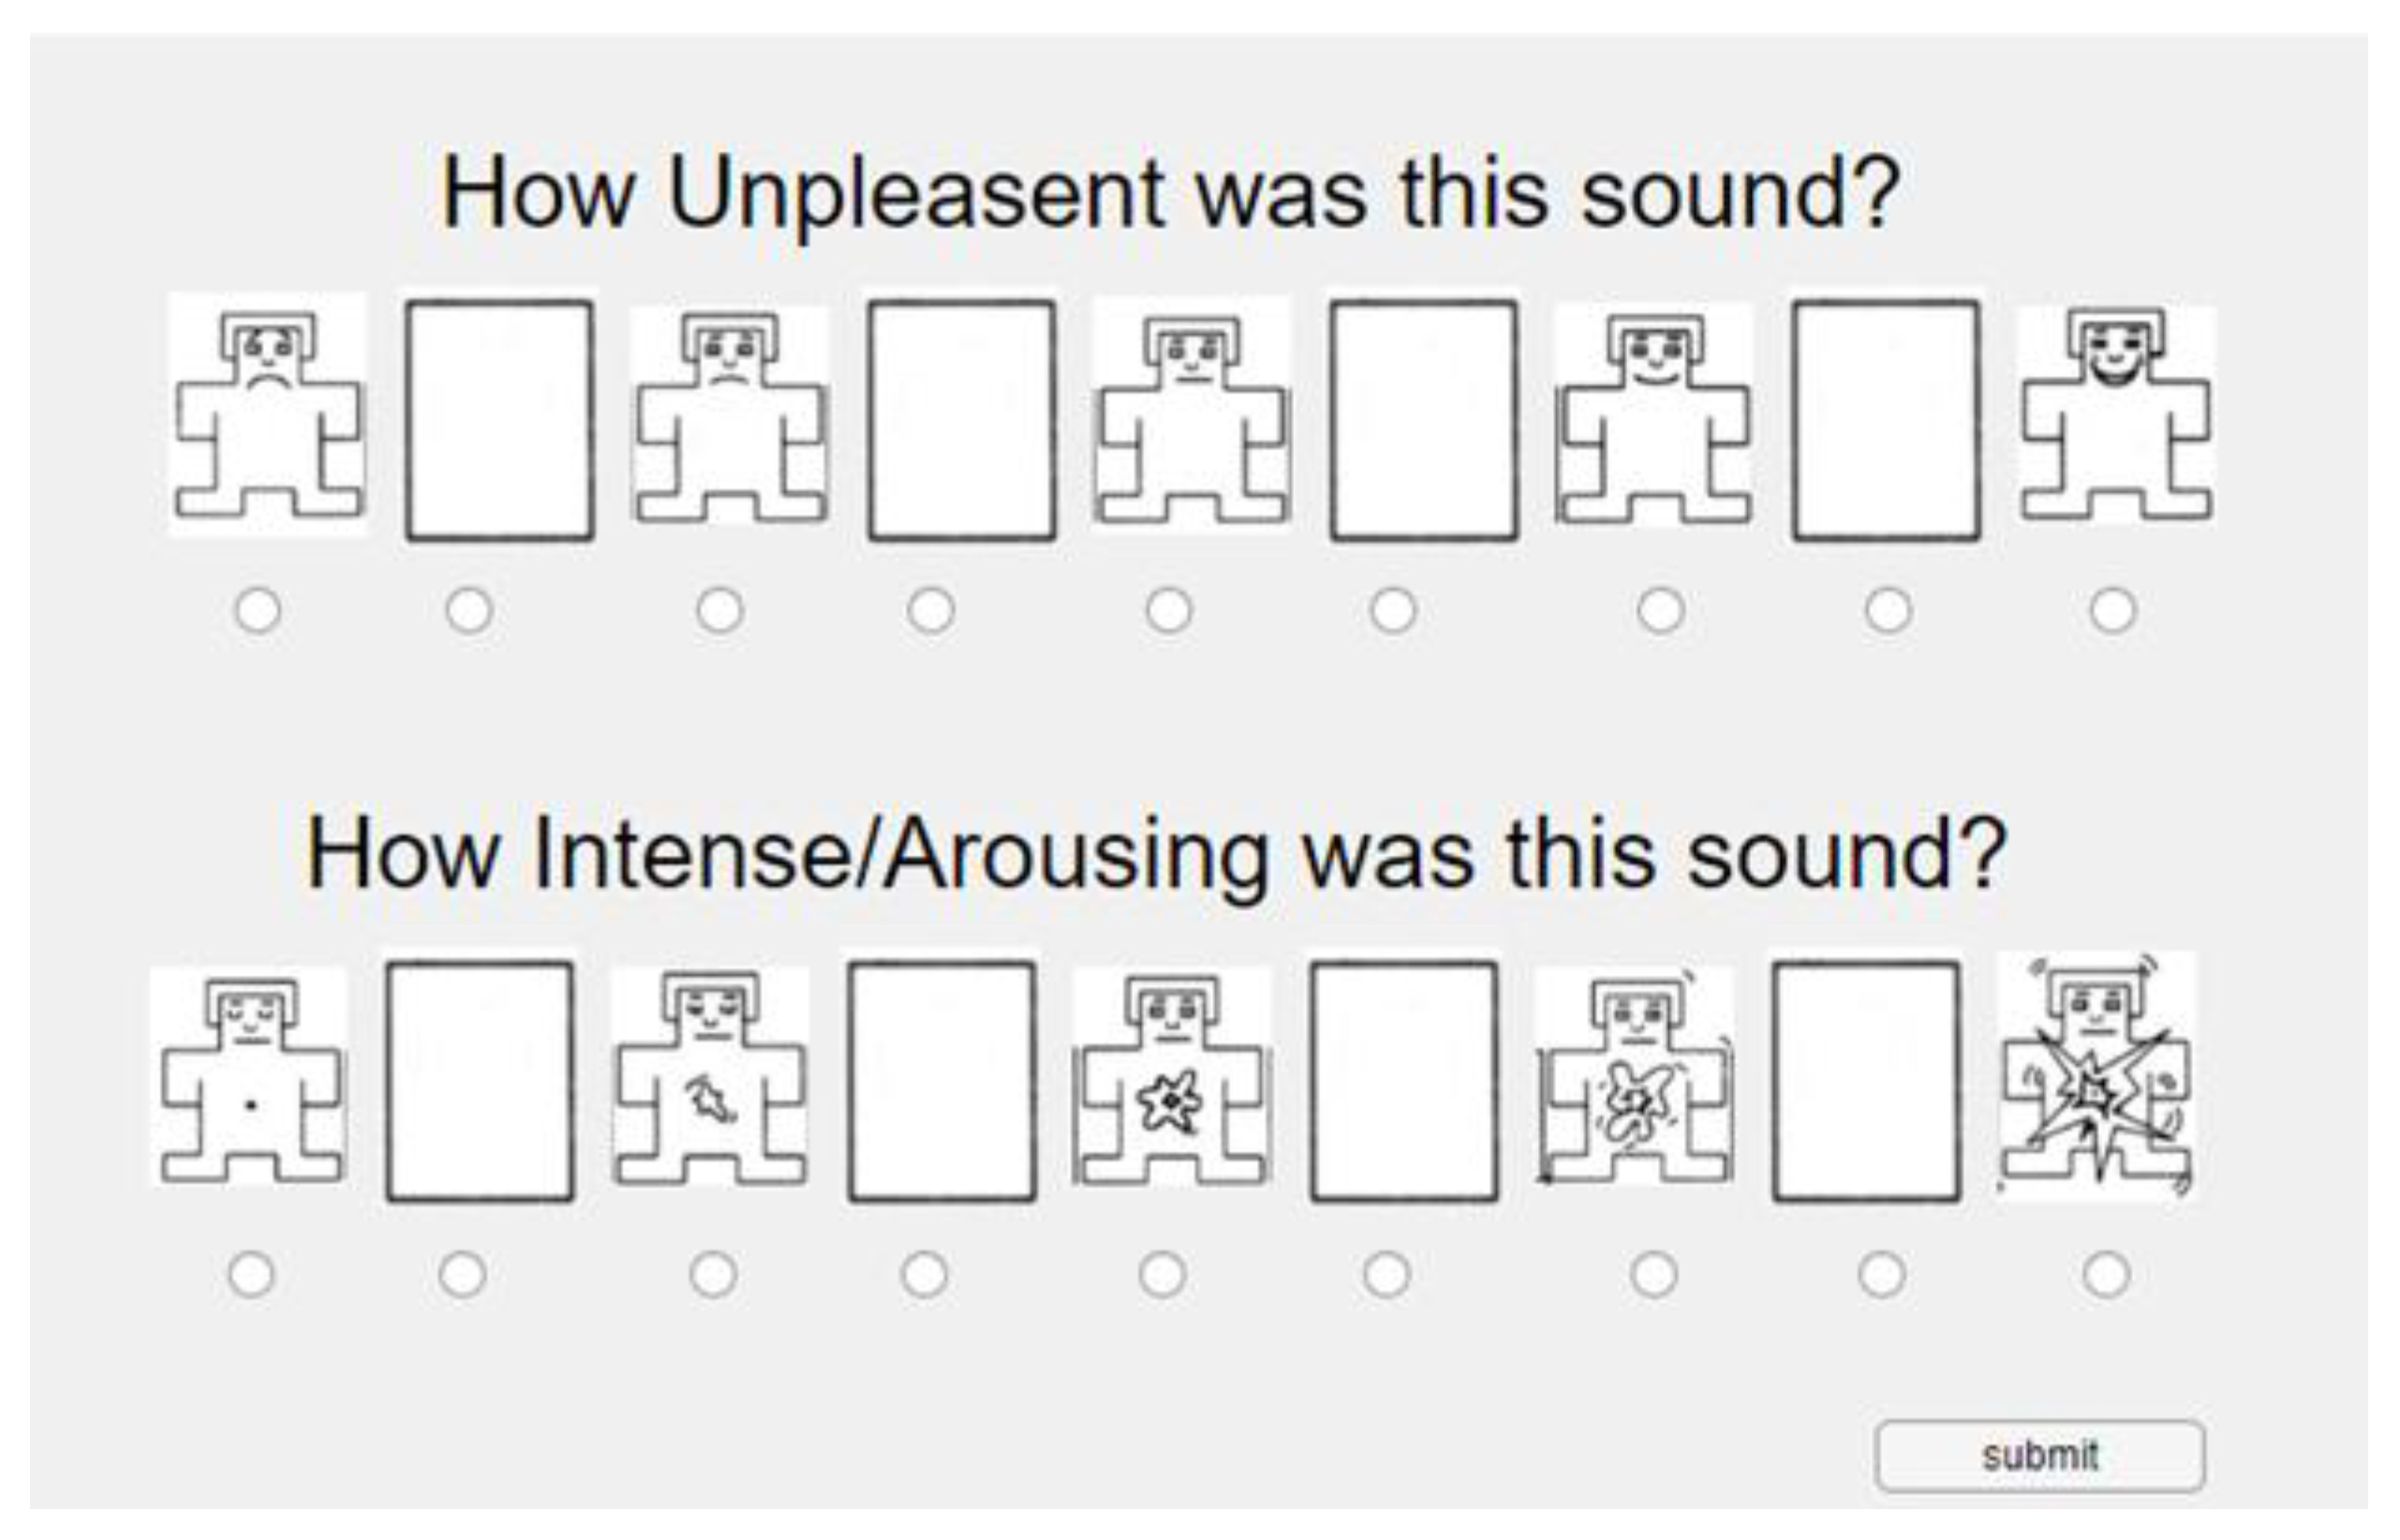
Figure 3.
The figure illustrates the sequence of events for pitch matching trials. Each rectangle illustrates the visuals on screen, with the speakers’ colors coded by the accompanying sound type. Note that only one sound type is played in the first half of the RI per trial. All trials during the Session 1 practice were silent trials.
Figure 3.
The figure illustrates the sequence of events for pitch matching trials. Each rectangle illustrates the visuals on screen, with the speakers’ colors coded by the accompanying sound type. Note that only one sound type is played in the first half of the RI per trial. All trials during the Session 1 practice were silent trials.
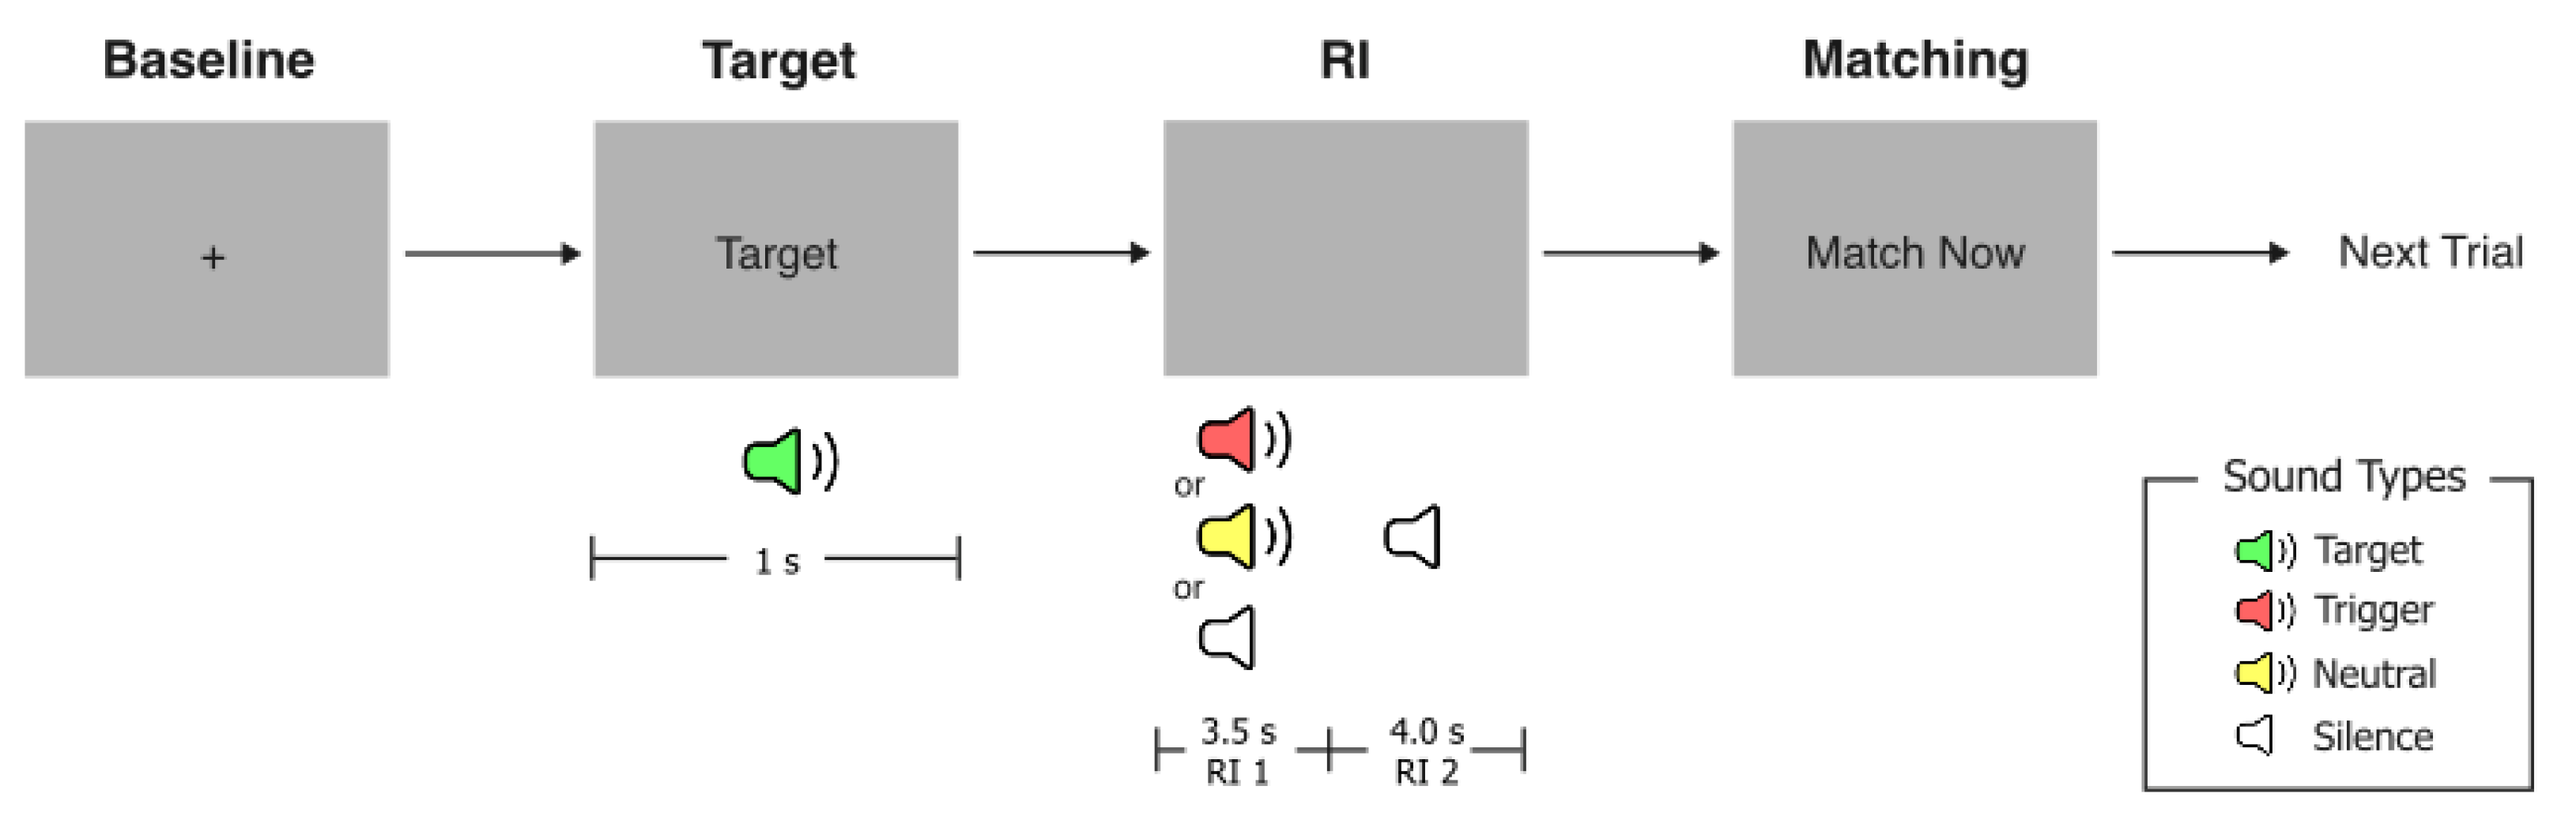
Figure 6.
(a) Average scalp map of the ICs (1 per contributing subject) in the right somatomotor mu cluster. (b) Locations of single equivalent current dipole models for individual ICs within the parietal cluster (blue spheres), plotted within the MNI brain. The red sphere depicts the cluster centroid. (c) Average ERSPs for each group and distractor condition. Dotted lines mark key event times.
Figure 6.
(a) Average scalp map of the ICs (1 per contributing subject) in the right somatomotor mu cluster. (b) Locations of single equivalent current dipole models for individual ICs within the parietal cluster (blue spheres), plotted within the MNI brain. The red sphere depicts the cluster centroid. (c) Average ERSPs for each group and distractor condition. Dotted lines mark key event times.
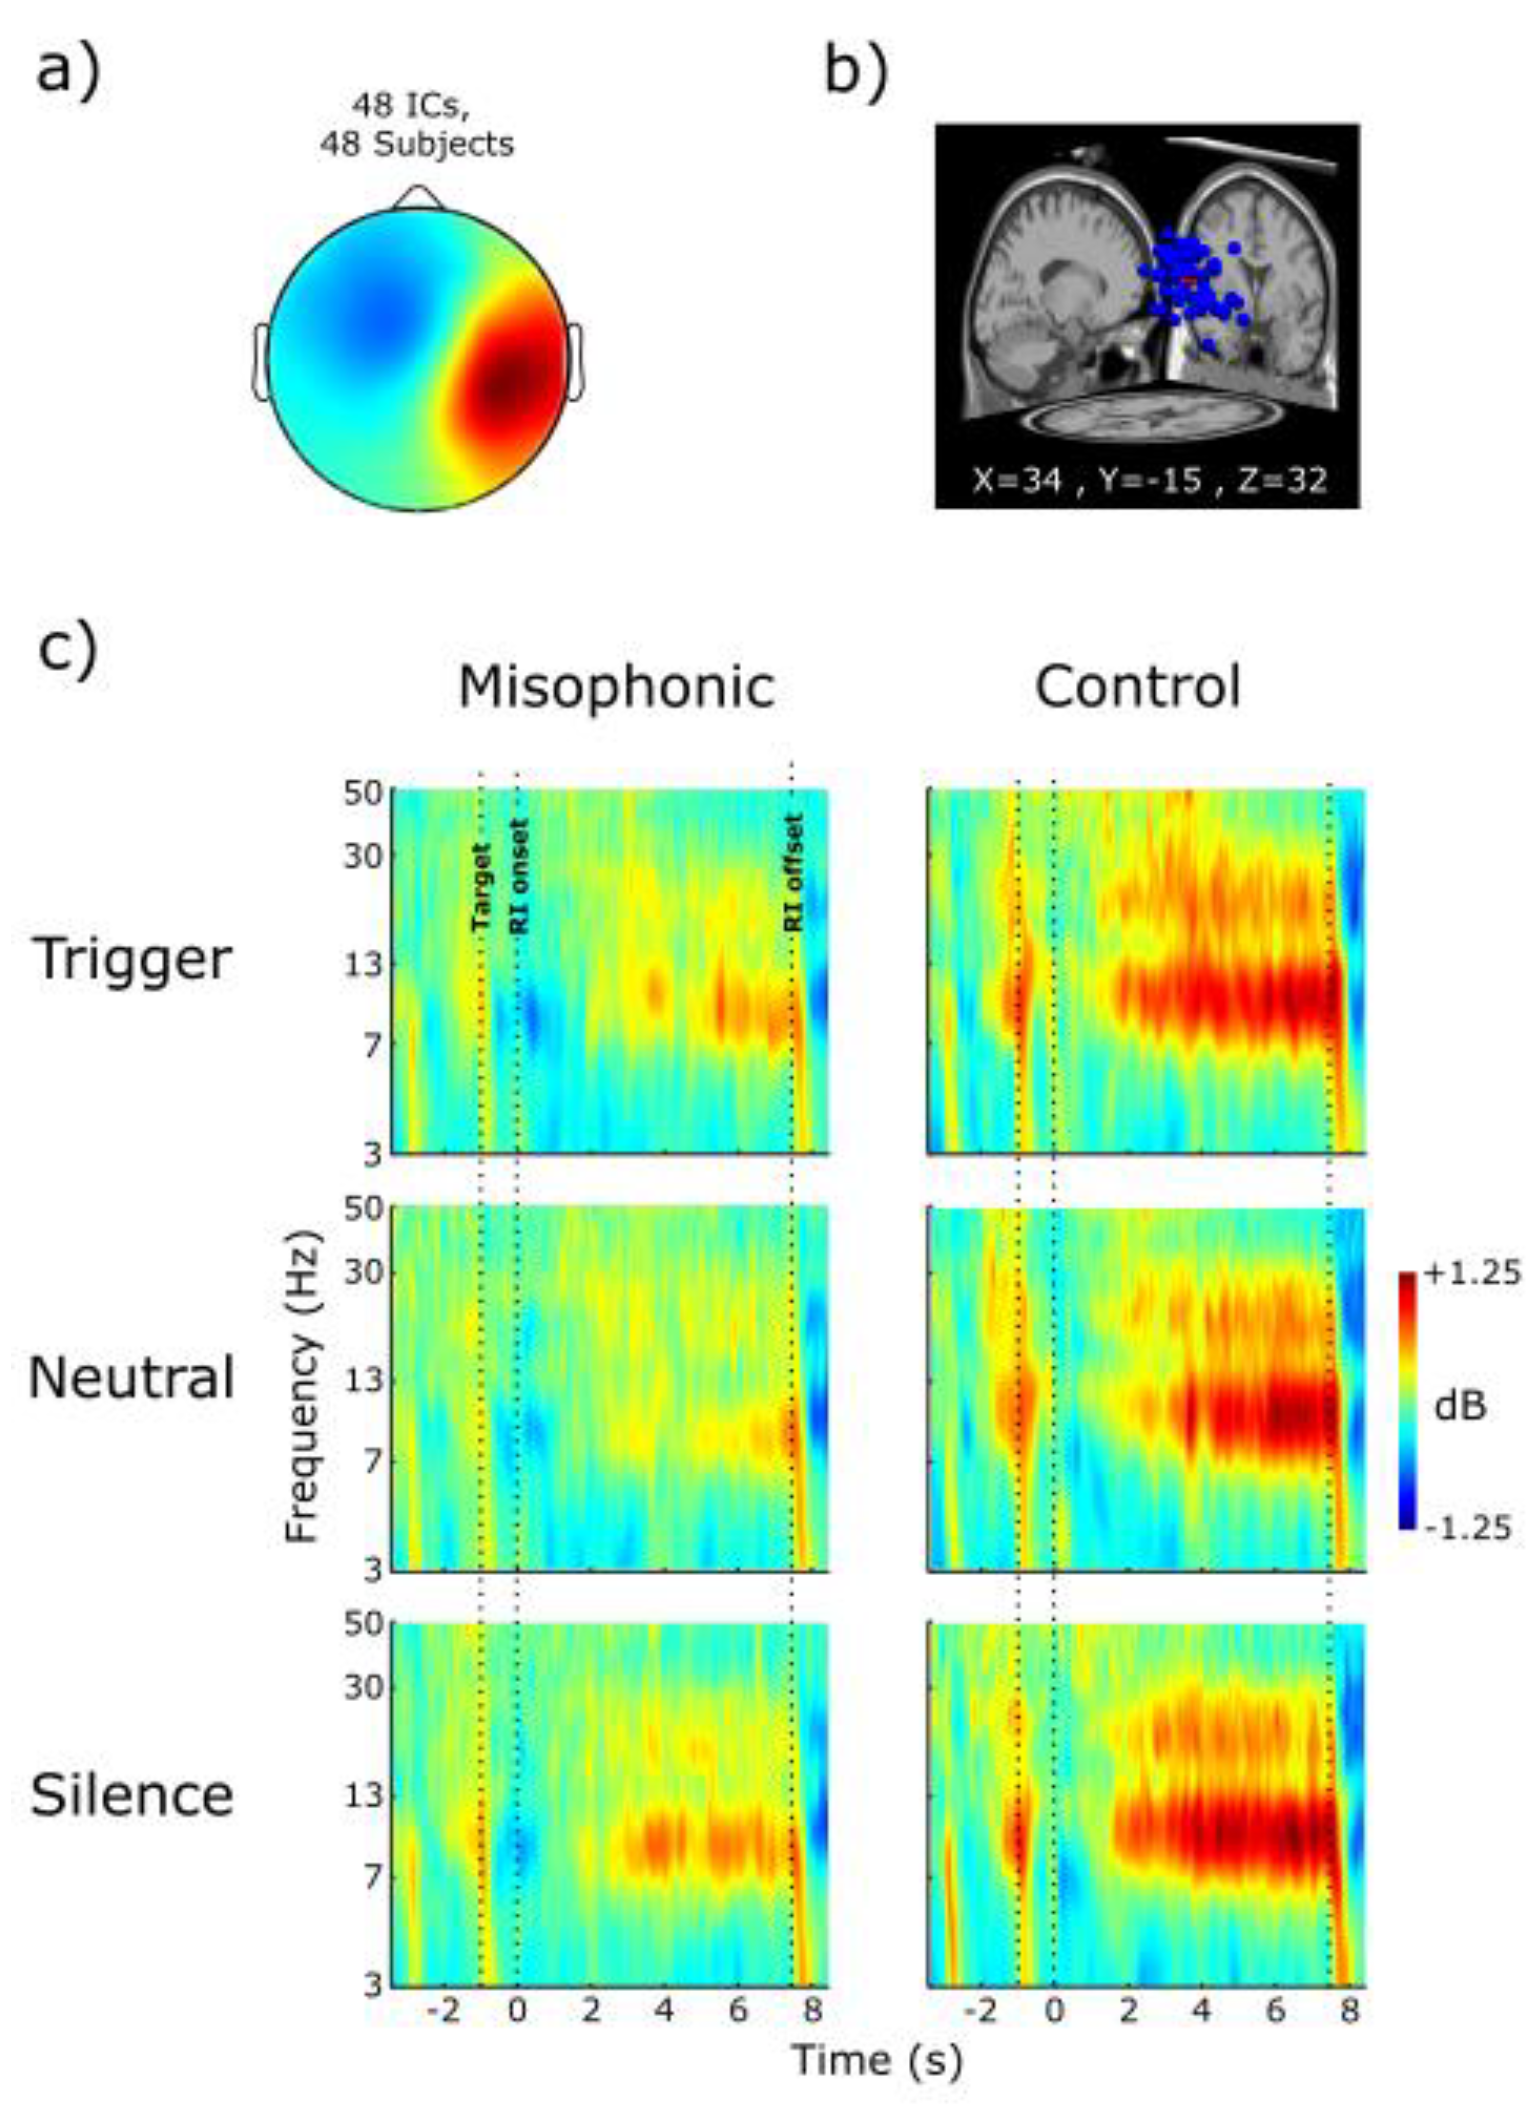

Table 1.
Description of sound content used to generate the sound bank.
 |
Disclaimer/Publisher’s Note: The statements, opinions and data contained in all publications are solely those of the individual author(s) and contributor(s) and not of MDPI and/or the editor(s). MDPI and/or the editor(s) disclaim responsibility for any injury to people or property resulting from any ideas, methods, instructions or products referred to in the content. |
© 2026 by the authors. Licensee MDPI, Basel, Switzerland. This article is an open access article distributed under the terms and conditions of the Creative Commons Attribution (CC BY) license (http://creativecommons.org/licenses/by/4.0/).
Copyright: This open access article is published under a Creative Commons CC BY 4.0 license, which permit the free download, distribution, and reuse, provided that the author and preprint are cited in any reuse.