
Submitted:
21 September 2026
Posted:
21 September 2026
You are already at the latest version
Abstract
This study developed an airtight concrete for the sealing layer of underground caverns in compressed air energy storage (CAES) power plants. The material is based on sulphoaluminate cement and incorporates fly ash, slag, basalt fiber, and chemical admixtures. The mechanical properties, gas permeability characteristics, and microscopic mechanisms were systematically evaluated through uniaxial compression and tensile tests, gas permeability tests under different thermal - pressure cycles and pore pressure conditions, combined with scanning electron microscopy and energy-dispersive X-ray spectroscopy. The results show that the sealing material exhibits high compressive strength (62.59 MPa) and good airtightness. Under a cyclic temperature of 60 °C, the gas permeability changes only slightly and remains on the order of 10⁻¹⁸ m², indicating excellent thermal stability. The permeability decreases with increasing pore pressure, which follows the Klinkenberg gas slippage model. Microscopic analysis reveals a dense internal structure dominated by ettringite and C-S-H gel, with most pores being isolated and non-connected. Numerical simulations using COMSOL Multiphysics further confirm that under actual operating conditions (e.g., the Three Gorges Ulanqab project), the sealing layer is in a triaxial compressive state, with a gas leakage rate of less than 1%, demonstrating excellent long term sealing performance and structural stability. This study provides a theoretical basis and experimental support for the design and application of sealing materials for CAES caverns.
Keywords:
engineering
; energy and fuel technology
1. Introduction
As traditional mineral energy reserves deplete, renewable energy is destined to become the dominant pillar of future energy structures. This trend is irreversible. However, the intermittency and volatility of renewable energy sources affect their integration into power grids [1]. Consequently, power systems face an increasingly urgent demand for large-scale, long-duration energy storage technologies [2]. Compressed Air Energy Storage (CAES), offering advantages such as large storage capacity [3,4,5,6], relatively low construction costs [7], and environmental friendliness [8], has emerged as one of the most promising large-scale energy storage technologies. Within a CAES system, the underground gas storage cavern is a core component, and its long-term sealing performance [9] directly impacts the system's operational efficiency, safety, and stability.
Currently, the main types of underground CAES storage caverns [10] include salt caverns, hard rock caverns, porous media aquifers, and abandoned mines and tunnels. Compared to other storage types, the greatest advantage of hard rock caverns [11] lies in the wide variety and distribution of hard rock formations meeting construction requirements, making site selection relatively easy. To reduce construction costs, engineered linings and flexible sealing layers can be added based on natural hard rock caverns or abandoned hard rock mines. Under high-pressure underground gas storage conditions, the cavern lining structure must not only withstand periodically varying thermo-pressure loads [12] but also possess extremely low gas permeability [13,14] to prevent compressed air leakage, thereby ensuring the economic viability and environmental compatibility of the energy storage system. Therefore, developing high-performance sealing materials for CAES underground caverns and systematically investigating their mechanical and permeability characteristics under complex coupled thermal-mechanical-fluid environments [15,16] holds significant engineering application value and scientific importance.
The sealing structures of gas storage caverns mainly consist of steel liner sealing layers and polymer sealing layers [17]. Currently, the composite structure of steel liner and reinforced concrete has become the most common sealing solution. However, steel liners are prone to bending deformation, leading to structural failure. If surrounding rock conditions are poor, the thickness of the steel liner must be increased, dramatically raising sealing costs [18]. In contrast, polymer materials exhibit good deformability, better buffering deformations caused by drastic changes in internal air pressure and temperature, thereby significantly reducing cyclic thermal-pressure stresses transmitted to the concrete lining and surrounding rock. In this context, polymer materials such as rubber and polyethylene have attracted widespread attention. Natural rubber possesses excellent flexibility, but contains a large number of unsaturated double bonds in its structure, causing it to gradually age under oxygen and high temperature conditions [19], losing its performance and shortening the cavern's service life. High-density polyethylene (HDPE) features low cost and easy processability but tends to soften at high temperatures, accompanied by a sharp increase in gas permeability [20]. Therefore, developing a sealing layer material with low permeability, stable properties, and relatively low cost has become a key focus of current research. Microstructural analysis has confirmed that sulfoaluminate cement [21,22], through the formation of AFT crystals, fills micro-cracks and refines the pore structure, reducing harmful porosity (pore radius > 1 μm) by 14.8% [23]. Although sulfoaluminate cement slightly affects workability, overall results indicate it helps mitigate degradation caused by temperature variations. Furthermore, under sub-zero curing conditions, the bond strength of sulfoaluminate cement concrete specimens is higher than that of ordinary Portland cement concrete [24]. The primary reason is that sulfoaluminate cement hydrates rapidly, forming a dense structural network that enables the concrete to quickly develop a compact microstructure even at below-freezing temperatures.
This study adopts gas-tight concrete as the sealing layer material, employing a composite cementitious system composed of sulfoaluminate cement, fly ash, slag, and basalt fibers to prepare a sealing material characterized by rapid hardening, high early strength, and low permeability. Combined with Scanning Electron Microscopy (SEM) and Energy Dispersive Spectroscopy (EDS), the types of hydration products, microstructural characteristics, and their influence mechanisms on macroscopic performance are explored at the microscopic level. Through the combined approach of experimentation and numerical simulation, the applicability and reliability of the sealing material under real service conditions are systematically evaluated, providing theoretical basis and technical support for the design and optimization of sealing layers in CAES underground gas storage caverns.
2. Materials and Methods
2.1. Materials Used
The sealing layer material used in this experiment is gas-tight concrete, prepared by mixing sulfoaluminate cement, fly ash, slag, basalt fibers, quartz sand, water reducer, retarder, and water. The sulfoaluminate cement is a rapid-setting and high-early-strength cement, sourced from Zibo Yunhe Cement Co., Ltd. The fly ash was obtained from Shijiazhuang Shang'an Power Plant [25,26,27]. The slag is S105 slag powder, supplied by Gongyi Longze Water Purification Materials Co., Ltd. The gradation curves of these three materials are shown in Figure 1, and their chemical compositions are presented in Table 1. The basalt fibers, sourced from Shanghai Chenqi Chemical Technology Co., Ltd., have a density of 2.69 g/cm³, a tensile strength of ≥2000 MPa, and a tensile elastic modulus of ≥85 GPa. The quartz sand is produced in Nanyang, Henan Province, with silica (SiO₂) as its main component (99.6% content) and a specific gravity of 2.66 g/cm³. In this study, a polycarboxylate superplasticizer and a special retarder for specialty cements were selected, with the retarder supplied by Shandong Fuzhu Building Materials Co., Ltd. Table 1 presents the main chemical compositions of the sulfoaluminate cement, fly ash, and slag, while Table 2 provides the designed mix proportion of the gas-tight concrete material for the sealing layer [28,29].
The preparation process for the gas-tight concrete specimens includes specimen preparation and curing, as described below: weigh dry powders, fibers, water reducer and water according to the mix proportion. Mix dry powders until uniform; manually separate basalt fiber clusters, sprinkle evenly into dry powders, and mix until no fiber clumps remain; mix water reducer with water, add to dry powders, mechanically stir for 2 minutes, scrape walls, and stir again until uniform; load the mixture into molds in two layers, vibrate each layer for 60 seconds, then vibrate until slurry bleeds and no bubbles escape; place molds in a standard curing box (20±2°C, ≥95% RH) for 24±2 hours; carefully demold, continue curing for 14 days, then cut specimens to a height of 100±0.2 mm with a flat surface.The process is illustrated in Figure 2.
2.3. Test Instruments and Test Methods
2.3.1. Uniaxial Compression Test
To obtain stable and reliable full stress-strain curves and peak strength, this study employed an electro-hydraulic servo loading method for the uniaxial compression tests. The uniaxial compressive strength testing[30,31,32] was conducted using the RMT-150B rock mechanics testing system, as shown in Figure 3. This system is an electro-hydraulic servo loading platform capable of performing conventional mechanical tests such as compression on rock or concrete materials. The equipment has an axial loading capacity of up to 1000 kN and can be equipped with a confining pressure module for triaxial tests. Under uniaxial compression conditions, the RMT-150B typically uses displacement control to achieve stable loading. Axial deformation measurements were taken using displacement sensors, and displacement loading was performed at a rate of 0.002 mm/s.
2.3.2. Uniaxial Tensile Test
The tensile strength test was conducted using an electro-hydraulic servo universal material testing machine. The test instrument and specimen molds are shown in Figure 4. This equipment enables stable displacement-controlled loading and real-time acquisition of load and deformation data. During the test, the tensile load was obtained using a high-precision force sensor, and specimen deformation was measured using a displacement sensor to obtain a complete stress-strain curve. The loading method adopted displacement control, with a loading rate controlled at 0.5 mm/min. Throughout the test, parameters such as load, displacement, and time were recorded in real time by a computer system, thereby capturing the full-response process of the material under uniaxial tension.
2.3.3. Permeability Test
The gas permeability test of the material in this study was conducted using a fully automatic geotechnical triaxial servo apparatus manufactured by TOP INDUSTRIE, France. This apparatus consists of different components, including an automatic control system, data acquisition system, pressurization system, pressure stabilization system, as well as servo devices for confining pressure, axial pressure, and water pressure. The test equipment is shown in Figure 5. It is capable of performing conventional compression tests, water or gas permeability tests, various rheological tests, and ultrasonic tests. The pressure chamber has a maximum confining pressure of 150 MPa, a maximum pore pressure of 60 MPa, and an axial pressure capacity of up to 1000 MPa. It enables stable loading and long-term pressure stabilization control under multi-field coupling conditions.
Figure 6 shows the gas permeability testing system. The control panel used for the gas permeability test is shown in Figure (a). One side of the panel is connected to a high-pressure argon gas cylinder. The gas is reduced in pressure by a valve before entering a small gas storage tank, allowing for safer adjustment and control of pressure. The other side is connected to the air inlet pipe of the triaxial testing apparatus pressure chamber. A high-precision pressure gauge with an accuracy of up to 10⁻³ bar (see Figure 6(b)) is installed in between, allowing the permeability pressure to be adjusted according to the test requirements. The triaxial testing apparatus is equipped with two valves: VM06 is used to control the gas inlet channel, and VM09 is used to control the gas outlet channel. During the permeability test, VM06 needs to be closed and VM09 opened.
(1) Experimental Scheme for Thermo-Pressure Cyclic Permeability Testing
To investigate the effect of temperature cycling on the permeability characteristics[33,34] of gas-tight concrete, the specimens were subjected to temperature cycling treatment at 60°C. Gas permeability was measured using a fully automatic geotechnical triaxial servo apparatus under conditions of a confining pressure of 10 MPa and a pore pressure of 7.5 MPa [35]. First, the gas permeability of the specimens under constant temperature conditions at room temperature was tested, serving as the gas permeability result for 0 cycles. Subsequently, the specimens were subjected to thermo-pressure cyclic loading treatment, and a gas permeability test was conducted after each completed temperature cycle. By comparing the changes in permeability under different numbers of cycles, the influence pattern of thermo-pressure cycling on the concrete's permeability performance can be analyzed. A complete stress-temperature cycle process is shown in Figure 7. After each completed stress-temperature cycle, a gas permeability test was conducted to obtain the gas permeability of the material under different numbers of cycles.
Based on the long-term operation conditions of compressed air energy storage caverns and the available experimental equipment, 10 cycles of stress-temperature cyclic tests were conducted. By analyzing the test results, the evolution law of internal structural damage of the sealing material under thermo-pressure cyclic conditions can be further investigated, and the influence mechanism of thermo-pressure coupling on the material's permeability performance can be explored.
(2) Permeability Tests under Different Pore Pressures
During the tests, the confining pressure was maintained at 10 MPa. The gas permeability of the specimens under different pressure conditions was measured by gradually varying the pore pressure. The pore pressure was set to 7.5 MPa, 5.5 MPa, 3.5 MPa, and 1.5 MPa, respectively.
2.3.4. Microscopic Characterization
Field Emission Scanning Electron Microscopy (SEM) [36,37,38] combined with Energy Dispersive X-ray Spectroscopy (EDS) [39,40,41] can be used to observe the microscopic morphology of gas-tight concrete, reveal the reaction mechanisms among basalt fibers, mineral admixtures, and sulfoaluminate cement, analyze element concentrations, and infer reaction products. The test equipment used was the TESCAN MIRA4 Field Emission Scanning Electron Microscope system (TESCAN, Czech Republic), equipped with an EDS energy dispersive spectroscopy system. This instrument features high-resolution imaging capability and enables observation of the surface microstructure of samples under high vacuum conditions, as well as qualitative and semi-quantitative analysis of elemental compositions in micro-areas.
3. Test Results
3.1. Uniaxial Compressive Mechanical Properties
Uniaxial compression tests were conducted on the gas-tight concrete specimens using the RMT-150B rock mechanics testing system. Three sets of parallel tests were performed, and the average values were taken. The test results of the uniaxial compressive stress-strain curve of the gas-tight concrete sealing layer are shown in Figure 8. At the initial stage of loading, the stress increased approximately linearly (segment o-a). In the next stage, the stress-strain curve entered a plastic rising segment, where the stress gradually increased and reached its peak (segment a-b). The third stage is the steep drop segment of the stress-strain curve, i.e., the failure stage (segment b-c). The specimen corresponding to the strain at point c had been completely failed. The turning point (i.e., the peak) between the stress-strain curves of segment a-b and segment b-c was taken as the uniaxial compressive strength, which was 62.59 MPa, with a corresponding elastic modulus of 2.69 GPa.
3.2. Uniaxial Tensile Mechanical Properties
The uniaxial tensile stress-strain curve results of the gas-tight concrete are shown in Figure 9. At the initial stage of loading, the stress increased approximately linearly, with a tensile strain of 0.05% and a tensile stress reaching 1.11 MPa (segment o-a). As the load further increased, the specimen entered the stress hardening stage. Cracks began to appear on the specimen surface, and the stress increased nonlinearly to its peak value. At the peak, the ultimate tensile strain reached 0.2%, and the ultimate tensile stress reached 3.58 MPa (segment a-b). As the load continued to increase, the specimen entered the strain softening stage. Surface cracks propagated into macroscopic cracks, and the load-bearing capacity of the specimen continuously decreased until fracture failure occurred.
3.3. Effect of Thermo-Pressure Cycle Number on Permeability
To intuitively reflect the influence of thermo-pressure cycling on permeability, the variation curve of permeability with cycle number was plotted based on the test results, as shown in Figure 10. As can be seen from the Figure, at the initial stage of thermo-pressure cycling, the gas permeability of the specimens showed a slight decrease. For example, during the 1st to 2nd cycles, the permeability decreased from 1.78×10⁻¹⁸ m² to 1.72×10⁻¹⁸ m². This phenomenon indicates that at the initial stage of temperature cycling during the triaxial seepage test, the specimens were subjected to a confining pressure of 10 MPa. The confining pressure compresses the internal pore structure of the concrete, causing some micro-cracks to close, thereby reducing pore connectivity.
As the number of temperature cycles increased, the test results showed a gradual recovery trend in gas permeability. For example, after the 5th cycle, the permeability gradually increased from 1.82×10⁻¹⁸ m² to 1.94×10⁻¹⁸ m². This phenomenon suggests that under repeated temperature variations, possibly due to the different thermal expansion coefficients between the aggregate and the cement paste, thermal deformation incompatibility occurs between them during temperature cycling, generating thermal stresses in the interfacial transition zone. When temperature cycles are applied repeatedly, these thermal stresses may induce new micro-cracks in the interfacial region or cause the propagation of existing micro-cracks, leading to an increase in gas permeability. As the number of temperature cycles further increased, the magnitude of permeability change gradually diminished. This indicates that the development of micro-cracks within the concrete gradually stabilizes, and the internal structure of the material gradually reaches a new equilibrium state. At this stage, the rate of change in pore structure decreases significantly, and thus the gas permeability gradually stabilizes. Overall, the effect of 60°C temperature cycling on the gas permeability of concrete is relatively limited, with permeability changes remaining within the order of magnitude of 1-2×10⁻¹⁸ m². This indicates that under lower-temperature cyclic conditions, no significant thermal damage occurs to the internal structure of the concrete, only minor adjustments in the microstructure.
3.4. Effect of Pore Pressure on Permeability
Gas permeability tests under different pore pressure conditions were conducted under a certain confining pressure. During the tests, the confining pressure was maintained at 10 MPa, and the gas permeability of the specimens under different pressure conditions was measured by gradually varying the pore pressure. The test results obtained are shown in Table 3.
From the test results, it can be observed that under a confining pressure of 10 MPa, when the pore pressure increased from 1.5 MPa to 7.5 MPa, the gas permeability of the specimens gradually decreased from 10.6×10⁻¹⁸ m² to 1.78×10⁻¹⁸ m², showing a significant downward trend. This variation pattern indicates that under a certain confining pressure, pore pressure has a notable effect on the gas permeability of concrete. To more intuitively reflect the relationship between pore pressure and permeability, a curve showing the relationship between gas permeability and pore pressure was plotted based on the test data, as shown in Figure 11.
It can be seen from the Figure that as the pore pressure increases, the gas permeability of the concrete gradually decreases, exhibiting a relatively obvious nonlinear trend. Theoretically, under a given confining pressure, when the pore pressure increases, the internal pore structure of the specimen may undergo a certain degree of lateral expansion, enlarging the pore space and thereby making the seepage channels more open, which could lead to an increasing trend in permeability. However, the test results indicate that under the conditions of this study, the permeability of the specimens gradually decreases with increasing pore pressure, showing a clear regularity. This phenomenon suggests that in low-permeability porous media, gas seepage behavior is influenced not only by changes in pore structure but also significantly by the gas slippage effect [42,43]. Under low pore pressure conditions, the mean free path of gas molecules is relatively large, causing gas molecules to slip along the pore wall surfaces, thereby increasing the gas flow velocity and manifesting as an increase in the apparent gas permeability. As the pore pressure gradually increases, the mean free path of gas molecules gradually decreases, and the gas slippage effect gradually weakens, so the measured apparent gas permeability also decreases accordingly.
To describe this phenomenon, Klinkenberg [44,45] proposed a modified permeability model that accounts for the gas slippage effect:
Where kg is the apparent gas permeability, km is the intrinsic gas permeability, b is the Klinkenberg coefficient, and p is the average pore pressure of the sealing layer.
For concrete materials, the internal pore structure [46,47] typically consists of capillary pores, gel pores, and micro-cracks. Since these pore sizes are usually on the micrometer or even nanometer scale, gas flow within the pores is susceptible to the slippage effect. When the pore pressure is low, the apparent gas permeability is significantly higher than the intrinsic permeability. Given that the pore pressure in underground caverns fluctuates within the range of 3–10 MPa, the influence of the gas slippage effect on permeability measurements must be considered when investigating the gas permeability characteristics of materials used in compressed air energy storage underground caverns. The reciprocal of the average pore pressure was calculated based on the experimental data, and the relationship curve between permeability and the reciprocal of the average pore pressure was plotted. The fitting results are shown in Figure 12.
It can be seen from the Figure that there is a good linear relationship between permeability and the reciprocal of the average pore pressure, indicating that the experimental results conform to the basic principles of the Klinkenberg modified model. According to the Klinkenberg model equation, the fitting equation obtained by incorporating the experimental data is:
The fitting results indicate that under low-pressure conditions, the gas slippage effect is relatively pronounced, and the apparent gas permeability is significantly higher than the intrinsic permeability of the material. As the pore pressure gradually increases, the slippage effect gradually weakens, and the apparent gas permeability progressively approaches the absolute permeability of the material. This trend is generally consistent with previous research findings, further demonstrating that for concrete as a low-permeability porous material, its gas seepage behavior is significantly influenced by the slippage effect under low-pressure conditions.
3.5. Microscopic Testing and Mechanism Analysis
3.5.1. Analysis of SEM Test Results
By selecting three typical specimens for scanning electron microscopy observation, the intrinsic mechanism of the influence of each component on the performance of the sealing material can be revealed at the microscopic level, as shown in Figure 13. Figure 13(a) and (b) show the microscopic conditions of the specimens, where a remarkably dense microstructure can be observed, with extremely low porosity and most pores being isolated closed pores. Hydration products (especially C-S-H gel) are generated in large quantities and form a continuous, dense spatial network, tightly cementing the unreacted particles together. Figure 13(c) clearly shows ettringite (AFt), the core hydration product of the sulfoaluminate cement system, which appears as slender needle-like or rod-shaped crystals. These crystals interlock and overlap with each other, forming a spatial skeleton structure that supports the early-age strength. Figure 13(d) shows the C-S-H gel, which primarily provides later-age strength. It exhibits a "honeycomb-like," network structure without a regular geometric shape. It can be observed wrapping around all other materials, filling nanoscale pores, and forming a densified matrix.
3.5.2. Analysis of EDS Test Results
To reveal the types and spatial distribution characteristics of hydration products in sulfoaluminate cement concrete incorporating mineral admixtures and basalt fibers, two different micro-areas of the sample were selected for EDS surface scanning and quantitative analysis, with results expressed as mass fractions. The results are shown in Figure 14.
In addition to the major elements, a certain amount of C was detected in both measurement areas. Since the samples were gold-sputtered, the detected C did not originate from a carbon coating layer. Nevertheless, it may still be influenced by sample carbonation, surface adsorption, conductive adhesive, resin, or admixture residues. In the discussion of this paper, C is treated as a possible "contamination" signal and is not used to determine the dominant phase composition. The mass fraction ratios obtained after excluding C are shown in Table 4.
Measurement Area 1 exhibits distinct calcium-rich characteristics, with a Ca content of 25.5%, while the Al content reaches 9.7%, the S content is 5.7%, and the Si content is only 5.5%. The relative enrichment of Ca-Al-S indicates that this micro-area is closer to the typical hydration product composition of sulfoaluminate cement. During the early hydration process of sulfoaluminate cement, the aluminate phase and sulfate readily form Ca-Al-S-O system products such as ettringite (AFt) under Ca²⁺-sufficient conditions, possibly accompanied by the formation of monosulfoaluminate or monocarboaluminate hydrate phases (AFm). Considering the coexistence of high Al and S contents along with Ca in this measurement area, it can be concluded that Area 1 is a region relatively enriched in sulfoaluminate hydration products. Its microstructure typically exhibits an interwoven morphology of needle-like, columnar crystals and gel phases, which significantly contributes to the early-age strength and the formation of the skeleton structure of the material. At the same time, localized agglomeration of AFt/AFm crystals or their concentrated precipitation in pores may also lead to micro-scale compositional heterogeneity, a common phenomenon in the microstructure of cement-based materials. Measurement Area 2 shows prominent differences compared to Area 1: the Si content increases to 18.4%, the Ca content is 23.4% (slightly lower than that in Area 1), while Al decreases to 5.6% and S decreases to 4.5%. The substantial increase in Si typically indicates an increased proportion of silicate gel phases or proximity to the reaction layer of mineral admixtures, as well as the presence of unreacted particles. Considering that fly ash and slag are incorporated into the system, both can provide reactive SiO₂ and Al₂O₃ and undergo pozzolanic and latent hydration reactions under alkaline conditions, generating C-S-H or C-A-S-H type gel products. Such gels typically exhibit a continuous or flocculent distribution, capable of effectively filling pores, wrapping around particles, and improving the interfacial transition zone structure, thereby enhancing the later-age strength and durability of the material [48,49]. Therefore, Area 2 can be regarded as a micro-area relatively enriched in gel phases, reflecting the role of mineral admixtures in participating in reactions within the sulfoaluminate cement system and forming a densified structure. Compared with Area 1, the decreased Al and S contents in Area 2 also indirectly indicate that the proportion of sulfoaluminate crystalline products in this region is relatively lower, with silicate gels being the main contributor. The Fe contents in the two measurement areas are 2.6% and 2.8%, respectively, and the Mg contents are 0.7% and 0.5%, along with small amounts of trace elements such as Na, K, Cl, and Ti. These can be attributed to the intrinsic trace components of fly ash or slag, aggregate impurities, or components introduced from basalt fibers. Their low contents generally do not alter the dominant hydration phase types of the system, but may act as nucleation sites or participate in the formation of composite gel structures in localized regions.
Overall, the main elements in the sample are O, Ca, Si, Al, and S, reflecting the typical characteristics of a sulfoaluminate cement-admixture composite system. The O element content dominates in both measurement areas (38.6% in Area 1 and 32.1% in Area 2), indicating that the tested regions are primarily composed of oxygen-bearing hydration products, which is consistent with the fact that cement-based materials mainly consist of various oxygen-containing compounds after hydration. Ca, Si, Al, and S are all major structure-related elements, reflecting that this admixture-fiber reinforced sulfoaluminate cement system exhibits a multiphase characteristic of "sulfoaluminate hydration products (AFt/AFm) + silicate gels (C-(A)-S-H/C-A-S-H)" coexisting, with pronounced spatial heterogeneity. Area 1 is biased towards AFt/AFm enrichment, reflecting the advantage of early-age products brought by the rapid hydration of sulfoaluminate cement; Area 2 is biased towards a silica-rich gel structure, reflecting the pore-filling and densification effects of fly ash or slag after their participation in reactions. This synergistic mechanism of "early-age crystalline skeleton + later-age gel densification" provides a microscopic basis for the material to simultaneously achieve relatively rapid strength development and good structural stability.
4. Numerical Simulation
4.1. Engineering Background
The Three Gorges Ulanqab Huade County Source-Network-Load-Storage Integrated Green Power Supply Industrial Park Demonstration Project is located in Huade County, Ulanqab City, Inner Mongolia Autonomous Region [50]. The project has a roof burial depth of approximately 155 m, a gas storage pressure ranging from 3.0 to 10 MPa, and a gas storage volume of 40,000 m³. The surrounding rock is composed of granodiorite, with the engineering geological category of the surrounding rock being mainly Class II to III. The annular gas storage cavern has a length of 478.25 m and a tunnel diameter of 10 m. A 0.5 m thick C40 reinforced concrete lining is cast on the inner wall of the cavern, and a 0.1 m thick sealing layer is laid on the inner surface of the lining. The sealing layer adopts the experimentally formulated material, as shown in Table 2.
4.2. Physical Property Parameters and Boundary Conditions
Within the framework of COMSOL Multiphysics, a numerical model coupling non-isothermal flow, fluid flow, and geomechanical deformation of the compressed air energy storage rock cavern was established using the Partial Differential Equation (PDE) solver [51,52,53]. Figure 15 shows the boundary conditions for the seepage field, temperature field, and stress field. The initial temperature of this CAES underground cavern is set to 286.15 K, and the initial pressure is set to 1.5 MPa based on the surrounding rock properties. Table 5 present the numerical simulation parameters for sensitivity analysis. The model calculation domain extends to six times the cavern diameter. The cavern thermodynamics are applied as boundary conditions on the inner surface of the cavern. For the cavern structural deformation field, the normal displacement is constrained at the outer boundary of the calculation model, while the inner boundary is a free boundary. For the seepage field, the outer boundary of the calculation model is set as a constant pressure, and the inner boundary is set as the gas pressure inside the cavern. For the temperature field, the outer boundary of the calculation model is set as a constant temperature, and the inner boundary is set as the gas temperature inside the cavern. During each daily cycle of CAES operation, air is injected into the underground rock cavern at a constant mass flow rate for 8 hours, followed by a 4-hour storage period. Then, air is released from the underground rock cavern at a constant mass flow rate for 4 hours, followed by another 8-hour storage period.
4.3. Model Results and Analysis
4.3.1. Variation Law of Cavern Pressure
Relevant studies have shown that the temperature field of the compressed air energy storage cavern reaches a steady state after 50 cycles [55]. Considering the computational time, calculations were performed for 60 cycles. The variations in temperature and pressure of the CAES underground cavern during 60 operating cycles (60 days) were investigated, and the pressure variations during the 1st week and the 60th cycle were selected for comparative analysis. Figure 16 shows the variation of air pressure inside the cavern. From the perspective of a single operating cycle, the air pressure inside the cavern gradually increases during the charging phase as the injected air volume increases, exhibiting an approximately linear increasing trend. After entering the storage phase, the cavern pressure shows a slight decrease due to the slow leakage of gas through the sealing layer into the surrounding rock. Subsequently, during the discharge phase, as the gas is released for power generation, the air pressure inside the cavern continues to decrease in an approximately linear trend. Before the next storage phase begins, the pressure rises to some extent again due to changes in system operating conditions. Therefore, within a complete operating cycle, the cavern pressure generally exhibits a periodic variation characteristic of "increase – slow decrease – rapid decrease – recovery". From the perspective of long-term operation results, as the number of operating cycles increases, the overall level of air pressure inside the cavern shows a slowly decreasing trend. This is mainly due to continuous gas leakage during the storage process, resulting in a gradual reduction of air mass inside the cavern. Over 60 operating cycles, the cumulative leaked air mass is approximately 2.54 × 10⁵ kg, corresponding to an air leakage ratio of about 0.21% of the cavern's gas storage capacity. Affected by this, during the 60th operating cycle, the maximum air pressure inside the cavern is approximately 8.7 MPa, and the minimum pressure is 3.31 MPa, both within the designed operating pressure range of 3–10 MPa.
Overall, during long-term cyclic operation, the average air pressure inside the cavern exhibits a gradually decreasing trend. This phenomenon is mainly related to two factors. On the one hand, as the gas mass inside the cavern decreases, the air pressure correspondingly decreases. On the other hand, as time progresses, some air gradually accumulates in the pores of the sealing layer, forming gas pressure, which to some extent slows down the subsequent air leakage rate, exerting a retarding effect on subsequent gas leakage.
4.3.2. Variation Law of Cavern Temperature
(1) Variation Law of Air Temperature
To further analyze the thermodynamic characteristics of the CAES underground cavern during cyclic operation, the variation law of cavern air temperature over 60 operating cycles was investigated. The temperature variations during the 1st week and the 60th cycle were selected for comparative analysis, as shown in Figure 17. From the perspective of a single operating cycle, the air temperature inside the cavern increases rapidly during the charging phase as compressed air is continuously injected. This is due to the adiabatic compression effect that occurs after the compressed air enters the cavern, which increases the internal energy of the gas, resulting in a significant rise in air temperature. After entering the storage phase, heat exchange occurs between the air inside the cavern and the cavern structure, with part of the heat being transferred to the cavern, causing the air temperature to decrease to some extent. During the discharge phase, as the air expands and is output for power generation, the internal energy of the gas decreases, and the cavern air temperature further decreases. Subsequently, during the next storage phase, the temperature rises slightly due to heat exchange. Therefore, within a complete operating cycle, the cavern air temperature generally exhibits a periodic variation characteristic of "increase – slow decrease – significant decrease – recovery".
From the perspective of long-term operation, as the number of cycles increases, the overall variation of cavern air temperature gradually stabilizes. In the early stage of system operation, due to the large temperature difference between the cavern air and the cavern structure, heat exchange is more significant, and the temperature variation amplitude is relatively large. As the operation time extends, the cavern structure gradually absorbs some heat and forms a certain amount of heat accumulation, causing the temperature difference between the cavern air and the cavern structure to gradually decrease, and the temperature variation gradually enters a stable state.
During the 60th operating cycle, the variation amplitude of cavern air temperature remains basically consistent across cycles, and the temperature variation curve exhibits stable periodic fluctuations, indicating that the system has gradually reached a thermodynamic dynamic equilibrium state. Overall, under long-term cyclic operating conditions, the cavern air temperature maintains regular periodic variations within each operating cycle, with its average temperature variation tending to stabilize. This is mainly due to the heat exchange between the cavern air and the cavern structure gradually reaching equilibrium. During the charging period, the air temperature rises from 32.3°C to 65.6°C, then slightly decreases to 55.15°C during the first storage period. Subsequently, the air temperature rapidly decreases to approximately 5.12°C during the discharge period, and then slightly increases to 32.25°C during the second storage period.
(2) Variation Law of Temperature in the Sealing Layer
To further analyze the temperature variation in the sealing layer of the CAES cavern during operation, the temperature variation at point P1, located at the middle position of the sealing layer on the symmetric boundary, was analyzed over 60 operating cycles. The variation processes during the 1st week and the 60th cycle were selected for comparison, as shown in Figure 18. It can be seen from Figure 18 that the temperature at the center of the sealing layer also exhibits distinct periodic variations with system operation, and its variation trend is generally consistent with that of the cavern air temperature, also exhibiting the periodic variation characteristic of "increase – slow decrease – significant decrease – recovery". During the charging phase, as the air temperature inside the cavern increases, the sealing layer temperature gradually rises. During the discharge phase, due to the expansion and cooling of the air, the sealing layer temperature also decreases. As the number of operating cycles increases, the overall temperature inside the sealing layer shows a gradually increasing trend. This is because, during long-term operation, the cavern air continuously transfers heat to the surrounding rock, resulting in gradual heat accumulation within the surrounding rock. At the same time, the amplitude of temperature variation inside the sealing layer is significantly smaller than that of the cavern air temperature. This is mainly due to the relatively large heat capacity and slower heat conduction process of the surrounding rock and sealing layer materials, which cause a certain lag in temperature variation. Therefore, the temperature variation inside the sealing layer is relatively gradual and tends to stabilize over long-term cyclic operation.
4.3.3. Analysis of Gas Leakage Law
To analyze the sealing performance of the CAES underground cavern during operation, the variation law of the gas leakage rate over 60 operating cycles (60 days) was investigated. The variations during the 1st week and the 60th operating cycle were selected for comparative analysis, as shown in Figure 19. The gas leakage rate is defined as the mass flow rate of air seeping outward through the sealing layer and the lining layer per unit time. A positive leakage rate indicates that air flows from the cavern into the sealing layer, while a negative leakage rate indicates that air flows back from the sealing layer into the cavern. The gas leakage ratio is defined as the proportion of leaked air mass to the injected air mass within a single cycle.
From the perspective of a single operating cycle, the variation of the leakage rate is closely related to the variation of air pressure inside the cavern. During the charging phase, as the air pressure inside the cavern gradually increases, the pressure difference across the sealing layer increases, causing gas to seep outward, and the leakage rate gradually increases. During the discharge phase, due to the rapid decrease in air pressure inside the cavern, the leakage rate gradually decreases, exhibiting a trend of "increase – decrease – decrease – increase". The leakage rate becomes negative during certain time periods because when the pressure inside the cavern is lower than the pore pressure on the outer side of the sealing layer, the direction of the seepage driving force changes, and some gas flows back into the cavern through the pores of the sealing layer.
During the 60th operating cycle, the variation of the leakage rate has essentially stabilized, and the variation pattern within each cycle is generally consistent. Within this cycle, the maximum leakage rate is approximately 0.132 kg/s, and the minimum value is approximately -0.062 kg/s. By integrating the leakage rate over time, the total leaked mass during the first cycle is approximately 8,964 kg, corresponding to an air leakage ratio of approximately 0.44%, which is less than the specified minimum leakage ratio of 1%, indicating that the underground gas storage cavern has good sealing performance under the current sealing layer parameters.
From the overall trend, the gas leakage rate exhibits a pronounced periodic variation characteristic during long-term cyclic operation, with a slight decreasing trend as the number of operating cycles increases, and the overall variation amplitude is relatively small. In the early stage of operation, due to the rapid increase in air pressure inside the cavern and the relatively low initial pore pressure in the sealing layer and lining layer, the pressure difference across the sealing layer is large, resulting in a relatively high gas seepage rate at the initial stage. As cyclic operation proceeds, some air gradually enters and accumulates in the pores of the sealing layer, causing the pressure difference across the sealing layer to gradually decrease, thereby exerting a certain retarding effect on further gas seepage. Therefore, during long-term operation, the leakage rate overall shows a trend of slowly decreasing and gradually stabilizing, indicating that the sealing layer has a good control effect on gas leakage.
5. Conclusions
In this study, an airtight concrete sealing layer material for underground caverns in compressed air energy storage (CAES) systems was developed based on sulphoaluminate cement, incorporated with fly ash, slag, basalt fiber, and chemical admixtures. The mechanical properties, gas permeability characteristics, microstructural evolution, and long-term sealing performance of the material were systematically investigated through laboratory experiments and COMSOL Multiphysics-based thermo-hydro-mechanical coupled numerical simulations. The main conclusions are drawn as follows:
(1) The developed airtight concrete exhibits excellent mechanical properties. Its uniaxial compressive strength reaches 62.59 MPa with an elastic modulus of 2.69 GPa. Numerical simulation results under actual operating conditions show that the sealing layer is in a triaxial compressive state (hoop stress≈-5.5 MPa, radial stress≈-9.8 MPa) without any tensile stress. The maximum compressive stress accounts for only 15.3% of the material's compressive strength, indicating a high safety reserve.
(2) The material demonstrates superior gas tightness. Under a confining pressure of 10 MPa and a pore pressure of 7.5 MPa, the gas permeability is approximately 1.78×10⁻¹⁸ m². Under thermal-pressure cycling at 60°C, the permeability remains within the order of 10⁻¹⁸ m² with only minor fluctuations, demonstrating good thermal stability. The permeability decreases with increasing pore pressure, which follows the Klinkenberg gas slippage model.
(3) The material possesses a dense microstructure. SEM observation reveals that the hydration products are dominated by needle/rod-like ettringite (AFt), which provides early-age strength, and honeycomb-like C-S-H gel, which provides later-age strength. Most pores are isolated and non-connected. EDS analysis confirms a multi-phase coexistence of "sulphoaluminate hydration products (AFt/AFm) + silicate gel (C-A-S-H)", forming a "early crystal skeleton + later gel densification" synergistic enhancement mechanism.
(4) Long-term numerical simulation over 60 operational cycles (60 days) shows that the cumulative leaked air mass is approximately 2.54×10⁵ kg, corresponding to a leakage rate of 0.21%–0.44%, which is far below the design allowable value of 1%.
Funding
This research was funded by National Natural Science Foundation of China, grant number 42577168
Data Availability Statement
The data presented in this study are available on request from the corresponding author. (please specify the reason for restriction, e.g., the data are not publicly available due to privacy or ethical restrictions.)
Institutional Review Board Statement
Not applicable
Informed Consent Statement
Not applicable
Conflicts of Interest
The authors declare no conflicts of interest.
References
- Sun, S.; Wu, B.; Yin, Y.; Shao, L.; Li, R.; Jiang, X.; Sun, Y.; Huo, X.; Ling, C. Thermodynamic characteristics of compressed air in salt caverns of CAES: Considering air injection for brine drainage. Energies 2025, 18, 3649. [Google Scholar] [CrossRef]
- Guan, Y.; Zhang, X.; Liang, Z.; Chen, T. A learning-based energy management strategy for hybrid energy storage systems with compressed air and solid oxide fuel cells. IET Renew. Power Gener. 2025, 19, e13192. [Google Scholar] [CrossRef]
- Komba, N.A.; Chen, H.S.; Liwoko, B.B.; Mwakipunda, G.C. A comprehensive review on compressed air energy storage in geological formation: Experiments, simulations, and field applications. J. Energy Storage 2025, 114, 115795. [Google Scholar] [CrossRef]
- Perazzelli, P.; Anagnostou, G. Design issues for compressed air energy storage in sealed underground cavities. J. Rock Mech. Geotech. Eng. 2016, 8, 314–328. [Google Scholar] [CrossRef]
- Luo, H.; Lin, S.; Hu, Q.; Dong, M. An investigation of parameter sensitivity and a dynamic analysis of subsurface storage chambers utilizing the finite difference method. Buildings 2024, 14, 3778. [Google Scholar] [CrossRef]
- Zeng, Z.; Zhang, D. Evolution of high toughness cementitious composites gas permeability after thermal-mechanical coupling damage. Buildings 2024, 14, 1923. [Google Scholar] [CrossRef]
- Assareh, E.; Hoseinzadeh, S.; Agarwal, S.; Keykhah, M.; Agarwal, N.; Heydari, A.; Garcia, D.A. Assessment of a wind energy installation for powering a residential building in Rome, Italy: Incorporating wind turbines, compressed air energy storage, and a compression chiller based on a machine learning model. Energy 2025, 320, 135083. [Google Scholar] [CrossRef]
- Li, Y.; Guo, C.; Wang, J.; Chen, R.; Liu, Y. Coupled wellbore-aquifer numerical analysis of underground performance of compressed air energy storage in heterogeneous aquifers. J. Energy Storage 2025, 114, 115794. [Google Scholar] [CrossRef]
- Zhang, N.; Liu, X.; Lai, X.; Liu, Y.; Jia, Q.; Gao, X. Study on the cracking residual sealing performance of folded sealing lining under lining fracture conditions in compressed air energy storage caverns. J. Energy Storage 2026, 145, 119839. [Google Scholar] [CrossRef]
- Cheng, H.D.; Jia, N.; Liu, S.; et al. Heat transfer algorithm for multi-layer sealing structures in artificial caverns for compressed air energy storage. Rock Soil Mech. 2026, 47, 470–484. [Google Scholar]
- Xia, K.Z.; Xiang, X.; Miao, X.X.; et al. Key issues and technologies for large-scale compressed air energy storage in hard rock lined underground caverns. J. Huazhong Univ. Sci. Technol. (Nat. Sci. Ed.) 2025, 53, 106–125. [Google Scholar]
- Wang, C.; Xu, X.; Feng, D.; Jin, P. Off-design characteristics analysis of a coupling near-isothermal compressed air energy storage system. J. Energy Storage 2026, 159, 121726. [Google Scholar] [CrossRef]
- Liang, W.; Yang, D.; Bian, H.; Li, P. Airtightness evaluation of rubber sealing layers for compressed air energy storage cavern using the solution-diffusion model. Energy 2025, 334, 137879. [Google Scholar] [CrossRef]
- Fang, J.; Ma, H.; Yang, C.; Li, H.; Zeng, Z.; Zhu, S.; Wang, X.; Nong, X. Airtightness evaluation of compressed air energy storage (CAES) salt caverns in bedded rock salt. J. Energy Storage 2024, 102, 114100. [Google Scholar] [CrossRef]
- Li, T.; Chen, L.; Liu, H.; Cui, S.; Mei, S. Configuration optimization for advanced adiabatic compressed air energy storage considering thermal coupling characteristics. J. Energy Storage 2025, 131, 117249. [Google Scholar] [CrossRef]
- Liu, X.; Yang, J.; Yang, C.; Zhang, Z.; Chen, W. Numerical simulation on cavern support of compressed air energy storage (CAES) considering thermo-mechanical coupling effect. Energy 2023, 282, 128916. [Google Scholar] [CrossRef]
- Qin, S.; Xia, C.; Zhou, S. Air tightness of compressed air storage energy caverns with polymer sealing layer subjected to various air pressures. J. Rock Mech. Geotech. Eng. 2023, 15, 2105–2116. [Google Scholar] [CrossRef]
- Hao, M.M.; Yang, W.J.; Peng, C.; et al. Research on resilient sealing materials and gas permeability performance for artificial cavern gas storage. Chin. J. Rock Mech. Eng. 2025, 44, 125–133. [Google Scholar]
- Lian, S.X.; Zhang, J.Q.; Zhu, Y.; Xie, Z.T.; Wu, J.R. Key parameters for the comprehensive service performance of natural rubber. Acta Polym. Sin. 2026, 57, 1108–1119. [Google Scholar]
- Wei, L.; Zheng, Y.; Tian, J.; Wu, X.; Shen, H.; Zhu, J.-H. Investigation into the fracture mechanical performance of strain hardening cementitious composites hybridized with polyethylene and carbon fiber using digital image correlation (DIC) technique. Structures 2025, 78, 109339. [Google Scholar] [CrossRef]
- Tchekwagep, J.J.K.; Huang, J.; Li, Z.; Zhao, Z.; Yang, W.; Li, Y.; Huang, Y.; Yang, C.; Tchakouté, H.K. The thermal performance of insulating panels made with alkali-activated agro-waste and calcium sulfoaluminate cement, and their usefulness in enhancing efficiency in building installations. Appl. Therm. Eng. 2026, 297, 130759. [Google Scholar] [CrossRef]
- Tadesse, D.M.; Kim, S.; Seo, J.; Yoon, H.N.; Reddy, K.C.; Park, S. Exploring the effect of calcium sulfoaluminate cement on the hydration and degree of reaction of slag cement. J. Build. Eng. 2026, 124, 115910. [Google Scholar] [CrossRef]
- He, Y.; Huang, W.; Zou, K.; Zhou, J.; Ma, R.; Zeng, Y.; Yang, J.; Du, J. Mitigating positive-negative temperature cycling damage in UHPC: The role of sulfoaluminate cement incorporation. J. Build. Eng. 2026, 124, 116004. [Google Scholar] [CrossRef]
- Zhao, J.; Liang, M.; Li, X.; Wang, Y.; Zhou, H. Bond performance between steel rebar and steel fiber reinforced sulfoaluminate cement concrete under curing conditions of −5 °C: Experimental investigations and theoretical analysis. Constr. Build. Mater. 2026, 522, 146193. [Google Scholar] [CrossRef]
- Zhang, P.; Li, D. PVA-KH792-enhanced composite cementitious material from lead–zinc slag and electroplating sludge: Mechanical performance and heavy-metal immobilization. Materials 2026, 19, 1420. [Google Scholar] [CrossRef]
- Xie, H.; Chan, H.-K.; Wang, X.; Zheng, C.; Shi, C.; Plank, J.; Lei, L. Effect of polycarboxylate superplasticizers on the rheological properties of lithium slag composite cementitious materials. Constr. Build. Mater. 2026, 520, 145945. [Google Scholar] [CrossRef]
- Meng, X.; Tang, Z.; Gao, P.; Li, Y.; Han, Y. Coupled effects of temperature and mechanical activation on the hydration kinetics and mechanism evolution of composite cementitious materials containing HMPT-IOTs. Constr. Build. Mater. 2026, 514, 145495. [Google Scholar] [CrossRef]
- Liu, Q.; Shen, W.; Chen, L.; Li, Q.; Lu, F.; Zhu, L. Fracture analysis of basalt fiber-reinforced composite laminates: Experimental study and analytical model. Compos. Struct. 2026, 386, 120266. [Google Scholar] [CrossRef]
- Lu, B.; Chen, J.; Xiang, S.; Peng, Z.; Liu, C.; Li, L. Study on the performance enhancement mechanism of basalt fiber-reinforced hydraulic concrete in ship lock galleries. Materials 2026, 19, 1333. [Google Scholar] [CrossRef]
- He, J.; Li, T.; Zheng, B.; Mao, T.; Wu, Y.; Li, S.; Li, X. Effect of calcite veins on the mechanical behavior and fracture propagation of carboniferous limestone. Eng. Geol. 2022, 300, 106592. [Google Scholar] [CrossRef]
- Ao, Y.; Jia, B.; Sun, C.; Pu, Y.; Yao, B. Mechanical response and fracture behaviors of pre-cracked granite under time-delayed triaxial compression: Experimental and 3D DEM insights. Eng. Geol. 2025, 356, 108294. [Google Scholar] [CrossRef]
- Chen, X.; Wang, Y.; Miao, S.; Zhang, S.; Yu, Z.; Du, L. Evaluation of multiple influences on the unconfined compressive strength of fibre-reinforced backfill using a GWO–LGBM model. Materials 2026, 19, 200. [Google Scholar] [CrossRef]
- Ardakani, S.B.; Rajabi, A.M. Laboratory investigation of clayey soils improvement using sepiolite as an additive; Engineering performances and micro-scale analysis. Eng. Geol. 2021, 293, 106328. [Google Scholar] [CrossRef]
- Yuan, H.; Xie, H.; Li, M.; Gao, M. A novel in-situ permeability test system to study the fluid flow aspects of geological formations. Eng. Geol. 2023, 320, 107132. [Google Scholar] [CrossRef]
- Noh, D.-H.; Kim, S.; Eun, J.; Kim, Y.-R. Experimental study on gas permeability and desiccation cracking of fiber-reinforced compacted bentonite at high temperature. Constr. Build. Mater. 2025, 478, 141053. [Google Scholar] [CrossRef]
- Flament, C.; Gillia, O.; Chevreux, N.; David, T.; Soulas, R.; Le Nevé, C.; Goti, R.; Andrieu, E. 3D FIB-SEM and TEM characterization of an industrial 0.5-Mo low carbon steel subjected to high temperature hydrogen attack. Int. J. Hydrogen Energy 2025, 136, 757–764. [Google Scholar] [CrossRef]
- Song, J.; Ye, W.; Hou, Q. Economic analysis of solar-hydrogen energy industry in China: A PLS-SEM approach to financial performance and input-output dynamics. Int. J. Hydrogen Energy 2025, 136, 546–562. [Google Scholar] [CrossRef]
- Ates, E.B.; Calik, E. Revealing factors influencing hydrogen energy investments using PLS-SEM. Int. J. Hydrogen Energy 2025, 98, 230–241. [Google Scholar] [CrossRef]
- Mao, L.-X.; He, F.; Li, L.; Xu, W.; Wang, Y.; Liu, Q.-F. A quantitative study of phase assemblage in cement-fly ash-slag ternary systems using machine learning-assisted BSE-EDS image analysis. Constr. Build. Mater. 2025, 498, 143712. [Google Scholar] [CrossRef]
- Al-Buriahi, M.S.; Alomayrah, N.; Alsaiari, N.S.; Tehçi, T.; Çalışkan, F. Effect of Si3N4 on metakaolin clay-based geopolymers: EDS, SEM, hardness, and gamma radiation shielding properties. Constr. Build. Mater. 2025, 492, 142857. [Google Scholar] [CrossRef]
- Huo, W.; Zhang, S.; Zhu, Z.; Sun, H.; Wan, Y.; Zhang, C.; Yang, L. ITZs characterization in full-component geopolymer recycled concrete based on quantitative BSE-EDS images and nanoindentation techniques. Constr. Build. Mater. 2025, 465, 140249. [Google Scholar] [CrossRef]
- Gu, Q.; Wu, Z.; Li, G.; Geng, J. Experiments and simulations of gas slippage effect on gas permeability and gas production in methane-hydrate-bearing montmorillonite sediments. Phys. Chem. Earth Parts A/B/C 2026, 142, 104309. [Google Scholar] [CrossRef]
- Zhang, J.; Jin, T.; He, Y.; Wang, Y.; Gao, Y.; Zhang, Y. The slippage effect of concrete gas permeability and the influence of its microstructure. Constr. Build. Mater. 2022, 333, 127384. [Google Scholar] [CrossRef]
- Zhou, Y.; Li, H.; Huang, J.; Zhang, R.; Wang, S.; Hong, Y.; Yang, Y. Influence of coal deformation on the Knudsen number of gas flow in coal seams. Energy 2021, 233, 121161. [Google Scholar] [CrossRef]
- Sun, Z.-X.; Zhou, S.-X. A laboratory observation for gas-rock mechanics and gas transport mechanism in low-permeability rocks. Eng. Geol. 2025, 352, 108049. [Google Scholar] [CrossRef]
- Nader, A.S.; Hilal, A.A.; Alwan, G.H.; et al. Void structure and strength of foam geopolymer concrete: Impact of using different binder and filler types. J. Mater. Civ. Eng. 2026, 38(6). [Google Scholar] [CrossRef]
- Oswaldo, C.; Paula, A.O.D.; Domingos, J.V.; et al. Pore solution, porosity, and microstructure of ternary cement matrices: A holistic and strategic view of concrete durability. J. Mater. Civ. Eng. 2025, 37(4). [Google Scholar] [CrossRef]
- Yang, Y.; Xu, L.; Chi, Y.; Yu, M.; Quan, J.; Li, L.; Huang, L. Unveiling of aging mechanisms for C–S–H gels subjected to coupled dry-wet cycling and carbonation: Integrated microscopic characterization and molecular dynamics. Constr. Build. Mater. 2026, 521, 146036. [Google Scholar] [CrossRef]
- Ihaddadene, T.; Claverie, J.; Bignonnet, F.; Amiri, O. Diffusion and physicochemical behavior of chloride and sodium ions in C-S-H gel pores: A molecular dynamics investigation. Cem. Concr. Res. 2026, 199, 108053. [Google Scholar] [CrossRef]
- Wang, X.Y.; Lu, W.W.; Shi, R.J.; et al. Design of the “Generation-Grid-Load-Storage Integration” demonstration project of China Three Gorges Corporation in Ulanqab. Power Demand Side Manag. 2023, 25, 41–47. [Google Scholar]
- El Alami, Y.; El Achouby, H.; Nasrin, R.; Hajjaj, C.; Benhmida, M.; Baghaz, E.; Ghazal, M.; Ibrahim, A. Numerical and experimental analysis of a new direct-contact PVT system for sustainable energy production: Energy, exergy, and environmental assessments. Energy 2026, 348, 140542. [Google Scholar] [CrossRef]
- Yan, J.; Cui, M.M.; Zhou, Y.K.; Zhao, C.Y. Design and optimization of large-scale thermochemical heat storage reactor and its application in integrated energy system. Energy 2026, 345, 139936. [Google Scholar] [CrossRef]
- Bayer, M.; Meister, C.; Schuetz, P.; Villasmil, W.; Walter, H.; Dahash, A. Development of a reduced-order dynamic model for large-scale seasonal thermal energy storage applications. Energy 2025, 333, 137379. [Google Scholar] [CrossRef]
- Zhou, Y.; Xia, C.; Zhao, H.; Mei, S.; Zhou, S. An iterative method for evaluating air leakage from unlined compressed air energy storage (CAES) caverns. Renew. Energy 2018, 120, 434–445. [Google Scholar] [CrossRef]
- Kushnir, R.; Dayan, A.; Ullmann, A. Temperature and pressure variations within compressed air energy storage caverns. Int. J. Heat Mass Transf. 2012, 55, 5616–5630. [Google Scholar] [CrossRef]
Figure 1.
Particle size distribution curves of sulphate aluminate cement,fly ash and slag.
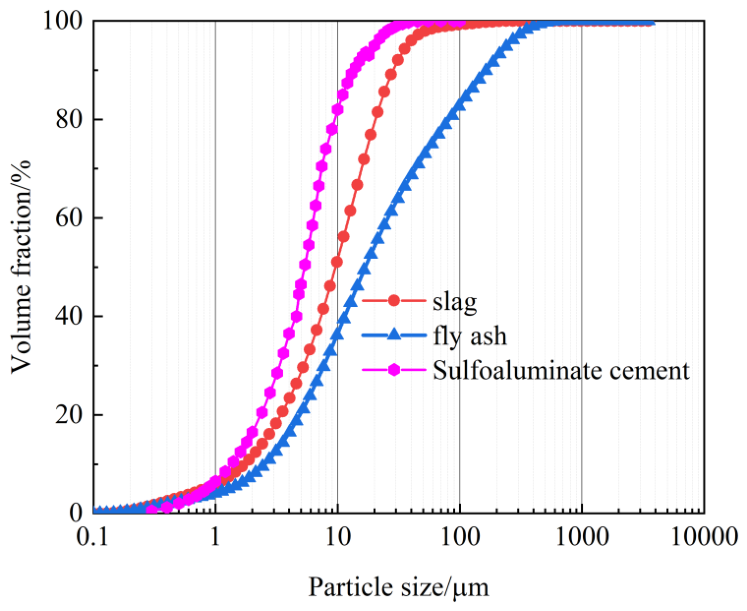
Figure 2.
Experimental Flowchart.
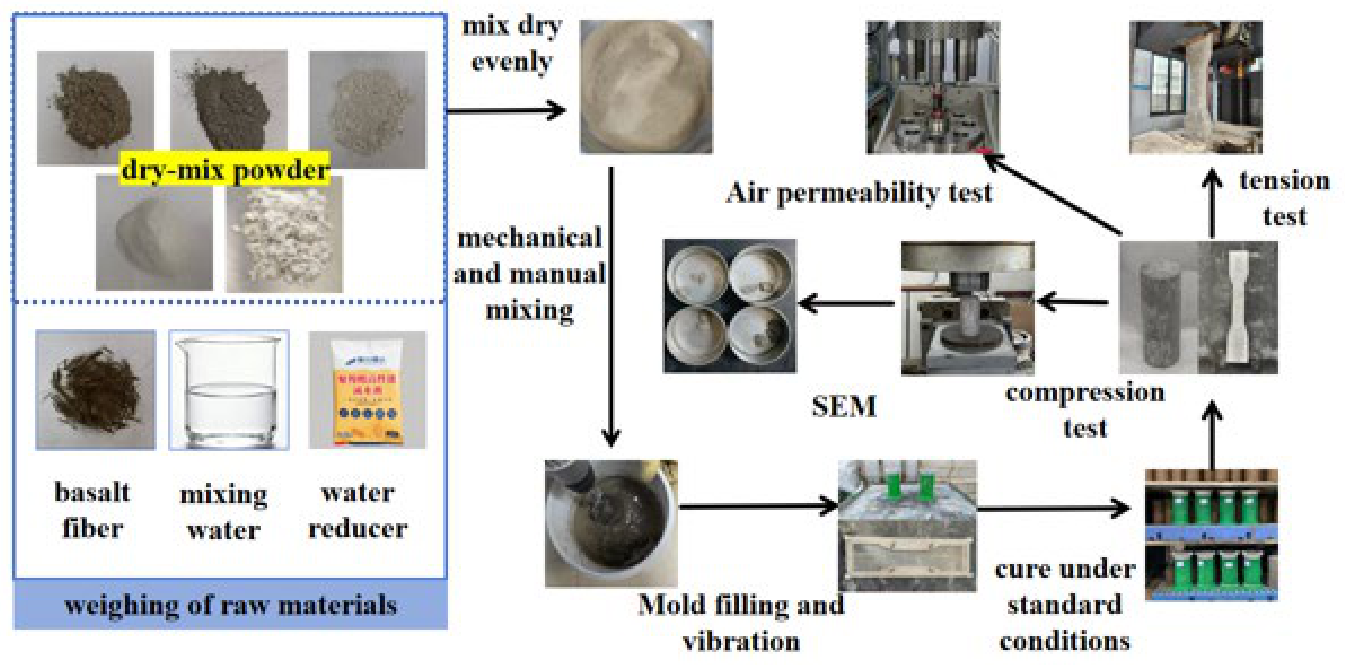
Figure 3.
RMT-150B rock mechanics testing system.
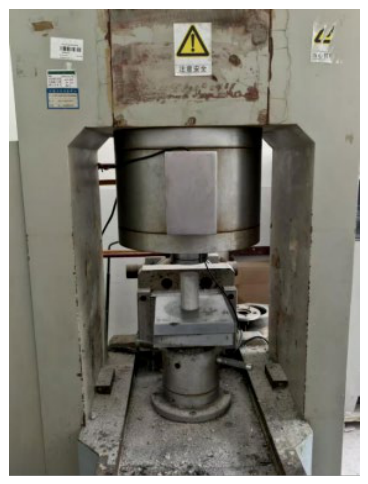
Figure 4.
Electro-hydraulic servo universal material testing machine and specimen mold.
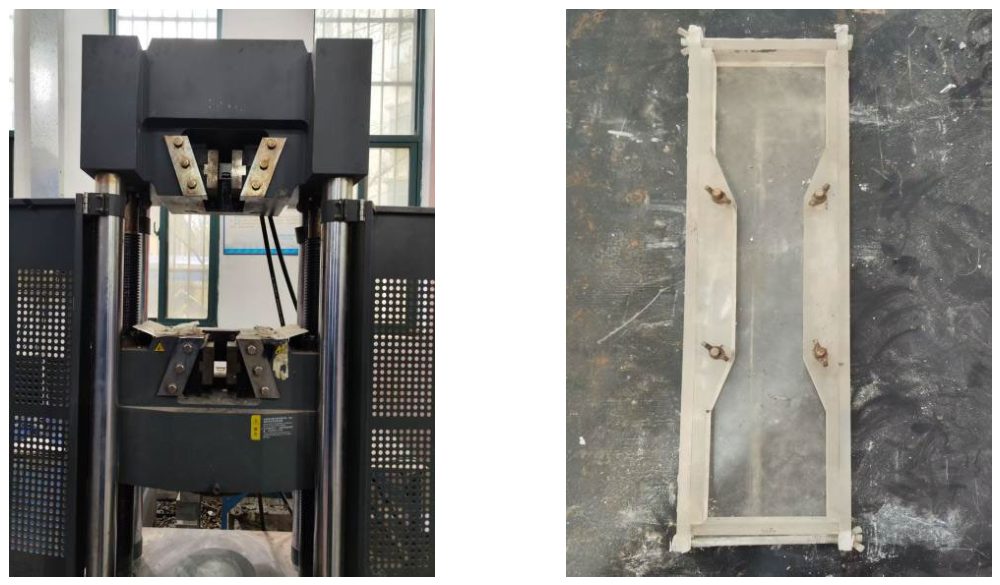
Figure 5.
Fully automatic geotechnical triaxial servo apparatus.
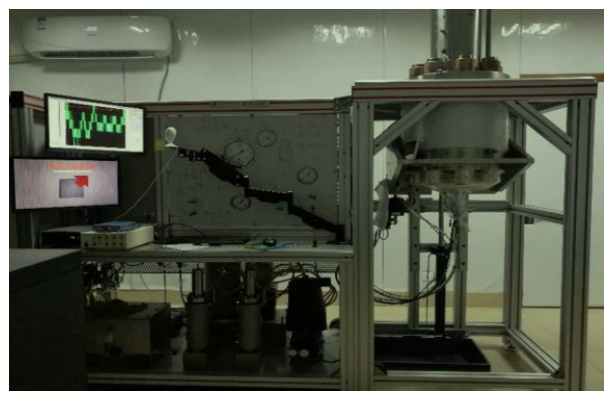
Figure 6.
Gas permeability testing system
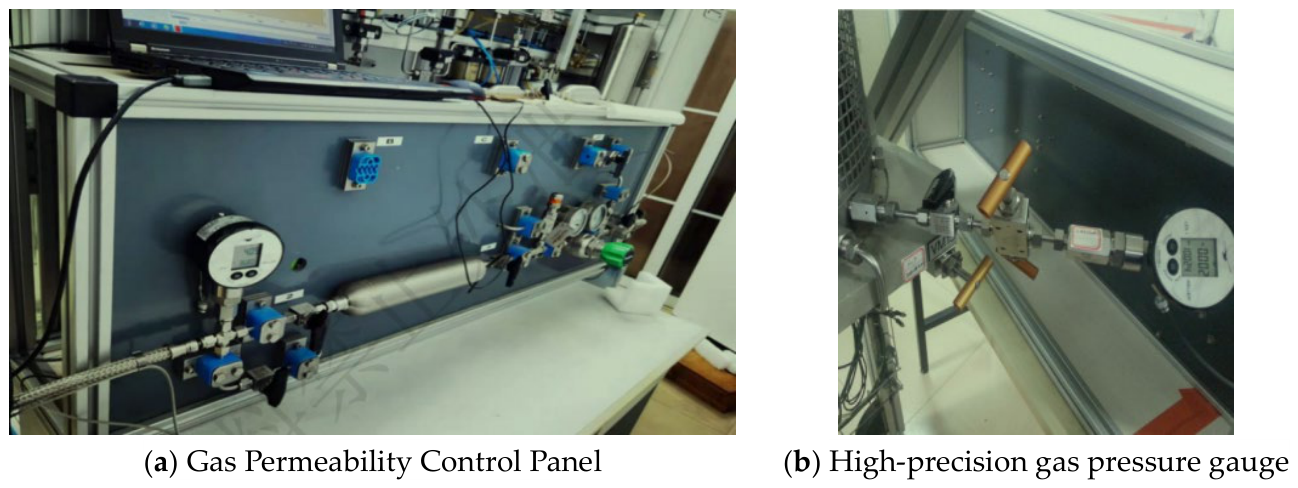
Figure 7.
A complete stress-temperature cycle process.
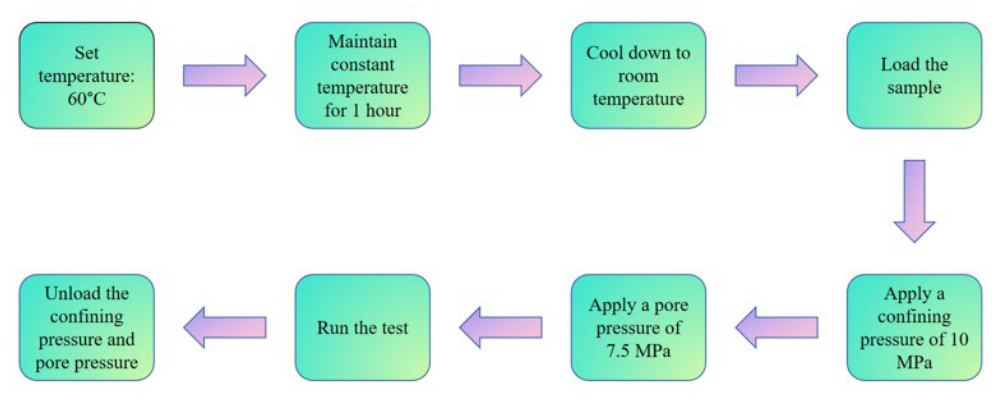
Figure 8.
Airtight concrete uniaxial tensile stress-strain curve.
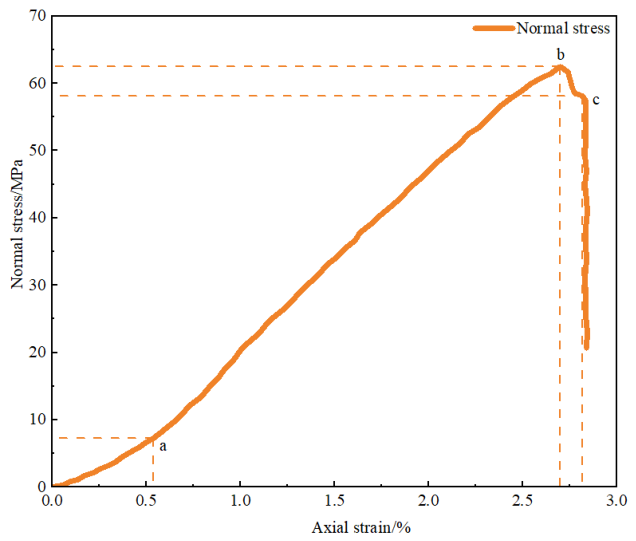
Figure 9.
Uniaxial tensile stress-strain curve of gas-tight concrete.
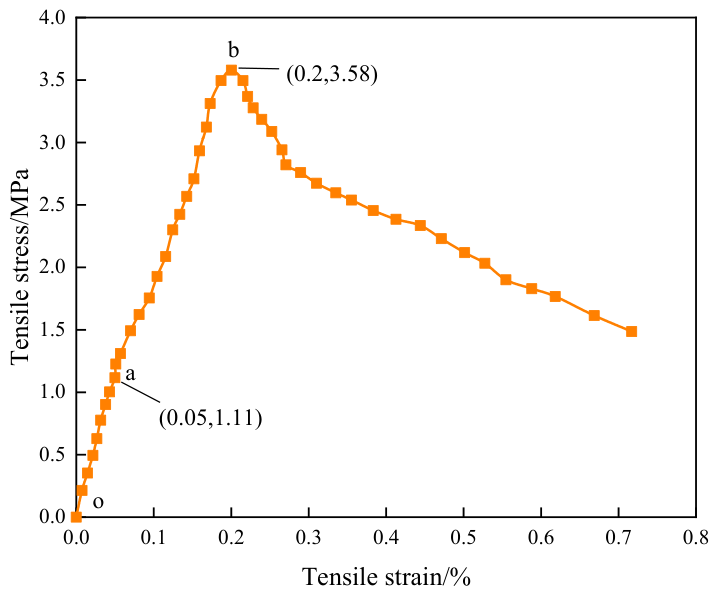
Figure 10.
Gas permeability test results under thermo-pressure cycling.
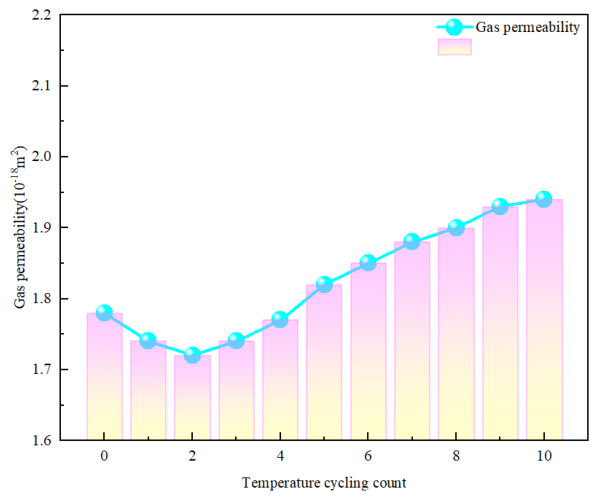
Figure 11.
Relationship curve between gas permeability and pore pressure of specimens.
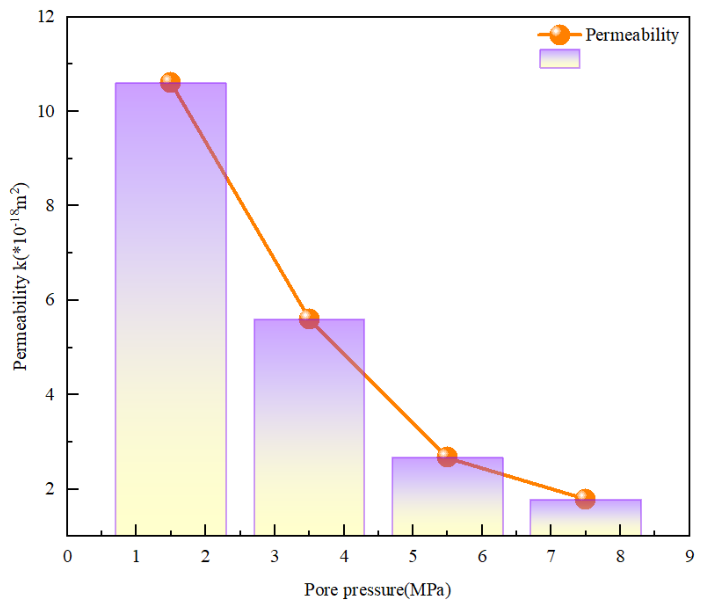
Figure 12.
Relationship between the reciprocal of average gas permeability pressure and permeability of specimens.
Figure 12.
Relationship between the reciprocal of average gas permeability pressure and permeability of specimens.
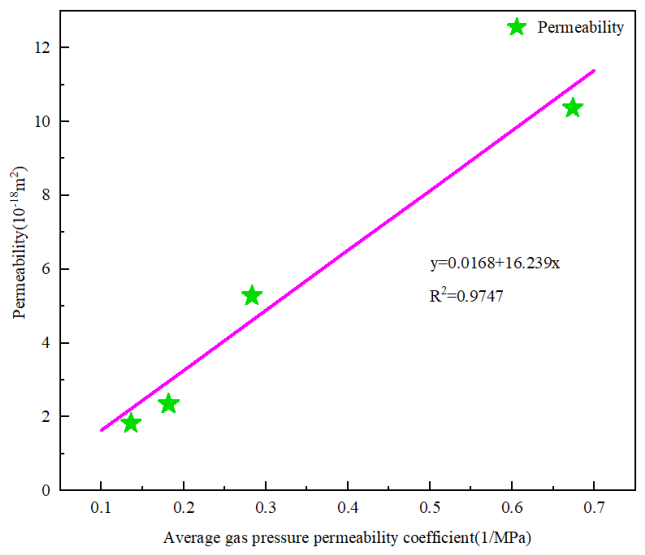
Figure 13.
SEM micrographs of specimens
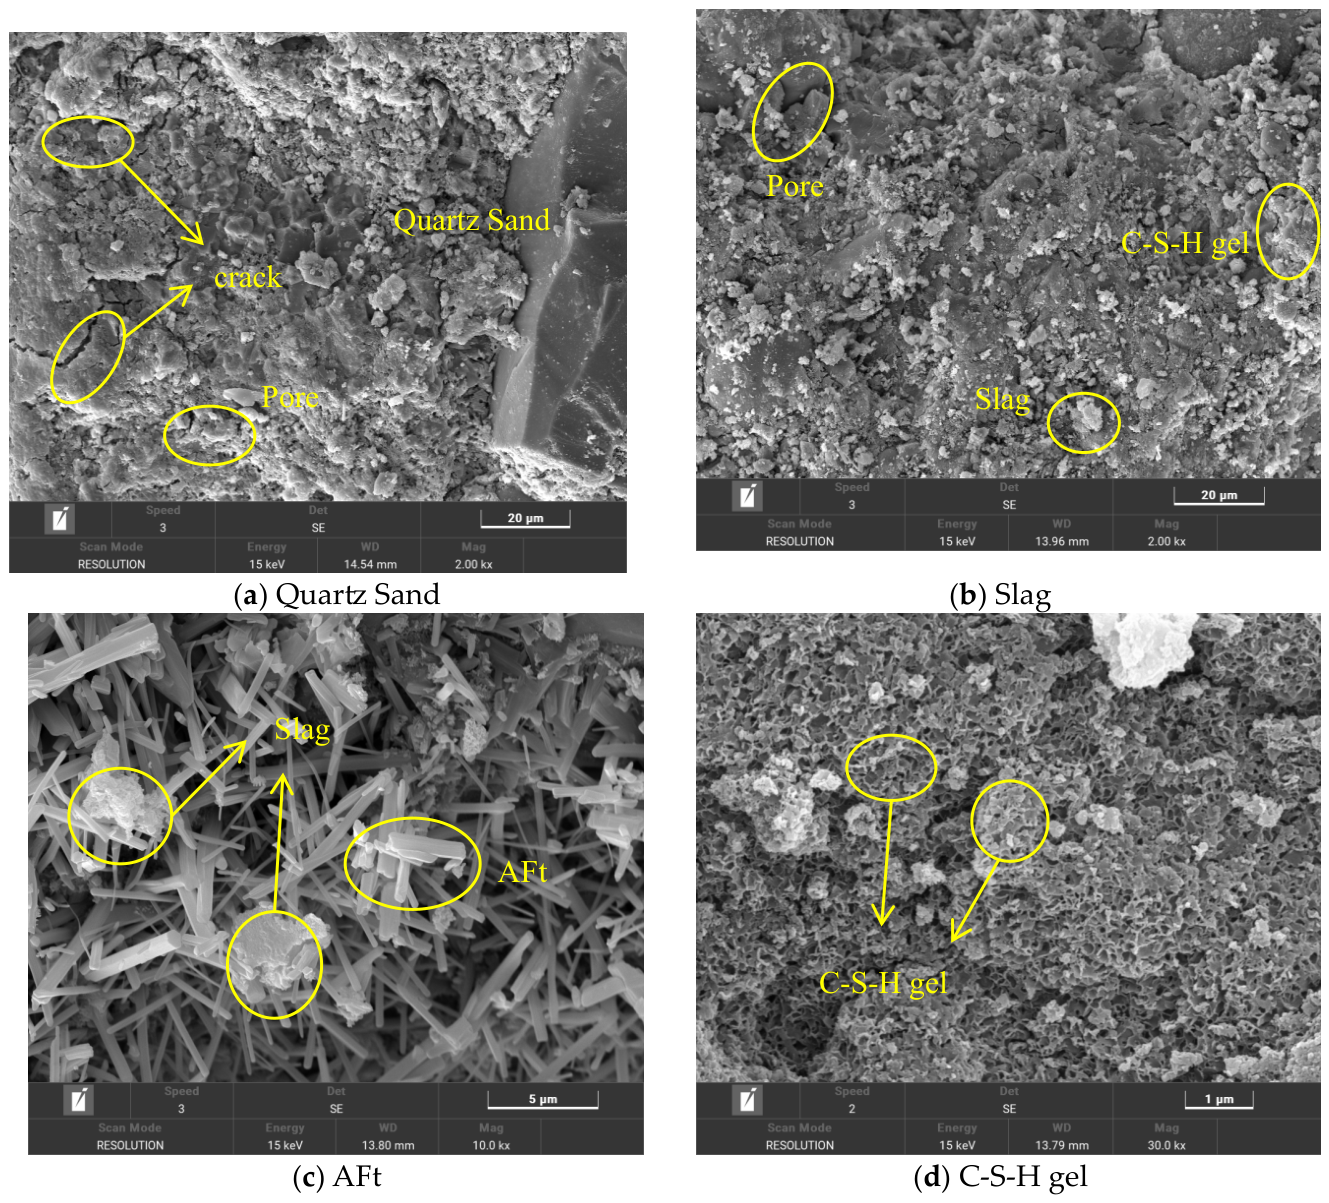
Figure 14.
EDS test results
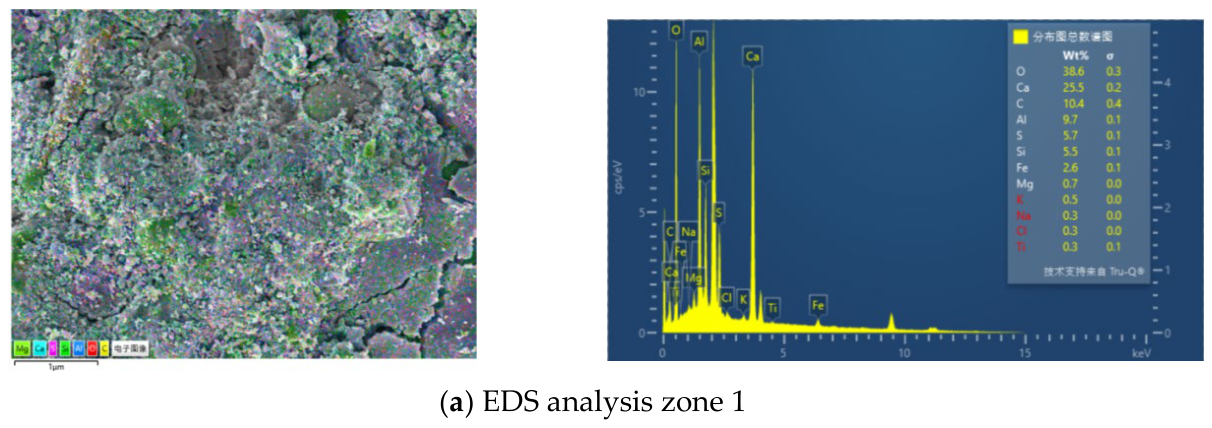
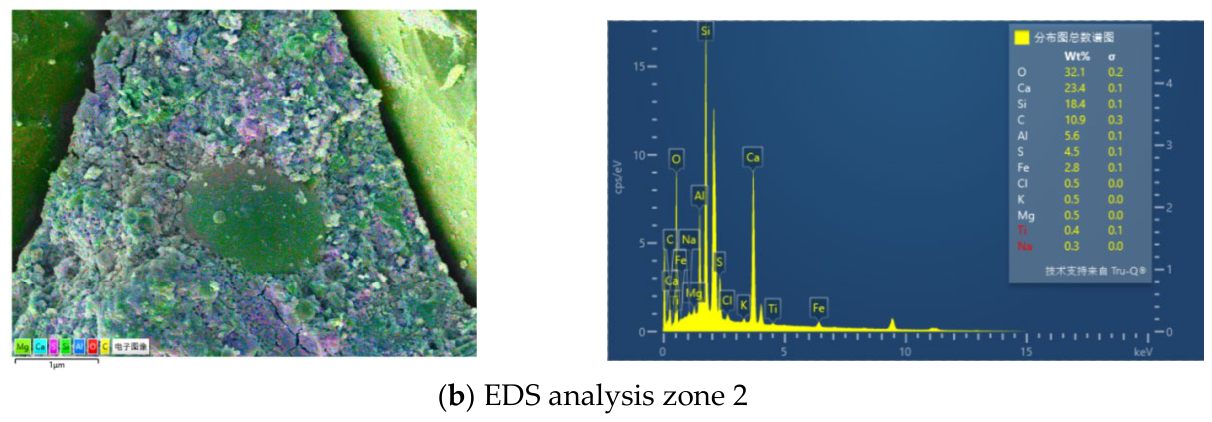
Figure 15.
Boundary conditions of the numerical calculation model.
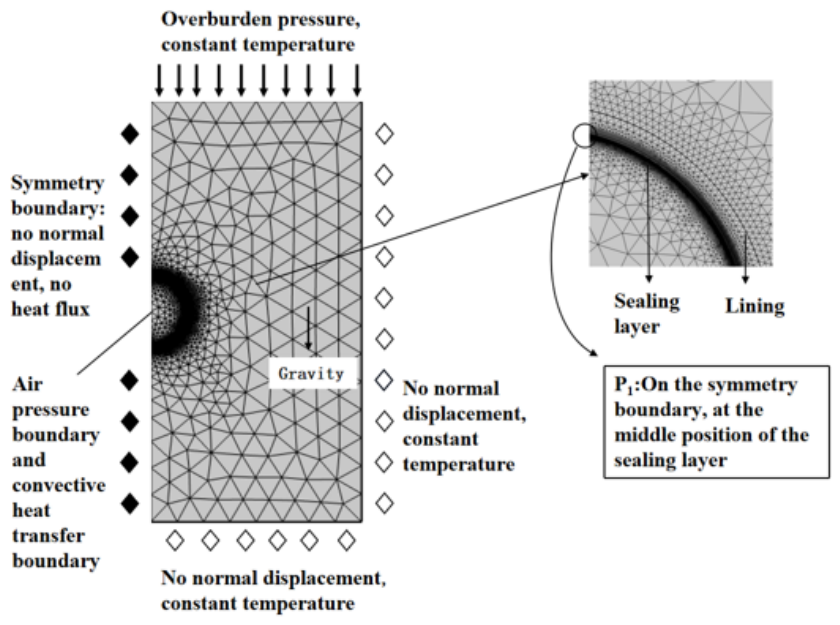
Figure 16.
Variation of air pressure: (a) Week 1, (b) Day 60, (c) 60 cycles.
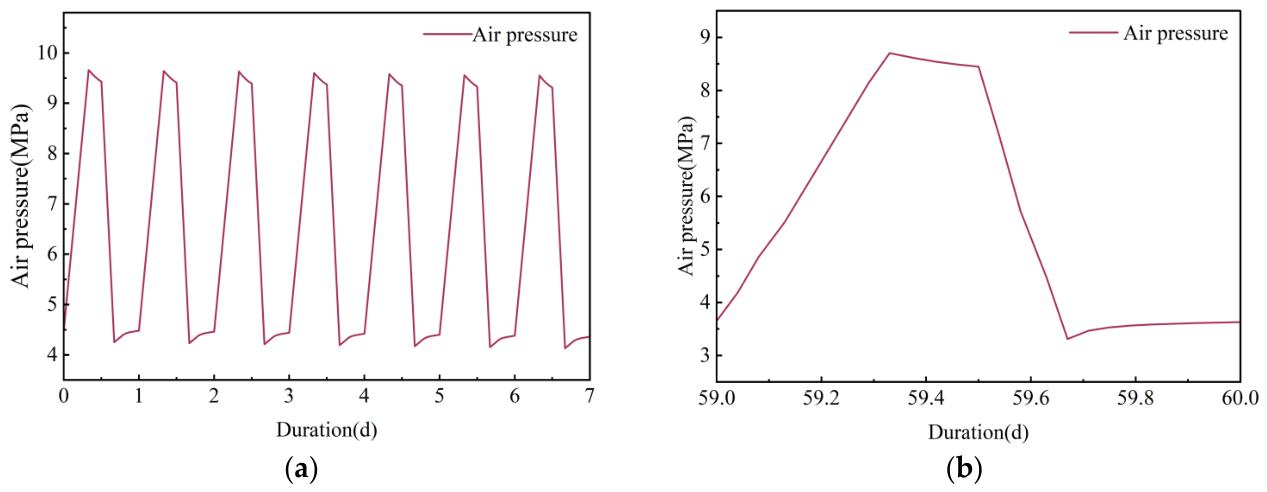
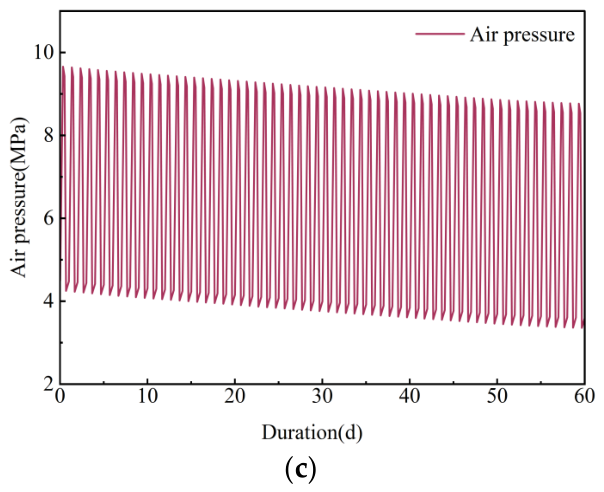
Figure 17.
Variation of air tempreature: (a) Week 1, (b) Day 60, (c) 60 cycles
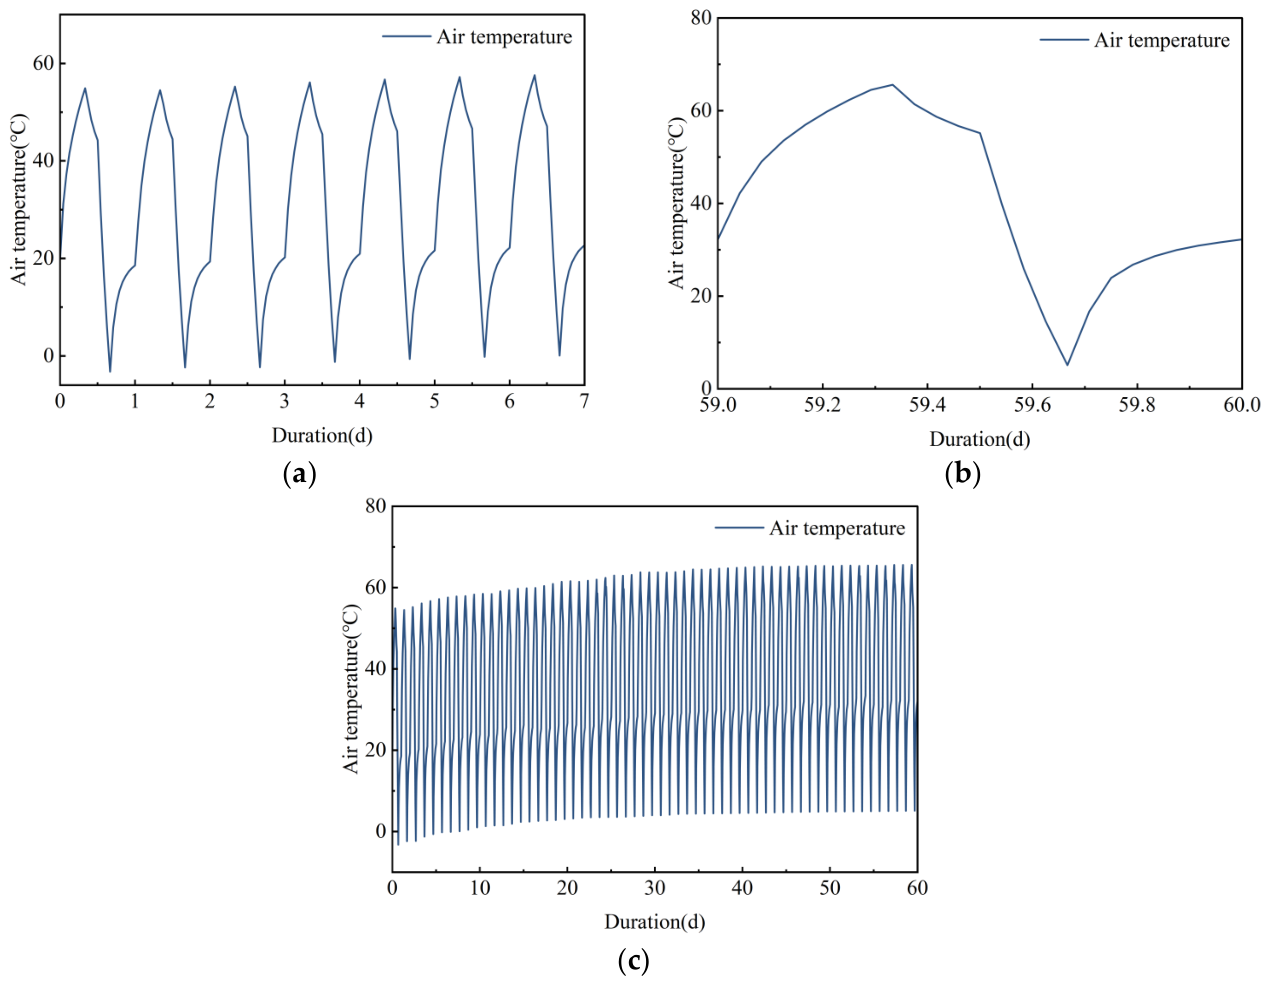
Figure 18.
Temperature variation within the sealing layer: (a) Week 1, (b) Day 60, (c) 60 cycles.
Figure 19.
Variation of gas leakage rate: (a) Week 1, (b) Day 60, (c) 60 cycles.
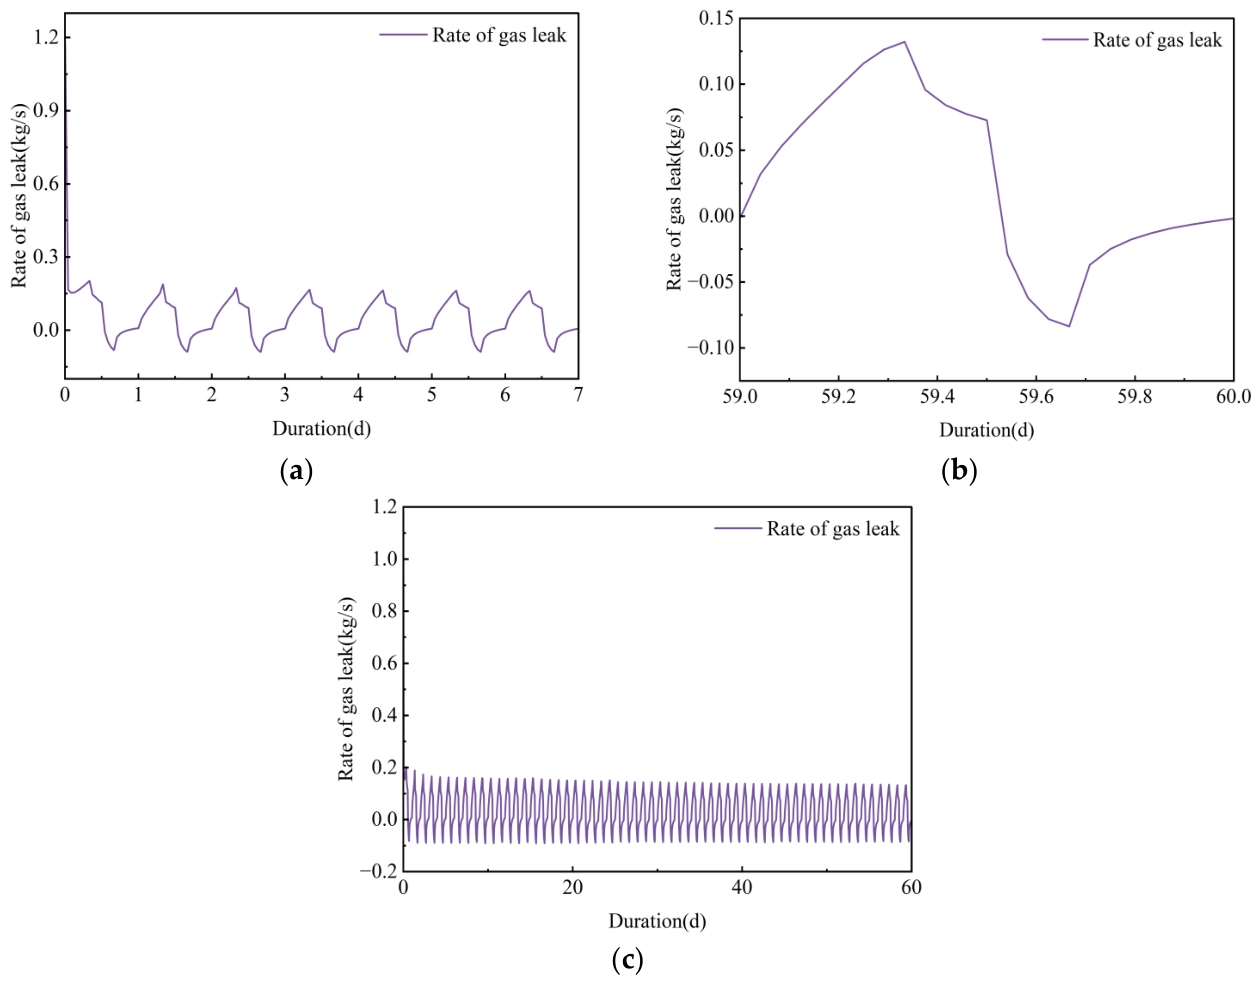

Table 1.
The main chemical components of sulphate aluminate cement,fly ash and slag.
| Material | Mass fraction/% | |||||||
|---|---|---|---|---|---|---|---|---|
| CaO | SiO2 | Al2O3 | Fe2O3 | MgO | TiO2 | SO3 | P2O5 | |
| Sulfoaluminate cement | 45.3 | 7.23 | 18.6 | 4.3 | 1.35 | 0.87 | 12.5 | - |
| Fly ash | 5.7 | 43 | 24 | 2.5 | 0.93 | - | 0.8 | - |
| Slag | 37.5 | 36.6 | 17.7 | 1.6 | 5.3 | - | 1.3 | - |
Table 2.
Sealing layer proportions.
| Specimen | Cement(kg/m3) |
Fly ash (kg/m3) |
Slag (kg/m3) |
Basalt fiber (kg/m3) |
Quartz sand (kg/m3) |
Water reducer (kg/m3) |
Retarder (kg/m3) |
Water (kg/m3) |
| Sealing layer | 473.4 | 80 | 40 | 5.1 | 900 | 3 | 3.6 | 180 |
Table 3.
Gas permeability test results of specimens under different pore pressures.
| confining pressure(MPa) | pore pressure(MPa) | Permeability k/(10-18m2) | |||
| Specimen 1 | Specimen 2 | Specimen 3 | Average | ||
| 10 | 7.5 | 1.74 | 1.79 | 1.81 | 1.78 |
| 5.5 | 2.63 | 2.68 | 2.70 | 2.67 | |
| 3.5 | 5.54 | 5.61 | 5.65 | 5.6 | |
| 1.5 | 10.52 | 10.61 | 10.67 | 10.6 | |
Table 4.
EDS element mass fraction ratios of each measurement point in the specimen after excluding carbon.
Table 4.
EDS element mass fraction ratios of each measurement point in the specimen after excluding carbon.
| Element | O | Ca | Si | Al | S | Fe | Mg | K | Na | Cl | Ti |
|---|---|---|---|---|---|---|---|---|---|---|---|
| Analyzed zone 1 | 38.6 | 25.5 | 5.5 | 9.7 | 5.7 | 2.6 | 0.7 | 0.5 | 0.3 | 0.3 | 0.3 |
| Analyzed zone 2 | 32.1 | 23.4 | 18.4 | 5.6 | 4.5 | 2.8 | 0.5 | 0.5 | 0.3 | 0.5 | 0.4 |
Table 5.
Value of the parameters in the sensitivity analysis.
| Parameter(Variable,Unit) | Value | Source of calculation parameters |
|---|---|---|
| Cavern radius,(m) | 5 | Operating condition |
| Cavern length, H(m) | 5.093×10² | Operating condition |
| Cavern surface area, (m2) | 8×10⁴ | Operating condition |
| Cavern volume, V(m3) | 4×10⁴ | Operating condition |
| Cavern burial depth, D(m) | 155 | Operating condition |
| Lining thickness, (m) | 0.5 | Setting |
| Sealing layer thickness, (m) | 0.1 | Setting |
| Temperature of injected air, (K) | 313.15 | Operating condition |
| Ratio of discharge rate to charge rate, | 2 | Zhouetal.[54] |
| Mass flow rate of injected air, (kg/s) | 70 | Setting |
| Mass flow rate of released air, (kg/s) | 35 | Setting |
| Heat transfer coefficient, (W/(m2·K)) | 50 | Setting |
| Initial cavern air pressure, (Pa) | 4.5×10⁶ | Setting |
| Initial temperature, , (K) | 293.15 | Operating condition |
| Elastic modulus of rock, (GPa) | 30 | Operating condition |
| Poisson's ratio of rock, | 0.3 | Operating condition |
| Rock density,(kg/m3) | 2600 | Operating condition |
| Coefficient of thermal expansion of rock, (1/K) | 8×10⁻⁶ | Operating condition |
| Thermal conductivity of rock,(W/(m·K)) | 2.5 | Operating condition |
| Specific heat capacity of rock, (J/(kg·K)) | 0.8×10³ | Operating condition |
| Elastic modulus of lining, (GPa) | 34 | Operating condition |
| Poisson's ratio of lining, | 0.3 | Operating condition |
| Density of lining,(kg/m3) | 2500 | Operating condition |
| Coefficient of thermal expansion of lining, (1/K) | 1×10⁻⁵ | Operating condition |
| Thermal conductivity of lining,(W/(m·K)) | 2 | Operating condition |
| Specific heat capacity of lining, (J/(kg·K)) | 0.9×10³ | Operating condition |
| Porosity of lining, | 0.12 | Operating condition |
| Permeability of lining, (m2) | 1×10-16 | Operating condition |
| Elastic modulus of sealing layer, (GPa) | 5.4 | Test |
| Poisson's ratio of sealing layer, | 0.3 | Setting |
| Density of sealing layer,(kg/m3) | 2600 | Test |
| Coefficient of thermal expansion of sealing layer, (1/K) | 9×10⁻⁶ | Setting |
| Thermal conductivity of sealing layer,(W/(m·K)) | 1.6 | Setting |
| Specific heat capacity of sealing layer, (J/(kg·K)) | 0.9×10³ | Setting |
| Porosity of sealing layer, | 0.08 | Setting |
| Apparent permeability of sealing layer, (m2) | 1.68×10⁻²⁰ | Test |
| Klinkenberg coefficient, b(N/m²) | 966.55 | Test |
| Initial reservoir pressure, (Pa) | 1.0133×10⁵ | Zhouetal.[54] |
Disclaimer/Publisher’s Note: The statements, opinions and data contained in all publications are solely those of the individual author(s) and contributor(s) and not of MDPI and/or the editor(s). MDPI and/or the editor(s) disclaim responsibility for any injury to people or property resulting from any ideas, methods, instructions or products referred to in the content. |
© 2026 by the authors. Licensee MDPI, Basel, Switzerland. This article is an open access article distributed under the terms and conditions of the Creative Commons Attribution (CC BY) license (http://creativecommons.org/licenses/by/4.0/).
Copyright: This open access article is published under a Creative Commons CC BY 4.0 license, which permit the free download, distribution, and reuse, provided that the author and preprint are cited in any reuse.