

Submitted:
18 September 2026
Posted:
20 September 2026
You are already at the latest version
Abstract
Integrating Wire Arc Additive Manufacturing (WAAM) into the Selective Paste Intrusion (SPI) process enables the fully additive fabrication of reinforced concrete structures with complex geometries. However, the WAAM process transfers thermal energy into the reinforcement and the surrounding concrete matrix, which may affect the bond between steel and concrete. This study addresses whether the heat introduced by the welding of reinforcement segments impairs the bond between reinforcing steel and SPI-fabricated concrete. To isolate this thermal effect from the geometric process effects covered in a companion study, two groups of 16 mm reinforcing bars embedded in SPI-fabricated concrete were compared: bars whose segments were joined during printing by manual welding at seven joints per bar (process-integrated thermal exposure), and bars with adhesively bonded segments without thermal input as the reference. Eight specimens per group (n = 8) were tested in push-through. Thermography corrected for the emissivity of the steel indicates estimated bar-surface temperatures of 215 to 275 °C near the joints immediately after welding and of 125 to 162 °C after 2 to 3 min, and the bars did not cool completely to ambient temperature between cycles. Despite these temperatures and the repeated heating and cooling cycles during printing, no loss of bond capacity relative to the adhesively bonded reference group was resolvable: the welded group reaches a mean maximum bond stress of 20.5 MPa, the adhesively bonded reference 22.4 MPa, and the difference of 1.9 MPa lies within the scatter of the two groups (coefficients of variation 22% and 21%). The failure mechanism was likewise the same for welded and adhesively bonded specimens: all failed by bar push-through with the same bond-slip sequence and a similar slip at maximum bond stress. Relative to the compressive strength of 72.4 MPa determined for the same mixture on cast prisms, the bond capacities correspond to roughly 30%. The segment joints were loaded in compression only, and their tensile and fatigue capacity was not characterised. Moreover, since the procedure investigated here resembles a stud welding process rather than genuine WAAM fabrication, the results are promising but do not yet provide sufficient evidence that WAAM can be fully integrated into the SPI process. In genuine WAAM, by contrast, welding occurs far more frequently than in the present procedure because of the smaller layer heights, so that heat accumulates and overlapping thermal cycles can produce even higher sustained temperatures at the steel–concrete interface.
Keywords:
selective paste intrusion
; wire arc additive manufacturing (WAAM)
; additive manufacturing
; bond behaviour
; reinforcement integration
; thermal exposure
; welding
; stud welding
; push-through test
; particle bed
1. Introduction
Selective Paste Intrusion (SPI) is an additive manufacturing method for producing concrete elements with complex geometries. Aggregates are sequentially spread to form a particle bed, and cement paste is selectively applied to bind them. The unbound surrounding aggregates act as temporary support, enabling the fabrication of freeform components without the need for conventional formwork, see Figure 1 [1,2].
Strategies for integrating reinforcement into digitally fabricated concrete are the subject of ongoing research [4,5]. Combining SPI with Wire Arc Additive Manufacturing (WAAM) has been proposed as a strategy to produce custom-shaped reinforcement directly within the particle bed [6]. WAAM reinforcement reaches a yield strength of 390 , a tensile strength of 481 , and a uniform elongation of in the single WAAM specimen that could be tested, and its bond performance is comparable to conventional B500B reinforcement [7]. B500B denotes a characteristic yield strength of 500 and ductility class B per EN 1992-1-1 [8], the latter defined by a strain-hardening ratio at a uniform elongation of at least . By characteristic yield strength, B500B lies between ASTM A615 Grades 60 and 75. The combined process alternates between steel deposition by WAAM, aggregate spreading, and selective paste intrusion, building the reinforced concrete element layer by layer inside the particle bed. A related hybrid concept has been proposed for extrusion-based printing: in the AMoRC process, segmented reinforcing bars are joined by intermittent drawn-arc stud welding ahead of a continuous concrete extrusion [9,10]. The combination of in-situ arc welding with a particle-bed process, in which the selectively intruded fresh matrix surrounds the reinforcement during welding, has so far only been investigated for SPI.
The bond between reinforcing steel and concrete is governed by three mechanisms: adhesion at the steel–concrete interface, mechanical interlock at the ribs, and friction due to relative displacement between steel and concrete [11,12,13]. At very small slip values, adhesion dominates but is lost early. The load transfer is then primarily governed by mechanical interlock, where the ribs bear against the surrounding concrete keys. With increasing slip, these concrete keys are progressively sheared off until the maximum bond stress is reached. Beyond that point, friction between steel and concrete remains as the only relevant mechanism [14]. Any disturbance in the matrix around the reinforcement, whether from thermal damage or from impaired material deposition, can therefore affect both the early bond mobilisation and the maximum achievable bond capacity.
A challenge of this combination is the high temperature generated during the WAAM process. The thermal load transferred from the welding point into the reinforcement and the surrounding particle bed can alter the rheological properties of the cement paste and impair the mechanical performance of the hardened concrete. Cement-paste rheology is sensitive to temperature, with changes in yield stress and plastic viscosity reported already in the range of 20 °C–50 °C [15,16,17].
For the SPI system considered here, the relevant thermal limits were established in a sequence of preceding studies. The fresh-state limit was identified by measuring how rising cement paste temperatures affect yield stress and viscosity. A sharp transition was observed between 60 °C and 70 °C, above which penetration of the cement paste into the particle bed deteriorates [18]. The hardened-state limit was confirmed by examining the effect of fresh-state thermal exposure on the compressive and flexural strength of the resulting concrete, which decline above a fresh-state temperature of 80 °C [19]. The actual temperatures occurring during WAAM at varying distances from the welding point, and corresponding cooling strategies, were then quantified [20]. Depending on the cooling rate and the distance to the welding point, the reinforcement reaches temperatures between 100 °C and 450 °C [20]. Bar temperatures of 164 °C–206 °C were measured by thermocouples embedded in the bar at a distance of 40 between measuring point and process zone [20]. These temperatures exceed the identified rheological and hardened-state thresholds.
To reduce the thermal load on the particle bed, one strategy is to increase the vertical distance between the welding point and the bed surface. Print quality remains unimpaired up to 40 , with a first strength reduction of about 16 setting in at 50 [3]. This vertical protrusion of the reinforcement gives rise to shadowing effects, a process-induced disturbance of material deposition in the vicinity of the protruding bar. A companion study [21] investigates these geometric effects systematically, covering bar diameters of 8–25 and inclination angles of 0 °C–90 °C. The present work focuses exclusively on the thermal component.
To isolate the effect of thermal exposure on bond strength, a controlled laboratory study was conducted prior to the present work. Conventionally cast pull-out specimens with WAAM-fabricated reinforcement bars heated to 20 °C, 60 °C, 80 °C, and 200 °C by means of an internal cartridge heater were tested according to RILEM RC6 [22]. The results revealed a displacement-dependent thermal effect that runs counter to the expectation of a uniform bond reduction across all slip levels. At small slip values ( and ), the 200 °C specimens exhibited higher bond stresses than those at 60 °C and 80 °C, attributed to heat-induced water evaporation at the steel–concrete interface, which locally reduces the water-to-cement ratio and increases matrix stiffness. The 200 °C specimens showed a reduction of 29 in maximum bond stress. Complementary microstructural analyses (X-ray diffraction (XRD), thermogravimetric analysis (TGA), and mercury intrusion porosimetry (MIP)) confirmed partial dehydration of C-S-H phases, an increased content of unhydrated C3S, indicating a locally reduced degree of hydration due to premature water loss, and a shift of the pore size distribution toward larger radii at 200 °C [22].
These findings establish the thermal sensitivity of the bond interface under controlled conditions. Independent evidence from cyclic thermal loading tests on reinforced concrete beams (7–28 cycles at 100 °C–300 °C) shows that lap-splice bond strength is largely retained at 100 and 200 °C but is reduced by up to 44 at 300 °C, governed primarily by the peak temperature and, to a lesser degree, by the number of cycles [23]. For oven-heated specimens, bond losses additionally increase with heating rate and target temperature [24], and depend non-monotonically on the concrete age at exposure for ages between 3 and 28 days [25]. The thermal exposure considered here, by contrast, acts within the first hours after intrusion, before the interface has fully formed. The controlled study used conventionally cast specimens with a cartridge heater to apply a defined, uniform temperature over the bond length. In the actual combined SPI-WAAM process, the thermal exposure differs in character: it arises from the layer-by-layer deposition of reinforcement directly in the particle bed, producing a transient, spatially non-uniform temperature field. The cement paste surrounding the reinforcement is not conventionally cast but formed by selective intrusion into a granular packing.
The present study addresses this gap. It records the process-integrated thermal exposure from welding of steel segments during fabrication by thermography and quantifies the effect of this exposure on the bond strength between reinforcement and SPI-fabricated concrete, using 16 bars embedded vertically in the particle bed. To subject the bond to repeated welding-induced heating and cooling cycles under controlled conditions, as a simplified analogue of the cyclic thermal loading in WAAM, reinforcement bars were segmented and reassembled: in one group the segments were joined by manual welding, introducing thermal exposure, and in the other group they were adhesively bonded without thermal input. Sixteen specimens were produced, eight welded and eight adhesively bonded ( per group). Both groups were fabricated under identical laboratory conditions with the same materials, particle bed, and printing parameters, so that they differ only in the joining method and the associated thermal input.
2. Materials and Methods
2.1. Materials
The concrete was produced using ordinary Portland cement (CEM I 42.5 N) and quartz sand with a particle size ranging from 1.0–2.2. The water-to-cement ratio was 0.40. A polycarboxylate-ether-based superplasticizer was used to adjust the flow properties of the cement paste, targeting a mini-slump flow of 400–410, determined with a Haegermann cone according to EN 1015-3. Ribbed reinforcing bars of grade B500B [26] (characteristic yield strength , ductility class B) with a nominal diameter of 16 were used. For this mixture, a mean compressive strength of at an age of 28 day has been determined on cast prisms according to DIN EN 196-1 [22].
2.2. Specimen Geometry and Reinforcement Configuration
The bond length was . Each specimen started with an initial segment protruding 10 above the particle-bed surface. Below the bed surface, approximately 50 of bar extended down to the holder rail. After separation from the rail, this free length served as the load-application end of the push-through test (see Section 2.4). Seven further segments were joined sequentially during printing, with the first six measuring 10 and the final segment measuring 20 , giving a total bar length of 90 above the initial bed surface (approximately 140 above the holder rail). Of this, 80 were embedded in the printed concrete (bond length), while the upper 10 of the final segment remained free above the specimen for mounting the displacement transducer. Seven segment joints fall within the bond length (Figure 2a). The reinforcing bars were cut into these segments prior to fabrication using a thin cutting disc, perpendicular to the bar axis. During fabrication, the segments were reassembled in the original cutting sequence and orientation using the respective joining method.
Two joining methods were compared. In the welded group, the segments were joined by gas tungsten arc welding (GTAW) using a power source (REHM Invertig.Pro digital 240DC, Uhingen, Germany) with an air-cooled torch (R-Tig 200/35) and a steel filler rod (W3Si1 according to DIN EN ISO 636) under a pure argon (I1 according to DIN EN ISO 14175) shielding gas atmosphere. The welding was performed in direct current electrode negative (DCEN) polarity at a machine-set welding current of 120 . Torch and filler rod were guided manually, as is characteristic of manual GTAW, so that arc duration and wire feed varied from joint to joint. A defined travel speed does not exist for this manual procedure, and a per-joint heat input is therefore not reported. Prior to each welding operation, the exposed bar end and the joint faces were cleaned to remove adhering aggregate particles, dust, and cement paste from the particle-bed environment. In the adhesively bonded group, the segments were butt-joined using a low-viscosity ethyl cyanoacrylate adhesive (Loxeal Instant Adhesive 32, Cesano Maderno, Italy). The joint faces of this group were cleaned prior to joining in the same manner as those of the welded group.
The reinforcement bars were fixed in the particle bed by welding them onto a holder consisting of two steel rails. Each rail carried four bars at a spacing of approximately 180 along the rail, and the two rails were mounted approximately 180 apart. The rails were connected by transverse steel struts for stability. A vertical round bar (diameter 28 ) served as a ground connection for the welding process. This bar was co-printed with the specimens and segmented in the same manner as the reinforcement bars, so that a fresh segment was always available above the bed surface for attaching the welding clamp. Figure 2 shows the specimen geometry and the holder assembly.
2.3. Specimen Fabrication
The specimens were fabricated on an SPI printer. The aggregate was spread in layers of 3 thickness using the spreading roller of the printer. After each aggregate layer, cement paste was selectively applied to bind the particles. For printing, the holder was placed on the printer platform and both rails were overprinted simultaneously in the same printing sequence, so that the welded and adhesively bonded groups received identical cement paste and aggregate conditions.
The printing started with the first 10 segment protruding above the particle bed. With each successive 3 layer of aggregate and cement paste, the protrusion decreased until the upper end of the segment approached the level of the bed surface. The printer was then paused, and a new segment was joined to the existing bar using the respective joining method (see Section 2.2), restoring the protrusion. This cycle of printing and segment joining was repeated until the full bond length of 80 was reached. The final segment was 20 long, so that 10 of free bar length remained above the specimen for the displacement measurement.
The setup produced a continuous block of printed concrete along each rail, embedding all four specimens per rail in a single monolithic body. This fabrication was performed in two production runs of identical configuration, so that eight specimens per group were obtained. Both runs used the same materials, mix design, and printing parameters, and the thermographic monitoring confirmed near-identical thermal conditions between them (Section 2.5).
After 24 of curing in the particle bed, the blocks together with their holders were excavated. Since the embedded bars still connected the blocks to the holder rails, the reinforcement stubs were separated directly upon excavation to release the blocks for storage. The cut was made carefully using a rotary tool (Dremel, Mount Prospect, IL, USA) with a thin cutting disc, applying minimal force to avoid vibration-induced damage to the early-age bond at the steel–concrete interface. The blocks were then stored at 20 °C and 65 relative humidity.
Since the SPI process produces a monolithic block rather than individual cylindrical specimens, each specimen had to be isolated by core drilling. At an age of 21 days, four cylindrical specimens with a diameter of 80 were extracted from each block by wet core drilling, with the reinforcement bar centred within each core. The remaining concrete cover after core drilling was not sufficient to prevent splitting failure. To provide the confinement required for a push-through test governed by bond failure rather than splitting, the specimens were bonded into steel confinement rings (inner diameter 82 , inner surface sandblasted to improve adhesive bond) using epoxy adhesive (Hilti HIT-RE 500, Schaan, Liechtenstein). Excess concrete above and below the ring was removed with a fine saw, producing specimens with a height equal to the bond length of 80 .
All specimens were stored at 20 °C and 65 relative humidity until testing at a specimen age of more than 28 days. Figure 3 shows the key stages of the fabrication process.
2.4. Mechanical Testing
Push-through tests were conducted following a procedure adapted from RILEM RC6 [27], as in the companion study [21] (Figure 4). The specimens were placed on a spherical seat to compensate for angular misalignment between bar axis and load axis and to ensure axial load application. The reinforcement bars protruded vertically upward, and the specimens were tested inverted relative to the printing orientation: the former rail-side bar end pointed upward for load application, while the displacement transducer engaged the opposite bar end (the final segment) below the specimen. The loading rate was adopted from RILEM RC6 [27] and applied under force control. It was computed as , where is the nominal bar diameter in . Load was applied to the upper bar end on a universal testing machine (Zwick Z600, Ulm, Germany). Force was recorded using the internal load cell of the testing machine.
Displacement was recorded at the free (unloaded) bar end using a potentiometric linear displacement transducer (Ahlborn FWA025TR, Holzkirchen, Germany; measuring range 25 , resolution as specified by the manufacturer) mounted in a polymer holder clamped to the steel confinement ring. The bond stress was calculated from the applied force F as
with and . Equation (1) corresponds to the mean bond stress over the bond length as defined in RILEM RC6 [27], applied here without the normalisation to a reference concrete strength used there. The bond response was evaluated at four characteristic slip levels: , , , and , representing the adhesive stage, the early interlock stage, the developed interlock stage, and the bond capacity, respectively. This evaluation follows the practice of the preceding studies [7,22] and reflects the stages of bond action described in [12].
The configuration deviates from RILEM RC6 [27] in several respects. Loading is applied in compression rather than tension, so that lateral expansion of the bar due to the Poisson effect increases the radial pressure at the interface instead of reducing it. Over the full specimen height, the bar is bonded, without the bond-free pre-length of the RC6 specimen. The concrete cover of the RC6 cube is replaced by a steel confinement ring, whose radial stiffness exceeds that of a typical concrete cover. Finally, the concrete is built up layer-wise along the bar axis rather than cast transverse to it. The absolute bond stresses reported here are therefore not directly comparable to pull-out values from the literature or to anchorage design models. The comparison between the two groups is unaffected, since both were fabricated and tested in the identical configuration. The RC6-derived bond length, loading rate, and slip-level evaluation were retained for comparability with the preceding controlled study [22] and with the pull-out characterisation of WAAM reinforcement [7].
2.5. Thermographic Imaging
Infrared video was recorded during each production run using a thermal imaging camera (InfraTec VarioCAM Research 976S, InfraTec GmbH, Dresden, Germany, long-wave infrared (LWIR) 8–14) with a 30 objective (Jenoptik, Jena, Germany) mounted above the particle bed, with an emissivity setting of . This value approximates the emissivity of the quartz sand surface ( 0.90–0.95) and was chosen because the primary objective was to monitor the temperature distribution in the particle bed. Because the camera assumes an emissivity of 1.00 while the freshly cut steel surface ( 0.20–0.30) emits far less radiation, the displayed steel temperatures underestimate the actual values. Correcting for the steel emissivity (grey-body inversion over the camera band of 8–14, reflected ambient temperature 20 °C) shows that a displayed value of 60 °C corresponds to an actual surface temperature of approximately 125 °C–162 °C, and a displayed value of 100 °C to approximately 215 °C–275 °C. The exact deviation depends non-linearly on temperature, on the reflected ambient radiation, and on the progressive oxidation of the steel surface, which increases its emissivity over successive welding cycles. Since a single emissivity setting applies to the entire image, the present analysis focuses on the particle-bed temperature rather than the steel surface. For quantitative evaluation, frames were extracted from the video at 5 intervals.
From each frame, the excess temperature was computed. is the mean temperature in an annular region of interest (ROI) surrounding each bar, extending approximately 30 from the bar centre, and is the mean temperature in a bar-free reference area of the same frame. This frame-by-frame background correction eliminates the baseline drift caused by periodic non-uniformity corrections (NUC) of the camera sensor. Because both quantities are extracted from the same frame with the same emissivity setting, the values are largely independent of the absolute emissivity calibration. Three bars per recording (P02, P03, P04) were evaluated. P01 was excluded because the overlay of the temperature scale in the infrared image prevented a complete annular ROI. Figure 5 shows an exemplary frame with the evaluation regions overlaid. The cumulative thermal exposure per recording was quantified as up to five minutes after the last welding peak.
2.6. Data Evaluation
All results are reported as individual values and as group means with standard deviations (SD) ( per group). Because the joining method is assigned at the level of the holder rail, the specimens of a group are not fabricated individually but share a rail and a printed block within each production run. Because of the sample size and the scatter inherent in bond testing, the comparison between the groups is reported descriptively, and no inferential statistics are applied.
3. Results and Discussion
Figure 6 shows the individual bond-stress–displacement curves for the welded and adhesively bonded specimens, together with the mean comparison. Figure 7 summarises the discrete bond stress values at , , , and at . All 16 specimens ( per group) are included in the analysis.
Table 1 reports the individual bond stress values at the four characteristic slip levels.
All curves follow the characteristic sequence of adhesion-controlled initial response, progressive activation of mechanical interlock at the ribs, attainment of a peak bond stress, and subsequent frictional decay, consistent with the classical bond behaviour reported for ribbed bars [11,12,13]. No specimen failed by splitting. All failures occurred by bar push-through. The confinement ring thus prevented splitting, and the measured response is governed by bond failure.
At small displacements ( and ), the two groups show no consistent difference. The mean values are (welded) and (adhesively bonded) at , and and at . The scatter at these displacement levels is high in both groups (coefficient of variation, CV, at : 110 adhesively bonded, 182 welded), since displacements this small approach the resolution limit of the displacement measurement and are sensitive to local packing and intrusion conditions. These levels are therefore reported for completeness but not interpreted further.
The curves diverge from approximately onward. At , the adhesively bonded group reaches a mean bond stress of , compared to for the welded group.
At , the adhesively bonded specimens achieve a mean of (SD ), the welded specimens (SD ). The difference of , corresponding to 9 of the adhesively bonded mean, is smaller than the standard deviation of either group. The coefficients of variation are nearly identical ( 22 welded, 21 adhesively bonded). Within the scatter of the data, no adverse effect of the process-integrated thermal exposure on the bond capacity is resolvable.
The displacement at is similar in both groups ( adhesively bonded, welded), indicating that the welding does not alter the kinematic failure sequence.
The scatter of both groups falls at the upper end of the range reported for pull-out testing of ribbed bars. Compilations of nominally identical pull-out specimens report coefficients of variation of 1–18 [28], individual 16 pull-out series reach [29], about 10 is typical for repeated tests within one laboratory [11], and a coefficient of variation of 14 was obtained across 390 splice tests [12]. The values of 21–22 observed here are plausible for hand-crafted specimens: the bars were manually segmented, reassembled, and joined, and the specimens were extracted from printed blocks by core drilling rather than cast in standardised moulds.
Relative to the compressive strength of determined for the same mixture on cast prisms [22], the measured bond capacities correspond to roughly 30 . Forces of this order are thus transferred across the printed steel–concrete interface, irrespective of the joining method.
The weld bead protrudes from the bar surface and forms a localised geometric discontinuity at each joint (Figure 8). Whether it additionally acts as a bearing element cannot be resolved with the present data. WAAM-fabricated reinforcement, whose entire surface consists of successive weld beads at approximately spacing, achieves bond performance comparable to conventionally ribbed B500B bars [7]. Bond degradation after elevated-temperature exposure of hardening or hardened concrete has been reported in multiple independent studies [23,24,25,30,31,32], and the controlled thermal-exposure study on the same interface identified a bond reduction under sustained 200 °C [22]. No such reduction was resolvable here.
Figure 9 shows two exemplary infrared frames recorded during fabrication.
The recordings confirm that the region around the welding point exceeds 100 °C (displayed), which corresponds to an estimated 215 °C–275 °C at the bar surface (grey-body inversion with 0.20–0.30, see Section 2.5), consistent with the temperature measurements in [20]. These values refer to the bar surface in the particle bed near the joint, not to the peak temperatures in the weld pool and the heat-affected zone, which are higher. The bars cool from > 100 °C (displayed) to approximately 60 °C (displayed, estimated 125 °C–162 °C actual) within 2–3. Full cooling to ambient temperature is not reached between welding cycles. Over the course of the fabrication, the thermal halos of adjacent bars on the welded rail become visible on the particle-bed surface, indicating that heat is transferred into the surrounding granular packing. As the particle bed is progressively covered by fresh aggregate and cement paste during printing, the surface measurement captures the thermal conditions at the time of deposition rather than a continuous record of the temperature at the steel–concrete interface. The adhesively bonded rail shows no thermal signature at the bed surface at any point during fabrication.
The radial extent of the thermal influence zone in the particle bed, estimated from the thermographic images using the bar diameter ( 16 ) as a dimensional reference, reaches approximately 30 from the bar centre. This estimate is based on the successively covered bed surface, i.e. a two-dimensional projection, not on a spatial mapping of the heat propagation at depth. The zone falls entirely within the drill cores (radius 40 ).
The quantitative evaluation (see Section 2.5) shows seven distinct peaks per recording, each corresponding to one segment-joining cycle, during which one segment was welded onto each of the four bars and the ground bar in direct succession (Figure 10). Each cycle follows a characteristic sequence: a steep temperature rise during the arc phase, a gradual decay as heat disperses into the surrounding particle bed, a drop when the next aggregate and cement paste layers are spread over the heated zone, followed by a slight temperature recovery as stored heat from the bed re-enters the freshly deposited material. This recovery indicates that the particle bed stores heat transiently and extends the effective duration of the thermal exposure beyond the welding event itself.
The mean peak amplitudes are and in the two recordings, while the valley temperatures between welding cycles are comparable ( 2–3), confirming that the visible particle-bed surface cools close to ambient between cycles. The cycle times ( and ) differ slightly, reflecting the manual nature of the segment-welding procedure used in this study. In an actual SPI-WAAM process, welding would be automated and cycle times controlled.
The cumulative thermal exposure at the bed surface, quantified as the time-integrated excess temperature (a surface-based proxy for the thermal load at the embedded interface, see Section 2.5), amounts to 1165 and 1212 in the two recordings. The two values differ by only about 4 , so that the thermal exposure was nearly identical in both production runs.
The result complements the controlled thermal-exposure study [22], in which 12 bars held at 200 °C for 18 by an internal heater exhibited a reduction of 29 in maximum bond stress. The process-integrated exposure examined here is of a different character: high peak temperatures at the steel surface act only for short periods per welding cycle, the bed surface re-cools between cycles, and a sustained bar-surface temperature of 200 °C, as applied in the controlled study, does not occur. Independent tests on reinforced concrete at sustained sub-high temperatures (150 °C–350 °C) confirm that bond degradation grows with heating duration [33]. The absence of a resolvable bond reduction in the present configuration is consistent with this picture.
The reduction in scatter from to (from CV above 100 to 21–22) reflects the progressive activation of the full bond length, which averages out local defects at individual segment joints.
4. Conclusions and Outlook
This study investigated the bond behaviour between reinforcement and concrete fabricated by Selective Paste Intrusion (SPI) under process-integrated thermal exposure from welding of steel segments, with adhesively bonded segments without thermal input as the reference. Reinforcing bars with a diameter of 16 embedded vertically in the particle bed were tested in push-through ( per group). The results show that process-integrated joining of reinforcement segments by welding within the SPI process is feasible in principle without a resolvable loss of bond capacity, as long as the thermal exposure corresponds to the stud-welding-like scenario investigated here, with seven joints per bar and estimated bar-surface temperatures of 215 °C–275 °C immediately after welding and 125 °C–162 °C after 2–3. For reinforcement produced by genuine WAAM, further investigations are required, in particular regarding heat accumulation, and questions of joint cleanliness remain to be addressed separately as a process-engineering task.
The welded and the adhesively bonded groups reach comparable bond capacities ( and ). The difference of ( 9 ) is smaller than the standard deviation of either group, and the coefficients of variation of the two groups are nearly identical ( 22 and 21 ). Within the scatter of the data, no adverse effect of the welding on the bond capacity was resolvable. Relative to the compressive strength of determined for the same mixture on cast prisms [22], the bond capacities correspond to roughly 30 . Reinforcement joined by process-integrated welding can thus transfer appreciable forces across the steel–concrete interface. The scatter lies at the upper end of the range reported for pull-out testing and is attributed to the manual segmentation, joining, and specimen extraction rather than to the thermal exposure, whose cumulative magnitude differed by only about 4 between the two thermographic recordings. The condition of the steel itself, in particular of the heat-affected zones at the joints, was not examined.
Bond stress values at very small slips () approach the resolution limit of the displacement measurement and show no consistent difference between the groups. All specimens failed by bar push-through and none by splitting, and the slip at maximum bond stress is similar in both groups. The failure mechanism, that is, the failure mode and the kinematic failure sequence, is thus the same for welded and adhesively bonded specimens.
Since the procedure investigated here resembles a stud welding process rather than genuine WAAM fabrication, the results are promising but do not yet provide sufficient evidence that WAAM can be fully integrated into the SPI process. The present procedure joins short segments ( 10 ) in single welding operations separated by several printed layers, a stud-welding-like approach as employed for segmented reinforcement in the extrusion-based AMoRC process [9,10]. In genuine WAAM, welding occurs far more frequently than in the present procedure: an actual WAAM build with layer heights of approximately requires welding operations at much shorter intervals, so that heat accumulates over successive layers [34], and the overlapping thermal cycles in a given bar cross-section can produce even higher sustained temperatures at the steel–concrete interface, of the kind shown to degrade bond under controlled heating [22] and under cyclic thermal loading [23]. For full WAAM integration, active cooling strategies [35,36] or a reduction of the thermal input per weld therefore remains necessary. The present results mark the lower-exposure end of the range between single stud-welding-like joining operations and continuous WAAM deposition, and drawn-arc stud welding, which completes a joint in a sub-second welding cycle with a correspondingly small heat-affected zone [37], is the candidate for automating the segment-joining route. A further transfer aspect concerns joint cleanliness: in the present study, the joint faces were cleaned before each welding cycle, so that contamination by particles or cement paste was largely excluded. Moisture is a known source of diffusible hydrogen in the weld metal [38], and foreign matter is a known cause of microstructural degradation and strength loss in welds [39]. In an automated SPI-WAAM process without intermediate cleaning, this aspect adds to the qualification requirements for the welded joints, independently of the concrete-side bond behaviour measured here.
As a limitation, the push-through configuration loads the segment joints exclusively in compression. The tensile and fatigue capacity of the joints (welded and adhesively bonded alike) was therefore not characterised, and the reported results concern the steel–concrete bond only, not the structural continuity of the reinforcement across the joints. Establishing the tensile performance of the joints in accordance with EN ISO 17660-1 for welding of reinforcing steel, and their fatigue performance according to the applicable fatigue design provisions, remains a prerequisite for structural application.
First, automated joining with a defined energy input per weld, for example by stud welding, where the process variant (drawn-arc versus capacitor-discharge according to EN ISO 14555) governs the actual heat input, would eliminate the variability of the manual procedure and allow the remaining scatter to be attributed to the process rather than to the preparation. Second, the step towards in-situ WAAM deposition combined with SPI, with its higher welding frequency and cumulative thermal load, remains to be taken. The temperature thresholds established in [22] and the temperature measurements and cooling strategies quantified in [20] define the design space for this step.
Author Contributions
Conceptualization, A.S. and T.K.; methodology, A.S.; investigation, A.S.; data curation, A.S.; writing—original draft preparation, A.S.; writing—review and editing, T.K. and C.G.; supervision, T.K. and C.G.; funding acquisition, C.G. All authors have read and agreed to the published version of the manuscript.
Funding
This research was funded by the Deutsche Forschungsgemeinschaft (DFG, German Research Foundation), project number 414265976, Transregional Collaborative Research Centre TRR 277 Additive Manufacturing in Construction.
Data Availability Statement
The data supporting the results of this study are available on Zenodo at https://doi.org/10.5281/zenodo.22050194. The data are currently under embargo until the publication of the associated article. Upon publication, the data will be publicly accessible under the Creative Commons Attribution 4.0 International (CC-BY 4.0) license.
Acknowledgments
The authors thank Stefan Rappl for operating the testing machine and for his support in specimen testing and data interpretation, Tamara Gandl for her assistance in specimen fabrication and testing, and Gregor Giessmann (Hilti) for providing the adhesive used in this study.
Conflicts of Interest
The authors declare no conflicts of interest.
References
- Lowke, D.; Dini, E.; Perrot, A.; Weger, D.; Gehlen, C.; Dillenburger, B. Particle-bed 3D printing in concrete construction — Possibilities and challenges. Cem. Concr. Res. 2018, 112, 50–65. [Google Scholar] [CrossRef]
- Weger, D. Additive Fertigung von Betonstrukturen mit der Selective Paste Intrusion — SPI / Additive manufacturing of concrete structures by Selective Paste Intrusion — SPI. PhD thesis, Technical University of Munich, Munich, Germany, 2020. [Google Scholar]
- Straßer, A.; Haynack, A.; Kränkel, T.; Gehlen, C. Additive manufacturing by the Selective Paste Intrusion: Effect of the distance of the print nozzle to the particle bed on the print quality. Constr. Build. Mater. 2024, 449, 138274. [Google Scholar] [CrossRef]
- Mechtcherine, V.; Buswell, R.; Kloft, H.; Bos, F.P.; Hack, N.; Wolfs, R.; Sanjayan, J.; Nematollahi, B.; Ivaniuk, E.; Neef, T. Integrating reinforcement in digital fabrication with concrete: A review and classification framework. Cem. Concr. Compos. 2021, 119, 103964. [Google Scholar] [CrossRef]
- Kloft, H.; Empelmann, M.; Hack, N.; Herrmann, E.; Lowke, D. Reinforcement strategies for 3D-concrete-printing. Civ. Eng. Des. 2020, 2, 131–139. [Google Scholar] [CrossRef]
- Weger, D.; Baier, D.; Straßer, A.; Prottung, S.; Kränkel, T.; Bachmann, A.; Gehlen, C.; Zäh, M. Reinforced particle-bed printing by combination of the Selective Paste Intrusion method with Wire and Arc Additive Manufacturing — A first feasibility study. In Second RILEM International Conference on Concrete and Digital Fabrication; Bos, F.P., Lucas, S.S., Wolfs, R.J.M., Salet, T.A.M., Eds.; Springer: Cham; RILEM Bookseries , 2020; Vol. 28, pp. 978–987. [Google Scholar] [CrossRef]
- Tischner, K.; Rappl, S.; Riegger, F.; Straßer, A.; Osterminski, K.; Kränkel, T.; Baehr, S.; Zaeh, M.F.; Gehlen, C. Bond behavior of WAAM reinforcements in comparison to conventional steel reinforcements. Constr. Mater. 2023, 3, 217–232. [Google Scholar] [CrossRef]
- DIN Deutsches Institut für Normung e.V. DIN EN 1992-1-1:2025-09; Eurocode 2: Bemessung und Konstruktion von Stahlbeton- und Spannbetontragwerken — Teil 1-1: Allgemeine Regeln und Regeln für Hochbauten, Brücken und Ingenieurbauwerke; Deutsche Fassung EN 1992-1-1:2023, 2025.
- Classen, M.; Ungermann, J.; Sharma, R. Additive Manufacturing of Reinforced Concrete—Development of a 3D Printing Technology for Cementitious Composites with Metallic Reinforcement. Appl. Sci. 2020, 10, 3791. [Google Scholar] [CrossRef]
- Zhang, S.; Kalus, M.; Engel, S.; Hegger, J.; Claßen, M. Development of an Innovative 3D-Printing Process for Reinforced Concrete – AMoRC Method. In RILEM Bookseries; Springer Nature Switzerland, 2023; pp. 641–652. [Google Scholar] [CrossRef]
- Eligehausen, R.; Popov, E.P.; Bertero, V.V. 1983. Local bond stress-slip relationships of deformed bars under generalized excitations: Experimental results and analytical model. Technical Report UCB/EERC-83/23, Earthquake Engineering Research Center, University of California, Berkeley, CA, USA. [Google Scholar]
- fédération internationale du béton (fib). Bond of reinforcement in concrete — State-of-art report . In fib Bulletin; fédération internationale du béton: Lausanne, 2000; p. 10. [Google Scholar] [CrossRef]
- fédération internationale du béton (fib). fib Model Code for Concrete Structures 2010; Ernst & Sohn: Berlin, 2013. [Google Scholar] [CrossRef]
- fédération internationale du béton (fib). Bond and anchorage of embedded reinforcement: Background to the fib Model Code for Concrete Structures 2010 fib Bulletin 72; fédération internationale du béton: Lausanne, 2014. [Google Scholar] [CrossRef]
- Lee, D.K.; Choi, M.S. Standard reference materials for cement paste: Part III — Analysis of the flow characteristics for the developed standard reference material according to temperature change. Materials 2018, 11, 2001. [Google Scholar] [CrossRef] [PubMed]
- Al Martini, S.; Nehdi, M.L. Coupled effects of time and high temperature on rheological properties of cement pastes incorporating various superplasticizers. J. Mater. Civ. Eng. 2009, 21, 392–401. [Google Scholar] [CrossRef]
- Wang, M.; Zhang, C.; Jiang, P.; Yan, J.; Liu, R.; Chen, M. Effects of temperature and bleeding on rheology of cement paste. Constr. Build. Mater. 2023, 403, 133085. [Google Scholar] [CrossRef]
- Straßer, A.; Weger, D.; Matthäus, C.; Kränkel, T.; Gehlen, C. Combining Wire and Arc Additive Manufacturing and Selective Paste Intrusion for additively manufactured structural concrete: Fundamental investigations on the effect of heat exposure by WAAM on the rheological and intrusion behavior of cement paste in the particle bed during Selective Paste Intrusion. Open Conf. Proc. 2022, 1, 61–72. [Google Scholar] [CrossRef]
- Straßer, A.; Kränkel, T.; Gehlen, C. Integrating Wire Arc Additive Manufacturing into Selective Paste Intrusion for reinforced concrete elements: Effect of temperature on the mechanical performance. ce/papers 2023, 6, 742–745. [Google Scholar] [CrossRef]
- Straßer, A.; Riegger, F.; Hamilton, L.D.; Kränkel, T.; Gehlen, C.; Zaeh, M.F.; Kwade, A. Selective Paste Intrusion: Integration of reinforcement by WAAM — Concept and current research with special attention to cooling strategies. Constr. Build. Mater. 2023, 406, 133236. [Google Scholar] [CrossRef]
- Straßer, A.; Kränkel, T.; Gehlen, C. Selective Paste Intrusion—Shadowing Effects from Rebar Protrusion in the Particle Bed and Their Impact on Bond Strength. Materials 2026, 19, 3954. [Google Scholar] [CrossRef]
- Straßer, A.; Riegger, F.; Kränkel, T.; Gehlen, C. Additive manufacturing of steel-reinforced concrete by combination of Selective Paste Intrusion and Wire Arc Additive Manufacturing: Impact of heat generated by WAAM on bond behavior of the reinforcement. Materials 2025, 18, 5455. [Google Scholar] [CrossRef] [PubMed]
- Khan, M.S.; Prasad, J.; Abbas, H. Bond strength of RC beams subjected to cyclic thermal loading. Constr. Build. Mater. 2013, 38, 644–657. [Google Scholar] [CrossRef]
- Lee, J.; Sheesley, E.; Jing, Y.; Xi, Y.; Willam, K. The effect of heating and cooling on the bond strength between concrete and steel reinforcement bars with and without epoxy coating. Constr. Build. Mater. 2018, 177, 230–236. [Google Scholar] [CrossRef]
- Li, Q.; Liu, L.; Yuan, G. Improvement of bond behaviour between steel bar and concrete subjected to elevated temperature at early age. Mag. Concr. Res. 2018, 70, 885–893. [Google Scholar] [CrossRef]
- DIN Deutsches Institut für Normung e.V. DIN 488-1:2009-08; Betonstahl — Teil 1: Stahlsorten, Eigenschaften, Kennzeichnung. 2009.
- RILEM/CEB/FIP. RC6: Bond test for reinforcement steel. 2. Pull-out test. RILEM Recommendation, E&FN Spon, London, 1983. In Draft published in Materials and Structures; 1st edition 1978, 2nd edition May 1983; 1973; Vol. 6, No. 32.
- Corres, E.; Muttoni, A. Bond of steel reinforcement based on detailed measurements: Results and interpretations. Struct. Concr. 2023, 24, 7173–7193. [Google Scholar] [CrossRef]
- Burdziński, M.; Niedostatkiewicz, M. Experimental-numerical analysis of the effect of bar diameter on bond in pull-out test. Buildings 2022, 12, 1392. [Google Scholar] [CrossRef]
- Yin, K.F.; Han, Y.; Liu, Y. Experimental research on bond strength between rebar and concrete after high temperature. Appl. Mech. Mater. 2011, 71-78, 1057–1061. [Google Scholar] [CrossRef]
- Ahmad, M.S.; Bhargava, P. Bond slip study between concrete and steel interface using splice beam specimen exposed to elevated temperatures. Structures 2020, 27, 1752–1762. [Google Scholar] [CrossRef]
- Andrade, M.S.; Ribeiro, J.C.L.; de Oliveira, D.S.; Pedroti, L.G.; Santos, C.F.R. Experimental evaluation of concrete-reinforcement bond: Bond failure mechanisms after exposure to elevated temperatures. Eng. Struct. 2024, 311, 118148. [Google Scholar] [CrossRef]
- Liu, S.; Zheng, W.; Hou, X.; Su, Z.; Li, S. Experimental and numerical study on the reinforcement-concrete bond properties at sustained sub-high temperatures. Eng. Struct. 2025, 341, 120825. [Google Scholar] [CrossRef]
- Singh, S.; Jinoop, A.N.; Tarun Kumar, G.T.A.; Palani, I.A.; Paul, C.P.; Prashanth, K.G. Effect of interlayer delay on the microstructure and mechanical properties of wire arc additive manufactured wall structures. Materials 2021, 14, 4187. [Google Scholar] [CrossRef] [PubMed]
- Reisgen, U.; Sharma, R.; Mann, S.; Oster, L. Increasing the manufacturing efficiency of WAAM by advanced cooling strategies. Weld. World 2020, 64, 1409–1416. [Google Scholar] [CrossRef]
- Wu, B.; Pan, Z.; Ding, D.; Cuiuri, D.; Li, H.; Fei, Z. The effects of forced interpass cooling on the material properties of wire arc additively manufactured Ti6Al4V alloy. J. Mater. Process. Technol. 2018, 258, 97–105. [Google Scholar] [CrossRef]
- Brätz, O.; Henkel, K.M. Investigations on the microstructure of drawn arc stud welds on structural steels by quantitative metallography. Weld. World 2023, 67, 195–208. [Google Scholar] [CrossRef]
- Klett, J.; Hassel, T. Influence of Stick Electrode Coating’s Moisture Content on the Diffusible Hydrogen in Underwater Wet Shielded Metal Arc Welding. Adv. Mater. Sci. 2020, 20, 27–37. [Google Scholar] [CrossRef]
- Ohashi, R.; Fujimoto, M.; Mironov, S.; Sato, Y.S.; Kokawa, H. Effect of contamination on microstructure in friction stir spot welded DP590 steel. Sci. Technol. Weld. Join. 2009, 14, 221–227. [Google Scholar] [CrossRef]
Figure 1.
Schematic representation of the combined SPI and WAAM process (renderings), modified after [3]. (a) printing a rebar, (b) spreading an aggregate layer, (c) cement paste application, (d) curing of the finished reinforced concrete element, (e) excavated component.
Figure 1.
Schematic representation of the combined SPI and WAAM process (renderings), modified after [3]. (a) printing a rebar, (b) spreading an aggregate layer, (c) cement paste application, (d) curing of the finished reinforced concrete element, (e) excavated component.
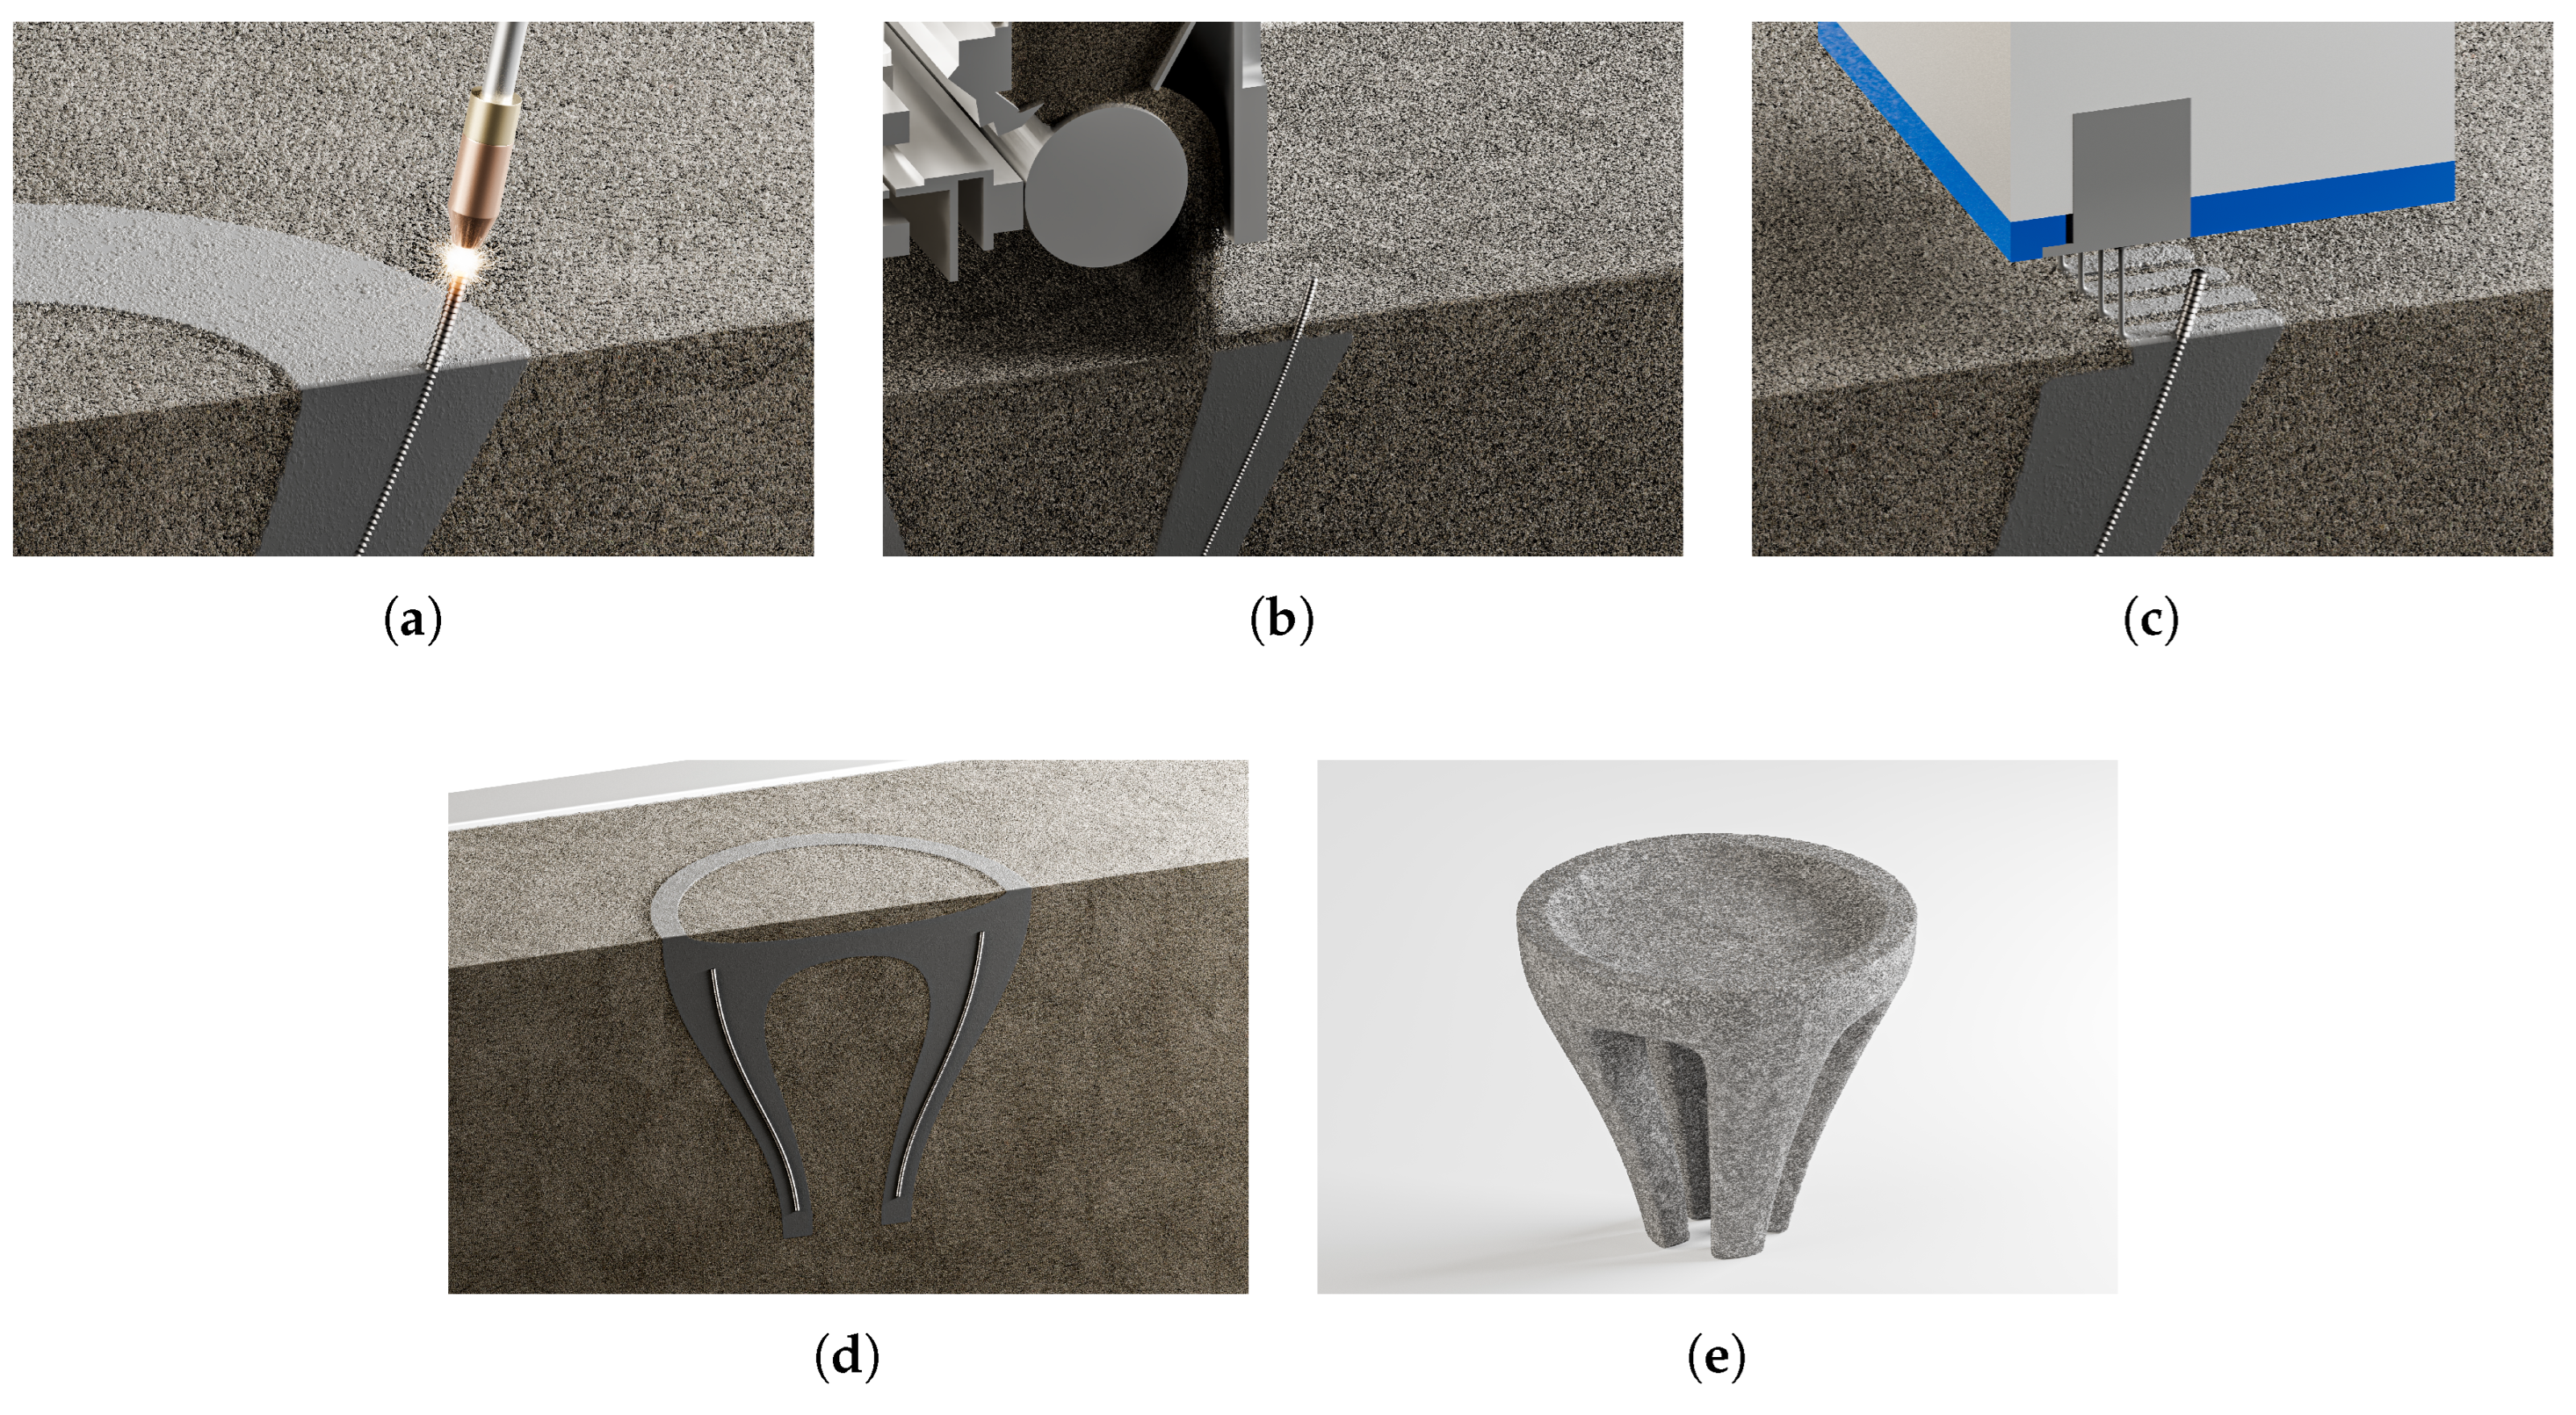
Figure 2.
Specimen geometry and holder assembly. (a) Segment sequence and specimen geometry (to scale). The initial segment protrudes 10 above the bed surface, and six further 10 segments and a final 20 segment are joined sequentially during printing. The bond length of 80 contains seven segment joints, and 10 of the final segment remain free for the displacement transducer. (b) Holder assembly with reinforcement segments on two steel rails. Numbered components: (1) steel rails, (2) reinforcement segments, (3) transverse struts for stability, (4) co-printed round ground bar (diameter 28) serving as the ground connection for the welding process.
Figure 2.
Specimen geometry and holder assembly. (a) Segment sequence and specimen geometry (to scale). The initial segment protrudes 10 above the bed surface, and six further 10 segments and a final 20 segment are joined sequentially during printing. The bond length of 80 contains seven segment joints, and 10 of the final segment remain free for the displacement transducer. (b) Holder assembly with reinforcement segments on two steel rails. Numbered components: (1) steel rails, (2) reinforcement segments, (3) transverse struts for stability, (4) co-printed round ground bar (diameter 28) serving as the ground connection for the welding process.
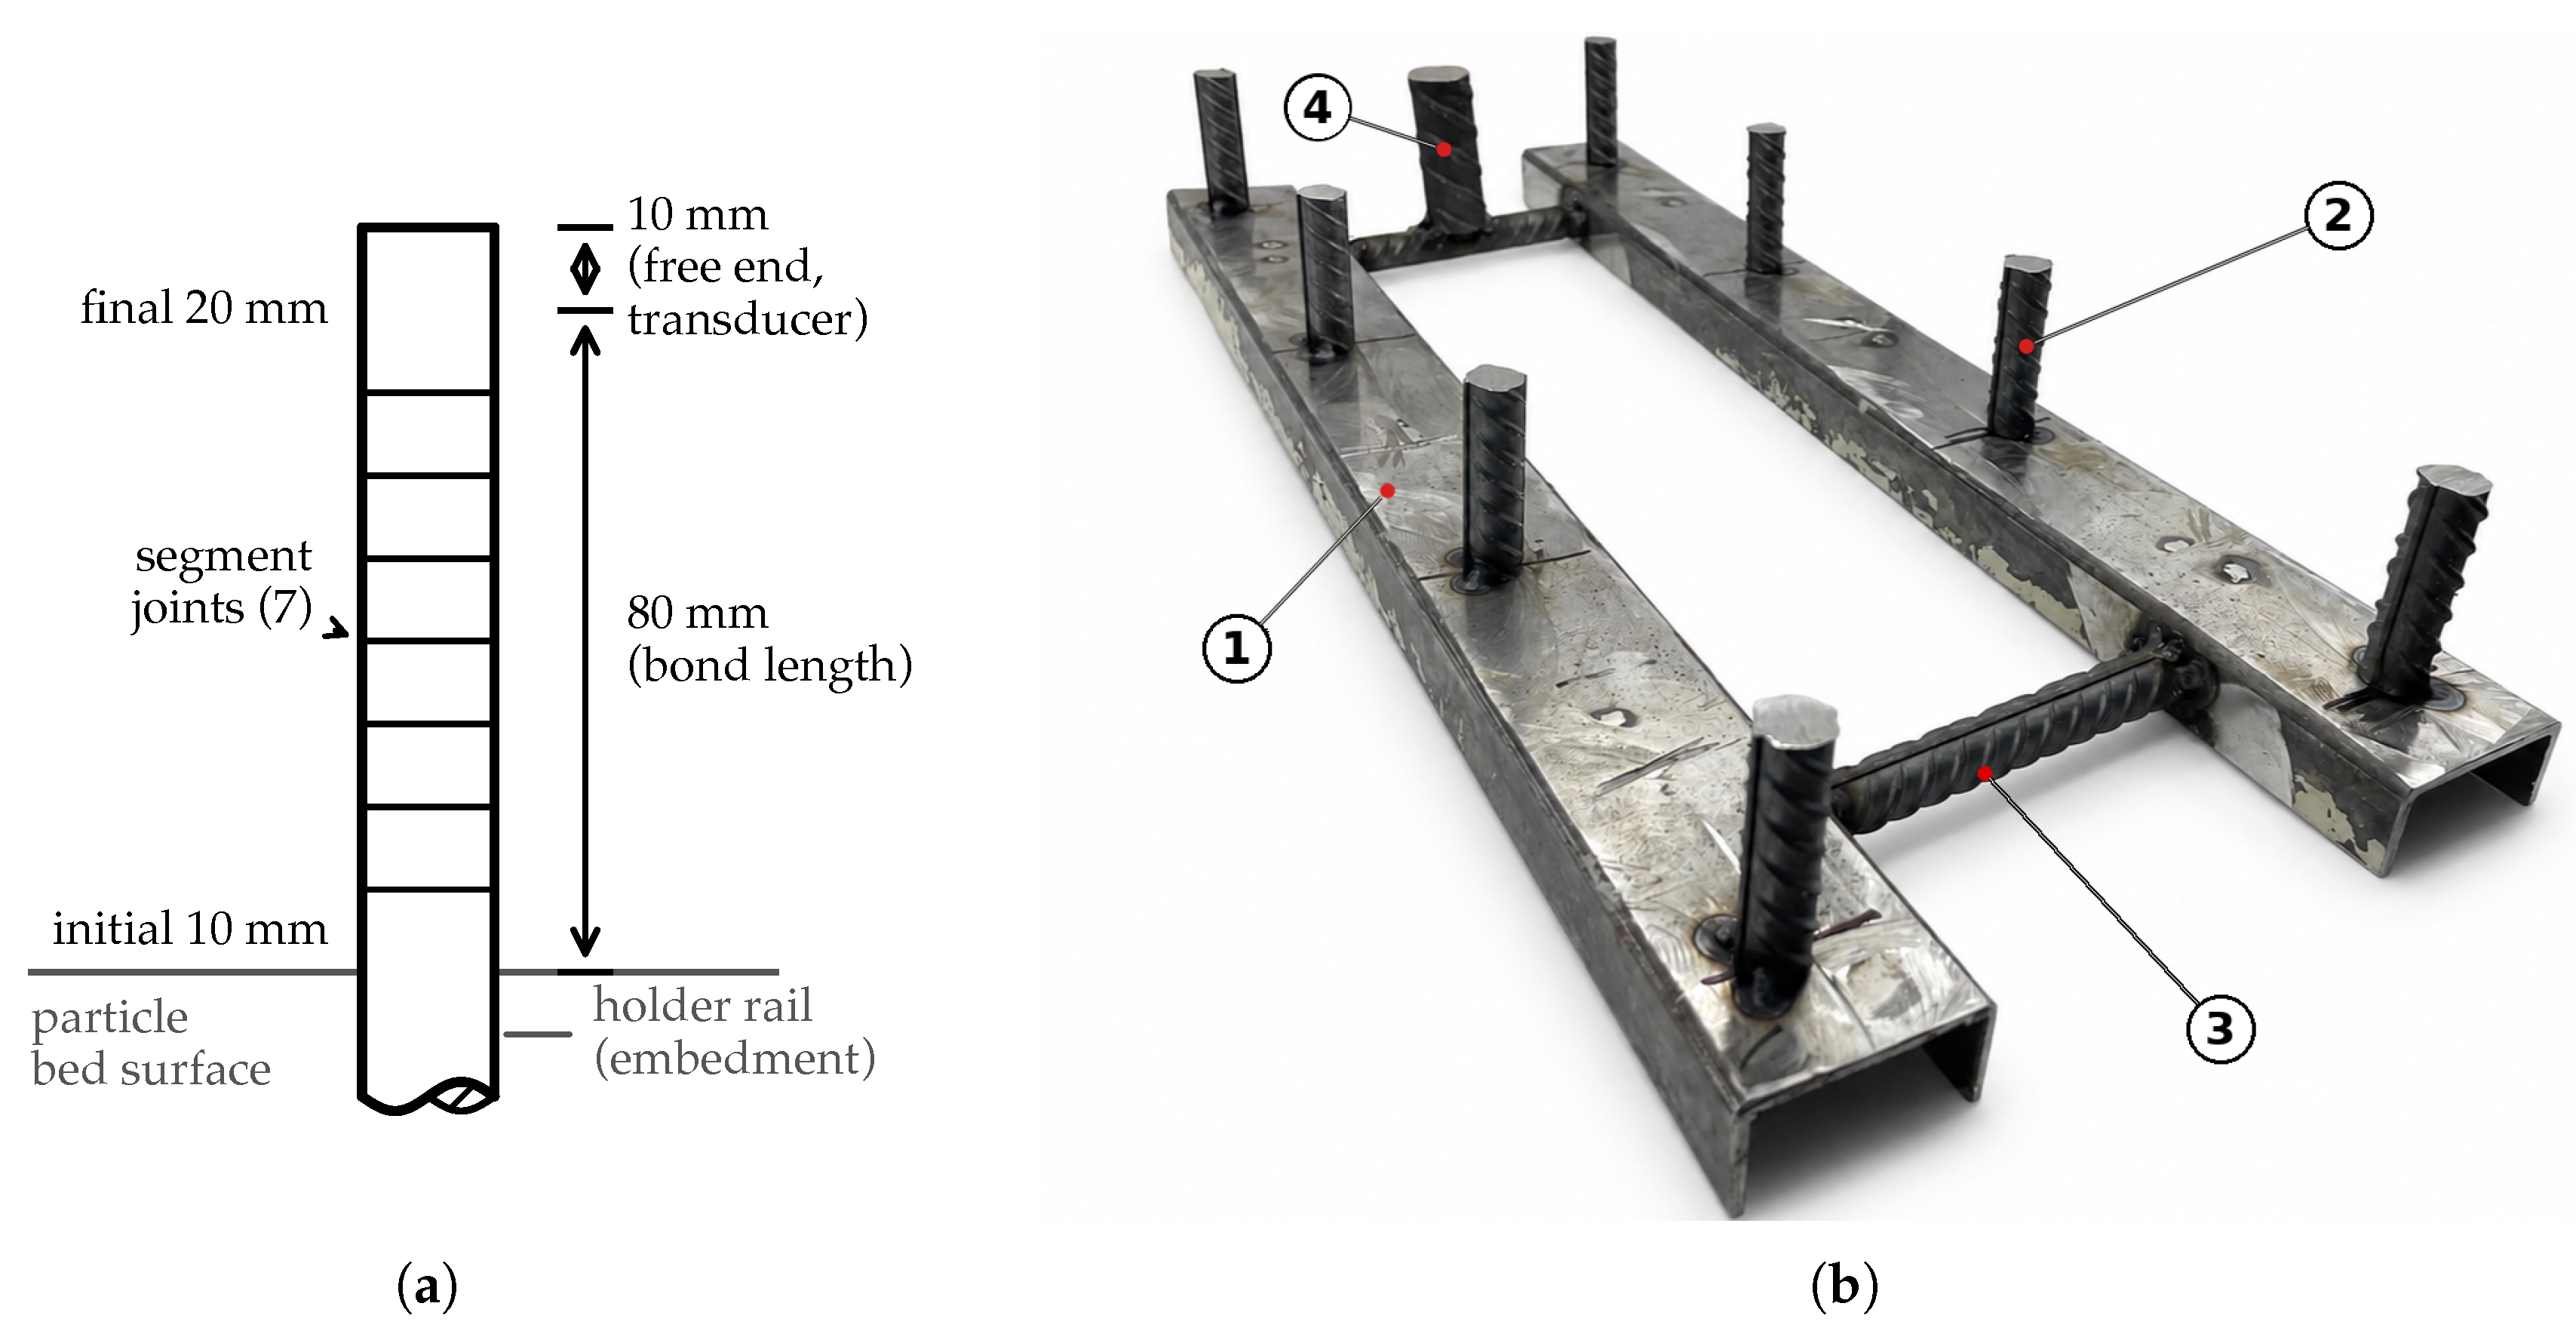
Figure 3.
Specimen fabrication. (a) Holder assembly placed in the particle bed before printing, with the initial 10 segments protruding above the bed surface. (b) Top view after printing, showing the two printed strips along the adhesively bonded (left) and welded (right) rails.
Figure 3.
Specimen fabrication. (a) Holder assembly placed in the particle bed before printing, with the initial 10 segments protruding above the bed surface. (b) Top view after printing, showing the two printed strips along the adhesively bonded (left) and welded (right) rails.
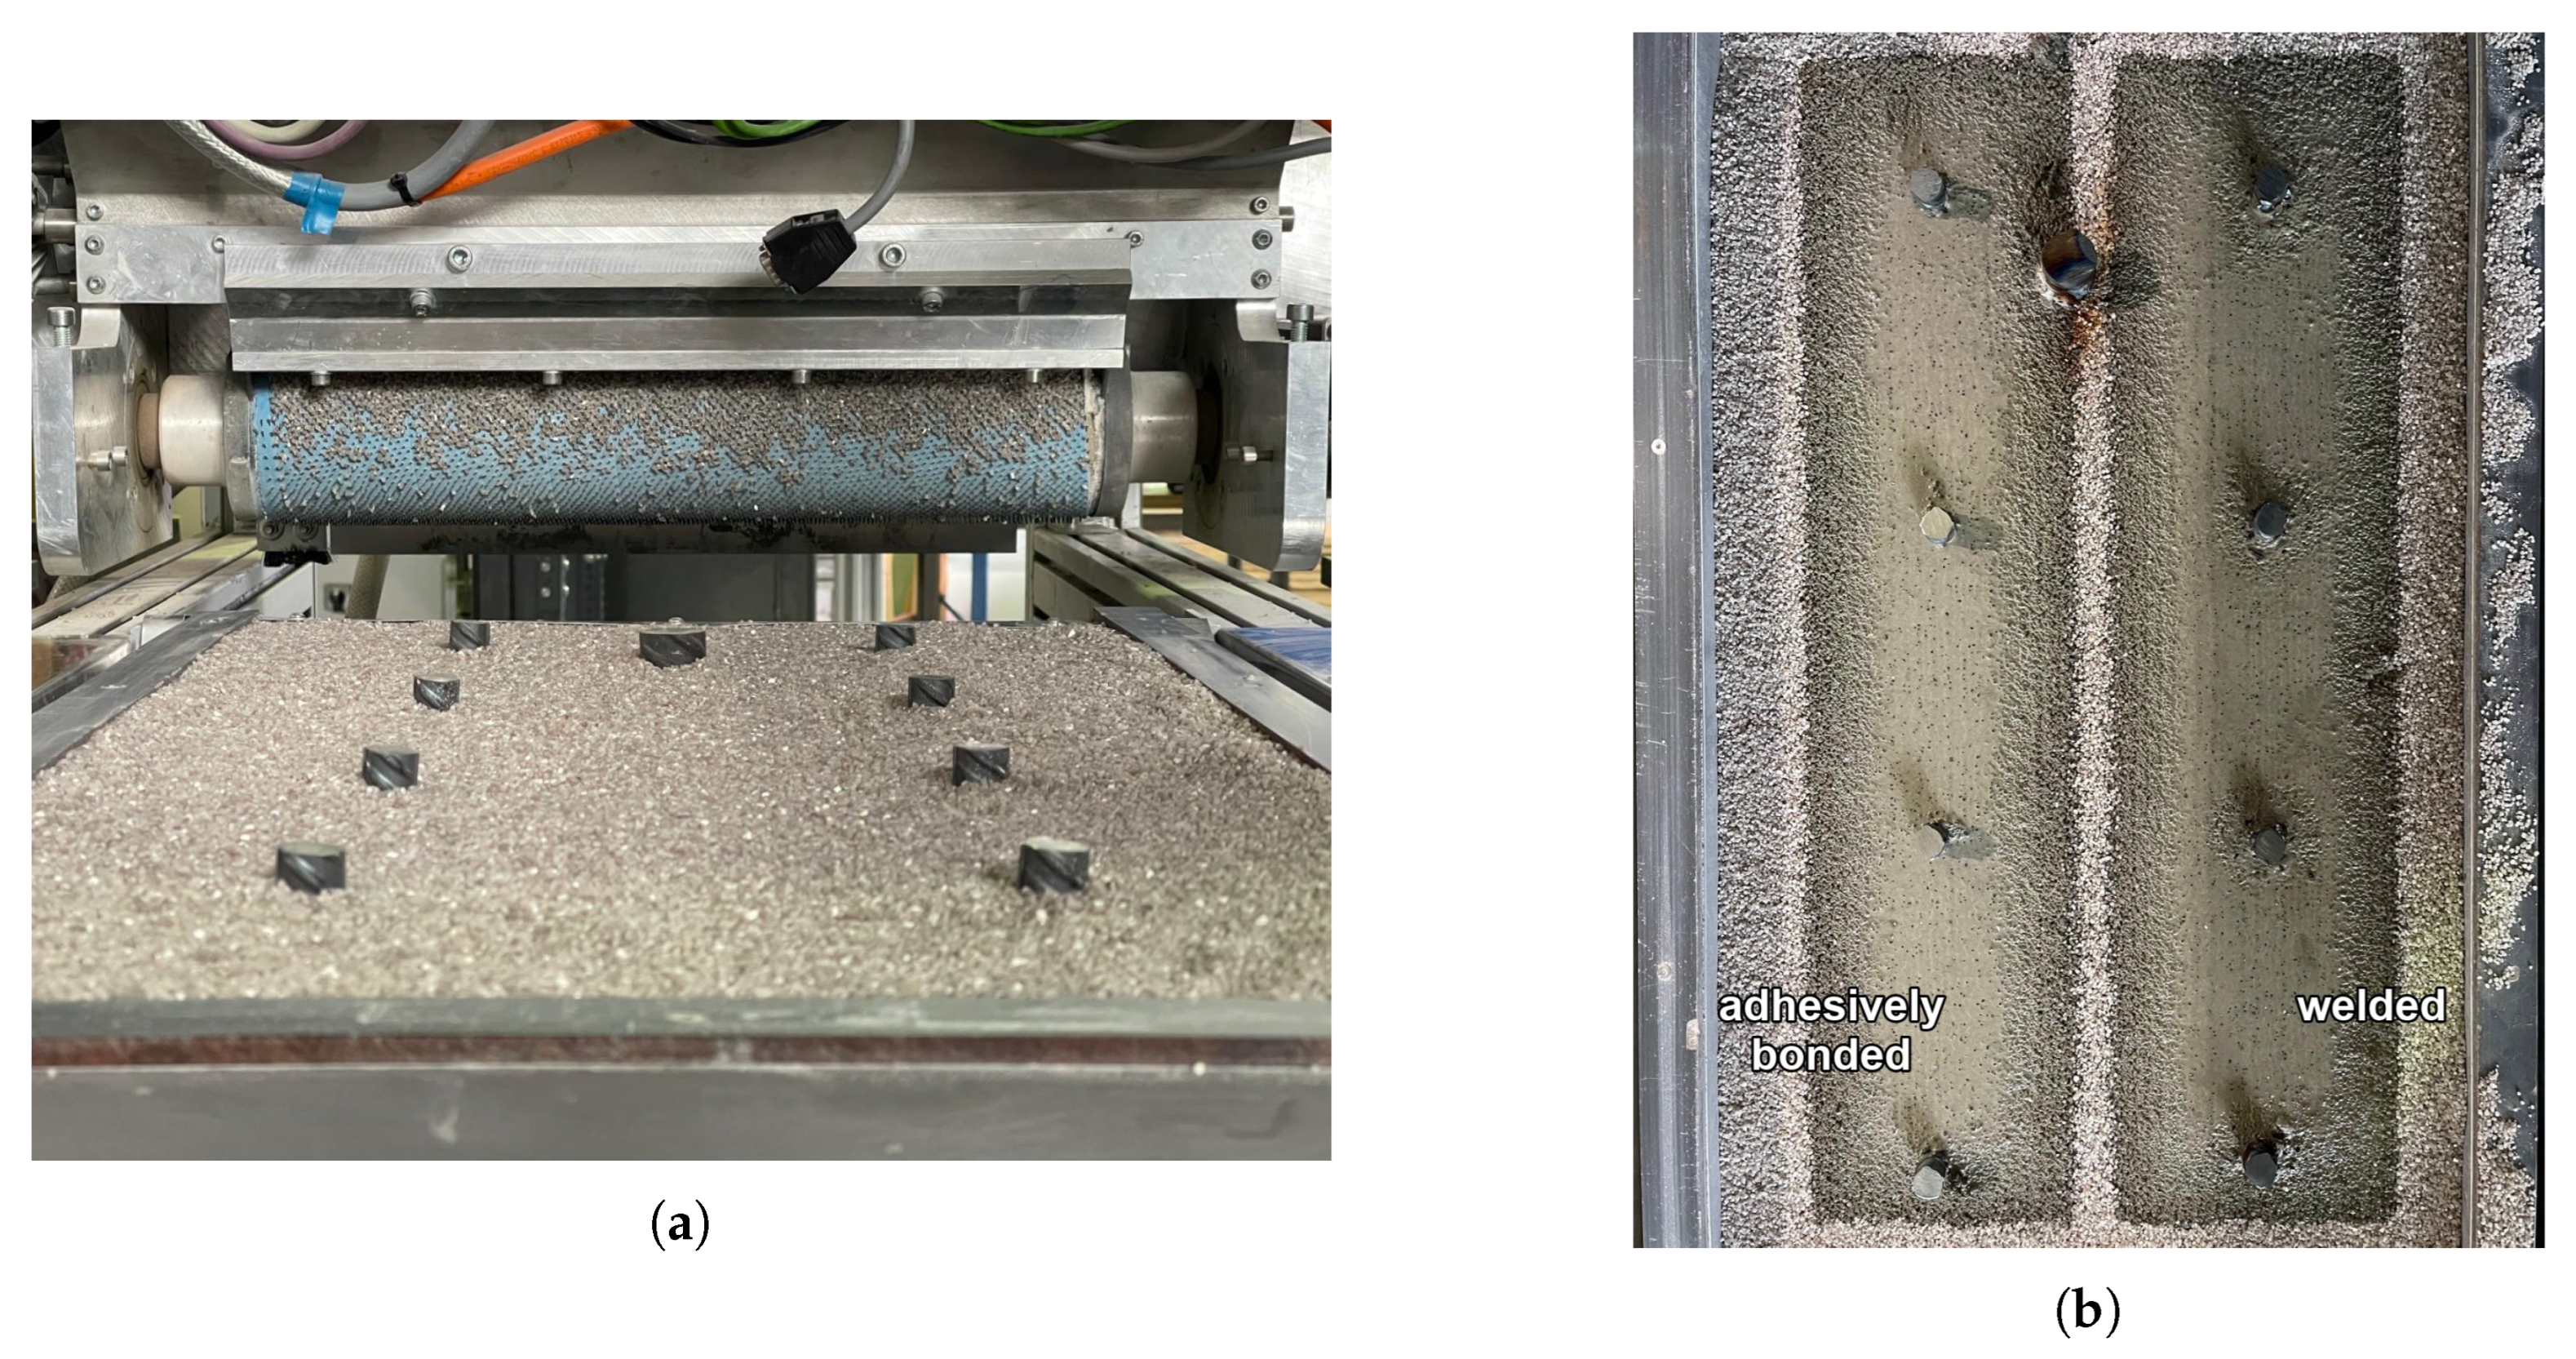
Figure 4.
Push-through test configuration, as in the companion study [21]. (a) Specimen placed on the spherical seat in the testing machine, with the reinforcement bar protruding upward for load application. (b) Specimen with the polymer holder clamped to the steel confinement ring, providing the mounting for the linear displacement transducer at the free bar end.
Figure 4.
Push-through test configuration, as in the companion study [21]. (a) Specimen placed on the spherical seat in the testing machine, with the reinforcement bar protruding upward for load application. (b) Specimen with the polymer holder clamped to the steel confinement ring, providing the mounting for the linear displacement transducer at the free bar end.
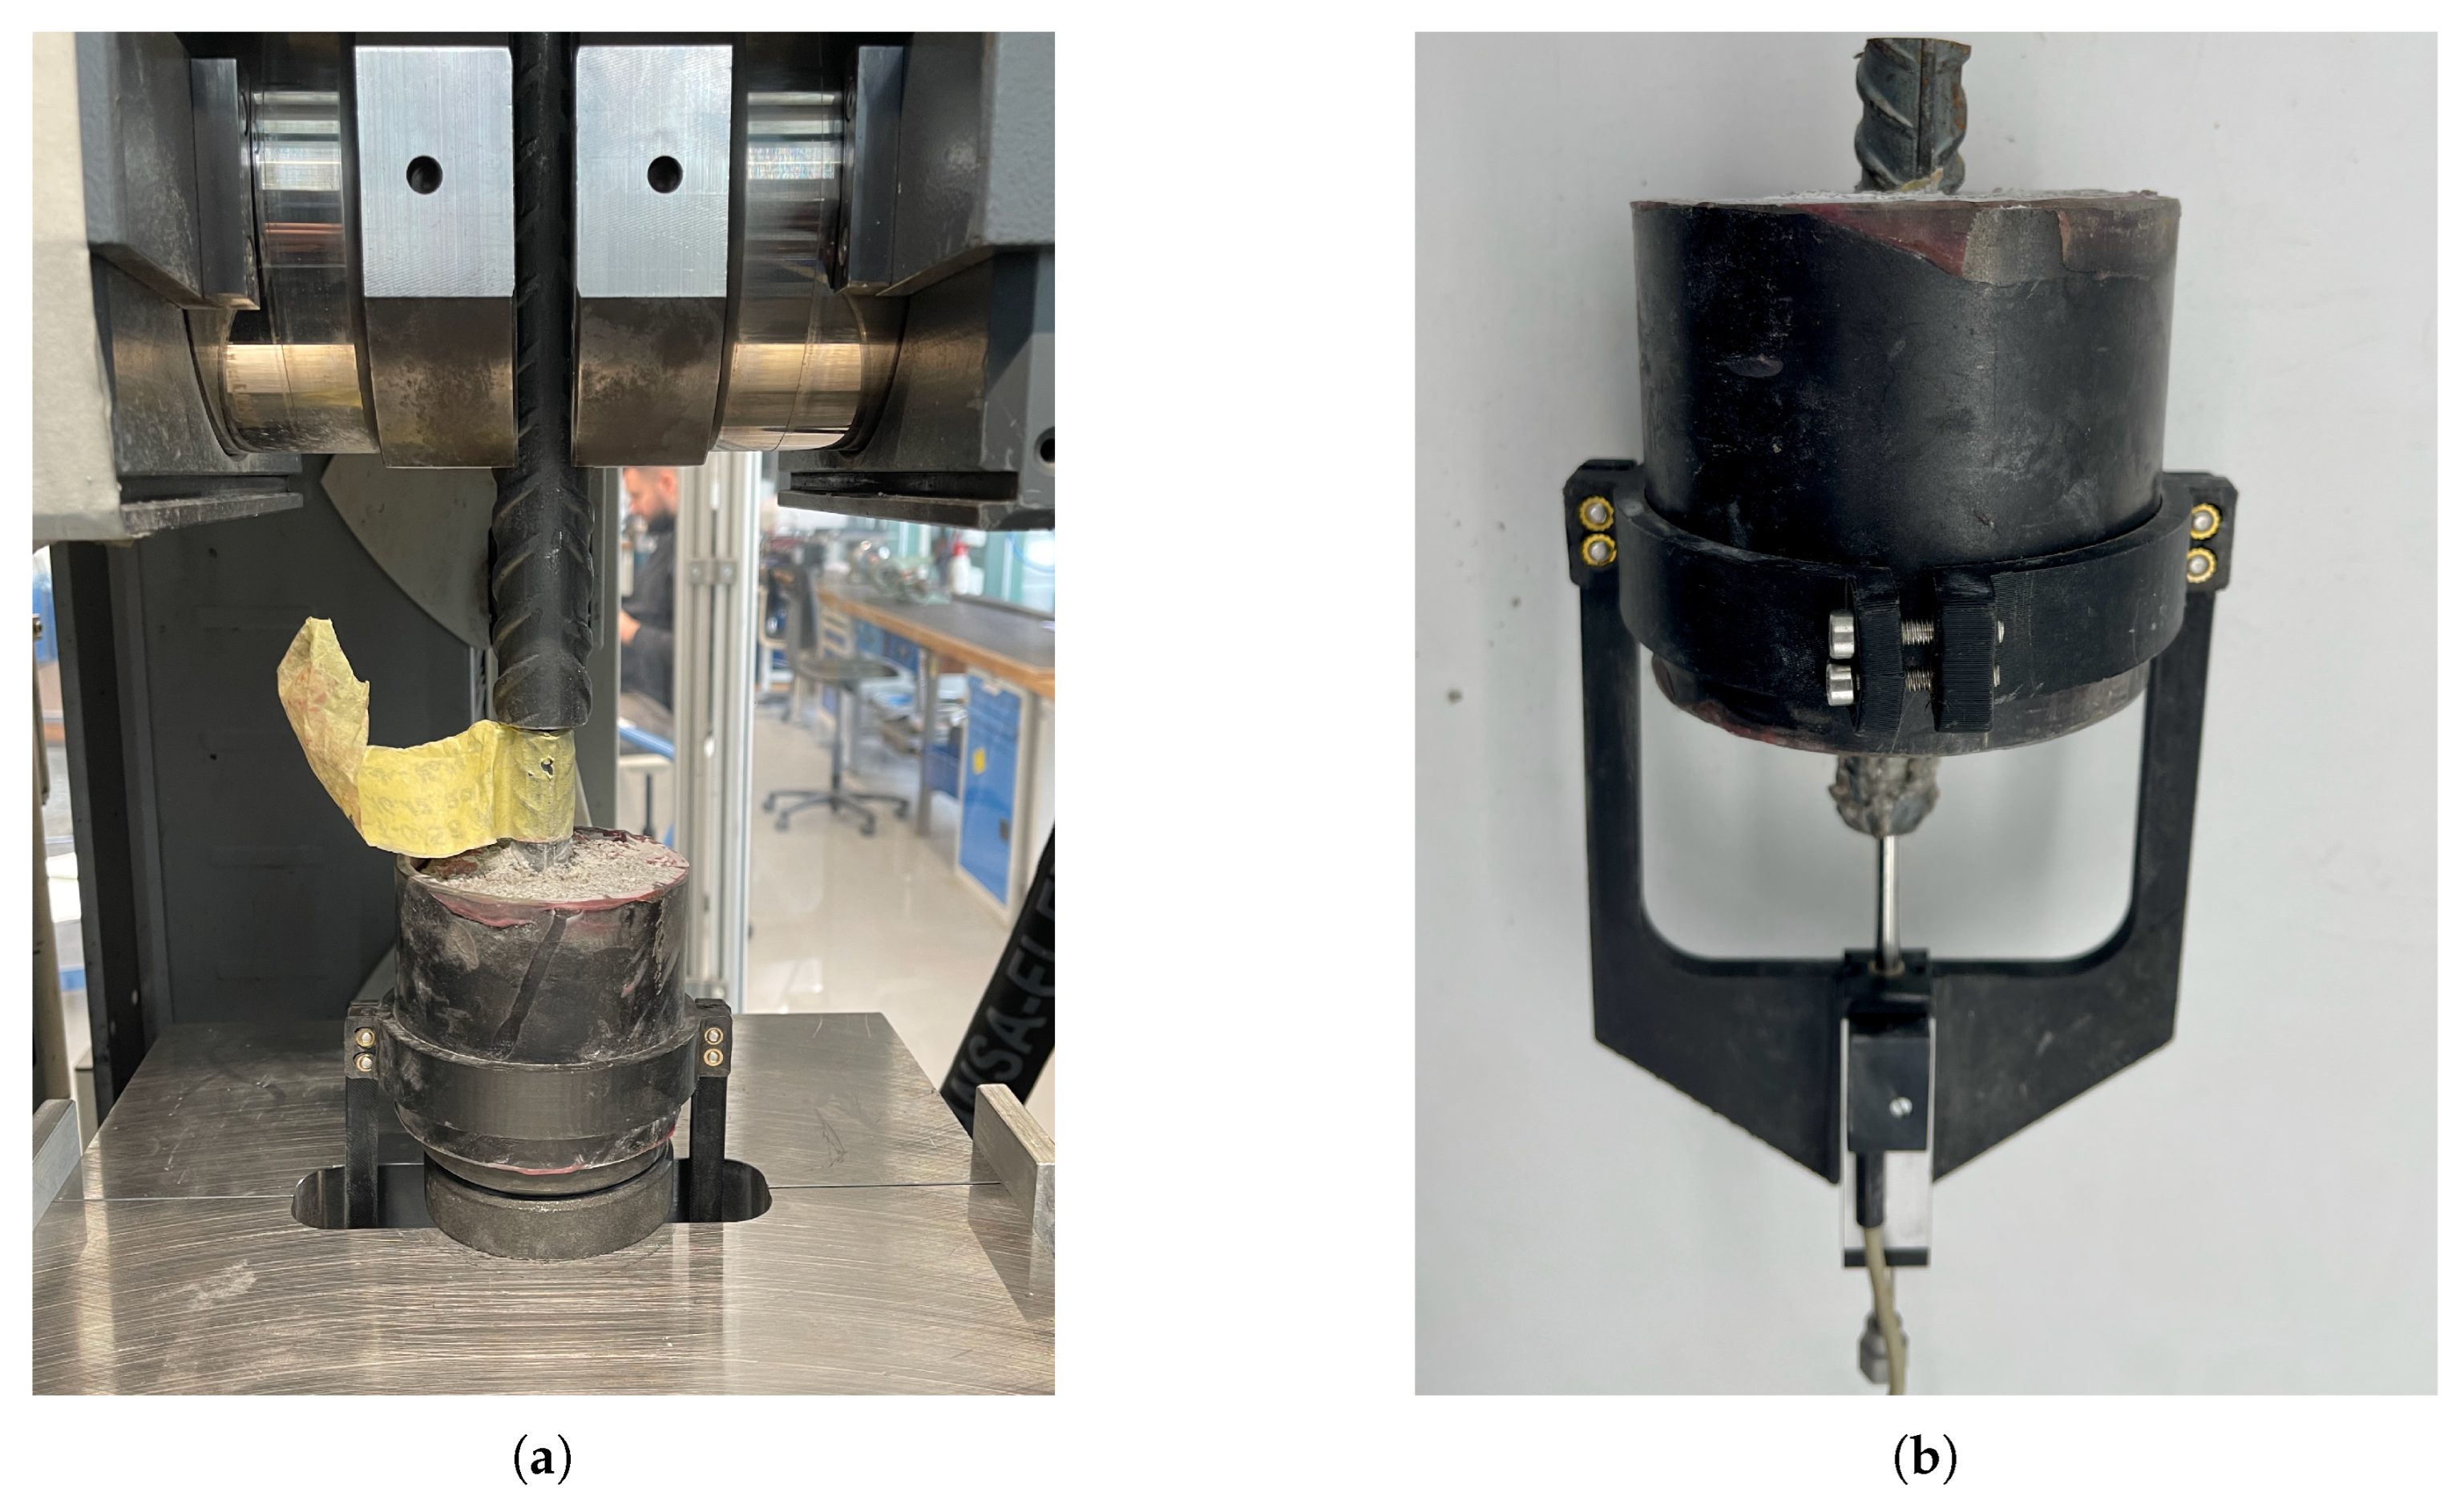
Figure 5.
Exemplary infrared frame with the evaluation regions overlaid. The annular ROI (white rings) surrounding each of the three evaluated bars (P02, P03, P04) defines . The rectangular reference area (dashed outline) in a bar-free region of the same frame defines .
Figure 5.
Exemplary infrared frame with the evaluation regions overlaid. The annular ROI (white rings) surrounding each of the three evaluated bars (P02, P03, P04) defines . The rectangular reference area (dashed outline) in a bar-free region of the same frame defines .
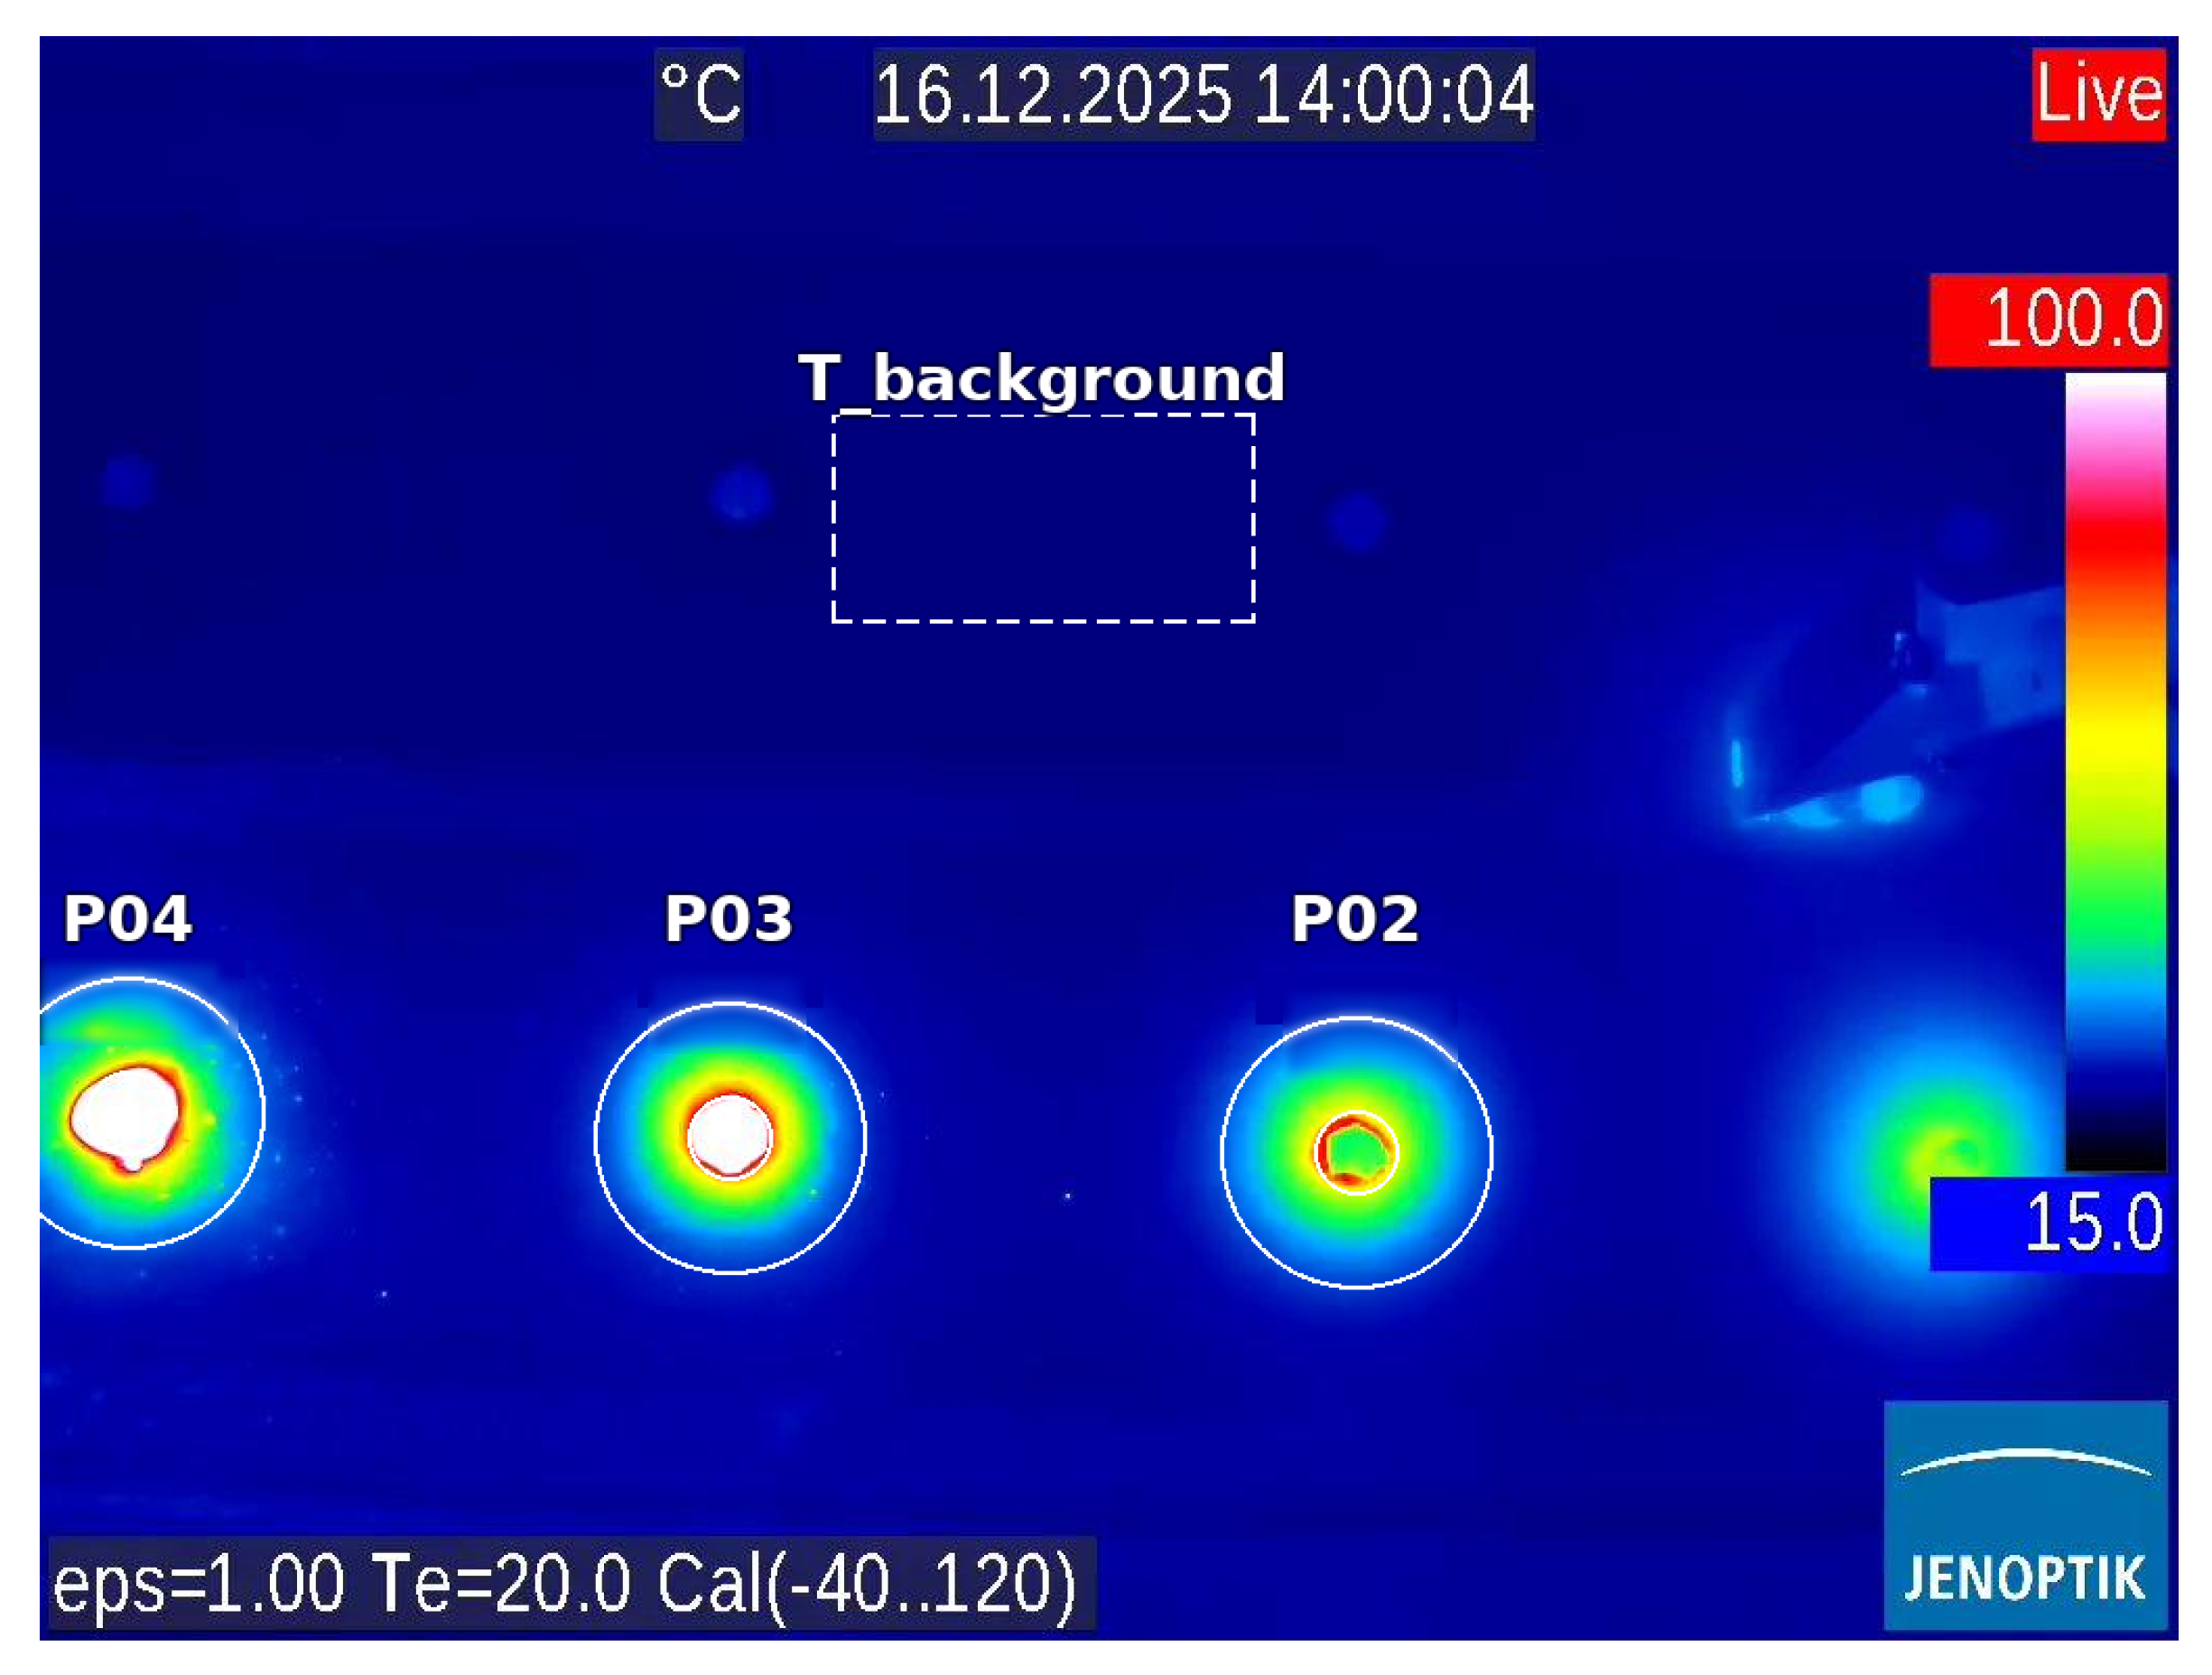
Figure 6.
Individual bond-stress–displacement curves (continuously measured) for the adhesively bonded (left) and welded (centre) specimens, with mean comparison (right). The fourth axis tick, labelled , marks the maximum-bond-stress level. The mean displacements at maximum bond stress are (adhesively bonded) and (welded). The mean curves are truncated at the largest displacement reached by all specimens.
Figure 6.
Individual bond-stress–displacement curves (continuously measured) for the adhesively bonded (left) and welded (centre) specimens, with mean comparison (right). The fourth axis tick, labelled , marks the maximum-bond-stress level. The mean displacements at maximum bond stress are (adhesively bonded) and (welded). The mean curves are truncated at the largest displacement reached by all specimens.
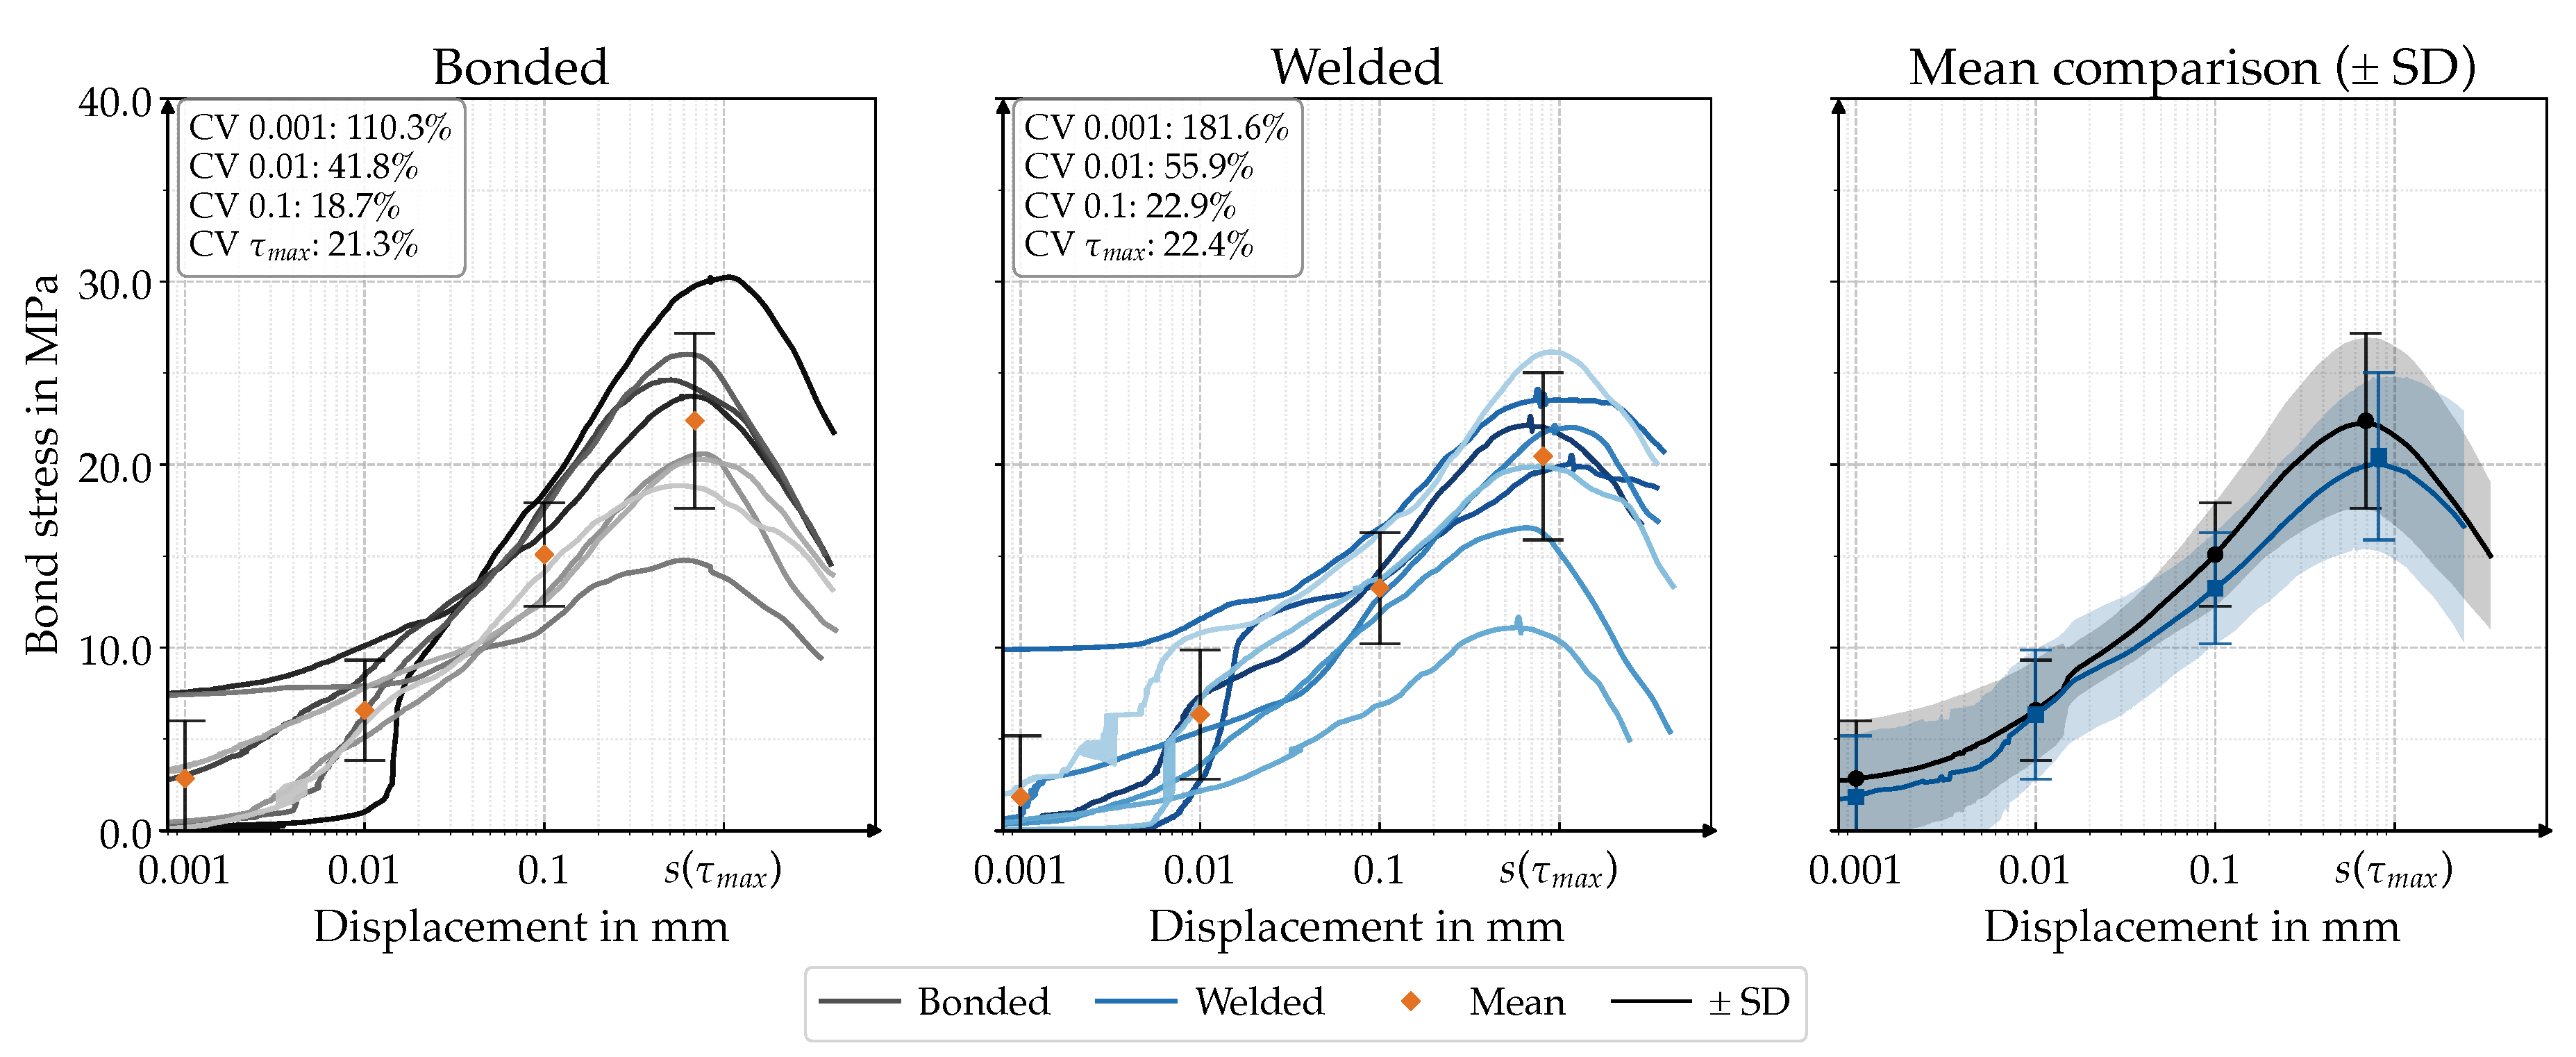
Figure 7.
Box plots of the discrete bond stress values at , , , and at ( per group). Open circles mark outliers beyond 1.5 times the interquartile range.
Figure 7.
Box plots of the discrete bond stress values at , , , and at ( per group). Open circles mark outliers beyond 1.5 times the interquartile range.
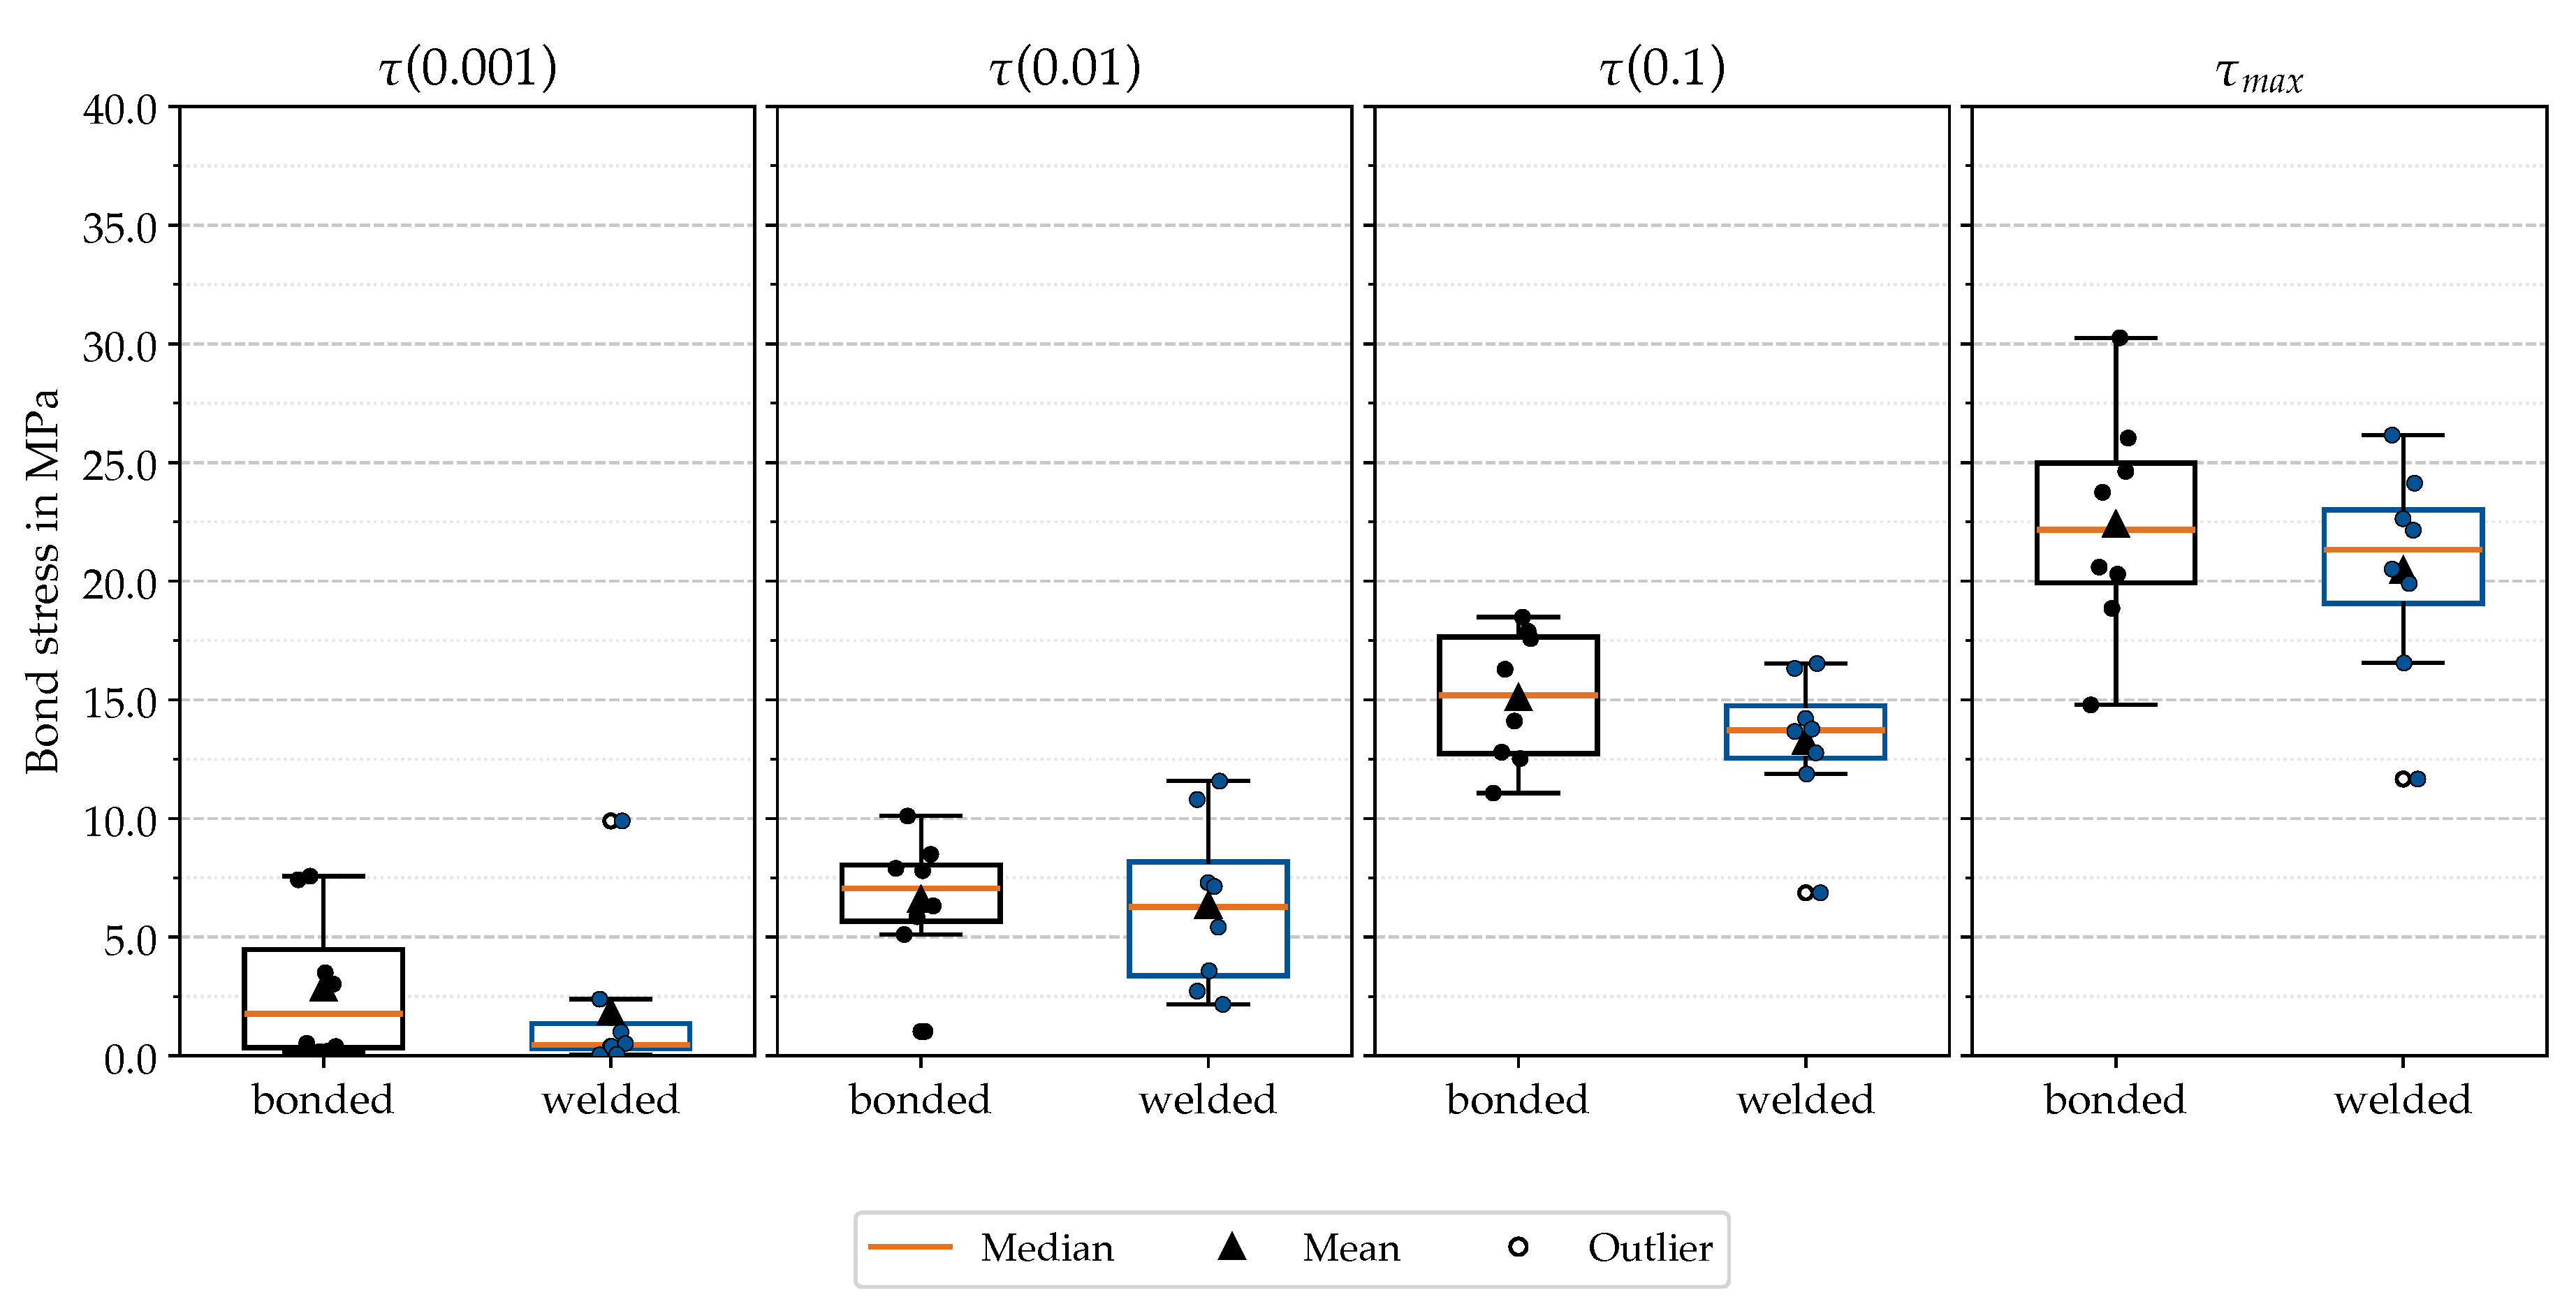
Figure 8.
Close-up of a segment joint during fabrication, taken directly after a welding cycle. The weld bead protrudes from the bar surface, forming a localised geometric discontinuity.
Figure 8.
Close-up of a segment joint during fabrication, taken directly after a welding cycle. The weld bead protrudes from the bar surface, forming a localised geometric discontinuity.
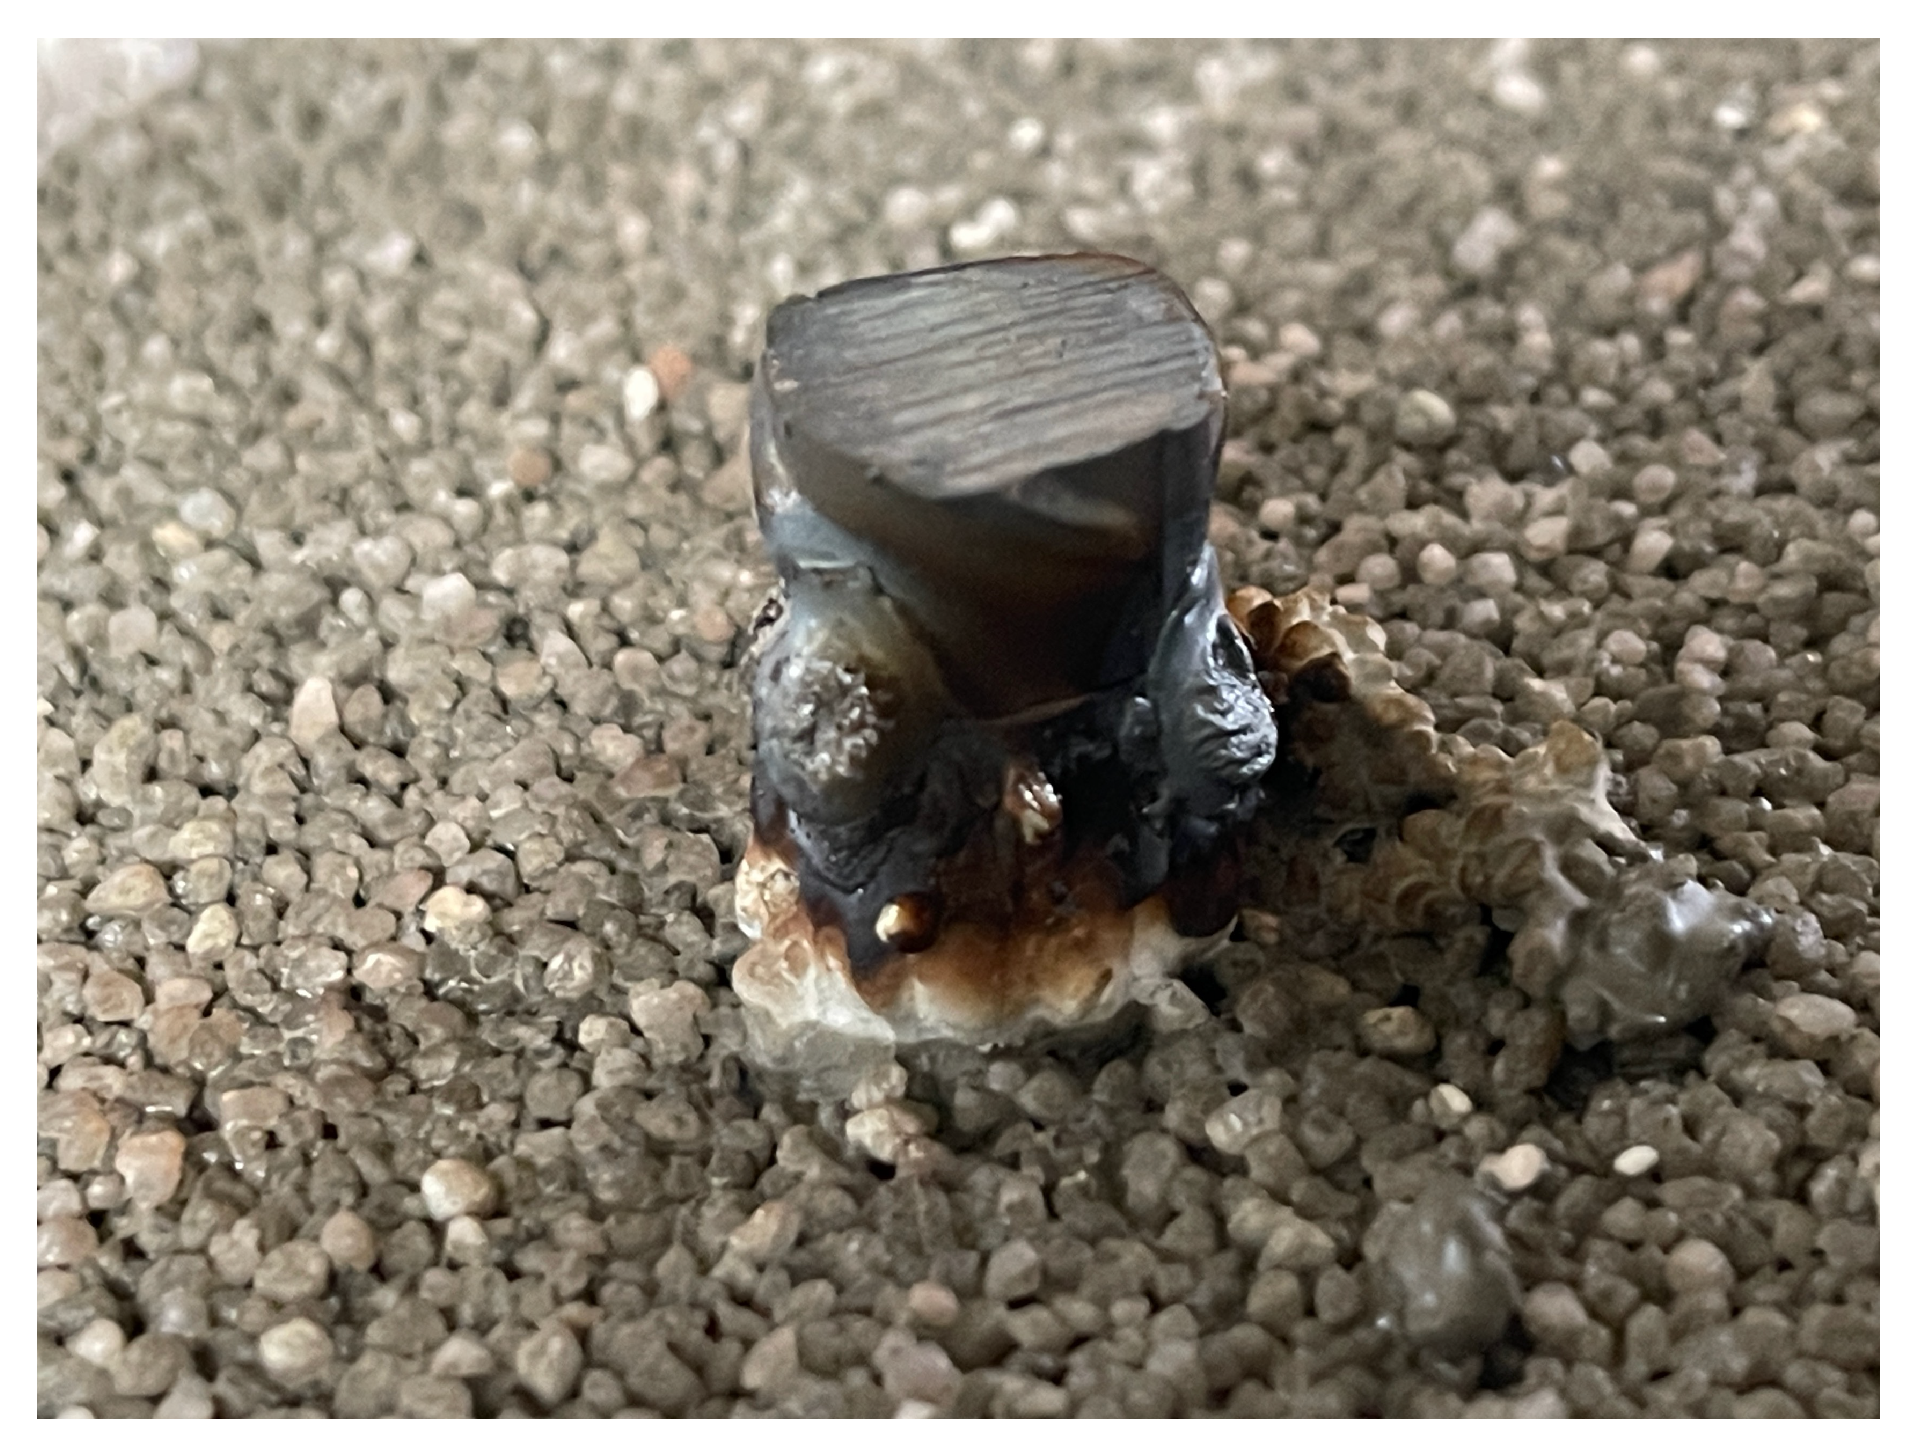
Figure 9.
Infrared images during specimen fabrication. Bar positions P01 to P04 are annotated in both frames. The co-printed ground bar is marked in b). (a) Immediately after welding of the fourth bar (P04), with thermal halos from the preceding welds visible at P01 to P03. Within each joining cycle, the bars of the rail are welded in direct succession, with about between consecutive bars (measured between the peaks of P02 to P04). (b) Cooling phase approximately later, showing all four bars with residual thermal halos at different stages of decay. The annotated hot region is the co-printed ground bar, which receives its own segment weld in every joining cycle and carries the welding current (Section 2.2). The infrared scale shows displayed temperatures. Actual steel-surface temperatures are higher (Section 2.5). The adhesively bonded rail (upper part of the image) shows no thermal signature.
Figure 9.
Infrared images during specimen fabrication. Bar positions P01 to P04 are annotated in both frames. The co-printed ground bar is marked in b). (a) Immediately after welding of the fourth bar (P04), with thermal halos from the preceding welds visible at P01 to P03. Within each joining cycle, the bars of the rail are welded in direct succession, with about between consecutive bars (measured between the peaks of P02 to P04). (b) Cooling phase approximately later, showing all four bars with residual thermal halos at different stages of decay. The annotated hot region is the co-printed ground bar, which receives its own segment weld in every joining cycle and carries the welding current (Section 2.2). The infrared scale shows displayed temperatures. Actual steel-surface temperatures are higher (Section 2.5). The adhesively bonded rail (upper part of the image) shows no thermal signature.
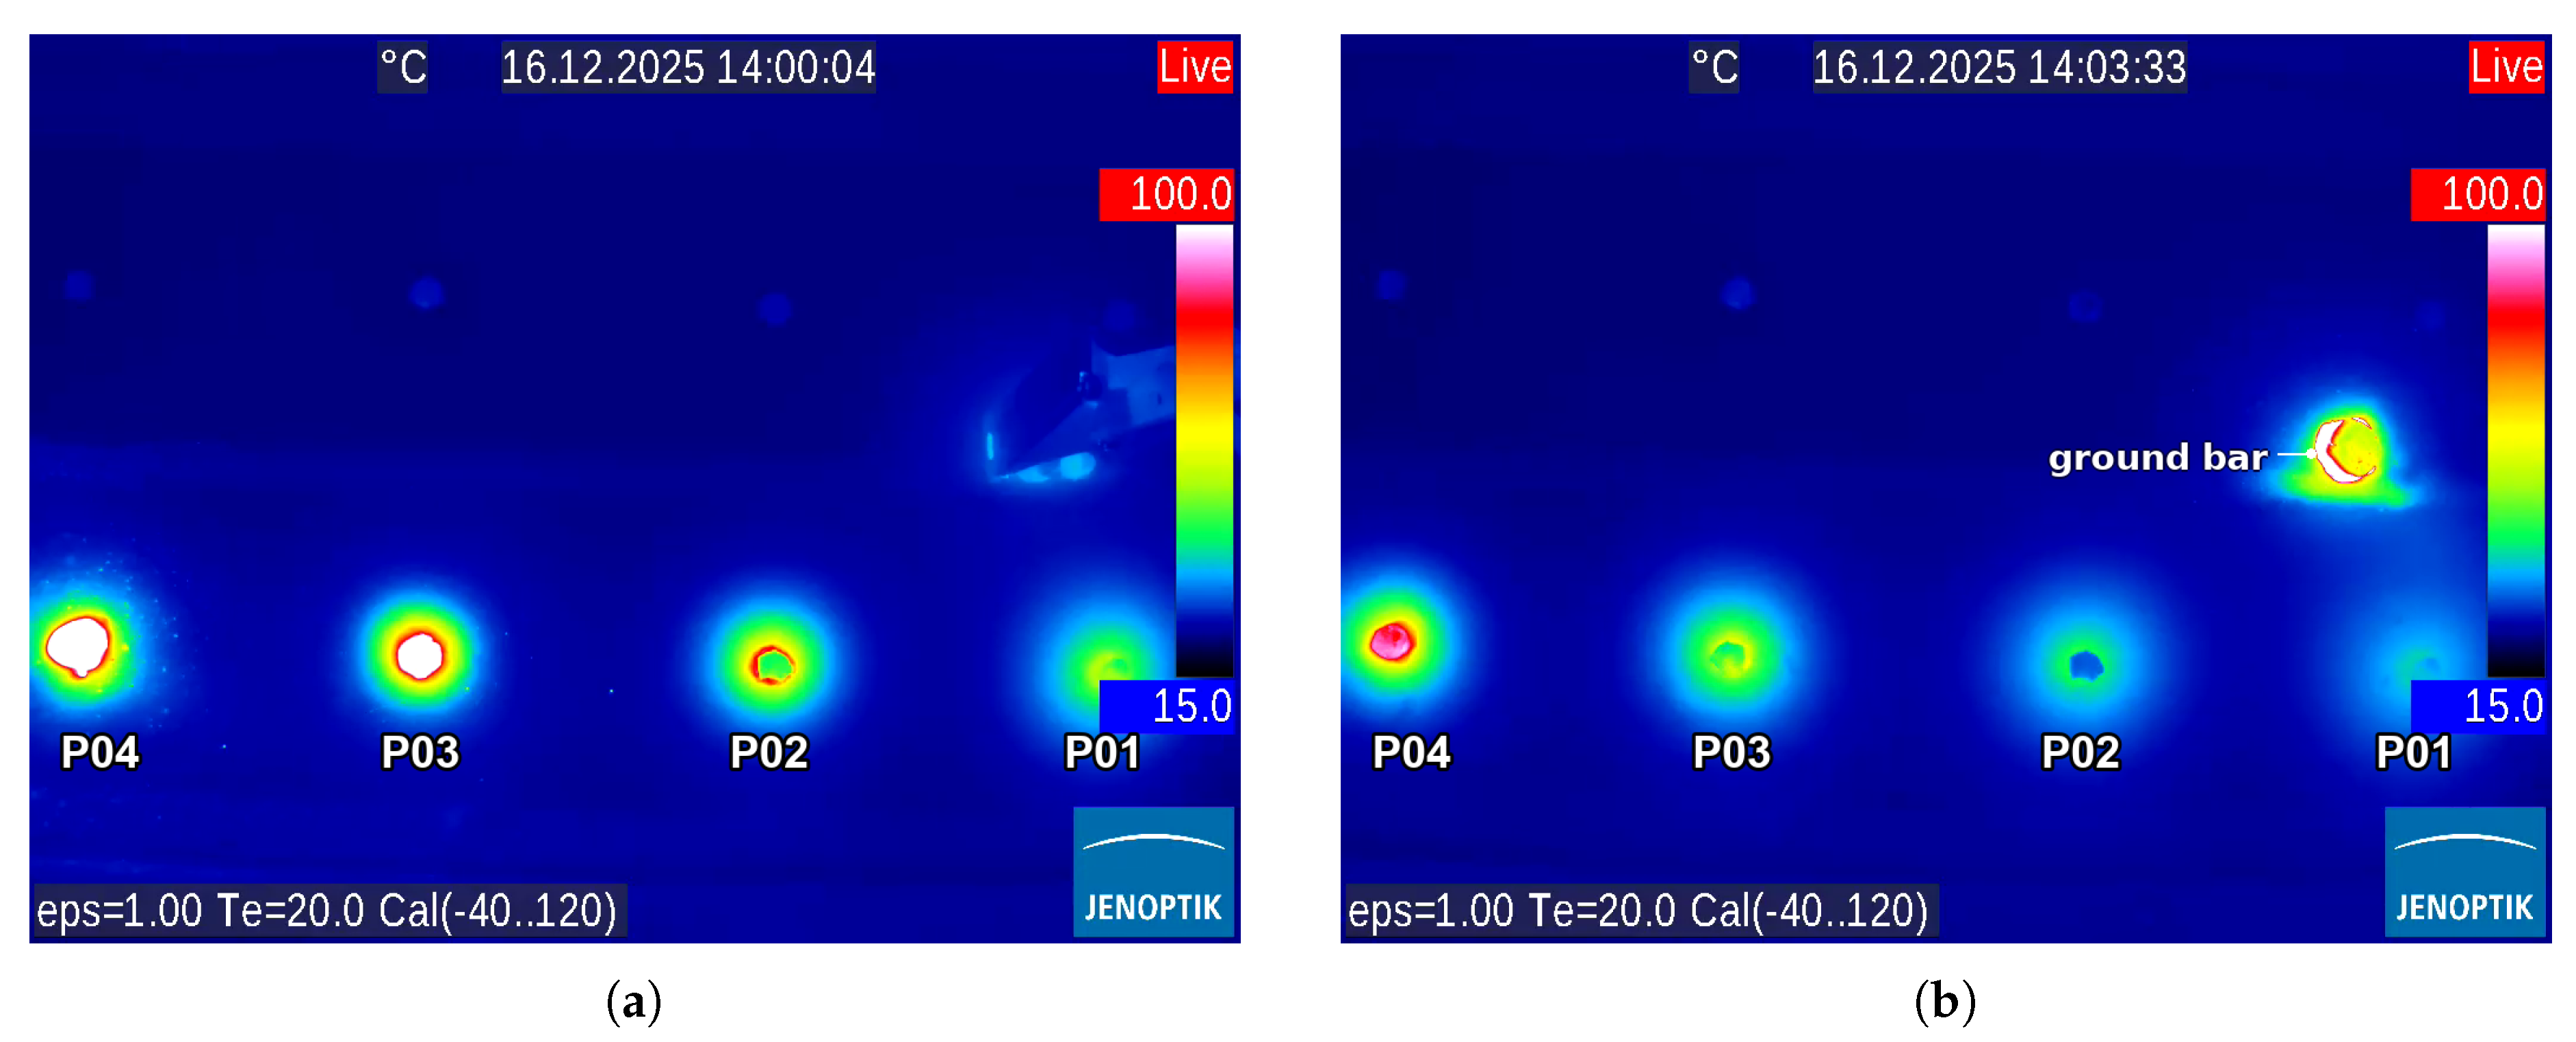
Figure 10.
Excess temperature in the particle bed surrounding the welded bars, for the three evaluated bars (P02, P03, P04), with the range between them shaded and the peak markers placed on their mean. Each panel shows one continuous recording. Each peak corresponds to one segment-joining cycle, in which one segment was welded onto each of the four bars and the ground bar. The adhesively bonded rail (not shown) exhibited throughout. The drop below zero at the very end of recording (a) (bars P03 and P04) is a background-correction artefact after the end of printing and lies outside the evaluation window.
Figure 10.
Excess temperature in the particle bed surrounding the welded bars, for the three evaluated bars (P02, P03, P04), with the range between them shaded and the peak markers placed on their mean. Each panel shows one continuous recording. Each peak corresponds to one segment-joining cycle, in which one segment was welded onto each of the four bars and the ground bar. The adhesively bonded rail (not shown) exhibited throughout. The drop below zero at the very end of recording (a) (bars P03 and P04) is a background-correction artefact after the end of printing and lies outside the evaluation window.
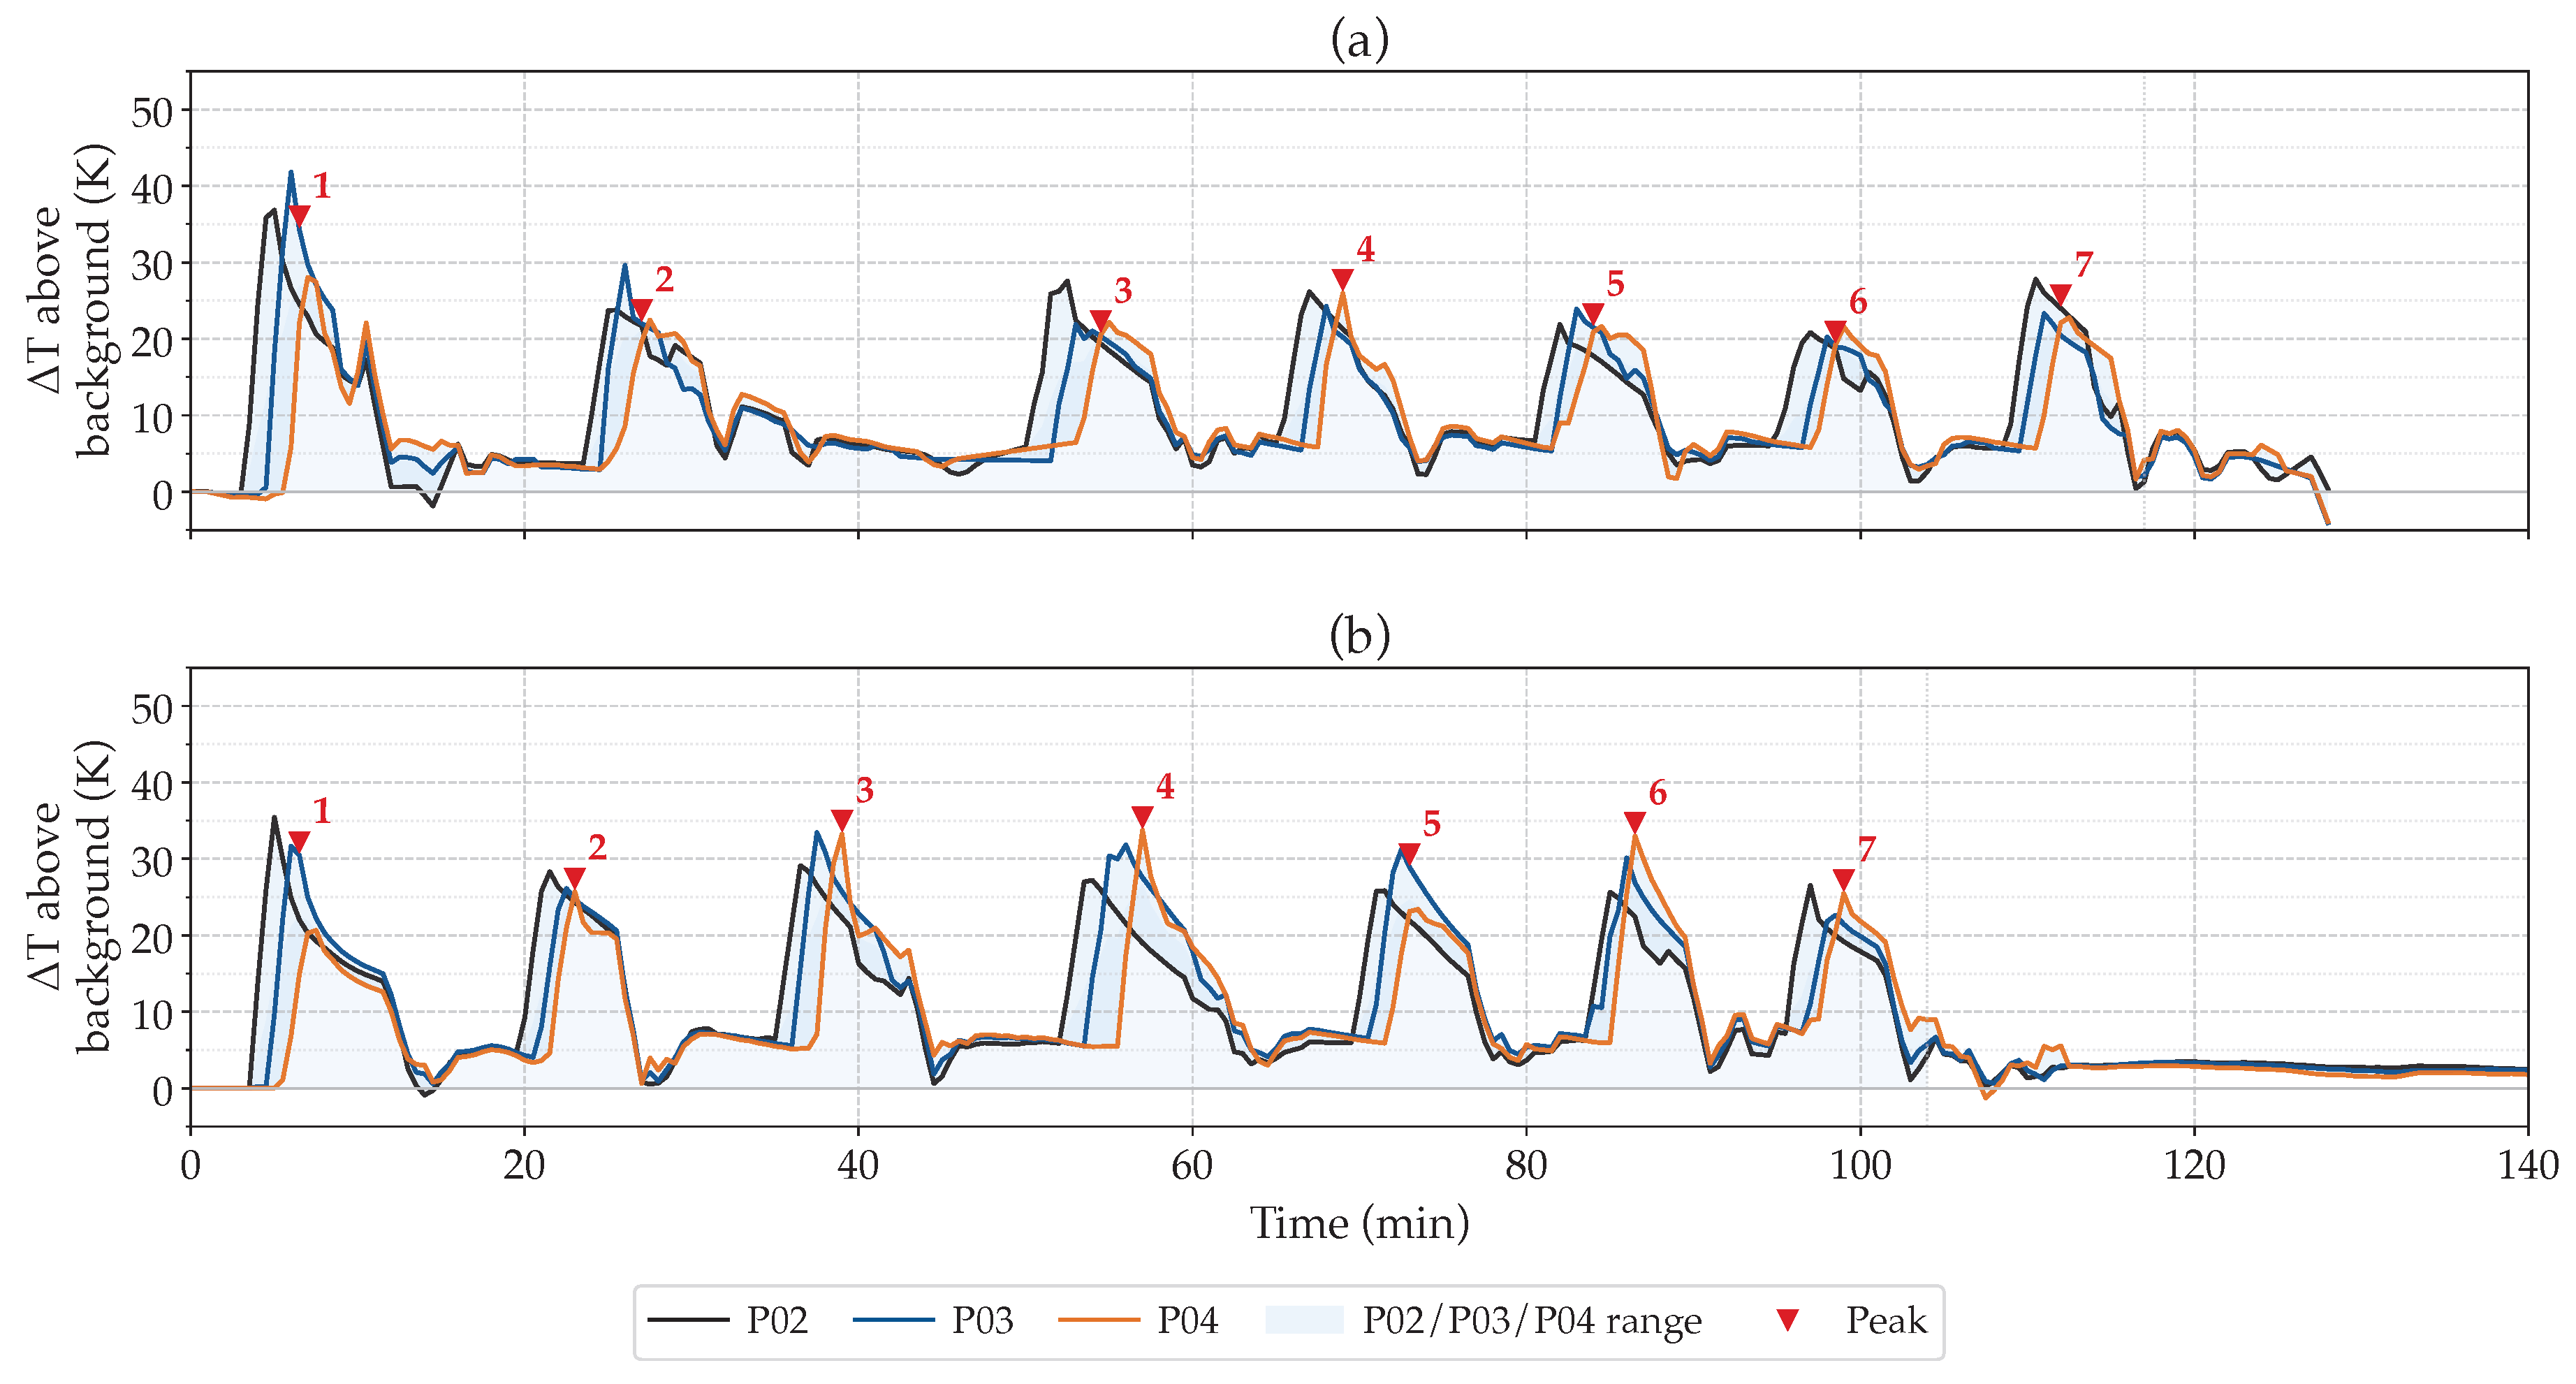

Table 1.
Individual bond stresses at the four characteristic slip levels (“Bonded” denotes the adhesively bonded group). All values in MPa. Group means (, ) are included. The specimen numbers are consecutive within each group and are independent of the bar positions P01 to P04 used in the thermography. Values at and are close to the resolution limit of the displacement measurement and scatter accordingly (see text).
Table 1.
Individual bond stresses at the four characteristic slip levels (“Bonded” denotes the adhesively bonded group). All values in MPa. Group means (, ) are included. The specimen numbers are consecutive within each group and are independent of the bar positions P01 to P04 used in the thermography. Values at and are close to the resolution limit of the displacement measurement and scatter accordingly (see text).
| Group | Specimen | ||||
|---|---|---|---|---|---|
| Welded | 1 | 0.40 | 7.30 | 14.22 | 22.63 |
| 2 | 0.04 | 2.73 | 13.67 | 20.51 | |
| 3 | 9.90 | 11.58 | 16.53 | 24.13 | |
| 4 | 1.01 | 5.42 | 12.77 | 22.15 | |
| 5 | 0.40 | 3.58 | 11.87 | 16.55 | |
| 6 | 0.52 | 2.17 | 6.87 | 11.66 | |
| 7 | 0.06 | 7.14 | 13.77 | 19.90 | |
| 8 | 2.39 | 10.80 | 16.32 | 26.15 | |
| Bonded | 1 | 0.19 | 1.03 | 18.48 | 30.25 |
| 2 | 7.57 | 10.10 | 16.29 | 23.74 | |
| 3 | 3.03 | 8.49 | 17.88 | 24.62 | |
| 4 | 0.39 | 6.32 | 17.58 | 26.03 | |
| 5 | 7.42 | 7.90 | 11.07 | 14.78 | |
| 6 | 0.53 | 5.11 | 12.79 | 20.59 | |
| 7 | 3.50 | 7.80 | 12.52 | 20.29 | |
| 8 | 0.18 | 5.86 | 14.11 | 18.85 | |
Disclaimer/Publisher’s Note: The statements, opinions and data contained in all publications are solely those of the individual author(s) and contributor(s) and not of MDPI and/or the editor(s). MDPI and/or the editor(s) disclaim responsibility for any injury to people or property resulting from any ideas, methods, instructions or products referred to in the content. |
© 2026 by the authors. Licensee MDPI, Basel, Switzerland. This article is an open access article distributed under the terms and conditions of the Creative Commons Attribution (CC BY) license (http://creativecommons.org/licenses/by/4.0/).
Copyright: This open access article is published under a Creative Commons CC BY 4.0 license, which permit the free download, distribution, and reuse, provided that the author and preprint are cited in any reuse.