

Submitted:
18 September 2026
Posted:
20 September 2026
You are already at the latest version
Abstract
Decaffeinated coffee is widely perceived as being virtually caffeine-free; however, complete caffeine removal is not achieved by commercial decaffeination processes, and residual caffeine in retail products may vary considerably. This study aimed to develop and vali-date a high-performance liquid chromatography method with ultraviolet detection HPLC–UV for the determination of residual caffeine in commercial decaffeinated coffee products. Sixteen products representing instant, ground, whole-bean, and capsule formats were analyzed. Chromatographic separation was achieved using a C18 reversed-phase column with a water–methanol gradient and UV detection at 272 nm. Method validation was performed according to the ICH Q2(R2) guideline, including system suitability, line-arity, precision, accuracy, recovery, and limits of detection and quantification. The method demonstrated excellent linearity over 0.05–5.0 ppm (R² = 1), with recoveries of 98.2–102.7% and repeatability and intermediate-precision RSDs below 2%. The LOD and LOQ were 0.0081 and 0.0245 ppm, respectively. Residual caffeine concentrations ranged from 0.051% to 0.175% (w/w). Ten products (62.5%) were at or below the 0.1% reference thresh-old, whereas six (37.5%) exceeded it. Although product category significantly affected re-sidual caffeine levels, substantial within-category variability was observed. The validated HPLC–UV method provides a rapid and reliable approach for routine quality control and post-market surveillance of residual caffeine in commercial decaffeinated coffee products.
Keywords:
decaffeinated coffee
; residual caffeine
; HPLC–UV
; method validation
; food quality control
; regulatory compliance
; consumer safety
1. Introduction
Coffee is among the most widely consumed beverages in the world, and for many drinkers it is also the principal daily source of Caffeine, a methylxanthine alkaloid that stimulates the central nervous system [1]. At moderate intake, Caffeine is generally linked to greater alertness and improved short-term cognitive performance [2], at higher intake, or in sensitive individuals, it can contribute to anxiety, insomnia, elevated blood pressure, arrhythmia, and gastrointestinal upset [3]. Concern about these effects, together with medical advice given to pregnant women, older adults, and people with certain cardiovascular or neurological conditions, has driven sustained demand for coffee with a lower caffeine content [3,4,5]. Industry has responded with several decaffeination technologies, including extraction with organic solvents such as dichloromethane or ethyl acetate, supercritical carbon dioxide extraction, and water-based (Swiss Water-type) processes [6,7,8]. Each can remove the large majority of Caffeine originally present in green coffee beans, but none removes it entirely [9]. A coffee sold as (decaffeinated) therefore still contains some caffeine, and the amount left behind depends on the process used, how well it was run, and downstream handling during roasting, blending, and packaging [7,10]. This residual fraction is not a trivial rounding error. Consumers who choose decaffeinated coffee specifically because of a medical restriction, pregnancy, or personal sensitivity are, in effect, trusting the label to mean negligible Caffeine [11,12]. Where products vary, including prior work suggests, between different batches of the same brand, trust can be misplaced, and repeated daily consumption of an under-decaffeinated product can add up to a meaningful cumulative exposure. Regulatory bodies have set thresholds to keep the decaffeinated claim meaningful. The U.S. Food and Drug Administration treat coffee as decaffeinated once at least 97% of the original Caffeine has been removed [13], which corresponds to roughly 0.1% residual caffeine on a dry-weight basis, the benchmark used throughout this study. Meeting that threshold reliably requires analytical methods sensitive enough to quantify trace caffeine in a chemically complex matrix rich in chlorogenic acids, tannins, and other interferents [14]. High-performance liquid chromatography (HPLC) is the method of choice for this kind of determination because of its sensitivity, selectivity, and suitability for routine quality control; paired with ultraviolet (UV) detection, it delivers accurate quantification without requiring mass-spectrometric instrumentation [14,15]. Even so, performance at trace levels depends heavily on how the method and the sample preparation feeding it are optimized. Despite the size of the decaffeinated coffee market, comparatively little published data speaks to how consistently commercially available products, across brands and formats, actually meet the regulatory ceiling. This study therefore had two aims: first, to develop and validate an HPLC–UV method for residual Caffeine in decaffeinated coffee in accordance with International Council for Harmonisation (ICH) guidelines [16], using a hot water/magnesium oxide extraction that avoids the organic solvents typically used for this class of assay; and second, to apply that method to a diverse set of commercially available decaffeinated coffee products instant, ground, whole bean, and capsule to gauge how well current market offerings meet the 0.1% regulatory benchmark, and to consider what any shortfall means for caffeine-sensitive consumers.
2. Materials and Methods
2.1. Chemicals and Reagents
Caffeine reference standard (purity ≥ 99%), HPLC-grade methanol, and ultrapure water were obtained from Sigma-Aldrich (Germany). Magnesium oxide (MgO) and other analytical-grade reagents used during sample preparation were also obtained from Sigma-Aldrich (Germany) and used as received.
2.2. Coffee Samples
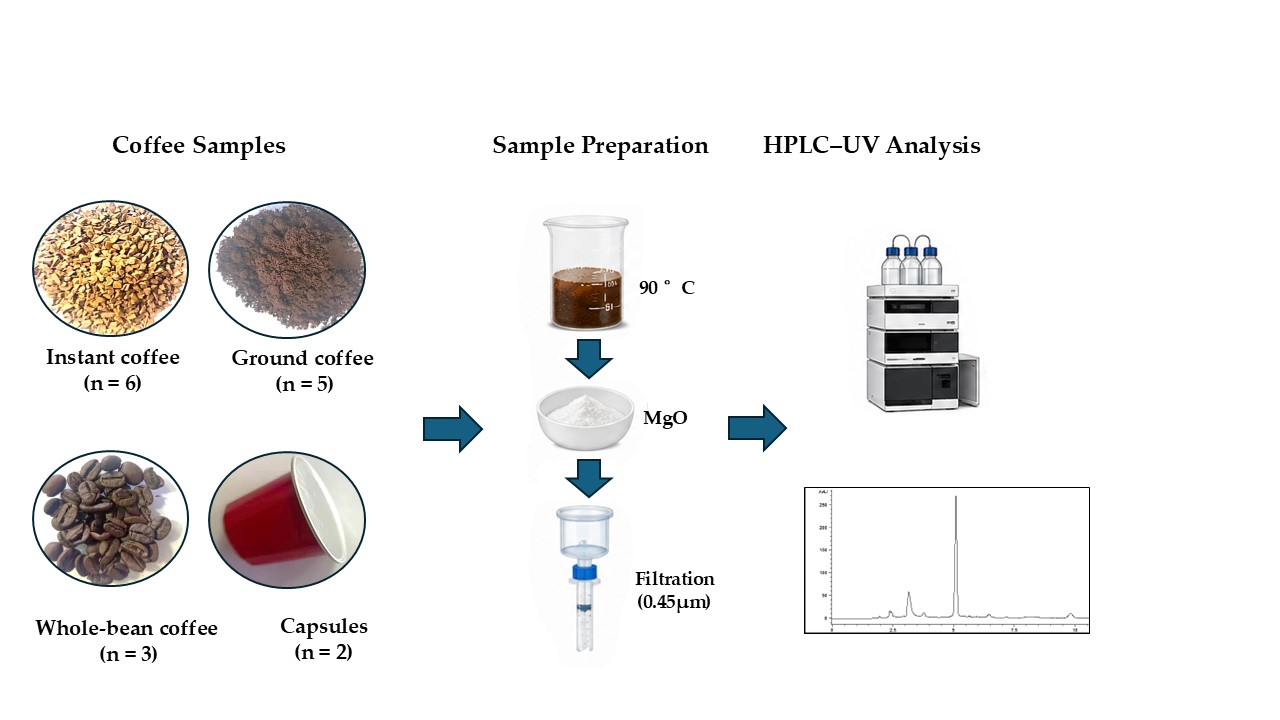
Sixteen commercially available decaffeinated coffee products were purchased from local retail markets, covering instant coffee (n = 6), ground coffee (n = 5), whole-bean coffee (n = 3), and coffee capsules (n = 2) from a range of manufacturers and countries of origin. Samples were kept in their original packaging under dry conditions at room temperature until analysis.
2.3. Instrumentation and Chromatographic Conditions
Analyses were performed on an Agilent 1200 Series HPLC–UV system (Agilent, USA) fitted with a Knauer C18 reversed-phase column (250 mm × 4.6 mm, 5 µm; Knauer, Germany). The mobile phase comprised water (A) and methanol (B) delivered as a gradient (Table 1), at a flow rate of 1.0 mL·min⁻¹ and a column temperature of 35 °C. Detection was at 272 nm, and the injection volume was 20 µL [17].
2.4. Preparation of Standard Solutions
A 1000 ppm caffeine stock solution was prepared by dissolving the reference standard in distilled water. Working standards spanning 0.05–5.0 ppm was prepared from this stock by serial dilution for use in calibration and validation.
2.5. Sample Preparation
Sample preparation was designed to extract Caffeine efficiently without organic solvents. Briefly, 0.5 g of decaffeinated coffee was weighed into an extraction vessel and combined with 200 mL of distilled water preheated to ~90 °C, with stirring. Magnesium oxide was added during extraction to neutralize chlorogenic acids, tannins, and other organic acids that would otherwise interfere chromatographically; the resulting insoluble salts precipitated on heating, leaving a clearer extract [18]. After cooling, the mixture was filtered to remove solids, diluted as needed, and passed through a 0.45 µm membrane filter before injection [19]. Alkaline treatment and solvent-assisted extraction were also evaluated during method development, but gave inferior recovery and more matrix interference than the hot-water/MgO approach, which was adopted for all subsequent analyses. Each sample was prepared in triplicate and analyzed under identical chromatographic conditions.
2.6. Method Validation
Validation followed ICH Q2(R2) and covered system suitability, linearity, precision (repeatability and intermediate precision), accuracy/recovery, and the limits of detection and quantification (LOD/LOQ) [16,20].
2.6.1. System Suitability
System suitability was assessed from repeated injections of a 2.5 ppm caffeine standard, evaluating retention time, capacity factor (k′), theoretical plate number (N), peak symmetry, and injection repeatability.
2.6.2. Linearity
Linearity was evaluated at 0.05, 0.1, 0.25, 0.5, 1, 2, 3.5, and 5 ppm. Calibration curves (peak area vs. concentration) were fitted by linear regression to obtain the coefficient of determination (R²).
2.6.3. Precision
Repeatability (intra-day precision) was assessed from six independent replicates of the same sample analyzed under identical conditions; intermediate precision (inter-day precision) was assessed by repeating the analysis on two separate days with independently prepared sample sets. Both were expressed as relative standard deviation (RSD %) [21].
2.6.4. Accuracy and Recovery
Accuracy was assessed via spike-recovery experiments at three concentration levels (0.05, 1, 5) ppm: known amounts of caffeine standard were added to pre-analyzed decaffeinated coffee samples, and recovery (%) was calculated from measured versus theoretical concentrations.
2.6.5. Limit of Detection and Limit of Quantification
LOD and LOQ were calculated from the calibration curve per ICH recommendations, using the standard deviation of the response (σ) and the slope of the calibration curve (S): LOD = 3.3σ/S; LOQ = 10σ/S.
2.7. Quantification of Residual Caffeine
Residual Caffeine in the commercial samples was quantified by external standard calibration. All measurements were made in triplicate and reported as grams of Caffeine per 100 g of product (% w/w).
2.8. Statistical Analysis
Data are reported as mean ± standard deviation (SD) from triplicate analyses, with RSD (%) used to express precision, and 95% confidence intervals calculated from the t-distribution (df = 2). Calculations were performed in GraphPad Prism (version 9). Each product’s triplicate mean was compared against the 0.1% regulatory limit using a one-sample Student’s t-test (df = 2). Residual Caffeine across the four broad product categories (instant, ground, whole-bean, capsule) was compared using one-way ANOVA (with Kruskal–Walli’s confirmation) followed by Tukey’s HSD post-hoc test for pairwise comparisons. Grubbs’ test was used to screen for outlying product means within a category, a chi-square test of independence was used to test for association between product category and binary compliance status, and Pearson correlation was used to examine the relationship between mean residual Caffeine and measurement precision (RSD). Significance was set at p < 0.05 throughout.
3. Results
3.1. Method Validation
System suitability testing demonstrated that the chromatographic system was suitable for caffeine determination in the analyzed coffee extracts as shown (Figure 1), caffeine eluted at a retention time of approximately 9.83 min, with a symmetry factor of 0.936 and a capacity factor (k′) of 5.17. The theoretical plate count (N = 12,947) indicated satisfactory column efficiency. Repeated injections of a 2.5 ppm caffeine standard showed an instrument repeatability RSD of 0.61%, demonstrating good injection-to-injection precision under the optimized chromatographic conditions.
The calibration curve showed (Figure 2) excellent linearity over the concentration range of 0.05–5.0 ppm, with the regression equation y = 62.66x + 0.8669 and a coefficient of determination of R² = 1.000. The LOD and LOQ were 0.0081 and 0.0245 ppm, respectively, demonstrating adequate sensitivity for quantification of residual caffeine in decaffeinated coffee extracts. The chromatograms showed stable baselines, good peak symmetry, and no detectable interfering peaks at the caffeine retention time.
Method precision was evaluated using repeatability and intermediate precision. Six independently prepared replicates analyzed under the same conditions gave an RSD of 1.39% as shown (Figure 3.A), while intermediate precision assessed on two separate days resulted in an overall RSD of 1.57% as shown (Figure 3.B). These results demonstrate good precision of the analytical procedure. Accuracy was assessed through recovery experiments at three concentration levels, with recoveries ranging from 98.2% to 102.7%. The recovery results support the accuracy of the method over the investigated concentration range.
3.2. Optimization of Sample Preparation
Coffee contains several matrix components, including chlorogenic acids, tannins, polyphenols, and proteins, which may contribute to chromatographic background and interfere with analyte determination. Therefore, the effect of MgO addition during sample extraction was evaluated. Extracts prepared with MgO produced cleaner chromatographic profiles and improved caffeine recovery compared with untreated extracts (Figure 4). The use of MgO was therefore retained in the optimized extraction procedure to improve extract quality and analytical reproducibility. The optimized procedure employed hot-water extraction followed by MgO treatment and filtration, thereby reducing the need for organic solvents during sample preparation. This approach provides a simple and relatively low-solvent procedure suitable for routine analysis of caffeine in commercial decaffeinated coffee products.
3.3. Residual Caffeine Content of Commercial Decaffeinated Coffee Products
Application of the validated HPLC–UV method to the sixteen commercial decaffeinated coffee products demonstrated substantial variability in residual caffeine concentration, with measured values ranging from 0.0514% to 0.1754% (w/w) (Table 2). Ten products (62.5%) had measured concentrations at or below the 0.1% reference threshold, whereas six products (37.5%) exceeded the threshold.The highest residual caffeine concentration was detected in NNODEC (BD) (0.1754% w/w) as shown (Figure 5), followed by RTDEC (CF) (0.1501% w/w) and IDEC (EH) (0.1343% w/w). The lowest concentration was observed in DDEC (CJ) (0.0514% w/w). Among instant coffee products, residual caffeine ranged from 0.0855% to 0.1754% (w/w). Ground and other brewed coffee products showed values ranging from 0.0514% to 0.1501%, whereas whole-bean products ranged from 0.0526% to 0.1045%. The two capsule products showed concentrations of 0.0972% and 0.1343% (w/w). For statistical comparison of product categories, the samples were assigned to four predefined broad categories: instant, ground/other brewed, whole-bean, and capsule coffee. The ground other brewed category included the products labeled as ground, Turkish, filter, and Saudi coffee. This grouping was used solely for statistical comparison and does not imply that these products have identical processing or preparation characteristics.A one-way ANOVA demonstrated a statistically significant difference in mean residual caffeine concentration among the four product categories (F(3,44) = 4.17, p = 0.011). A Kruskal–Wallis test provided a consistent overall result (H = 10.9, p = 0.012). These findings indicate that product category contributed to differences in residual caffeine concentration. However, the substantial variability among individual products within categories indicates that product format alone is insufficient to predict the compliance status of a particular commercial product. Because the 0.1% threshold represents a reference point for regulatory assessment rather than a conventional statistical null hypothesis, compliance classification was based primarily on the measured product concentration relative to the specified threshold. Products with measured mean concentrations ≤0.1% were classified as compliant, whereas those with measured means >0.1% were classified as exceeding the reference threshold. The products MFRDEC (BC) and MDEC (EI) were close to the threshold, with measured means of 0.1023% and 0.0972%, respectively, and should therefore be interpreted cautiously in view of their proximity to the regulatory boundary.
SD and RSD were calculated from triplicate measurements. Compliance classification was based on the measured mean concentration relative to the 0.1% (w/w) reference threshold. Products with mean concentrations ≤0.1% were classified as compliant, whereas products with mean concentrations >0.1% were classified as exceeding the threshold. Where one-sample t-test results are reported, they represent an exploratory comparison of the product mean with 0.1% (w/w) and were not used as the sole basis for regulatory classification.
3.4. Statistical Analysis
Because the overall ANOVA indicated a significant difference among product categories, Tukey’s HSD post-hoc test was performed to identify the category pairs responsible for the observed effect. Whole-bean coffee showed significantly lower residual caffeine concentrations than instant coffee (mean difference = −0.0385% w/w, 95% CI [−0.0729, −0.0041], adjusted p = 0.023) and coffee capsules (mean difference = −0.0449% w/w, 95% CI [−0.0893, −0.0005], adjusted p = 0.047). The remaining pairwise comparisons were not statistically significant after adjustment for multiple comparisons. These findings indicate that the significant omnibus category effect was driven primarily by the lower residual caffeine concentrations observed in whole-bean coffee compared with instant and capsule products. Nevertheless, the wide variation among individual products within several categories indicates that category-level differences should not be interpreted as evidence that one product format is inherently more compliant or safer than another. A Grubbs’ test identified NNODEC (BD), with a residual caffeine concentration of 0.1754%, as a statistical outlier within the instant-coffee group (G = 1.91; Gcrit = 1.89; α = 0.05). This result indicates unusually high residual caffeine relative to the other instant-coffee products analyzed. However, the statistical identification of an outlier does not establish the underlying cause, and additional batch-level and manufacturing data would be required to determine whether the result reflects process variability, raw-material differences, or another product-specific factor.
The small number of products in some categories limits the statistical power of category-level comparisons. In particular, the capsule group contained only two products, and the whole-bean group contained three products. Therefore, the observed category differences should be considered exploratory and should be confirmed using a larger and more representative sample of commercial products.
4. Discussion
The present study demonstrated substantial variability in residual caffeine concentrations among commercial decaffeinated coffee products, despite all products being marketed as decaffeinated. The concentrations measured in the sixteen products ranged from 0.0514% to 0.1754% (w/w), indicating that caffeine removal was not uniform across the products examined. This observation is consistent with the fundamental limitations of industrial decaffeination, in which complete removal of caffeine is technically difficult because caffeine is distributed within the cellular structure of the coffee bean and its extraction is influenced by mass transfer, moisture content, processing conditions, and the selectivity of the decaffeination process [6]. Industrial decaffeination may employ water, organic solvents, or supercritical carbon dioxide, and differences in process design and operating conditions can influence the extent to which caffeine is removed while preserving desirable coffee constituents [7,22,23]. The variability observed in the present study is also consistent with previous analytical investigations of commercial decaffeinated coffee. Meinhart et al. developed an optimized analytical method for caffeine determination in decaffeinated coffee and applied it to 45 commercial samples, demonstrating the practical need for sensitive analytical procedures capable of characterizing residual caffeine at low concentrations [22]. Similarly, Bizzotto et al. compared capillary electrophoresis and HPLC for residual caffeine determination and applied both methods to commercial decaffeinated coffee samples, confirming the suitability of chromatographic approaches for monitoring residual caffeine in this product category [23]. Earlier HPLC-based work by Fujioka and Shibamoto also demonstrated marked differences in caffeine concentrations among commercial regular and decaffeinated coffees, with decaffeinated products containing substantially less caffeine than regular coffee but still showing measurable residual levels [24]. An important finding of the present study was the statistically significant difference in residual caffeine concentration among the predefined product categories. However, the post-hoc analysis indicated that this overall effect was driven primarily by the lower concentrations observed in whole-bean products compared with instant and capsule products. Importantly, substantial variation remained within individual categories. Thus, product format should not be interpreted as a direct surrogate for the efficiency of the decaffeination process. The final caffeine concentration in a commercial product is likely to reflect multiple factors, including the caffeine concentration of the original green coffee, coffee species and cultivar, the decaffeination technology used, processing conditions, and subsequent roasting and manufacturing steps. Because these variables were not available for the products examined, the observed category differences should be interpreted as associations rather than evidence of a causal effect of product format itself [25].The residual caffeine concentrations observed in the present study are also relevant from a regulatory and quality-control perspective [26]. Six of the sixteen products (37.5%) had measured mean concentrations above the 0.1% reference threshold used in the present assessment [27], whereas ten products (62.5%) were at or below this threshold. These findings should, however, be interpreted in the context of the specific regulatory definition and jurisdiction to which the 0.1% threshold is applied. A concentration exceeding a specified regulatory or reference threshold should not automatically be interpreted as evidence of an acute toxicological hazard. Rather, it represents a potential quality control and labeling concern because consumers may reasonably expect a product marketed as decaffeinated to contain substantially less caffeine than conventional coffee. From a public-health perspective, the distinction between regulatory compliance and toxicological safety is important. Caffeine is a pharmacologically active compound, and its physiological effects depend on dose, frequency of exposure, individual susceptibility, and the contribution of caffeine from all dietary sources. The European Food Safety Authority has concluded that, for the general healthy adult population, single caffeine doses up to 200 mg and habitual daily intakes up to 400 mg from all sources do not generally raise safety concerns, while lower levels may be relevant for certain population groups or circumstances [28]. Consequently, the residual caffeine concentrations identified in the present study should not be characterized as demonstrating an immediate health hazard. Instead, they demonstrate that the term “decaffeinated” does not necessarily indicate complete caffeine removal and that analytical verification remains important for accurate product characterization. This distinction may be particularly relevant for consumers who intentionally restrict caffeine intake. Previous reviews have emphasized that decaffeinated coffee is selected by consumers who wish to reduce caffeine exposure while retaining the sensory and potentially beneficial characteristics associated with coffee consumption. Therefore, even relatively low residual concentrations may be relevant when exposure is repeated through multiple servings or when individuals are attempting to minimize caffeine intake for personal or dietary reasons. Nevertheless, the present study did not measure caffeine exposure following beverage preparation and therefore cannot directly estimate the amount of caffeine ultimately consumed per serving. Such an assessment would require standardized brewing experiments and consideration of serving size, extraction efficiency, and consumption frequency. The observed product-to-product variability may also reflect differences in the extent to which decaffeination affects other coffee constituents. Decaffeination is not necessarily completely selective for caffeine, and changes in other compounds may occur depending on the process employed. For example, Farah et al. reported differences in chlorogenic acid and chlorogenic acid lactone profiles between regular and decaffeinated coffees, indicating that decaffeination can influence compounds other than caffeine. These observations reinforce the concept that decaffeination should be regarded as a multidimensional processing step rather than simply a quantitative reduction in caffeine. Differences in processing technology may therefore contribute to variation in the chemical composition of commercial decaffeinated products, although the present study did not measure these additional compounds [25]. From an analytical perspective, the HPLC–UV method developed in this study demonstrated suitable performance for quantitative determination of residual caffeine. The method showed excellent linearity over 0.05–5.0 ppm (R² = 1.000), satisfactory recovery (98.2–102.7%), and good repeatability and intermediate precision, with RSD values below 2%. The LOD and LOQ of 0.0081 and 0.0245 ppm, respectively, indicate that the method provides sufficient sensitivity for the concentration range encountered in the analyzed samples. These characteristics are consistent with the established use of HPLC-based methods for caffeine determination in coffee and other complex food matrices [29]. Recent methodological literature also identifies HPLC coupled with UV, diode-array, or mass-spectrometric detection as an established analytical platform for caffeine quantification because of its sensitivity, reproducibility, and adaptability to different matrices [14,30]. The optimized hot-water/MgO extraction procedure represents an additional practical feature of the present method. Conventional caffeine extraction procedures have employed a variety of organic solvents, water-based systems, and other extraction strategies, each presenting different advantages with respect to selectivity, extraction efficiency, cost, and environmental considerations [31]. In the present study, hot-water extraction combined with MgO treatment produced cleaner chromatographic profiles and satisfactory recovery while reducing dependence on organic solvents during sample preparation. This feature may be advantageous for laboratories conducting routine food-quality analysis, particularly where analytical simplicity, cost, solvent consumption, and waste generation are important considerations. However, the present study did not undertake a formal green analytical chemistry assessment; therefore, the method should be described as a low-solvent or solvent-reduced approach rather than definitively classified as a green method. The analytical findings also have implications for quality-control and post-market surveillance. Previous studies have demonstrated that commercial decaffeinated coffees can be effectively screened for residual caffeine using chromatographic techniques, supporting the feasibility of routine monitoring [32]. The relatively simple HPLC–UV procedure developed here may therefore provide a practical screening tool for laboratories that do not have access to more advanced LC–MS/MS instrumentation. Nevertheless, HPLC–UV should be viewed primarily as a quantitative routine method, whereas mass-spectrometric approaches may provide additional selectivity and confirmatory capability in complex matrices [33]. Several limitations should be considered when interpreting the present findings. First, the study included only sixteen commercial products, which limits the precision with which the prevalence of products exceeding the 0.1% reference threshold can be estimated. The proportion observed in this study should therefore not be extrapolated to the wider national or international decaffeinated coffee market. Second, the samples were obtained from local retail markets and may not adequately represent differences among manufacturers, countries of origin, product formulations, or production batches. Third, only one commercial unit or batch per product was evaluated; consequently, the study cannot determine whether the observed differences are stable characteristics of the products or reflect batch-to-batch variation. A further limitation is the absence of detailed information regarding the decaffeination technology used for each product. Different industrial approaches, including water-based extraction, organic-solvent extraction, and supercritical carbon dioxide, may differ in caffeine removal efficiency and in their effects on other coffee constituents [30,34]. In addition, information regarding the original green-bean caffeine concentration, Coffea species or cultivar, roasting conditions, processing parameters, and manufacturer-specific quality-control procedures was not available. Consequently, the present study cannot establish whether a particular decaffeination technology, raw-material characteristic, or manufacturing factor was responsible for the higher residual caffeine concentrations observed in individual products. Future investigations should therefore include larger numbers of commercial products, multiple production batches, different geographical markets, and products manufactured using known decaffeination technologies. Where possible, future studies should also compare residual caffeine before and after brewing, determine caffeine concentration per standardized serving, and investigate the relationship between residual caffeine and other coffee constituents such as chlorogenic acids [35]. Such studies would provide a more comprehensive assessment of the chemical consequences of decaffeination and would strengthen the evidence base for quality-control and post-market surveillance of decaffeinated coffee. Overall, the present findings support the use of validated analytical methods to characterize residual caffeine in commercial decaffeinated coffee. The substantial variability observed among individual products, together with the significant but limited category-level differences, suggests that product format alone cannot reliably predict residual caffeine concentration. Product-specific analytical verification therefore remains important for quality assurance, while larger and more systematically designed studies are needed to determine the prevalence, reproducibility, and underlying causes of elevated residual caffeine concentrations in the broader commercial market.
5. Conclusions and General Remarks
A sensitive and precise HPLC–UV method was developed and validated for the determination of residual caffeine in commercial decaffeinated coffee products. The method demonstrated excellent linearity over 0.05–5.0 ppm, satisfactory accuracy and recovery, and good repeatability and intermediate precision, with LOD and LOQ values of 0.0081 and 0.0245 ppm, respectively. The optimized hot-water/MgO extraction procedure provided a simple, low-solvent approach for sample preparation. Application of the method to sixteen commercial products revealed substantial variability in residual caffeine concentrations, ranging from 0.0514% to 0.1754% (w/w). Ten products (62.5%) were at or below the 0.1% reference threshold, whereas six products (37.5%) exceeded it. Product category was significantly associated with residual caffeine concentration; however, substantial within-category variability limited the ability of product format to predict individual-product compliance. These findings support the value of validated analytical methods for routine quality control and post-market surveillance of decaffeinated coffee products. Because of the limited sample size and the absence of manufacturing and decaffeination-process information, the present findings should be considered an initial assessment rather than an estimate of the prevalence of regulatory non-compliance in the wider market. Larger, multi-batch studies involving products from different manufacturers and markets are needed to confirm the observed variability and to identify factors associated with residual caffeine levels.
Author Contributions
Conceptualization, L.S.; methodology, L.S.; validation, A.N.; formal analysis, I.A.; investigation, I.A.; data curation, L.S.; writing original draft preparation, I.A.; writing review and editing, A.N.; supervision, L.S. All authors have read and agreed to the published version of the manuscript.
Funding
This research received no external funding.
Institutional Review Board Statement
Not applicable this study involved chemical analysis of retail food products and did not involve human or animal subjects.
Informed Consent Statement
Not applicable.
Data Availability Statement
The data supporting the findings of this study are available from the corresponding author upon reasonable request.
Acknowledgments
The author thanks the Faculty of Pharmacy, Damascus University, Syria, for laboratory facilities and technical support.
Conflicts of Interest
The author declares no conflict of interest.
Abbreviations
The following abbreviations are used in this manuscript:
| FDA: | United States Food and Drug Administration |
| ICH: | International Council for Harmonisation of Technical Requirements for Pharmaceuticals for Human Use |
| LOD: | Limit of Detection |
| LOQ: | Limit of Quantification |
| MgO: | Magnesium Oxide |
| R²: | Coefficient of Determination |
| Rt: | Retention Time |
References
- dePaula, J.; Farah, A. Caffeine consumption through coffee: Content in the beverage, metabolism, health benefits and risks. Beverages 2019, 5, 37. [Google Scholar] [CrossRef]
- Raise-Abdullahi, P.; Raeis-Abdollahi, E.; Meamar, M.; Rashidy-Pour, A. Effects of coffee on cognitive function. Prog. Brain Res. 2024, 288, 133–166. [Google Scholar] [CrossRef] [PubMed]
- Temple, J.L.; Bernard, C.; Lipshultz, S.E.; Czachor, J.D.; Westphal, J.A.; Mestre, M.A. The safety of ingested caffeine: a comprehensive review. Front. Psychiatry 2017, 8, 80. [Google Scholar] [CrossRef] [PubMed]
- Carbone, M.G.; Pagni, G.; Tagliarini, C.; Maremmani, I.; Maremmani, A.G.I. Caffeine in aging brains: cognitive enhancement, neurodegeneration, and emerging concerns about addiction. Int. J. Environ. Res. Public Health 2025, 22, 1171. [Google Scholar] [CrossRef] [PubMed]
- Hinkle, S.N.; Gleason, J.L.; Yisahak, S.F.; Zhao, S.K.; Mumford, S.L.; Sundaram, R.; Grewal, J.; Grantz, K.L.; Zhang, C. Assessment of caffeine consumption and maternal cardiometabolic pregnancy complications. JAMA Netw. Open 2021, 4, e2133401. [Google Scholar] [CrossRef] [PubMed]
- Ramalakshmi, K.; Raghavan, B. Caffeine in coffee: its removal. Why and how? Crit. Rev. Food Sci. Nutr. 1999, 39, 441–456. [Google Scholar] [CrossRef] [PubMed]
- Shofinita, D.; Lestari, D.; Purwadi, R.; Sumampouw, G.A.; Gunawan, K.C.; Ambarwati, S.A.; Achmadi, A.B.; Tjahjadi, J.T. Effects of different decaffeination methods on caffeine contents, physicochemical, and sensory properties of coffee. Int. J. Food Eng. 2024, 20, 561–581. [Google Scholar] [CrossRef]
- Olechno, E.; Puścion-Jakubik, A.; Markiewicz-Żukowska, R.; Socha, K. Impact of brewing methods on total phenolic content (TPC) in various types of coffee. Molecules 2020, 25, 5274. [Google Scholar] [CrossRef] [PubMed]
- Prandi, B.; Ferri, M.; Monari, S.; Zurlini, C.; Cigognini, I.; Verstringe, S.; Schaller, D.; Walter, M.; Navarini, L.; Tassoni, A. Extraction and chemical characterization of functional phenols and proteins from coffee (Coffea arabica) by-products. Biomolecules 2021, 11, 1571. [Google Scholar] [CrossRef] [PubMed]
- McCusker, R.R.; Fuehrlein, B.; Goldberger, B.A.; Gold, M.S.; Cone, E.J. Caffeine content of decaffeinated coffee. J. Anal. Toxicol. 2006, 30, 611–613. [Google Scholar] [CrossRef] [PubMed]
- Saeed, M.; Naveed, M.; BiBi, J.; Ali Kamboh, A.; Phil, L.; Chao, S. Potential nutraceutical and food additive properties and risks of coffee: A comprehensive overview. Crit. Rev. Food Sci. Nutr. 2019, 59, 3293–3319. [Google Scholar] [CrossRef] [PubMed]
- Henningfield, J.E.; Barrett, F.S.; Evans, S.M.; Garcia-Romeu, A.; Garrett, B.E.; Hienz, R.D.; Lukas, S.E.; Nayak, S.M.; Strain, E.C.; Weerts, E.M. Roland R. Griffiths, psychopharmacology pioneer: Abuse liability, alcohol, nicotine, caffeine, benzodiazepines, and psychedelics. J. Psychopharmacol. 2026, 40, 10–45. [Google Scholar] [CrossRef] [PubMed]
- Food, U.; Administration, D. Spilling the beans: How much caffeine is too much. FDA Consum. Health Inf. 2018. [Google Scholar]
- Awwad, S.H.; Nasereddin, L.M.; Al-Tamimi, O.; Daraosheh, A.Q.; Elrashidi, A.; Abu Al-Shayeb, L.; Shannag, M.; Mohammad, B.A.; Issa, R.; Abu-Samak, M.S. From Conventional Methods to Innovation: Caffeine and Chlorogenic Acid Extraction and Quantification in the Rise of Smart and Green Techniques—A Systematic Review. Molecules 2026, 31, 1890. [Google Scholar] [CrossRef] [PubMed]
- Cortés-Herrera, C.; Artavia, G.; Leiva, A.; Granados-Chinchilla, F. Liquid chromatography analysis of common nutritional components, in feed and food. Foods 2018, 8, 1. [Google Scholar] [CrossRef] [PubMed]
- Ermer, J. ICH Q2 (R2): validation of analytical procedures. Method validation in pharmaceutical analysis: a guide to best practice 2025, 351–372. [Google Scholar]
- Naveen, P.; Lingaraju, H.; Deepak, M.; Medhini, B.; Prasad, K.S. Method development and validation for the determination of caffeine: An alkaloid from coffea arabica by high-performance liquid chromatography method. Pharmacogn. Res. 2018, 10, 88. [Google Scholar] [CrossRef] [PubMed]
- Condelli, N.; Cela, N.; Di Cairano, M.; Scarpa, T.; Milella, L.; Ascrizzi, R.; Flamini, G.; Galgano, F. Drivers of coffee liking: Effect of physicochemical characteristics and aromatic profile on consumers’ acceptability of mono-origin and mono-variety coffees. J. Food Sci. 2022, 87, 4688–4702. [Google Scholar] [CrossRef] [PubMed]
- Macheiner, L.; Schmidt, A.; Schreiner, M.; Mayer, H.K. Green coffee infusion as a source of caffeine and chlorogenic acid. J. Food Compos. Anal. 2019, 84, 103307. [Google Scholar] [CrossRef]
- Eberle, M.; Wasylenko, J.T.; Kostelac, D.; Kiehna, S.; Schellinger, A.; Zhang, Z.; Ehrick, J.D. A modern framework for analytical procedure development and lifecycle management based on ICH Q14 principles. Anal. Chem. 2025, 97, 12–21. [Google Scholar] [CrossRef] [PubMed]
- He, X.; Lei, Y.; Li, Z.; Yu, F.; Zhao, J.; Li, Q.; Liu, W.; Zhao, Z. Dansyl-HPLC-FLD analysis of 21 amino acids and processing dynamics in ziyang selenium-enriched green tea. J. Food Meas. Charact. 2026, 1–14. [CrossRef]
- Meinhart, A.D.; Bizzotto, C.S.; Ballus, C.A.; Prado, M.A.; Bruns, R.E.; Teixeira Filho, J.; Godoy, H.T. Optimisation of a CE method for caffeine analysis in decaffeinated coffee. Food Chem. 2010, 120, 1155–1161. [Google Scholar] [CrossRef]
- Bizzotto, C.S.; Meinhart, A.D.; Ballus, C.A.; Ghiselli, G.; Godoy, H.T. Comparison of capillary electrophoresis and high performance liquid chromatography methods for caffeine determination in decaffeinated coffee. Food Sci. Technol. 2013, 33, 186–191. [Google Scholar] [CrossRef]
- Fujioka, K.; Shibamoto, T. Chlorogenic acid and caffeine contents in various commercial brewed coffees. Food Chem. 2008, 106, 217–221. [Google Scholar] [CrossRef]
- Farah, A.; de Paulis, T.; Moreira, D.P.; Trugo, L.C.; Martin, P.R. Chlorogenic acids and lactones in regular and water-decaffeinated arabica coffees. J. Agric. Food Chem. 2006, 54, 374–381. [Google Scholar] [CrossRef] [PubMed]
- Hassan, S.A.; Abdelaal, S.H.; El Azab, N.F.; El-Kosasy, A.M. A new era in dietary supplement regulation: sustainable chemometric approach for quality control of four dietary ingredients in slimming preparations. J. Food Compos. Anal. 2025, 108619. [Google Scholar] [CrossRef]
- Pierens, G.K.; Carroll, A.R.; Davis, R.A.; Palframan, M.E.; Quinn, R.J. Determination of analyte concentration using the residual solvent resonance in 1H NMR spectroscopy. J. Nat. Prod. 2008, 71, 810–813. [Google Scholar] [CrossRef] [PubMed]
- NDA, E.S.P. Scientific opinion on the safety of caffeine. Efsa J. 2015, 13, 4102. [Google Scholar] [CrossRef]
- Klikarová, J.; Česlová, L. Targeted and non-targeted HPLC analysis of coffee-based products as effective tools for evaluating the coffee authenticity. Molecules 2022, 27, 7419. [Google Scholar] [CrossRef] [PubMed]
- Kalita, L.; Sinha, S.K.; Deka, B.; Dasgupta, D.; Deka, B.; Patowary, P.; Mazumder, M.U.; Sahariah, B.J.; Ali, R. Caffeine Analysis Through the Lens of Green Chemistry: A Review of Sustainable Techniques and Emerging Trends. Crit. Rev. Anal. Chem. 2025, 1–15. [Google Scholar] [CrossRef] [PubMed]
- Bizzotto, C.S.; Meinhart, A.D.; Ballus, C.A.; Junior, F.A.d.S.C.; Godoy, H.T. Multivariate optimization of residual caffeine extraction from decaffeinated coffee. Eclética Quím. 2013, 38, 45–53. [Google Scholar]
- Al-Khateeb, L.A.; El-Maghrabey, M. Environmentally friendly ultra-fast HTLC method for simultaneous analysis of NSAIDs and caffeine in environmental waters. Microchem. J. 2025, 116733. [Google Scholar] [CrossRef]
- Locatelli, M.; Melucci, D.; Carlucci, G.; Locatelli, C. Recent HPLC strategies to improve sensitivity and selectivity for the analysis of complex matrices. Instrum. Sci. Technol. 2012, 40, 112–137. [Google Scholar] [CrossRef]
- Husodo, A.S.; Gala, S.; Pramono, Y.B.; Jimmy, J.; Yuniati, Y. Extraction of Bioactive Compounds from Coffee and Its By-products: A Bibliometric Review of Process Readiness and Valorization. ASEAN J. Chem. Eng. 2026, 26, 410–437. [Google Scholar] [CrossRef]
- Campa, C.; Doulbeau, S.; Dussert, S.; Hamon, S.; Noirot, M. Qualitative relationship between caffeine and chlorogenic acid contents among wild Coffea species. Food Chem. 2005, 93, 135–139. [Google Scholar] [CrossRef]
Figure 1.
(A) HPLC–UV chromatogram of a 2.5 ppm caffeine standard, showing a well-resolved peak at Rt ≈ 9.83 min; (B) injection-to-injection repeatability across five replicate injections under the same conditions.
Figure 1.
(A) HPLC–UV chromatogram of a 2.5 ppm caffeine standard, showing a well-resolved peak at Rt ≈ 9.83 min; (B) injection-to-injection repeatability across five replicate injections under the same conditions.
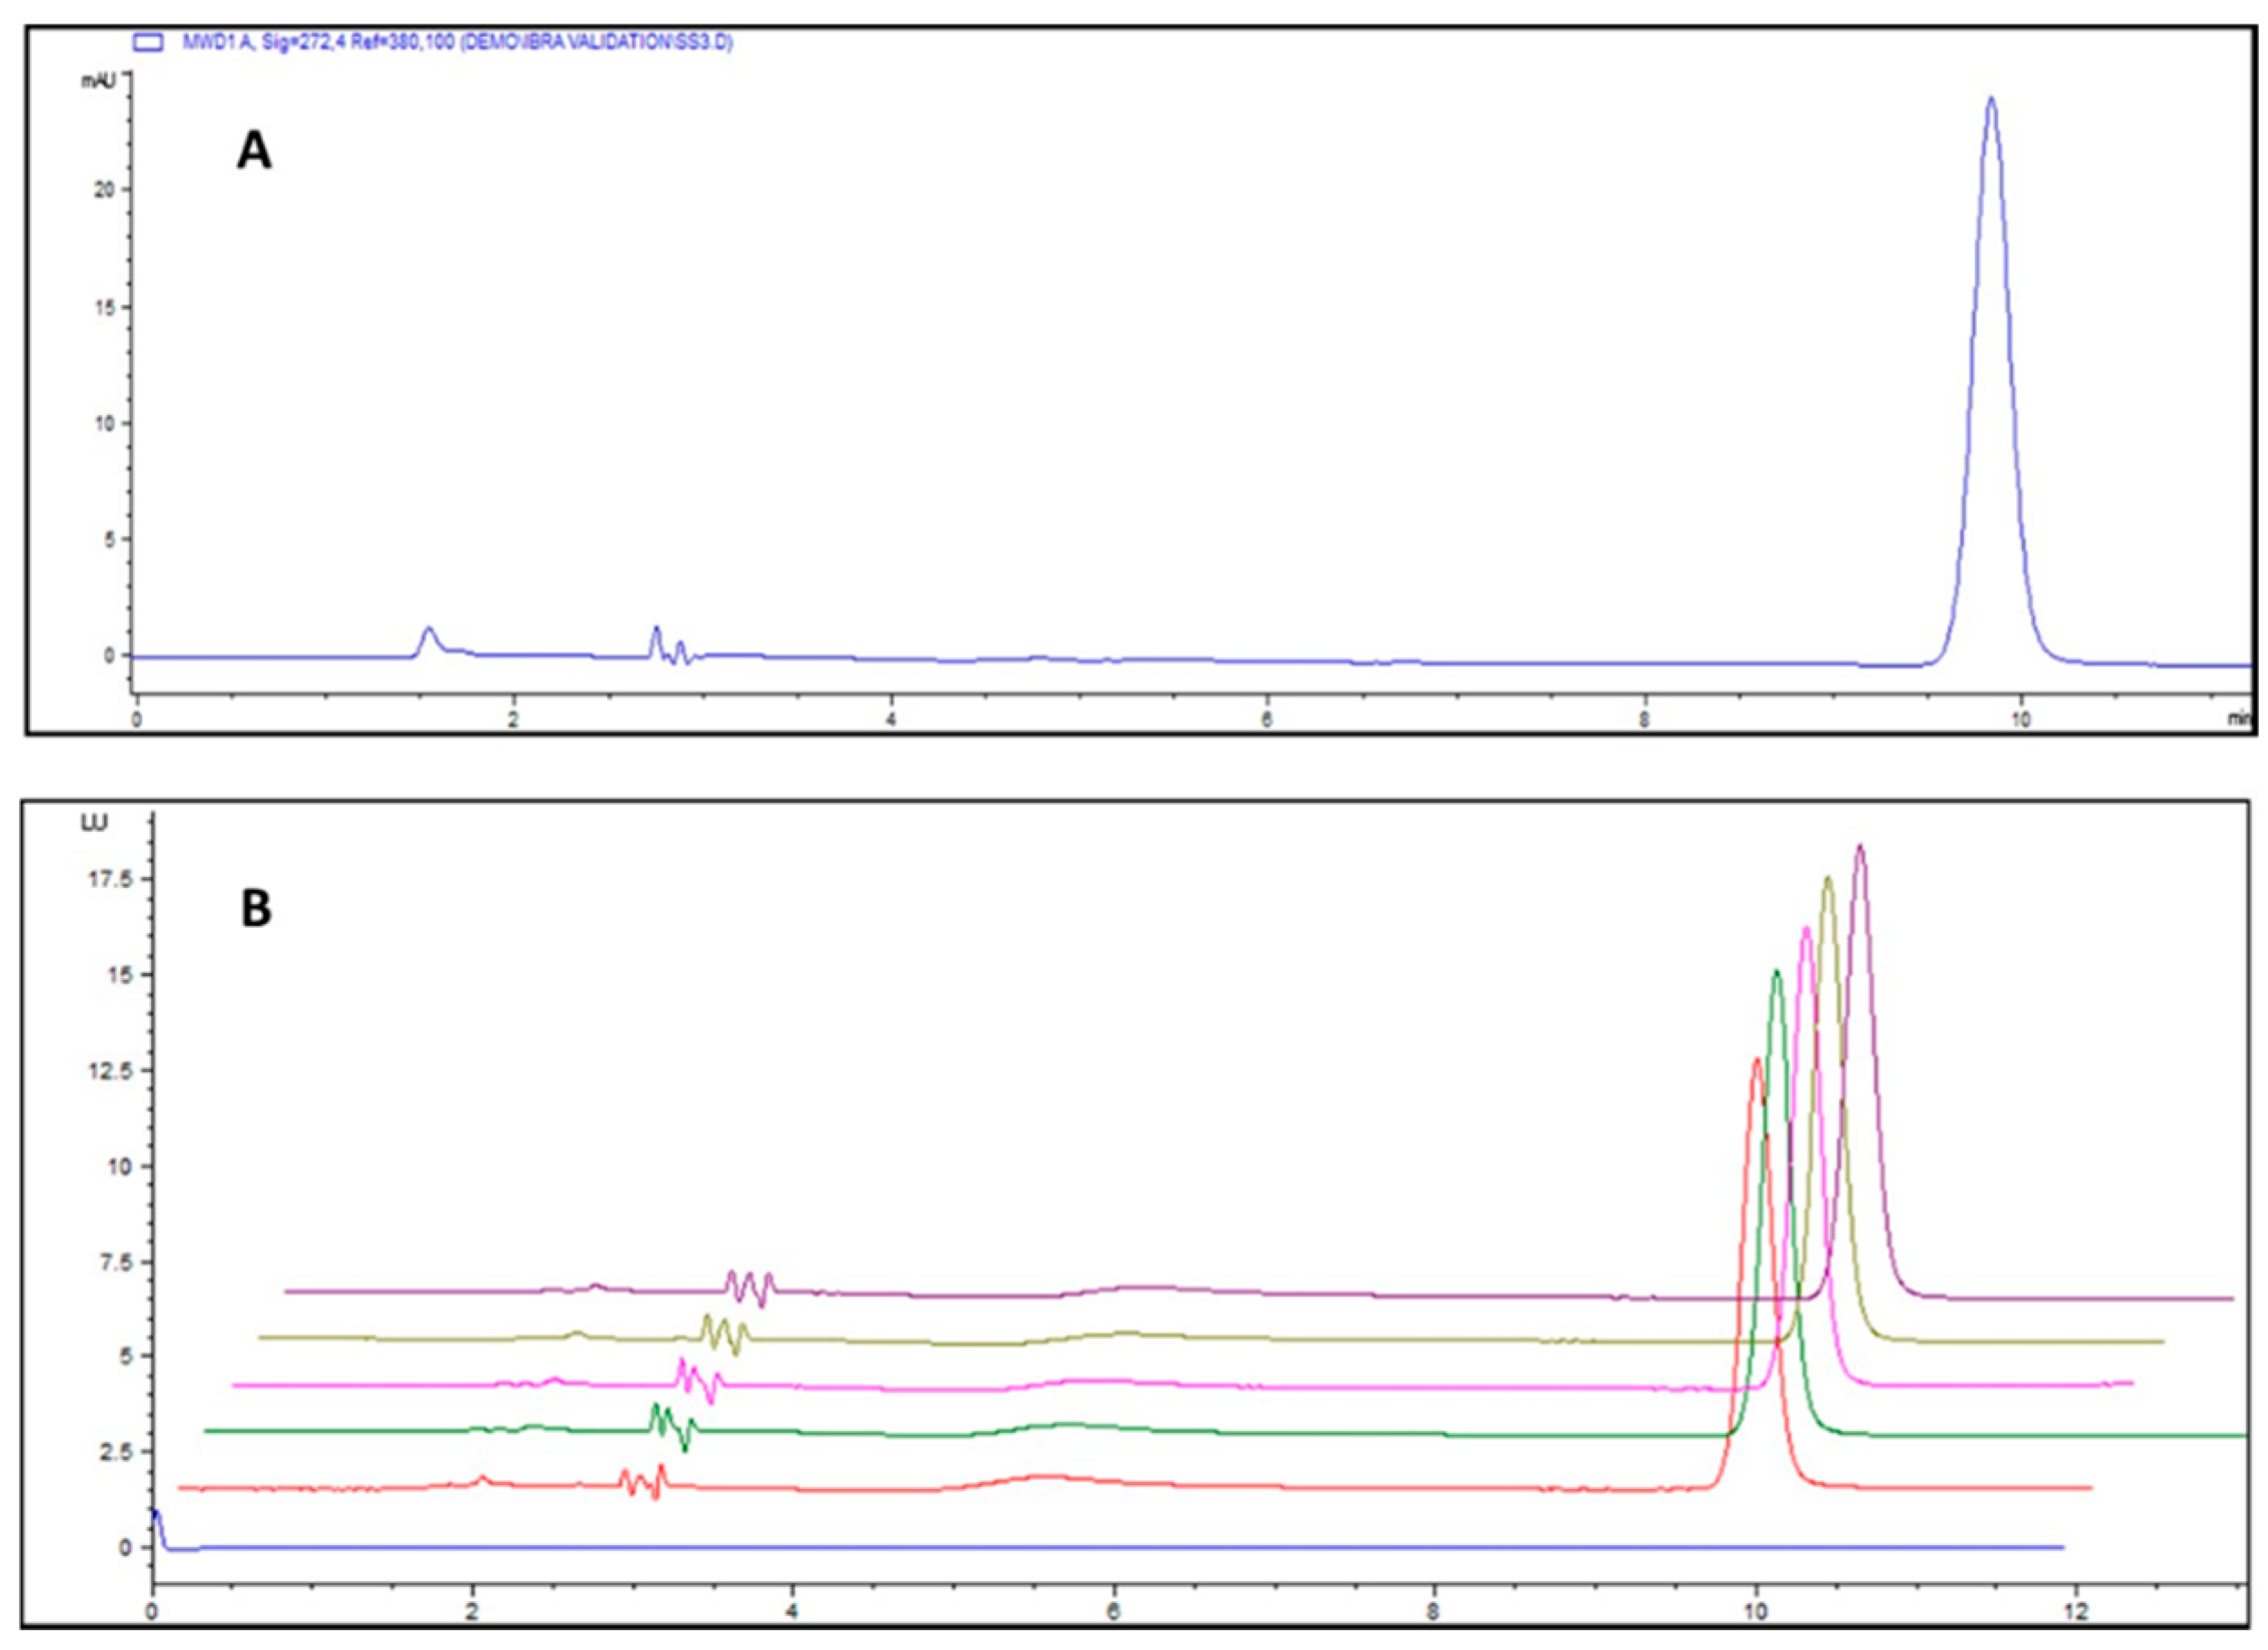
Figure 2.
Calibration curve for caffeine quantification obtained using the validated HPLC–UV method.
Figure 2.
Calibration curve for caffeine quantification obtained using the validated HPLC–UV method.
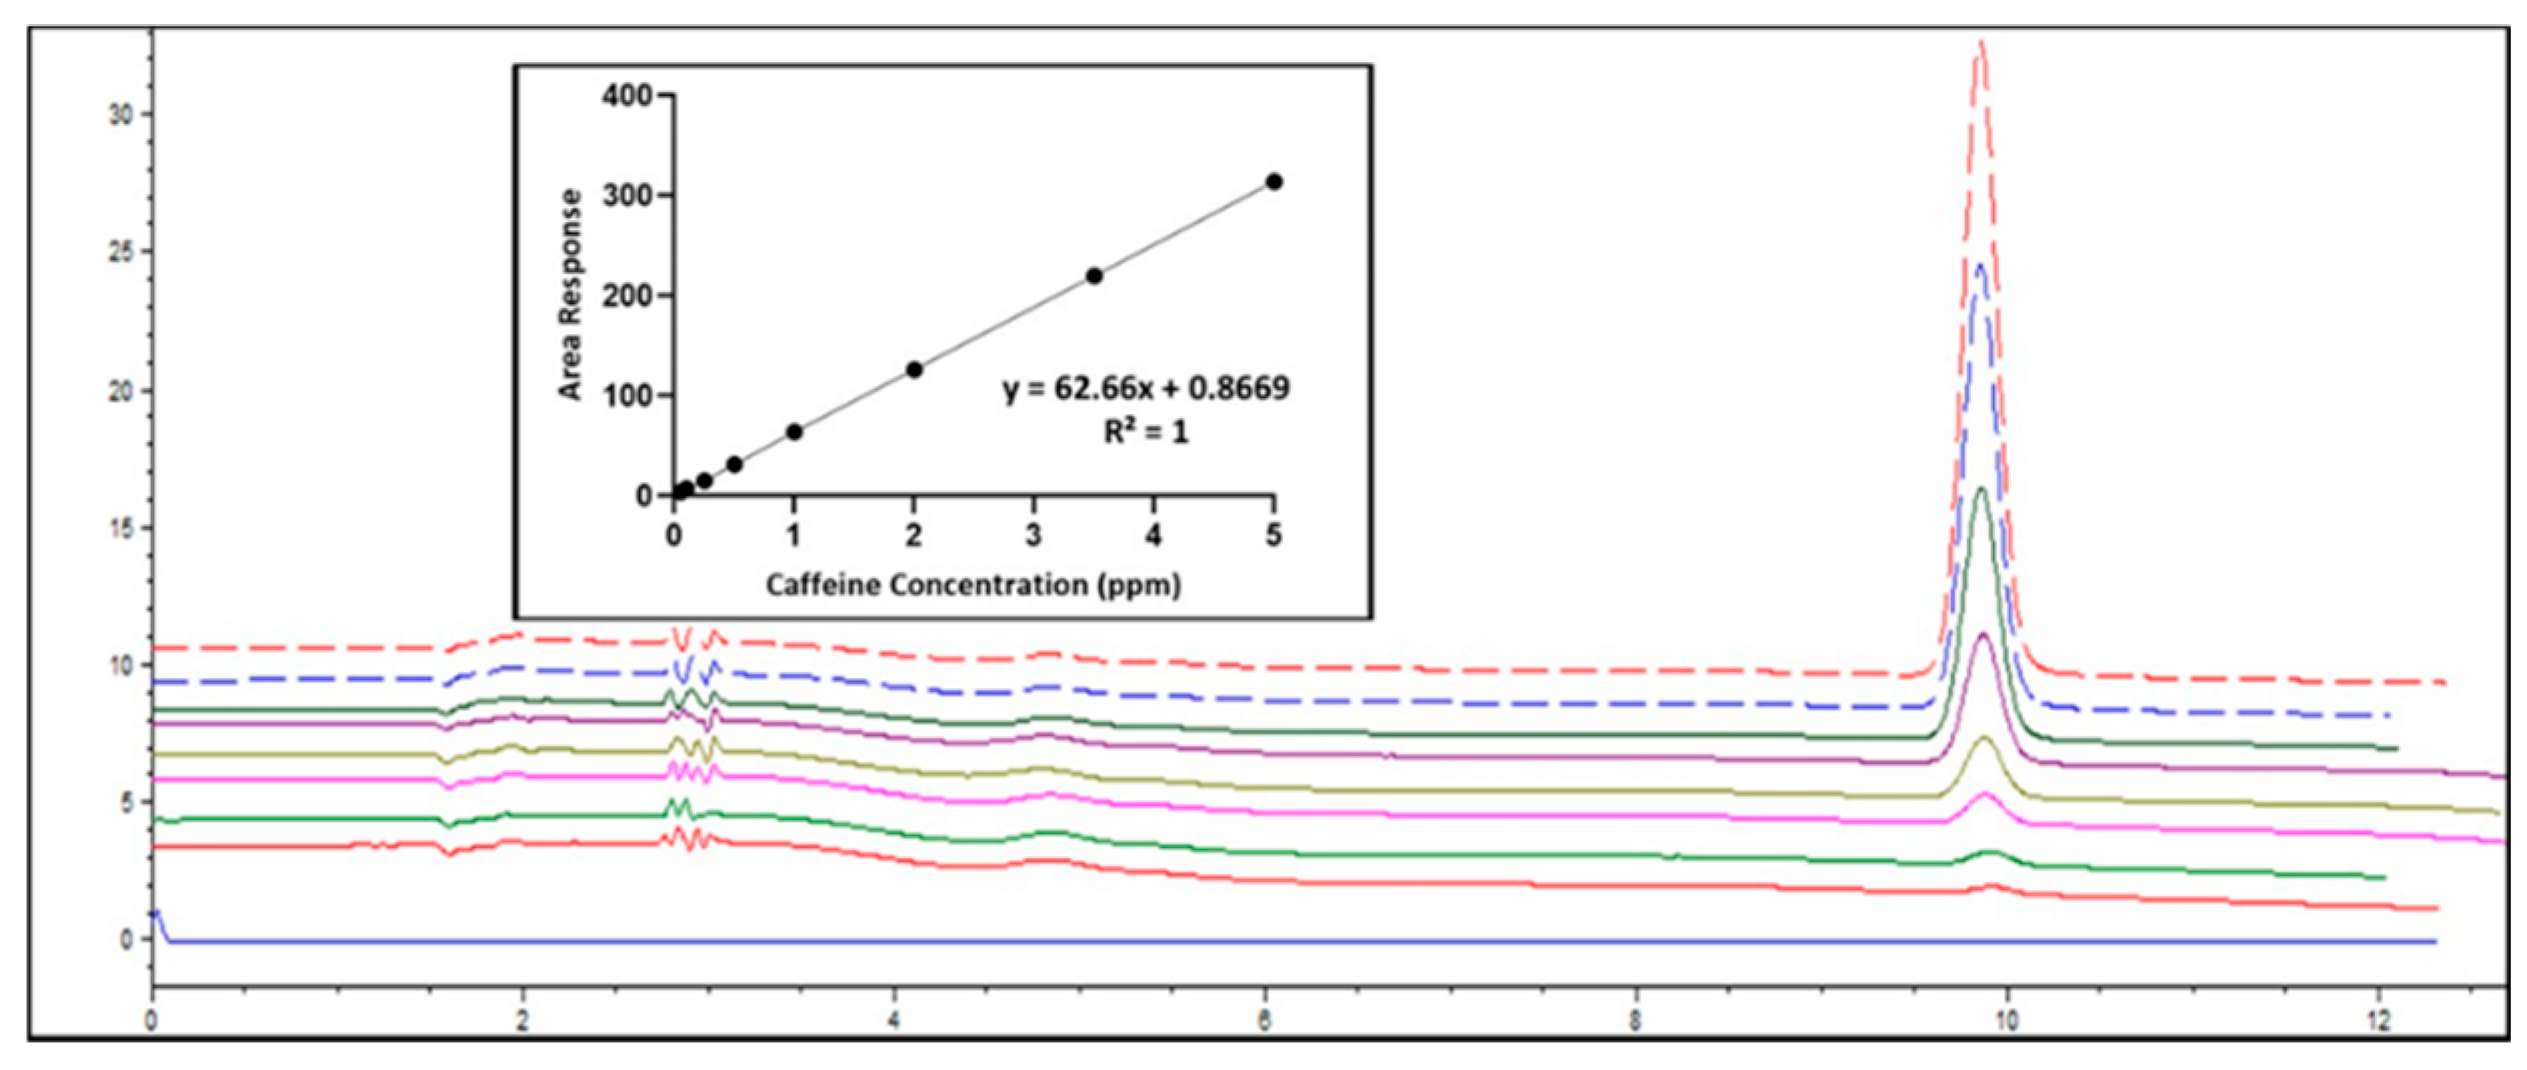
Figure 3.
(A) Repeatability across six replicates of the same coffee sample under identical conditions; (B) intermediate precision assessed on two separate days.
Figure 3.
(A) Repeatability across six replicates of the same coffee sample under identical conditions; (B) intermediate precision assessed on two separate days.
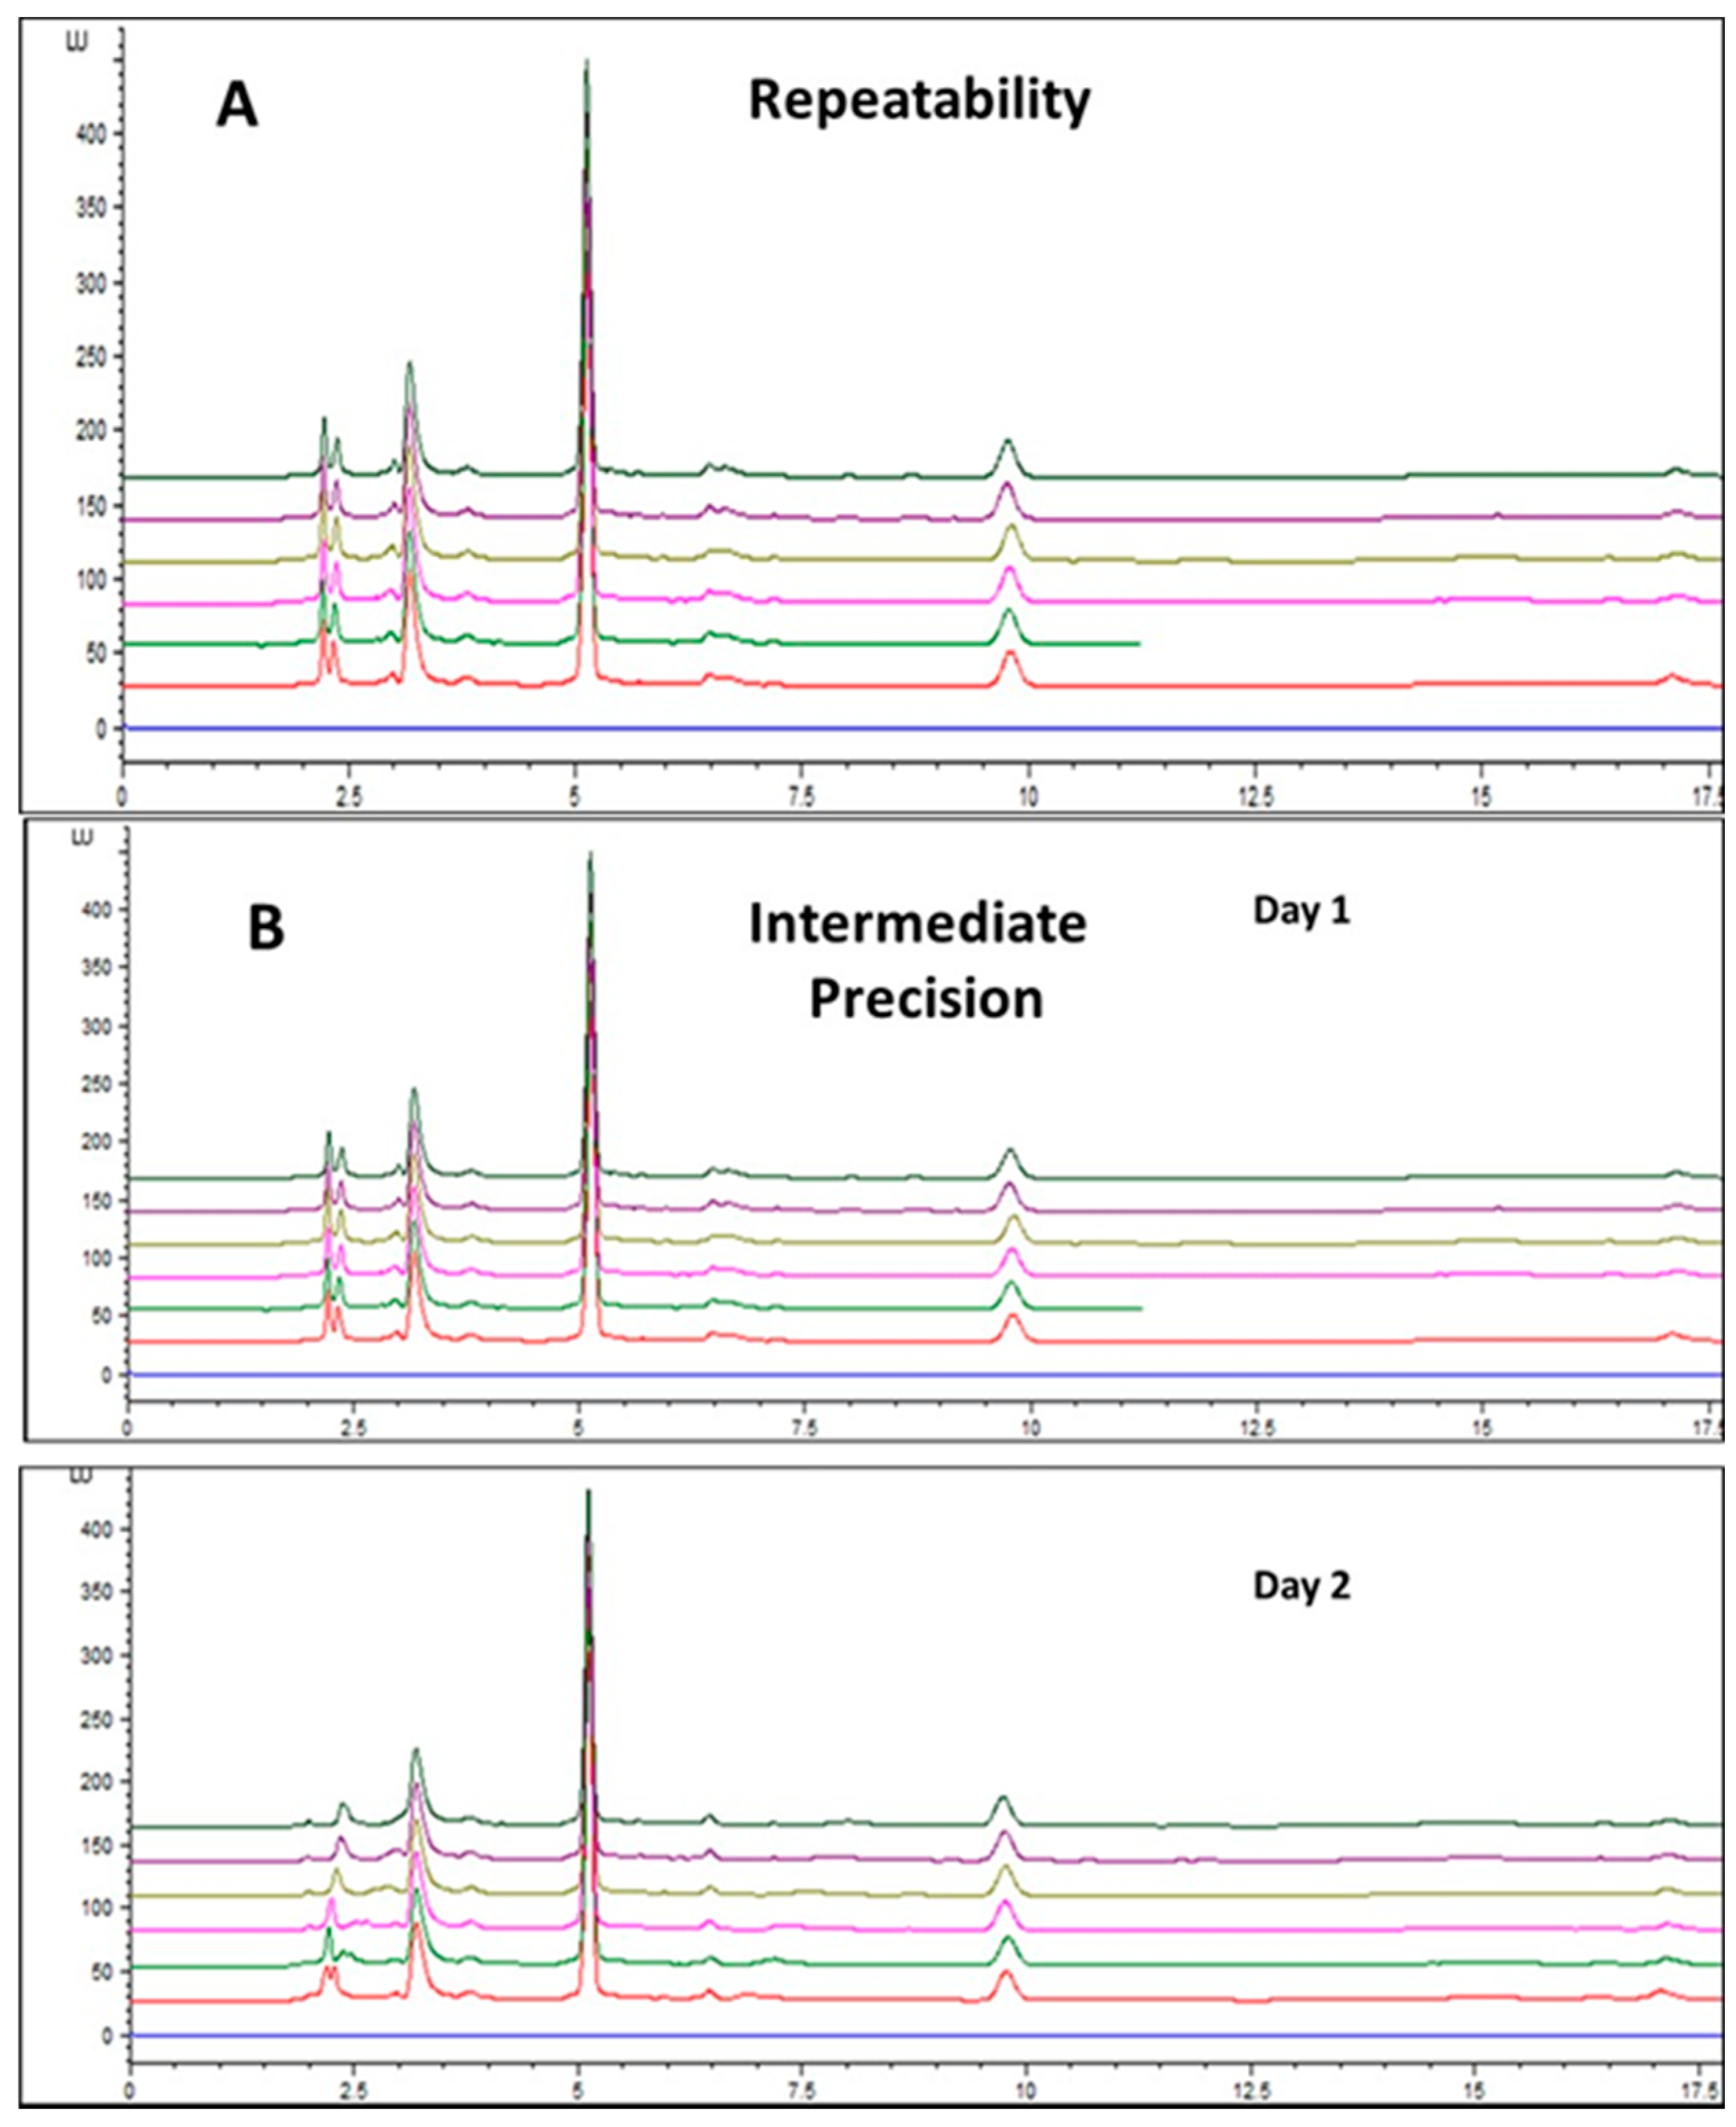
Figure 4.
Chromatographic profiles of coffee extracts prepared (A) without MgO treatment and (B) with MgO treatment.
Figure 4.
Chromatographic profiles of coffee extracts prepared (A) without MgO treatment and (B) with MgO treatment.
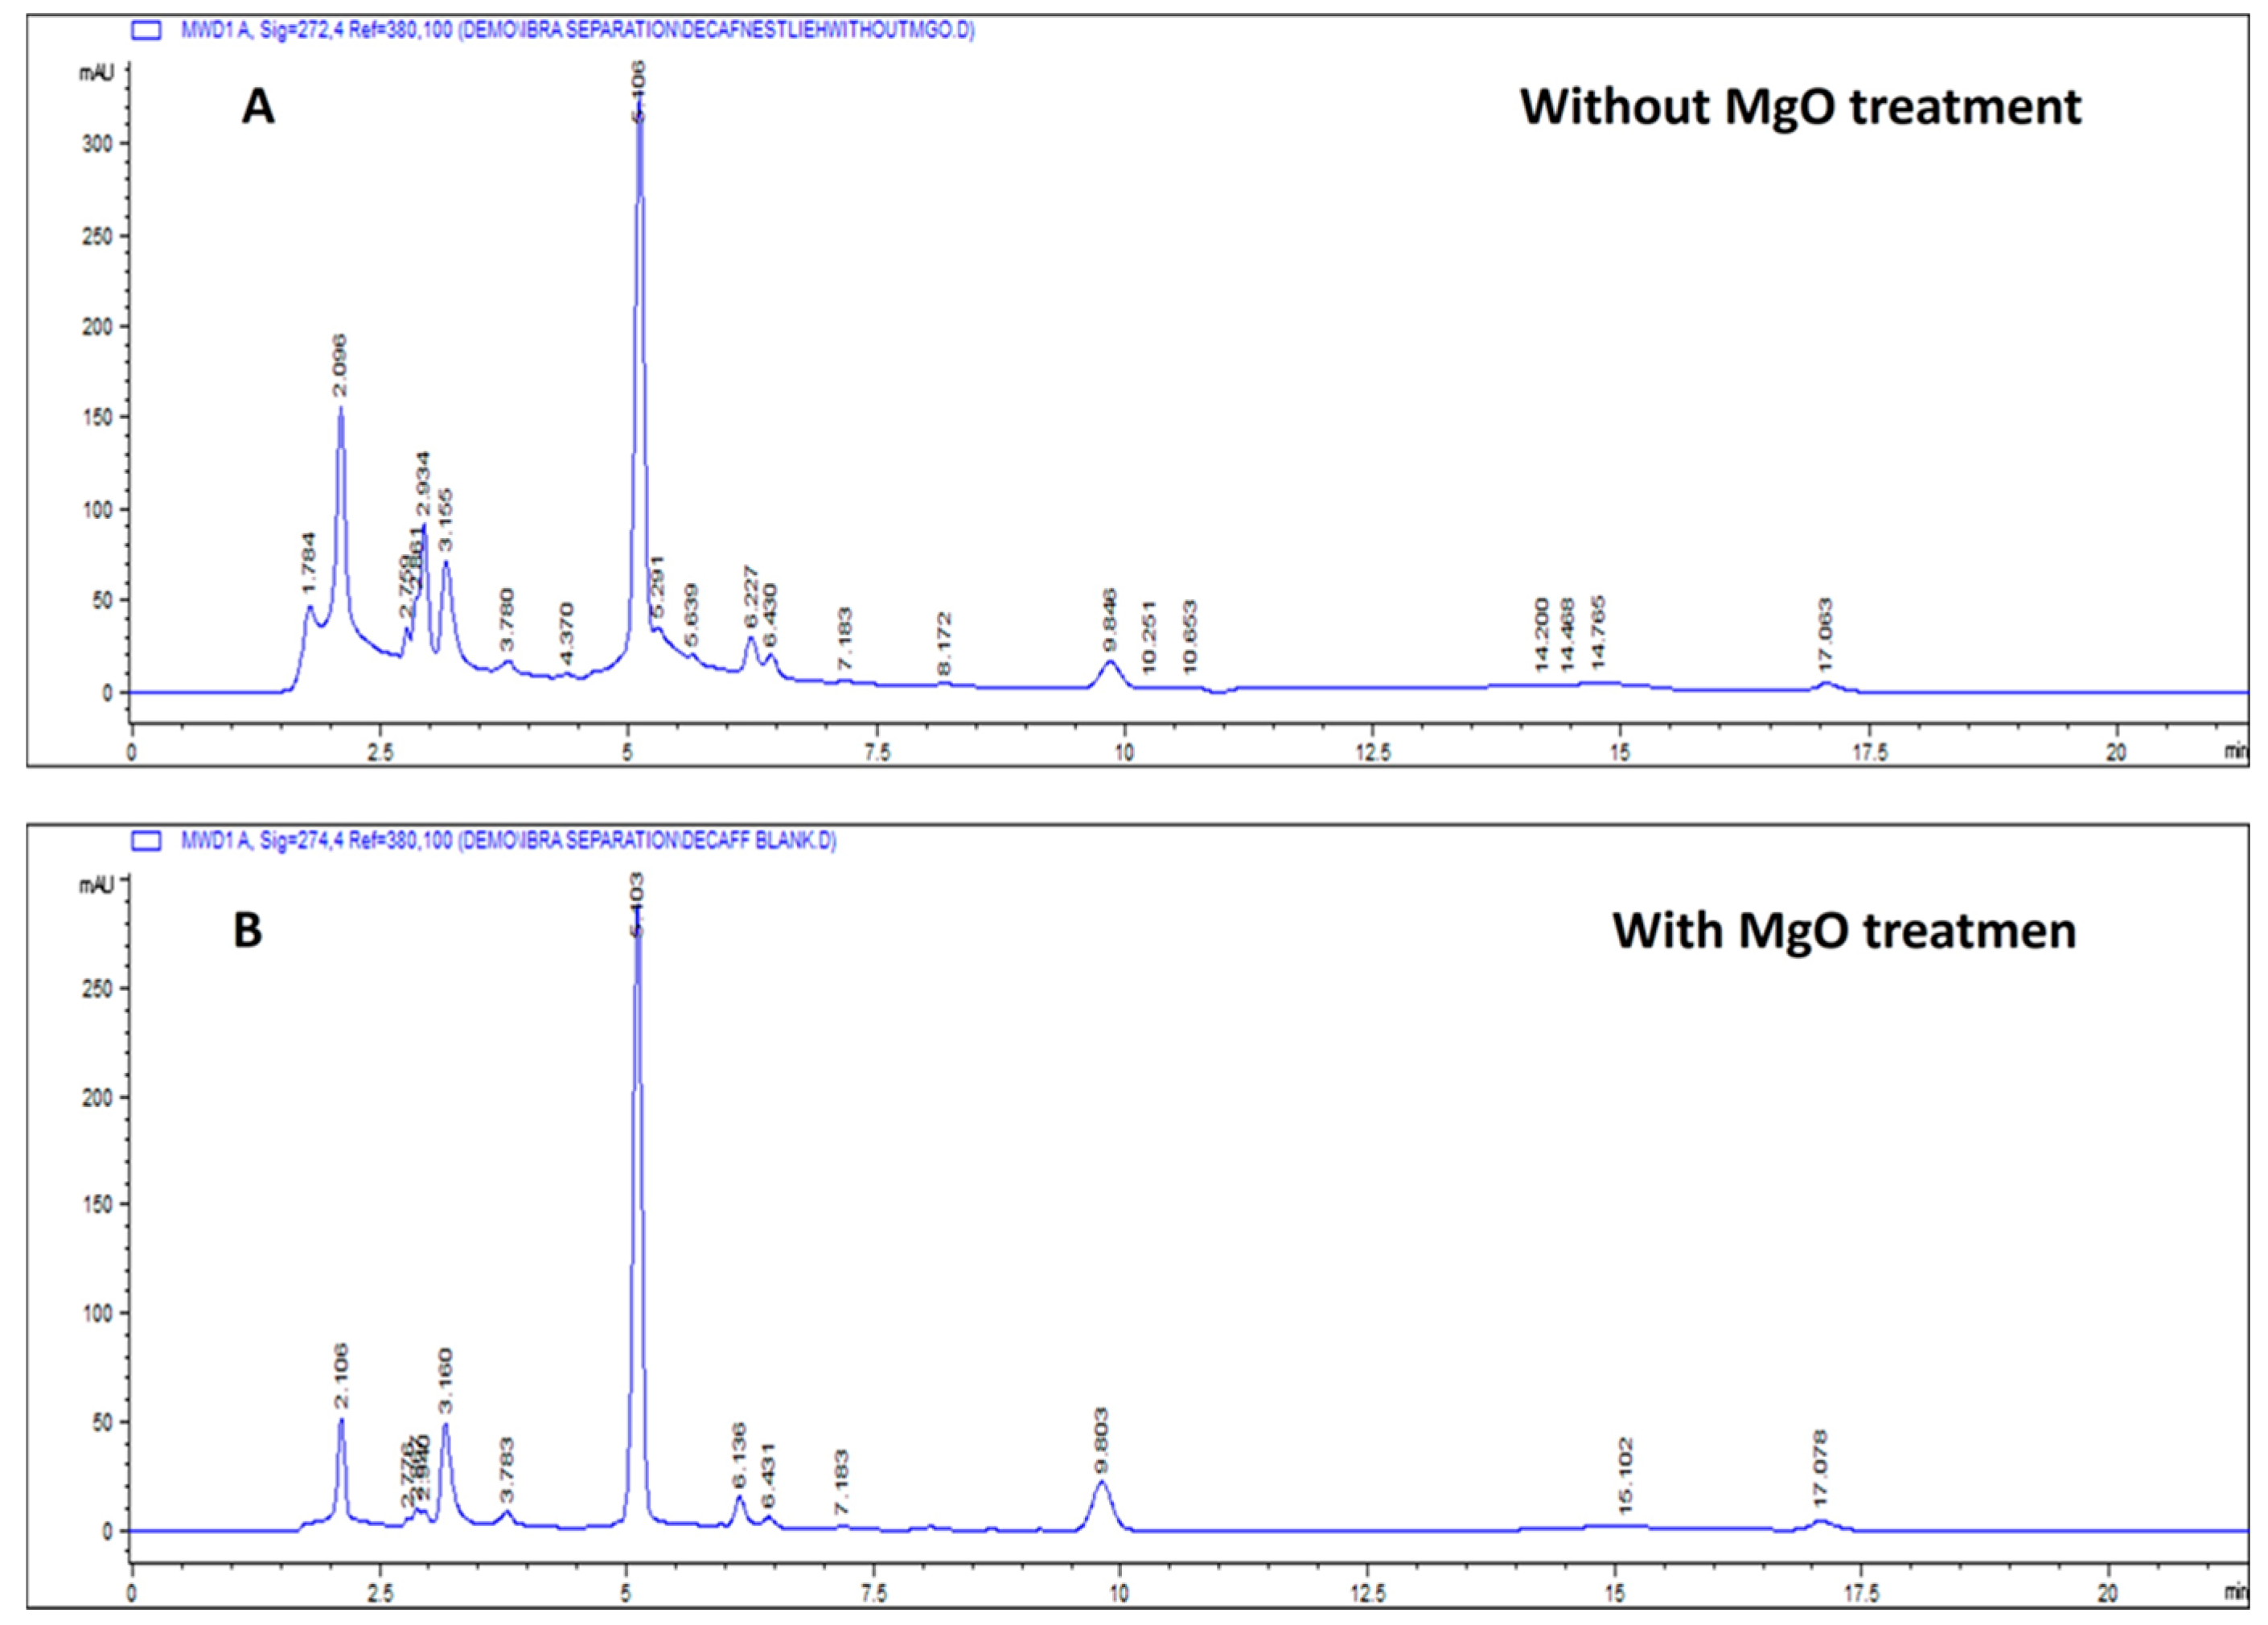
Figure 5.
Residual caffeine concentrations in the analyzed products relative to the 0.1% (w/w) regulatory Limit.
Figure 5.
Residual caffeine concentrations in the analyzed products relative to the 0.1% (w/w) regulatory Limit.
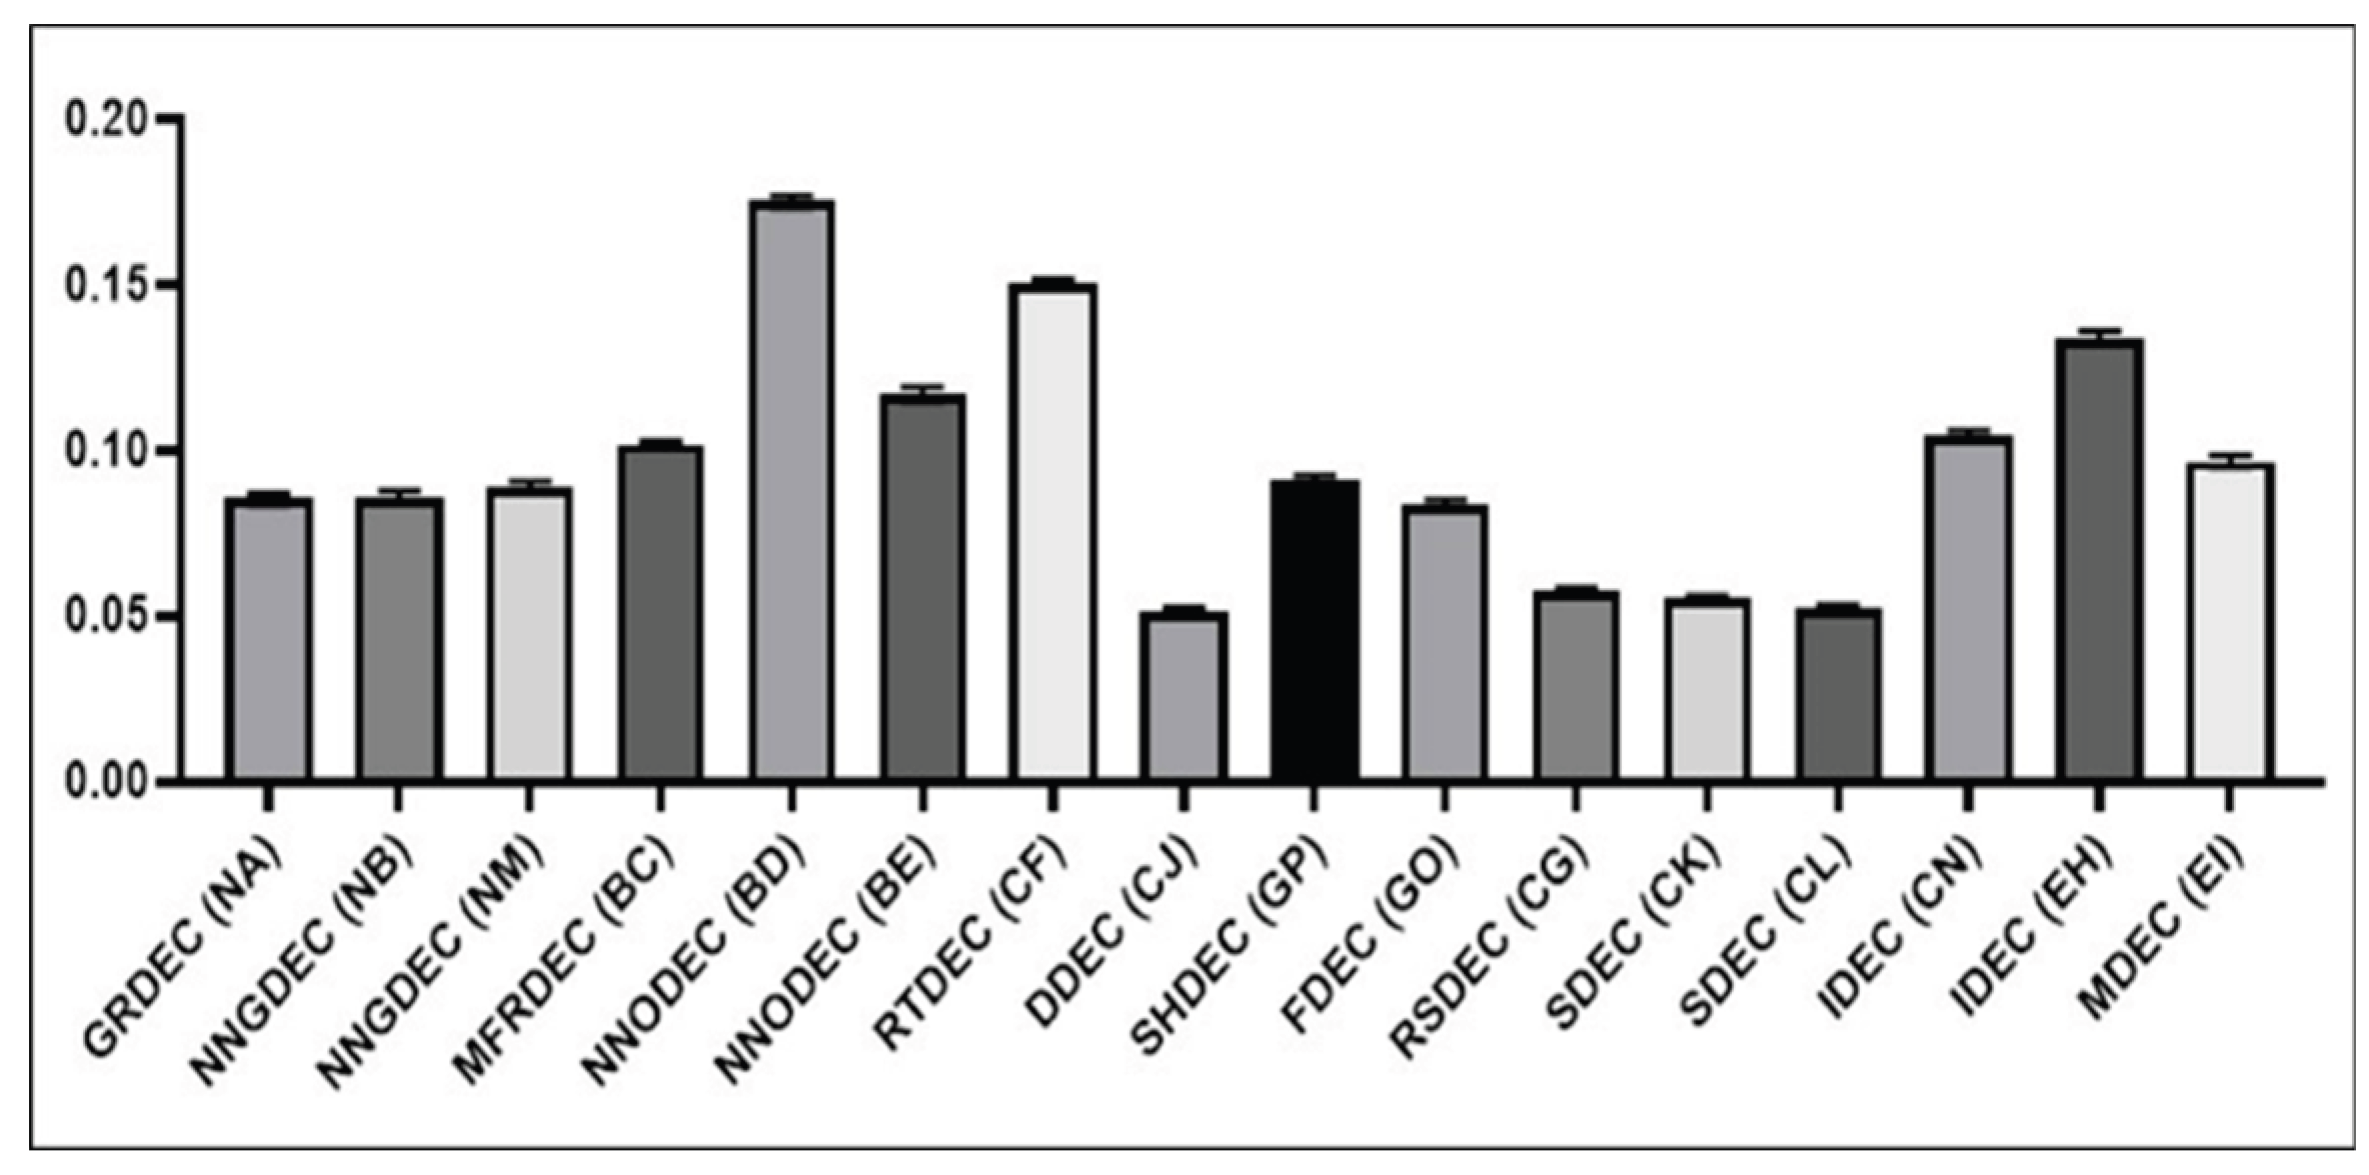

Table 1.
Gradient elution program used for HPLC–UV analysis.
| Time (min) | Water (%) | Methanol (%) |
| 0 | 75 | 25 |
| 1 | 75 | 25 |
| 2 | 60 | 40 |
| 6 | 60 | 40 |
| 10 | 50 | 50 |
| 12 | 10 | 90 |
| 30 | 10 | 90 |
Table 2.
Quantification of residual Caffeine in commercial decaffeinated coffee samples and one-sample t-test results against the regulatory Limit (≤0.1% w/w).
Table 2.
Quantification of residual Caffeine in commercial decaffeinated coffee samples and one-sample t-test results against the regulatory Limit (≤0.1% w/w).
| Product Code | Coffee Category | Rt (min) | Peak Area | Mean Caffeine (w/w %) | SD | RSD (%) | Regulatory Limit (w/w%) | Compliance Status |
| GRDEC (NA) | Instant Coffee | 9.83 | 134.76 | 0.0855 | 0.00168 | 1.96 | ≤0.1 | Compliant |
| NNGDEC (NB) | Instant Coffee | 9.83 | 135.58 | 0.0860 | 0.00165 | 1.92 | ≤0.1 | Compliant |
| NNGDEC (NM) | Instant Coffee | 9.83 | 140.60 | 0.0892 | 0.00165 | 1.85 | ≤0.1 | Compliant |
| MFRDEC (BC) | Instant Coffee | 9.83 | 160.70 | 0.1023 | 0.00108 | 1.06 | ≤0.1 | Non-compliant |
| NNODEC (BD) | Instant Coffee | 9.83 | 275.58 | 0.1754 | 0.00171 | 0.97 | ≤0.1 | Non-compliant |
| NNODEC (BE) | Instant Coffee | 9.83 | 184.14 | 0.1170 | 0.00214 | 1.83 | ≤0.1 | Non-compliant |
| RTDEC (CF) | Ground Coffee (Turkish) | 9.83 | 236.74 | 0.1501 | 0.00183 | 1.22 | ≤0.1 | Non-compliant |
| DDEC (CJ) | Ground Coffee | 9.83 | 81.38 | 0.0514 | 0.00098 | 1.92 | ≤0.1 | Compliant |
| SHDEC (GP) | Ground Coffee | 9.83 | 143.24 | 0.0909 | 0.00165 | 1.81 | ≤0.1 | Compliant |
| FDEC (GO) | Filter Coffee | 9.83 | 132.28 | 0.0839 | 0.00142 | 1.69 | ≤0.1 | Compliant |
| RSDEC (CG) | Saudi Coffee | 9.83 | 90.89 | 0.0575 | 0.00110 | 1.91 | ≤0.1 | Compliant |
| SDEC (CK) | Whole Bean Coffee | 9.83 | 86.43 | 0.0546 | 0.00106 | 1.95 | ≤0.1 | Compliant |
| SDEC (CL) | Whole Bean Coffee | 9.83 | 83.31 | 0.0526 | 0.00090 | 1.73 | ≤0.1 | Compliant |
| IDEC (CN) | Whole Bean Coffee | 9.83 | 164.60 | 0.1045 | 0.00164 | 1.57 | ≤0.1 | Non-compliant |
| IDEC (EH) | Coffee Capsule | 9.83 | 211.30 | 0.1343 | 0.00183 | 1.36 | ≤0.1 | Non-compliant |
| MDEC (EI) | Coffee Capsule | 9.83 | 153.08 | 0.0972 | 0.00143 | 1.47 | ≤0.1 | Compliant |
Regulatory Limit: ≤0.1% residual caffeine (w/w).
Disclaimer/Publisher’s Note: The statements, opinions and data contained in all publications are solely those of the individual author(s) and contributor(s) and not of MDPI and/or the editor(s). MDPI and/or the editor(s) disclaim responsibility for any injury to people or property resulting from any ideas, methods, instructions or products referred to in the content. |
© 2026 by the authors. Licensee MDPI, Basel, Switzerland. This article is an open access article distributed under the terms and conditions of the Creative Commons Attribution (CC BY) license (http://creativecommons.org/licenses/by/4.0/).
Copyright: This open access article is published under a Creative Commons CC BY 4.0 license, which permit the free download, distribution, and reuse, provided that the author and preprint are cited in any reuse.