

Submitted:
02 September 2026
Posted:
20 September 2026
You are already at the latest version
Abstract
Fallen wood is widely recognized as a critical micro-habitat for forest regeneration, yet how its facilitative role varies across ontogenetic stages and what constraints govern its spatial effectiveness throughout the tree life cycle remain poorly understood. This study investigated the spatial associations between Picea schrenkiana populations and fallen wood across four ontogenetic stages in a 6-hm² permanent plot in the West Tianshan Mountains, China. Our results revealed that fallen wood serves as an irreplaceable regeneration substrate throughout the entire life history: 99.6% of seedlings were established on fallen wood, and this dependency remained remarkably high (>78%) even at the adult stage. Spatial point pattern analyses demonstrated stage-specific shifts in tree-fallen wood associations: strong positive correlations at the seedling stage, significant negative correlations at the sapling stage driven by light limitation, multiscale fluctuating associations at the sub-adult stage, and positive correlations at the adult stage—indicating a functional transition from micro-habitat sheltering to historical legacy. Furthermore, after accounting for environmental heterogeneity using heterogeneous Poisson process models, we identified an environmental action scale (EAS) that expanded systematically with ontogeny: from 3.94 m for seedlings to 4.3–8.61 m for saplings, and to approximately 16 m for both sub-adults and adults, reflecting a cascading control mechanism in which local environmental filters and fallen wood micro-habitat interact across ontogenetic stages, driving enhanced physiological tolerance and crown expansion that increase the EAS and ultimately shape population spatial patterns. Notably, EAS exhibited a strict proportional scaling relationship with maximum crown diameter (R² = 0.9839), revealing that population spatial structure is intrinsically constrained by species-specific morphological conservatism. These findings advance our understanding of fallen wood dynamics beyond early recruitment and provide a mechanistic framework for assessing regeneration resilience in montane coniferous forests under climate change.
Keywords:
Picea schrenkiana
; fallen wood
; ontogenetic stage
; spatial point pattern
; environmental action scale
; nurse log
; morphological constraint
1. Introduction
The spatial patterns of plant populations result from the combined effects of environmental filtering and species biological traits. Environmental filtering, acting through abiotic stress, often dominates the spatial distribution patterns of populations [1,2]. In response, species further shape these patterns through morphological and physiological adaptations [3,4]. However, because individuals have distinctly different requirements for environmental conditions and resources at different ontogenetic stages, the relative contributions of environmental filtering and species biological traits are not constant, but rather undergo dynamic shifts across ontogenetic stages [5]. In long-lived forest ecosystems, population spatial patterns begin to form during early stages such as seed dispersal, germination, and establishment [6,7]. At these stages, individuals heavily rely on specific micro-habitats to alleviate environmental stress [8,9,10], and environmental filtering often dominates the spatial patterns of populations [11]. As individuals grow and their physiological tolerance increases, species biological traits may play a more dominant role [12,13]. Therefore, investigating the shift in the relative importance of environmental filtering and species biological traits across different ontogenetic stages throughout the full life history, identifying critical thresholds for individual niche transitions, and predicting population dynamics are of great theoretical and practical significance for understanding the self-organizing mechanisms of forest ecosystems and guiding forest management.
In coniferous forest ecosystems, fallen wood is an important component of the forest regeneration process and serves as a medium for the coupling between environmental filtering and species biological traits. It not only provides a physical substrate for seed germination and seedling establishment, but also facilitates regeneration by alleviating interspecific competition and modulating temperature and humidity [14,15]. For example, in North American western hemlock (Tsuga heterophylla) forests, over 90% of seedlings colonize decaying fallen wood [16]; in post-fire sites in Colorado, seedlings of multiple Pinus species also aggregate significantly around snags and fallen wood [17]. However, current understanding of the role of fallen wood in shaping population spatial patterns remains limited in the following aspects: (1) Whether the role of fallen wood persists throughout the entire life history, and the characteristics of its functional shifts across ontogenetic stages remain unclear; (2) Most studies treat fallen wood as a static factor independent of the environment, neglecting the regulation of environmental filtering on the micro-habitat effects of fallen wood and its action scale, making it difficult to explain why fallen wood regeneration success rates vary drastically across different environmental backgrounds; (3) Although environmental filtering and species biological traits are recognized as the two core processes shaping population spatial patterns, the direct link between them has long been constrained by the lack of reliable quantitative indicators, limiting the in-depth understanding of the mechanisms underlying population spatial pattern formation; (4) In the context of global climate change, especially given the significant warming and humidification trend in the Tianshan Mountains [18,19], whether a critical threshold exists in the fallen wood–environment coupling relationship, and how it affects the long-term maintenance resilience of populations, remains unknown. These limitations restrict our in-depth understanding of the regeneration mechanisms of montane coniferous forests and hinder the development of targeted management measures.
Picea schrenkiana is the foundation species of the forest ecosystem in the Tianshan Mountains of Xinjiang, and its natural regeneration capacity directly determines the sustainable development potential of the forest ecosystem in this region. In the P. schrenkiana forests of the West Tianshan National Nature Reserve, large amounts of fallen wood are widely distributed, and seedlings are generally aggregated on the fallen wood, suggesting that fallen wood plays an important role in forest regeneration. However, whether the influence of fallen wood on the spatial patterns of P. schrenkiana populations persists throughout the full life history, how environmental filtering regulates this influence and at what spatial scale, and the specific manifestations of life-history constraints remain systematically unstudied. Based on this, the present study takes a 6-ha permanent plot of typical P. schrenkiana forest in the western Tianshan Mountains as a platform, and comprehensively applies spatial point pattern analysis and micro-habitat field measurements to systematically analyze the dynamic changes in population spatial patterns and tree–fallen wood spatial associations across different ontogenetic stages, and to quantify the effective action scale of environmental filtering on fallen wood micro-habitats and its variation across ontogenetic stages. This study aims to clarify the coupling mechanism between environmental filtering and species biological traits, reveal the dominant factors shaping population spatial patterns, and provide a theoretical basis and management support for evaluating and enhancing the regeneration resilience of montane coniferous forests in the Tianshan Mountains under the context of warming and humidification.
2. Materials and Methods
2.1. Study Area
The study area is located in the West Tianshan National Nature Reserve in Gongliu County, Ili Kazakh Autonomous Prefecture, Xinjiang Uygur Autonomous Region (82°51′–83°06′ E, 43°03′–43°15′ N), situated at the northern foothills of the Nalati and Yishigelike Mountains. The reserve extends 28 km from north to south and 14 km from east to west, with a total area of 31,217 ha. The region has a typical continental monsoon climate, with a mean annual temperature of 2.7 °C, a mean temperature in January of −10.6 °C, and a mean temperature in July of 11 °C. The annual precipitation is as high as 800–1000 mm, making it the region with the highest precipitation in Xinjiang, where P. schrenkiana forests are well developed [20].
2.2. Plot Establishment
This study was conducted in a permanent plot established by the Xinjiang West Tianshan Forest Ecosystem Observation and Research Station. The plot is under standardized management, with no long-term anthropogenic disturbances such as grazing or tourism, and the P. schrenkiana forest is in a state of natural succession. The plot measures 200 m × 300 m (6 ha) and is evenly divided into 150 grids of 20 m × 20 m each. The plot is located on a semi-shady slope, with its short sides parallel to the ridge direction and its long sides extending along the slope aspect, thereby forming a complete environmental gradient from the bottom to the top of the slope (Figure 1). The soil within the plot is montane leached cinnamon soil, with deep and moist soil layers suitable for the growth of P. schrenkiana [21]. The understory herbaceous vegetation coverage is extremely high, reaching 90%–100%, and the dominant herbaceous plants include Impatiens aquatilis and Aegopodium alpestre.
To understand the relationship between fallen wood and P. schrenkiana regeneration, six subplots of 60 m × 60 m each were established along a 300-m-long environmental gradient transect within the plot, at 100-m intervals. Each subplot was formed by merging nine adjacent 20 m × 20 m grids.
2.3. Field Survey
1) Environmental factor measurements
Topographic factors such as elevation, slope, and aspect were measured at the center of each grid. Three microclimatic indicators, including light intensity, air temperature, and humidity, were also recorded. Simultaneously, fallen wood micro-habitats were investigated. To address the uneven distribution of fallen wood (sparse at the ridge top and dense at the slope bottom), we conducted stratified sampling within the subplots based on decay classes (Classes III, IV, and V, following international standards). A total of 113 fallen wood pieces were investigated (12 in the ridge-top subplots, 35 in the mid-slope subplots, and 66 in the slope-bottom subplots). In July of the same year, 2–3 measurement points were selected along each fallen wood piece based on its length. At these points, temperature, moisture content, electrical conductivity (Yuntang, YT-WSYP) and Photosynthetically Active Radiation (PAR) (Apogee, MQ-500) of the fallen wood surface, side, and the soil within 1 m were measured, along with to characterize the hydrothermal conditions of the fallen wood micro-habitat. For some completely decomposed Class V fallen wood, micro-habitat indicators of the side were not measured.
2) Investigation of P. schrenkiana population regeneration
① Frequency statistics of fallen wood regeneration. The presence/absence data of regenerating individuals at different ontogenetic stages on fallen wood of different decay classes within each subplot were recorded. A total of 67 fallen wood pieces were investigated across the slope-bottom, mid-slope, and ridge-top subplots, with 31, 20, and 16 pieces, respectively.
② Comparison of regeneration on different substrates. The number of individuals regenerating on fallen wood versus on the ground was investigated. The target sample size for each ontogenetic stage was set at 180 individuals (30 per subplot). Due to the extremely low occurrence of seedlings on the ground and the large order-of-magnitude difference, seedlings were excluded from this comparative analysis. Only saplings, sub-adults, and adults were investigated. In the actual survey, the sample sizes for adults (n = 184) and sub-adults (n = 224) met the expected numbers. Due to the extremely low natural density of saplings in the understory, 118 valid individuals were obtained after searching the core area and a 50-m homogeneous buffer zone around it, meeting the minimum statistical power requirement for inter-group comparisons.
3) Acquisition of individual spatial coordinates
For seedlings, coordinates were determined using RTK (Real-Time Kinematic), and crown width, basal diameter, and tree height were measured. The coordinates and diameters of the top and bottom ends of the fallen wood were recorded. For saplings and above, a backpack LiDAR (Light Detection and Ranging) system was used to acquire 3D point cloud data. Outlier filtering and ground point classification were performed using CloudCompare version 2.14. The 3DFin plugin was used for elevation normalization and individual tree segmentation. The segmentation results were manually checked and corrected to address issues such as adjacent crown adhesion, mis-segmentation, and missed segmentation of individual trees. Finally, the spatial coordinates, crown width, DBH, and tree height of each individual tree were obtained.
2.4. Data Analysis
1) Ontogenetic stage classification and coordinate processing
Considering the difficulty in obtaining age data and the high correlation between DBH and age, this study classified individuals into ontogenetic stages based on the established DBH-classification standard [22]: seedlings (DBH ≤ 5 cm), saplings (5 cm < DBH ≤ 15 cm), sub-adults (15 cm < DBH ≤ 30 cm), and adults (DBH > 30 cm). In the spatial point pattern analysis, the coordinates of fallen wood were taken as the mean of the coordinates of its top and bottom ends (i.e., the geometric center), which were used to analyze the spatial distribution pattern of fallen wood itself and its spatial associations with individuals at different stages.
2) Statistical description and tests
The presence/absence data of individuals at each stage on fallen wood of different decay classes were tallied as occurrence frequencies and converted to percentages (since a single fallen wood piece can host individuals from different stages, the sum of percentages across stages may exceed 100%). A Chi-square test was used to examine the relationship between decay class and individual occurrence count. Due to the abundance of zeros and small sample sizes, Fisher’s exact test (Cramér’s V) was further applied [23], and the significance was tested using 100,000 Monte Carlo simulations. When comparing regeneration differences between fallen wood and ground substrates, relative percentages rather than absolute numbers were used. Given the large number of zeros and the skewed distribution of the data, descriptive statistics were reported as median and interquartile range (IQR). The non-parametric Kruskal-Wallis test was used for significance testing, and post-hoc multiple comparisons were conducted using Dunn’s test with Bonferroni correction [24].
3) Spatial point pattern analysis
Ripley’s L(r) function based on individual tree coordinates was selected as the spatial distribution statistic to analyze population spatial patterns and their association patterns at different scales. To remove the influence of environmental heterogeneity, both single-stage pattern analysis and inter-stages association analysis simultaneously adopted Complete Spatial Randomness (CSR) and Heterogeneous Poisson Process (HPP) as null models for comparison. To quantify the impact of environmental heterogeneity on the spatial patterns of P. schrenkiana populations, Principal Component Analysis (PCA) was conducted to extract mutually orthogonal composite environmental gradients. The initial environmental dataset included six variables: elevation, slope, aspect, light intensity, air humidity, and air temperature. Among these, light intensity showed an extremely right-skewed distribution with many extremely high values. If included in the model, it would greatly mask the information carried by other environmental factors. Therefore, it was treated as an independent local driving factor to separately test its contribution to the spatial pattern of saplings. Since topographic factors showed no significant correlation with other environmental factors (p> 0.05), three variables—elevation, air temperature, and air humidity—were ultimately retained for PCA to characterize the fundamental environmental gradient of hydrothermal conditions in the Tianshan Mountains [25]. The correlation coefficients among all retained variables were below 0.6, indicating no severe collinearity (Table S1 and Table S2).
PCA was performed based on standardized environmental data. The first principal component (PC1) explained 47.7% of the total variance, with high positive loadings on elevation (0.749) and air humidity (0.647), representing a topography–moisture coupling gradient. The second principal component (PC2) explained 42.4% of the variance, dominated by air temperature (loading = −0.836), representing a thermal gradient independent of topography (Table S3). The cumulative explained variance of the first two axes reached 90.1%, adequately capturing the environmental structure of the study area. These two principal components were incorporated as environmental covariates into the HPP model to fit the environmental background intensity function λ(u), thereby testing the spatial association between fallen wood and trees at different ontogenetic stages after removing large-scale environmental trends. All spatial point pattern analyses were based on 199 Monte Carlo simulations. The spatial distribution pattern (for single species: aggregated, random, or uniform) or association type (for fallen wood-tree: positive, negative, or no association) and their significant scales were determined by comparing the observed values with the positions of the simulation envelopes [26].
All statistical analyses were conducted in R version 4.6.3. Spatial analyses were performed using the spatstat package [27], and figures were produced using the ggplot2 package. Significance levels were set at p< 0.05, p< 0.01, and p< 0.001.
3. Results
3.1. Spatial Distribution Characteristics of P. schrenkiana and Fallen Wood
The distributions of P. schrenkiana individuals at various life-history stages and fallen wood within the plot exhibited significant spatial heterogeneity. A total of 2006 seedlings were recorded, of which 2000 were distributed on fallen wood. Among the 447 fallen wood pieces in total, 121 were colonized by seedlings, accounting for 27.07%. Both seedlings and fallen wood were concentrated in the middle-to-low elevation areas of the plot, and their densities generally decreased with increasing elevation. The numbers of saplings and sub-adults were relatively low, with 101 and 194 individuals, respectively. Saplings showed obvious spatial aggregation and were distinctly concentrated in the high-elevation areas in the southern part of the plot, indicating strong microhabitat dependence. Adults were the most widely distributed and numerically dominant, with a total of 1075 individuals, and exhibited an obvious aggregated pattern in local areas. Overall, this spatial distribution characteristics reflects a non-equilibrium dynamic process of the P. schrenkiana forest driven jointly by environmental filtering and historical events (Figure 1 and Figure 2).
3.2. Regeneration on Fallen Wood and Its Relationship with Decay Class
Populations at all ontogenetic stages within the study area showed a high proportion of regeneration on fallen wood, demonstrating a strong dependence on fallen wood. Specifically, the median proportion of fallen wood regeneration for saplings was 78.78% (IQR = 70.00–90.88%), and for sub-adults it was 81.38% (IQR = 73.33–91.67%). Although it decreased slightly at the adult stage, the median remained at a high level of 78.33% (IQR = 69.17–81.18%) (Figure 3A).
Statistical tests indicated a strong correlation between the occurrence frequency of trees at different ontogenetic stages and fallen wood decay class (χ² = 69.58, p < 0.001; Cramér’s V = 0.637, p < 0.001) (Table 1). On Class III fallen wood, the composition was almost entirely seedlings, with an occurrence frequency of 100% in all subplots (IQR = 100.00–100.00%), and no saplings, sub-adults, or adults were recorded. On Class IV fallen wood, seedlings still dominated, but their frequency began to decline (median = 75.00%, IQR = 66.67–83.33%). Meanwhile, saplings appeared for the first time on some fallen wood pieces (median = 16.67%, IQR = 0.00–16.67%), and a few adults were also recorded (0.00%, 0.00–16.67%). By Class V, a fundamental shift in the regeneration pattern occurred. The frequency of seedlings dropped sharply to near disappearance (median = 5.00%, IQR = 0.00–6.67%), while adults became the absolutely dominant component (64.29%, 55.00–73.33%), and sub-adults also occurred consistently with relatively high frequencies (28.57%, 20.00–60.00%) (Figure 3B).
In summary, fallen wood serves not only as a critical seedbed for seedling establishment, but alsobut also as an important substrate influencing the P. schrenkiana population across ontogenetic stages from seedling to adult. Its ecological function exhibits distinct dynamic matching characteristics with decay degree and ontogenetic stage.
3.3. Diameter-Class Structure of P. schrenkiana and Fallen Wood
The diameter-class structure of P. schrenkiana populations varied significantly across ontogenetic stages. For seedlings, the mean basal diameter (BD) was 0.12 cm, with current-year individuals dominating; those with BD < 0.2 cm accounted for 91.9%. The probability density curve showed an extremely unimodal, left-skewed distribution (skewness = 14.59, kurtosis = 277.78), reflecting a highly aggregated small-size characteristic. As the population developed, the diameter distributions of saplings and sub-adults gradually became more even. The skewness values of their probability density curves were both negative, at −0.49 and −0.08, respectively, and kurtosis dropped to the lowest levels across the entire life history (2.16 and 1.95), presenting a flat bimodal pattern. Upon reaching the adult stage, the diameter distribution returned to a unimodal pattern, mainly ranging from 50 to 82 cm (49.95%), with the probability density curve becoming right-skewed (skewness = 1.19, kurtosis = 5.71). In addition, the diameter-class distribution of fallen wood closely resembled that of adults (skewness = 1.27, kurtosis = 5.49), further confirming the intrinsic link between the two in the population dynamic process (Table 2, Figure 4).
3.4. Micro-Habitat Characteristics of Fallen Wood
The moisture content and electrical conductivity of fallen wood at all decay classes were lower than those of the adjacent soil. For Class III fallen wood, the median moisture content and electrical conductivity at the top were 19.20% (IQR = 11.00–32.80) and 18.00 μs/cm (IQR = 7.00–31.00), respectively, while those of the surrounding soil were 29.45% (IQR = 22.00–38.00) and 54.00 μs/cm (IQR = 30.00–77.00). In contrast, the temperature and light at the top of fallen wood were higher than those of the adjacent soil. For Class III fallen wood, the temperature at the top reached 23.53 °C (IQR = 21.32–25.70), and the photosynthetically active radiation (PAR) was 28.00 μmol/(m²·s) (IQR = 9.00–36.00). These values were 44.32% and 154.55% higher than the soil temperature (19.40 °C, IQR = 17.65–20.26) and PAR (11.00 μmol/(m²·s), IQR = 5.00–22.00), respectively. However, there were generally no significant differences between the top and side of fallen wood, except that the temperature at the top of Class IV fallen wood was significantly higher than that at the side. These results reflect the micro-habitat characteristics of fallen wood, which feature high temperature, high light, low moisture, and low nutrient availability.
Furthermore, the micro-habitat effect of fallen wood weakened with increasing decay class, as indicated by the narrowing IQR differences among positions. Notably, the temperature and PAR at Class V approached those of the adjacentsoil. The temperatures at the top of fallen wood and in the soil were 20.26 °C (IQR = 19.33–21.45) and 18.71 °C (IQR = 17.90–20.05), respectively, while the PAR values were 14.00 μmol/(m²·s) (IQR = 5.00–25.00) and 7.00 μmol/(m²·s) (IQR = 4.00–15.00) (Figure 5).
3.5. Scale-Dependent Spatial Associations Between P. schrenkiana and Fallen Wood
At spatial scales of 0–50 m, P. schrenkiana populations at all ontogenetic stages exhibited significant aggregated distributions, which were not constrained by environmental factors, as no distinct difference was observed between the heterogeneous Poisson process (HPP) model and the complete spatial randomness (CSR) model. From seedlings to adults, the aggregation intensity showed a decreasing trend. Seedlings and saplings displayed strong aggregation, whereas sub-adults and adults only showed weak aggregation (Figure 6). Fallen wood also exhibited a relatively weak aggregated distribution (Figure 7).
The spatial association between regenerating trees and fallen wood also showed distinct ontogenetic stage specificity and pronounced scale dependence. Based on the HPP model, the spatial association analysis between seedlings and fallen wood revealed that at scales of r> 3.94 m, the positive spatial association remained significant after removing the influence of environmental heterogeneity. However, at small scales of 0–3.94 m, the environmental-corrected spatial association was not significant. In contrast, under the CSR model without environmental correction, seedlings and fallen wood showed a significant positive association across all scales (Figure 8A, E). This indicates that the environmental effect on seedling–fallen wood spatial association occurred within the range of < 3.94 m.
For saplings and fallen wood under the CSR model, a significant negative association was observed at large scales of r> 8.61 m, while the distribution was random within r ≤ 8.61 m. However, under the HPP model with environmental heterogeneity removed, the scale at which the negative association appeared decreased to r> 4.3 m, with random distribution within r ≤ 4.3 m. This discrepancy indicates that environmental factors altered the association pattern between saplings and fallen wood at the scale of 4.3–8.61 m (Figure 8B, F).
Sub-adults and fallen wood mainly showed a positive association at medium scales. Under the CSR model, a significant positive association was observed at scales of 13.71–35.36 m, with random distribution at other scales. Under the HPP model, the scale range of positive association narrowed to 16.09–33.67 m. In addition, a significant negative association appeared at small scales of 1.38–4.49 m, with random distribution at other scales (Figure 8C, G).
The spatial association pattern between adults and fallen wood was also significantly affected by model selection. Under the CSR model, adults and fallen wood showed a significant positive association at r> 2.57 m and random distribution at r ≤ 2.57 m. Under the HPP model, however, a significant negative association was observed at small scales of 0–4.45 m, random distribution at medium scales of 4.45–16.11 m, and a positive association only at large scales of r> 16.11 m (Figure 8D, H).
4. Discussion
Based on a 6-ha permanent plot, this study systematically analyzed the coupling effect of environmental filtering and species biological traits on the spatial association pattern between P. schrenkiana and fallen wood, which enriched the understanding of the regeneration function of fallen wood and constructed a theoretical framework for the regeneration of P. schrenkiana populations in the Tianshan Mountains. The study first confirmed that the influence of fallen wood persists throughout the entire life history, establishing its fundamental role in the regeneration of mountain forests in arid regions. Furthermore, it revealed the dynamic transition of fallen wood function during ontogeny, shifting from micro-habitat shelter for seedlings to a historical legacy for adults. Building on this, the study further revealed the environmental action scale (EAS) that influences the effectiveness of fallen wood micro-habitat, and found that EAS expands systematically with ontogeny and is highly correlated with the maximum crown width of trees at each stage. The above findings collectively illustrate a cascading regulatory process from environmental filtering to fallen wood buffering, and then to population spatial patterns based on individual tolerance, providing a new theoretical perspective for understanding the long-term maintenance mechanism of mountain coniferous forests in arid regions.
4.1. The Influence of Fallen Wood on P. schrenkiana Population Regeneration Throughout the Entire Life History
This study reveals a fact that was previously under-quantified in the Tianshan mountain forests: the influence of fallen wood on P. schrenkiana population regeneration does not only occur at the seedling establishment stage, but runs through the entire life history. The proportion of fallen wood regeneration as high as 99.6% at the seedling stage confirms the irreplaceability of fallen wood as a critical micro-habitat for seed germination and early establishment. At the sapling, sub-adult, and even adult stages, their early regeneration still occurred on fallen wood, with the proportion of fallen wood regeneration stably maintained above 78%. This finding provides a useful supplement to the traditional understanding that fallen wood, as a nurse log, only functions at the seedling recruitment stage [15,28].
In addition, the significant correlation between fallen wood decay class and the occurrence frequency of individuals at various life history stages (χ² = 69.58, p< 0.001) further reveals the dynamic change process of this whole-life-history dependence. The gradient pattern from 100% seedlings on Class III fallen wood to 64.29% adults on Class V fallen wood indicates that the contribution of fallen wood to population regeneration is not a static resource supply, but an orderly process that changes synergistically with its own decay degree and the ontogenetic stage.
At the global scale, there is significant regional variation in the relative importance of fallen wood in forest regeneration, and its contribution mainly depends on whether there are alternative micro-habitats in the understory. In subalpine Picea abies forests in the Western Carpathians of Europe, regeneration mainly occurs on the ground and stumps, and fallen wood is not a critical substrate [29]; in similar forests in the Italian Alps, more than 57% of the existing dominant trees are established on stumps, and the regeneration density on stumps is five times that on the ground [30]. In contrast, in moist western hemlock (Tsuga) forests in North America, 94–98% of seedlings depend on fallen wood for regeneration [16,31]; similar patterns are also observed in the coniferous forests on Mount Fuji, Japan, where the proportion of fallen wood regeneration is significantly higher than that on the ground [32]. The above studies show that when there are effective alternative substrates such as stumps in the understory, the regeneration function of fallen wood can be partially replaced. However, for the P. schrenkiana forests in the arid region of Tianshan Mountains, there is a lack of micro-habitats in the understory that can replace the water buffering function of fallen wood [21]. Under strong seasonal drought stress, almost all seedlings are confined to completing regeneration on fallen wood, and the water retention capacity of fallen wood has become a key ecological adaptation strategy for maintaining population stability.
4.2. Stage-Specific Shifts in Fallen Wood Function
Although the influence of fallen wood on P. schrenkiana population regeneration runs through the entire life history, the spatial association pattern between P. schrenkiana and fallen wood exhibits high variability across different ontogenetic stages. The HPP model, with elevation and hydrothermal gradients (PC1 + PC2) as environmental covariates, showed that seedlings and fallen wood exhibited a highly positive association, mainly driven by hydrothermal conditions, supporting the aforementioned view that fallen wood promotes seedling regeneration. However, the association between saplings and fallen wood underwent a fundamental reversal, showing random distribution at small scales and negative association at large scales. This seems contradictory to the phenomenon that 78.78% of saplings still regenerate on fallen wood, but it precisely reveals the change in dominant ecological factors during the transition from seedlings to saplings. Grid-based (20 × 20 m) Mantel tests showed that sapling abundance was significantly positively correlated with light intensity (r = 0.214, p< 0.001), and the spatial heatmap of light intensity showed that saplings were concentrated in high-light patches such as forest gaps rather than near fallen wood (Figure S1). Therefore, the negative spatial association between saplings and fallen wood reflects environmental filtering driven by light limitation, but does not mean that saplings do not depend on fallen wood. The absence of sapling snags observed in the field indicates that selection mainly occurs at the seedling stage, and the surviving saplings are concentrated in high-light patches.
Previous allometric studies in this plot provide direct support for the negative spatial association between saplings and fallen wood from a life-history perspective. The crown width–DBH allometric scaling slope at the sapling stage was significantly greater than 1, while it was significantly less than 1 at the seedling stage, and approached 1 at the adult stage. It can be seen that saplings have shifted the biomass allocation from mechanical support to crown expansion to maximize the capture of limited light resources in the understory [33]. The study by Stroheker et al. [34] in a Picea abies forest in the Swiss Alps provides strong support for this. They also found obvious stage differences in spruce regeneration on fallen wood: seedling density was mainly constrained by physical factors such as decay type and inclination of fallen wood, while sapling density was mainly driven by light availability. In summary, multiple lines of evidence consistently indicate that light condition is the dominant ecological factor at the sapling stage, which causes the negative spatial association between saplings and fallen wood in the HPP model based on hydrothermal gradients. This indicates that fallen wood can exhibit completely different ecological functions at different life history stages, and its effectiveness is strictly limited by the resource requirements of species at specific developmental stages.
Sub-adults and fallen wood showed a mixed spatial association pattern of random, negative, and positive correlations at multiple scales. This mixedness itself conveys important information: the sub-adult stage is in a transition period where multiple ecological processes such as intraspecific competition, local environmental filtering, and the attenuation of fallen wood micro-habitat effects act simultaneously and intertwine, and a stable spatial distribution pattern has not yet been formed. Its own aggregation intensity also decreased from the peak at the seedling and sapling stages (L(r) ≈ 70) to L(r) ≈ 46 (Figure 6).
As for the positive spatial association between adults and fallen wood, it is a reflection of past historical processes in the present. Although adults no longer show physiological dependence on the current fallen wood micro-habitat, the spatial distribution pattern of original fallen wood has been deeply imprinted in the macro-spatial structure of the current adult forest, which is the fundamental reason why adults and fallen wood maintain positive association at large scales. The fact that 78% of adults still regenerated on fallen wood further indicates that biological legacies [35] of historical settlement events can be retained in the stand structure over decades or even centuries, producing an ecological legacy effect [36,37], even if the original fallen wood has completely decayed.
It can be seen that the function of fallen wood changes with the ontogenetic stages of P. schrenkiana, from strict micro-habitat shelter at the seedling stage, to the transition of dominant factors and attenuation at the sapling and sub-adult stages, and finally to only residual historical legacy traces at the adult stage. Grid-based partial regression analysis showed that after removing the influences of environmental heterogeneity and spatial autocorrelation, seedling and adult densities were still significantly positively correlated with fallen wood abundance, while saplings and sub-adults showed no significant correlation. This result independently confirms the core conclusion of the stage-specific transition of fallen wood function at the local scale (Figure S2).
4.3. Environmental Action Scale (EAS) Affects the Availability of Fallen Wood Micro-Habitats
This study found that the spatial association pattern between P. schrenkiana and fallen wood changed systematically after removing the influence of environmental heterogeneity, and this change commonly occurred at spatial scales of several meters to tens of meters. In the CSR model without environmental factors removed, trees at all ontogenetic stages and fallen wood generally showed significant positive or negative associations across all scales or at large scales. In contrast, in the HPP model with environmental heterogeneity removed, this association generally changed at small scales. Specifically, the positive association between seedlings and fallen wood became non-significant within r ≤ 3.94 m; for saplings and fallen wood, the association shifted from non-significant to negative within 4.3–8.61 m; for sub-adults, the change in the positive association range occurred at 13.71–16.09 m and 33.67–35.36 m; for adults, the association shifted to significantly negative and random within 0–4.45 m and 4.45–16.11 m, respectively. This indicates that several to tens of meters is the effective range of local environmental influence on fallen wood micro-habitats in the P. schrenkiana forest of West Tianshan Mountains. Therefore, this study proposes the concept of environmental action scale (EAS). At the statistical level, EAS is defined as the critical scale threshold at which the spatial association between trees and fallen wood shifts from significant positive or negative to non-significant in the HPP model compared to the CSR model. Ecologically, it represents the maximum effective range within which environmental factors can influence the spatial association between trees and fallen wood. This concept emphasizes that the presence of fallen wood does not equate to the realization of its ecological function. Fallen wood serves as an effective substrate for population regeneration only when the micro-habitat conditions (such as light, temperature, humidity, etc.) meet the basic requirements of individuals [38]. When environmental conditions are harsh, even if the fallen wood itself is structurally intact, most of its surface may fail to support seedling establishment due to resource scarcity or excessive stress [21], leading to a decline in actual availability. The shift from significant association to non-significant at different scales for trees and fallen wood at various stages is precisely the manifestation of EAS affecting the availability of fallen wood micro-habitats.
This theoretical inference is also supported by the measured data of fallen wood micro-habitats and demographic results. The measurements in this study showed that fallen wood is not always superior to the ground; its surface exhibits significantly high temperature, high light, low humidity, and low nutrient characteristics in summer, essentially constituting a stressful micro-habitat for seedlings. This result directly explains the extremely low seedling establishment success rate in the plot. Among the 447 fallen wood surveyed, only 121 (about 27%) successfully established seedlings. This means that over 70% of fallen wood lost their regeneration support potential due to insufficient decay [21] or unfavorable local environments. However, once the local environment (such as canopy shading and humid air) can buffer the summer stress on the fallen wood surface, the advantage of fallen wood as a regeneration substrate emerges. Data show that 2000 seedlings were aggregated on the 121 successfully colonized fallen wood, with an average of about 16.6 seedlings per fallen wood. This asymmetric distribution pattern of low colonization rate but high aggregation reflects the nested mechanism by which the availability of fallen wood micro-habitats is limited by the local environment. A regeneration study on old-growth spruce-fir forests in Japan pointed out that although the water extract of fallen wood was acidic and the mineral nutrients were extremely low, tree seedlings could still colonize in large numbers on it, indicating that seedling recruitment depends more on the physical substrate provided by fallen wood [39]. This is highly consistent with the core idea of this study. It proves that fallen wood is only a necessary physical basis for regeneration, but not a sufficient condition.
4.4. Expansion of the Environmental Action Scale (EAS) with Ontogeny
Given that the EAS affects the availability of fallen wood micro-habitats, how this scale changes with ontogenetic stages is the core issue for understanding the spatial distribution dynamics of the population. The HPP model shows that EAS is not constant, but exhibits a systematic gradient expansion from <4 m to approximately16 m with ontogeny. This scale expansion phenomenon is essentially the result of dynamic changes in the interaction among environmental filtering, the fallen wood shelter effect, and individual physiological tolerance across developmental stages.
Seedlings are almost completely attached to fallen wood (99% distributed on fallen wood) and have extremely weak physiological tolerance, so the fallen wood shelter effect dominates the relative weight. Once environmental disturbance exceeds the buffering capacity of the fallen wood micro-habitat, individuals can hardly survive [21]. The study by Iijima et al. [40] showed that when fallen wood encounters extreme drought exceeding its water-holding threshold (e.g., no precipitation for 30 consecutive days in a greenhouse experiment), or on exposed fallen wood lacking moss cover, seedlings suffer lethal water stress and die. Another study reported that only 23.9% of P. schrenkiana seedlings survive to 30 years of age due to water limitation [41]. Therefore, the EAS at the seedling stage largely reflects the shelter capacity of fallen wood. Of course, the shelter capacity of fallen wood is closely related to its decay stage and physical characteristics [21,42]; this paper does not elaborate further. Thus, only within the spatial range of r ≤ 3.94 m can environmental filtering break through the buffering capacity of the fallen wood micro-habitat, cause seedling mortality, and thereby alter the nature of the positive association between fallen wood and seedlings.
The EAS at the sapling stage (4.3–8.61 m) is intermediate between that of seedlings and adults, showing a trend of gradual expansion with development, which is consistent with the predicted direction of the above sliding-weight framework. As mentioned earlier, in order to compete for light, crown width–DBH allometric scaling surges at the sapling stage [35], and roots also begin to penetrate into the soil to explore broader soil moisture, so the EAS must expand sharply. Individuals at this stage are in an ecologically vulnerable period of transition from dependence on microhabitat shelter to independent environmental response. They have neither completely severed their connection with fallen wood nor fully established adaptation mechanisms to the environment, and are under dual regulation by local environmental filtering and individual tolerance.
The EAS at the sub-adult and adult stages is similar, maintained at 16.09 m and 16.11 m, respectively. This is mainly because the physiological tolerance and resource acquisition ability of individuals at these two stages are greatly enhanced, dominating the relative weight in determining this scale. At the same time, as time goes by, the original fallen wood becomes highly decayed, its physical structure converges with the surrounding ground environment, and its buffering capacity for the micro-habitat significantly declines (Figure 5). Therefore, the EAS at these two stages largely reflects the individual’s own resistance. However, an additional EAS appears at the scale of 33.67–35.36 m for sub-adults, a phenomenon not observed at the adult stage. We believe that this scale above 30 m may originate from the low population density and unstable spatial association pattern at the sub-adult stage, rather than being a direct reflection of the individual’s true physiological tolerance. A study on the spatial pattern of Tianshan spruce (P. schrenkiana var.tianshanica) in the East Tianshan Mountains also found negative associations between individuals of different ontogenetic stages within 0–16 m [43], further confirming that a scale of about ten meters may be of greater ecological significance.
4.5. Crown Width Dominates the Spatial Patterns
More importantly, this study found a strict proportional scaling relationship between EAS and the morphological size (crown width and DBH) of individuals at different ontogenetic stages, especially with the maximum crown diameter showing the highest linear fit (R² = 0.9839), which was significantly better than that of the mean crown width (R² = 0.6892) and the DBH indexes (Figure S3). This result has profound ecological implications.
First, crown width provides a clear morphological explanation for EAS, an abstract statistical indicator. Although the expansion of EAS originates from the improvement of individual physiological tolerance, this physiological change must eventually be reflected in external morphology. As a functional trait that directly reflects the range of requirements of a single tree for aboveground light resources and belowground water and nutrients, crown width can approximately characterize the volume of an individual’s niche.
Second, this result indicates that EAS does not depend on the average level of the population, but is limited by the potential maximum niche width that individuals can reach at each stage. After environmental heterogeneity or dispersal limitation determines the aggregated distribution of the population, the density-dependent self-thinning process ultimately determines the spatial distribution of individuals within aggregations [26,44]. During this process, it is often the individuals with the greatest growth potential and strongest competitiveness that determine the population aggregation intensity. This is the mechanism by which the maximum crown diameter can constrain the population spatial structure. This mechanism was directly verified in the developmental sequence of the population spatial pattern. As shown in Figure 6, although all ontogenetic stages maintained the basic pattern of aggregated distribution, their aggregation intensity showed a regular decreasing trend with ontogeny. The essence of this phenomenon is driven by crown expansion. With ontogeny, the increase in maximum crown diameter forces an increase in the nearest neighbor distance, which macroscopically manifests as a regular attenuation of aggregation intensity.
Finally, morphological canalization reveals the evolutionary origin of this strict proportionalscaling relationship. As a coniferous tree, P. schrenkiana has strong apical dominance and a fixed branching pattern, and its crown development exhibits a high degree of morphological canalization. This means that regardless of environmental fluctuations, the distribution of individuals in space is strictly constrained within the niche volume defined by their crown size. Even when neighbor competition occurs, it is difficult to alleviate competitive pressure through crown plasticity, such as the crown shyness phenomenon observed in broad-leaved trees [45]. The consequence of this rigid competition mode is that disadvantaged individuals are either eliminated or endure and wait for opportunities (e.g., canopy gaps). It is precisely this individual morphological canalization rooted in evolutionary constraints that makes the maximum crown diameter a suitable morphological proxy for characterizing EAS.
For a long time, explanations for forest spatial patterns have been mostly limited to external factors such as environmental heterogeneity and dispersal limitation [1,2], while the role of trees’ own growth and ontogenectic characteristics is often overlooked. Through the functional trait of crown width, this study established a direct link between physiological tolerance and environmental filtering. Thus, the formation mechanism of the P. schrenkiana population spatial pattern can be summarized as a cascade of effects: environmental filtering → fallen wood micro-habitat → population ontogenetic stage → enhanced physiological tolerance → crown expansion → increased EAS → altered spatial distribution pattern. Specifically, local environmental filtering and fallen wood micro-habitats jointly act on different ontogenetic stages; the enhancement of individual physiological tolerance is reflected in crown expansion, which drives the expansion of the environmental action scale (EAS), and ultimately alters the population aggregation pattern (Figure 9). Therefore, the population spatial pattern is an emergent property at the population level based on external environmental filtering (including local environmental filtering and fallen wood micro-habitats), with the species’ inherent morphological canalization playing a key role, in which crown width plays a crucial part. This suggests that future studies on the spatial patterns of coniferous forests should not ignore the intrinsic driving role of individual morphological traits (especially crown width), which provides a new perspective for understanding the self-organization process of coniferous forest ecosystems.
4.6. Implications for P. schrenkiana Population Regeneration
Although this study focused on a single tree species, P. schrenkiana in the Tianshan Mountains, the core mechanisms revealed—namely the non-sufficiency of fallen wood as a regeneration substrate, the nested screening of environmental filtering, and the dynamic expansion of the effective environmental filtering range across life history stages—are likely widespread in high-latitude or high-altitude coniferous forest ecosystems. For example, studies on forest regeneration in the coniferous forests of Mount Fuji, Japan [33], Norway spruce (Picea abies) forests in the Swiss Alps [36], and subalpine fir (Abies faxoniana) forests in the high mountains of southwestern China [46] have all reported similar phenomena of environmental constraints limiting successful seedling regeneration on fallen wood. These cross-regional studies consistently suggest that the cascade process proposed in this study may have a universality that transcends a single tree species, and is worthy of verification and expansion in more types of coniferous forests.
Population regeneration is the foundation for the persistence of forest ecosystems, while population maintenance is the cumulative result of the regeneration process over time. By analyzing the functional role shifts of fallen wood across different life history stages and their interactions with environmental gradients, this study revealed the spatiotemporal coupling mechanism among environmental filtering, ontogenetic stages, and spatial patterns during the population regeneration process. This mechanism indicates that the continuous regeneration of a population depends not only on the physical presence and properties of micro-habitat substrates such as fallen wood, but also on the screening efficiency of local environmental quality on regeneration potential and the response differences of different ontogenetic stages to environmental stress. The strict isometric scaling relationship between EAS and crown width further reveals that crown morphological canalization is the main factor affecting EAS and shapes the population distribution pattern at the habitat scale. Together, they determine whether the population can complete the full cycle from short-term regeneration events to long-term maintenance.
Therefore, this study not only provides a new theoretical perspective for understanding the dynamic function of fallen wood in population regeneration, but also offers an operational analytical approach for assessing the long-term maintenance capacity of mountain forest populations under climate change. We should not regard fallen wood as an isolated, static superior substrate, but rather as a dynamic component nested within vegetation structure and topographic space. Fallen wood that is detached from the shelter of the ground herb layer and soil moisture replenishment actually constitutes a survival trap for seedlings in the arid region summer (specifically, the low-humidity and high-temperature environment in summer as described in Figure 5). This means that focusing solely on the quantity or decay status of fallen wood is far from sufficient; the changes in the suitability thresholds of fallen wood micro-habitats under future climate scenarios must be simultaneously assessed. Because slight deterioration of the local environment can reduce the effective suitable area of fallen wood, leading to a non-linear decline or even collapse of regeneration potential. Therefore, future research should focus on which life history stages of the fallen wood–individual coupling relationship will first reach the critical threshold under a warming and humidifying climate scenario? Can the proportion of effective fallen wood that truly possesses regeneration function be increased to buffer climate impacts by regulating canopy structure or topographic and hydrological conditions? How will the endogenous morphological constraints determined by the attributes of coniferous trees themselves shift with climate change, thereby reshaping the population spatial pattern? Answering these questions will directly determine the regeneration resilience and long-term persistence capacity of Tianshan and similar mountain coniferous forests in rapidly changing environments.
5. Conclusions
Based on a 6-ha permanent plot, this study revealed the dynamic patterns of spatial association between Picea schrenkiana populations and fallen wood and their underlying mechanisms, enriching the understanding of the functional role of fallen wood as nurse logs. The core findings are as follows:
(1) The influence of fallen wood exists throughout the entire life history of P. schrenkiana. 99.6% of seedlings depend on fallen wood, and even at the adult stage, at least 78% of individuals completed their early regeneration on fallen wood. However, the function of fallen wood shifts with ontogenetic stages: it provides micro-habitat shelter for seedlings, is masked by light resource limitation for saplings, weakens due to intraspecific competition and declining micro-habitat effects for sub-adults, and becomes a historical ecological legacy for adults. This functional shift is manifested in spatial patterns as: a strong positive association with seedlings, a negative association with saplings, a multi-scale fluctuating association with sub-adults, and still a positive association with adults.
(2) The potential of fallen wood to support regeneration is constrained by the local environment. The environmental action scale (EAS) characterizes the effective range of local environmental influence on fallen wood micro-habitats. Across different ontogenetic stages, EAS varies from several meters to tens of meters, forming a nested screening constraint.
(3) EAS expands with ontogeny, mainly regulated by the combined effects of local environmental filtering, fallen wood micro-habitats, and individual physiological tolerance. Specifically, the EAS at the seedling stage is 3.94 m, mainly regulated by local environmental filtering and the buffering capacity of fallen wood. The EAS at the sapling stage is 4.3–8.61 m, simultaneously regulated by local environmental filtering and individual physiological tolerance (mainly light tolerance). The EAS at the sub-adult and adult stages expands to approximately 16 m, mainly regulated by individual physiological tolerance.
(4) There is a strict proportional scaling relationship between EAS and the maximum crown diameter (R² = 0.9839), revealing that the morphological constraint mechanism of P. schrenkiana itself plays an important role in shaping population spatial patterns. The crown morphological canalization makes it difficult for individuals to alleviate competition through plasticity; thus, the maximum crown diameter becomes a driving factor that defines the critical EAS threshold and reduces population aggregation intensity. Together with environmental filtering, it determines whether the population can complete the full cycle from short-term regeneration events to long-term maintenance.
(5) The canalization of crown width makes it a reliable quantitative indicator connecting the two processes of environmental filtering and species biological traits. The formation mechanism of the P. schrenkiana population spatial pattern can be summarized as a cascade of effects: environmental filtering → fallen wood micro-habitat → population ontogenetic stage → enhanced physiological tolerance → crown expansion → increased EAS → altered spatial distribution pattern.
The above findings have direct implications for the management of mountain coniferous forests under climate change. Against the backdrop of a warming and humidifying climate in the Tianshan Mountains, assessing regeneration potential solely based on fallen wood volume carries a risk of overestimation; local environmental parameters such as microtopography, air temperature and humidity, and light must be simultaneously incorporated to identify effective fallen wood. At the same time, the endogenous constraints determined by crown morphological canalization remind us that the population’s response to climate change depends not only on changes in external environmental suitability, but also on the extent of the species morphological plasticity. Therefore, identifying the critical thresholds of fallen wood–seedling spatial association scales and establishing adaptive management strategies that enhance the proportion of effective fallen wood by regulating canopy structure can provide scientific support for maintaining the long-term regeneration resilience of mountain coniferous forests in the Tianshan Mountains.
Supplementary Materials
The following supporting information can be downloaded at the website of this paper posted on Preprints.org.
Author Contributions
D.Y.H. provided research ideas and designed the experiments; X.S., J.K.H., Z.P.Z., S.Y.X., P.P.X. and Y.C.Z. participated in fieldwork and data collection; Y.C.Z. conducted data analysis and prepared the figures; X.S. and J.K.H. wrote the manuscript; D.Y.H. and J.K.H. revised the manuscript; E.A., W.Z., X.L.S., C.Y. and A.A. participated in field surveys and plot establishment. All authors have read and agreed to the published version of the manuscript.
Funding
This research was funded by Key Research Project of Ili Normal University (2023YSZD008) and the Special Project of Applied Technology Research and Innovation Drive (YYD2023A13) in Yili Kazakh Autonomous Prefecture.
Data Availability Statement
The raw field survey data are not publicly available due to the ongoing long-term monitoring of the permanent plot and conservation sensitivity of the study site. All results supporting the conclusions of this study are presented in the main text and supplementary material. Further information regarding the datasets may be obtained from the corresponding author upon reasonable request.
Acknowledgments
We thank the Administration of West Tianshan National Nature Reserve for their assistance during the field surveys. We are grateful to undergraduate students Shen Daihua and Hu Caixia for their contributions to the fieldwork. We also appreciate the constructive comments from the anonymous reviewers.
Conflicts of Interest
The authors declare no conflicts of interest.
References
- Zhang, M.; Bao, M.; Cheng, X. Spatial Distribution Patterns and Environmental Drivers of Bombax ceiba L.-Associated Plant Communities in Contrasting Habitats: A Case Study from a Tropical Rainforest and a Dry-Hot Valley. Forests 2026, 17, 531. [Google Scholar] [CrossRef]
- Yusup, A.; Halik, Ü.; Abliz, A.; Aishan, T.; Keyimu, M.; Wei, J. Population Structure and Spatial Distribution Pattern of Populus euphratica Riparian Forest Under Environmental Heterogeneity Along the Tarim River, Northwest China. Front. Plant Sci. 2022, 13, 844819. [Google Scholar] [CrossRef] [PubMed]
- Peralta, A.L.; Escudero, A.; de la Cruz, M.; Sánchez, A.M.; Luzuriaga, A.L. Functional Traits Explain Both Seedling and Adult Plant Spatial Patterns in Gypsum Annual Species. Funct. Ecol. 2023, 37, 1170–1180. [Google Scholar] [CrossRef]
- Zhang, N.; Wang, H.; Wu, Y.; Liu, G. Altitudinal Variation in Seed Dispersal Functional Traits of Meconopsis integrifolia and Its Correlation Relationships with Population Spatial Distribution Pattern. North. Hortic. 2016, 20, 62–67, (In Chinese with English abstract). [Google Scholar]
- Tuo, F.; Liu, X.; Liu, R.; Zhao, W.; Jing, W.; Ma, J.; Wu, X.; Zhao, J.; Ma, X. Spatial Distribution Patterns and Association of Picea crassifolia Population in Dayekou Basin of Qilian Mountains, Northwestern China. Chin. J. Plant Ecol. 2020, 44, 1172–1183, (In Chinese with English abstract). [Google Scholar] [CrossRef]
- Han, Y.; Wang, Z. Spatial Pattern of Manchurian Ash (Fraxinus mandshurica) Seed Dispersal in Secondary Hardwood Forests. Chin. J. Plant Ecol. 2002, 26, 51–57, (In Chinese with English abstract). [Google Scholar]
- Zhang, L.; Dong, L.; Chen, Y.; Liu, Z. Seed Rain Dynamics of Natural Secondary Forest in the Central Part of Greater Xing’an Mountains, China. Chin. J. Appl. Ecol. 2020, 31, 4035–4041, (In Chinese with English abstract). [Google Scholar]
- Sharma, G.; Nautiyal, B.P.; Nautiyal, A.R. Seedling Emergence and Survival in Cinnamomum tamala under Varying Micro-Habitat Conditions: Conservation Implications. Trop. Ecol. 2009, 50, 201–209. [Google Scholar]
- Li, N.; Wang, Z.; Cai, Y.; Zhang, L. Importance of Microhabitat Selection by Birds for the Early Recruitment of Endangered Trees in a Fragmented Forest. Avian Res. 2020, 11, 46. [Google Scholar] [CrossRef]
- Maher, C.; Barber, A.; Affleck, D. Shelter Provided by Wood, Facilitation, and Density-Dependent Herbivory Influence Great Basin Bristlecone Pine Seedling Survival. For. Ecol. Manag. 2015, 342, 76–83. [Google Scholar] [CrossRef]
- Tian, K.; Chen, L.; Mi, X.; Ma, K.; Chen, J. The Effect of Habitat Filtering on Tree Seedling Distribution in a Subtropical Evergreen Broadleaf Forest in China. Chin. Sci. Bull. 2013, 58, 3561–3569, (In Chinese with English abstract). [Google Scholar] [CrossRef]
- Seidler, T.G.; Plotkin, J.B. Seed Dispersal and Spatial Pattern in Tropical Trees. PLoS Biol. 2006, 4, e344. [Google Scholar] [CrossRef] [PubMed]
- An, L.; Wu, Z.; Fan, C.; Zhang, C.; Zhao, X. Spatial Point Patterns and Effects of Density Dependence in Secondary Poplar-Birch Forest, Changbai Mountains, China. Acta Ecol. Sin. 2021, 41, 1461–1471, (In Chinese with English abstract). [Google Scholar] [CrossRef]
- Steinebrunner, F.; Tischer, A.; Medicus, T.; Huth, F.; Bernhardt-Römermann, M. The Effects of Deadwood on Tree Regeneration and Microsites: A Systematic Review. For. Ecol. Manag. 2025, 596, 123096. [Google Scholar] [CrossRef]
- Harmon, M.E.; Franklin, J.F.; Swanson, F.J.; Sollins, P.; Gregory, S.V.; Lattin, J.D.; Anderson, N.H.; Cline, S.P.; Aumen, N.G.; Sedell, J.R.; Lienkaemper, G.W.; Cromack, K.; Cummins, K.W. Ecology of Coarse Woody Debris in Temperate Ecosystems. In Advances in Ecological Research; MacFadyen, A., Ford, E.D., Eds.; Academic Press: London, UK, 1986; Volume 15, pp. 133–302. [Google Scholar]
- Graham, R.L.; Cromack, K., Jr. Mass, Nutrient Content, and Decay Rate of Dead Boles in Rain Forests of Olympic National Park. Can. J. For. Res. 1982, 12, 511–521. [Google Scholar] [CrossRef]
- Dawe, D.A.; Peters, V.S.; Flannigan, M.D. Post-Fire Regeneration of Endangered Limber Pine (Pinus flexilis) at the Northern Extent of Its Range. For. Ecol. Manag. 2020. [Google Scholar] [CrossRef]
- Zhang, Z.; Liu, L.; Tang, X. The Regional Difference and Abrupt Events of Climatic Change in Tianshan Mountains during 1960–2010. Prog. Geogr. 2012, 31, 1475–1484, (In Chinese with English abstract). [Google Scholar]
- Adilai, W.; Yusufujiang, R.; Reyilai, K.; Jiang, H. Spatiotemporal Distribution and Variation Trend of Evapotranspiration in Ili River Valley. J. Geo-Inf. Sci. 2018, 20, 217–227, (In Chinese with English abstract). [Google Scholar]
- Xinjiang Comprehensive Expedition Team; CAS; Institute of Botany; CAS. Vegetation of Xinjiang and Its Utilization; Science Press: Beijing, China, 1978. (In Chinese) [Google Scholar]
- He, J.K.; Xu, Z.W.; Shi, R.K.; et al. Quantitative Characteristics and Influencing Factors of Regeneration Seedlings of Different Decay Grades of Picea schrenkiana, Western Tianshan Mountains. Bull. Bot. Res. 2024, 44(2), 279–288. [Google Scholar]
- He, J.N.; Ning, C.W.; Zhang, W.T.; et al. Altitudinal Patterns of Population Structure Dynamics of Picea schrenkiana in the Northern Slope of the Eastern Tianshan Mountains. Acta Ecol. Sin. 2024, 44(12), 5389–5398, (In Chinese with English abstract). [Google Scholar]
- Zar, J.H. Biostatistical Analysis, 5th ed.; Pearson Prentice Hall: Upper Saddle River, NJ, USA, 2010. [Google Scholar]
- Armstrong, R.A. When to Use the Bonferroni Correction. Ophthalmic Physiol. Opt. 2014, 34(5), 502–508. [Google Scholar] [PubMed]
- Han, Q.; Luo, G.; Li, C.; Ye, H.; Chen, Y. Modeling Grassland Net Primary Productivity and Water-Use Efficiency Along an Elevational Gradient of the Northern Tianshan Mountains. J. Arid Land 2013, 5, 354–365. [Google Scholar] [CrossRef]
- Han, D.Y.; Wang, J.F.; Yang, Y.F.; et al. Impacts of Grazing and Intraspecific Competition on Spatial Distribution Patterns of Gagea nigra Population in the Ili Valley. Acta Ecol. Sin. 2023, 43(20), 8556–8563, (In Chinese with English abstract). [Google Scholar]
- Baddeley, A.; Rubak, E.; Turner, R. spatstat. Spatial Point Pattern Analysis, Model-Fitting, Simulation, Tests. R Package. 2024. Available online: https://CRAN.R-project.org/package=spatstat (accessed on 19 July 2026).
- Harmon, M.E.; Franklin, J.F. Tree Seedlings on Logs in Picea-Tsuga Forests of Oregon and Washington. Ecology 1989, 70, 48–59. [Google Scholar] [CrossRef]
- Bujoczek, L.; Bujoczek, M.; Banaś, J.; Zięba, S. Spruce Regeneration on Woody Microsites in a Subalpine Forest in the Western Carpathians. Silva Fenn. 2015, 49, 1337. [Google Scholar] [CrossRef]
- Motta, R.; Berretti, R.; Lingua, E.; Piussi, P. Coarse Woody Debris, Forest Structure and Regeneration in the Valbona Forest Reserve, Paneveggio, Italian Alps. For. Ecol. Manag. 2006, 235, 155–163. [Google Scholar] [CrossRef]
- Christy, E.J.; Mack, R.N. Variation in Demography of Juvenile Tsuga heterophylla across the Substratum Mosaic. J. Ecol. 1984, 72, 75–91. [Google Scholar] [CrossRef]
- Katsumata, N.; Minami, Y.; Okitsu, S. The Role of Decaying Log Microsites in the Regeneration Dynamics of a Subalpine Forest on Mt. Fuji. Nat. Environ. Sci. Res. 2009, 22, 1–13. [Google Scholar]
- He, J.; Zhang, Y.; Xu, Z.; Shi, R.; Yang, Y.; Han, D. Analysis of Allometric Relations of Picea schrenkiana in Different Development Stages in the Western Tianshan Mountains of China. Forests 2026, 17, 487. [Google Scholar] [CrossRef]
- Stroheker, S.; Weiss, M.; Sieber, T.N.; Bugmann, H. Ecological Factors Influencing Norway Spruce Regeneration on Nurse Logs in a Subalpine Virgin Forest. Forests 2018, 9, 120. [Google Scholar] [CrossRef]
- Franklin, J.F.; Lindenmayer, D.; MacMahon, J.A.; McKee, A.; Magnuson, J.; Perry, D.A.; Waide, R.; Foster, D. Threads of Continuity. Conserv. Biol. 2000, 1, 8–16. [Google Scholar] [CrossRef]
- Currie, W.S.; Nadelhoffer, K.J. The Imprint of Land-Use History: Patterns of Carbon and Nitrogen in Downed Woody Debris at the Harvard Forest. Ecosystems 2002, 5, 446–460. [Google Scholar] [CrossRef]
- Johnstone, J.F.; Allen, C.D.; Franklin, J.F.; Frelich, L.E.; Harvey, B.J.; Higuera, P.E.; Mack, M.C.; Meentemeyer, R.K.; Metz, M.R.; Perry, G.L.W.; Schoennagel, T.; Turner, M.G. Changing Disturbance Regimes, Ecological Memory, and Forest Resilience. Front. Ecol. Environ. 2016, 14(7), 369–378. [Google Scholar] [CrossRef]
- Pioli, S.; Clagnan, E.; Chowdhury, A.A.; Bani, A.; Borruso, L.; Ventura, M.; Tonon, G.; Brusetti, L. Structural and Functional Microbial Diversity in Deadwood Respond to Decomposition Dynamics. Environ. Microbiol. 2023, 25, 2351–2367. [Google Scholar] [CrossRef] [PubMed]
- Takahashi, M.; Sakai, Y.; Ootomo, R.; Shiozaki, M. Establishment of Tree Seedlings and Water-Soluble Nutrients in Coarse Woody Debris in an Old-Growth Picea-Abies Forest in Hokkaido, Northern Japan. Can. J. For. Res. 2000, 30, 1118–1124. [Google Scholar] [CrossRef]
- Iijima, H.; Shibuya, M.; Saito, H.; Takahashi, K. The Water Relation of Seedlings of Picea jezoensis on Fallen Logs. Can. J. For. Res. 2006, 36, 664–670. [Google Scholar] [CrossRef]
- Wang, T.; Ren, H.; Ma, K. A Preliminary Study on Picea schrenkiana Population Dynamics in the Central Tianshan Mountains, Northwestern China. Ecol. Environ. 2006, 15, 564–571, (In Chinese with English abstract). [Google Scholar]
- Orman, O.; Adamus, M.; Szewczyk, J. Data from: Regeneration Processes on Coarse Woody Debris in Mixed Forests: Do Tree Germinants and Seedlings Have Species-Specific Responses When Grown on Coarse Woody Debris? Dataset. Dryad 2017. [Google Scholar] [CrossRef]
- Zhang, Y.; Li, J.; Chang, S.; Li, X.; Lu, J. Spatial Distribution Pattern of Picea schrenkiana var. tianshanica Population and Its Relationships with Topographic Factors in Middle Part of Tianshan Mountain. Chin. J. Appl. Ecol. 2011, 22, 2799–2806, (In Chinese with English abstract). [Google Scholar]
- Li, S.; Zhang, D.; Zhang, Z.; Huang, L. Spatial Distribution Pattern and Correlation of Artemisia halodendron Population in Horqin Sandy Land, China. Biot. Resour. 2022, 44, 63–72, (In Chinese with English abstract). [Google Scholar]
- Onoda, Y.; Bando, R. Wider Crown Shyness Between Broad-Leaved Tree Species Than Between Coniferous Tree Species in a Mixed Forest of Castanopsis cuspidata and Chamaecyparis obtusa. Ecol. Res. 2021, 36(4), 733–743. [Google Scholar] [CrossRef]
- Ma, J.M.; Liu, S.R.; Shi, Z.M.; et al. Natural Regeneration of Abies faxoniana Along Restoration Gradients of Subalpine Dark Coniferous Forest in Western Sichuan, China. Chin. J. Plant Ecol. 2009, 33, 623–634, (In Chinese with English abstract). [Google Scholar]
Figure 1.
Schematic diagram of elevation distribution of Piceaschrenkiana study plots in the West Tianshan National Nature Reserve, Xinjiang.
Figure 1.
Schematic diagram of elevation distribution of Piceaschrenkiana study plots in the West Tianshan National Nature Reserve, Xinjiang.
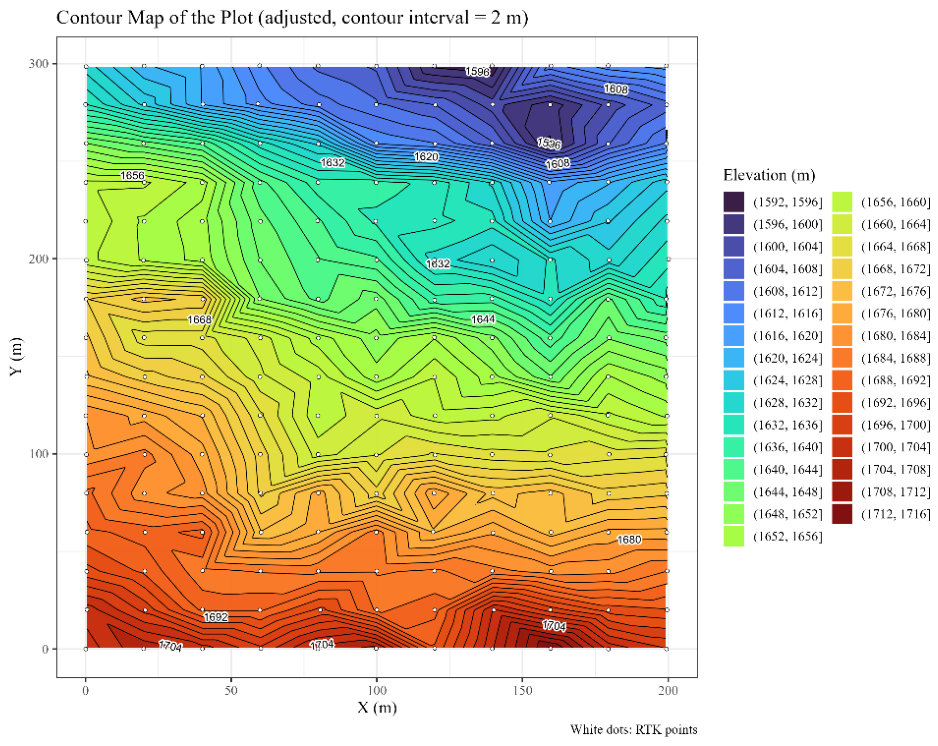
Figure 2.
Distribution map of P. schrenkiana and fallen wood in the 6-ha plot. Different symbols and colors represent trees at various ontogenetic stages, and lines indicate fallen wood. North is indicated by the arrow.
Figure 2.
Distribution map of P. schrenkiana and fallen wood in the 6-ha plot. Different symbols and colors represent trees at various ontogenetic stages, and lines indicate fallen wood. North is indicated by the arrow.
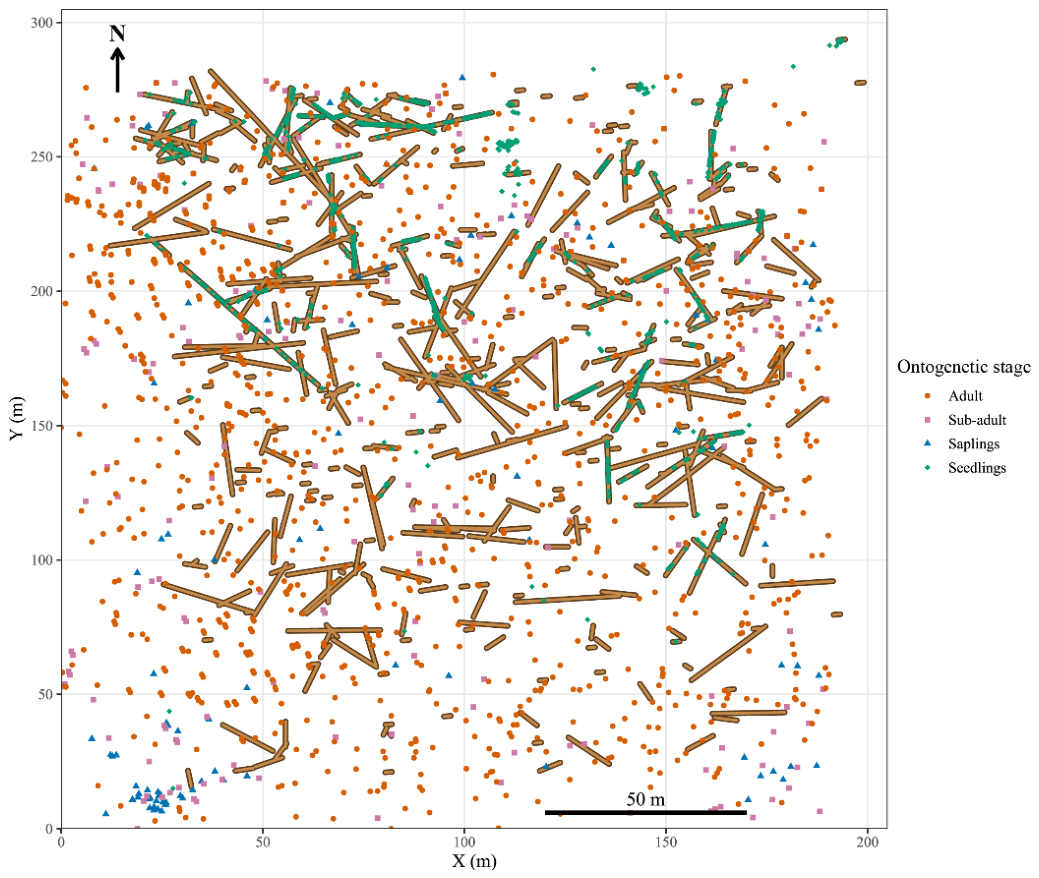
Figure 3.
Regeneration patterns of P.schrenkiana across ontogenetic stages and their association with fallen wood decay class. (A) Proportion of fallen wood (blue) vs. ground (orange) regeneration for saplings, sub-adults and adults. (B) Occurrence frequency of all four ontogenetic stages across decay classes III–V. Different lowercase letters denote significant differences within the same grouping category (p< 0.05).Seedlings are excluded from Panel A as >95% of seedlings occur exclusively on fallen wood (see Section 3.1).
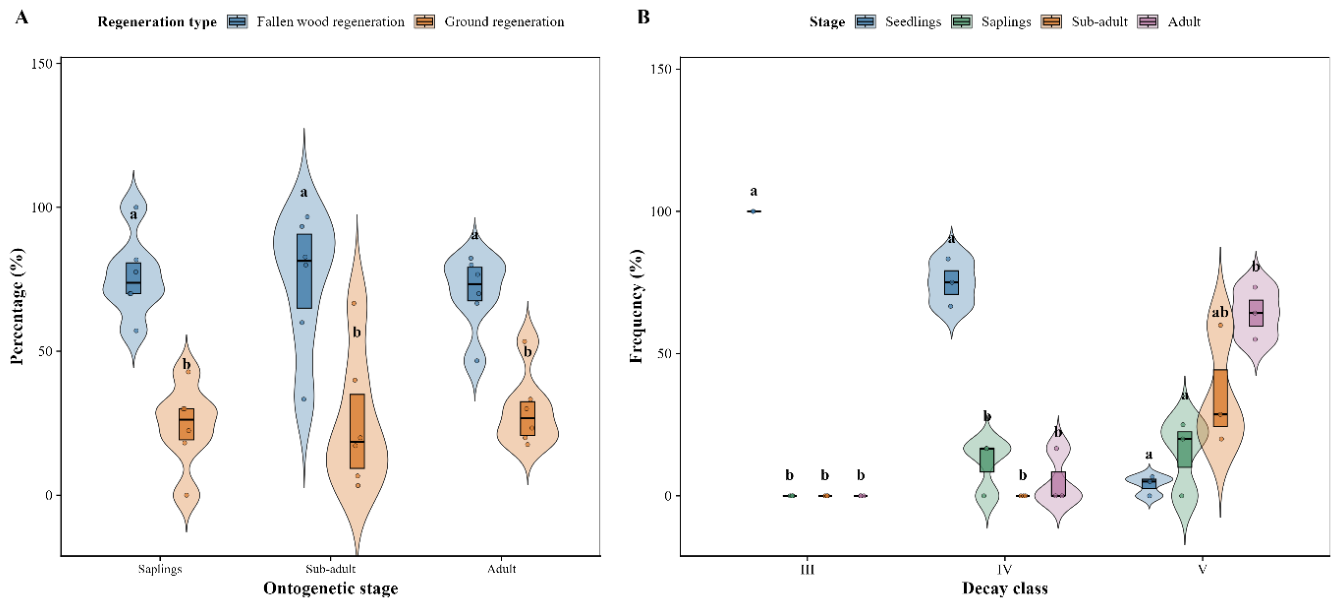
Figure 4.
Diameter-class structures of P. schrenkiana across ontogenetic stages and fallen wood in the 6-ha plot in the West Tianshan National Nature Reserve, Xinjiang. Solid lines indicate probability density curves. Different lowercase letters in panel A indicate significant differences among ontogenetic stages (p< 0.05). The diameter of seedlings is measured as BD, fallen wood at the geometric center, and trees in other stages as DBH.
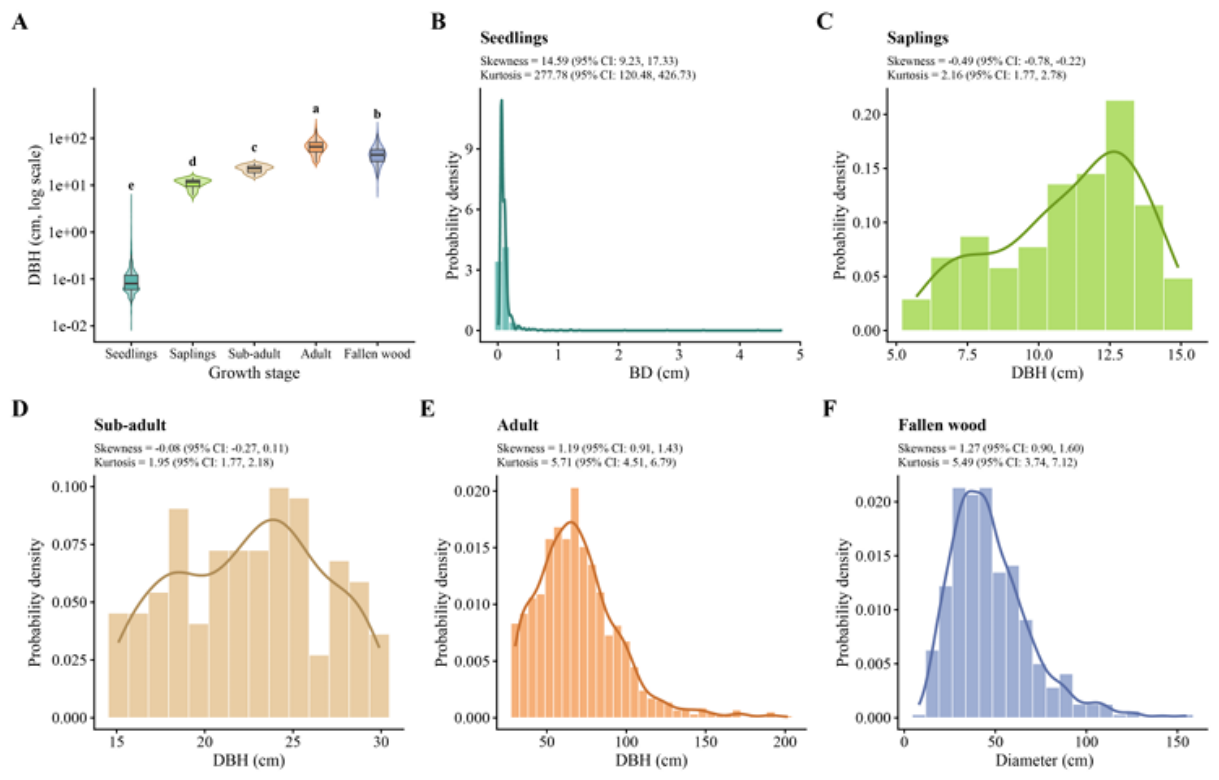
Figure 5.
Comparison of micro-habitat characteristics between P.schrenkiana fallen wood across decay classes and adjacent soils in the West Tianshan National Nature Reserve, Xinjiang. Different lowercase letters indicate significant differences among decay classes for each micro-habitat factor (p< 0.05).
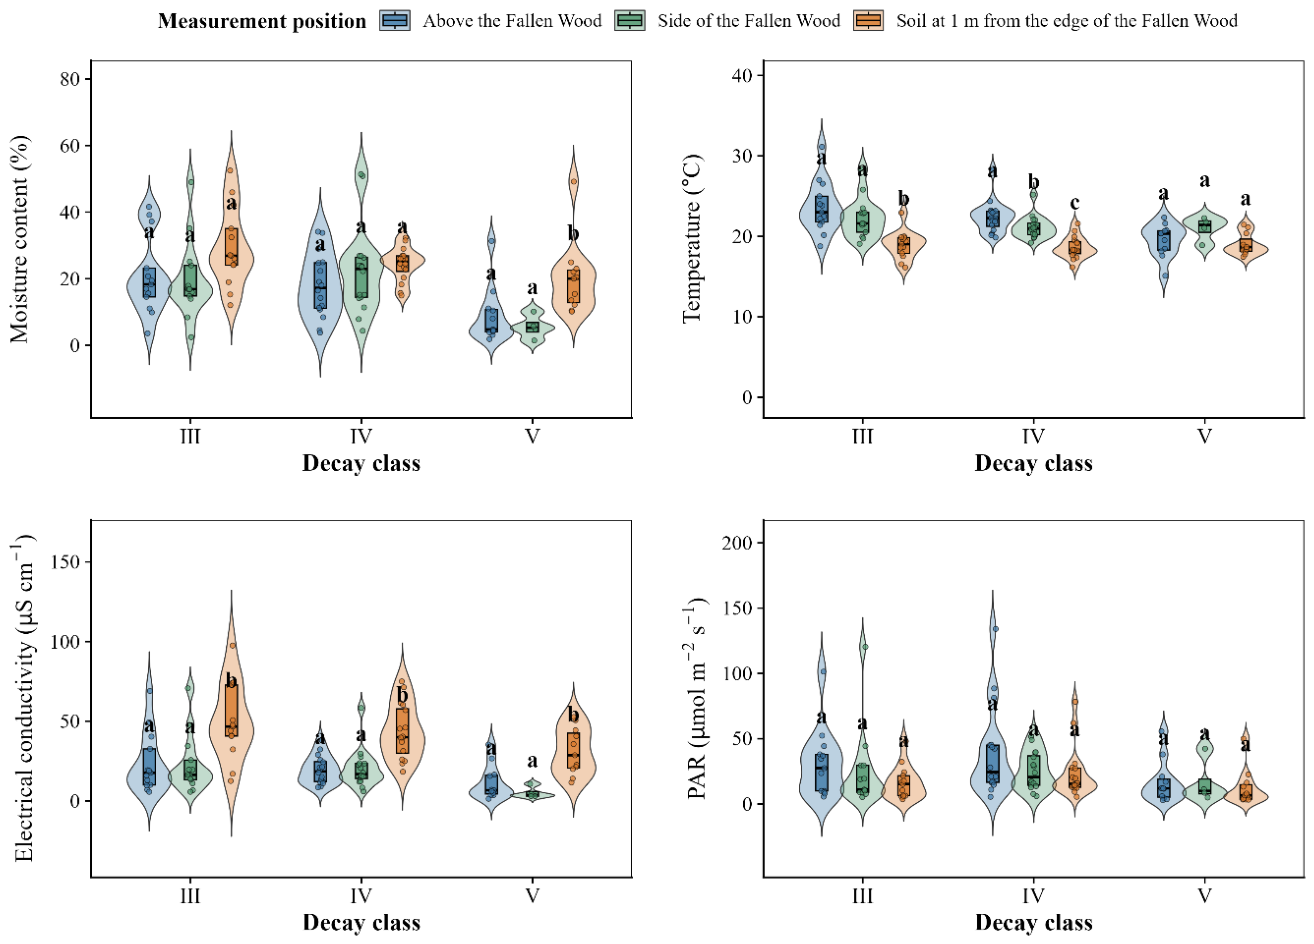
Figure 6.
Spatial point pattern analysis of P. schrenkiana in the 6-ha plot in the Xinjiang West Tianshan National Nature Reserve using Ripley’s L-function.Panels A–D are based on the complete spatial randomness (CSR) model, showing the observed L(r) (solid black line), theoretical L(r) (dashed red line), and simulation envelopes (shaded gray area, based on 199 Monte Carlo simulations) for seedlings, saplings, sub-adults, and adults, respectively. Panels E–H are based on the heterogeneous Poisson process (HPP) model, presenting the corresponding adjusted L(r) to facilitate visual assessment of deviations from the null hypothesis: positive values indicate clustering, while negative values indicate regularity. All analyses were conducted up to a distance of 50 m.
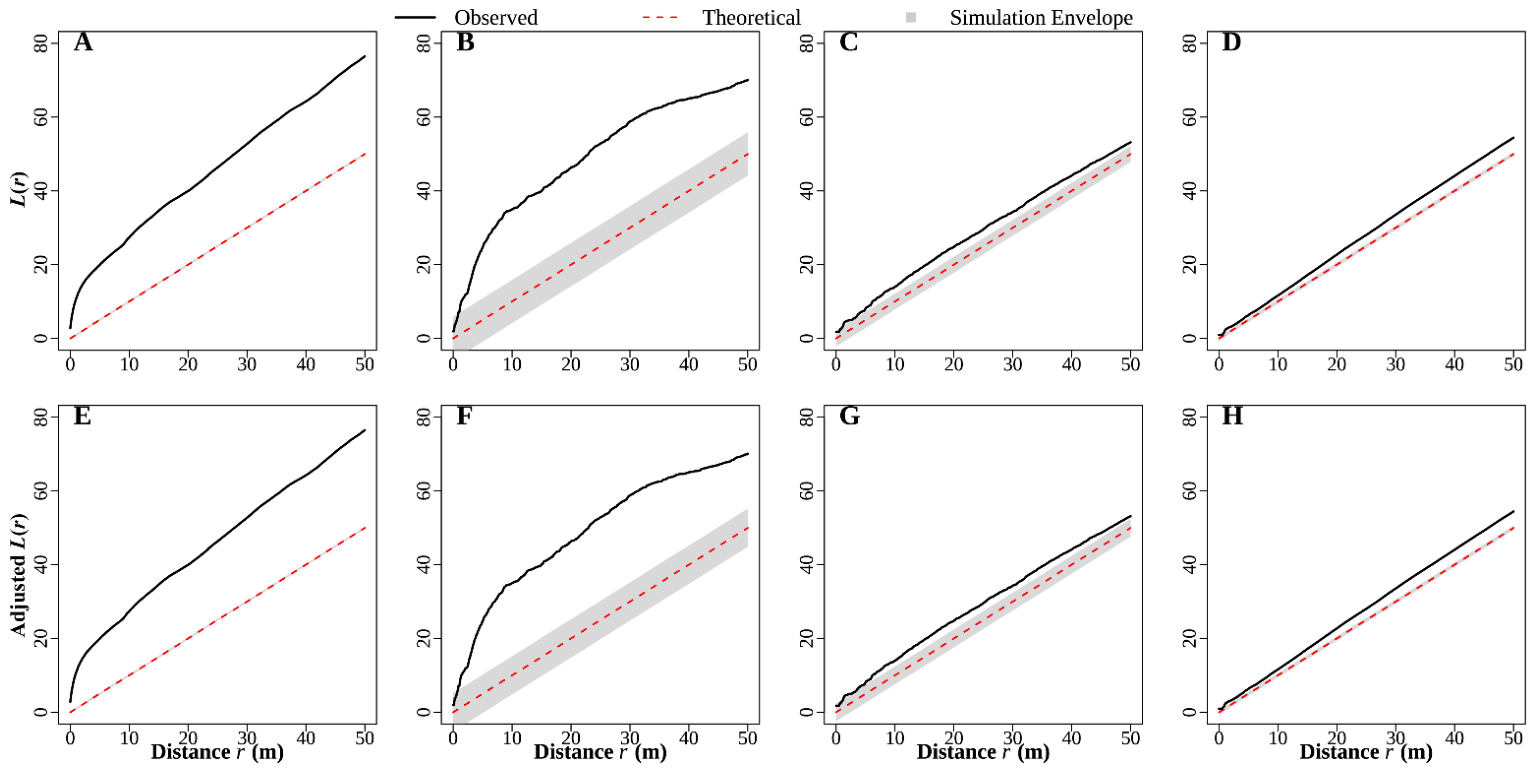
Figure 7.
Spatial point pattern analysis of P.schrenkiana fallen wood in the 6-ha plot in the Xinjiang West Tianshan National Nature Reserve. Panel A is based on the complete spatial randomness (CSR) model; panel B is based on the heterogeneous Poisson process (HPP) model with environmental covariate adjustment. Symbol definitions and analytical procedures follow those in Figure 6.
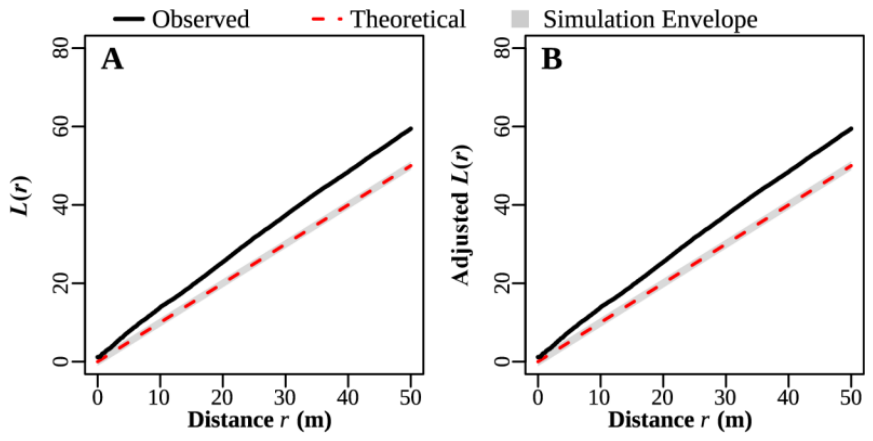
Figure 8.
Spatial association between P.schrenkiana fallen wood and seedlings, saplings, sub-adults, and adults in the 6-ha plot in the Xinjiang West Tianshan National Nature Reserve. Panels A–D are based on the complete spatial randomness (CSR) model; panels E–H are based on the heterogeneous Poisson process (HPP) model with environmental covariate adjustment. Symbol definitions and analytical procedures follow those in Figure 6.
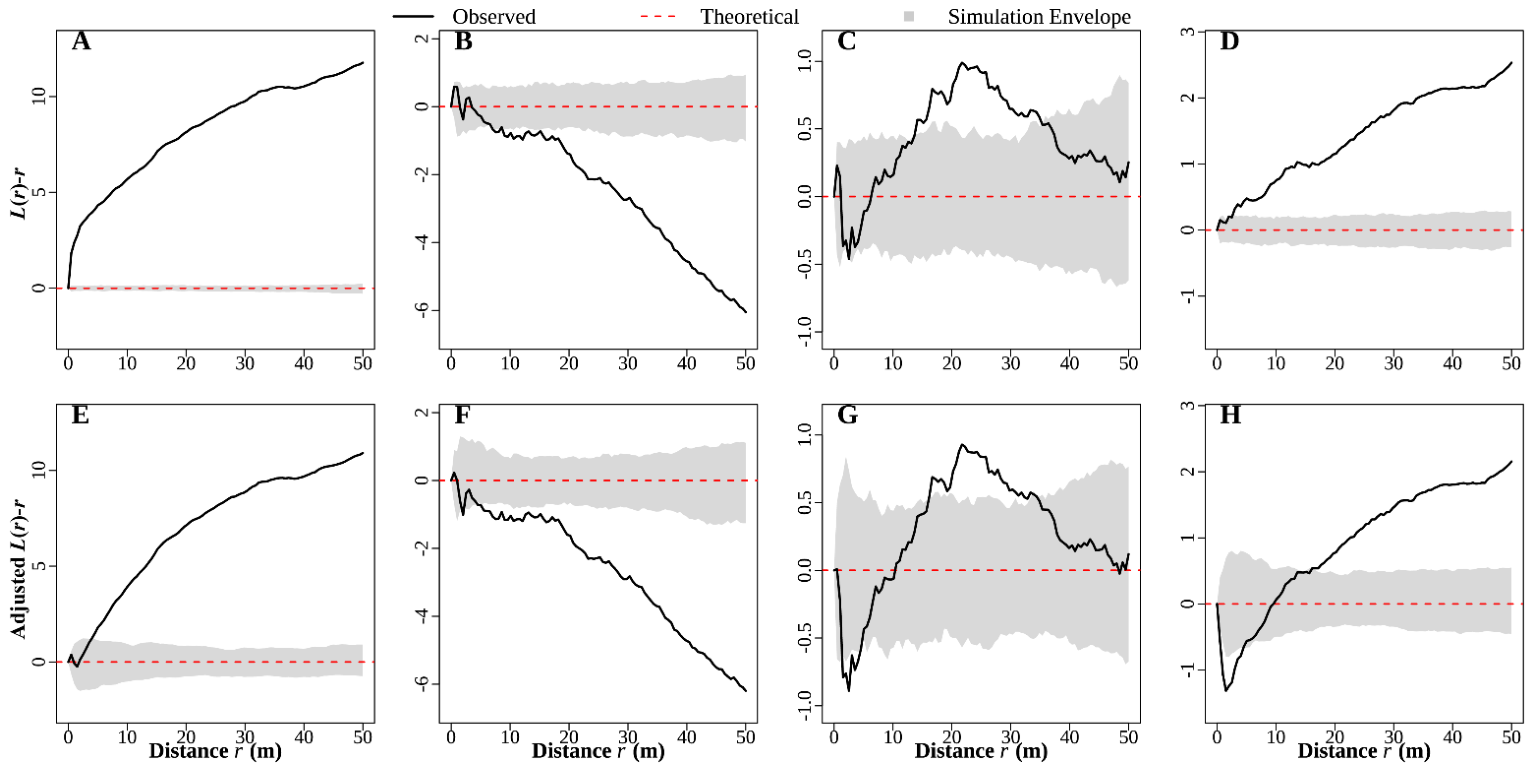
Figure 9.
A multi-process coupling framework of the spatial association patterns between Picea schrenkiana and fallen wood. This framework illustrates a cascade process starting from local environmental filtering and fallen wood micro-habitats, proceeding through ontogeny and enhanced physiological tolerance, and manifested as crown width expansion, which in turn drives the Environmental Action Scale (EAS) and spatial associations. PC1 and PC2 represent the moisture and temperature gradients, respectively. In the diagram, hexagons represent species biological processes, rectangles denote environmental filtering processes, and ellipses (crown width) indicate the linkage between environmental filtering and species biological traits. Red arrows indicate inhibitory effects (e.g., environmental filtering), while green arrows denote facilitative effects (e.g., the sheltering effect of fallen wood micro-habitats). The point pattern analysis on the right reveals the spatial associations between trees and fallen wood, where the width of the boxes corresponds to the scale ranges of each ecological process and the critical EAS threshold.
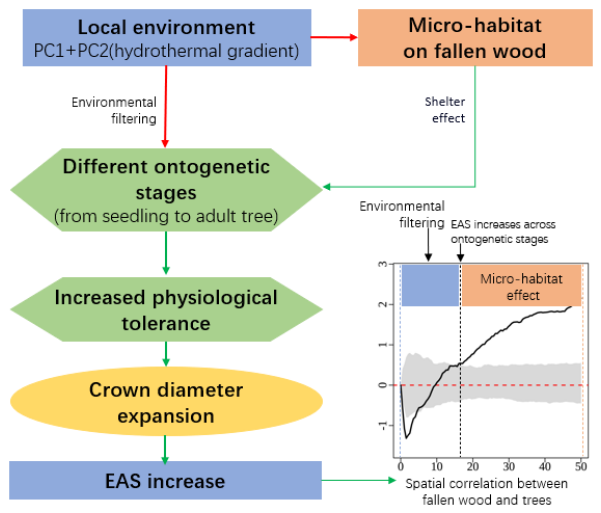

Table 1.
Statistical tests for the correlation between the occurrence frequency of P. schrenkiana across ontogenetic stages and fallen wood decay classes.
Table 1.
Statistical tests for the correlation between the occurrence frequency of P. schrenkiana across ontogenetic stages and fallen wood decay classes.
| Methods | Statistic | df | p values |
| Pearson χ² test | χ² = 69.58 | 6 | < 0.001 |
| Fisher’s exact test | Cramér’s V = 0.637 | — | < 0.001 |
Note: Pearson’s χ² test was used to assess independence; Fisher’s exact test was applied when expected frequencies were low. Cramér’s V represents the effect size, with significance evaluated via 100,000 Monte Carlo simulations. “—” indicates not applicable.
Table 2.
Descriptive statistics of diameter measurements for P. schrenkiana across ontogenetic stages and fallen wood.
Table 2.
Descriptive statistics of diameter measurements for P. schrenkiana across ontogenetic stages and fallen wood.
| Ontogenetic stage | n | mean (cm) | sd (cm) | median (cm) | min (cm) | max (cm) |
| Seedlings | 2006 | 0.12 | 0.20 | 0.08 | 0.01 | 4.7 |
| Saplings | 101 | 11.07 | 2.44 | 11.8 | 5.7 | 14.9 |
| Sub-adult | 194 | 22.53 | 4.13 | 22.85 | 15.1 | 29.9 |
| Adult | 1075 | 69.38 | 26.05 | 66.4 | 30.1 | 201.7 |
| Fallen wood | 447 | 47.39 | 21.89 | 44.75 | 8 | 155 |
Note: Diameter refers to basal diameter (BD) for seedlings, diameter at breast height (DBH) for saplings to adults, and geometric center diameter for fallen wood.
Disclaimer/Publisher’s Note: The statements, opinions and data contained in all publications are solely those of the individual author(s) and contributor(s) and not of MDPI and/or the editor(s). MDPI and/or the editor(s) disclaim responsibility for any injury to people or property resulting from any ideas, methods, instructions or products referred to in the content. |
© 2026 by the authors. Licensee MDPI, Basel, Switzerland. This article is an open access article distributed under the terms and conditions of the Creative Commons Attribution (CC BY) license (http://creativecommons.org/licenses/by/4.0/).
Copyright: This open access article is published under a Creative Commons CC BY 4.0 license, which permit the free download, distribution, and reuse, provided that the author and preprint are cited in any reuse.