
Preprint
Article

This version is not peer-reviewed.

Hermetia illucens Oil in Calf Milk Replacers: Effects on Fatty Acid Digestibility, Fecal Excretion, and Hair Cortisol at Weaning

Submitted:

17 September 2026

Posted:

18 September 2026

You are already at the latest version

Abstract

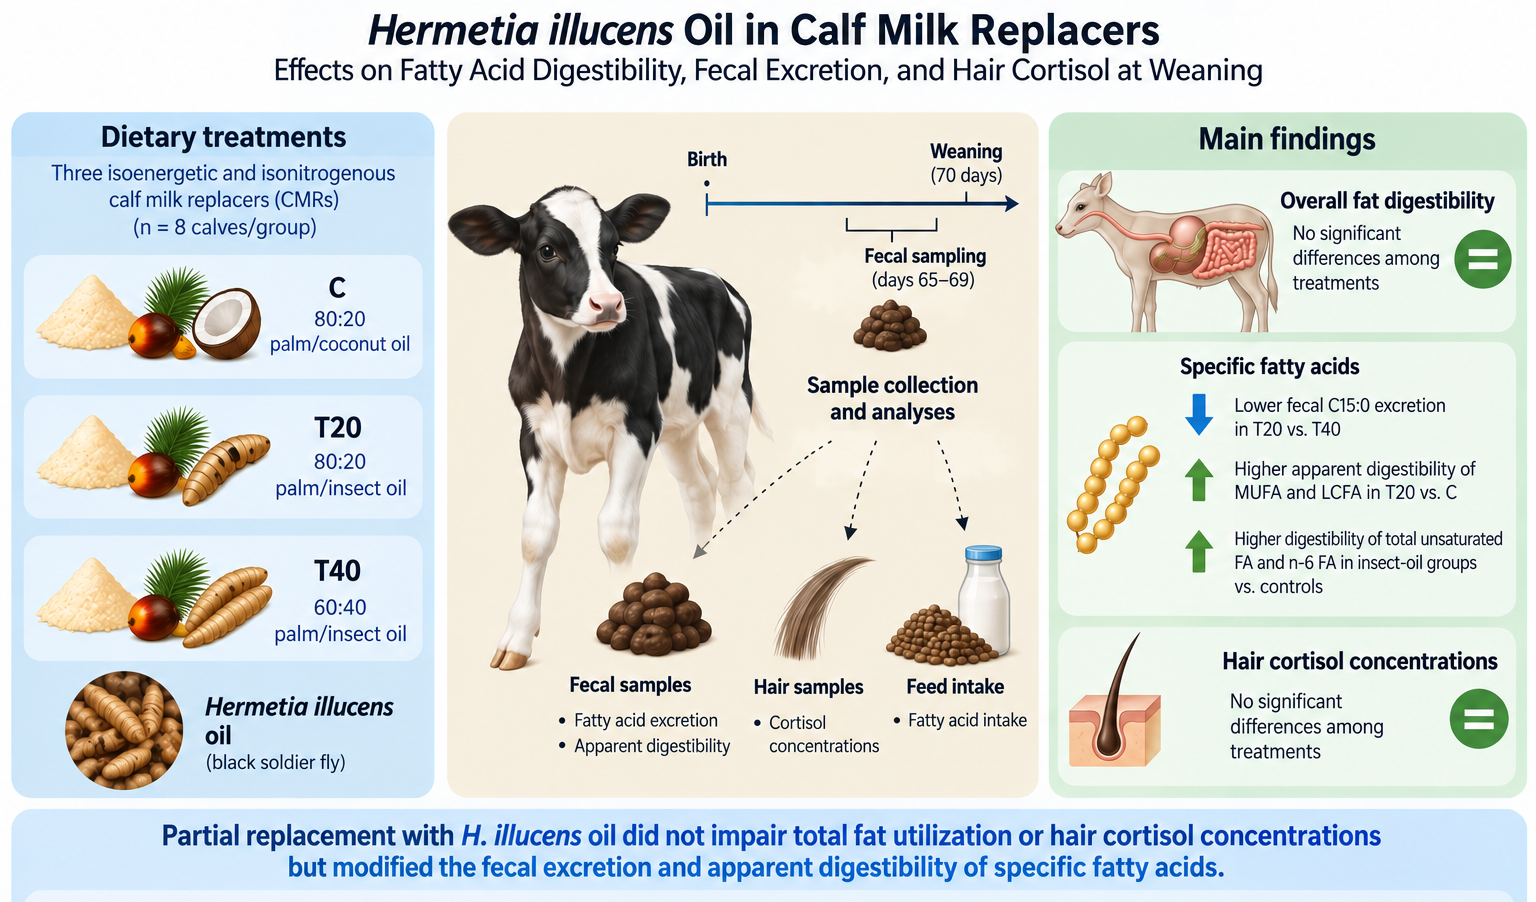
The use of alternative lipid sources in calf milk replacers (CMRs) may influence fatty acid (FA) digestion and metabolism during the transition from the preruminant to the ruminant stage. This study evaluated the effects of Hermetia illucens oil inclusion in CMRs on FA intake, fecal excretion, apparent digestibility, and hair cortisol concentrations in dairy calves. Twenty-four calves were randomly assigned to three isoenergetic and isonitrogenous CMRs (n = 8/group) differing in fat source: 80:20 palm/coconut oil (C), 80:20 palm/insect oil (T20), or 60:40 palm/insect oil (T40). Calves were gradually weaned at 70 days of age, and fecal samples were collected from days 65 to 69. Overall fat intake, fecal fat excretion, and apparent fat digestibility did not differ among treatments. However, treatment affected fecal excretion and apparent digestibility of individual FAs. T20 calves showed lower fecal C15:0 excretion than T40 calves. Apparent digestibility of MUFA and LCFA was higher in T20 than in C, while total unsaturated FA and n-6 FA digestibility was higher in insect-oil groups than in controls. Hair cortisol concentrations did not differ among treatments. Partial replacement with H. illucens oil did not impair total fat utilization or hair cortisol concentrations but modified the fecal excretion and apparent digestibility of specific FAs.
Keywords: 
;  ;  ;  ;  ;  ;  

1. Introduction

Dietary lipids contribute to energy supply of CMRs and influence the development of adipose tissue which is particularly important during early life stress or cold stress periods. It also supports thermoregulation, serve as structural components of membranes, and facilitates the absorption of fat-soluble vitamins essential for immune function acting as immune mediators, and antioxidant defense in pre-ruminant calves [1].
The digestibility of fat depends on several factors, including the chain length, degree of saturation, triglyceride structure and processing (e.g. emulsification) [2]. In general, CMRs commonly contain blends of vegetable oils and have a lower SFA (52-60%) and a higher polyunsaturated fatty acid (PUFA) content (7-13%), compared to bovine milk fat (71% SFA and 3% PUFA) [2]. In calves the different digestive dynamics of fat can influence the lipid metabolism in different ways [2], as well as the fatty acid (FA) profile and the development of different body tissues [3], and potentially modifying their functionality [4,5]; digestive dynamics of fat also affect growth performance [6,7].
In addition, fecal lipids are recognized as indicators of gastrointestinal system maturation and metabolic interactions between host and microbiome [8,9], and can provide noninvasive approach insights into gut metabolism, mucosal development, and immunity [6,7,10].
During weaning phase, structural and microbial changes, including increased fermentation activity and epithelial proliferation, are important features of digestive and metabolic adaptation [11].
Our previous study evaluated isoenergetic and isonitrogenous cow’s milk replacers (CMRs) with different fat formulations, in which palm and coconut oils were partially or completely replaced with Hermetia illucens oil. The results showed that the different lipid formulations did not significantly affect apparent nutrient digestibility or feed efficiency at weaning, indicating that black soldier fly oil could be included in CMRs without impairing these parameters. However, calves fed the CMR containing an 80:20 palm/insect oil ratio tended to have a lower dry matter intake than those receiving the control CMR (80:20 palm/coconut oil) and showed a lower average body weight than calves fed the CMR containing a 60:40 palm/insect oil ratio [12]. In addition to digestive responses, changes in dietary lipid sources may influence the physiological adaptation of calves during the pre-weaning period.
Although the effects of dietary lipid sources on fat digestion in young calves have been extensively investigated, information on the utilization of individual fatty acids from alternative lipid sources during weaning remains limited. In particular, to our knowledge, no information is currently available on the apparent digestibility and fecal excretion of individual fatty acids in calves fed milk replacers containing Hermetia illucens oil. This information may be particularly relevant during the transition from the preruminant to the ruminant stage, when the increasing consumption of solid feed progressively modifies digestive processes and microbial contribution to fatty acid metabolism.
On the other hands, Hair cortisol provides an non-invasive indicator of long-term hypothalamic–pituitary–adrenal (HPA) axis activity [13] and may therefore help to assess whether different CMR fat formulations are associated with changes in the physiological stress response during this critical transition phase.
This study reports a prespecified secondary analysis conducted in the same experimental cohort described by Altomonte et al. [12] aimed to provide further insight into the potential effects of different CMR fat formulations in calves by evaluating fatty acid digestibility, fecal fatty acid markers associated with rumen bacterial colonization and functionality, and hair cortisol concentrations at weaning.

2. Materials and Methods

2.1. Animals, Samples and Diets

The experiment was carried out on a commercial dairy farm in central Italy between September 2023 and January 2024. Animal care and procedures were carried out in accordance with the Guide for the Care and Use of Laboratory Animals and Directive 2010/63/EU for animal experiments, using noninvasive medical procedures. The study was performed with the consent of the animals’ owner.
Ambient temperature ranged from a maximum of 25 °C at the beginning of the trial to a minimum of 6 °C at the end of the trial. Initial body weight and detailed calf management conditions have been previously reported by Altomonte et al. [12].
Immediately after colostrum intake (day 0) Friesian calves were randomly assigned to 3 treatments (n = 8 heifers per group) for 10 weeks using three commercial isoenergetic and isonitrogenous CMRs (Table A1), which differed only in the fat source and fatty acids. The CMR control (C) included an 80/20 ratio of palm/coconut oil; CMR T20 included an 80/20 ratio of palm/insect oil from the black soldier fly; and CMR T40 included a 60/40 ratio of palm/insect oil from the black soldier fly.
Single batches of experimental CMR were manufactured by a commercial producer using the same emulsifiers, stabilizers, ingredients (except oil sources) and processing conditions.
Calves were fed according to the feeding program previously described by Altomonte et al. [12]. Briefly, CMR was offered according to a step-down feeding schedule until complete weaning at 70 days of age. Calves also had access to pelleted starter feed and chopped straw throughout the trial. The chemical composition and ingredients of the starter feed are reported in Table A2. Solid feed and water were offered ad libitum from day one of the study.
The amount of CMR and the feed offered and refused by the calves were weighed by a scale, and data were recorded every morning before the new feed distribution to determine the dry matter intake (DMI). No spontaneous refusals of liquid CMR occurred during the trial.
Samples of diets and orts were collected at the beginning, middle and end of the trial and stored at −20 °C prior to analysis for proximate nutrients; they were analyzed in duplicate.
Weaning was gradual and induced at about week 10. At the ages of 65, 66, 67, 68, and 69 days, feces were individually collected from each animal 8 h after the feed delivery as reported in our previous study Altomonte et al. [12] and stored at −20 °C prior to analysis for chemical composition. For fatty acid analysis, fecal samples collected from each calf over the five sampling days were pooled to obtain one representative composite sample per animal.

2.2. Chemical Analysis of Feed, Milk Replacers and Feces

Starter feed, straw, CMRs were analyzed in terms of chemical composition, according to the methods of the Association of Official Analytical Chemists (AOAC) to determine DM (method No. 930.15), ash (method No. 942.05) and crude protein (method No. 984.13) [14]. Ether extract content was determined by Soxhlet extraction (method No. 991.36). Neutral detergent fiber (aNDF) was determined in starter feed, straw and according to EN ISO 16472, by adding α-amylase (Merck, Darmstadt, Germany) and correcting for residual ash content.
A total starch assay kit (Megazyme Ltd., Bray, Co. Wicklow, Ireland) was used to determine the total starch in starter feed (AOAC Method 996.11, AACC Method 76-13.01).
In the CMRs, fat was extracted using the Rose–Gottlieb method [15], whereas fat from feed and fecal samples was extracted according to the Folch method [16]. Fatty acid methyl esters (FAMEs) were prepared according to Christie [17] and analyzed by gas chromatography by a PerkinElmer Clarus 480 equipped with a flame ionization detector and a capillary column (TR-FAME 60 m × 0.25 mm ID; film thickness 0.25 μm, Thermo Fisher Scientific, Waltham, MA, USA). The peak areas of individual FAs were identified using a fatty acid standard injection (Food Industry FAME Mix—Restek Corporation, Bellefonte, PA, USA) and quantified as the percentage of total FAs.
Acid-detergent insoluble ash (AIA) was analyzed in feed (CMR, concentrate and hay) and in feces according to Liu [18] and used as an internal marker for predicting fecal output and digestibility [19].
The daily marker intake (AIA intake) was calculated using the following formula:
AIA daily intake = ([(AIA feed × Q feed) − (AIA orts × Q orts]
where:
  • AIA feed is the concentration of marker in feed offered (g/kg DM);
  • Q feed is the amount of feed offered daily (kg/day);
  • AIA orts is the concentration of marker in orts (g/kg DM);
  • Q orts is the amount of orts refused daily (kg/day);
The total-tract apparent digestibility (TTAD) of fat, and individual fatty acids was calculated as follows:
Fat TTAD (%) = 100 – 100 × [(AIA diet / AIA feces) × (Fecal fat / Feed fat)],
Individual Fatty acids TTAD (%) = 100 − 100 × [(AIA diet /AIA feces) × (Fecal individual FA / Feed individual FA)].
Daily fecal output (FO) (kg DM/day) was calculated as follows and subsequently used to estimate the daily excretion of nutrients and minerals:
FO = (AIA daily intake/AIA feces),
where:
  • AIA daily intake is in g/day;
  • AIA feces is the amount of marker in feces (g/kg DM).

2.3. Hair Samples Collection, Storage and Analysis

To specifically assess cumulative cortisol exposure during the weaning period, a defined area of the croup region was shaved at the beginning of weaning. At the end of the weaning period, the hair regrown within the same area was completely collected for cortisol analysis, ensuring that the analyzed hair reflected cortisol accumulation during the weaning period. Hair samples were collected from the left left rump (croup) region. At the end of the study, a square area of approximately 5 × 5 cm was clipped as close as possible to the skin using clean electric clippers. Clippers were cleaned and disinfected between animals to prevent cross-contamination. All clipped hair was collected. The hair samples were stored on a paper sheet, sealed, and stored in a dry, dark environment for a maximum of 3 months.
Hair cortisol was extracted according to Mariti et al. [13]. Briefly, 200 mg of hair were washed three times with methanol and dried overnight. The hair was then minced into fragments shorter than 1 mm, and a 50-mg aliquot was incubated with 1 mL of methanol for 24 h at room temperature. After centrifugation, 0.6 mL of supernatant was collected, evaporated under a nitrogen stream, and stored at −20 °C until analysis.
The dried extracts were reconstituted in 200 µL of Assay Diluent, and cortisol concentrations were determined in duplicate using a competitive enzyme immunoassay kit (Expanded Range High Sensitivity Salivary Cortisol Enzyme Immunoassay Kit, Salimetrics LLC, State College, PA, USA; item no. 1-3002), following the manufacturer’s instructions. Optical density was measured at 450 nm, and cortisol concentrations were calculated using a four-parameter logistic standard curve and expressed as pg/mg of hair.

2.4. Statistical Analysis

Means and standard deviations were calculated for the chemical composition of the starter feed, straw and CMRs.
Weekly fatty acid intake data were analyzed using a linear mixed model fitted by restricted maximum likelihood (REML), with treatment, time, and the treatment × time interaction included as fixed effects and calf included as a random effect. JMP version 17.7. (SAS Institute Inc., Cary, NC, USA) [20].
Data collected at the end of the trial (days 65–69), including fatty acid intake, fecal fatty acid excretion, and total-tract apparent digestibility of fat and individual fatty acids, were analyzed using a one-way model with treatment as the fixed effect. Normality of residuals was assessed using the Shapiro–Wilk test. When a significant treatment effect was detected, pairwise comparisons among least-squares means were performed using Tukey’s Honest Significant Difference (HSD) test.
Hair cortisol concentrations were analyzed using the Kruskal–Wallis test. Since hair cortisol concentrations did not differ among dietary treatments, pairwise post-hoc comparisons were not performed.
Statistical significance was declared at p < 0.05.
Apparent digestibility was considered not interpretable (nd) for fatty acids occurring at very low dietary intakes when fecal excretion was comparable to or exceeded dietary intake, likely because of endogenous and/or microbial contributions to fecal fatty acids.

3. Results

Overall, fatty acid intake trends differed among treatments (Table A3), reflecting the different fatty acid profiles of the experimental CMRs [12] as well as the contribution of starter feed intake
During the trial, calves in the T40 group showed a higher (P < 0.05) PUFA intake than the control group from weeks 4 to 9 and a higher (P < 0.05) intake of medium-chain fatty acids (MCFA) than both the C and T20 groups over the same period. In contrast, calves in the T20 group had a lower (P < 0.05). SFA intake than the other groups for most of the pre-weaning period (weeks 2–8) and a lower (P < 0.05) intake of short-chain fatty acids (SCFA) until the end of the pre-weaning period (Table S3).
Average daily fat intake during days 65–69 As (Table 1), did not differ among groups. However, average SCFA was significantly higher in the C group than in both insect-oil groups (P < 0.01).
Differences between groups were also observed for several individual FA intakes. The C group showed lower C4:0 and higher intakes of C10:0 than T20 and T40 (P < 0.01), while C6:0 intake was higher (P < 0.01), in T40 than in the other groups.
C12:0 and C13:0 and C16:1 intake progressively increased with insect oil inclusion, being lowest in C, intermediate in T20, and highest in T40 (P < 0.01). On the contrary C8:0, C20:3 n6, and C21:0 progressively decreased with insect oil inclusion.
T20 showed the highest intakes of C14:1, C15:0, C15:1 and C16:0. Both insect-oil groups had significant higher intakes (P < 0.01) of C18:1 trans-9, C18:1 trans-11, C18:2 all-trans and C18:3 n6 than the C group.
Among the fatty acids present at lower dietary concentrations, significant treatment differences were also detected for C20:0, C20:3 n-3, C20:4 n-6, C20:5 n3, and C22:6 highest concentration in T20 (P < 0.05).
No significant differences among groups were observed for the intake of the quantitatively predominant C18 fatty acids, including C18:0, C18:1 cis-9, C18:2 n-6 cis
Total fecal fat excretion (g/day) did not differ among groups (Table 2). No significant differences were observed for the fecal excretion in the fatty acid classes however, the UNS/SFA ratio tended to be higher in T40 than in the other groups (P =0.05).
Despite the overall similarity in the major fatty acid classes, treatment affected the fecal excretion of several individual fatty acids. T20 showed lower (P < 0.05) fecal excretion of C8:0 and C16:0 than C group, while T40 showed intermediate values for C8 and C 16:0 and the highest excretions of C15:0 and C15:1 cis-10. In addition, C16:1 showed increasing trend con inclusion of insect oil with higher (P < 0.05) fecal excretions T40 the C group.
Both insect-oil groups (T20 and T40) showed lower fecal excretion of C18:1 trans-11, C20:1, and C20:3 n-3 than the C group (P < 0.01). Compared with T20, the T40 group also had higher fecal excretion of C15:0 (P < 0.01), as well as C20:5 n-3, C22:5 n-3, and C22:6 n-3 (P < 0.05), whereas T20 showed lowest excretion of C22:5 n-3 and C22:6 n-3 than both C and T40 (P < 0.05).
No significant treatment effects were observed for most of the quantitatively predominant fatty acids, including C14,0 C18:0, C18:1 cis-9, C18:2 cis-9, cis-12.
Apparent fat and fatty acid digestibility is reported in Table 3. Overall fat digestibility was high in all experimental groups, with values of approximately 90-91%, and did not differ among treatments. Regarding fatty acid digestibility, high apparent digestibility coefficients were observed across all experimental groups: digestibility exceeded 90% for some of the major fatty acids, particularly oleic acid (C18:1 cis-9) and linoleic acid (C18:2 cis-9, cis-12), whereas for several minor fatty acids (including C11:0, C13:0, C14:1, C15:0, C15:1, C18:1 trans-9, C18:1 trans-11, C18:2 trans-9, trans-12, C18:3 n-6, CLA cis-9, trans-11, C21:0, C20:3 n-6, C22:0, and C24:1C20:3 n-3, C22:1, C20:4, C20:5 n-3, and C22:6 n-3) showed no detectable apparent digestibility values, because of the very low dietary intake and the possible contribution of endogenous and microbial fatty acids to fecal excretion.
No significant differences were observed among groups for SFA, PUFA, SCFA, MCFA, or total n-3 fatty acid digestibility. Conversely, treatment significantly affected the digestibility of MUFA digestibility was significantly higher (P < 0.01) in T20 than in C. Accordingly, total UNS digestibility was higher in both insect-oil groups than in C (P < 0.05). LCFA digestibility was highest in T20 and lowest (P < 0.01) in C, with T40 showing an intermediate value; n-6 fatty acid digestibility was higher (P < 0.01) in T20 and T40 than in C.
Among medium-chain fatty acids, C8:0 digestibility was higher (P < 0.05) in T20 than in T40, with C showing an intermediate value, whereas C12:0 showed the opposite pattern, with higher (P < 0.05) digestibility in T40 than in T20. No treatment differences were detected for C10:0 or C14:0, whereas C18:0, C18:1 cis 9, C18:2 n6 showed higher digestibility values (P < 0.05) in T20 than control.
Hair cortisol concentrations did not differ significantly among dietary treatments (Kruskal–Wallis test, P = 0.128), with median (IQR) values of 16.92 (14.10–17.65), 14.12 (13.50–14.77), and 19.86 (16.44–20.53) pg/mg in the C, T20, and T40 groups, respectively.

4. Discussion

The lower intake of SCFA, C8:0, and C10:0 observed in the insect-oil groups compared with the C group (Table 1) is consistent with the complete replacement of coconut oil in the CMRs, as coconut oil is richer in these fatty acids than palm oil [21,22].
Conversely, the higher intakes of C14:1, C15:1, and C16:1 in observed in the insect-oil groups compared with the control reflected the fatty acid composition of the CMRs [12] and may be related to the replacement of coconut oil and the greater contribution of Hermetia illucens and palm oils, which are relatively richer in these fatty acids [23]. Similarly, the higher intake of several minor LCFA, including C18:1 trans-9, C18:1 trans-11, C18:2 trans, and C18:3 n-6, observed in the insect-oil groups is consistent with the lipid profiles of palm and Hermetia illucens oils used in the experimental CMRs [12].
With the exception of C16:0, the FA present at higher concentrations in the starter feed, namely C18:0, C18:1 cis-9, C18:2 all-cis, and C18:3 n-3, did not differ in intake among groups.
Regarding fecal FA excretion (Table 2), C14:0, C16:0, C18:0, and C18:1 were the predominant fecal FA, in agreement with previous studies in calves [10,24,25], whereas the other FA occurred at lower concentrations and represented minor components of the fecal fatty acid profile (Table A4). For the predominant FA (C14:0, C16:0, C18:0, and C18:1), dietary supply may be an important contributor to their relatively high fecal excretion. Indeed, the CMRs used in the present study contained coconut and palm oils, which contributed to C14:0, while C16:0 was also one of the major fatty acids supplied by the starter feed.
In addition, the higher fecal excretion of C16:1 observed in the T40 group may primarily reflect its greater dietary supply, as Hermetia illucens lipids contain appreciable amounts of this FA [23]. Conversely, the higher fecal excretion of C15:0 and C15:1 in T40 may also indicate a greater contribution of rumen microbial lipid synthesis. In fact, odd chain FA are commonly associated with rumen microbial lipid synthesis and can therefore provide indirect information on microbial fatty acid metabolism [26]. Similarly, in small animals reduced presence of C15:0 in feces may reflect lower microbiota production [27].
Therefore, the lower fecal excretion of odd-chain fatty acids (C15:0 and C15:1) together with the marked reduction in trans-vaccenic acid (C18:1 t11) observed in T20 may reflect differences in micobial fatty acids metabolism or the contribution of rumen-derived lipids. These findings are likely associated with the reduced starter intake observed in our previous study [12] during the first weeks of weaning. Since ruminal fermentation and microbial colonization in young calves are strongly influenced by concentrate consumption [28], the lower starter intake observed in the T20 group [12] may have influenced rumen microbial activity. This interpretation remains speculative, because rumen fermentation and microbial population were not directly assessed.
Despite the similar overall fat digestibility among groups (Table 3), a higher apparent digestibility of C8:0 was found in the T20 group (Table 3), this may be related to its lower dietary intake and fecal excretion, whereas T40 showed lower C8:0 digestibility, with the control group exhibiting intermediate values.
C12:0 apparent digestibility was higher in T40 group than control (p < 0.05), this could be related to the diet and in agreement with the literature in fact full-fat insect meals, H. illucens larvae, are rich in lauric acid (C12:0) [29].
As observed also in our study also other authors [30,31] have reported relatively modest differences in apparent digestibility among individual LCFA. Apparent digestibility coefficients for most LCFA were generally within the range of 70–90%, consistent with values previously reported in cattle [30,31].
Calves fed the insect oil-containing CMRs showed higher apparent digestibility of UNS fatty acids than control calves, with T20 also exhibiting greater MUFA digestibility. Regarding individual fatty acids, the UNS fatty acids generally showed higher apparent digestibility than their corresponding saturated fatty acids (for example C18:0 and C18:1 cis 9).
The higher apparent digestibility of MUFA and UNS observed in the T20 group may reflect differences in lipid digestion and utilization and appears consistent with the findings reported by Jenkins [32]. In preruminant and weaning calves, the apparent digestibility of unsaturated fatty acids is generally very high before weaning, often reaching or exceeding 90%. This high utilization of UNS in preruminant calves has been attributed to efficient intestinal lipase activity and to the greater effectiveness of bile salts in promoting the emulsification and micellar solubilization of unsaturated compared with long-chain saturated fatty acids. Indeed, unsaturated fatty acids are more readily incorporated into mixed micelles in the small intestine than long-chain saturated fatty acids, such as C18:0, partly because of their lower melting point.
Consistent with our results, White et al. [33] reported an almost complete net disappearance of several C18 unsaturated fatty acids reaching the small intestine of steers. In contrast, C18:0 showed considerably lower apparent digestibility in our study, ranging from approximately 51% in the Control group to 72% in T20. These values are comparable to the approximately 60% disappearance reported for C18:0 by White et al. [33], further supporting the lower intestinal utilization of stearic acid compared with unsaturated C18 fatty acids.
Taken together, the high apparent digestibility of UNS and the lower fecal excretion of C15:0 observed in T20 calves could be cautiously interpreted as being consistent with a slower transition toward a fully functional ruminant digestive pattern. Since odd-chain fatty acids such as C15:0 are largely associated with rumen microbial lipid synthesis, their lower fecal excretion may reflect a lower contribution of rumen microbial metabolism. This hypothesis is also consistent with the reduced solid feed intake and lower average body weight of T20 calves compared with T40 calves observed in our previous study [12], as solid feed intake is a major driver of rumen development and microbial activity [28]. However, because rumen fermentation and microbial populations were not directly assessed, this hypothesis should be interpreted with caution.
Hair cortisol values observed in the present study fall within the broad range (1.57 a 138.22 pg/mg), previously reported in young dairy calves [34]. Moreover, hair cortisol concentrations did not differ among dietary treatments (Table 3), suggesting that the different CMR fat formulations did not markedly affect it. Therefore, despite the treatment-related differences observed in fatty acid intake, fecal excretion, and apparent digestibility, the inclusion of insect oil in the CMR did not appear to adversely affect the long-term physiological stress response of the calves.
The present findings extend our previous observations by showing that, although replacing conventional fat sources with Hermetia illucens oil did not affect overall fat digestibility, it modified the apparent digestibility and fecal excretion of specific fatty acids. Thus, evaluation of individual fatty acids revealed treatment-related responses that were not detectable when considering total fat digestibility alone, providing additional insight into lipid utilization during the transition toward a functional ruminant digestive system.

5. Conclusions

Partial replacement of conventional fat sources with Hermetia illucens oil did not impair overall fat digestibility or hair cortisol in pre-weaning calves, although it affected the apparent digestibility of specific fatty acids and fatty acid classes. The T20 treatment showed the most pronounced changes, with greater apparent digestibility of MUFA, and UNS.
Overall, these findings indicate that the effects of insect oil supplementation may also involve changes in fatty acid fecal excretions and apparent digestibility during the transition toward a functional rumen depending on the inclusion level. Further studies, including direct measurements of rumen fermentation and microbial populations, are needed to clarify the mechanisms underlying these responses.

Author Contributions

Conceptualization, I.A.; methodology, I.A. and F.S.; software, I.A.; formal analysis, I.A., M.F., V.G, A.G; investigation, I.A., M.F. V.G, and A.G;.; resources, M.M. and F.S.; data curation, I.A.; writing—original draft preparation, I.A.; writing—review and editing, I.A., F.S., M.F, A.G, V.G., M.M.; supervision, M.M. and I.A. All authors have read and agreed to the published version of the manuscript.

Funding

This research received no external funding.

Institutional Review Board Statement

The authors confirm that the ethical policies of the journal, as noted on the journal’s author guidelines page, have been adhered to. Animal care and procedures were in accordance with the Guide for the Care and Use of Laboratory Animals and Directive 2010/63/EU for animal experiments (National law: D.L. 26/2014).

Data Availability Statement

The original contributions presented in this study are included in the article. Further inquiries can be directed to the corresponding author.”

Acknowledgments

The authors would like to thank Dr. Matteo Boggian and the Maccarese Farm, Rome, Italy.

Conflicts of Interest

The authors declare no conflicts of interest.

Appendix A

Table A1. Composition of starter feed and straw used in the experiment.
Starter feed Straw
mean±SD mean±SD
Dry matter (%) 90.08 ±0.78 91.60±0.28
Crude Protein (% of DM) 19.82±0.88 9.31±0.80
Fiber (% of DM) 11.01±1.1 39.84±3.74
NDF (% of DM) 32.73±0.37 70.62±0.61
Starch (% of DM) 21.19±0.19 1.28±0.10
Fat (% of DM) 3.67±0.01 0.70±0.02
Ash (% of DM) 8.35±0.12 15.81±0.12
Table A2. Composition of calf milk replacers (CMR) varying in oil composition used in the experiment.
Control
80/20 ratio of palm/coconut oil
Treatment
80/20 ratio of palm/insect oil
Treatment
70/30 ratio of palm/insect oil/coconut oil
Treatment
60/40 ratio of palm/insect oil
mean±SD mean±SD mean±SD mean±SD
Dry matter (%) 96.74±1.14 97.41±0.45 97.22±0.39 97.57±0.39
Crude Protein (% of DM) 25.11±0.41 24.73±0.49 25.73 ±0.27 25.08±0.27
Fat (% of DM) 18.6±0.24 18.9±0.64 18.75±0.35 18.8±0.48
Lactose 1 (% of DM) 45.4 46.1 45.84 46.89
Ash (% of DM) 7.59± 0.12 7.68± 0.25 6.90 ±0.82 6.80±0.82
1 Lactose was calculated as follow: DM – (fat + crude protein + ash).
Table A3. Total intake of fatty acids from cow’s milk replacer (CMR) and starter feed throughout the trial in the three groups of calves.
1w 2w 3w 4w 5w 6w 7w 8w 9w 10w time treatment Treatment x time
SFA total intake (g/day) p p p
C Group 65.74a 75.70a 85.63a 98.71a 100.39a 102.53a 103.6a 103.25a 78.39 48.19 <0.001 0.004 <0.001
T20 Group 53.51b 59.69b 74.32b 87.08b 90.17b 91.70B b 93.92B b 92.29b 71.60 52.73
T40 Group 63.55a 81.70a 93.20a 102.68a 102.86a 103.66a 105.66a 101.71b 78.61 49.96
MUFA total intake (g/day)
C Group 35.21a 40.50a 45.95 53.52a 54.68a 56.44a 57.90a 59.94a 48.91a 34.23 <0.001 0.002 0.032
T20 Group 30.53ab 33.93b 42.27 49.69ab 51.59ab 52.64ab 54.48ab 54.14ab 44.65ab 36.80
T40 Group 29.33b 37.56ab 42.95 48.11b 48.31b 49.33b 51.35b 50.25b 43.44b 33.44
PUFA total intake (g/day)
C Group 8.17 9.30b 10.90b 14.22b 15.20b 17.28b 20.07b 26.68a 30.45a 31.20 <0.001 0.002 <0.001
T20 Group 9.25 9.97b 12.53b 15.18b 16.13b 16.94b 19.09b 20.66b 24.20b 30.00
T40 Group 10.54 13.20a 15.30a 18.92a 19.25a 21.08a 24.23a 25.44a 31.61a 35.19
SCFA total intake (g/day)
C Group 3.59a 4.13a 4.67a 5.39a 5.48a 5.60a 5.66a 5.64a 4.29a 2.65a <0.001 0.001 <0.001
T20 Group 1.53c 1.70c 2.12c 2.49c 2.58c 2.64c 2.73c 2.71c 2.24c 1.85b
T40 Group 2.05b 2.63b 3.01b 3.34b 3.35b 3.40b 3.51b 3.41b 2.80b 1.99b
MCFA total intake (g/day)
C Group 56.52a 65.09b 73.61b 84.76b 86.17b 87.91b 88.70b 88.06ab 66.34a 40.15 <0.001 0.001 <0.001
T20 Group 48.64b 54.28c 67.58b 79.14b 81.92b 83.26b 85.13b 83.49b 64.11 46.23
T40 Group 61.08a 75.69a 86.33a 94.92a 95.06a 95.65a 97.24a 93.41a 71.10 42.48
LCFA total intake (g/day)
C Group 49.33 56.59 64.61 76.77 79.09 83.22 87.68 96.61 87.41 70.97 <0.001 0.013 0.109
T20 Group 44.14 48.68 60.77 71.89 75.01 77.01 81.29 82.48 75.25 72.15
T40 Group 43.95 56.00 64.24 73.75 74.32 77.32 82.79 82.77 81.27 73.54
C = control group feeding CMR with 80/20 palm/coconut oil ratio. T20 = treatment group feeding CMR with 80/20 palm/insect oil ratio. T40 = treatment group feeding CMR with 60/40 palm/insect oil ratio. Different uppercase letters within the same column indicate significant differences within treatment groups (p < 0.05).
Table A4. Fatty acid profile of feces of the three groups.
% of the total fatty acids C 1 group T20 2 group T40 3 group SE p
C6:0 0.47 0.18 0.27 0.26 0.647
C8:0 0.60 0.24 0.40 0.20 0.487
C10:0 2.94 3.79 1.98 0.77 1.885
C11:0 0.76 1.34 0.71 0.86 2.112
C12:0 0.94B 2.39A 1.22B 0.32 0.001
C13:0 0.87 0.68 0.86 0.33 0.804
C14:0 4.64b 9.71a 7.97ab 1.15 2.831
C14-1 cis9 2.63b 3.21a 3.13ab 0.43 0.033
C15:0 1.75B 1.48B 3.00A 0.37 0.906
C15-1 cis10 2.31ab 1.87b 2.63a 0.51 0.037
C16:0 37.98 25.91 25.76 0.87 11.968
C16-1 cis9 0.12 0.30 0.33 0.10 0.245
C17:0 1.12b 2.24a 1.12b 0.42 1.032
C17-1 cis10 0.27B 1.40a 1.57a 0.95 0.032
C18:0 8.84 11.58 12.26 1.17 2.846
C18-1 trans9 1.72 2.37 2.81 0.74 1.816
C18-1 trans11 0.923a 0.001b 0.06b 0.24 0.596
C18:1 cis9 8.75 10.62 11.62 1.47 3.641
C18-1cis7 1.19 1.06 1.16 0.23 0.564
C18-2n-trans 9,12 0.35 0.49 0.32 0.09 0.242
C18-2n-6 cis9,12 4.07 4.78 5.71 1.09 2.67
C18-3n-6(6,9,12) 1.29b 2.31a 1.38b 0.61 0.013
C18-3n3 (9,12,15) 1.53b 2.42a 2.32a 0.49 0.023
C20:0 0.25AB 0.09B 0.37a 0.10 0.006
Cla9c-11t 0.49 0.62 0.72 0.19 0.005
C21:0 3.17a 0.15b 0.51b 1.17 0.032
C20-1 1.53a 0.73b 0.46b 0.42 0.062
C20-2 0.00B 0.03B 0.20a 0.10 0.0028
C20-3 n6(8,11,14) 0.62 0.40 0.61 0.44 1.074
C20-4 n6 0.20 0.10 0.08 0.11
C20-3n-3(11,14,17) 0.32ab 0.04b 0.07b 0.11 0.248
C22:0 0.83 0.71 0.84 0.27 0.672
C22-1 0.16 0.19 0.24 0.12 0.072
C22-1n9 0.17 0.10 0.03 0.07 0.178
C20-5n3 0.19 0.13 0.26 0.10 0.237
C23:0 1.00b 1.91a 0.95b 0.41 0.021
C22-2 0.14 0.10 0.18 0.08 0.029
C24:0 0.75a 0.41b 0.68ab 0.18 0.018
C24-1 1.82 1.50 1.49 0.40 0.984
C22-5n3 1.84 1.99 2.22 0.43 1.061
C22-6n3 0.44ab 0.17b 0.48a 0.18 0.058
C17:0+C17:1 2.57b 4.05a 2.63b 0.058
SCFA 7 4.92 4.79 3.59 1.16 2.835
MCFA 8 53.61 51.03 48.33 3.44 8.661
LCFA 9 41.45b 44.18a 48.06a 4.49 0.068
SFA 4 67.36a 63.65ab 59.74b 3.47 0.044
MUFA 5 21.40 23.36 25.73 2.51 0.169
PUFA 6 11.23b 12.98ab 14.48a 1.84 0.044
UNS/SFA 0.55 0.58 0.68 0.08 1.414
Omega 3 4.85b 5.06b 6.03ab 1.08 0.041
Omega 6 6.54 7.87 8.11 1.24 0.362
a,b: p < 0,05; A,B: p < 0,01; 1 C = control group feeding CMR with 80/20 palm/coconut oil ratio; 2 T20 = treatment group feeding CMR with 80/20 palm/insect oil ratio; 3 T40 = treatment group feeding CMR with 60/40 palm/insect oil ratio; 4 SFA = saturated fatty acids; 5 MUFA = monounsaturated saturated fatty acids; 6 PUFA = polyunsaturated saturated fatty acids; 7 SCFA = short chain fatty acids (< C11); 8 MCFA (≥ C11 < C18) medium chain fatty acids; 9 LCFA = long chain fatty acids (≥ C18).

References

  1. Drackley, J.K. Calf nutrition from birth to breeding. Vet. Clin. N. Am. Food Anim. Pract. 2008, 24, 55–86. [Google Scholar] [CrossRef]
  2. Wilms, J.N.; van der Nat, V.; Ghaffari, M.H.; Steele, M.A.; Sauerwein, H.; Martín-Tereso, J.; Leal, L.N. Fat composition of milk replacer influences growth performance, feeding behavior, and plasma fatty acid profile in ad libitum-fed calves. J. Dairy Sci. 2024, 107, 2797–2817. [Google Scholar] [CrossRef]
  3. Bascom, S.A.; James, R.E.; McGilliard, M.L.; Van Amburgh, M. Influence of dietary fat and protein on body composition of Jersey bull calves. J. Dairy Sci. 2007, 90, 5600–5609. [Google Scholar] [CrossRef]
  4. Sampath, H.; Ntambi, J.M. Polyunsaturated fatty acid regulation of genes of lipid metabolism. Annu. Rev. Nutr. 2005, 25, 317–340. [Google Scholar] [CrossRef]
  5. Jump, D.B.; Tripathy, S.; Depner, C.M. Fatty acid-regulated transcription factors in the liver. Annu. Rev. Nutr. 2013, 33, 249–269. [Google Scholar] [CrossRef]
  6. Hill, T.M.; VandeHaar, M.J.; Sordillo, L.M.; Catherman, D.R.; Bateman, H.G., II; Schlotterbeck, R.L. Fatty acid intake alters growth and immunity in milk-fed calves. J. Dairy Sci. 2011, 94, 3936–3948. [Google Scholar] [CrossRef]
  7. Hu, F.; Piao, M.; Yang, C.; Diao, Q.; Tu, Y. Effects of coconut oil and palm oil on growth, rumen microbiota, and fatty acid profile of suckling calves. Microorganisms 2023, 11, 655. [Google Scholar] [CrossRef]
  8. Zierer, J.; Jackson, M.A.; Kastenmüller, G.; Mangino, M.; Long, T.; Telenti, A.; Mohney, R.P.; Small, K.S.; Bell, J.T.; Steves, C.J.; Valdes, A.M.; Spector, T.D.; Menni, C. The fecal metabolome as a functional readout of the gut microbiome. Nat. Genet. 2018, 50, 790–795. [Google Scholar] [CrossRef]
  9. Yao, Y.; Ding, L.; Huang, X. Diverse functions of lipids and lipid metabolism in development. Small Methods 2020, 4, 1900564. [Google Scholar] [CrossRef]
  10. Ghaffari, M.H.; Sadri, H.; Hemmert, K.J.; Ostendorf, C.S.; Schuchardt, S.; Koch, C.; Sauerwein, H. Longitudinal characterization of fecal lipids in dairy heifers from birth to first calving. J. Dairy Sci. 2026, 109, 3011–3033. [Google Scholar] [CrossRef]
  11. Steele, M.A.; Penner, G.B.; Chaucheyras-Durand, F.; Guan, L.L. Development and physiology of the rumen and the lower gut: Targets for improving gut health. J. Dairy Sci. 2016, 99, 4955–4966. [Google Scholar] [CrossRef]
  12. Altomonte, I.; Salari, F.; Ferrara, M.; Vivo, T.; Martini, M. Hermetia illucens Oil in Calf Milk Replacers Sustains Nutrient Digestibility with Subtle Effects on Concentrate Intake Depending on the Inclusion Level. Animals 2026, 16, 2363. [Google Scholar] [CrossRef]
  13. Mariti, C.; Diverio, S.; Gutierrez, J.; Baragli, P.; Gazzano, A. Partial Analytic Validation of Determination of Cortisol in Dog Hair Using a Commercial EIA Kit. Dog Behav. 2020, 6, 1–15. [Google Scholar] [CrossRef]
  14. AOAC International. Official Methods of Analysis, 17th ed.; AOAC International: Gaithersburg, MD, USA, 2000; Volume I. [Google Scholar]
  15. IDF-FIL. International Standard 1D: Determination of Fat Content—Gravimetric Method; International Dairy Federation: Brussels, Belgium, 1996. [Google Scholar]
  16. Folch, J.; Lees, M.; Sloane Stanley, G.H. A simple method for the isolation and purification of total lipides from animal tissues. J. Biol. Chem. 1957, 226, 497–509. [Google Scholar] [CrossRef]
  17. Christie, W.W. A simple procedure for rapid transmethylation of glycerolipids and cholesteryl esters. J. Lipid Res. 1982, 23, 1072–1075. [Google Scholar] [CrossRef]
  18. Liu, K. New and improved methods for measuring acid-insoluble ash. Anim. Feed Sci. Technol. 2022, 288, 115282. [Google Scholar] [CrossRef]
  19. Kanani, J.; Philipp, D.; Coffey, K.P.; Kegley, E.B.; West, C.P.; Gadberry, S.; Jennings, J.; Young, A.N.; Rhein, R.T. Comparison of acid-detergent lignin, alkaline-peroxide lignin, and acid-detergent insoluble ash as internal markers for predicting fecal output and digestibility by cattle offered bermudagrass hays of varying nutrient composition. J. Anim. Sci. Biotechnol. 2014, 5, 7. [Google Scholar] [CrossRef]
  20. JMP®, version 17.7. SAS Institute Inc.: Cary, NC, USA.
  21. Veluchamy, S.R.; Mary, R.; Beegum, P.P.S.; Pandiselvam, R.; Padmanabhan, S.; Sathyan, N.; Shil, S.; Niral, V.; Musuvadi Ramarathinam, M.; Lokesha, A.N.; et al. Physicochemical characterization and fatty acid profiles of testa oils from various coconut (Cocos nucifera L.) genotypes. J. Sci. Food Agric. 2023, 103, 370–379. [Google Scholar] [CrossRef]
  22. Sabahannur; Alimuddin, S. Identification of fatty acids in virgin coconut oil (VCO), cocoa beans, crude palm oil (CPO), and palm kernel beans using gas chromatography. IOP Conf. Ser. Earth Environ. Sci. 2022, 1083, 012036. [Google Scholar] [CrossRef]
  23. Cullere, M.; Woods, M.J.; van Emmenes, L.; Pieterse, E.; Hoffman, L.C.; Dalle Zotte, A. Hermetia illucens Larvae Reared on Different Substrates in Broiler Quail Diets: Effect on Physicochemical and Sensory Quality of the Quail Meat. Animals 2019, 9, 525. [Google Scholar] [CrossRef]
  24. Ruiz-González, A.; Rico, D.E.; Rico, J.E. Modulation of fecal metabolites by heat stress and diet, and their association with inflammation and leaky gut markers in dairy cows. Metabolites 2022, 12, 142. [Google Scholar] [CrossRef]
  25. Anitaş, Ö.; Göncü, S. Relations between feces, urine, milk and blood fatty acid contents in cattle. MOJ Eco Environ. Sci. 2018, 3, 356–362. [Google Scholar] [CrossRef]
  26. Popova, M.; Ferlay, A.; Bougouin, A.; Eugène, M.; Martin, C.; Morgavi, D.P. Associating changes in the bacterial community of rumen and faeces and milk fatty acid profiles in dairy cows fed high-starch or starch and oil-supplemented diets. J. Dairy Res. 2022, 89, 249–258. [Google Scholar] [CrossRef]
  27. Rey, A.I.; Higueras, C.; Olmeda, P.; Sainz, A.; Gálvez, B.G.; Larrosa, M. Markers of Gut Health in Small Animals: Focus on Fatty Acids and Amino Acids as Indicators of Intestinal Functionality and Microbiome Activity. Animals 2025, 15, 1927. [Google Scholar] [CrossRef]
  28. Khan, M.A.; Bach, A.; Weary, D.M.; von Keyserlingk, M.A.G. Invited review: Transitioning from milk to solid feed in dairy heifers. J. Dairy Sci. 2016, 99, 885–902. [Google Scholar] [CrossRef]
  29. Renna, M.; Coppa, M.; Lussiana, C.; Le Morvan, A.; Gasco, L.; Maxin, G. Full-fat insect meals in ruminant nutrition: In vitro rumen fermentation characteristics and lipid biohydrogenation. J. Anim. Sci. Biotechnol. 2022, 13, 138. [Google Scholar] [CrossRef]
  30. Enjalbert, F.; Nicot, M.C.; Bayourthe, C.; Vernay, M.; Moncoulon, R. Effects of dietary calcium soaps of unsaturated fatty acids on digestion, milk composition and physical properties of butter. J. Dairy Res. 1997, 64, 181–195. [Google Scholar] [CrossRef]
  31. Moate, P.J.; Chalupa, W.; Jenkins, T.C.; Boston, R.C. A model to describe ruminal metabolism and intestinal absorption of long chain fatty acids. Anim. Feed Sci. Technol. 2004, 112, 79–105. [Google Scholar] [CrossRef]
  32. Jenkins, T. Lipid Metabolism in the Rumen. J. Dairy Sci. 1993, 76, 3851–3863. [Google Scholar] [CrossRef]
  33. White, B.G.; Ingalls, J.R.; Sharma, H.R.; McKirdy, J.A. The effect of whole sunflower seeds on the flow of fat and fatty acids through the gastrointestinal tract of cannulated Holstein steers. Can. J. Anim. Sci. 1987, 67, 447–45. [Google Scholar] [CrossRef]
  34. Tamminen, L.-M.; Keeling, L.J.; Svensson, A.; Briot, L.; Emanuelson, U. Unraveling the Complexity to Observe Associations Between Welfare Indicators and Hair Cortisol Concentration in Dairy Calves. Front. Anim. Sci. 2021, 2, 793558. [Google Scholar] [CrossRef]
Table 1. Average daily dietary intake of crude fat and fatty acids in the 3 groups of calves during days 65–69 of the trial (g/day).
C 1 group T20 2 group
T40 3 group
SE p
Intake of fat (g/day)
196.42 183.73 197.44 8.40 0.542
Intake of individual fatty acids (g/day)
C4:0 0.19B 0.23A 0.25A 0.01 <0.001
C6:0 0.25b 0.26b 0.30a 0.01 0.017
C8:0 0.80A 0.29B 0.22C 0.01 <0.001
C10:0 1.32A 0.79B 0.87B 0.04 <0.001
C11:0 0.002 0.004 0.003 0.0001 0.153
C12:0 5.67C 6.83B 9.03A 0.31 <0.001
C13:0 0.01C 0.014B 0.02A 0.001 <0.001
C14:0 3.98 3.94 4.16 0.15 0.062
C14:1 0.08C 0.13A 0.11B 0.006 <0.001
C15:0 0.10B 0.17A 0.10B 0.007 <0.001
C15:1 0.016C 0.029A 0.022B 0.001 <0.001
C16:0 29.30B 35.18A 28.71B 1.27 0.001
C16:1 0.32C 0.64B 0.75A 0.02 <0.001
C17:0 0.63 0.59 0.72 0.04 0.092
C18:0 4.96 5.57 5.06 0.20 0.134
C18:1 c9 33.31 36.80 32.53 1.39 0.101
C18:1 t9 0.02B 0.04A 0.03A 0.002 <0.001
C18:1 t11 0.06B 0.11A 0.10A 0.005 <0.001
C18:2 n6 cis 30.15 29.23 34.27 1.94 0.143
C18:2 n6 all trans 0.005C 0.03A 0.03A 0.001 <0.001
C18:3 n3 2.14 2.04 2.45 0.14 0.105
C18:3 n6 0.01B 0.03A 0.03A 0.001 <0.001
C20:0 0.15 B 0.20A 0.13B 0.01 <0.001
CLA 0.25 0.28 0.30 0.01 0.103
C20:1 0.37 0.35 0.40 0.02 0.208
C20:3 n3 0.002A 0.002A 0.001B 0.0001 <0.001
C20:3 n6 0.015A 0.010B 0.005C 0.0001 <0.001
C20:4 n6 0.011B 0.014A 0.011B 0.001 <0.001
C20:5 n3 0.005B 0.007A 0.002C 0.003 <0.001
C21:0 0.05A 0.01B 0.0003C 0.0003 0.001
C22:0 0.29 0.29 0.33 0.02 0.187
C22:1 0.002C 0.003B 0.004A 0.0002 <0.001
C23:0 0.21ab 0.18b 0.23a 0.01 0.026
C24:0 0.26 0.23 0.28 0.02 0.126
C24:1 0.003B 0.003B 0.005A 0.0001 <0.001
C22:5 0.17 0.15 0.18 0.01 0.124
C22:6 0.002B 0.003A 0.001C 0.0001 <0.001
SCFA 7 2.67A 1.95B 2.06B 0.07 <0.001
MCFA 8 40.59 46.46 43.95 1.82 0.103
LCFA 9 73.06 76.12 77.08 3.77 0.660
SFA 48.37 55.25 51.02 2.00 0.059
MUFA 5 34.88 38.68 34.67 1.47 0.141
PUFA 6 32.77 31.79 37.29 2.11 0.141
UNS/SFA 1.36 1.30 1.41 0.05 0.068
Omega 3 2.31 2.20 2.65 0.15 0.099
Omega 6 30.18 29.31 34.35 1.94 0.143
a,b: P <0,05; A,B: P <0,01. 1 C = control group feeding CMR with 80/20 palm/coconut oil ratio; 2 T20 = treatment group feeding CMR with 80/20 palm/insect oil ratio; 3 T40 = treatment group feeding CMR with 60/40 palm/insect oil ratio; 4 SFA = saturated fatty acids; 5 MUFA = monounsaturated saturated fatty acids; 6 PUFA = polyunsaturated saturated fatty acids; 7 SCFA = short chain fatty acids (< C11); 8 MCFA (≥ C11 < C18) medium chain fatty acids; 9 LCFA = long chain fatty acids (≥ C18).
Table 2. Average daily dietary intake of crude fat and fatty acids in the 3 groups of calves during days 65–69 of the trial (g/day).
C 1 group T20 2 group T40 3 group SE p
Fat 16.94 13.63 17.81 2.57 0.572
C6:0 0.05 0.02 0.05 0.04 0.455
C8:0 0.11a 0.02b 0.07ab 0.03 0.023
C10:0 0.54 0.48 0.35 0.11 0.228
C11:0 0.15 0.13 0.12 0.11 0.110
C12:0 0.18 0.32 0.23 0.07 0.051
C13:0 0.11 0.07 0.15 0.05 0.128
C14:0 0.96 1.27 1.44 0.26 0.335
C14:1 c9 0.53 0.41 0.54 0.11 0.636
C15:0 0.35AB 0.21B 0.50A 0.07 0.008
C15:1 c10 0.24b 0.24b 0.46a 0.10 0.013
C16:0 5.79a 3.49b 4.54ab 0.82 0.039
C16:1 c9 0.02b 0.04ab 0.06a 0.02 0.011
C17:0 0.23 0.28 0.22 0.08 0.670
C17:1 0.19 0.19 0.24 0.13 0.761
C18:0 1.96 1.49 2.21 0.40 0.280
C18:1 t9 0.64 0.29 0.59 0.24 0.180
C18:1 t11 0.11a 0.03b 0.02b 0.03 0.004
C18:1 c9 1.84 1.45 2.14 0.49 0.313
C18:1 c7 0.23 0.15 0.22 0.06 0.182
C18:2 trans 9,12 0.07 0.06 0.06 0.02 0.362
C18:2 cis 9,12 0.92 0.70 1.11 0.26 0.216
C18:3 n6 0.21 0.25 0.23 0.07 0.917
C18:3 n3 0.25 0.28 0.40 0.07 0.09
C20:0 0.06 0.02 0.05 0.02 0.136
CLA 0.11 0.06 0.11 0.04 0.213
C20:1 0.29a 0.06b 0.05b 0.09 0.012
C20:2 0.00 0.0004 0.03 0.02 0.391
C20:4 0.04 0.02 0.02 0.02 0.242
C20:3n3 0.07A 0.004B 0.01B 0.02 <0.001
C20:5n3 0.03ab 0.01b 0.04a 0.02 0.047
C23:0 0.20 0.23 0.17 0.06 0.168
C24:0 0.01a 0.009b 0.01a 0.002 0.03
C22:5n3 0.04a 0.01b 0.04a 0.02 0.047
C22:6n3 0.07a 0.02b 0.08a 0.03 0.023
SCFA 7 0.83 0.60 0.63 0.17 0.412
MCFA 8 8.76 6.66 8.51 1.30 0.401
LCFA 9 9.13 5.80 8.86 1.75 0.114
SFA 4 11.81 8.28 10.65 1.70 0.208
MUFA 5 4.47 3.06 4.70 1.00 0.220
PUFA 6 2.45 1.72 2.73 0.66 0.167
UNS/SFA 0.56 0.57 0.70 0.04 0.05
Omega 3 1.03 0.63 1.06 0.21 0.110
Omega 6 1.40 1.08 1.54 0.30 0.343
a,b: within a row means without a common superscript differ at P < 0.05. A,B: within a row means without a common superscript differ at P < 0.01. 1 C = control group feeding CMR with 80/20 palm/coconut oil ratio; 2 T20 = treatment group feeding CMR with 80/20 palm/insect oil ratio; 3 T40 = treatment group feeding CMR with 60/40 palm/insect oil ratio; 4 SFA = saturated fatty acids; 5 MUFA = monounsaturated saturated fatty acids; 6 PUFA = polyunsaturated saturated fatty acids; 7 SCFA = short chain fatty acids (< C11); 8 MCFA (≥ C11 < C18) medium chain fatty acids; 9 LCFA = long chain fatty acids (≥ C18).
Table 3. Total tract apparent digestibility of nutrients and fatty acids and hair cortisol in in calves fed 3 milk replacer programs at the end of weaning (65-69 days).
C 1 group T20 2 group T40 3 group SE p
Fat digestibility % 91.15 92.71 90.96 1.23 0.565
C6:0 85.09 92.80 85.05 11.49 0.740
C8:0 84.91ab 91.47a 69.40b 4.98 0.022
C10:0 59.20 41.06 60.41 7.05 0.140
C12:0 96.61ab 94.43b 97.41a 0.73 0.030
C13:0 nd nd nd - -
C14:0 67.77 68.83 64.96 7.53 0.986
C14:1 nd nd nd - -
C15:0 nd nd nd - -
C15:1 nd nd nd - -
C16:0 82.73 89.34 84.31 1.88 0.069
C16:1 87.63 93.12 92.19 2.82 0.099
C17:0 54.13 52.94 70.64 6.66 0.247
C17:1 nd nd nd - -
C18:0 51.80b 72.11a 56.60b 4.86 0.027
C18:1 trans-9 nd nd nd - -
C18:1 trans-11 nd nd nd - -
C18:1 cis-9 92.77b 95.93a 93.48ab 0.82 0.023
C18:2 trans-9.12 nd nd nd - -
C18:2 cis-9.12 96.00b 97.72a 96.83ab 0.44 0.023
C18:3 n3 87.63 86.52 83.78 4.46 0.193
C18:3 n6 nd nd nd - -
C20:0 59.10 88.37 62.44 9.17 0.106
CLA cis-9. trans-11 nd nd nd - -
C21:0 nd nd nd - -
C20:3 n6 nd nd nd - -
C20:3 n3 nd nd nd - -
C22:0 nd nd nd - -
C22:1 nd nd nd - -
C20:4 nd nd nd - -
C20:5 nd nd nd - -
C24:0 90.59 95.30 94.80 1.20 0.051
C24:1 nd nd nd - -
C22:5 86.03 90.40 79.09 11.67 0.518
C22:6 nd nd nd - -
SCFA 7 64.87 69.23 69.82 5.03 0.907
MCFA 8 78.45 84.83 80.82 2.21 0.296
LCFA 9 84.39B 93.60A 88.61AB 1.40 <0.01
SFA 4 76.04 87.07 79.31 2.44 0.187
MUFA 5 83.03B 91.97A 86.55AB 1.65 0.003
PUFA 6 91.21 94.77 94.77 1.68 0.319
UNS 85.52b 93.45a 89.74a 1.22 0.020
n 3 60.86 71.97 59.93 16.03 0.251
n6 91.32B 96.44A 95.59A 1.01 0.005
Hair cortisol (median and IQR) pg/mg
16.92
(14.10–17.65)
14.12
(13.50–14.77)
19.86
(16.44–20.53)
0.128
a,b: within a row means without a common superscript differ at P < 0.05. A,B: within a row means without a common superscript differ at P < 0.01. 1 C = control group feeding CMR with 80/20 palm/coconut oil ratio; 2 T20 = treatment group feeding CMR with 80/20 palm/insect oil ratio; 3 T40 = treatment group feeding CMR with 60/40 palm/insect oil ratio; 4 SFA = saturated fatty acids; 5 MUFA = monounsaturated saturated fatty acids; 6 PUFA = polyunsaturated saturated fatty acids; 7 SCFA = short chain fatty acids (< C11); 8 MCFA (≥ C11 < C18) medium chain fatty acids; 9 LCFA = long chain fatty acids (≥ C18).
Disclaimer/Publisher’s Note: The statements, opinions and data contained in all publications are solely those of the individual author(s) and contributor(s) and not of MDPI and/or the editor(s). MDPI and/or the editor(s) disclaim responsibility for any injury to people or property resulting from any ideas, methods, instructions or products referred to in the content.
Copyright: This open access article is published under a Creative Commons CC BY 4.0 license, which permit the free download, distribution, and reuse, provided that the author and preprint are cited in any reuse.
