

Submitted:
16 September 2026
Posted:
17 September 2026
You are already at the latest version
Abstract
The presence of iodine has been shown to enhance chalcopyrite leaching in ferric sulfate media. Previous studies of iodine-assisted heap leaching have demonstrated improved copper extraction from chalcopyrite. This study investigated the kinetics of iodine-assisted chalcopyrite leaching in ferric sulfate media under atmospheric stirred tank conditions. Thermodynamic analysis was first conducted to evaluate the stability of iodine species as a function of the ferric-to-ferrous ratio in sulfate media under the conditions investigated. Leaching experiments were performed in an iodine-resistant, fully sealed stirred glass reactor to minimize iodine loss through volatilization and prevent corrosion of reactor materials. Two chalcopyrite samples with distinct copper grades and mineralogical characteristics were used to evaluate the performance of iodine-assisted leaching under different leaching conditions. The experimental results show that the addition of 150 mg/L total iodide to a leaching solution containing an initial Fe(III)/Fe(II) ratio of 49 and a total iron concentration of 10 g/L at 85 °C achieved 96.5% copper extraction after 48 h. This represented an approximately 60% points increase in copper extraction compared with the corresponding test without iodide addition. In contrast to heap leaching, pyrite dissolution was observed during stirred tank leaching. Chalcopyrite leaching kinetics increased with increasing initial solution potential, initial iodide concentration, and temperature, up to a certain level. In addition, high copper dissolution rates were achieved by replenishing the system with fresh oxidant and by adding chloride to the sulfate media
Keywords:
chalcopyrite leaching
; iodine-assisted leaching
; copper leaching kinetics
; iodine speciation
; ferric sulfate media
1. Introduction
The presence of iodine has been demonstrated to enhance chalcopyrite leaching in ferric sulfate media [1,2,3,4,5,6,7,8]. Fukano and Miura [1] demonstrated that iodine-assisted column leaching of chalcopyrite under atmospheric conditions achieved around 70% copper extraction, compared with 14% for conventional ferric sulfate leaching in the absence of iodine. The use of iodine for chalcopyrite leaching was initially developed by JX Nippon Mining and Metals for chalcopyrite heap leaching and was patented as the “JX Iodine Process” [9,10,11]. This process involves the addition of iodide ions to a ferric sulfate solution to accelerate chalcopyrite dissolution. The presence of iodine can help overcome the typical limitations of chalcopyrite leaching under ambient conditions, particularly the formation of passivating surface layers that hinder further mineral dissolution [12]. Iodine recovery can be achieved using activated carbon [1].
In iodine-assisted chalcopyrite leaching in ferric sulfate media, iodide ions are typically added as potassium iodide as the source of iodine species. Ferric ions oxidize iodide to triiodide (I3⁻) and diiodine (I2). These iodine species directly participate in chalcopyrite oxidation, producing cupric, ferrous, and elemental sulfur. The ferrous ions generated during leaching can be re-oxidized to ferric in the presence of an additional oxidant, such as dissolved oxygen. These processes can be described by the following reactions, as shown in Equations (1)–(5) [7]:
6I⁻ + 4Fe3+ = 2I3⁻ + 4Fe2+
4I⁻ + 4Fe3+ = 2I2 + 4Fe2+
CuFeS2 + 2I3⁻ = Cu2+ + Fe2+ + 2S0 + 6I⁻
CuFeS2 + 2I2 = Cu2+ + Fe2+ + 2S0 + 4I⁻
4Fe2+ + O2 + 4H+ = 4Fe3+ + 2H2O
Winarko et al. [5,6,7,8] identified solution potential as the primary factor controlling the performance of iodine-assisted chalcopyrite leaching. The influence of other process parameters became apparent only when the solution potential was maintained at a sufficiently high level. In bottle leaching tests conducted at 25 °C without potential control, increasing the initial solution potential from 673 to 769 mV vs. SHE led to a higher copper dissolution rate [5]. This trend was further confirmed in subsequent leaching tests using KMnO4 as an additional oxidant, where maintaining a higher solution potential in the range of 669 to 769 mV vs. SHE accelerated chalcopyrite leaching kinetics [6]. The highest potential tested, 769 mV vs. SHE, corresponded to a ferric-to-ferrous ratio of 49 and resulted in the fastest copper dissolution kinetics in the presence of iodine.
The enhanced leaching kinetics observed at higher potentials were attributed to changes in iodine speciation as a function of solution potential. Based on the Eh-pH diagram developed by Winarko et al. [5], potentials higher than 705 mV correspond to the predominance of diiodine and triiodide. Within this potential range, rapid leaching was achieved because diiodine and triiodide are the active iodine species involved in chalcopyrite dissolution. However, when leaching was conducted with diiodine in the absence of ferric and ferrous, the copper dissolution rate was low because diiodine was rapidly depleted from solution [5]. Diiodine is reduced to iodide during the reaction and loses its oxidizing capacity unless it is regenerated by ferric ions.
The use of iodine in mixed sulfate–chloride and chloride-based systems for chalcopyrite leaching has also been explored, demonstrating that chloride addition up to 50 g/L Cl⁻ further enhances copper extraction [13,14,15,16]. In iodine-assisted leaching systems containing chloride, the leaching residues were found to contain significant amounts of elemental sulfur and intermediate copper species [15,16]. In addition, residues formed in the presence of chloride exhibited higher porosity, which may facilitate oxidant diffusion to the mineral surface and contribute to improved leaching kinetics [14].
Previous studies have primarily focused on heap leaching applications under relatively low temperature conditions, where iodine losses through volatilization into the surrounding environment create practical limitations. The present study investigated the behavior of iodine-assisted chalcopyrite leaching at 85 °C, a temperature relevant to atmospheric stirred tank leaching. Higher temperatures alter leaching behavior by changing iodine speciation and increasing iodine volatilization [3]. However, iodine loss may be minimized by operating in a closed reactor system. Iodine speciation diagrams were therefore developed specifically for the conditions investigated in this study.
Another important distinction between iodine-assisted heap and stirred tank leaching is the behavior of pyrite. Previous studies reported that pyrite was essentially inert under heap leaching conditions [8]. At 85 °C, however, partial pyrite dissolution may occur, thereby increasing oxidant consumption and changing the solution chemistry. To investigate pyrite dissolution behavior, two chalcopyrite concentrate samples with markedly different mineralogical compositions were examined. Sample A contained low-grade chalcopyrite and a high proportion of pyrite, whereas Sample B consisted predominantly of chalcopyrite with a lower pyrite content. Sample A was produced by reflotation of tailings to recover residual copper. Particular emphasis was placed on understanding its leaching behavior in the presence of iodine to assess the feasibility of iodine-assisted leaching for treating this type of concentrate.
This article reports the results of leaching experiments conducted under uncontrolled pH and oxidation-reduction potential (ORP) conditions without external oxidant addition. This approach allowed the decrease in solution potential and its effects on leaching behavior to be observed. The experimental data were subsequently used to develop a preliminary kinetic model and identify the key factors controlling copper extraction. The results also established a baseline for comparison with future experiments involving oxygen injection for oxidant regeneration.
2. Materials and Methods
2.1. Material Preparation
Two chalcopyrite samples were used in this study: a low-grade sample (Sample A) containing 0.87% Cu and 2.1% chalcopyrite, and a high-grade sample (Sample B) containing 23.79% Cu and 59.7% chalcopyrite. The copper head grades of the samples were analyzed by inductively coupled plasma optical emission spectroscopy (ICP-OES; Agilent 5100). Their mineralogical compositions were determined using quantitative X-ray diffraction (XRD; Bruker D8 Endeavor), as shown in Table 1 and Table 2. The particle sizes were −38 µm for Sample A and −53+38 µm for Sample B.
All chemicals used were of analytical grade. Ferric sulfate (Fe2(SO4)3) was purchased from Fisher Scientific, and ferrous sulfate (FeSO4) and potassium iodide (KI) were purchased from Sigma Aldrich. Stock solutions of 50 g/L Fe(III) as ferric sulfate and 10 g/L I⁻ as potassium iodide were prepared prior to the leaching tests. Saturated potassium chloride (LabChem) was used as the pH electrode filling solution and 4 M potassium chloride saturated with silver chloride (Fisher Scientific) was used to refill the ORP electrodes.
2.2. Experimental Design
A series of stirred tank leaching tests were conducted to investigate the copper dissolution rate in the presence of iodine under uncontrolled pH and ORP conditions. This study evaluated the leaching behavior of different chalcopyrite samples in ferric sulfate media, including control tests without iodide, tests with oxidant replenishment through multistage leaching, and tests involving the addition of chloride ions. Additional experiments were conducted to evaluate the effects of key variables on chalcopyrite dissolution, including the initial Fe(III)/Fe(II) molar ratio, total iodide concentration, and temperature. The experimental design for this study is summarized in Table 3.
2.3. Measurement of Formal Oxidation-Reduction Potential (ORP)
Formal potential is the redox potential experimentally measured under a specific set of conditions, such as pH, ionic strength, anion type and concentration present in solution, and temperature. The Nernst equation relates the redox potential of the Fe3+/Fe2+ couple to the standard reduction potential (E0) and the activities of Fe3+ (free ferric) and Fe2+ (free ferrous), as shown in Equation (6). The effect of iron complexation with sulfate and non-ideal solution behavior can be accounted for by expressing Equation (6) in the practical form shown in Equation (7), which relates the redox potential of the Fe3+/Fe2+ couple to the formal potential (E0’) and the ratio of the total Fe(III) concentration to the total Fe(II) concentration.
where R is the gas constant (8.3145 J mol-1 K-1), T is the temperature (K), and F is the Faraday constant (96485 C mol-1).
To determine the formal potential, the redox potentials of ferric–ferrous solutions with different Fe(III)/Fe(II) ratios were measured under fixed conditions: a total iron concentration of 10 g/L, pH 1.4, and 85 °C. Solid ferrous sulfate was added to ferric sulfate stock solutions of known concentration to achieve Fe(III)/Fe(II) ratios ranging from 1 to 49. The pH of each solution was then adjusted to 1.4 using concentrated sulfuric acid. The redox potential of each solution was measured using an ORP electrode with an Ag/AgCl reference electrode (Fisher Scientific) saturated with 4 mol/L KCl. These measurements were used to determine the formal potential of the Fe3+/Fe2+ redox couple under the specified conditions.
2.4. Leaching Procedures
The leaching experiments were conducted in a fully sealed 1-L jacketed glass reactor (Cansci Glass Reactor 1L) connected to a water bath (Fisher Scientific). The reactor was equipped with a PTFE lid, sampling port, thermometer, and overhead stirrer fitted with a PTFE impeller, as shown in Figure 1.
The Fe(III)/Fe(II) ratio was varied between 1 and 49 by adjusting the amount of ferric sulfate stock solution and solid ferrous sulfate added. The total iodide concentration was varied between 75 and 225 mg/L through the addition of potassium iodide. Tests involving chloride addition at 5 and 15 g/L were performed by adding hydrochloric acid to the sulfate solution rather than chloride salts, such as NaCl or CaCl2, to minimize the formation of Na-jarosite and gypsum. In the multistage leaching experiments, the residue from the first stage was filtered, dried, and used as the feed material for the second stage, with fresh oxidant added under otherwise identical conditions. The temperature tests were conducted between 55 and 85 °C, with the temperature maintained constant using a recirculating water bath connected to the reactor jacket.
Leaching experiments were conducted at different solids contents to account for differences in mineralogy and copper grade between the two concentrate samples. Sample A was leached at a solids content of 10 g/L, whereas Sample B was leached at 2 g/L. A higher solids content was used for Sample A to compensate for its substantially lower copper grade. For Sample B, however, a lower solids content was selected to maintain consistency with previous studies using the same concentrate [5], thereby enabling direct comparison of the results. In addition, the lower solids content minimized the rapid consumption of ferric ions, which was particularly important because no external oxidant was supplied during leaching. Under these conditions, a sufficiently high redox potential could be maintained over the duration of the experiments, allowing the effects of other process parameters to be more clearly evaluated.
Following each leaching test, the solid residues were filtered and dried. The residues from Sample A were analyzed for mineralogical composition using quantitative XRD. Quantitative XRD analysis was not performed on the residues from Sample B because only a limited quantity of material remained at the end of the experiments, which was insufficient to obtain reliable quantitative XRD results.
During the leaching tests, solution samples were collected periodically over a period of up to 168 h and analyzed for copper and iron concentrations by ICP-OES, from which copper extraction was calculated. ORP and pH were measured in a separate beaker at each sampling interval to monitor changes in solution potential and pH. At the end of each test, the solid residues were filtered, washed, dried, and digested in aqua regia using a microwave digestion system (Ethos UP-EASY) prior to analysis by ICP-OES. Iodide concentration was measured at the beginning and end of each test using an iodide-selective electrode (Hanna Instruments HI 4111).
3. Results and Discussion
3.1. Formal Potential Measurements
The formal potential of the Fe3+/Fe2+ couple in sulfate media was determined by plotting the measured solution potential against the logarithm of the Fe(III)/Fe(II) concentration ratio. The formal potential tests were conducted under the baseline conditions used in the leaching experiments, namely pH 1.4, a total iron concentration of 10 g/L, and 85 °C. The Fe(III)/Fe(II) concentration ratios used to construct the formal potential plot were 1, 9, 24, and 49. The maximum Fe(III)/Fe(II) ratio of 49 was selected based on previous studies of iodine-assisted chalcopyrite leaching in ferric sulfate media [5,6].
The intercept of the linear regression in Figure 2 represents the formal potential, which was determined to be 713.4 mV vs. SHE under the specific conditions used in this study. A slope of 71.15 mV/decade was obtained from the linear regression. A practical Nernst equation was therefore expressed as Equation (8) and used in the present study to relate the solution potential to the ratio of the total Fe(III) concentration to the total Fe(II) concentration.
The formal potential measured in this study (713.4 mV vs. SHE) was lower than the standard reduction potential (E°) of the Fe3+/Fe2+ redox couple (770 mV vs. SHE at 25 °C) (Atkins, 2010). This deviation occurs because in sulfate solution Fe(III) forms stronger complexes with sulfate ions than Fe(II) (Yue et al., 2014). This complexation decreases the activity of free Fe3+ ions relative to Fe2+, thereby lowering the formal potential of the Fe3+/Fe2+ couple. Equation (8) is practically useful because it relates the experimentally measured redox potential to the ratio of the total Fe(III) to the total Fe(II) concentrations in solution.
3.2. Iodine Speciation Diagram
Iodine speciation plays an important role in understanding and controlling chalcopyrite leaching. The distribution of iodine species depends on solution redox potential. In this study, an iodine speciation diagram was developed based on thermodynamic data for possible reactions among iodine species. Under the leaching conditions used in this study, iodine may be present as iodide (I⁻), triiodide (I3⁻), aqueous diiodine (I2,aq), and gaseous diiodine (I2,g). Diiodine distribution between aqueous and gaseous phases is governed by Henry’s law. The concentration of gaseous diiodine is related to its partial pressure through the ideal gas law. The half-cell reactions involving iodide, triiodide, and diiodine are shown in Equations (9) and (10) and were used to construct the iodine speciation diagram based on the overall relationship shown in Equation (11).
Here, E1° and E2° represent the standard reduction potentials of the respective redox couples and are 0.699 V and 0.734 V vs. SHE, respectively [17]. R is the universal gas constant (8.314 J mol-1 K-1), F is the Faraday constant (96485 C mol-1), and T is the temperature (K). The concentrations of total iodide added, free iodide, triiodide, and aqueous diiodine are denoted by [I]T, [I⁻], [I3⁻], and [I2,aq], respectively. Vhs and Vsol denote the headspace and solution volumes of the reactor (m3), respectively, while kH is Henry’s constant at the leaching condition (mol m-3 Pa-1).
Figure 3 presents the iodine speciation diagram under the leaching conditions investigated in this study, namely a total iodide concentration of 150 mg/L, 10 g/L total iron, and a temperature of 85 °C. Leaching was conducted in a glass reactor containing 0.9 L of solution, with an additional 0.314 L of headspace representing the gas-filled volume above the liquid. The diagram depicts the distribution of iodine species in the reactor during chalcopyrite leaching in ferric sulfate media across a range of solution potentials. The two x-axes represent the Fe(III)/Fe(II) molar ratio and the corresponding solution potential. The relationship between the Fe(III)/Fe(II) molar ratio and solution potential was described by the practical Nernst equation in Equation (8). The vertical dotted lines denote the initial and typical final redox potentials under the leaching conditions used in this study.
The speciation diagram shows that at constant total iodide concentration and temperature, the distribution of iodine species is controlled by the redox potential of the leaching solution. At low potentials (< 0.68 V), iodine exists predominantly as free iodide (I⁻). Within the intermediate range (0.68 V < E < 0.73 V), triiodide (I3⁻) is the predominant species. At potentials above 0.73 V, aqueous diiodine (I2,aq) becomes the predominant species. As the redox potential increases further, a higher fraction of total iodide added is converted to aqueous diiodine, which increases the tendency for iodine loss through volatilization as gaseous diiodine (I2,g).
3.3. Iodine-Assisted Stirred Tank Leaching of Chalcopyrite Concentrate
3.3.1. Reproducibility Test
Two replicate tests were performed to assess the consistency of the leaching results under identical experimental conditions. The tests were conducted on Sample A under the baseline conditions previously described: a Fe(III)/Fe(II) molar ratio of 49, a total iodide concentration of 150 mg/L, a total iron concentration of 10 g/L, a solids content of 10 g/L, and 85 °C. The tests also evaluated the robustness of the experimental setup in the presence of iodine species. The leaching reactor was specifically designed to minimize iodine losses through diiodine volatilization and adsorption onto reactor materials. This was achieved by carefully sealing all gaps and using iodine-resistant materials (PTFE) for components in contact with the leaching solution.
The results in Figure 4 confirm that the leaching behavior of Sample A was reproducible across two replicate tests. Both replicates reached ~90% copper extraction after 168 h, with comparable ORP trends, stable pH profiles, and consistent total iodide concentrations. The results demonstrate that the experimental setup could produce consistent results under identical conditions. The similar total iodide values further indicate that iodine species were effectively retained within the reactor, with minimal losses through volatilization and adsorption onto reactor materials.
3.3.2. Enhancement of Copper Dissolution by Iodine Species
The leaching behavior of Sample A and Sample B in the presence of iodine was investigated in ferric sulfate solution at an initial Fe(III)/Fe(II) molar ratio of 49, a total iron concentration of 10 g/L, and 85 °C. Figure 5 shows that the addition of 150 mg/L (1.18 mM) total iodide enhanced both the copper leaching kinetics and the overall copper extraction for both samples. For Sample A, the presence of iodine increased copper extraction to 90.1% after 168 h, corresponding to an approximately 40% points increase compared with the iodine-free system. Sample B exhibited substantially faster dissolution kinetics, achieving 96.5% copper extraction within 48 h and complete dissolution within 72 h in the presence of iodine species. This corresponds to an approximately 60% points increase relative to the test conducted without iodine under otherwise identical conditions.
Although copper extraction was substantially enhanced by iodine addition, the corresponding decrease in ORP was comparable to that observed in the absence of iodine. The higher Fe(III) consumption in Sample A, despite its lower chalcopyrite content, indicates that oxidation and dissolution of pyrite also occurred. In contrast, the pH profiles for both samples remained stable throughout the leaching tests.
The difference in leaching kinetics between the two samples is primarily attributed to differences in mineralogy. The higher chalcopyrite content in Sample B likely allowed diiodine and triiodide to predominantly attack chalcopyrite surfaces. In contrast, more than 95% of the exposed surface area in Sample A is composed of pyrite, quartz, and clay. The abundance of silicate and pyrite minerals in Sample A likely resulted in partial encapsulation of copper-bearing phases within these matrices, limiting copper dissolution. In addition, ORP decreased more substantially for Sample A, from ~0.82 to 0.69 V within the first 24 h. This decrease shifted the iodine speciation from predominantly aqueous diiodine and triiodide to mainly free iodide. As a result, the solution became less oxidizing, resulting in slower leaching kinetics for Sample A.
The calculated total iodide concentration differed between the two samples at both the beginning and the end of leaching. Because the leaching tests for both samples started at a high initial potential, a portion of the iodide added was converted to gaseous diiodine immediately and was therefore not accounted for by the total iodide analysis, which accounts only for dissolved iodine species. At the end of leaching, the calculated total iodide concentration was controlled by the final solution potential. In Sample A, the ORP decreased and stabilized at approximately 680 mV vs. SHE, where iodine predominantly exists as free iodide. As a result, the calculated total iodide closely matched the designed concentration of 150 mg/L. In contrast, Sample B maintained a higher final potential, favoring the formation of triiodide and diiodine. Because a portion of diiodine volatilized into the gas phase and was not detected during the total iodide analysis, the calculated total iodide concentration for Sample B was lower than that for Sample A. In addition, iodine species were effectively retained inside the sealed glass reactor.
The dissolved iron concentration remained relatively constant throughout the leaching tests for both samples. Because chalcopyrite dissolution releases iron into solution, an increase in dissolved iron concentration would be expected. The absence of such an increase indicated that the released iron reprecipitated during leaching, likely as jarosite. This is further discussed in the leaching residue analysis in Section 3.5.
The results in Figure 5b were directly compared with those of the kinetic study conducted by Winarko et al. [5], in which the same chalcopyrite concentrate as Sample B was leached in sealed PTFE bottles. The kinetics observed in the present study were substantially faster, with complete copper dissolution within 72 h at 85 °C and 150 mg/L total iodide. In contrast, under otherwise identical conditions of Fe(III)/Fe(II) molar ratio, total iodide concentration, total iron concentration and solids content, Winarko et al. [5] reported a maximum copper extraction of only approximately 55% after 168 h at 25 °C. The enhanced leaching kinetics were attributed primarily to the higher temperature, which increases the intrinsic reaction rate. In addition, the higher temperature shifts iodine speciation towards species that favor chalcopyrite dissolution. Winarko [17] reported that aqueous diiodine accounted for approximately 62−72% of the total iodine species at 25 °C and 150 mg/L total iodide when the Fe(III)/Fe(II) molar ratio exceeded 30. In comparison, thermodynamic calculations for the present system indicate that the fraction of aqueous diiodine exceeds 80% at the same Fe(III)/Fe(II) ratio, as shown in Figure 3.
3.3.3. Multistage Leaching Test
Figure 6 presents the results of the multistage leaching test conducted on Sample A under the baseline conditions: initial Fe(III)/Fe(II) ratio of 49, total iron concentration of 10 g/L, solids content of 10 g/L, initial iodide concentration of 150 mg/L, and at 85 °C. A single-stage test conducted under identical conditions is included for comparison. The results show that replenishing the oxidant in the second stage clearly enhanced copper dissolution kinetics. Specifically, copper extraction increased by ~14% points in the two-stage test, reaching 83.9%, compared with 69.5% in the single-stage test after 48 h.
At the start of the second stage, the Fe(III)/Fe(II) ratio was restored to a high value, resulting in a high solution potential, which maintained the active iodine species at high concentrations. This enhanced chalcopyrite leaching rate at the beginning of the second stage. However, it is important to note that the initial increase in leaching kinetics in the second stage was lower than that observed at the beginning of the first stage, despite the addition of fresh ferric sulfate solution. This suggests that re-leaching could not fully restore the dissolution kinetics to the level achieved during the first stage. One possible reason is that the readily exposed and more easily leachable fine chalcopyrite particles were oxidized during the first stage, leaving behind coarser particles and those that were partially encapsulated or less accessible to the leaching solution. Another possible reason is that the solid surface was transformed into phases that hindered further leaching, even when exposed to fresh solution with high oxidizing potential. Previous studies have shown that the formation of metal-deficient sulfides or polysulfides, iron precipitates, and elemental sulfur, as well as changes in the semiconducting properties of the mineral surface can impede further dissolution [18,19,20,21,22]. Nevertheless, the results of the multistage leaching test demonstrate that the addition of fresh oxidant with a high Fe(III)/Fe(II) ratio can partially restore dissolution kinetics, highlighting the importance of solution potential in controlling chalcopyrite leaching in the presence of iodine species.
3.3.4. The Effect of Chloride Addition
The effectiveness of chalcopyrite leaching in ferric sulfate media in the presence of iodine species was further explored by adding chloride ions. Since chloride media are known to enhance chalcopyrite dissolution compared with sulfate systems [23,24,25], the possible synergistic effect between chloride and iodine was investigated in this study.
Figure 7 shows that adding chloride ions to the iodine-assisted chalcopyrite leaching system had a positive effect on leaching kinetics for both samples. For Sample A, at an iodine concentration of 150 mg/L, the addition of 15 g/L Cl⁻ resulted in ~85% copper extraction within the first 24 h. This represents an improvement of ~25% compared with leaching under otherwise identical conditions without chloride and ~5% compared with leaching in the presence of 5 g/L chloride. Similarly, for Sample B, the addition of 15 g/L Cl⁻ enhanced dissolution kinetics, with complete copper extraction achieved within 72 h. The effect of chloride was most pronounced during the first 48 h, where copper extraction increased noticeably. Compared with Sample A, the impact of chloride addition was less noticeable for Sample B because copper dissolution was already very rapid in the presence of iodine. In addition, the presence of chloride lowered the solution pH due to increased proton activity. Since HCl was used as the chloride source, it dissociated completely into H⁺ and Cl⁻, thereby directly acidifying the solution.
The beneficial effect of chloride addition is attributed to a reduction in the overall activation energy and the formation of a more porous product layer, which facilitates charge transfer during leaching in the presence of iodine species [20,23,26]. Previous studies have reported that a porous sulfur layer can form during leaching in mixed chloride-iodine system, thereby enhancing oxidant diffusion [14]. In addition, the presence of chloride in the sulfate solution helps stabilize Cu(I) ion in solution [27]. This introduces an additional redox couple, Cu(II)/Cu(I), which can contribute to the sulfide oxidation reactions.
Another factor contributing to the increased leaching kinetics is the stronger complexation of ferric ions with sulfate than with chloride [28]. Ferric ions form stable sulfate complexes, primarily as FeHSO42+, Fe(SO4)2, and FeSO4+. Increasing the temperature from 25 to 150 °C decreases the free Fe3+ concentration, while the concentration of Fe2+ remains relatively stable [28]. In contrast, although chloride also forms stable complexes with Fe(III) ions, e.g., FeCl2+, FeCl2+, and FeCl3, a higher concentration of free ferric ions remains available for oxidation reactions in the chloride system [29,30]. As a result, the measured redox potentials are higher in the mixed sulfate-chloride system than those measured in the sulfate-only system, as shown in Figure 7b and Figure 7e. This higher redox potential shifts the Fe(III)/Fe(II) redox couple toward more oxidizing conditions, further contributing to improved chalcopyrite leaching performance.
In contrast, leaching tests conducted with chloride addition alone, i.e., in the mixed sulfate-chloride system without iodine, exhibited significantly slower kinetics than tests conducted with iodine addition. These results indicate that iodine species were the primary contributors to enhanced chalcopyrite leaching, while chloride acted as a secondary enhancer that further improved dissolution kinetics when iodine was present.
3.4. Response of Copper Extraction to Different Leaching Conditions
3.4.1. Fe(III)/Fe(II) Molar Ratio
The effect of the Fe(III)/Fe(II) ratio on chalcopyrite dissolution kinetics was investigated at ratios of 49, 24, 9, and 1 for both Sample A and Sample B. Figure 8 shows that copper extraction improved when the Fe(III)/Fe(II) ratio was increased above 1 for both samples. For Sample A, the extractions obtained at Fe(III)/Fe(II) ratios of 9, 24, and 49 were relatively similar, indicating that further increases within this range had little additional effect on the leaching kinetics. For Sample B, however, a modest improvement in extraction was observed at Fe(III)/Fe(II) ratios of 24 and 49 compared with a ratio of 9, particularly between 24 and 96 h of leaching. The similar leaching kinetics observed at ratios of 9, 24, and 49 indicate that further improvement in leaching efficiency became marginal at Fe(III)/Fe(II) ratios above 9, corresponding to initial solution potentials above ~0.78 V.
Because the leaching tests were conducted without oxidant addition, the solution potential gradually declined as ferric ions were reduced to ferrous ions over time. As shown in Figure 3, this decrease in redox potential shifted the dominant iodine species from diiodine (I2,aq) and triiodide (I3⁻) toward free iodide (I⁻). As a result, the oxidative power of the leaching solution decreased, thereby slowing chalcopyrite leaching kinetics. The ORP values at Fe(III)/Fe(II) ratios of 49, 24, and 9 were 0.82, 0.80, and 0.78 V vs. SHE, respectively. These potentials fall within the stability region of aqueous diiodine and triiodide. The relative concentrations of these two active species do not vary substantially across this potential range, which may explain the similar leaching kinetics observed experimentally under these conditions.
In contrast, at a Fe(III)/Fe(II) ratio of 1, the ORP was ~0.71 V, where free iodide concentration is much higher, and lower fractions present as diiodine and triiodide. Because iodide does not have oxidizing power, the lower fractions of active iodine species resulted in slower chalcopyrite leaching kinetics. This also indicates that, under the conditions investigated in this study, a minimum potential of ~0.78 V was sufficient to achieve fast leaching kinetics, since the iodide-equivalent fractions of aqueous diiodine and triiodide were at their highest values as predicted by the speciation diagram in Figure 3. Increasing the potential beyond this level is not expected to produce a significant change in iodine speciation and, therefore, is unlikely to further improve leaching performance.
Figure 8e shows that in some tests the solution potential slightly increased during leaching. Because no additional oxidant was added and the reactor was fully sealed throughout the 168 h leaching period, this slight increase in potential at the later stage might be attributed to oxygen ingress into the sampled leaching solution during parameter measurement. Because ORP and pH were measured in a separate beaker, a small amount of oxygen may have entered the sampled solution and oxidized a portion of ferrous ions back to ferric ions.
3.4.2. Iodide Concentration
Figure 9 shows the results of leaching tests conducted at different total iodide concentrations for both Sample A and Sample B. For Sample A, an increase in the total iodide concentration from 75 to 225 mg/L resulted in a moderate increase in copper extraction. Specifically, leaching with 75 mg/L of iodine yielded 88% copper extraction after 168 h, whereas around 94% of copper was extracted with 225 mg/L of iodine over the same period. For Sample B, increasing the total iodide concentration from 150 to 300 mg/L enhanced leaching kinetics only during the first 24 h. After this period, the extraction became similar, reaching ~98% copper extraction within 48 h. Slightly steeper ORP decreases were observed at higher total iodide concentrations for both samples, indicating greater ferric consumption to regenerate active iodine species. The solution pH measurements were similar for all tests conducted.
A previous study reported the formation of CuI or other Cu–I precipitates during chalcopyrite leaching in the presence of iodine, which can reduce the concentration of active iodine species available for chalcopyrite dissolution [13]. Castellón and Taboada [13] identified an optimum iodide concentration of 100 mg/L in sulfuric acid media, whereas concentrations above 500 mg/L reduced copper extraction due to CuI precipitation. These results indicate that increasing the total iodide concentration produced only a modest enhancement in leaching kinetics. The presence of iodide in the system was the more critical factor, as evidenced by the significant difference in leaching performance between tests conducted with and without iodine. Even a relatively low concentration of 75 mg/L (0.59 mM) total iodide was sufficient to significantly accelerate chalcopyrite leaching kinetics.
3.4.3. Temperature
The effect of temperature on chalcopyrite dissolution for Sample A was evaluated in the range of 55–85 °C. The results show that higher temperatures enhanced copper dissolution. After 168 h of leaching, ~90% copper extraction was achieved at 85 °C compared with only ~44% at 55 °C (Figure 10). Higher temperatures were associated with higher ferric consumption and larger decreases in solution potential. The final iodide concentrations were similar across all tests. No significant changes were observed in the pH profiles.
Using Equation (12), the Arrhenius plot shown was constructed from the apparent rate constants derived from the data in Figure 10 at different leaching temperatures, and the results are shown in Figure 11.
The leaching experiments yielded an activation energy of 69.7 kJ/mol, consistent with a surface reaction controlled leaching mechanism. This is higher than those reported in previous iodine-assisted chalcopyrite studies, i.e., 33.8 kJ/mol from Granata et al. [2] and 47 kJ/mol from Winarko et al. [5]. The higher activation energy suggests that the leaching rates under the conditions of this study were more strongly controlled by chemical reactions. In other words, the leaching rate exhibited greater sensitivity to temperature changes than those reported in the previous studies.
3.5. Analysis of Leaching Residues
Table 4 summarizes the chemical compositions of the initial solids and leach residues for all tests. Overall, the changes in solid mass and composition between the initial samples and the final residues were consistent with the leaching results. The residues from tests containing iodine species, T1 and T3, exhibited substantially lower copper concentrations than those from the corresponding control tests. The residual copper concentration was 0.11% in both T1 and T3, compared with 0.64% and 14.70% in T2 and T4, respectively, reflecting the accelerated copper extraction achieved in the presence of iodine. For Sample A, higher initial Fe(III)/Fe(II) ratios created more oxidizing conditions and greater changes in solid mass. Tests T11, T12, and T13 had mass changes of 6.28%, 3.74%, and −10.13% at Fe(III)/Fe(II) ratios of 24, 9, and 1, respectively. Given the high pyrite content in Sample A, the higher initial solution potential likely promoted pyrite co-dissolution as a side reaction, thereby contributing to the greater solid loss. For the Fe(III)/Fe(II) ratio of 1, the negative mass change was likely caused by jarosite precipitation. Because lower chalcopyrite dissolution was observed under this condition, and pyrite co-dissolution was also assumed to be lower, the mass gained through jarosite formation exceeded the mass lost by sulfide dissolution, resulting in an overall increase in the residue mass.
In contrast, for Sample B, higher initial Fe(III)/Fe(II) ratios resulted in more solid accumulation. The increases in residue mass were 0.408 g, 0.318 g, and 0.104 g in T14, T15, and T16 at Fe(III)/Fe(II) ratios of 24, 9, and 1, respectively. This accumulation was likely contributed by precipitation of jarosite, as indicated by the corresponding higher iron contents in the residue: 0.743 g, 0.721 g, and 0.635 g, respectively, compared with 0.514 g in the initial solid.
Increasing the total iodide concentration also promoted substantial residue mass accumulation, particularly for Sample B, where the residue mass obtained at 300 mg/L iodide in T10 was more than twice the initial solid mass. Because iodide was added as KI, the associated increase in K⁺ concentration increased the thermodynamic driving force for jarosite precipitation, resulting in a higher final residue mass.
Conversely, the addition of 15 g/L chloride ion increased the solid mass loss by ~10% for Sample A and ~27% for Sample B under the baseline condition. In addition to improving copper extraction, chloride has been reported to suppress iron precipitation, particularly jarosite formation, thereby decreasing the amount of solid remaining in the final residue [31,32].
Selected residues from Sample A were also analyzed by quantitative XRD to determine the final mineral composition after leaching. The XRD patterns in Figure 12 show that, in the absence of iodide and chloride (Q2), the mineralogy of the leaching residue was similar to that of the initial Sample A (Q1). A slight decrease in pyrite peak intensity and the appearance of jarosite peaks were observed in Q2, consistent with the lower copper extraction (~50% after 168 h), and partial oxidation of pyrite observed in the control test (Figure 5a). In contrast, when iodine species were present (Q3 and Q4), the chalcopyrite peaks disappeared completely. In the test with iodide but without chloride (Q3), jarosite peak intensity increased, supporting the interpretation that K+ introduced through potassium iodide addition promoted jarosite nucleation and growth.
In contrast, when chloride was added to the system (Q4 and Q5), the jarosite peaks disappeared completely, suggesting that the addition of chloride to the sulfate system reduced jarosite formation in the residue. This is consistent with the observations from the residue analysis discussed earlier. The formation of jarosite is expressed in Equation (13).
6Fe3+ + 2K+ + 4SO42- + 6H2O = K2Fe6(SO4)4(OH)12 + 12H+
This reduction in jarosite formation is likely resulted from increased proton activity, which can inhibit iron hydrolysis, as well as reduced sulfate activity. In chloride media, jarosite precipitation was observed when a sulfate source was present in solution [31,33]. However, when HCl is added into a sulfate solution, the solution pH decreases and the dissociated [H+] ion protonates sulfate to form bisulfate. In addition, chloride ions form stable complexes with Fe3+ ions (e.g., FeCl2+, FeCl2+, and FeCl3), which reduces the activity of free Fe3+ available for jarosite formation [29,30]. Similar results have been reported in previous studies when chloride is added to the leaching of chalcopyrite [31,32]. Dutrizac [31] observed that adding a higher concentration of HCl in a mixed chloride-sulfate system reduced the amount of potassium jarosite precipitated from solution. Vakylabad et al. [32] investigated the effect of sodium chloride addition on bioleaching of chalcopyrite and found that chloride helped limit jarosite formation on the mineral surface.
Additionally, Figure 13 shows the XRD patterns of the initial solid and the residues obtained from leaching tests conducted at initial Fe(III)/Fe(II) ratios of 24, 9, and 1. Because the copper leaching kinetics at ratios of 49 and 24 were very similar, only the result for a ratio of 24 is shown. Overall, no major differences were observed across the three ratios. As previously discussed, leaching tests conducted at ratios of 24 and 9 exhibited comparable kinetics, whereas the test at the ratio of 1 resulted in slightly lower copper extraction after 168 h. Consistent with these results, a small chalcopyrite peak was still detected at the ratio of 1 (Q9), whereas it was absent in the other residues (Q7 and Q8). The intensity of the jarosite peaks decreased at lower Fe(III)/Fe(II) ratios, indicating that jarosite formation was favored at higher initial ratios, where a higher ferric ion concentration drove Equation (13) towards the right-hand side. In contrast, pyrite peaks became more pronounced at lower Fe(III)/Fe(II) ratios (Q9 > Q8 > Q7). Given the relatively high rest potential of pyrite, i.e., +0.66 V vs. SHE [34], pyrite dissolves only under strongly oxidizing conditions. At lower Fe(III)/Fe(II) ratios, the reduced ferric availability and, consequently, lower diiodine concentration, limit the oxidizing power of the leaching solution, leaving pyrite largely unreacted.
The extent of pyrite dissolution in Sample A was quantified by QXRD phase balances of the initial solid and the leach residues, as summarized in Table 5. Under both the baseline condition and the baseline without iodine species, approximately 48-50% of the initial pyrite was dissolved during leaching. The addition of 15 g/L chloride further promoted pyrite co-dissolution to around 51-56%, consistent with the higher overall solid mass loss observed in the residue. This behavior differs from that reported by Winarko et al. [8] under heap leaching conditions, where pyrite remained essentially inert. The greater pyrite oxidation observed in the present study is attributed to the higher leaching temperature. Because pyrite oxidation consumes oxidants, this accelerated the decline in solution potential during leaching. This is consistent with the relatively high ferric consumption observed for Sample A despite its low chalcopyrite content, as previously shown in Figure 5c. The amount of jarosite formed was also quantified by QXRD and is summarized in Table 5. The presence of chloride generally lowered the mass of jarosite in the final residue, consistent with the previous discussion.
In contrast to Sample A, pyrite dissolution in Sample B could not be quantified directly because QXRD data were unavailable for the leach residues. Instead, the amount of pyrite remaining in the final residues was estimated using an iron mass balance approach based on the ICP-OES analysis. The iron associated with undissolved chalcopyrite was first calculated from the residual copper content. This amount was then subtracted from the total iron measured in the residue, and the remaining iron was attributed to pyrite. The estimated pyrite content of the final residue was compared with the initial pyrite content determined by QXRD analysis of Sample B.
As shown in Table 6, this method did not produce reliable estimates of pyrite dissolution under most test conditions, because the calculated pyrite mass in the final residues exceeded the initial pyrite mass. This discrepancy is likely attributed to jarosite precipitation, which introduced additional iron into the solid residue and prevented closure of the iron mass balance. However, for the chloride-containing test and the test without iodine, the estimated extents of pyrite dissolution were 54.2% (T9) and 38.4% (T4), respectively. These values are comparable to those determined for Sample A, specifically for the test with chloride. As discussed previously, chloride can suppress the formation of jarosite while the absence of KI lowers the K-jarosite formation. While the extent of pyrite co-dissolution should be interpreted as indicative rather than quantitative, test T9 suggests that approximately 54.2% of the pyrite in Sample B dissolved during leaching, which was relatively similar to that from Sample A with much higher pyrite content.
3.6. Role of Iodine Species in Enhancing Chalcopyrite Leaching
Most studies on chalcopyrite leaching in acidic sulfate media agree that chalcopyrite passivation has multiple causes depending on the leaching conditions. Early studies concluded that the formation of iron precipitates and elemental sulfur, as well as the transformation of chalcopyrite to copper-deficient sulfide contributed to the slow reaction kinetics [18,20,21,35,36,37]. More recently, advances in electrochemical measurements have demonstrated that changes in the semiconducting properties of chalcopyrite during leaching may also contribute to passivation [22]. Preferential dissolution of iron from chalcopyrite can form a covellite-like surface layer, resulting in the formation of a “p-n junction”, i.e., a difference in semiconducting properties between the unreacted chalcopyrite surface and the covellite-like surface. This junction has been proposed to restrict charge transfer and suppress further electrochemical reaction [22]. In this study, jarosite and elemental sulfur were identified in the residues from iodine-assisted chalcopyrite leaching. However, neither hindered the leaching process, as high copper extractions were achieved.
The role of iodine species in enhancing chalcopyrite leaching has been investigated through both leaching and electrochemical studies. Granata et al. [2] proposed that cyclic reactions involving ferric and iodide were responsible for the higher leaching efficiency. In these reactions, as shown in Equations (14)–(18), iodide is oxidized by ferric to form active iodine species, which then participate directly in chalcopyrite dissolution. The overall reaction is the more commonly known chalcopyrite leaching with ferric, as shown in Equation (18).
CuFeS2 + 2I3⁻ = Cu2+ + Fe2+ + 2S0 + 6I⁻
CuFeS2 + 2I2 = Cu2+ + Fe2+ + 2S0 + 4I⁻
6I⁻ + 4Fe3+ = 2I3⁻ + 4Fe2+
4I⁻ + 4Fe3+ = 2I2 + 4Fe2+
CuFeS2 + 4Fe3+ → Cu2+ + 5Fe2+ + 2S0
The role of iodine as the main oxidant for chalcopyrite dissolution was further investigated by Winarko et al. [5]. Their results showed that iodide in its reduced form does not promote chalcopyrite leaching, as only 1.8% copper was leached after 7 days in acidified water containing 170 mg/L free iodide (I⁻). In contrast, when diiodine (I2) was added instead of free iodide, rapid dissolution was observed during the first day. However, leaching ceased thereafter due to depletion of diiodine species. These results highlight that iodine in its molecular form, I2, is the active oxidant in chalcopyrite leaching.
Nicol [38] explored the electrochemical mechanism by which iodine species enhance chalcopyrite leaching. The author concluded that the mixed potential of the chalcopyrite system in the presence of iodine was higher than that observed with ferric alone, and that the exchange current density of the iodine/iodide couple was around 100 times higher than that of the Fe3+/Fe2+ couple. Thermodynamically, the Fe3+/Fe2+ redox couple has a more positive standard reduction potential (+0.77 V) than the I2/I⁻ couple (+0.54 V) [39], meaning that Fe3+ is a stronger oxidant than diiodine. However, Nicol’s work demonstrated that the reduction of iodine to iodide is more reversible and exhibits faster kinetics. As a result, the presence of iodine increases the mixed potential and accelerates chalcopyrite dissolution. These findings indicate that iodine enhances chalcopyrite leaching mainly due to kinetic effects without altering the fundamental electrochemical reaction pathway.
The faster reaction kinetics between iodine species and chalcopyrite, compared with the direct interaction between ferric ions and chalcopyrite, result in faster mineral oxidation and dissolution (Equations (14) and (15)). The more sluggish Fe3+/Fe2+ couple instead serves to regenerate diiodine/triiodide species to maintain a high oxidative potential in solution (Equations (16) and (17)). This mechanism assumes that the oxidation of free iodide to molecular diiodine and triiodide by ferric occurs rapidly, allowing the cyclic redox reactions that attack the chalcopyrite surface to be sustained. This rapid oxidation was observed visually when potassium iodide was added to the ferric sulfate solution; within seconds, reddish-brown iodine vapors appeared in the reactor headspace. This indicates that iodide oxidation is fast and is not the rate-limiting step in chalcopyrite oxidation in the presence of iodine species.
Furthermore, the high reversibility of the iodine couple, as discussed by Nicol [38], is considered to promote rapid redox cycling, leading to the formation of a more porous sulfur layer rather than a dense, blocking film. Castellón and Taboada (2023a) reported that sulfur formed in the presence of iodide is more porous and less passivating. This enhances electron transfer at the mineral surface relative to the ferric/ferrous system. The iodide ions generated at the surface can subsequently diffuse back into the bulk solution, where they can be re-oxidized to triiodide or diiodine in the presence of another oxidant such as ferric. These steps are illustrated in Figure 14. In relation to the semiconducting theory of passivation, iodine species are proposed to destabilize the covellite-like surface, thereby reducing the stability of the p–n type junction. Owing to their higher exchange current density relative to the Fe3+/Fe2+ couple, iodine redox couples can effectively disrupt this junction, exposing fresh chalcopyrite surfaces and inhibiting the development of a passivating barrier. The rapid attacks of the redox cycle of I2/I⁻ and I3⁻/I⁻ may also de-passivate the product layer during leaching by creating a more porous surface that facilitates electron transfer.
4. Conclusions
This study investigated chalcopyrite leaching kinetics in ferric sulfate media in the presence of iodine species using two chalcopyrite samples. The iodine speciation diagram shows that the distribution of iodine species strongly depends on solution potential, with I2 and I3⁻ being the predominant species involved in chalcopyrite dissolution at high potentials. The leaching results showed that copper extraction increased with increasing initial Fe(III)/Fe(II) ratio, iodine addition, and temperature. The addition of chloride further enhanced leaching kinetics. The multistage leaching tests demonstrated that replenishment with the fresh oxidant could partially restore reaction rates. Analysis of the leaching residues showed that pyrite partially dissolved during leaching, which increased ferric consumption and contributed to the decline in solution potential. It has been reported that the exchange current density of the iodine/iodide redox couple is around 100 times higher than that of the Fe3+/Fe2+ couple, meaning that the iodine/iodide redox couple can exchange electrons rapidly and be regenerated efficiently. The proposed mechanism is that the oxidizing iodine species act as reversible redox mediators, participating in chalcopyrite oxidation and accelerating the reaction rate. During chalcopyrite oxidation, triiodide and diiodine are reduced to iodide, which can subsequently be re-oxidized by Fe(III) to regenerate the oxidizing iodine species. Arrhenius plot from leaching tests at different temperatures showed an activation energy of 69.77 kJ/mol, consistent with surface reaction-controlled kinetics.
Author Contributions
Conceptualization, D.D. and W.L..; Methodology, M.R.K.; Validation, W.L. and D.D.; Formal Analysis, M.R.K.; Investigation, M.R.K.; Resources, W.L. and D.D.; Data Curation, M.R.K.; Writing – Original Draft Preparation, M.R.K.; Writing – Review & Editing, W.L. and D.D.; Visualization, M.R.K.; Supervision, W.L. and D.D.; Project Administration, W.L.; Funding Acquisition, D.D. All authors have read and agreed to the published version of the manuscript.
Funding
This research received funding from Mitacs Awards (IT25881) and LeadFX Inc.
Data Availability Statement
The data presented in this article will be made available upon request by the authors to interested researchers.
Acknowledgments
The authors wish to thank Mitacs Awards and LeadFX for sponsoring this research, and the support from the University of British Columbia.
Disclosure of Interests
The authors have no competing interests to declare that are relevant to the content of this article.
References
- Fukano, Y.; Miura, A. Chalcopyrite Leaching with Iodine (JX Iodine Process) for Various Ore Types. Hydrometallurgy 2021, 206, 105752. [Google Scholar] [CrossRef]
- Granata, G.; Miura, A.; Liu, W.; Pagnanelli, F.; Tokoro, C. Iodide-Assisted Leaching of Chalcopyrite in Acidic Ferric Sulfate Media. Hydrometallurgy 2019, 186, 244–251. [Google Scholar] [CrossRef]
- Kurniawan, M.R.; Liu, W.; Dreisinger, D. Atmospheric Tank Leaching of Chalcopyrite Concentrate in Ferric Sulfate Media. 9th International Symposium on Hydrometallurgy 2023, Society for Mining, Metallurgy & Exploration, 2023; Vol. 9, pp. 58–67. [Google Scholar]
- Moraga, G.A.; Jamett, N.E.; Hernández, P.C.; Graber, T.A.; Taboada, M.E. Chalcopyrite Leaching with Hydrogen Peroxide and Iodine Species in Acidic Chloride Media at Room Temperature: Technical and Economic Evaluation. Metals 2021, 11, 1567. [Google Scholar] [CrossRef]
- Winarko, R.; Dreisinger, D.B.; Miura, A.; Tokoro, C.; Liu, W. Kinetic Modelling of Chalcopyrite Leaching Assisted by Iodine in Ferric Sulfate Media. Hydrometallurgy 2020, 197, 105481. [Google Scholar] [CrossRef]
- Winarko, R.; Dreisinger, D.B.; Miura, A.; Fukano, Y.; Liu, W. Iodine-Assisted Chalcopyrite Leaching in Ferric Sulfate Media: Kinetic Study under Fully Controlled Redox Potential and pH. Hydrometallurgy 2022, 208, 105797. [Google Scholar] [CrossRef]
- Winarko, R.; Dreisinger, D.B.; Miura, A.; Fukano, Y.; Liu, W. Modelling the Scale-up of the Iodine-Assisted Chalcopyrite Leaching in Ferric Sulfate Media from Reactors to Columns and Simulating Heap Operations. Hydrometallurgy 2023, 222, 106203. [Google Scholar] [CrossRef]
- Winarko, R.; Dreisinger, D.B.; Miura, A.; Fukano, Y.; Liu, W. Characterization of the Solid Leach Residues from the Iodine-Assisted Chalcopyrite Leaching in Ferric Sulfate Media. Hydrometallurgy 2024, 226, 106302. [Google Scholar] [CrossRef]
- Kuwano, K.; Abe, A.; Manabe, M.; Miura, A. Method of Leaching Copper Sulfide Ore. U.S. Patent No. 8,257,671 B2, 2012. [Google Scholar]
- Manabe, M. Method of Leaching Copper Sulfide Ore with the Use of Iodine. U.S. Patent No. 8,163,063 B2, 2012. [Google Scholar]
- Miura, A.; Manabe, M.; Sato, K.; Kuwano, K.; Kawashiro, S.; Ohata, A. Leaching of Lowgrade Primary Copper Sulfide Ore with JX Iodine Process. Present. Copp. 2016 9th Int. 2016, 1643–1654. [Google Scholar]
- Li, Y.; Kawashima, N.; Li, J.; Chandra, A.P.; Gerson, A.R. A Review of the Structure, and Fundamental Mechanisms and Kinetics of the Leaching of Chalcopyrite. Adv. Colloid Interface Sci. 2013, 197–198, 1–32. [Google Scholar] [CrossRef]
- Castellón, C.I.; Taboada, M.E. Leaching of Copper Concentrate with Iodized Salts in a Saline Acid Medium: Part 1—Effect of Concentrations. Materials 2023, 16, 2312. [Google Scholar] [CrossRef]
- Castellón, C.I.; Taboada, M.E. Leaching of Copper Concentrates with Iodized Salts in a Saline Acid Medium: Part 2—Effect on Chloride Concentration and an Aerated System. Materials 2023, 16, 5940. [Google Scholar] [CrossRef]
- Martínez-Bussenius, C.; Videla, Á. Iodide-Assisted Leaching of Chalcopyrite Concentrate in Acidic Chloride Solution: Effect of Different Parameters on the Copper Extraction Rate. Miner. Eng. 2024, 213, 108752. [Google Scholar] [CrossRef]
- Videla, A.; Martinez-Bussenius, C. Iodide-Assisted Leaching of Chalcopyrite in Acidic Chloride Solution: Effect of Different Parameters on the Copper Recovery Rate. SSRN 2023. [Google Scholar] [CrossRef]
- Winarko, R. Iodine-Assisted Heap Leaching of Chalcopyrite: Laboratory and Modelling Studies, University of British Columbia; 2022; Available online: https://go.exlibris.link/1XBwxvVK.
- Antonijević, M.M.; Bogdanović, G.D. Investigation of the Leaching of Chalcopyritic Ore in Acidic Solutions. Hydrometallurgy 2004, 73, 245–256. [Google Scholar] [CrossRef]
- Buckley, A.; Woods, R. An X-Ray Photoelectron Spectroscopic Study of the Oxidation of Chalcopyrite. Aust. J. Chem. 1984, 37, 2403–2413. [Google Scholar] [CrossRef]
- Dutrizac, J.E. Elemental Sulphur Formation During the Ferric Sulphate Leaching of Chalcopyrite. Can. Metall. Q. 1989, 28, 337–344. [Google Scholar] [CrossRef]
- Hackl, R.P.; Dreisinger, D.B.; Peters, E.; King, J.A. Passivation of Chalcopyrite during Oxidative Leaching in Sulfate Media. Hydrometallurgy 1995, 39, 25–48. [Google Scholar] [CrossRef]
- Ren, Z.; Chao, C.; Krishnamoorthy, P.; Asselin, E.; Dixon, D.G.; Mora, N. The Overlooked Mechanism of Chalcopyrite Passivation. Acta Mater. 2022, 236, 118111. [Google Scholar] [CrossRef]
- Dreisinger, D.; Abed, N. A Fundamental Study of the Reductive Leaching of Chalcopyrite Using Metallic Iron Part I: Kinetic Analysis. Hydrometallurgy 2002, 66, 37–57. [Google Scholar] [CrossRef]
- Dutrizac, J.E. The Dissolution of Chalcopyrite in Ferric Sulfate and Ferric Chloride Media. Metall. Trans. B 1981, 12, 371–378. [Google Scholar] [CrossRef]
- Majima, H.; Awakura, Y.; Hirato, T.; Tanaka, T. The Leaching of Chalcopyrite in Ferric Chloride and Ferric Sulfate Solutions. Can. Metall. Q. 1985, 24, 283–291. [Google Scholar] [CrossRef]
- Lu, Z.Y.; Jeffrey, M.I.; Lawson, F. The Effect of Chloride Ions on the Dissolution of Chalcopyrite in Acidic Solutions. Hydrometallurgy 2000, 56, 189–202. [Google Scholar] [CrossRef]
- Watling, H.R. Chalcopyrite Hydrometallurgy at Atmospheric Pressure: 2. Review of Acidic Chloride Process Options. Hydrometallurgy 2014, 146, 96–110. [Google Scholar] [CrossRef]
- Yue, G.; Zhao, L.; Olvera, O.G.; Asselin, E. Speciation of the H2SO4–Fe2(SO4)3–FeSO4–H2O System and Development of an Expression to Predict the Redox Potential of the Fe3+/Fe2+ Couple up to 150 °C. Hydrometallurgy 2014, 147–148, 196–209. [Google Scholar] [CrossRef]
- Gammons, C.H.; Allin, N.C. Stability of Aqueous Fe(III) Chloride Complexes and the Solubility of Hematite between 150 and 300 °C. Geochim. Et. Cosmochim. Acta 2022, 330, 148–164. [Google Scholar] [CrossRef]
- Persson, I. Ferric Chloride Complexes in Aqueous Solution: An EXAFS Study. J. Solut. Chem. 2018, 47, 797–805. [Google Scholar] [CrossRef]
- Dutrizac, J.E. Factors Affecting the Precipitation of Potassium Jarosite in Sulfate and Chloride Media. Metall. Mater. Trans. B 2008, 39, 771–783. [Google Scholar] [CrossRef]
- Vakylabad, A.; Nazari, S.; Darezereshki, E. Bioleaching of Copper from Chalcopyrite Ore at Higher NaCl Concentrations. Miner. Eng. 2022, 175, 107281. [Google Scholar] [CrossRef]
- Dutrizac, J.E. Ferric Ion Leaching of Chalcopyrites from Different Localities. Metall. Trans. B 1982, 13, 303–309. [Google Scholar] [CrossRef]
- Majima, H. How Oxidation Affects Selective Flotation of Complex Sulphide Ores. Can. Metall. Q. 1969, 8, 269–273. [Google Scholar] [CrossRef]
- Córdoba, E.M.; Muñoz, J.A.; Blázquez, M.L.; González, F.; Ballester, A. Passivation of Chalcopyrite during Its Chemical Leaching with Ferric Ion at 68 °C. Miner. Eng. 2009, 22, 229–235. [Google Scholar] [CrossRef]
- Mikhlin, Y.L.; Romanchenko, A.S.; Asanov, I.P. Oxidation of Arsenopyrite and Deposition of Gold on the Oxidized Surfaces: A Scanning Probe Microscopy, Tunneling Spectroscopy and XPS Study. Geochim. Et. Cosmochim. Acta 2006, 70, 4874–4888. [Google Scholar] [CrossRef]
- Munoz, P.B.; Miller, J.D.; Wadsworth, M.E. Reaction Mechanism for the Acid Ferric Sulfate Leaching of Chalcopyrite. Metall. Trans. B 1979, 10, 149–158. [Google Scholar] [CrossRef]
- Nicol, M.J. The Role of the Iodide/Iodine Couple as a Redox Mediator in the Dissolution of Chalcopyrite in Sulfate Media. An Electrochemical Study. Hydrometallurgy 2023, 220, 106088. [Google Scholar] [CrossRef]
- Atkins, P. W.; Overton, T.; Rourke, J.; Weller, M.; Armstrong, F. A. Shriver & Atkins’ inorganic chemistry, 5th ed.; Oxford University Press, 2010. [Google Scholar]
Figure 1.
Schematic diagram of the experimental setup used for the leaching test in this study.
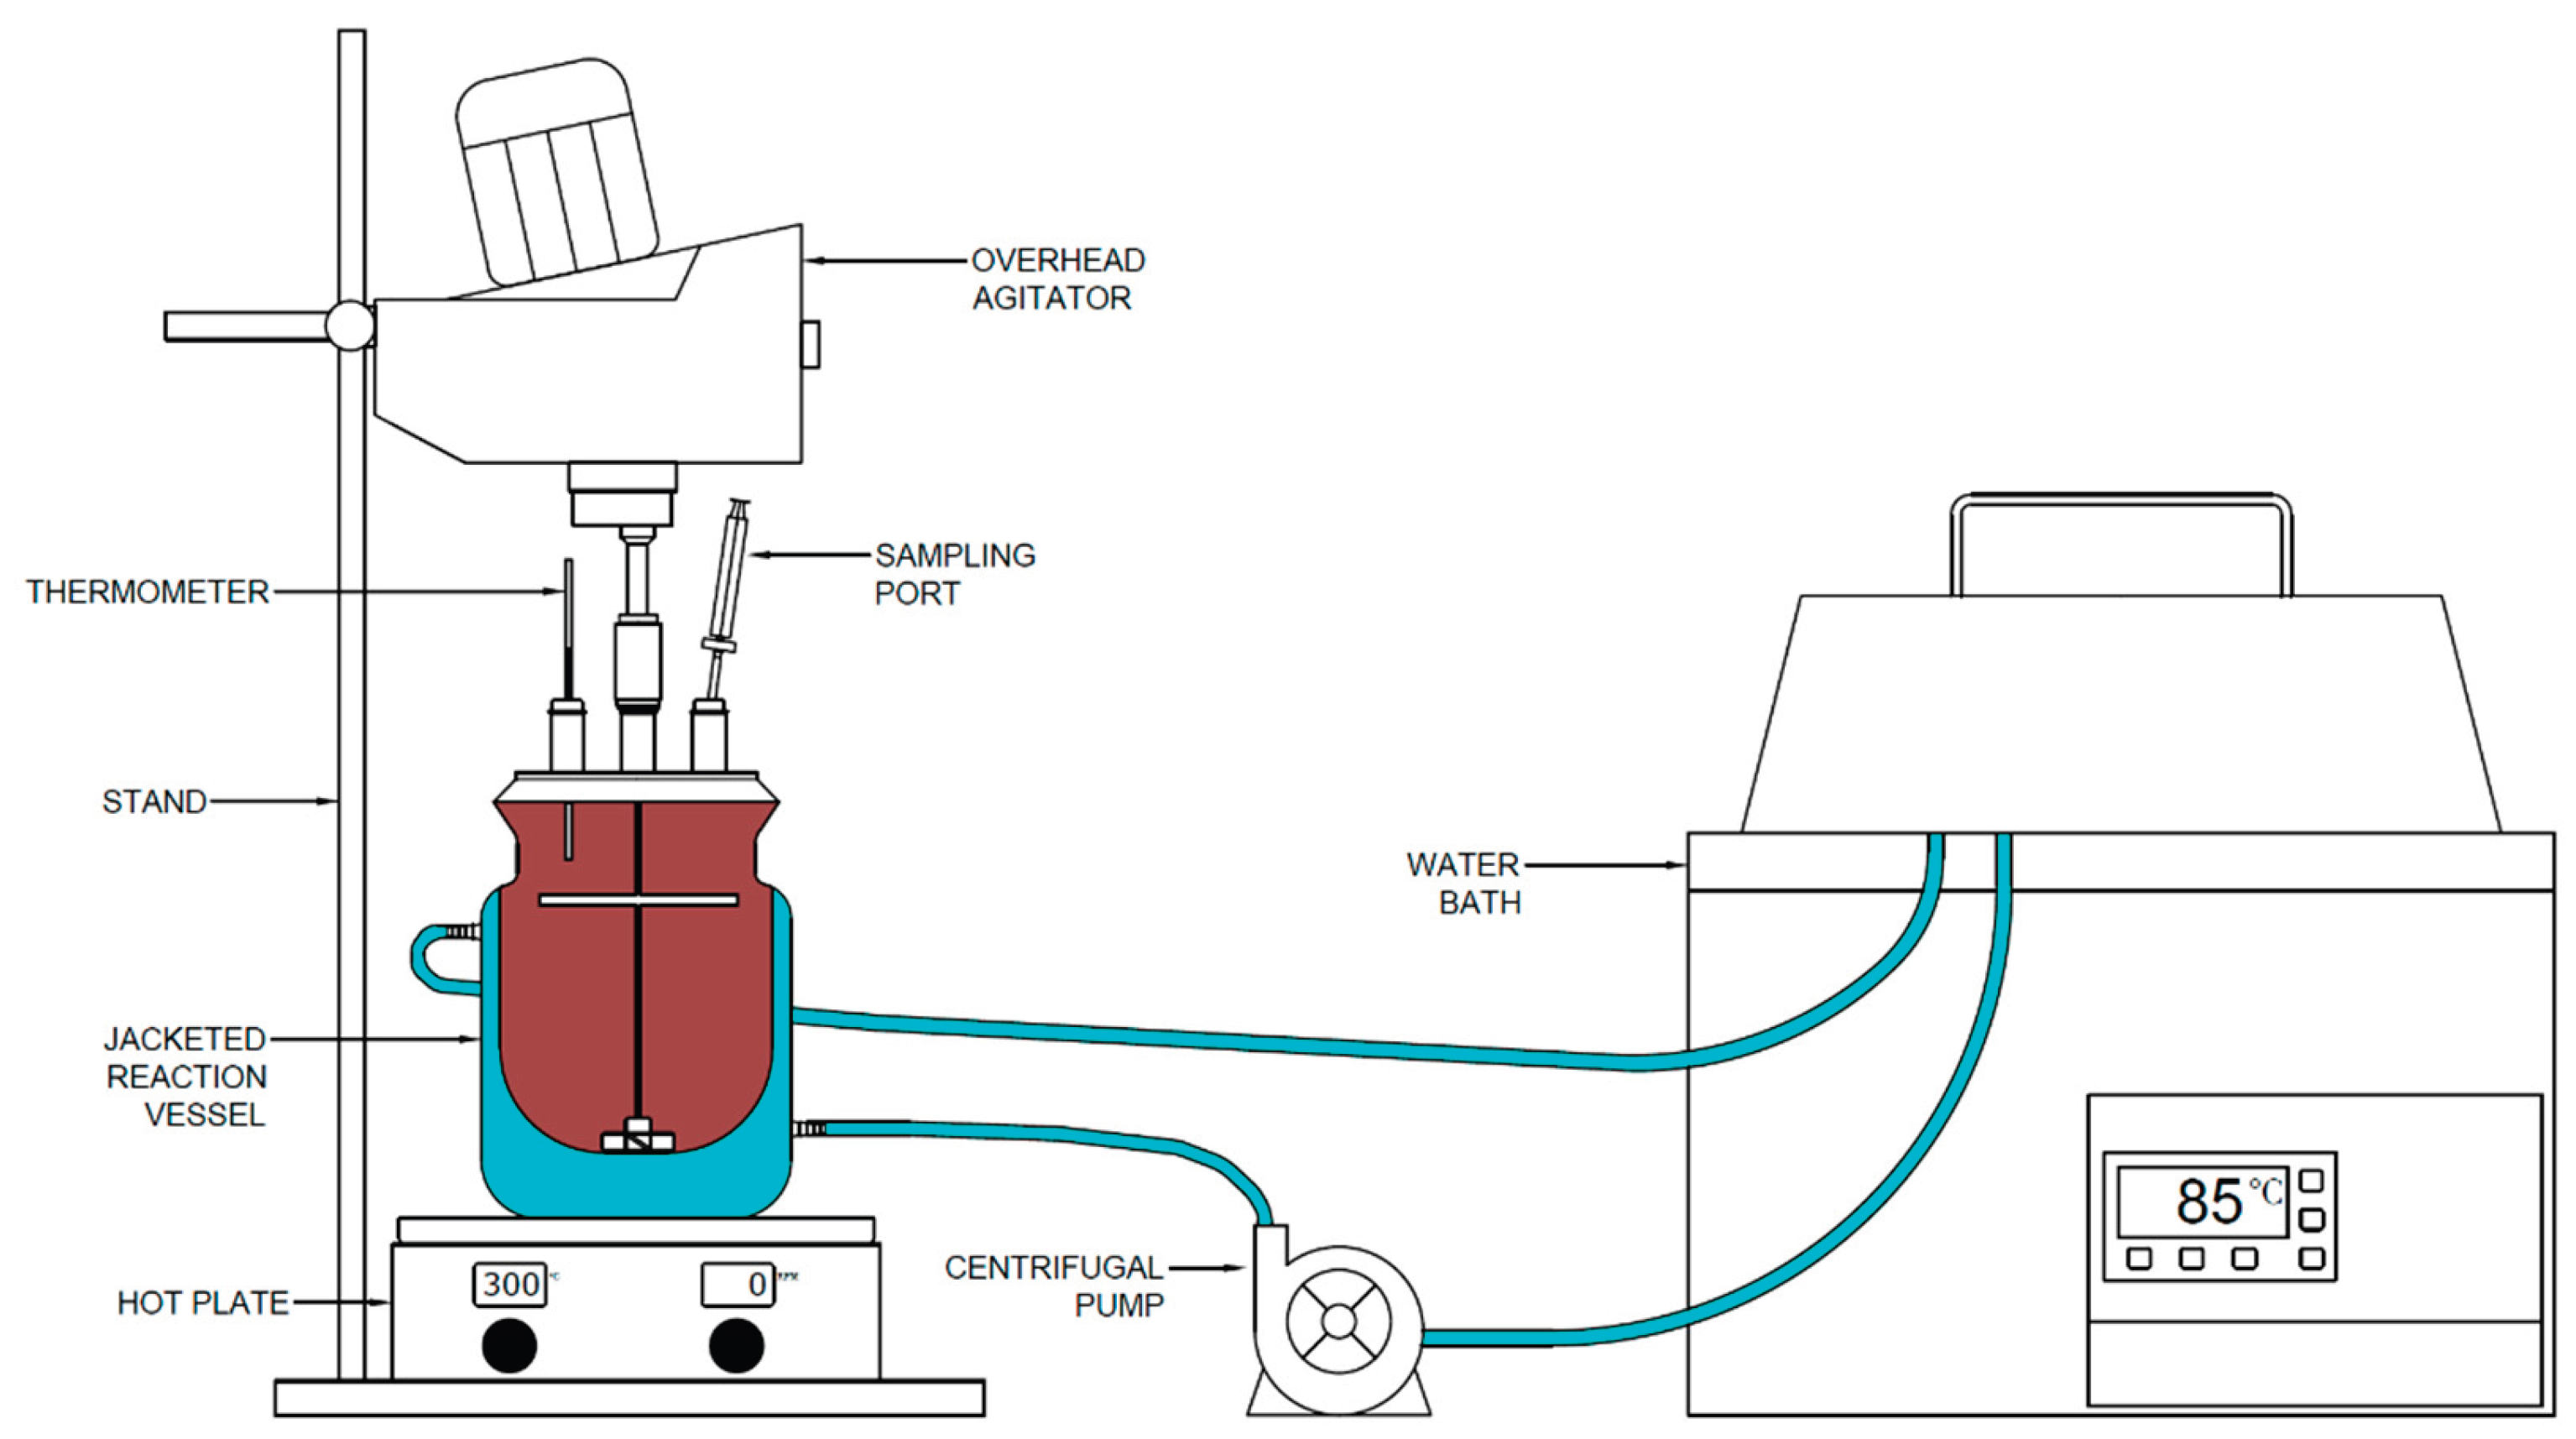
Figure 2.
Measured redox potential as a function of the ferric-to-ferrous concentration ratio in ferric sulfate media at pH 1.4, a total iron concentration of 10 g/L, and 85 °C.
Figure 2.
Measured redox potential as a function of the ferric-to-ferrous concentration ratio in ferric sulfate media at pH 1.4, a total iron concentration of 10 g/L, and 85 °C.
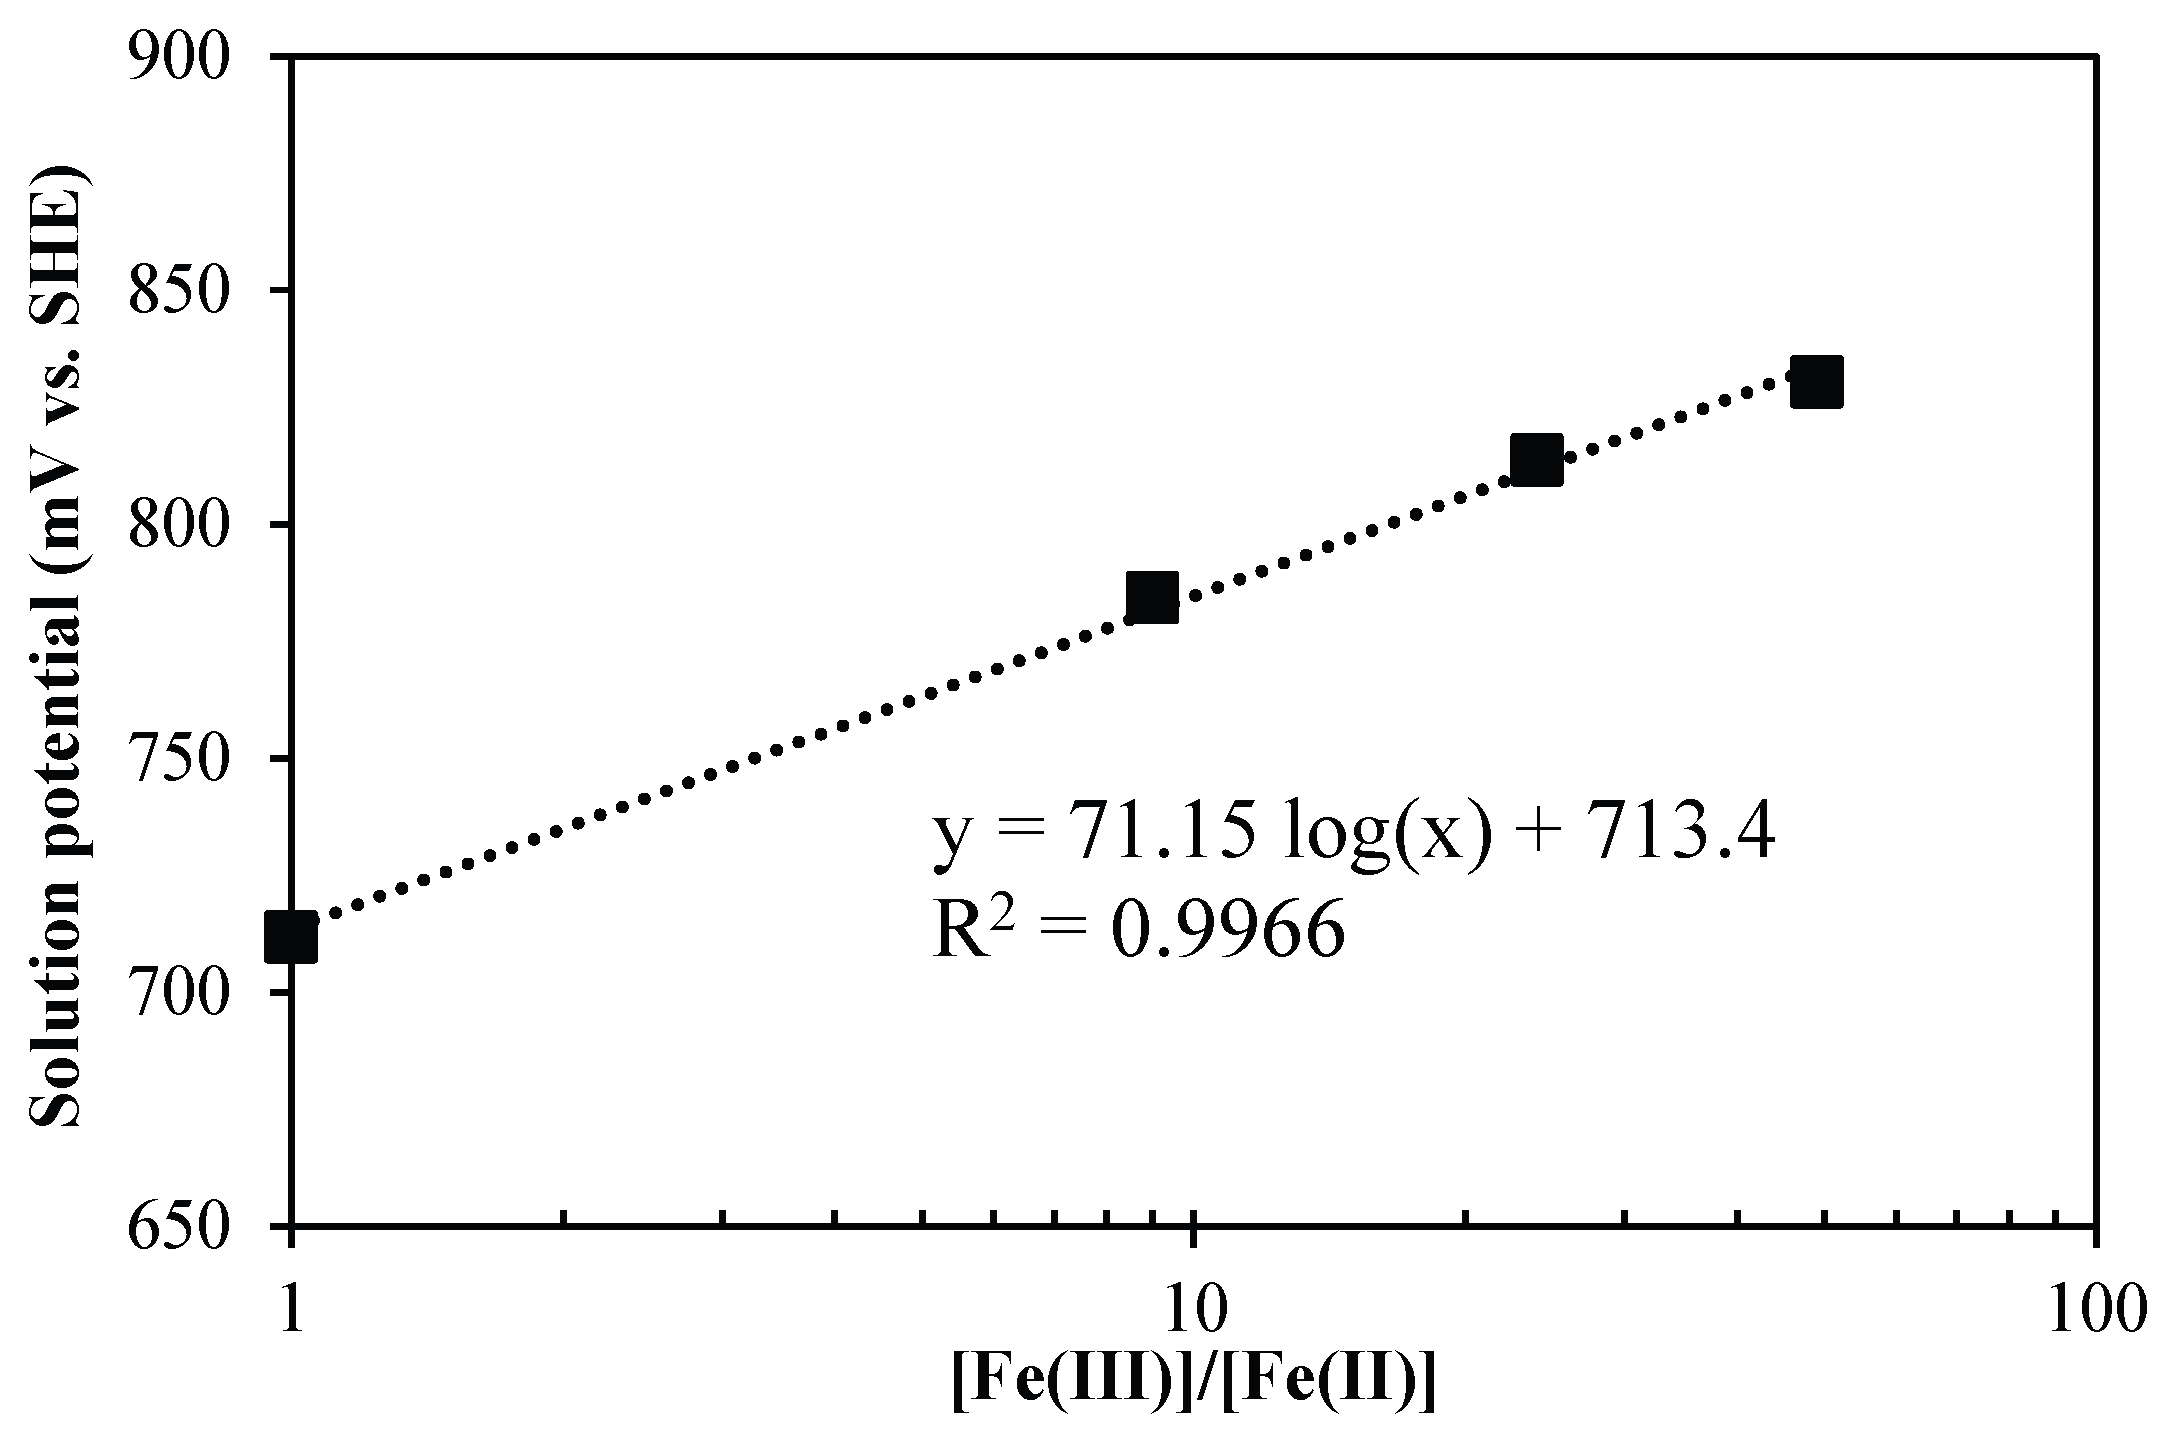
Figure 3.
Percentage of iodine species present as free iodide (I⁻), triiodide (I3⁻), aqueous diiodine (I2, aq), and gaseous diiodine (I2, g) as a function of solution potential in a leaching solution containing 10 g/L total iron and 150 mg/L Itotal at 85 °C.
Figure 3.
Percentage of iodine species present as free iodide (I⁻), triiodide (I3⁻), aqueous diiodine (I2, aq), and gaseous diiodine (I2, g) as a function of solution potential in a leaching solution containing 10 g/L total iron and 150 mg/L Itotal at 85 °C.
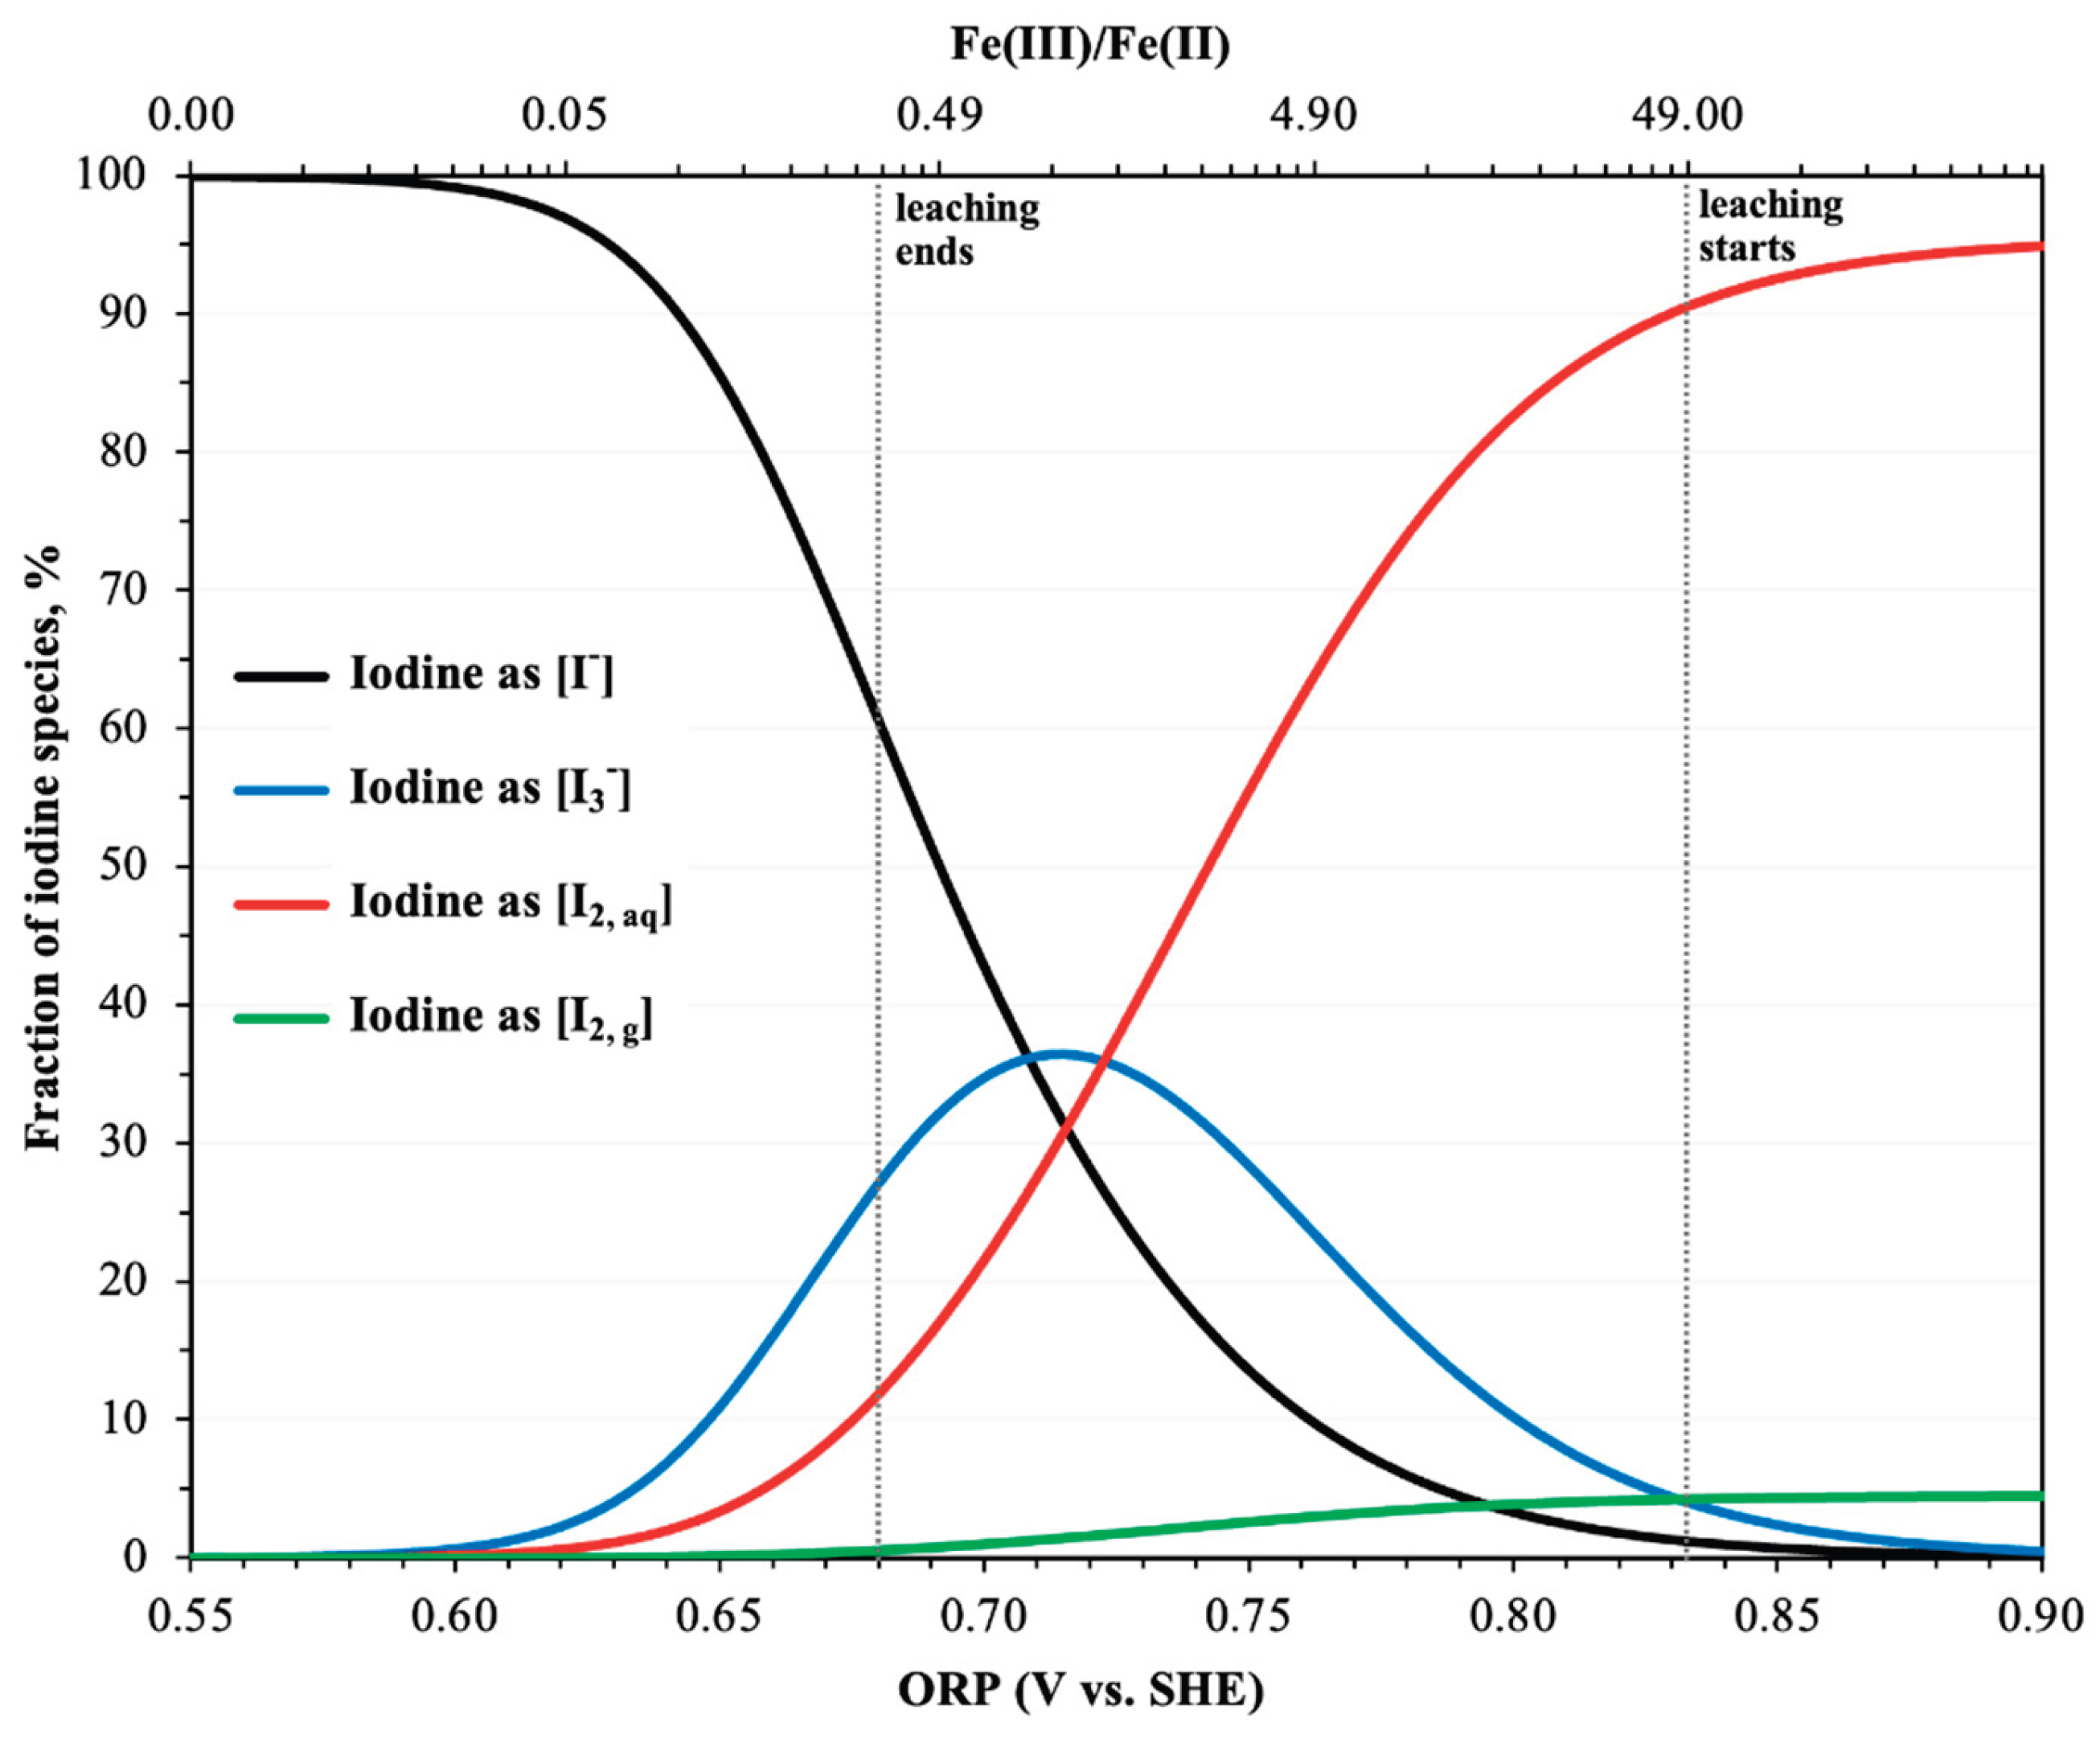
Figure 4.
Copper extraction (a), and ORP, pH, and total iodide concentration (b) from duplicate leaching tests on Sample A in ferric sulfate media at an initial Fe(III)/Fe(II) ratio of 49, a total iron concentration of 10 g/L, an initial iodide concentration of 150 mg/L, a solids content of 10 g/L, and 85 °C.
Figure 4.
Copper extraction (a), and ORP, pH, and total iodide concentration (b) from duplicate leaching tests on Sample A in ferric sulfate media at an initial Fe(III)/Fe(II) ratio of 49, a total iron concentration of 10 g/L, an initial iodide concentration of 150 mg/L, a solids content of 10 g/L, and 85 °C.
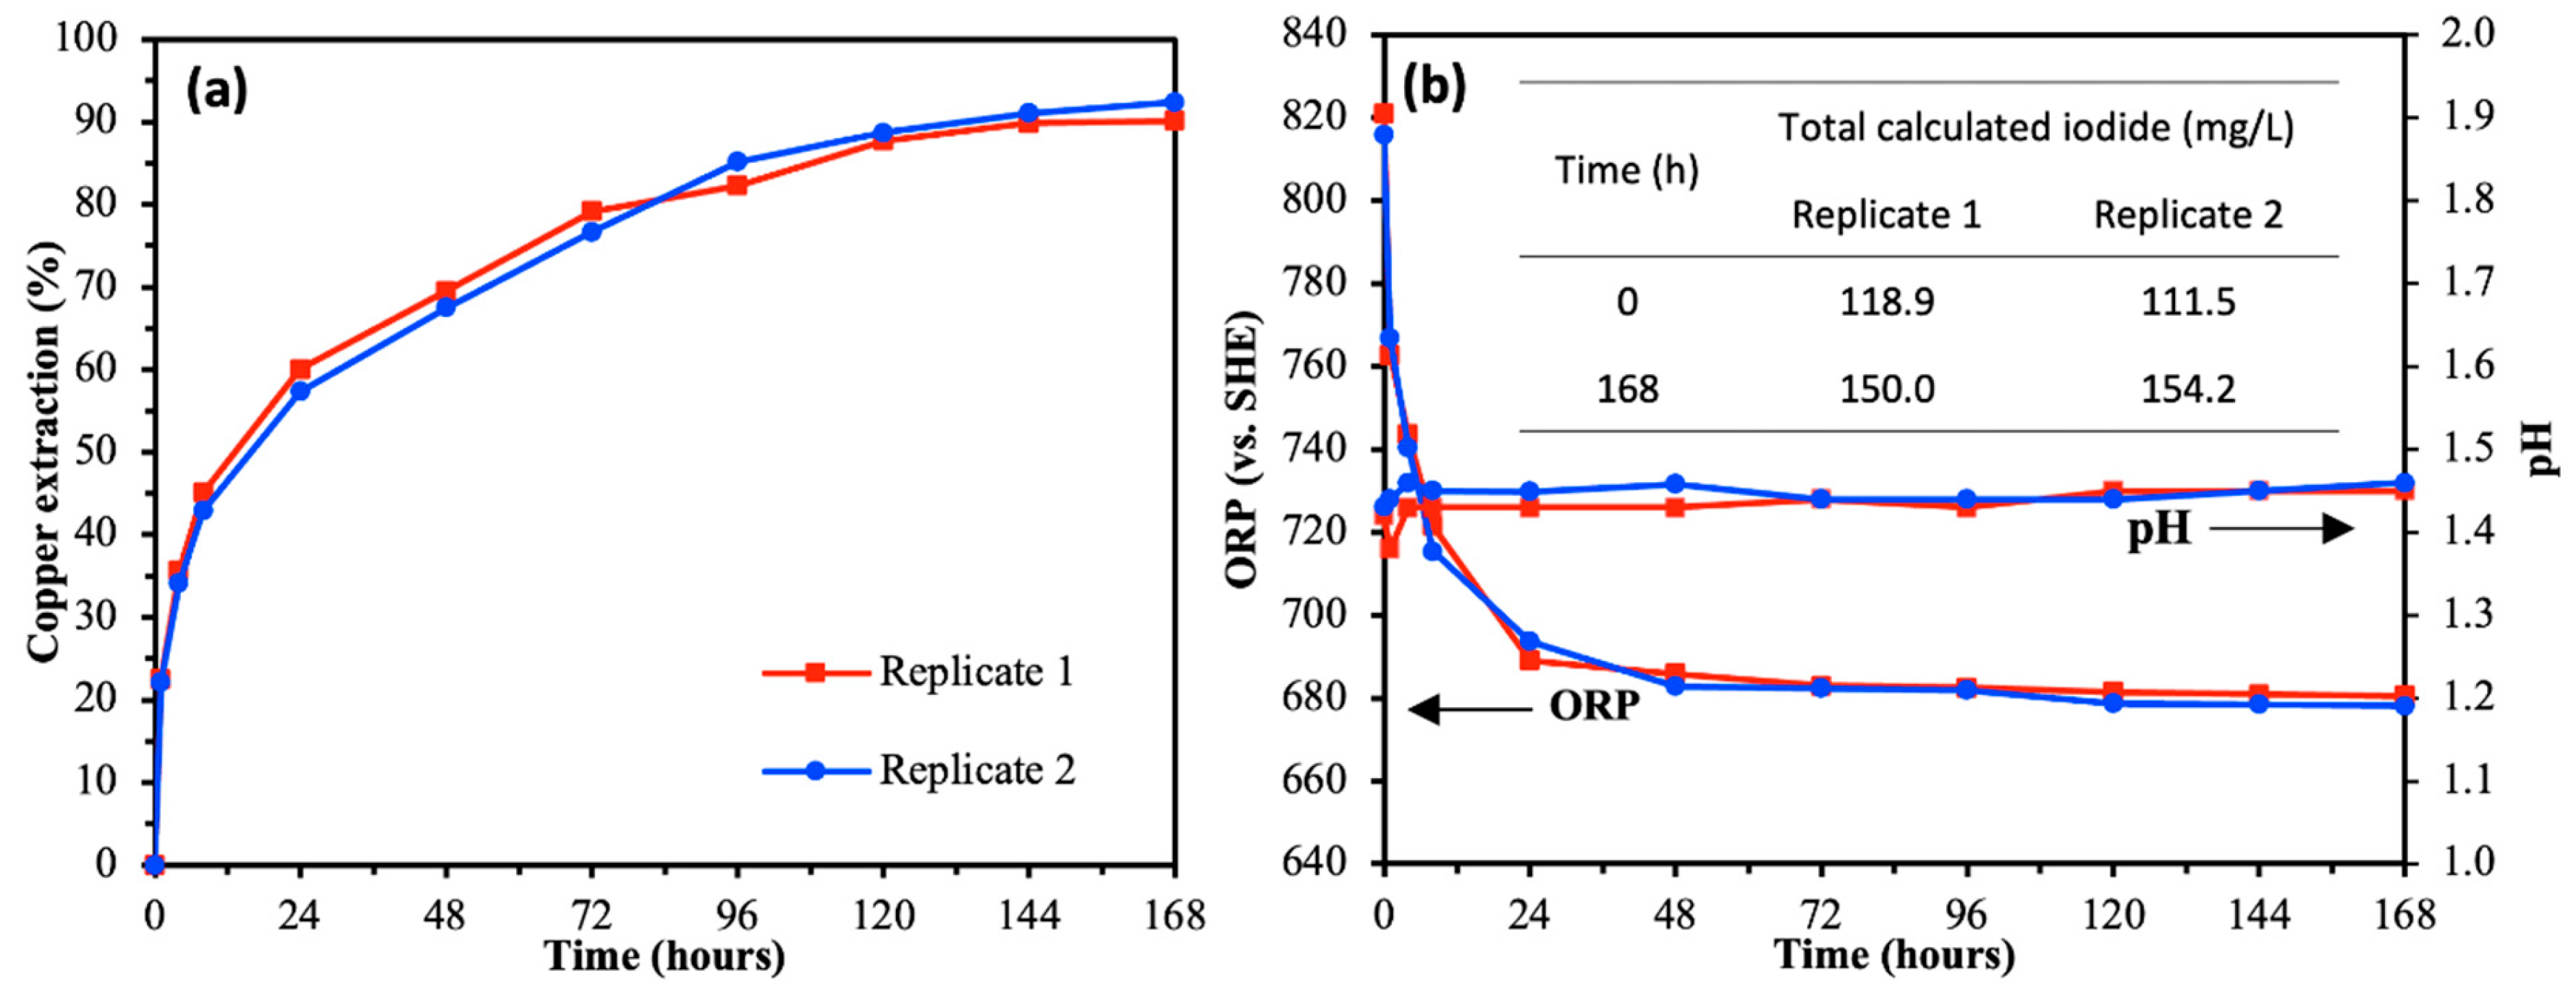
Figure 5.
Copper extraction from Sample A (a) and Sample B (b), ORP and pH measurements for Sample A (c) and Sample B (d), and dissolved iron concentration from Sample A (e) and Sample B (f) during leaching tests conducted with and without 150 mg/L iodide in ferric sulfate media. Leaching conditions: initial Fe(III)/Fe(II) ratio of 49, total iron concentration of 10 g/L, solids content of 10 g/L for Sample A and 2 g/L for Sample B, and a temperature of 85 °C.
Figure 5.
Copper extraction from Sample A (a) and Sample B (b), ORP and pH measurements for Sample A (c) and Sample B (d), and dissolved iron concentration from Sample A (e) and Sample B (f) during leaching tests conducted with and without 150 mg/L iodide in ferric sulfate media. Leaching conditions: initial Fe(III)/Fe(II) ratio of 49, total iron concentration of 10 g/L, solids content of 10 g/L for Sample A and 2 g/L for Sample B, and a temperature of 85 °C.
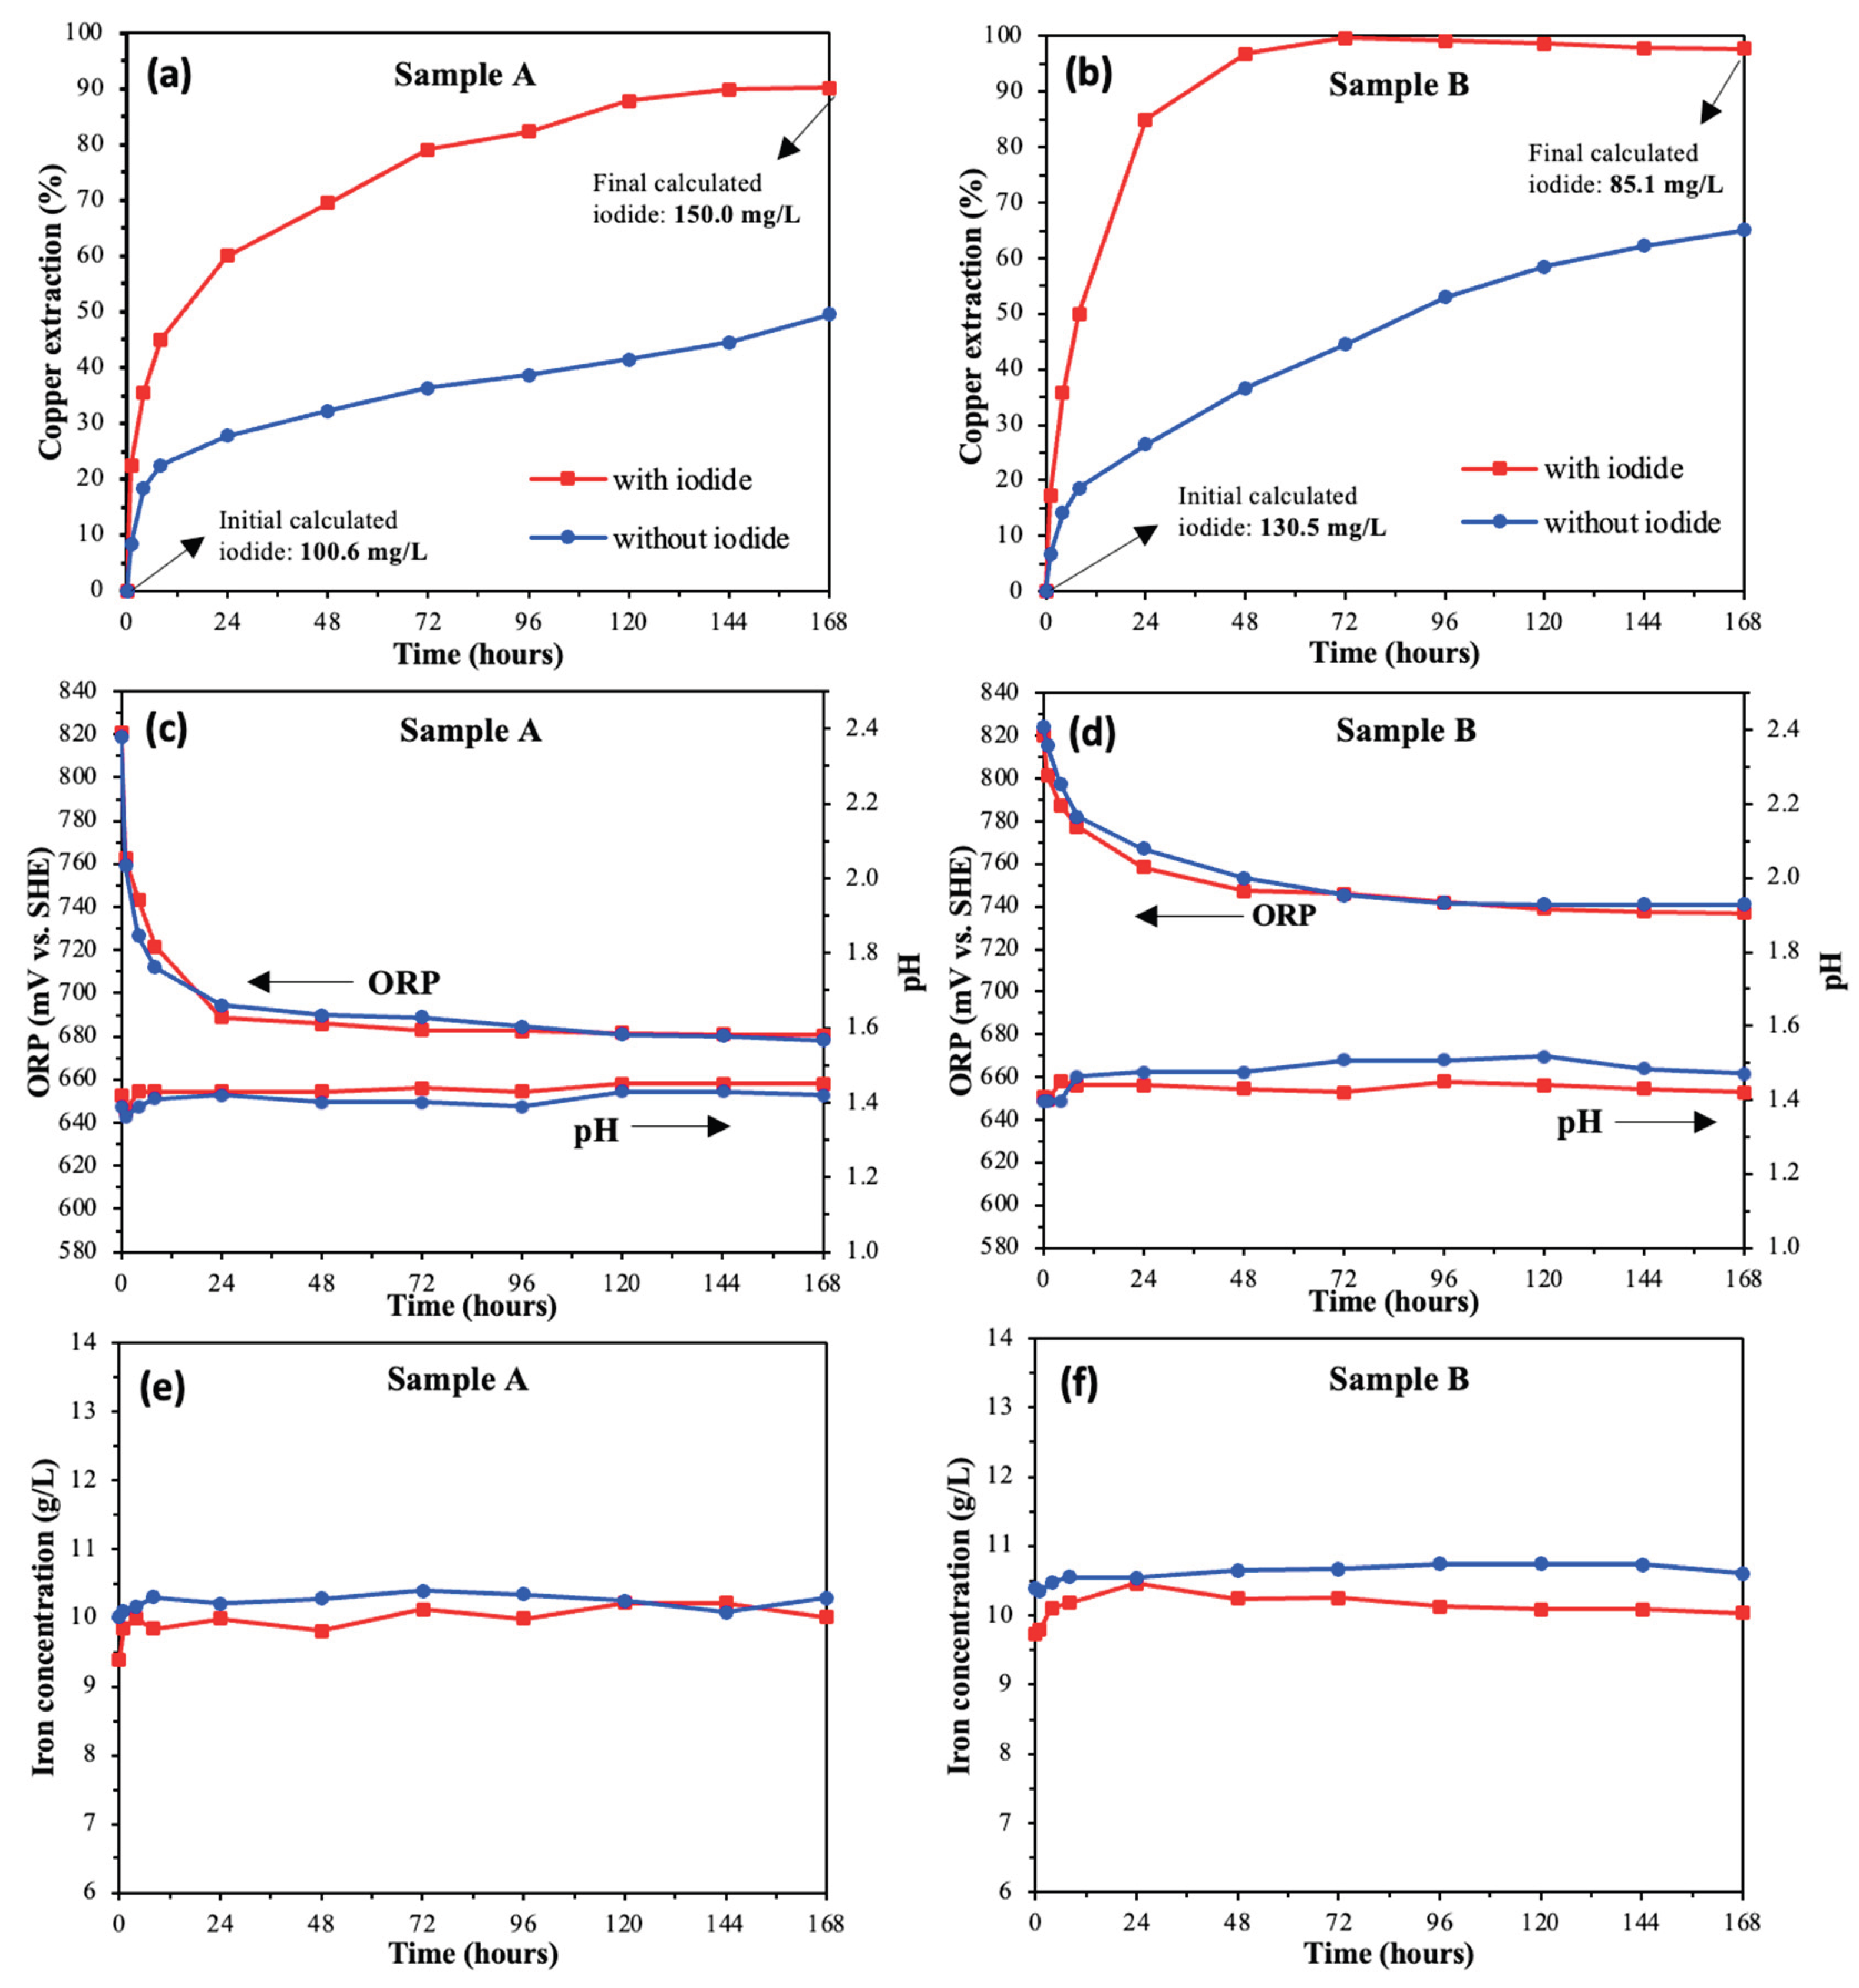
Figure 6.
Copper extractions (a), ORP (b), and pH measurements during multistage leaching of Sample A in ferric sulfate media, showing the effect of oxidant replenishment on leaching kinetics. Tests were conducted at an initial Fe(III)/Fe(II) ratio of 49, total iron concentration of 10 g/L, solids content of 10 g/L, initial iodide concentration of 150 mg/L, and 85 °C.
Figure 6.
Copper extractions (a), ORP (b), and pH measurements during multistage leaching of Sample A in ferric sulfate media, showing the effect of oxidant replenishment on leaching kinetics. Tests were conducted at an initial Fe(III)/Fe(II) ratio of 49, total iron concentration of 10 g/L, solids content of 10 g/L, initial iodide concentration of 150 mg/L, and 85 °C.
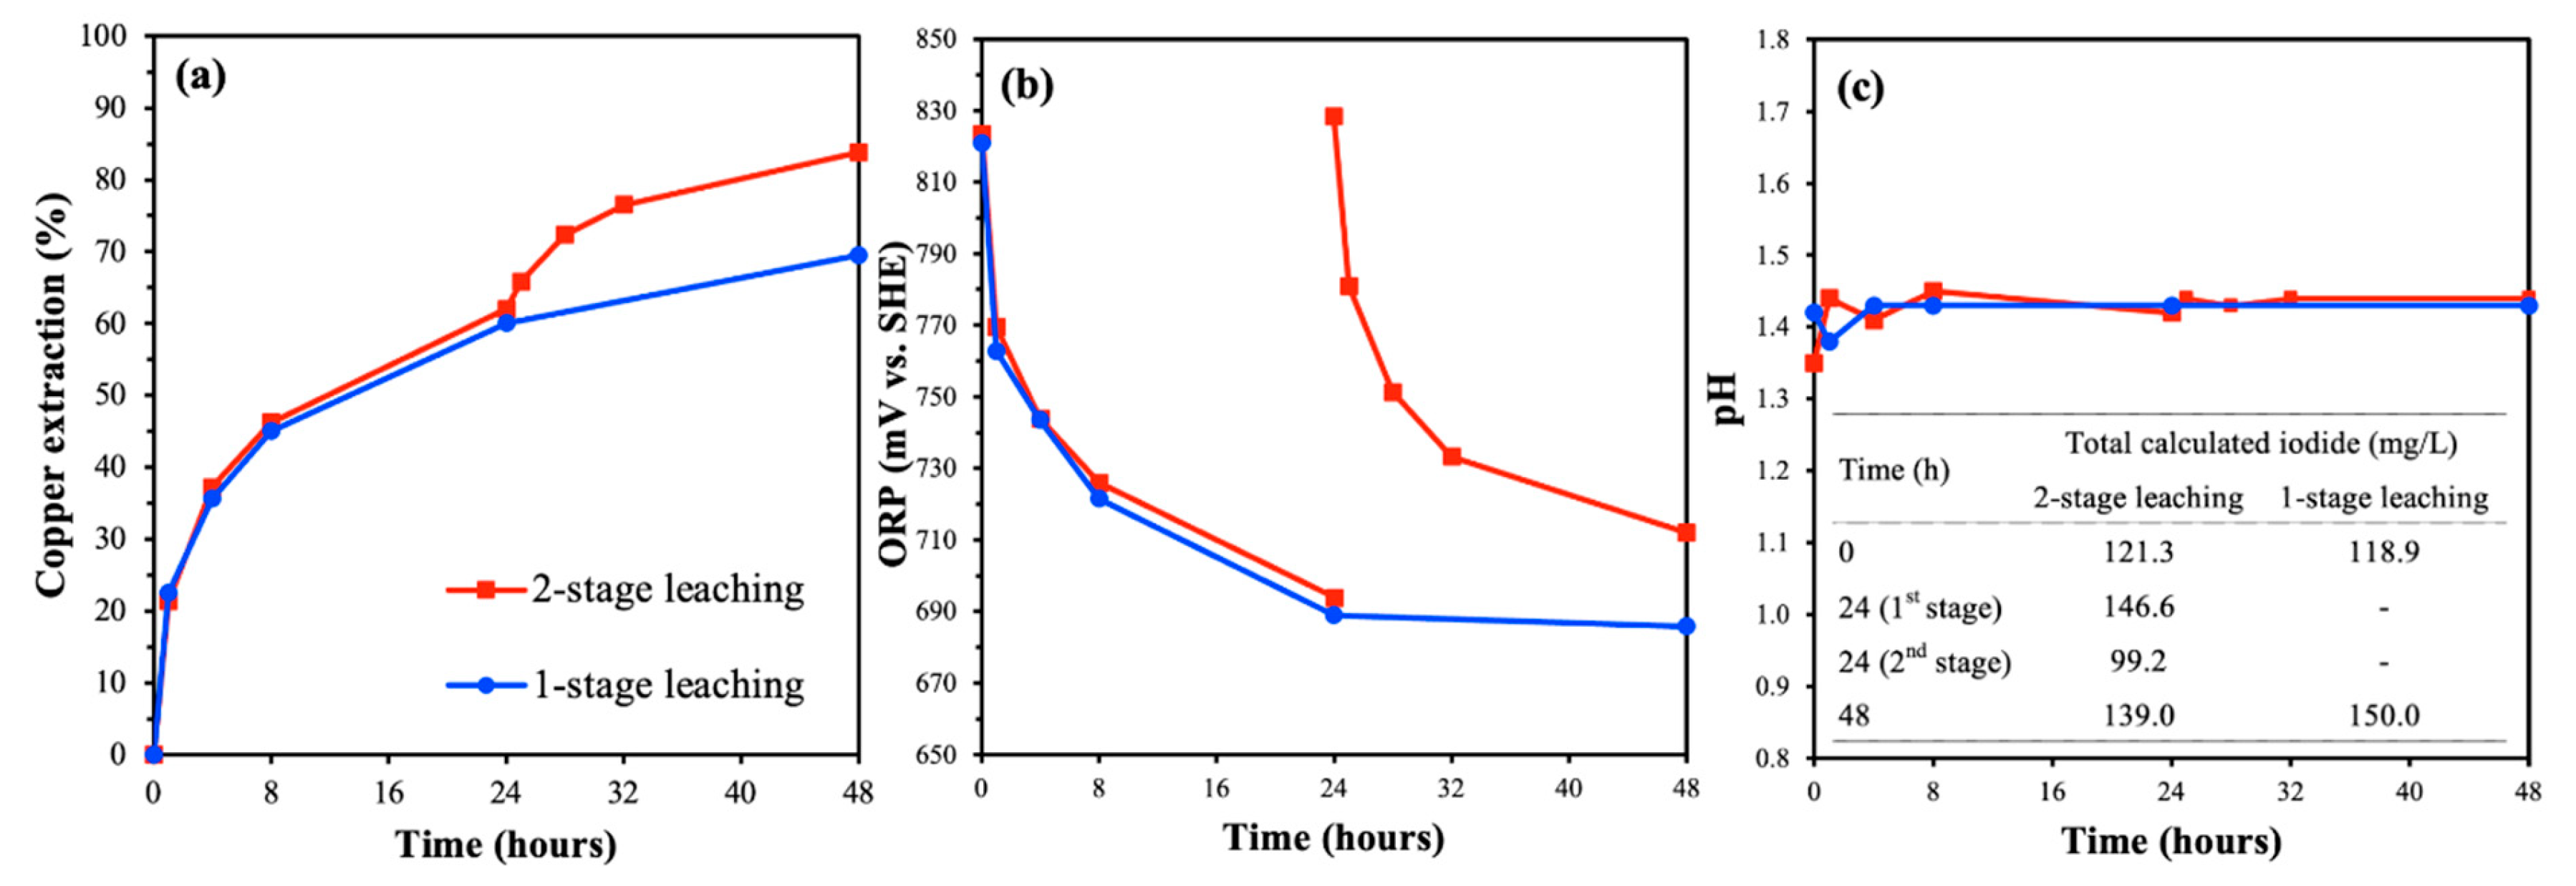
Figure 7.
Copper extractions (a, d), ORP (b, e), and pH (c, f) measurements for Sample A and Sample B with and without the addition of Cl⁻ in ferric sulfate media. Leaching conditions: Fe(III)/Fe(II) ratio of 49, total iron concentration of 10 g/L, solids content of 10 g/L (Sample A) and 2 g/L (Sample B), and at 85 °C.
Figure 7.
Copper extractions (a, d), ORP (b, e), and pH (c, f) measurements for Sample A and Sample B with and without the addition of Cl⁻ in ferric sulfate media. Leaching conditions: Fe(III)/Fe(II) ratio of 49, total iron concentration of 10 g/L, solids content of 10 g/L (Sample A) and 2 g/L (Sample B), and at 85 °C.
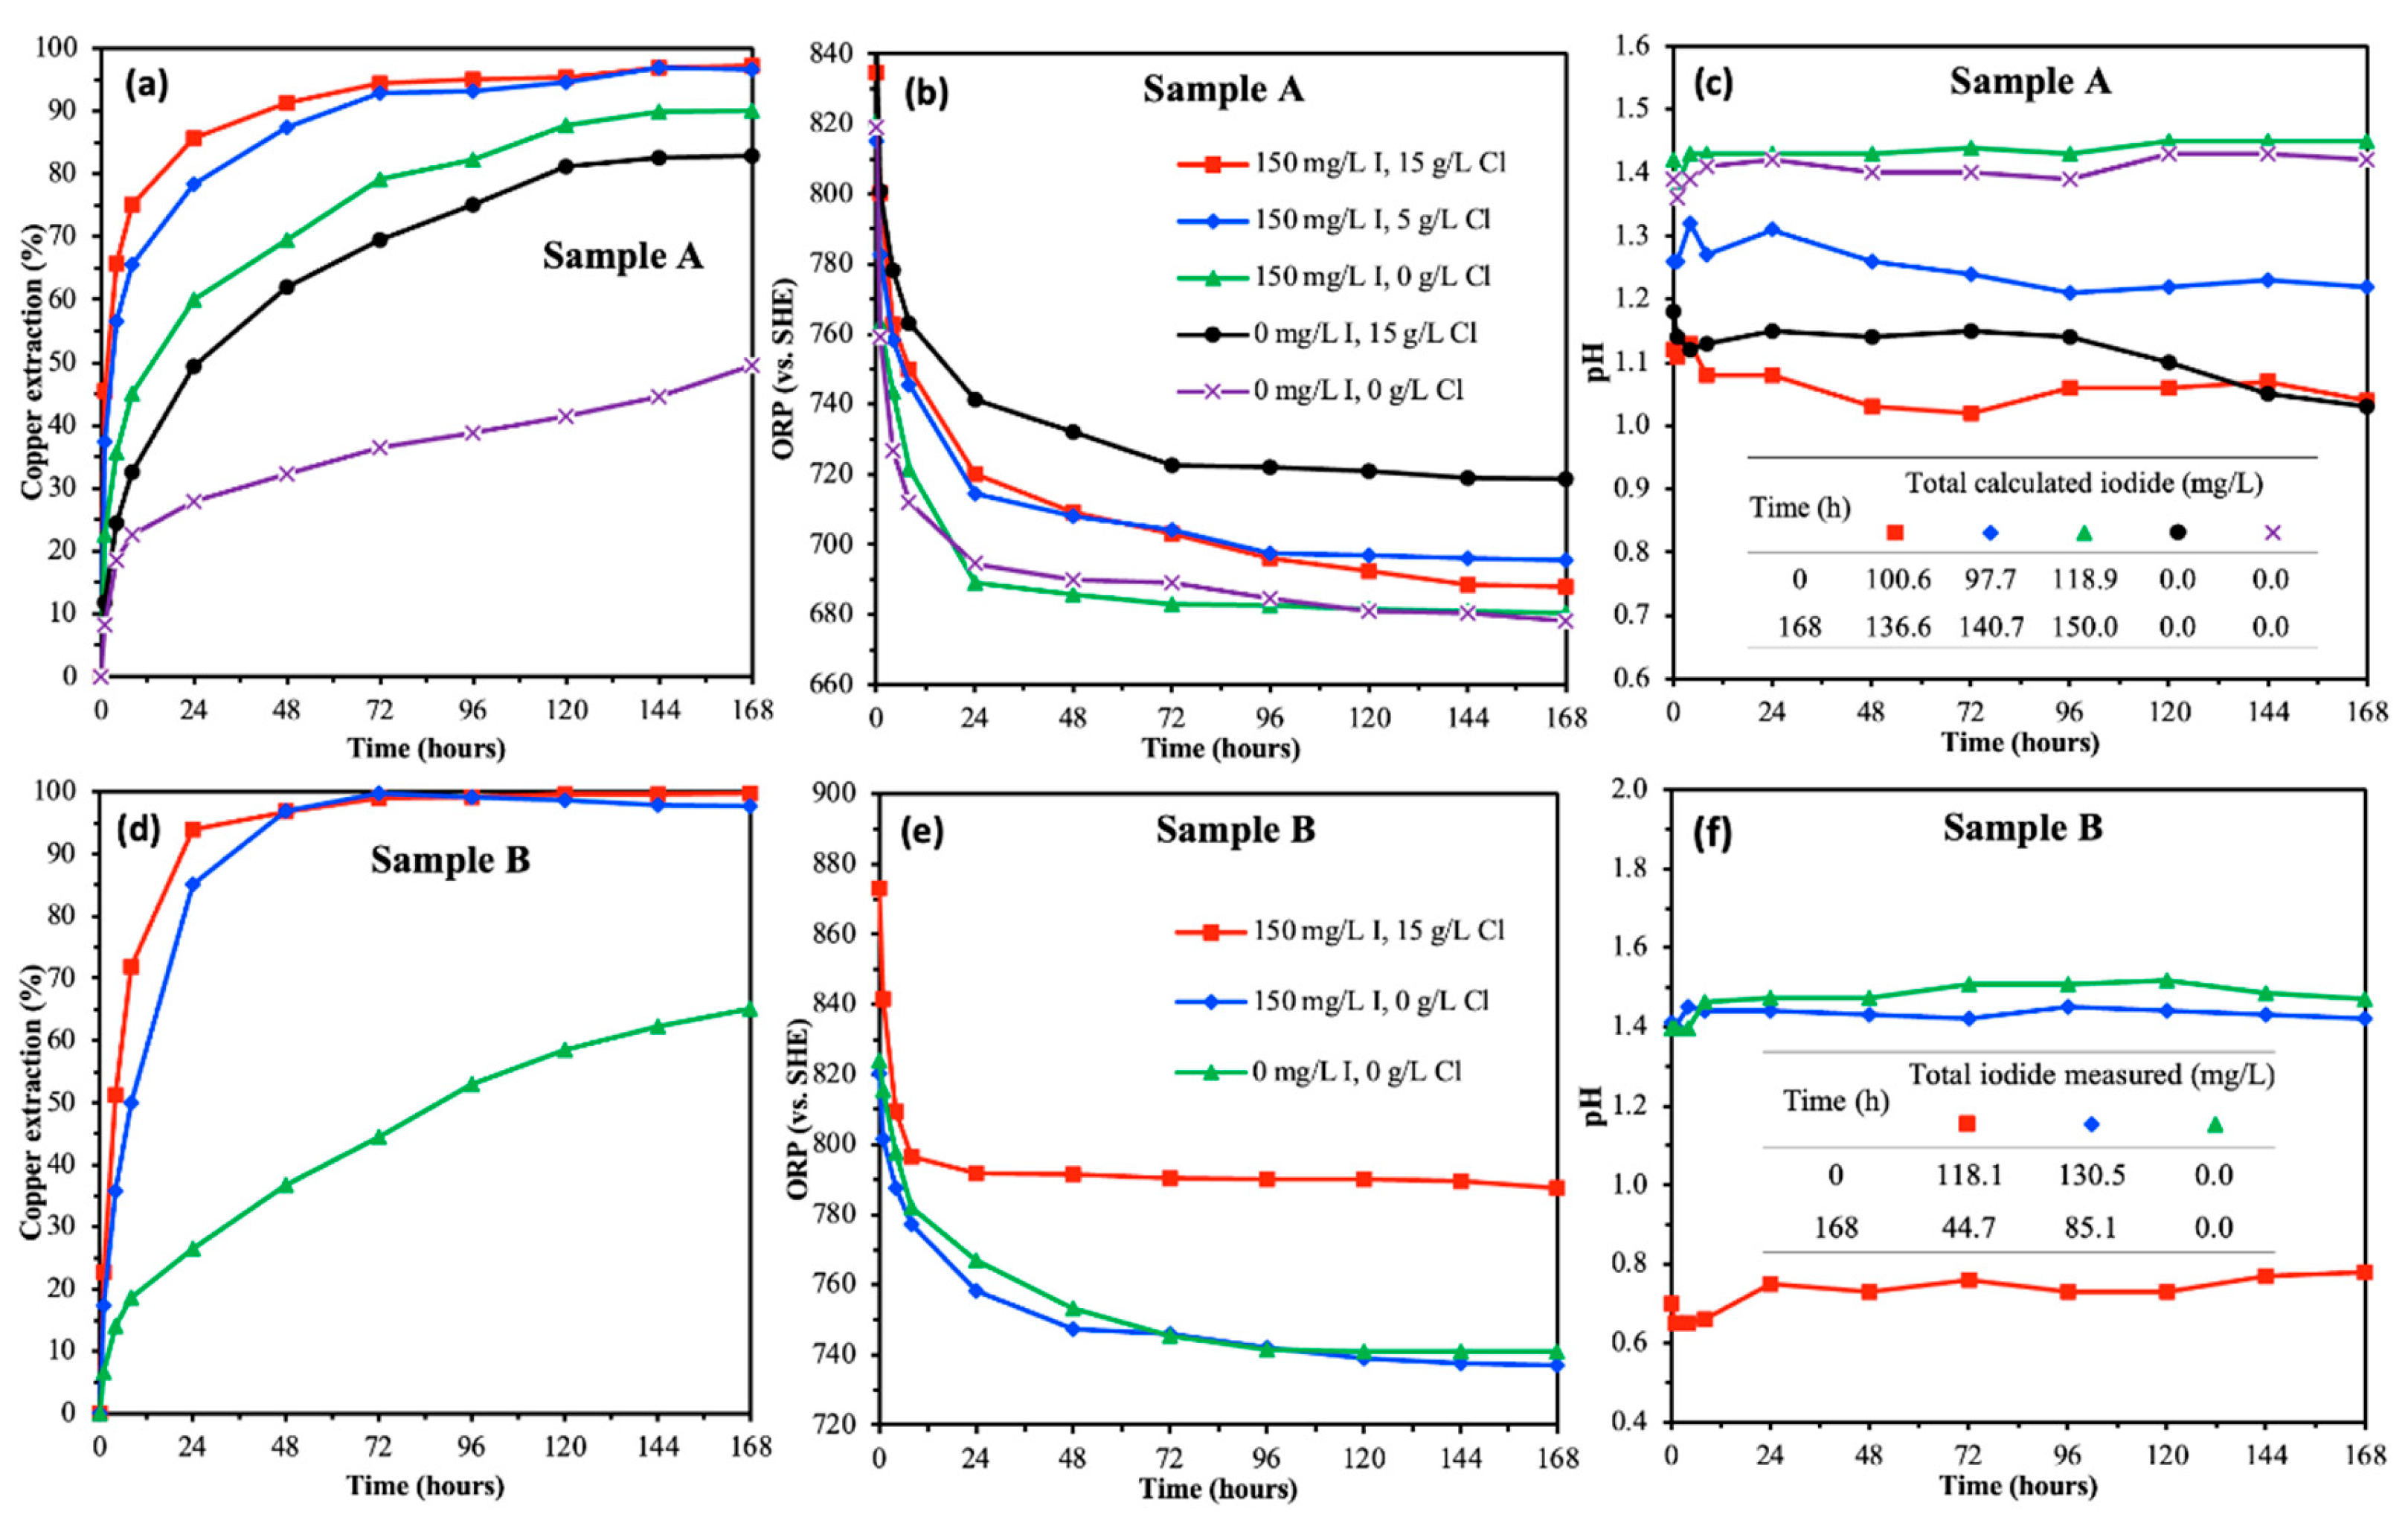
Figure 8.
Copper extractions (a, d), ORP (b, e) and pH (c, f) measurements during leaching tests on Sample A and B conducted at different initial Fe(III)/Fe(II) concentration ratios in ferric sulfate media containing a total iron concentration of 10 g/L, solids content of 10 g/L (Sample A) and 2 g/L (Sample B), initial iodide concentration of 150 mg/L, and at 85 °C.
Figure 8.
Copper extractions (a, d), ORP (b, e) and pH (c, f) measurements during leaching tests on Sample A and B conducted at different initial Fe(III)/Fe(II) concentration ratios in ferric sulfate media containing a total iron concentration of 10 g/L, solids content of 10 g/L (Sample A) and 2 g/L (Sample B), initial iodide concentration of 150 mg/L, and at 85 °C.
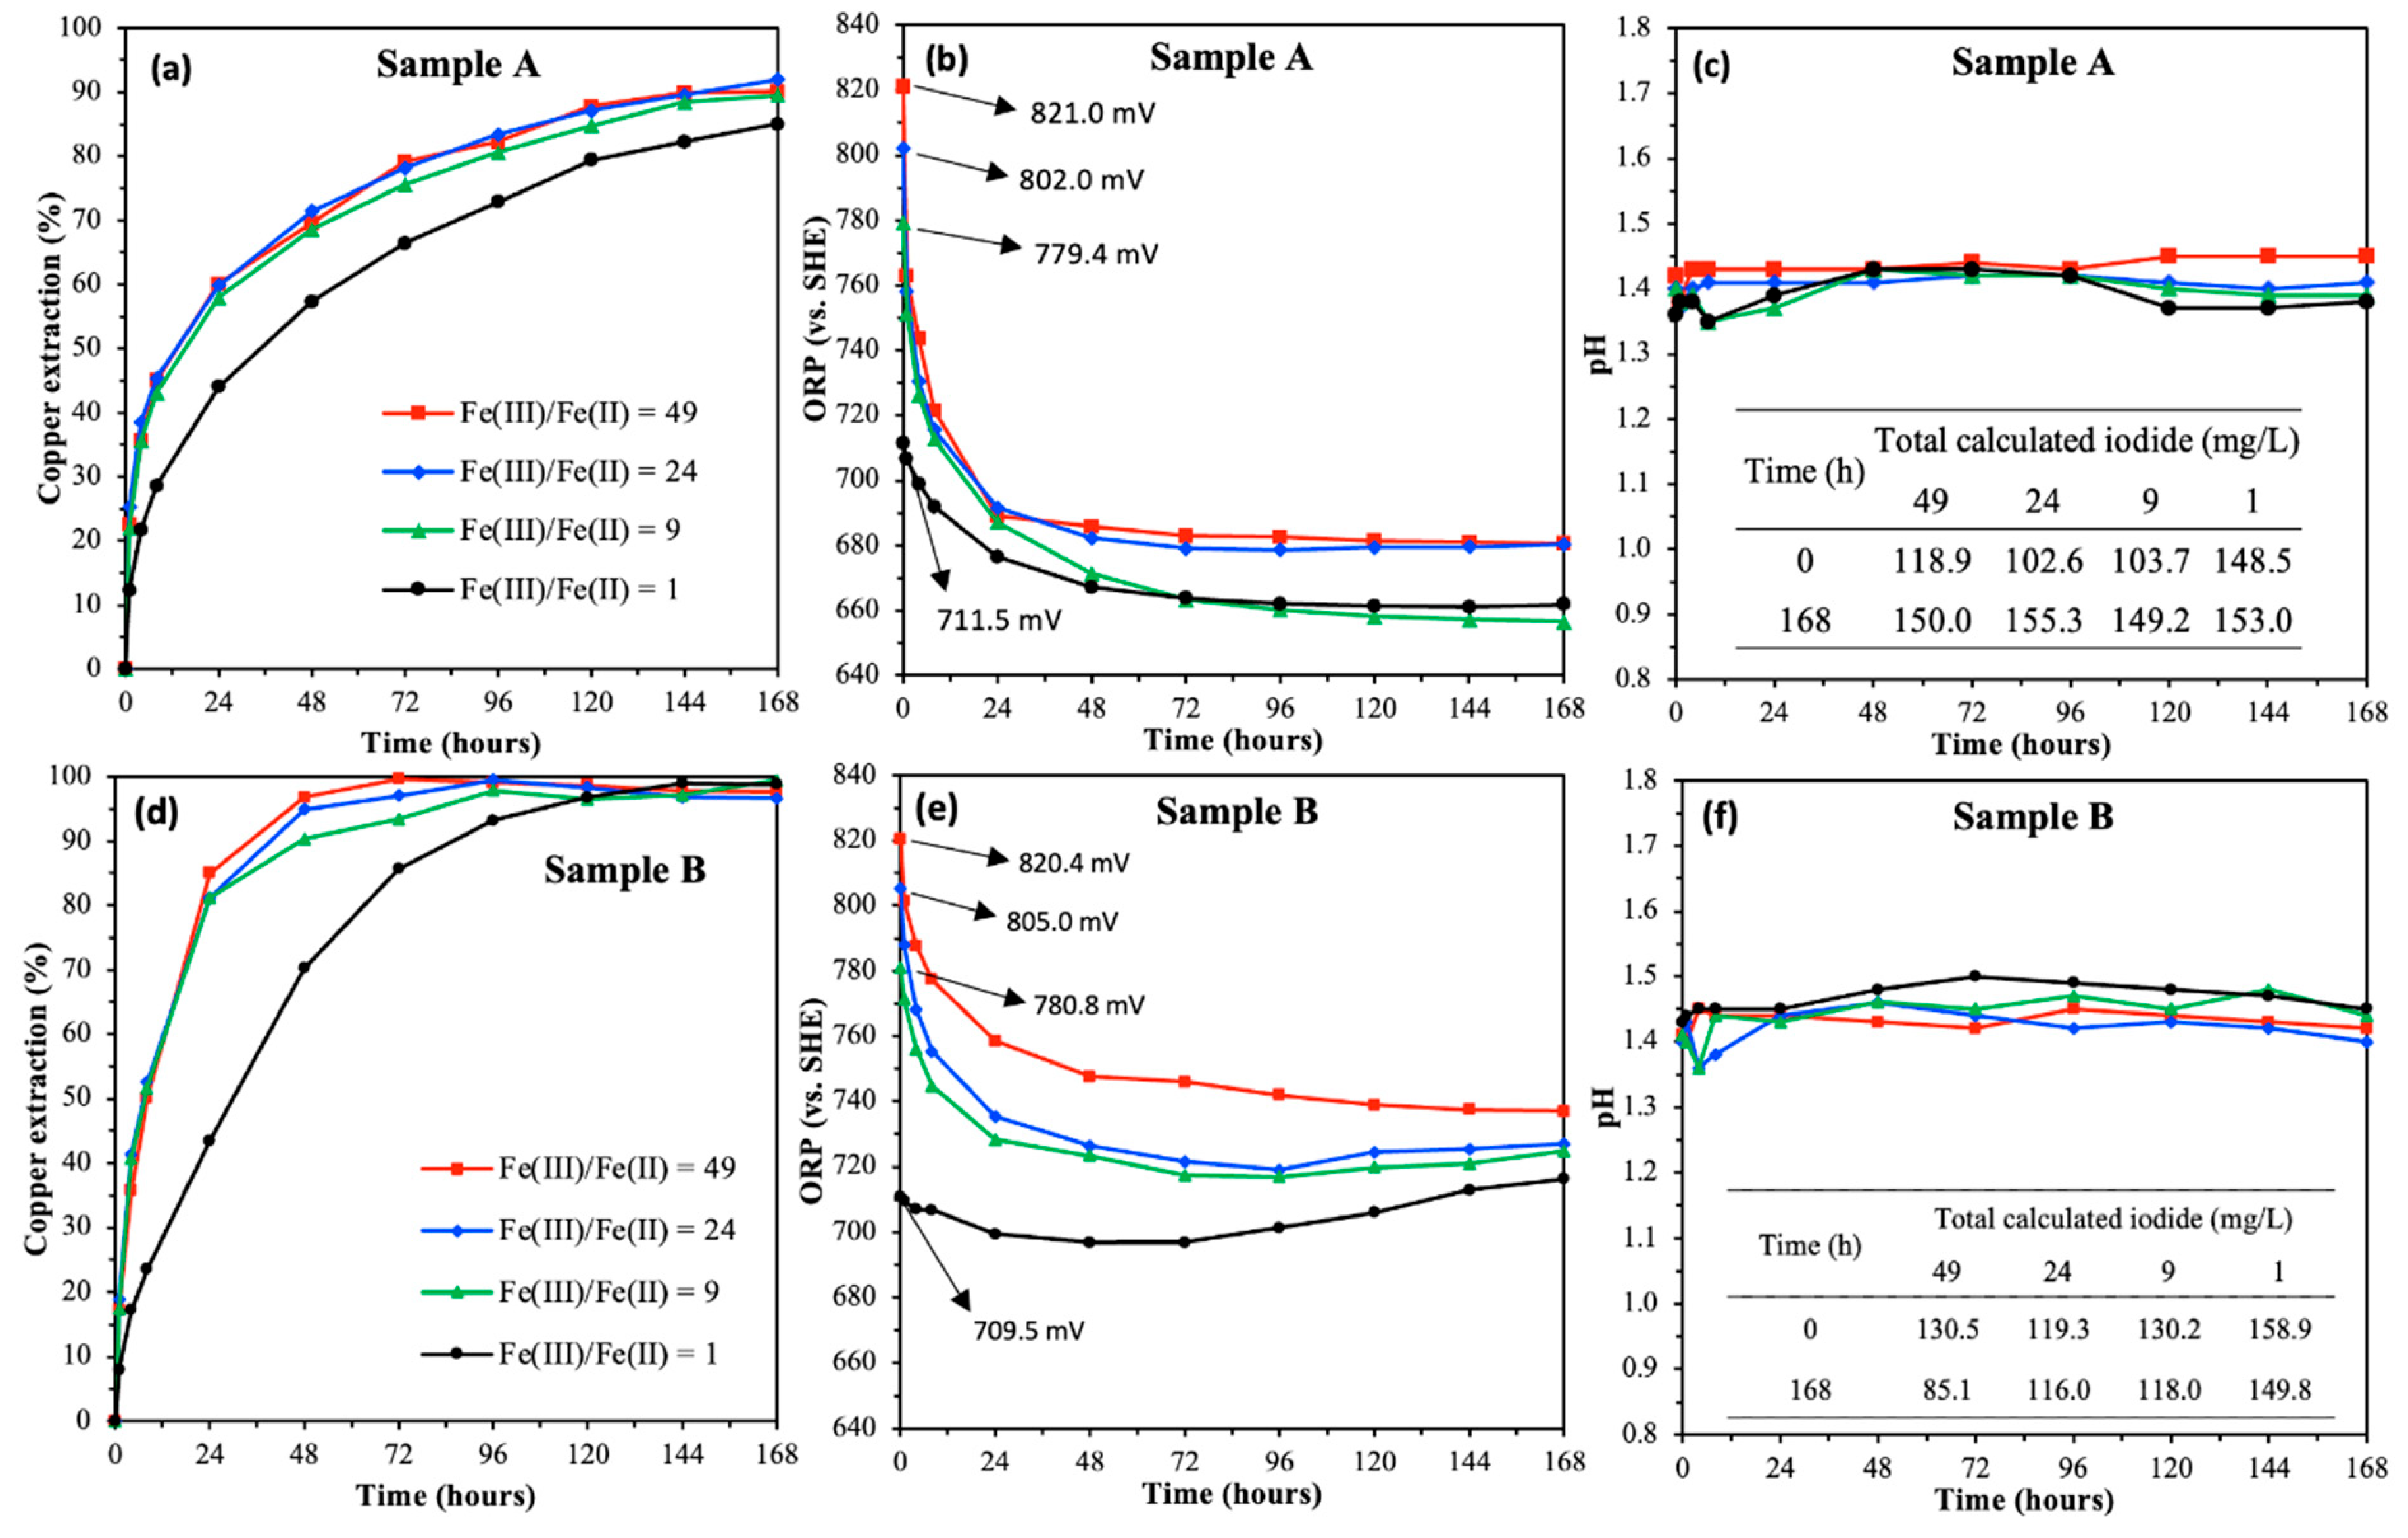
Figure 9.
Copper extractions (a, d), ORP (b, e), and pH (c, f) measurements from tests on Samples A and B at different initial iodide concentrations in ferric sulfate media containing a Fe(III)/Fe(II) ratio of 49, total iron concentration of 10 g/L, solids content of 10 g/L (Sample A) and 2 g/L (Sample B), and at 85 °C.
Figure 9.
Copper extractions (a, d), ORP (b, e), and pH (c, f) measurements from tests on Samples A and B at different initial iodide concentrations in ferric sulfate media containing a Fe(III)/Fe(II) ratio of 49, total iron concentration of 10 g/L, solids content of 10 g/L (Sample A) and 2 g/L (Sample B), and at 85 °C.
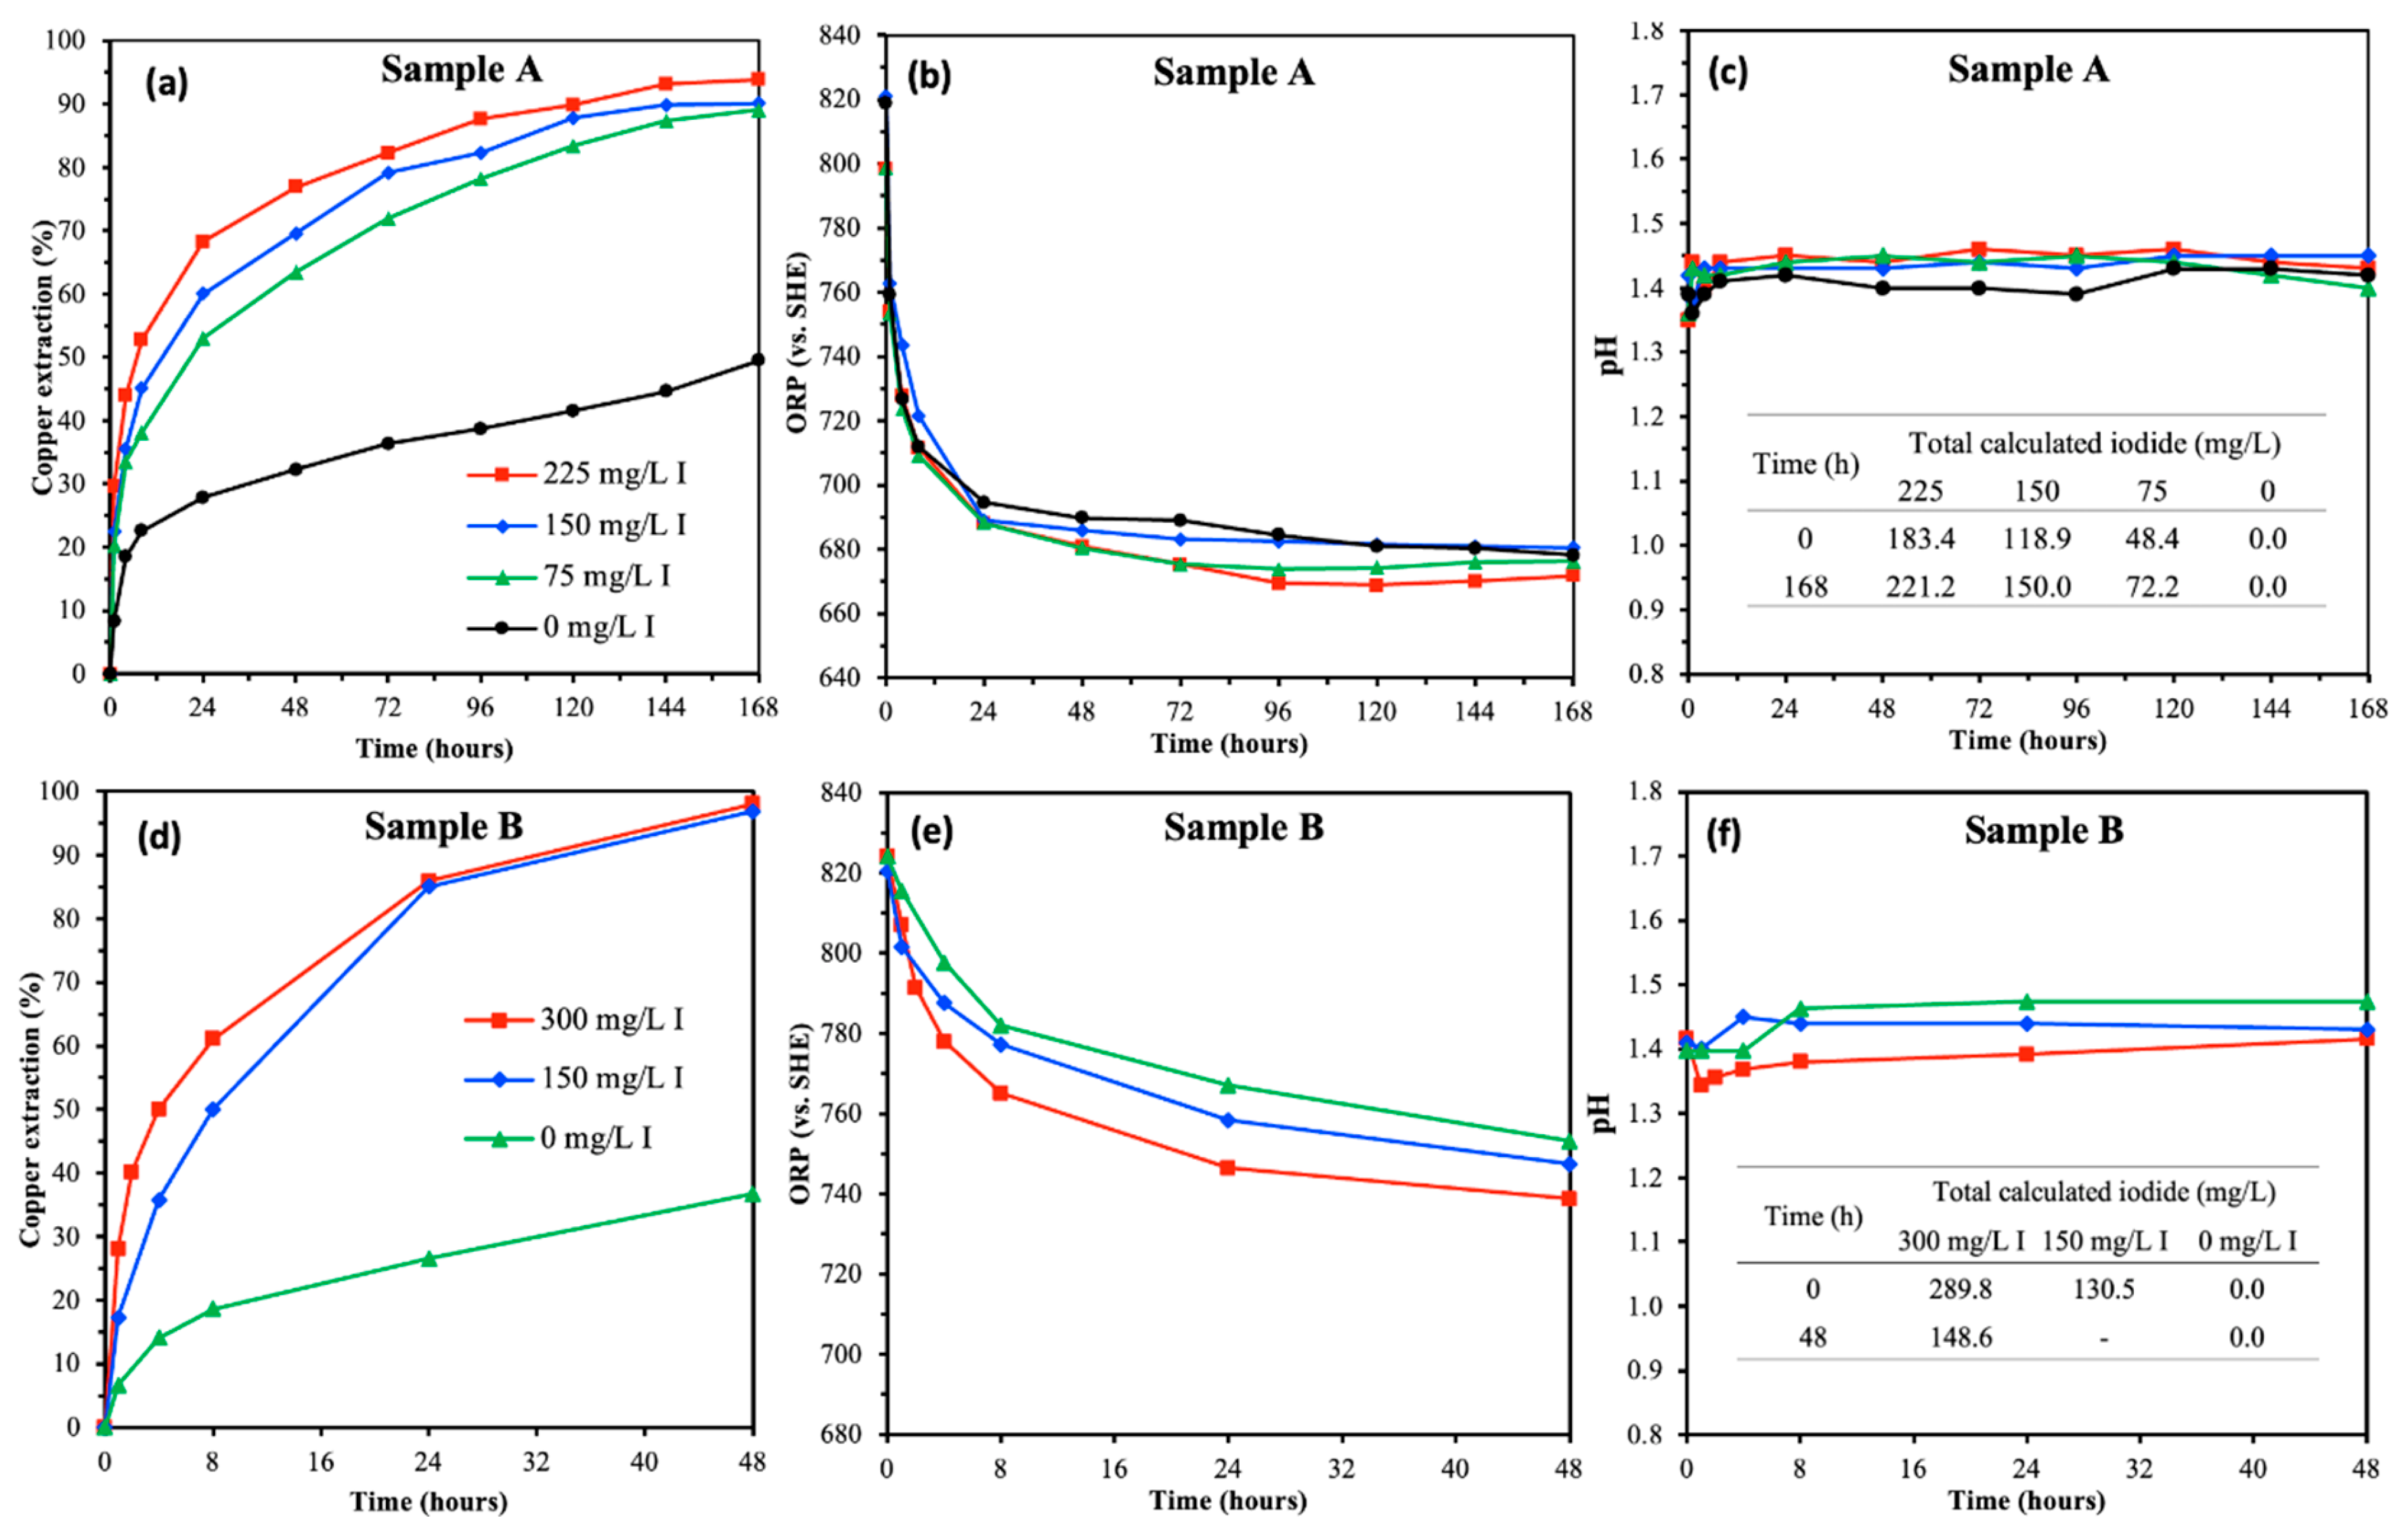
Figure 10.
Copper extractions (a) and ORP (b) measurements from tests on Sample A at different temperatures in ferric sulfate media containing a Fe(III)/Fe(II) ratio of 49, total iron concentration of 10 g/L, solids content of 10 g/L, and initial iodide concentration of 150 mg/L.
Figure 10.
Copper extractions (a) and ORP (b) measurements from tests on Sample A at different temperatures in ferric sulfate media containing a Fe(III)/Fe(II) ratio of 49, total iron concentration of 10 g/L, solids content of 10 g/L, and initial iodide concentration of 150 mg/L.
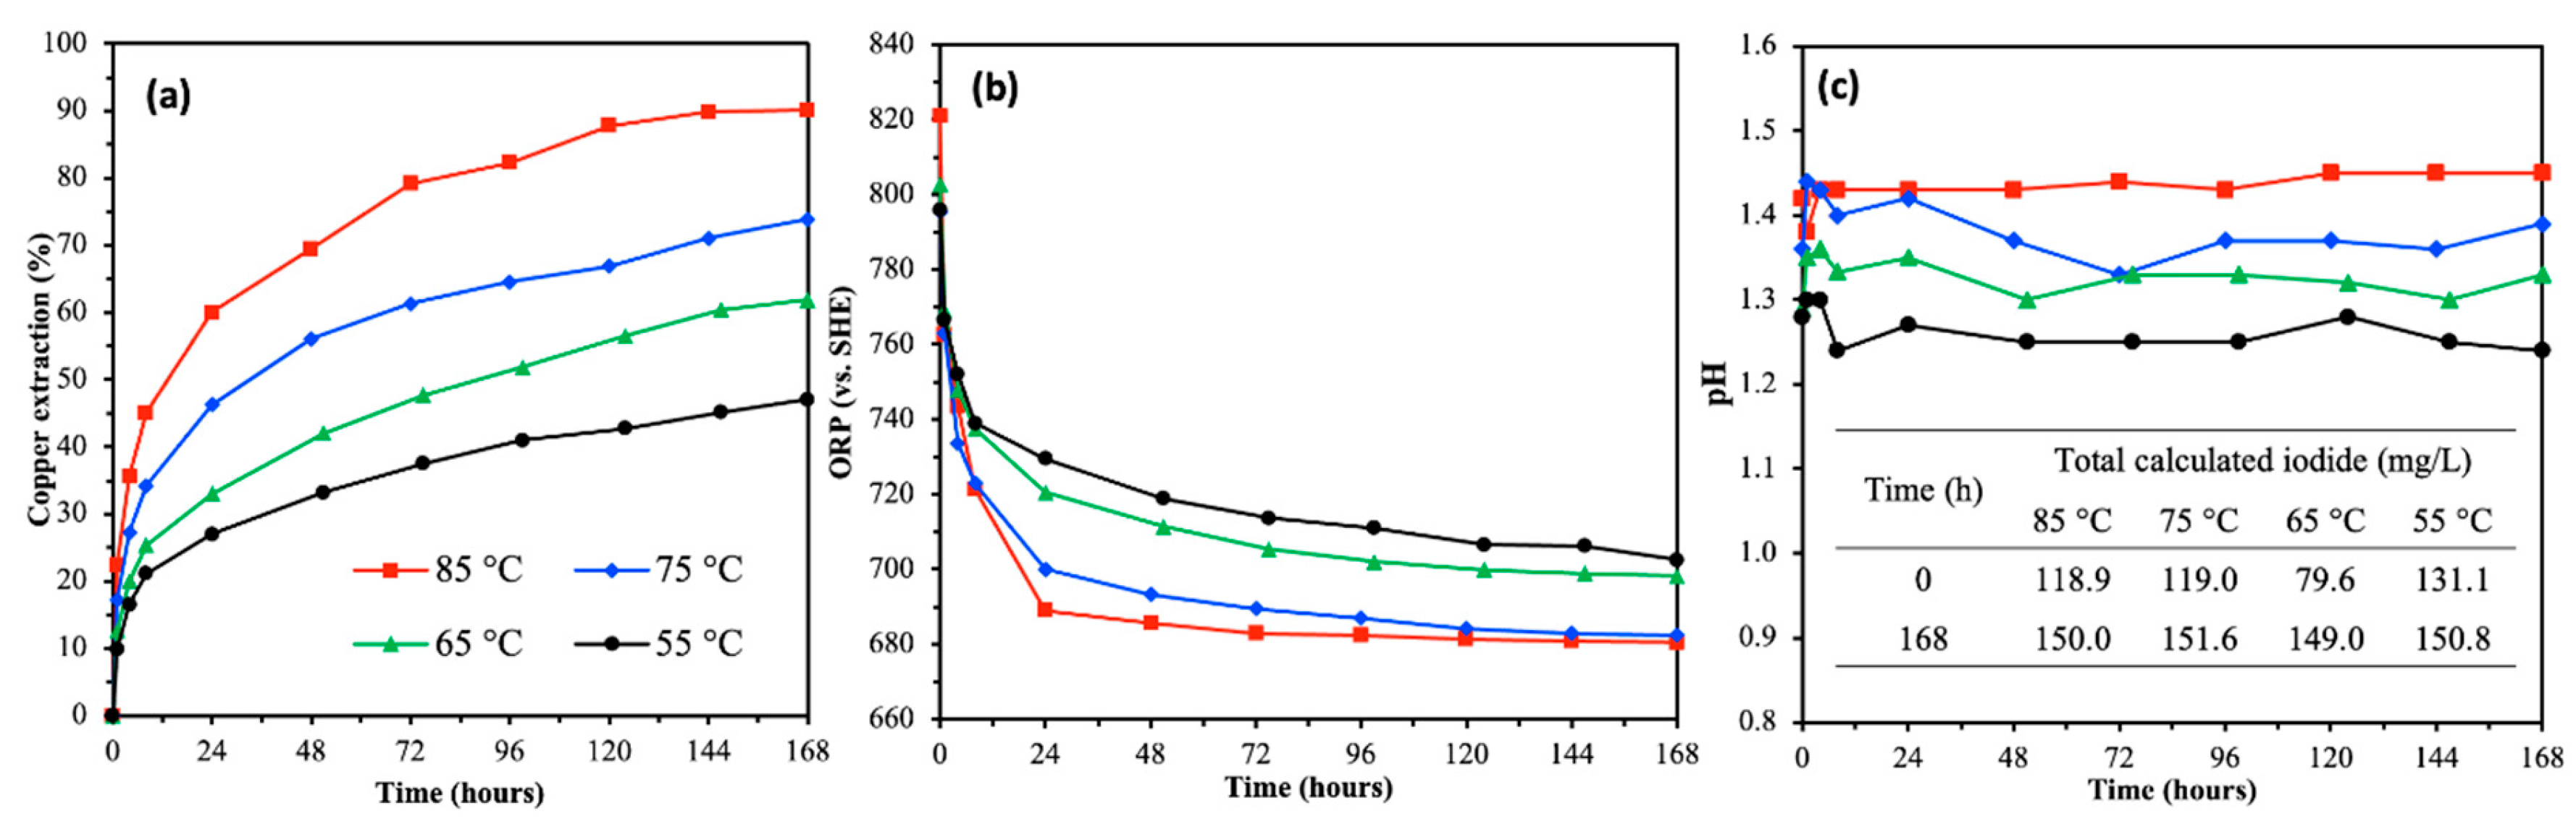
Figure 11.
Arrhenius plot for calculating the activation energy based on the apparent rate constant at different temperatures.
Figure 11.
Arrhenius plot for calculating the activation energy based on the apparent rate constant at different temperatures.
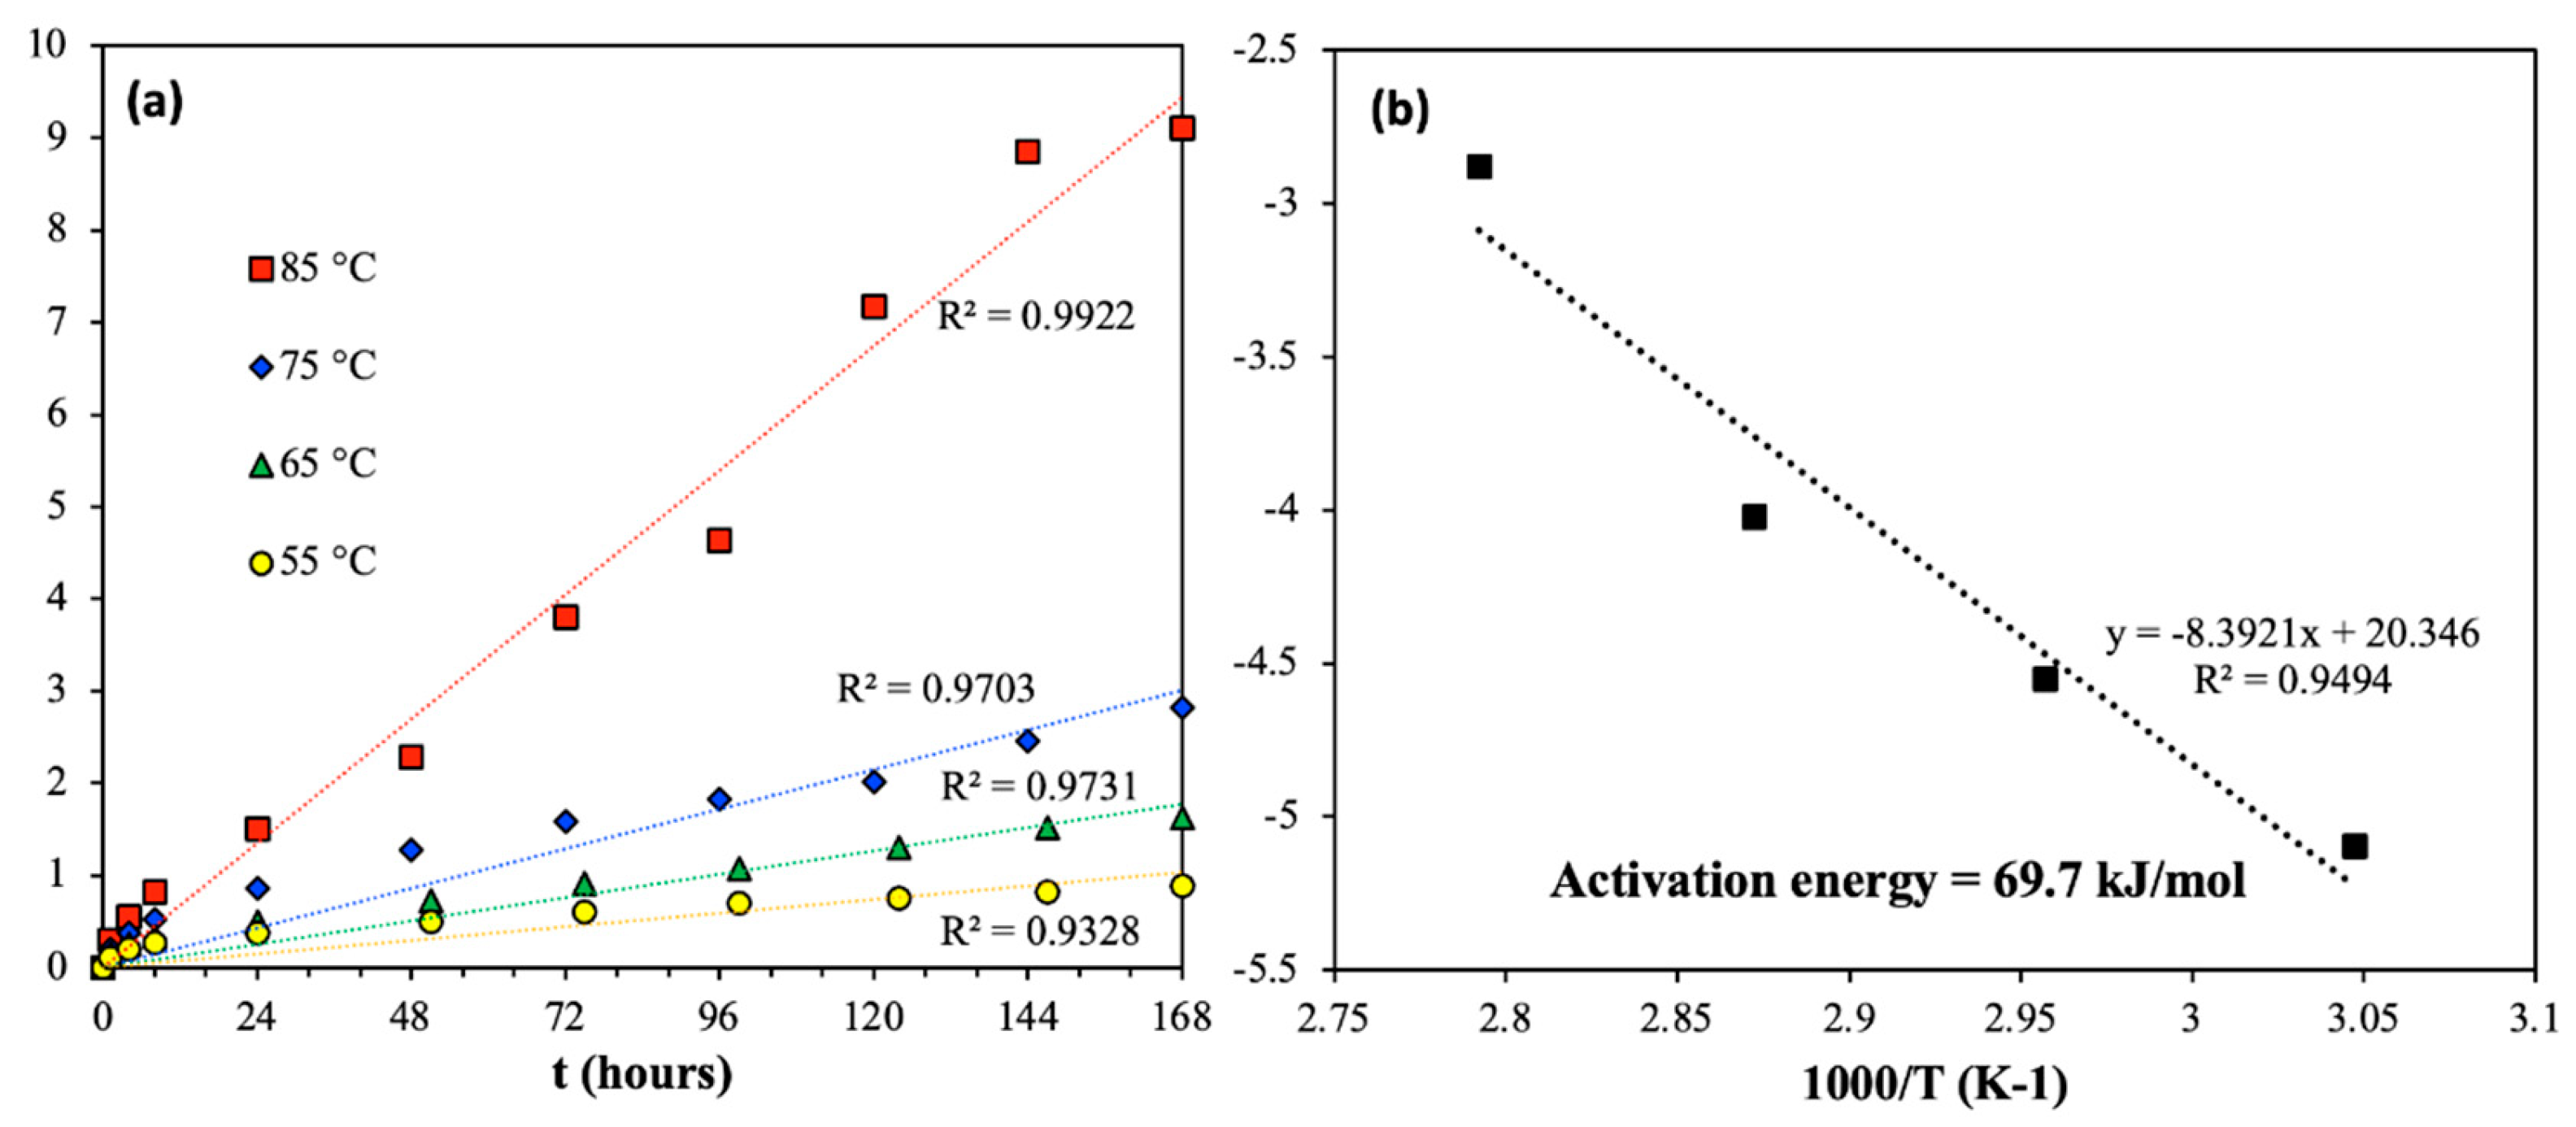
Figure 12.
XRD patterns of residues from leaching of Sample A under different conditions. Identified phases: c = chalcopyrite, p = pyrite, j = jarosite, q = quartz, s = elemental sulfur, i = illite, k = kaolinite.
Figure 12.
XRD patterns of residues from leaching of Sample A under different conditions. Identified phases: c = chalcopyrite, p = pyrite, j = jarosite, q = quartz, s = elemental sulfur, i = illite, k = kaolinite.
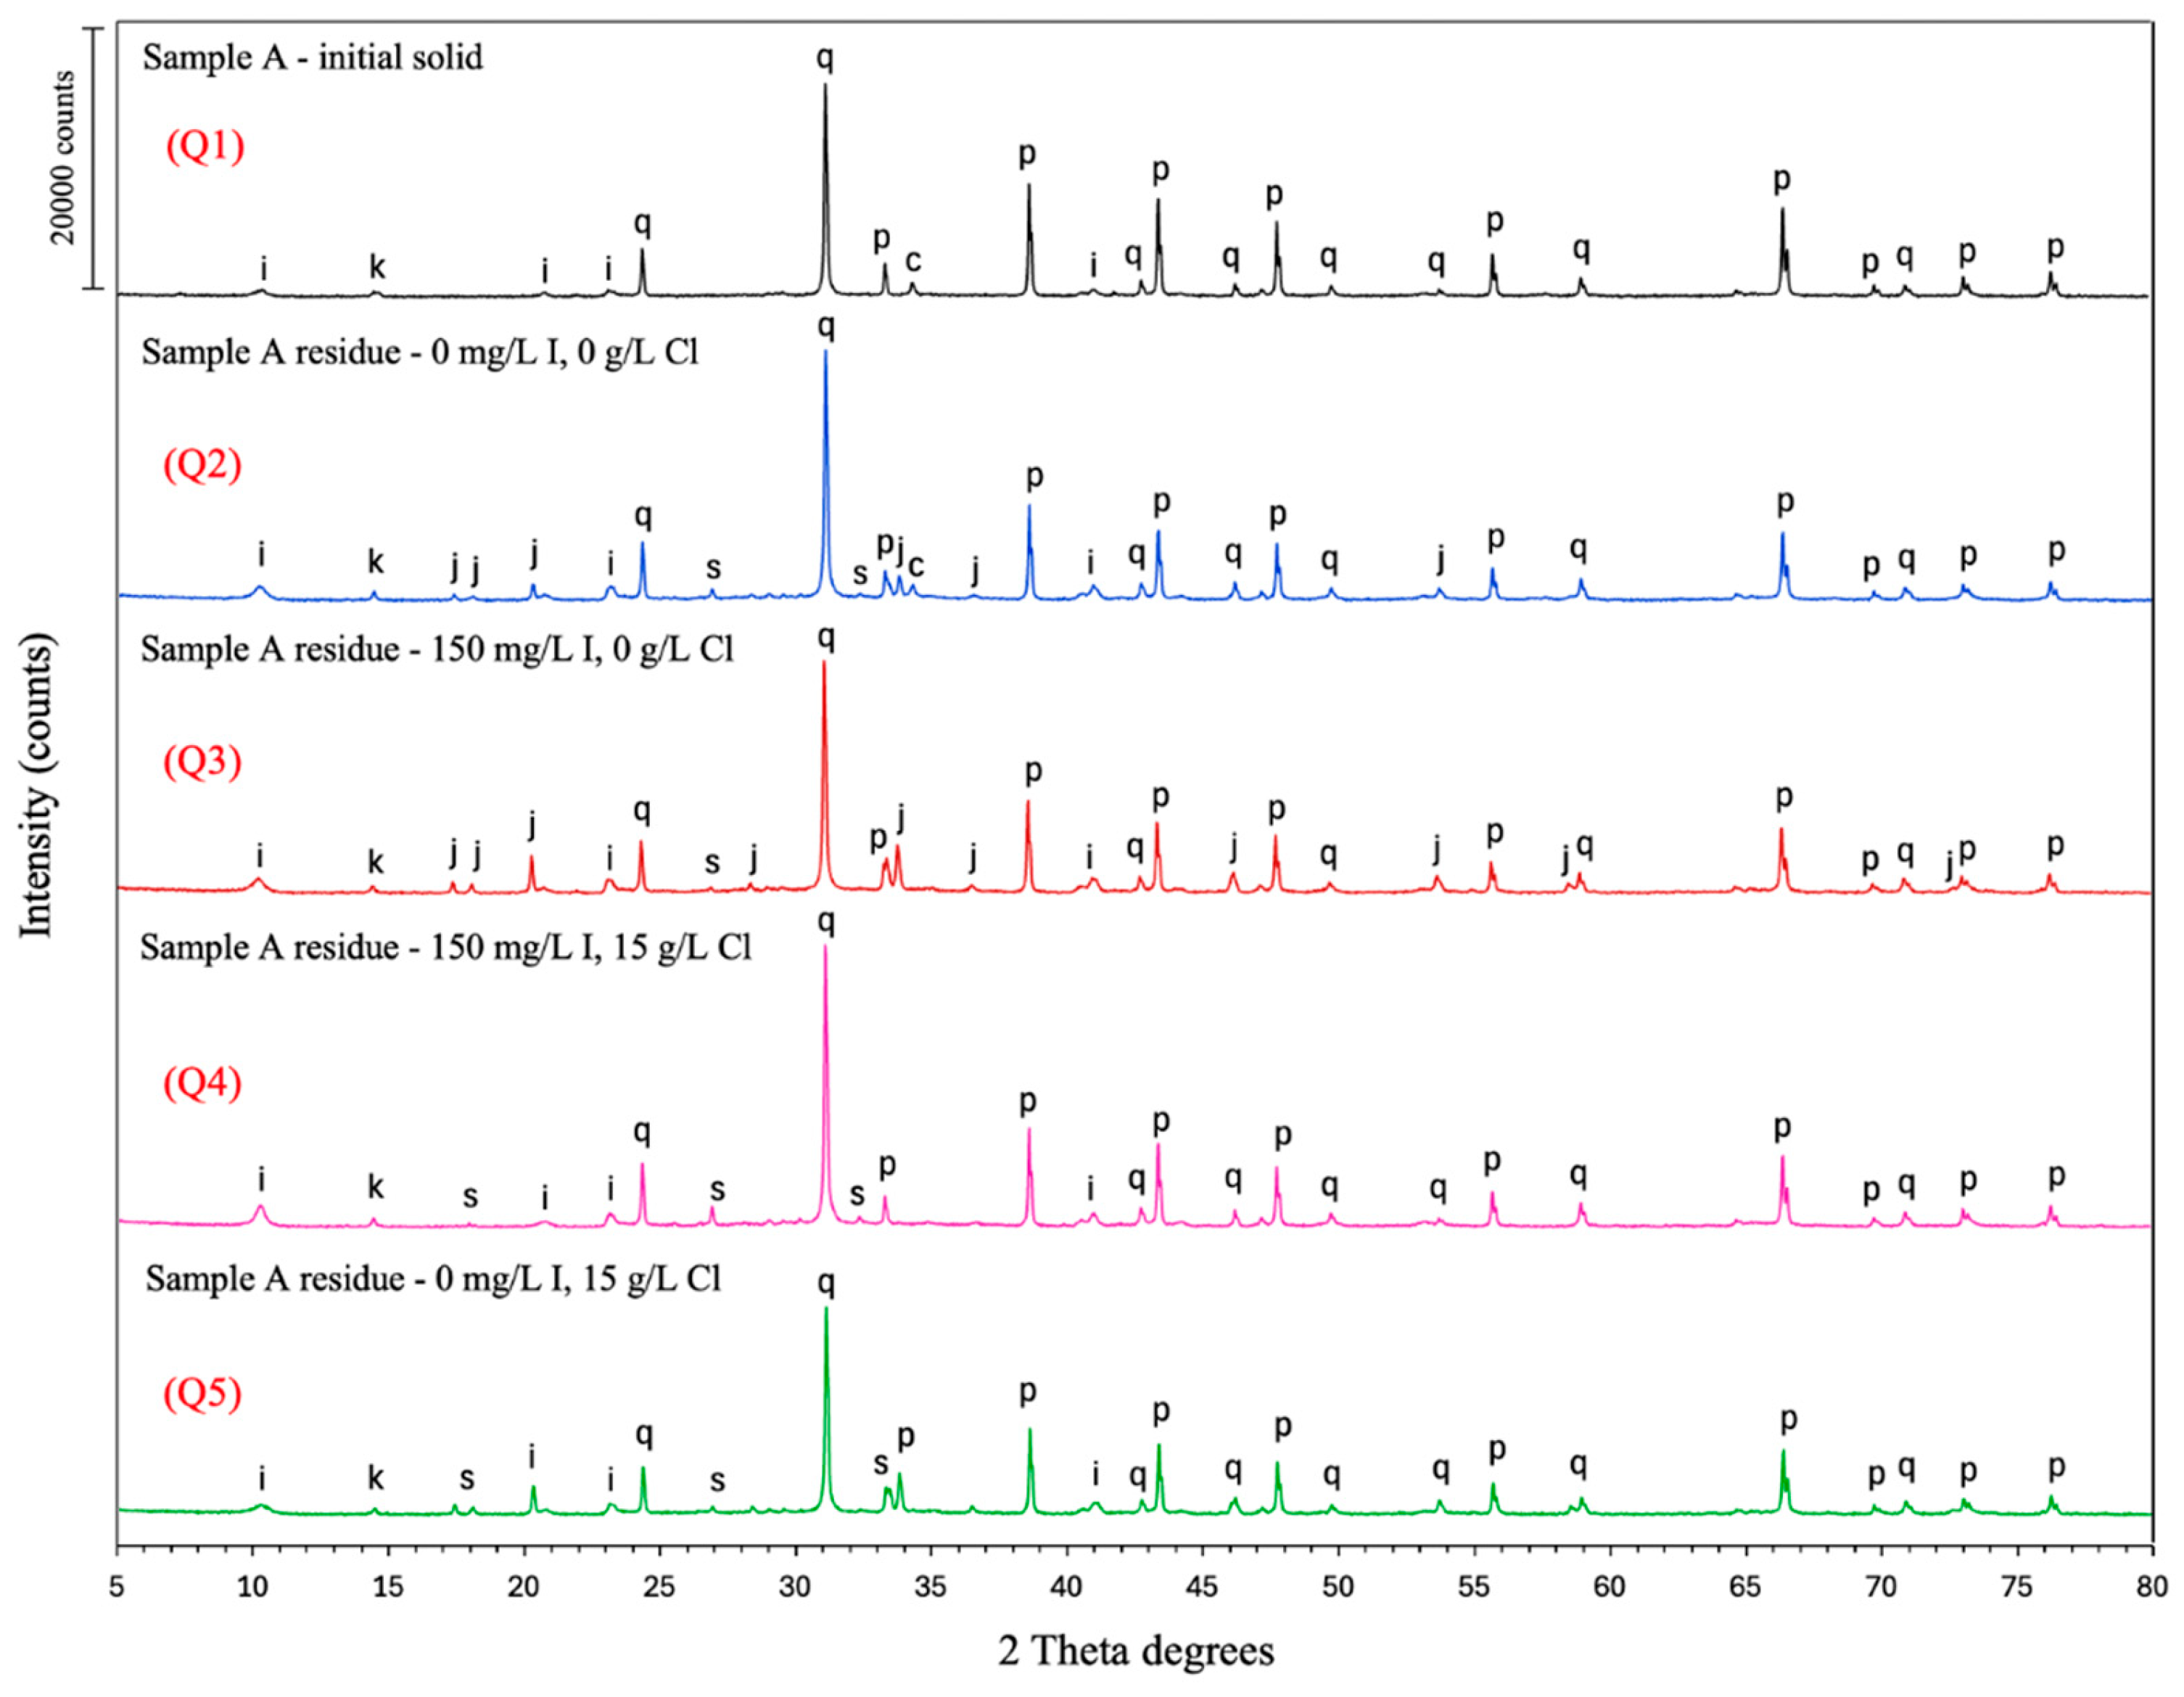
Figure 13.
XRD patterns of residues from leaching of Sample A at different initial Fe(III)/Fe(II) molar ratio. Identified phases: c = chalcopyrite, p = pyrite, j = jarosite, q = quartz, s = elemental sulfur, i = illite, k = kaolinite.
Figure 13.
XRD patterns of residues from leaching of Sample A at different initial Fe(III)/Fe(II) molar ratio. Identified phases: c = chalcopyrite, p = pyrite, j = jarosite, q = quartz, s = elemental sulfur, i = illite, k = kaolinite.
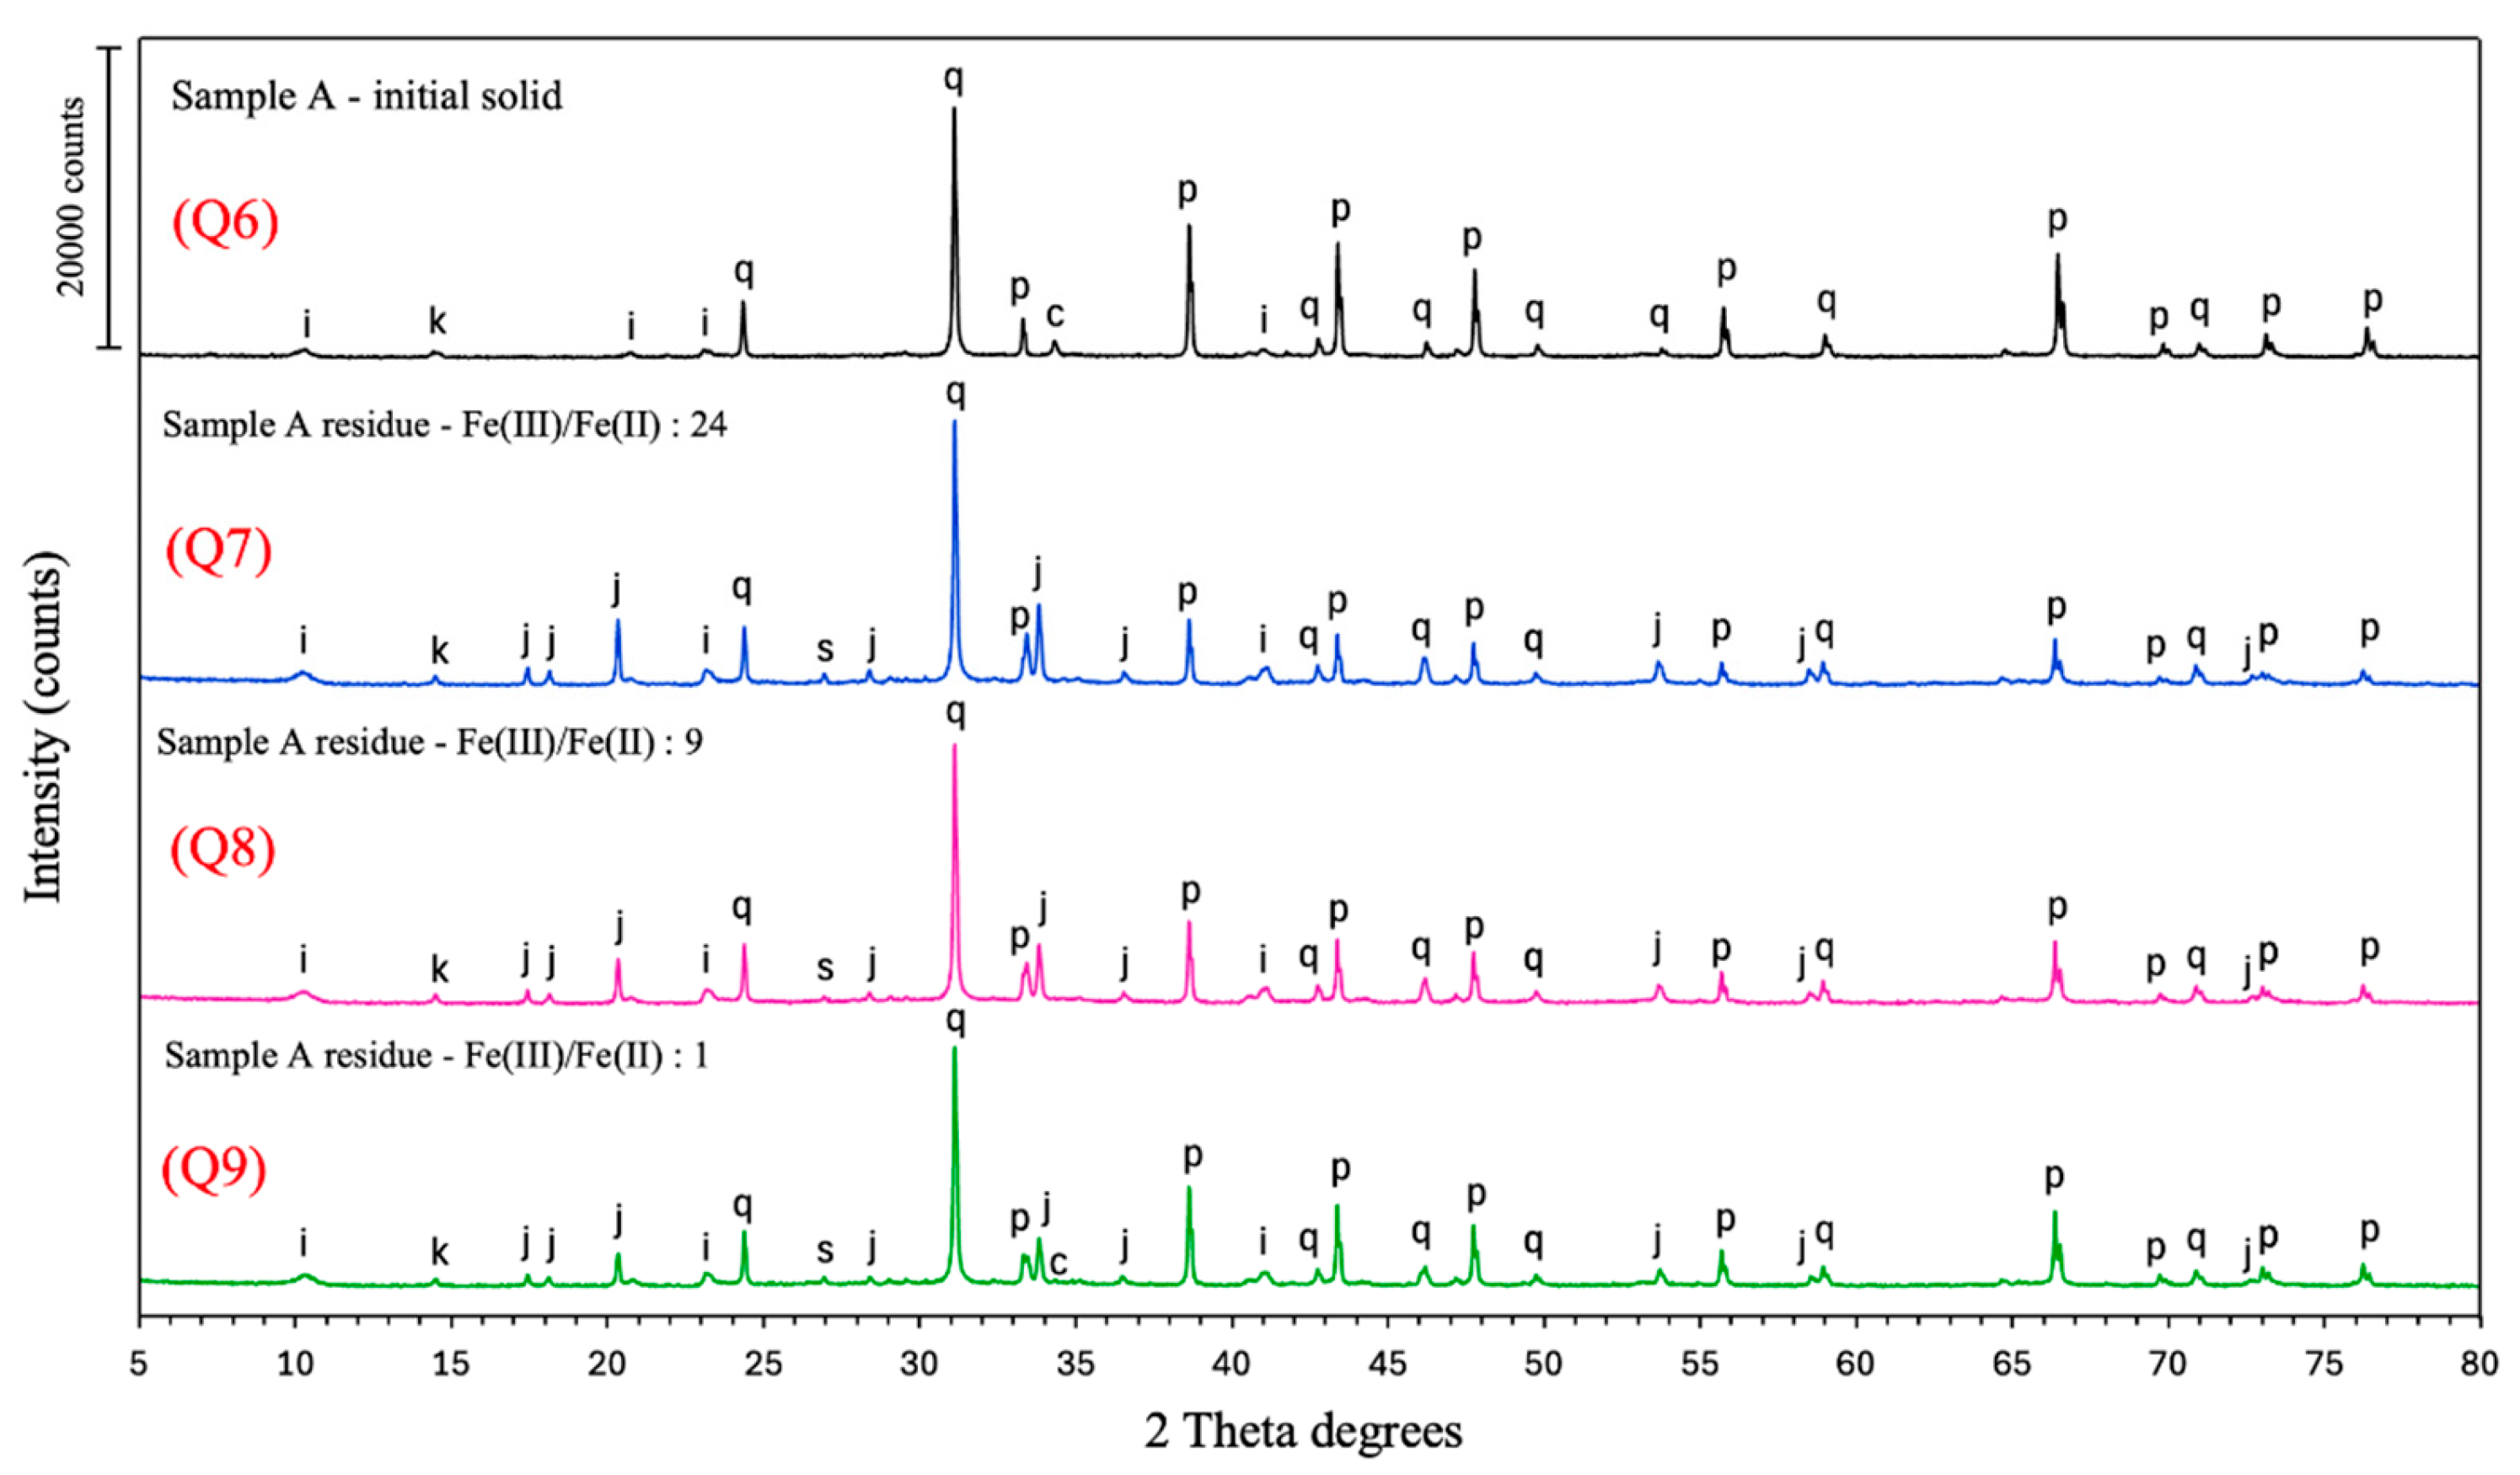
Figure 14.
Schematic mechanism showing diffusion of diiodine and triiodide from the bulk sulfate solution to the chalcopyrite surface penetrating the solid product, e.g., elemental sulfur, during iodine-assisted leaching. The numbered labels indicate the specific process occurring within each region.
Figure 14.
Schematic mechanism showing diffusion of diiodine and triiodide from the bulk sulfate solution to the chalcopyrite surface penetrating the solid product, e.g., elemental sulfur, during iodine-assisted leaching. The numbered labels indicate the specific process occurring within each region.
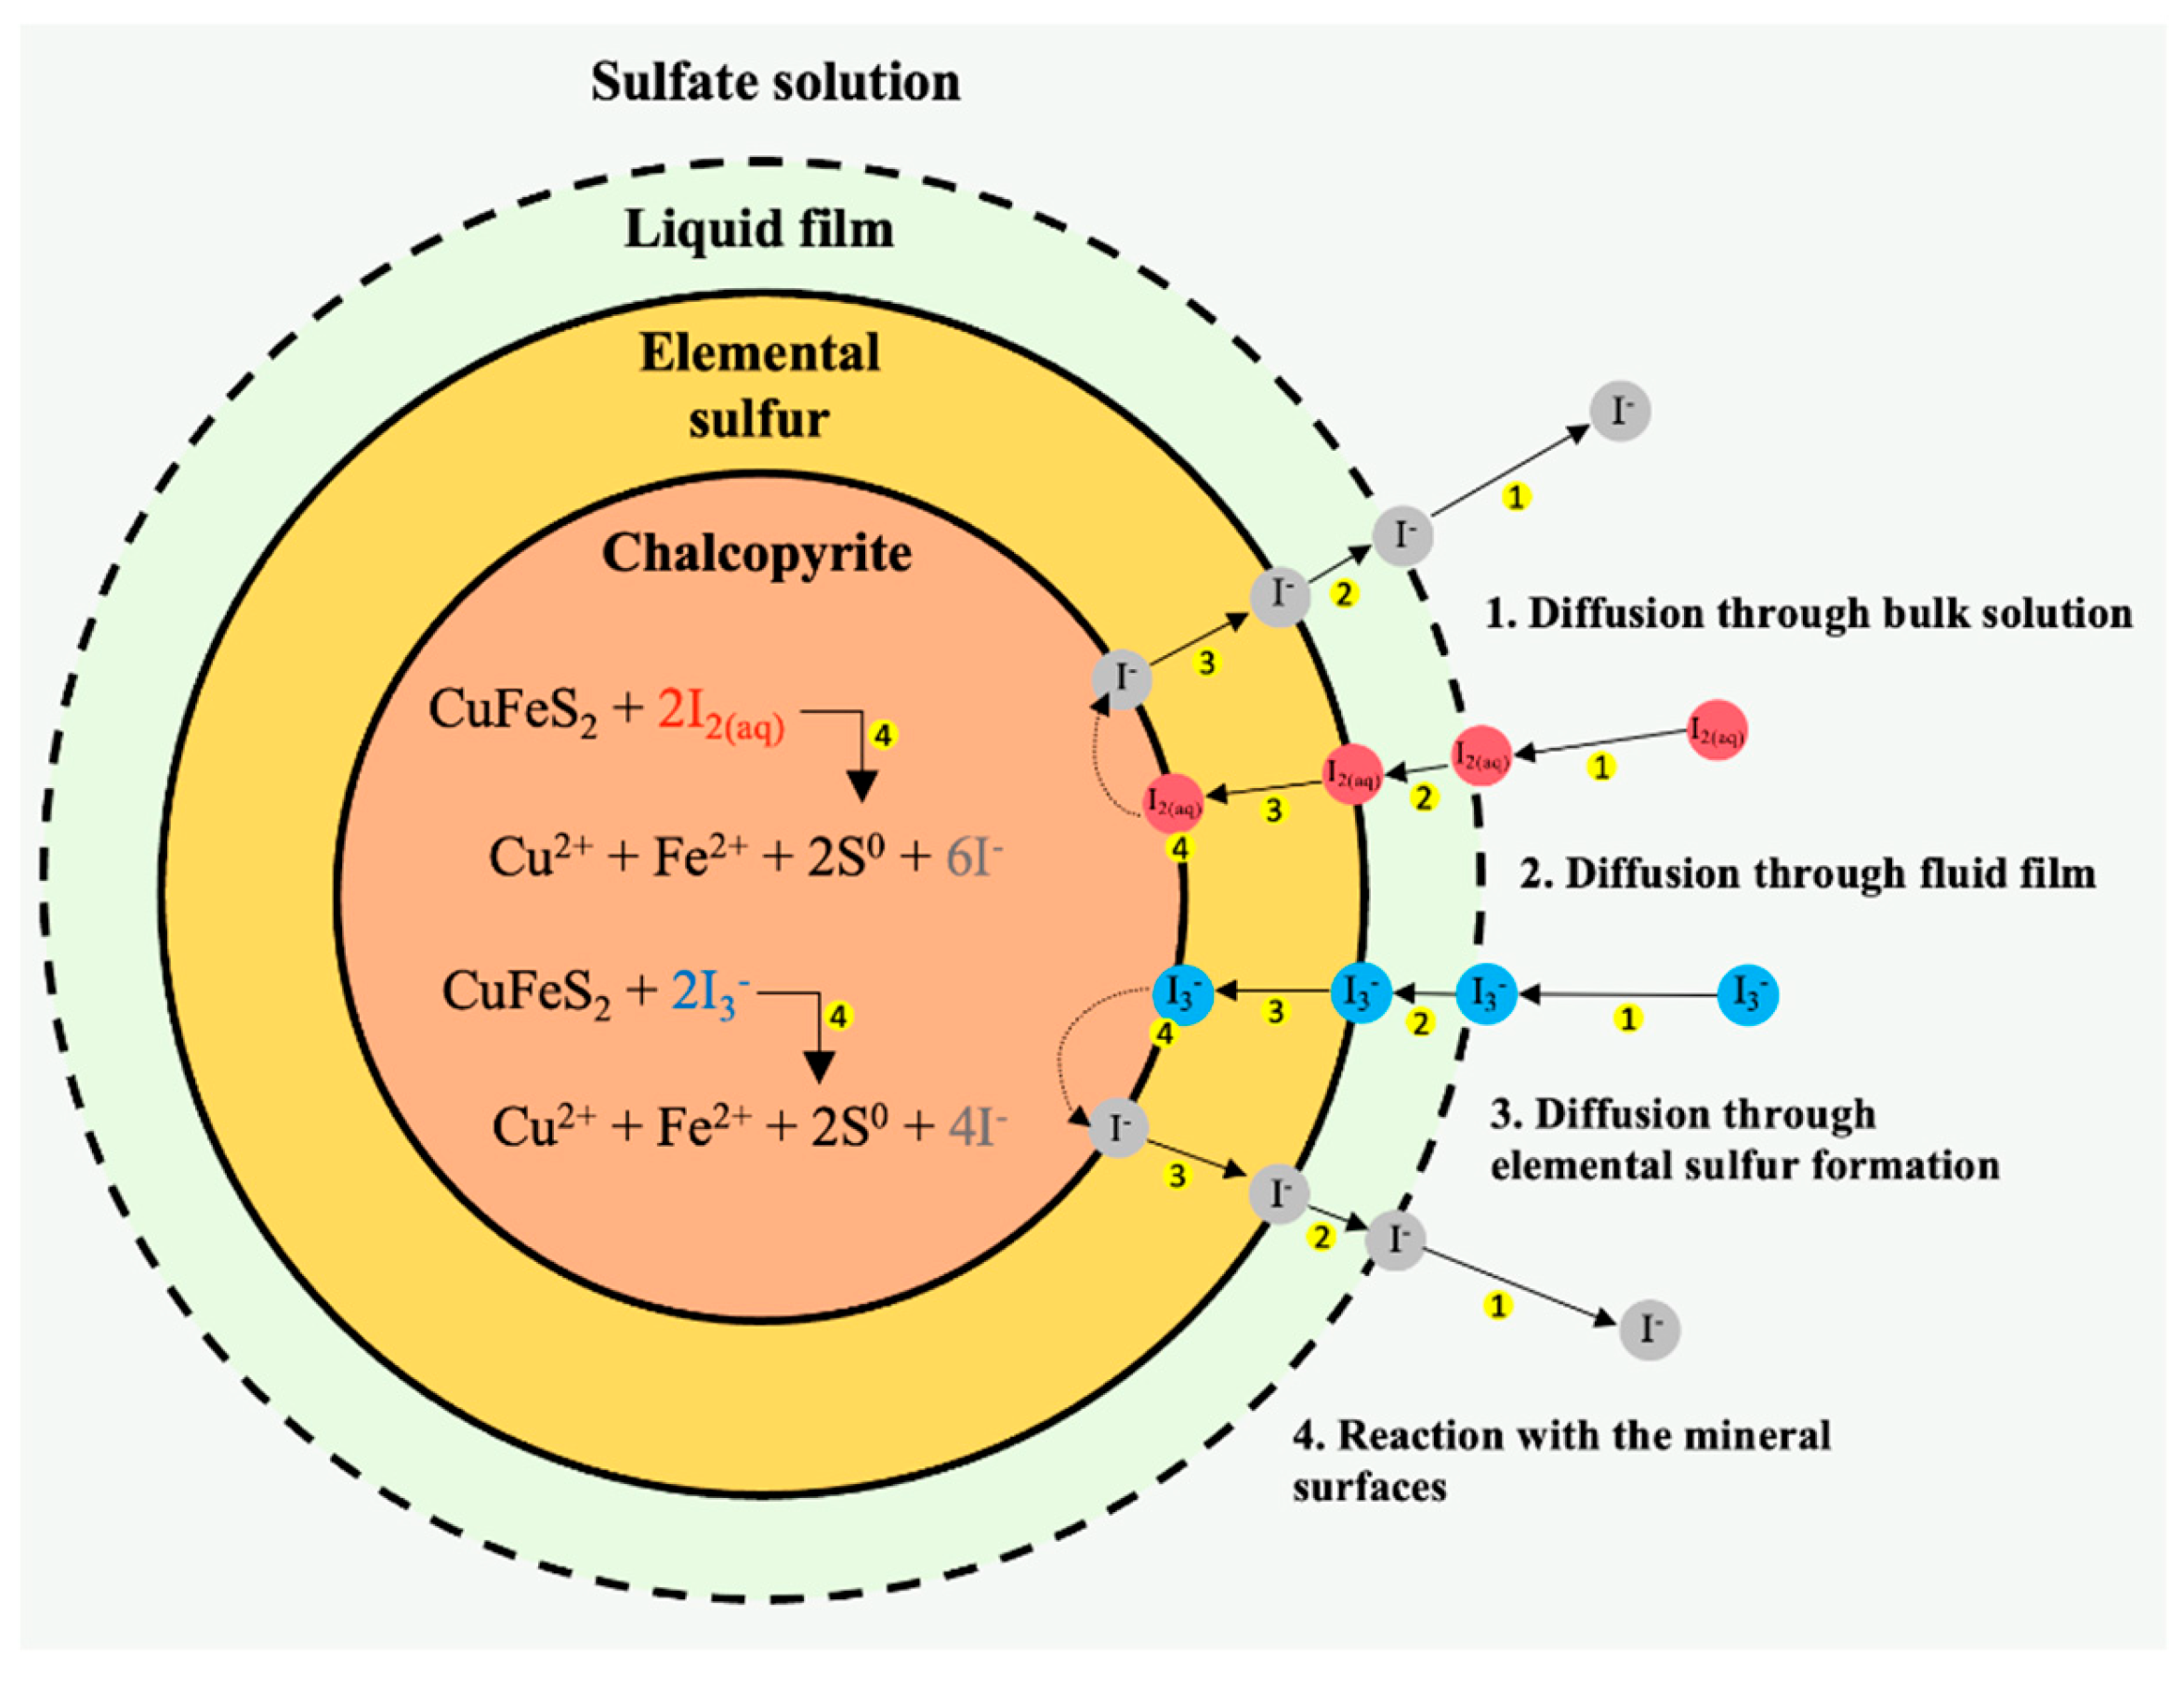

Table 1.
Head grade of the two chalcopyrite samples used in the present study.
| Chalcopyrite sample | Cu (%) | Fe (%) | S (%) |
|---|---|---|---|
| Sample A | 0.87 | 17.75 | 19.60 |
| Sample B | 23.79 | 28.61 | 39.95 |
Table 2.
Quantitative X-ray diffraction analysis of the two chalcopyrite samples.
| Mineral | Ideal Formula | Sample A (%) | Sample B (%) |
|---|---|---|---|
| Chalcopyrite | CuFeS2 | 2.1 | 59.7 |
| Pyrite | FeS2 | 40.2 | 28.6 |
| Quartz | SiO2 | 33.8 | 2.1 |
| Illite-Muscovite 2M1 | K0.65Al2.0Al0.65Si3.35O10(OH)2/ KAl2AlSi3O10(OH)2 | 18.1 | 0.7 |
| Chalcanthite | CuSO4.5H2O | 0.0 | 2.6 |
| Others | 5.8 | 6.3 | |
Table 3.
Experimental design for the leaching tests in this study using Sample A and B.
| Test No. | Leaching tests | Sample | Initial [Fe(III)]/ [Fe(II)] molar ratio |
[I⁻]T | [Cl⁻] | Temperature |
|---|---|---|---|---|---|---|
| (mg/L) | (g/L) | (°C) | ||||
| 1 | Reproducibility test | Sample A | 49 | 150 | 0 | 85 |
| 2 | Reproducibility test | Sample A | 49 | 150 | 0 | 85 |
| 3 | Control test | Sample A | 49 | 150 | 0 | 85 |
| 4 | Control test | Sample A | 49 | 0 | 0 | 85 |
| 5 | Control test | Sample B | 49 | 150 | 0 | 85 |
| 6 | Control test | Sample B | 49 | 0 | 0 | 85 |
| 7 | Multi-stage test | Sample A | 49 | 150 | 0 | 85 |
| 8 | Multi-stage test | Sample A | 49 | 150 | 0 | 85 |
| 9 | Chloride addition | Sample A | 49 | 150 | 0 | 85 |
| 10 | Chloride addition | Sample A | 49 | 150 | 5 | 85 |
| 11 | Chloride addition | Sample A | 49 | 150 | 15 | 85 |
| 12 | Chloride addition | Sample A | 49 | 0 | 15 | 85 |
| 13 | Chloride addition | Sample B | 49 | 150 | 0 | 85 |
| 14 | Chloride addition | Sample B | 49 | 150 | 15 | 85 |
| 15 | Fe(III)/Fe(II) | Sample A | 49 | 150 | 0 | 85 |
| 16 | Fe(III)/Fe(II) | Sample A | 24 | 150 | 0 | 85 |
| 17 | Fe(III)/Fe(II) | Sample A | 9 | 150 | 0 | 85 |
| 18 | Fe(III)/Fe(II) | Sample A | 1 | 150 | 0 | 85 |
| 19 | Fe(III)/Fe(II) | Sample B | 49 | 150 | 0 | 85 |
| 20 | Fe(III)/Fe(II) | Sample B | 24 | 150 | 0 | 85 |
| 21 | Fe(III)/Fe(II) | Sample B | 9 | 150 | 0 | 85 |
| 22 | Fe(III)/Fe(II) | Sample B | 1 | 150 | 0 | 85 |
| 23 | Total iodide | Sample A | 49 | 0 | 0 | 85 |
| 24 | Total iodide | Sample A | 49 | 75 | 0 | 85 |
| 25 | Total iodide | Sample A | 49 | 150 | 0 | 85 |
| 26 | Total iodide | Sample A | 49 | 225 | 0 | 85 |
| 27 | Total iodide | Sample B | 49 | 0 | 0 | 85 |
| 28 | Total iodide | Sample B | 49 | 150 | 0 | 85 |
| 29 | Total iodide | Sample B | 49 | 300 | 0 | 85 |
| 30 | Temperature | Sample A | 49 | 150 | 0 | 85 |
| 31 | Temperature | Sample A | 49 | 150 | 0 | 75 |
| 32 | Temperature | Sample A | 49 | 150 | 0 | 65 |
| 33 | Temperature | Sample A | 49 | 150 | 0 | 55 |
Table 4.
Chemical analysis of the leach residues obtained from all leaching tests.
| Test ID | Sample type | Process parameters | Initial solid composition | Residue composition | (Initial solid - residue) | ||||||
|---|---|---|---|---|---|---|---|---|---|---|---|
| Total mass (g) | (%) | Total mass (g) | (%) | ||||||||
| Cu | Fe | S | Cu | Fe | S | (%) | |||||
| T1 | Sample A | Baseline | 9.00 | 0.87% | 17.75% | 19.60% | 7.34 | 0.11% | 15.22% | 14.63% | 18.46% |
| T2 | Sample A | Control test | 9.00 | 0.87% | 17.75% | 19.60% | 7.28 | 0.64% | 11.60% | 15.98% | 19.17% |
| T3 | Sample B | Baseline | 1.80 | 23.79% | 28.61% | 39.95% | 1.19 | 0.11% | 23.06% | 54.34% | 34.08% |
| T4 | Sample B | Control test | 1.80 | 23.79% | 28.61% | 39.95% | 1.11 | 14.70% | 25.56% | 48.16% | 38.54% |
| T5a | Sample A | Multi (first stage) | 9.50 | 0.87% | 17.75% | 19.60% | 8.91 | 0.34% | 17.86% | 18.64% | 6.26% |
| T5b | Sample A | Multi (second stage) | 8.00 | 0.34% | 17.86% | 18.64% | 7.90 | 0.14% | 16.23% | 15.17% | 1.32% |
| T6 | Sample A | 5 g/L Cl⁻ | 9.00 | 0.87% | 17.75% | 19.60% | 7.18 | 0.04% | 11.78% | 15.31% | 20.23% |
| T7 | Sample A | 15 g/L Cl⁻ | 9.00 | 0.87% | 17.75% | 19.60% | 6.44 | 0.03% | 11.77% | 16.63% | 28.44% |
| T8 | Sample A | 0 mg/L I + 15 g/L Cl⁻ | 9.00 | 0.87% | 17.75% | 19.60% | 6.37 | 0.21% | 10.59% | 15.79% | 29.28% |
| T9 | Sample B | 15 g/L Cl⁻ | 1.80 | 23.79% | 28.61% | 39.95% | 0.69 | 0.17% | 15.14% | 75.62% | 61.48% |
| T10 | Sample B | 300 mg/L I | 1.80 | 23.79% | 28.61% | 39.95% | 3.76 | 0.95% | 30.95% | 28.24% | -109.00% |
| T11 | Sample A | Fe(III)/Fe(II) = 24 | 9.00 | 0.87% | 17.75% | 19.60% | 8.44 | 0.07% | 14.78% | 12.58% | 6.28% |
| T12 | Sample A | Fe(III)/Fe(II) = 9 | 9.00 | 0.87% | 17.75% | 19.60% | 8.66 | 0.09% | 14.54% | 12.84% | 3.74% |
| T13 | Sample A | Fe(III)/Fe(II) = 1 | 9.00 | 0.87% | 17.75% | 19.60% | 9.91 | 0.12% | 15.63% | 15.00% | -10.13% |
| T14 | Sample B | Fe(III)/Fe(II) = 24 | 1.80 | 23.79% | 28.61% | 39.95% | 2.21 | 0.10% | 33.63% | 29.50% | -22.66% |
| T15 | Sample B | Fe(III)/Fe(II) = 9 | 1.80 | 23.79% | 28.61% | 39.95% | 2.12 | 0.11% | 34.01% | 29.26% | -17.68% |
| T16 | Sample B | Fe(III)/Fe(II) = 1 | 1.80 | 23.79% | 28.61% | 39.95% | 1.90 | 0.25% | 33.45% | 37.48% | -5.78% |
| T17 | Sample A | 75 °C | 9.00 | 0.87% | 17.75% | 19.60% | 7.99 | 0.26% | 15.80% | 16.84% | 11.24% |
| T18 | Sample A | 65 °C | 9.00 | 0.87% | 17.75% | 19.60% | 8.63 | 0.35% | 17.34% | 17.37% | 4.06% |
| T19 | Sample A | 55 °C | 9.00 | 0.87% | 17.75% | 19.60% | 8.68 | 0.45% | 18.20% | 18.45% | 3.53% |
| T20 | Sample A | 225 mg/L total I⁻ | 9.00 | 0.87% | 17.75% | 19.60% | 8.32 | 0.06% | 16.21% | 14.37% | 7.58% |
| T21 | Sample A | 75 mg/L total I⁻ | 9.00 | 0.87% | 17.75% | 19.60% | 7.65 | 0.11% | 14.46% | 14.32% | 14.98% |
| T22 | Sample A | Duplicate test to T1 | 9.00 | 0.87% | 17.75% | 19.60% | 7.33 | 0.10% | 14.47% | 15.26% | 18.57% |
Note: Unless otherwise indicated, all tests were conducted at the baseline conditions of a Fe(III)/Fe(II) molar ratio of 49, 150 mg/L total iodide, 0 g/L Cl⁻, solids content of 10 g/L (Sample A) and 2 g/L (Sample B), and 85 °C.
Table 5.
Extent of pyrite co-dissolution and jarosite precipitation from leaching tests on Sample A based on the results of QXRD analysis.
Table 5.
Extent of pyrite co-dissolution and jarosite precipitation from leaching tests on Sample A based on the results of QXRD analysis.
| Test ID | Test condition | Pyrite | Jarosite | ||||||
|---|---|---|---|---|---|---|---|---|---|
| Initial mass (g) | Residue (g) | Pyrite co-dissolution (%) | Initial mass (g) | Residue (g) | |||||
| T1 | Baseline | 3.619 | 1.820 | 49.69% | 0.000 | 1.108 | |||
| T2 | 0 mg/L total I | 3.619 | 1.870 | 48.33% | 0.000 | 0.560 | |||
| T7 | 15 g/L Cl⁻ | 3.619 | 1.752 | 51.58% | 0.000 | 0.045 | |||
| T8 | 0 mg/L total I + 15 g/L Cl⁻ | 3.619 | 1.579 | 56.37% | 0.000 | 0.000 | |||
Note: Unless otherwise indicated, all tests were conducted at the baseline conditions of a Fe(III)/Fe(II) molar ratio of 49, 150 mg/L total iodide, 0 g/L Cl⁻, solids content of 10 g/L, and 85 °C.
Table 6.
Iron mass balance estimates of pyrite dissolution during leaching of Sample B. All mass values are reported in milligrams, while pyrite co-dissolution is in percent.
Table 6.
Iron mass balance estimates of pyrite dissolution during leaching of Sample B. All mass values are reported in milligrams, while pyrite co-dissolution is in percent.
| Test ID | Test condition | Initial py | Cu in residue | Fe in residue | Est. cpy in residue | Fe from est. cpy | Est. Fe from py in residue | Est. py remaining | Est. py co-dissolution |
|---|---|---|---|---|---|---|---|---|---|
| T3 | Sample B, baseline | 515.1 | 1.4 | 289.0 | 3.9 | 1.2 | 287.8 | 618.4 | -20.0% |
| T9 | Sample B, 15 g/L Cl⁻ | 515.6 | 1.3 | 111.0 | 3.7 | 1.1 | 109.8 | 236.0 | 54.2% |
| T4 | Sample B, 0 mg/L total I⁻ | 515.7 | 172.0 | 299.0 | 496.6 | 151.1 | 147.9 | 317.7 | 38.4% |
| T14 | Sample B, Fe(III)/Fe(II)=24 | 514.9 | 2.1 | 742.7 | 6.1 | 1.8 | 740.9 | 1591.7 | -209.1% |
| T15 | Sample B, Fe(III)/Fe(II)=9 | 515.0 | 2.3 | 720.7 | 6.7 | 2.1 | 718.6 | 1543.9 | -199.8% |
| T16 | Sample B, Fe(III)/Fe(II)=1 | 514.9 | 4.7 | 637.1 | 13.7 | 4.2 | 632.9 | 1359.8 | -164.1% |
| T10 | Sample B, 300 mg/L total I⁻ | 514.9 | 35.6 | 1164.8 | 102.7 | 31.3 | 1133.5 | 2435.3 | -373.0% |
Note: py = pyrite, cpy = chalcopyrite, Est. = estimated. Unless otherwise indicated, all tests were conducted at the baseline conditions of a Fe(III)/Fe(II) molar ratio of 49, 150 mg/L total iodide, 0 g/L Cl⁻, solids content of 2 g/L, and 85 °C.
Disclaimer/Publisher’s Note: The statements, opinions and data contained in all publications are solely those of the individual author(s) and contributor(s) and not of MDPI and/or the editor(s). MDPI and/or the editor(s) disclaim responsibility for any injury to people or property resulting from any ideas, methods, instructions or products referred to in the content. |
© 2026 by the authors. Licensee MDPI, Basel, Switzerland. This article is an open access article distributed under the terms and conditions of the Creative Commons Attribution (CC BY) license (http://creativecommons.org/licenses/by/4.0/).
Copyright: This open access article is published under a Creative Commons CC BY 4.0 license, which permit the free download, distribution, and reuse, provided that the author and preprint are cited in any reuse.