

Submitted:
16 September 2026
Posted:
17 September 2026
You are already at the latest version
Abstract
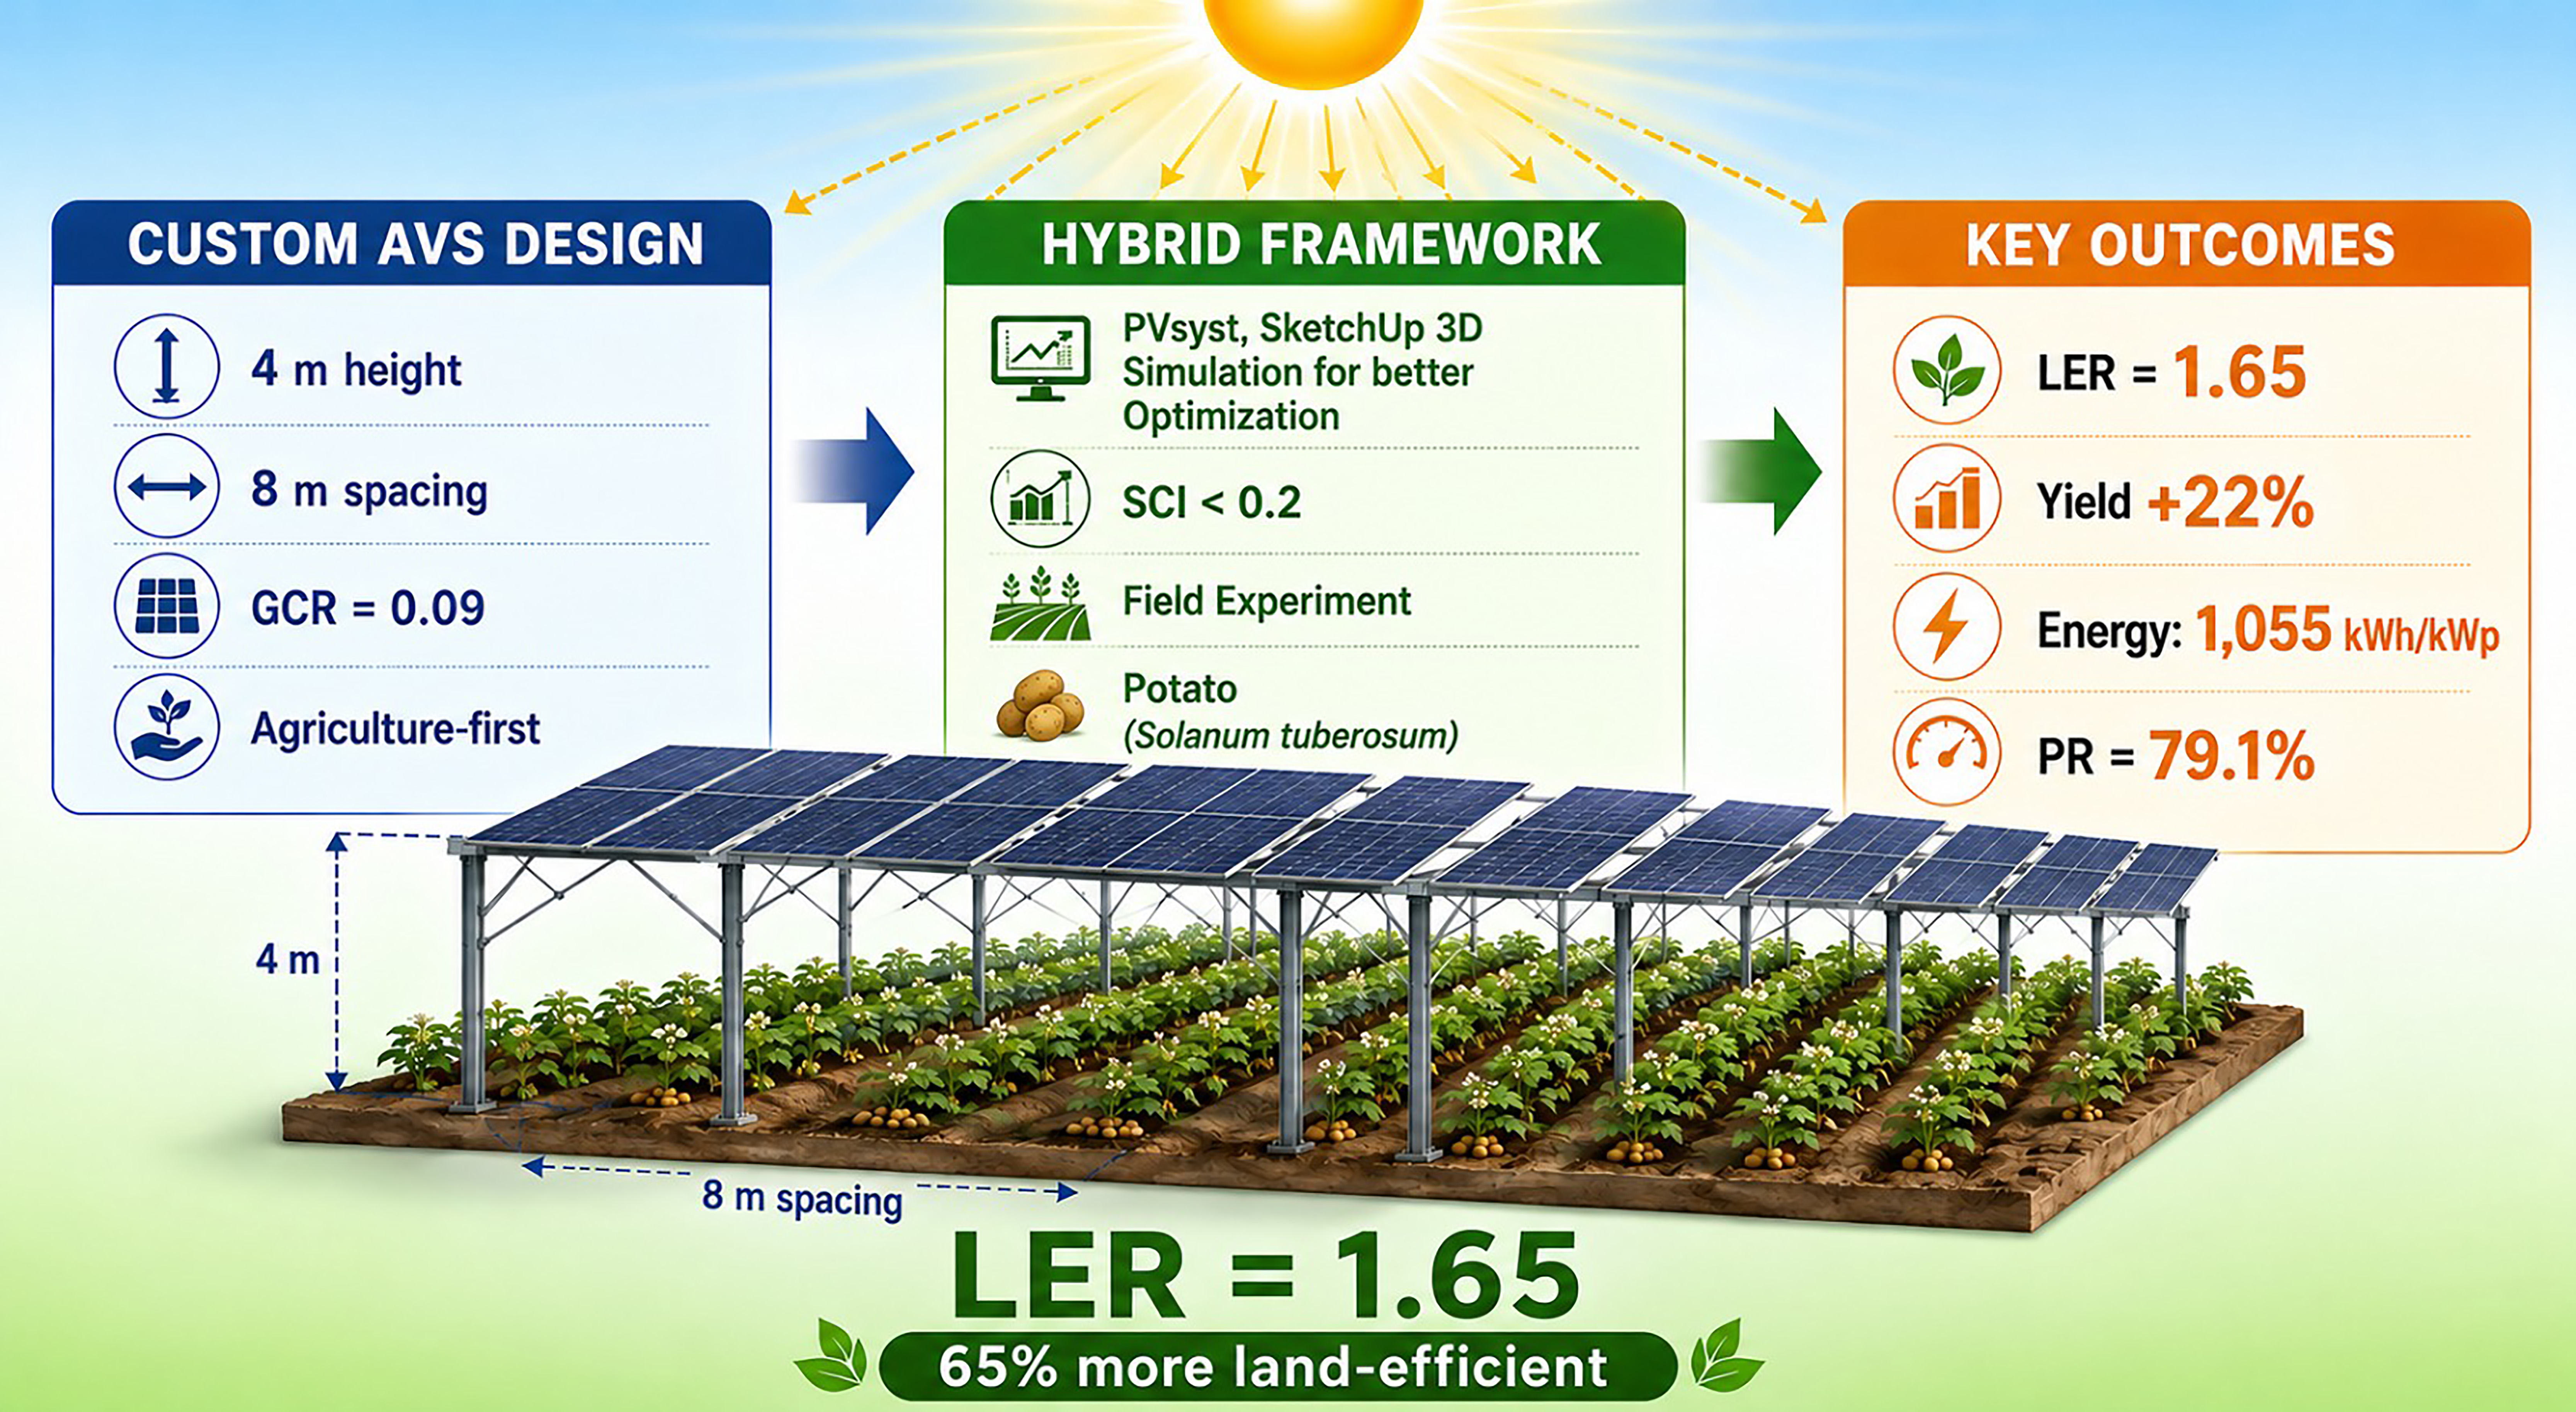
To deal with land utilization rivalry between food and energy frameworks, Agrivoltaic Systems (AVS) present an emerging innovation that balances both the outputs. However, most existing designs usually concentrate on photovoltaic (PV) power density over crop productivity, rendering them inappropriate for shade-sensitive staple crops, like potato (Solanum tuberosum L.) [1]. To avoid this, custom-designed, agriculture-forward AVS established on a 4m high mounting structure at Amity University, Noida, India (28.54N, subtropical climate) has been examined in this study to reduce shade effects utilizing an 8m inter-row spacing and reduced Ground Coverage Ratio (0.09). For this reason, this work established hybrid experimental-simulation framework integrating field experiments with SketchUp 3D and PVsyst-based modelling tool to provide dynamic and spatio-temporal Shadow Coverage Index (SCI) amid the total potato phenology. The results revealed: (i) custom design-controlled SCI below 0.2 at the potato tubers growth duration, with consequent increased yield up to 22% (18.3kg/plot, control: 15.0kg/plot), (ii) an overall annual electricity produced & confirmed by PVsyst was recorded as 1055 KWh /kWp with a performance ratio of 79.1%, and (iii) LER index of 1.65 signified a 65% increase in land-use efficiency in the AVS. It has demonstrated an alternative route to attain synergy between land utilized for PV arrays and crop cultivation, by targeting and attaining perfect balance between these two outcomes rather than maximize PV power density, offers replicability in a subtropical land use pattern, contributing to SDG 7 and supporting a sustainable, secure, and efficient transition to a Net Zero future through integrated food-energy systems.
Keywords:
agrivoltaic
; shadow coverage index (SCI)
; crop yield
; simulation modelling
; custom-designed AVS
; hybrid framework
; food-energy nexus
1. Introduction
The ever-increasing battle between food production and renewable energy for land allocation is a defining battle of 21st century. By 2050 the global population is to increase to over 9.7 billion people, thereby requiring a 60% increase in agricultural production along with the switch to low-carbon energy to alleviate climatic change [2,3]. This battle between the production of energy and food may be addressed through the use of Agrivoltaic systems (AVS), the co-location of photovoltaic panels (PV) and crop cultivation on the same agricultural land [4,5]. While enhancing efficiency of Land Use in dual usage of solar resources, AVS generally produce Land Equivalent Ratios (LER) over 1.5 [6,7].
For India, it remains particularly important due to its position as the world’s most populous country and third largest contributor to GHG emission, coupled with its target of 500 GW of renewable energy sources by 2030[8] and its need to secure the food security of 1.4 billion people [9]. However, most of the current studies into the performance of AVS have been carried out in temperate Europe and look at shade tolerant crops such as lettuce, spinach and berries [10,11]. The majority of the world, specifically the subtropical regions such as the Indo Gangetic plains with their extreme solar radiation, summer temperatures (>40 C) and monsoons remain significantly understudied, especially with relation to major staple crops.
The primary issue in agrivoltaics is distributing sunlight between crops and photovoltaic panels to ensure sufficient production of both crops and electricity. So far, the field of agrivoltaics has not thoroughly assessed design strategies, mainly because the best way to divide sunlight varies with location and the type of crops grown [12,13]. While the variety of agrivoltaic pilot projects mirrors the diversity in agriculture, transferring insights across different environments is difficult without a clear understanding of how system components interact and how local climate conditions influence these interactions [14]. Existing models fail to account for essential factors affecting plant function, thus missing important aspects of how agrivoltaic systems work together. The use of dimensionless metrics like LER, GCR, and WUE enhances the application of agrivoltaics in practical settings [6,15,16].
Direct contribution of integrated solar agriculture with UN SDG7 Affordable and Clean energy by providing distributed renewable electricity source [17,18]. Also, in providing transition to sustainable, safe and reliable and efficient energy sector since conflict on usage for the land use reduced by AVS and a source of dual income (food and energy) the Net Zero Transition is accessible for the food producers and users [19,20]. Due to the Net Zero objectives of numerous countries, we anticipate the expansion of land use innovative solutions, such as the one proposed with the AVS system will be a key element in achieve net zero emissions without impacting food security [21,22].
Despite the extensive number of articles about AVSs there is still much to learn, in particular most AVS systems prioritize power density (kW/ha) at the expense of crop physiological requirements. Present conventional designs generally focus on achieving high Ground Coverage Ratios (GCR >0.5) and low panel mounting heights (<3m) to minimize the land cost while maximizing energy production. While this is a reasonable assumption from an energetic perspective, there has been no recognition of the drastic long term shade stress being imposed on the underlying crop by these conventional PV systems leading to reduced yields and nutritional content and altered morpho-physiology [20]. This is exacerbated in systems targeting important shade sensitive staple crops such as potato (Solanum tuberosum L.), a crop requiring a large input of photosynthetically active radiation (PAR) in specific phases i.e., during tuber initiation and bulking stages (van der Werf et al., 2020). Furthermore, conventional methods of measuring performance lack utility for comparing AVS performance; the widespread use of the static, GCR cannot fully take in to account dynamic, space-time variability of shadows induced on crops by seasonal solar position and panel arrangement, and there is need for a time dependent, Shadow Coverage Index (SCI) that can take these aspects in to account. Filling these gaps will be key to leveraging the full benefits of agrivoltaics to enable the sustainable, secure, and efficient use of land that contributes to not just SDG 7, but the broader climate mitigation goals as well.
This paper describes the construction of a bespoke, agricultural-based agrivoltaic system designed to optimize crop production at the expense of power density. Situated on the research farm of the Amity University, Noida (India) the proposed system uses an elevated mounting height to optimize ventilation and reduce heat stress along with a wide inter-row spacing allowing more lateral light, pole-based structures to minimize soil coverage and thus intended to optimize Land Equivalent Ratio (LER) by allowing crop shading indices less than that required. It utilizes the hybrid approach of field experimentation coupled with PVsyst-based energy modeling simulations for better optimization and looks at the system from three different scenario; (i) spatial/temporal and land usage/shading effects, (ii) energy yields and (iii) crop yield/quality/physiology, to determine the perfect balance between crop yield and energy production.
The specific objectives of this study targeted at providing a methodical assessment of the custom-made, agriculture-focused agrivoltaic system using a complete hybrid framework: First, design and characterize a custom agriculture-oriented agrivoltaic system that is specific for subtropical conditions, specifying all of the design parameters of structural characteristics (i.e., height of mounts, space between rows, configuration of pole arrays), geometrical variables (i.e., tilt angle of modules, orientation direction, array configurations), and electrical information (i.e., panel capability, configuration and capacity of system inverter and system configuration). Second, develop a new, dynamic Shadow Coverage Index (SCI) to quantify the shading situation where Solar position simulations derived from the software PVsyst coupled with phenological events of potatoes throughout the whole growing season are integrated to represent spatiotemporal variation of shading. Third, examine and investigate crop characteristics during a parallel outdoor experimental study on potatoes in the specific design and in monocropped open field, specifically potato growth components (height, area of the leaves and count of the leaves), tuber characteristics (unit tuber count, unit tuber weight, unit dry mass of tuber), and total final yield in the above mentioned two planting configurations. Fourth, investigate and evaluate system performance, via determining Land Equivalent Ratio (LER) which highlights the interrelationships between the power generation and cultivation aspects so as to determine the land-equivalent efficiency of the current specific design configuration. Lastly, develop and propose a reproducible framework that can provide guidance for determining appropriate design configurations for a balance between crop yield and energy supply based on evidence derived from observations from a subtropical region agrivoltaic plant system, such that comparable planting arrangements are applied to new facilities.
2. Materials and Methods
2.1. Study Area and Climatic Conditions
The field experiment was conducted in the rabi (winter) season, at research farm of Amity Institute of Organic Agriculture, Amity University, Noida, Uttar Pradesh, India (28o 32′29.44” N; 77o 19′ 56.73” E, 200m amsl). This site is characterized by a subtropical semi-arid climatic zone, dominated by hot summers (April-June, mean temp 38-42C), cool winters (December-February, mean temp 5-15oC) and a prominent monsoon period (July September). The crop was grown during winter season to avoid extreme temperatures due to heat stress and as part of normal farming activities in the study region. Global Horizontal Irradiance (GHI) at the location is 1,618.8 kWh/m/year, with maximum 764 hr sun light per year. Table 1 and Table 2 provide a detailed description of the study area’s location and climate and weather conditions, respectively.
2.2. Custom-Designed Agrivoltaic System
2.2.1. Structural Design
A pole-mounted, fixed-tilt agrivoltaic structure of land area 629 m2 was constructed on the site. The key design parameters chosen to prioritize crop growth are as follows (Table 3):
An east-west orientation of the panels with north-south rows arrangement was adopted, which help in balanced shading distribution to the underlying crops. Structure configuration was based on a 5x3 matrix, with a total of 32 panels mounted on 16 poles (two panels per pole arranged in vertical orientation), as shown in Figure 1. A hot-dip galvanized steel structure (UL 2703 certified) was utilized to ensure corrosion resistance of the mounting system. The detailed specification of SPV system including inverter and structure has been mentioned in Appendix A as A1.
2.2.2. PV-Array Design
Monocrystalline modules with a capacity of 325 Wp are mounted on the structure at an optimal tilt and azimuth of 24° and 180°, respectively, at a height of 4m for easier operation with underlying agricultural activity. The row-to-row spacing was selected to be 8 m. The DC power generated by the array was directed to a DC combiner box, converted into AC, and fed to a 10-kW grid-connected inverter. The output power from the grid-connected inverter was connected to the AC distribution board and synchronized with the utility grid. Data of system’s performance was logged using an integrated data acquisition system [23].

Table 4.
SPV System Configuration.
| Component | Specification |
|---|---|
| PV Module Rating | Mono-crystalline, 325 W |
| Number of Modules | 32 |
| PV Array Capacity | ≈10 kW |
| Inverter Sizing | 10 kW grid-connected inverter |
| Inverter Efficiency | 97–98% |
| Mounting Structure | Fixed tilt |
| Monitoring | Data logger |
| GM Structure | HDG (Hot-dip Galvanized) |
Table 5.
SPV System Sizing for 10kW PV System.
| Parameter | value |
|---|---|
| Module rated power (Wp) | 325 |
| Number of modules | 32 |
| Total capacity (kW) | 10 |
| Module per string 1 | 16 |
| Number of strings | 2 |
| Array Configuration | 16 x 2 |
2.3. Simulation Framework
The custom-designed agrivoltaic system model evaluates metrics such as the Ground Coverage Ratio (GCR), Shadow Coverage Index (SCI), Land Equivalent Ratio (LER), crop yield, and energy output within a hybrid agrivoltaic framework. This integrated approach facilitates field experiments and simulations, employing a multi-objective decision-making strategy to optimize and identify trade-offs between energy production and agricultural outputs, also described in Figure 2. Energy yield simulations were conducted using PVsyst, employing typical meteorological data sourced from the synthetic Typical Meteorological Year (TMY) Meteonorm 8.1 database. Shading analysis was performed using hourly time-step simulations with the SketchUp software tool. However, in Figure 3 three-dimensional design of custom-designed AVS model shown by using SketchUp 3D software tool, Figure 4., module spatial arrangement layout simulated in PVsyst Ver.7.4, respectively. Further system energy flow schematic diagram of 10 kW Solar PV System is illustrated in Figure 5.
2.3.1. Ground Coverage Ratio (GCR)
GCR is an important designing parameter which determines proportion of PV array area to be covered over the total land area available. High GCR will yield higher energy density, but with lower light available for crops.
where as,
A_PV = Total projected area of PV modules on the ground (m2)
A_Land = Total land area allocated for the PV system (m2)
Calculation:
Module dimensions: 1.96 m × 0.99 m = 1.9404 m2 per module
Tilt angle = 24°
Pitch = 8 m
Total land area = 629 m2
Total useable land area = 600 m2
Projected width per module:
W = 1.94 × cos (24°) = 1.77” m”
Total module area:
A_PV = 1.77 × 32 = 56.64 m2
GCR = 56.64/600 = 0.0944 ≈ 9.44%
2.3.2. Shadow Coverage Index (SCI)—Dynamic Modelling
Shadow coverage Index (SCI), a non-dimensional parameter in range 0-1, determines the ratio of a surface area to be covered by shadow (at a given time or over a period). SCI addresses the limitations of GCR where time variability in solar trajectory and array arrangement is taken into consideration for determining shadow profile across the crop.
SCI Classification:
SCI < 0.3 → Low shading, crops receive sufficient sunlight
SCI 0.3–0.6 → Moderate shading, suitable for shade-tolerant crops
SCI > 0.6 → High shading, may significantly reduce crop productivity
The shadow area depends on solar geometry, panel dimensions, and tilt angle:
where,
L_shadow = Shadow length (m)
W_panel = Width of the PV panel (m)
The shadow length is expressed using solar elevation angle:
where,
H_panel = Effective height of the PV panel above ground (m)
Θs = Solar elevation angle (degrees)
Thus,
For multiple PV rows:
where, N = number of PV rows.
SCI calculation using 3-D shading model of PVsyst (Version 7.4) was done considering solar geometry (azimuth, altitude of the Sun), panel dimension, tilt, mounting height, row to row gap. Time-step simulations for 10 minutes interval were run for the cropping season (December to March) and overlapped with potato phenological stages (emergence, vegetative stage, tuber initiation, tuber bulking, and maturity) in order to identified sensitive periods of shading in potato cultivation.
2.3.3. Energy Yield Simulation (PVsyst)
Energy generation for PV array was simulated using PVsyst V7.4 (PVsyst SA, Switzerland). Input data parameters for simulation were:
Hourly meteo-data for the study location from a synthetic Typical Meteorological Year (TMY) Meteonorm 8.1 database.
Module’s manufacturer specifications (temperature coefficient, efficiency) and other system properties.
System losses considered were 3% as soiling loss, thermal losses according to the NOCT of the module and 2% as inverter loss.
Shading losses computed from the SCI model.
Core Equations:
PV Output Power:
where,
A = Panel area (m2)
G = Irradiance (W/m2)
η = Efficiency (%)
Performance Ratio:
where,
Y_f = Final yield (actual energy output)
Y_r = Reference yield (theoretical maximum)
The simulation production included monthly as well as seasonal AC energy (kWh), specific yield (kWh/kWp), and performance ratio (PR).
2.3.4. Land Equivalent Ratio (LER)
LER is used to determine relative efficiency of agrivoltaic system when agricultural and solar energy yield of the combination system are measured in relative to independent solar and agricultural systems. LER >1 for the combination system indicate AVS uses land more efficiently than the individual monoculture and PV farms. The working calculation has shown in Appendix A, A4: LER Calculation—Extended
where,
Y_AVS = Crop yield under agrivoltaic system
Y_Control = Crop yield under conventional monocropping
E_AVS = Energy yield from agrivoltaic system
E_(PV-only) = Energy yield from PV-only system (no crop)
LL = Land loss factor (LL = 0 for overhead systems)
Interpretation:
LER = 1: Agrivoltaic system performs equivalently to separate systems
LER > 1: Agrivoltaic system is more land-efficient
LER < 1: Separate systems are more land-efficient
2.4. Crop Cultivation and Experimental Design
2.4.1. Experimental Details
The experiment and image sample collected on strip plot (shown in Figure 6) design with two treatments replicated three times; plot dimensions per treatment were 6m. Meanwhile, weather condition data has been shown in Appendix A, A2: Detailed Weather Data (November 2024–March 2025).
The treatments considered were as under:
- T1: PV array mounted crop planting (AVS treatment), and
- T2: PV array-less, conventional monocrop planting (Control).
2.4.2. Soil Characteristics
The soil at the experimental location is a deep loamy soil with well-developed alluvium, moderate in clay and low in organic carbon content with a pH of approximately 8.4. For Control T2 the soil parameters are pH (1:5 suspension): 8.48 (Alkaline), Total Nitrogen (TKN): 0.037% by Mass (Low), Available P: 17.3 mg/Kg (Moderate), Available K: 178 mg/Kg (Moderate). Whereas the same for T1 are observed as pH (1:5 suspension): 8.39 (Slightly Alkaline), Total Nitrogen (TKN): 0.042% by Mass (Low), Available P: 18.5 mg/Kg (Moderate), Available K: 187 mg/Kg (Moderate).
2.4.3. Agronomic Practices
The agronomic practice during the experiment is as given below, in Table 6:
2.5. Data Collection and Statistical Analysis
The data collected during the process has shared as Appendix A, A3: Raw Crop Data.
2.5.1. Crop Parameters Recorded
The following parameters were recorded for both treatments:
- Leaf area (cm2)—measured using leaf area meter
- Plant height (cm)—measured from ground to apical meristem
- Number of leaves per plant
- Number of tubers per stand
- Unit weight of potato (g/tuber)
- Dry matter weight (g)—oven-dried at 70 °C to constant weight
- Final yield per plot (kg)
2.5.2. Statistical Analysis
As the installation is under study under a pilot scale, crop parameters were evaluated under descriptive, rather than confirmatory statistical framework. The values shown are the mean ± standard deviation (SD), and % changes are provided as indicative measure in pilot research study. This framework is ideal to showcase a design concept and simulation validated technique, rather than performing crop physiological characterization.
3. Results
3.1. Energy Yield Assessment
The PVsyst simulation results for the 10.4 kWp custom-designed AVS are presented below, in Table 7.
The key performance indicators are:
- • Annual Energy Yield: 1,976 kWh/year (normalized: 1,055 kWh/kWp/year)
- • Specific Yield: 2.98 kWh/kWp/day
- • Performance Ratio (PR): 79.1%
- • System Capacity Utilization Factor: ~12.1%
With a performance ratio of 79.1%, a fairly high efficiency is found with allowances for the various losses like soiling (3%), thermal losses and inverter losses (2%) and shading losses. While the energy produced under low GCR (0.09) was comparatively less when compared to conventional PV farm, agrivoltaic cultivation resulted in a better crop yield under this particular conditions.
3.2. Shading Dynamics—Shadow Coverage Index (SCI)
3.2.1. GCR–SCI Relationship
It has been observed that GCR is non-linearly related with SCI. At custom-built GCR of 0.09, SCI was less than 0.2 throughout cropping seasons-clearly within the ‘low shading’. Thus, minimal shading overlap occurred with good light penetration which is considered ‘crop-friendly’ condition with agrivoltaic system.
3.2.2. Seasonal SCI Variation
The SCI exhibited distinct diurnal and seasonal patterns from November to March, indicated in Figure 7:
- Morning ramp (8–10 AM): SCI rises sharply with rapid shading onset after sunrise
- Midday plateau (10 AM–2 PM): SCI stabilizes at approximately 0.09–0.12, indicating relatively uniform shading
-
Afternoon divergence (2–5 PM):
- ○
- January–February: Peak SCI (~0.14–0.15) — strongest late-day shading
- ○
- November: Secondary peak (~0.13), then declines
- ○
- December: Continuous decline, weakest shading overall
- ○
- March: Gradual rise, moderate shading
The key finding herein is that during the potato tuber initiation (30-50 DAS) and tuber bulking phases (50-90 DAS)-which are the most critical stages of potato production-the SCI remained below 0.2 confirming the custom design has successfully avoided deep-shading effect at these yield determining stages.
3.3. Crop Performance
3.3.1. Vegetative Growth Parameters
Growth and yield parameters were measured for each scenario, T1 & T2, are represented in following Table 8 and Figure 8.
Leaf Area: Over the observed period leaf area increased in both treatments. At the early stage (30 DAS), there was a marginal increase in leaf area in AVS over the control due to favorable micro-climate with diffused light and low stress while at mid stage (30-60 DAS), steady increase with close trend was observed between the two treatments. At late stage (60 DAS), control had greater leaf area when compared to AVS treatment.
Plant Height: Plant height continuously increase in both treatments with 94 DAS for AVS crops and until 108 DAS for control crops. Similar trend, AVS shows smaller stature (10.8% height decrease at 90 DAS) as compared to control at all stages of crop growth due to shading effect which is directly associated with low irradiation.
No. of Leaves: There were always significantly more leaves at the control treatment than AVS. However, significant increases were first observed after ~ 59DAS and the effect grew significantly at a late stage (62-65 DAS) of vegetative growth where AVS results in lower number of leaves at the end of the vegetative stage.
3.3.2. Yield Attributes
Number of tubers/stands: Throughout potato growth-higher number of tubers was observed at the control treatment compared to AVS treatment. At the early stages the difference between control and AVS was higher (4-5 tubers in 59-66 DAS) but as it grown further it significantly decrease and reached to approximately 1 tuber in 72-100 DAS.
Unit Weight of the tubers: Increase in unit weight of tubers was observed in both the treatments but AVS shows higher unit weight over control throughout all the stages of the crop growth, and significantly more gain at approximately between 60-75 DAS where it levelled off while control shows slow steady increase. Finally, unit weight was significantly increased at AVS treatment compared to control (30.0 gm vs 47.5 gm), the reason can be attributed towards favourable micro-climate which improved the overall moisture and heat condition resulting in better tuberization under AVS compared to control.
Dry matter: AVS treatment shows significantly more dry matter then control throughout all the growing periods, a very sharp increase in dry matter from ~0.2 g to 0.88 g was observed at approximately 70 DAS while slow increase from ~0.15 g to 0.20 g occur in control which clearly means that biomass production capacity increased under agrivoltaic system due to improved microclimate
Final Yield: Potatoes were harvested with the observed AVS yielded of 18.3 kg/plot and that of Control is 15.0 kg/plot, thus 22.0% of higher yield was recorded for custom-designed AVS.
3.4. Land Equivalent Ratio (LER)
The Land Equivalent Ratio calculated for both T1 & T2 conditions are summarized in Table 10.
LER in the case of for T1 has been observed to be 1.65, which clearly depicts that the land is being utilized efficiently up to 65% higher compared to individual monoculture and PV land usage and this is much higher as compared to the expected value of LER>1.0 for any agrivoltaic system. The following Table 11 illustrates the trade-off dynamics of the study.
4. Discussion
4.1. Physiological Response of Potato to Dynamic Shading
Potato plants under the custom AVS demonstrated a classical shade-avoidance response: marginally longer stems (+16.8% at early growth stage) but decreased leaf area and number as compared to the control. Such morphological adjustments correspond to the potato response to reduce PAR, which increases biomass allocation for stem elongation and tuber filling in reverse way, as identified [24].
Surprisingly, the 58.3% increase in unit tuber weight obtained under AVS indicates that the moderate shading (SCI < 0.2) during tuber bulking perhaps provided additional favorable factors such as (i) attenuated heat stress which resulted in more efficient partitioning of assimilates toward tuber production and (ii) enhanced soil moisture retention by reducing evaporation rate, and (iii) favorable microclimatic condition for tuber growth. The massive 340% increase in dry matter content further consolidates the above interpretation and shows increased efficiencies in biomass accumulation under the agrivoltaic microclimate.
The total yield improvement by 22.0% (18.3 ± 2.1 kg versus 15.0 ± 1.8 kg per plot) is broadly consistent with recent meta-analyses that the potato yields ranged from -20% to +11% with different agrivoltaic system designs and climates. The custom-design with intentionally low GCR and elevated mounting height obtained at the upper limit of this range indicating the possibility for agriculture-centric designs to improve productivity in the tropics.
4.2. Trade-Off Between Energy Generation and Crop Yield
The trade-off results demonstrate a non-linear relation between the GCR, SCI and the system outputs, and the LER of 1.65 achieved at GCR=0.09 can be considered significantly positive as the combined food-energy output exceeded that of the individual systems by 65%. This value falls within the upper range of LER values (1.2-1.8) that have been reported in a global review of agrivoltaics.
Although the system energy ratio (EAVS/EPV-only) was relatively low at 0.43, this occurred due to the deliberate sacrifice in power density. However, the system design is economically reasonable because:
- The 22.0% additional crop yield has sufficiently offset the 57.0% decrease in energy generation in the system total value,
- The custom design enables year-round agricultural activities beneath the panels, improving overall land-use efficiency, and
- During subtropic areas hot weather conditions are a limiting factor for the tuber productivity, moderate shading helps to retain quality of and market value of the product and increases total value of the crops due to increased unit yield.
This study hence challenged the conventional idea which emphasizes power maximization as the optimal configuration of AVS and demonstrates the necessity of considering crop limitations to optimize system design.
4.3. Justification of Custom-Design over Conventional AVS
A typical conventional AVS with high GCR (e.g., >0.5, mounting height <3m) would have: (i) remained an SCI > 0.4 during tuber bulking, which would have resulted in a loss of ~40% to 60% of potato yield, (ii) obtained far below a 1.5 LER. To avoid these problems, the following design modifications for the custom AVS were imposed: (1) elevated mounting height (4m) to maintain high air circulation rates and alleviate heat stress, and allow the passage of field machines; (2) widely spaced rows (8 m) so as to allow side-light penetrates, hence maintaining an SCI < 0.2 during potato tuber formation; (3) low GCR (0.09) to minimize deep shading over agricultural floor and yet provide adequate energy generation; and (4) pole-foundation design that minimize the soil footprint and preserve the soil structure. All the improvements are consistent with the current system design principles for temperate and tropical areas in which heat stress is the main limiting factor affecting the yield.
4.4. Implications for Subtropical Agrivoltaics and Future Directions
The study proves the feasibility of the agriculture-first approach to boost the land-use efficiency in the subtropics, and the hybrid experimental-simulation framework for the customized AVS design allows for application and evaluation of AVS design with specific crop requirements. There are:
- For Researchers: Researcher will benefit from the introduced SCI metric to investigate the impact of AVS design on the crop physiology.
- For Policymakers: Policymakers are presented with solid evidence that AVS enables highly efficient land-use that meets the PM-KUSUM objectives of deploying renewable energy for agriculture in India.
- For Farmers: Farmers can be attracted to invest in dual-input agriculture due to double income stream of food and energy without further compromises in agricultural yield.
For future work the researchers suggest to: Replicate study over a multi-year and multi-season crop production in order to confirm the identified results; Evaluate system performances with multiple staple crops (e.g., Wheat, maize and pulses) grown under similar designs; Incorporate economic analysis to compute net present value (NPV) and payback period (PBP) of integrated food energy systems; Monitor, under actual conditions, the system dynamics such as local microclimatic conditions and soil health changes along with crop growth and energy output; and Construct comprehensive techno-economic model with consideration of location-specific climate risks.
5. Conclusions
The present study successfully proved the potential of the custom-designed agriculture-focus agrivoltaics system for greater Land Use Efficiency (LER = 1.65) in addition to boosted potato yields (22%) in subtropical Indian conditions. Compromising on optimum power density through reduced GCR (0.09), larger height (4m), and extended plant spacing (8 m) helped sustain the Shadow Coverage Index (SCI) under 0.2 during the tuber bulging phase and instead boosted, rather than hindered, crop yields.
This newly developed hybrid experiment–simulation frame provides an easily replicable, site specific-centric protocol for the optimal AVS configuration. Furthermore, inclusion of the SCI parameter dynamically within the PVSyst has provided an objective framework to connect the PV system parameters to crop physiology’s thresholds, which has long been missing within standard AVS designs.
The results of this research not only contradict the standard approach in which the value of GCR signifies good performance and land-use but also proves that optimized system design is not dependent solely on land–use or power but rather based on crops requirements which can ultimately result in an integrated AVS design far more efficient to crop production and resource-utilization in subtropical environment.
Considering the ongoing conditions of heat stress, food insecurity and shortages of land in subtropical regions, an integrated AVS in an agriculture-centric frame might serve as a good way for an eco-friendly and sustainable food-energy nexus, directly contributing to SDG 7 (Affordable and Clean Energy) and supporting an equitable transition to a Net Zero future.
Author Contributions
Mohammad Adil Faizi: Methodology, Investigation, Simulation, Writing—original draft. Abhishek Verma: Conceptualization, Methodology, Writing—review & editing. Sonal Chauhan—reviewing & editing. V.K. Jain: Supervision, Writing—review & editing.
Data Availability Statement
The authors confirm that the data supporting the findings of this study are available within the article and its Appendix A. As and if required any specific information, author’s will share upon request.
Acknowledgments
Authors are thankful to Dr. Ashok K. Chauhan, Founder President, Amity University for his continuous encouragement and support. Authors are also thankful to Dr. Atul K. Chauhan, Chancellor, Amity University Uttar Pradesh for his support to making famer’s cottage and connecting with Swachh Bharat Abhiyan concept. The authors appreciatively acknowledge Dr. Naleeni Ramawat, former Director of the Amity Institute of Organic Agriculture (AIOA), for her continuous support and guidance in this research.
Conflicts of Interest
The authors declare that they have no known competing financial interests or personal relationships that could have appeared to influence the work reported in this paper.
References
- Colauzzi, M., et al., Potato cultivation in agrivoltaic systems in Northern Italy: a four-year case study on array setup, shading patterns, and yield response. Smart Agric. Technol. 2026, 14, 101989.
- FAO, F., The state of world fisheries and aquaculture 2022; Food and Agricultural Organisation (FAO), 2022.
- Allan, R.P., et al., Intergovernmental panel on climate change (IPCC). Summary for policymakers, in Climate change 2021: The physical science basis. Contribution of working group I to the sixth assessment report of the intergovernmental panel on climate change; Cambridge University Press, 2023; pp. 3–32.
- Dupraz, C., et al., Combining solar photovoltaic panels and food crops for optimising land use: Towards new agrivoltaic schemes. Renew. Energy 2011, 36(10), 2725–2732.
- Weselek, A., et al., Agrivoltaic system impacts on microclimate and yield of different crops within an organic crop rotation in a temperate climate: Agrivoltaic system impacts on microclimate and yield of different crops within an organic crop rotation in a temperate climate. Agron. Sustain. Dev. 2021, 41(5), 59. [CrossRef]
- Amaducci, S.; Yin, X.; Colauzzi, M. Agrivoltaic systems to optimise land use for electric energy production. Appl. Energy 2018, 220, 545–561. [Google Scholar] [CrossRef]
- Trommsdorff, M., et al., Combining food and energy production: Design of an agrivoltaic system applied in arable and vegetable farming in Germany. Renew. Sustain. Energy Rev. 2021, 140, 110694.
- Pal, V.S., V. Pal, and D.B. Pal, Renewable energy sources, power demand, policies. Smart Energy Technol. Towards A Sustain. Future 2026.
- Li, R.; et al. System Optimization and Primary Electrical Design of 50 MW Agrivoltaic Power Station: A Case Study in China. Eng 2025, 6(9), 211. [Google Scholar] [CrossRef]
- Barron-Gafford, G.A., et al., Agrivoltaics provide mutual benefits across the food–energy–water nexus in drylands. Nat. Sustain. 2019, 2(9), 848–855.
- Mohammad, G., et al., Sun, soil, and sustainability: opportunities and challenges of agri-voltaic systems in India. Curr. Agric. Res. J. 2024, 12(1), 49–62.
- Ghaffarpour, Z.; Fakhroleslam, M.; Amidpour, M. Calculation of energy consumption, tomato yield, and electricity generation in a PV-integrated greenhouse with different solar panels configuration. Renew. Energy 2024, 229. [Google Scholar] [CrossRef]
- Colauzzi, M., et al., Potato cultivation in agrivoltaic systems in Northern Italy: a four-year case study on array setup, shading patterns, and yield response. Smart Agricultural Technology, 2026. 14.
- Omer, A.A.A., et al., Impacts of agrivoltaic systems on microclimate, water use efficiency, and crop yield: A systematic review. Renew. Sustain. Energy Rev. 2025, 221, 115930.
- Warmann, E., G.D. Jenerette, and G.A. Barron-Gafford, Agrivoltaic system design tools for managing trade-offs between energy production, crop productivity and water consumption. Environ. Res. Lett. 2024, 19(3), 034046.
- Kim, J.; et al. Shading impacts on sorghum and soybean grain yields in agrivoltaics systems: Source-sink strength in response to shading. Smart Agric. Technol. 2025, 12, 101647. [Google Scholar] [CrossRef]
- Küfeoğlu, S., SDG-7 affordable and clean energy, in Emerging technologies: Value creation for sustainable development; Springer, 2022; pp. 305–330.
- Cuppari, R.I., et al., Agrivoltaics: synergies and trade-offs in achieving the sustainable development goals at the global and local scale. Appl. Energy 2024, 362, 122970.
- Njema, G.G., et al., A review on advances towards achieving net-zero carbon footprint through sustainable agrivoltaic technology. Bull. Natl. Res. Cent. 2025, 49(1), 38.
- Maka, A.O.M., T. Ghalut, and E. Elsaye, The pathway towards decarbonisation and net-zero emissions by 2050: The role of solar energy technology. Green Technol. Sustain. 2024, 2(3), 100107.
- Costa, C., Jr.; et al. Roadmap for achieving net-zero emissions in global food systems by 2050. Sci. Rep. 2022, 12(1), 15064. [Google Scholar] [CrossRef] [PubMed]
- Kumwenda, S., Net zero emission: progress, opportunities, and challenges. Agric. Towar. Net. Zero Emiss. 2025, 27–34.
- Faizi, M.A.; et al. Design and optimization of solar photovoltaic power plant in case of agrivoltaics, in Recent Trends in Materials and Devices: Proceedings of ICRTMD 2019; Springer, 2020; pp. 59–69. [Google Scholar]
- Schulz, V.S.; et al. Impact of Different Shading Levels on Growth, Yield and Quality of Potato (Solanum tuberosum L.). Agronomy 2019, 9(6), 330. [Google Scholar] [CrossRef]
Figure 1.
A custom designed elevated SPV configuration in 5x3 matrix formation with agricultural land beneath the solar panel structures.
Figure 1.
A custom designed elevated SPV configuration in 5x3 matrix formation with agricultural land beneath the solar panel structures.
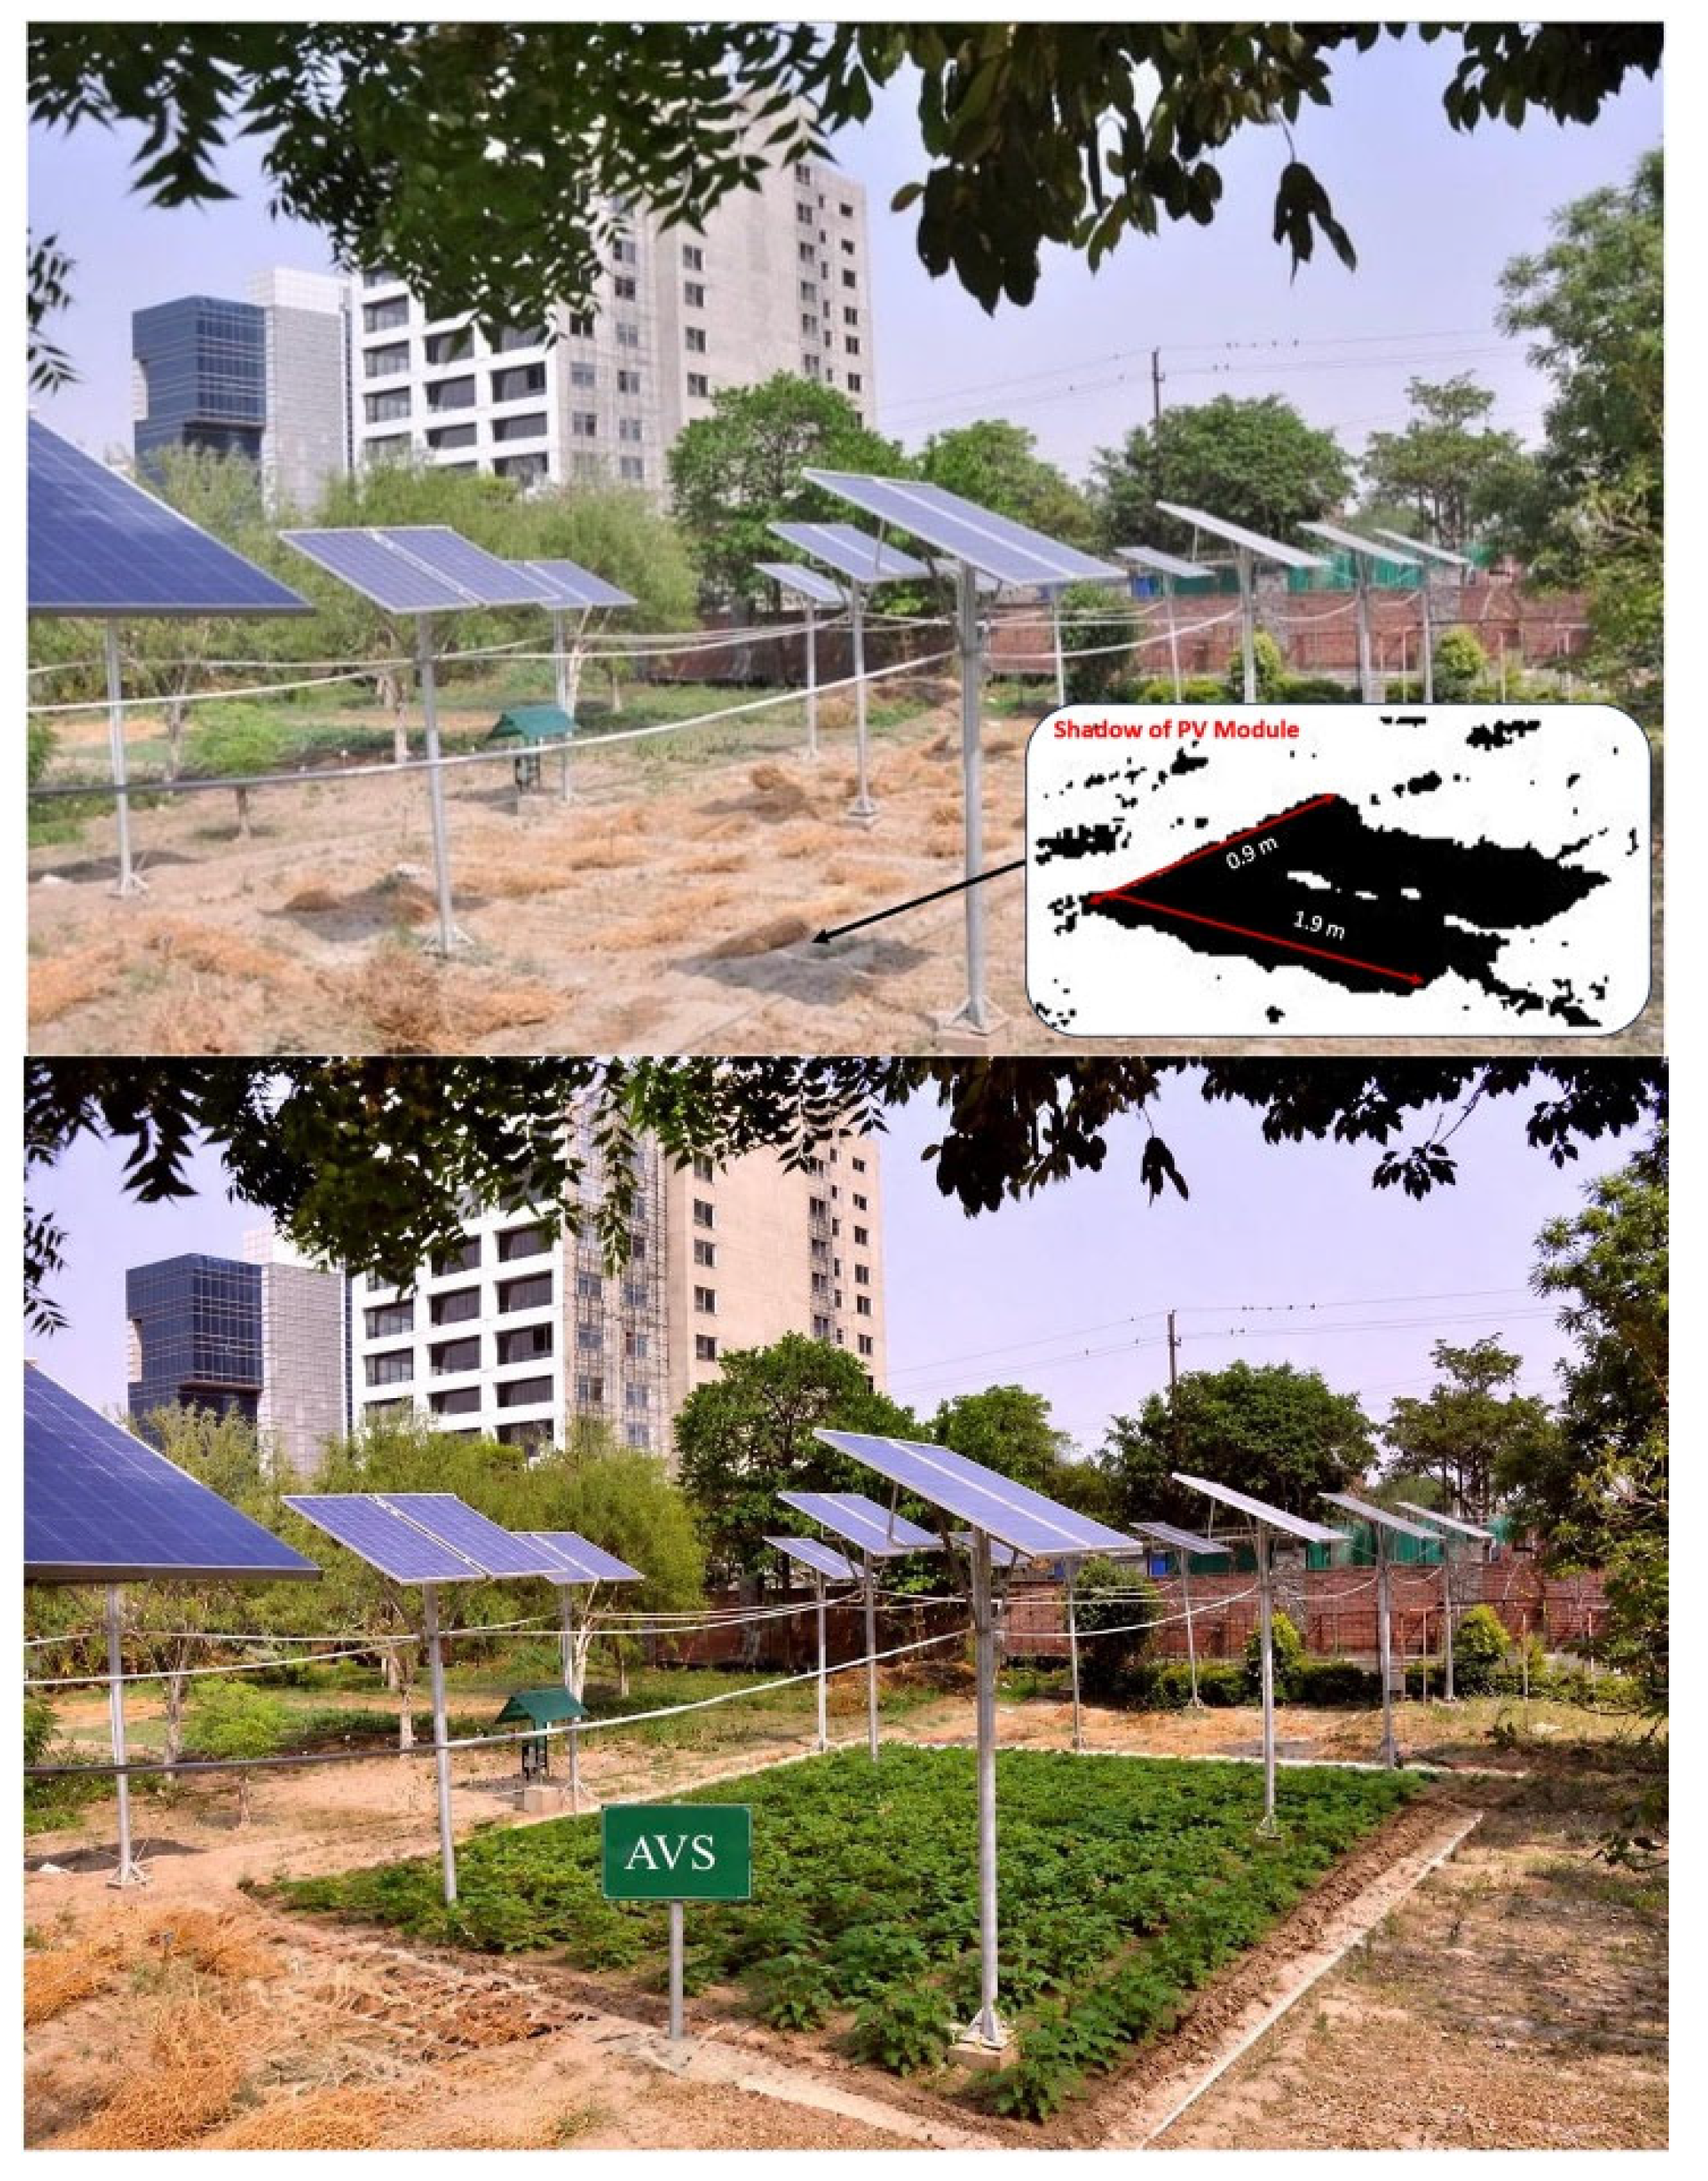
Figure 2.
Hybrid multi-objective decision-making strategy to optimize Agrivoltaic System.
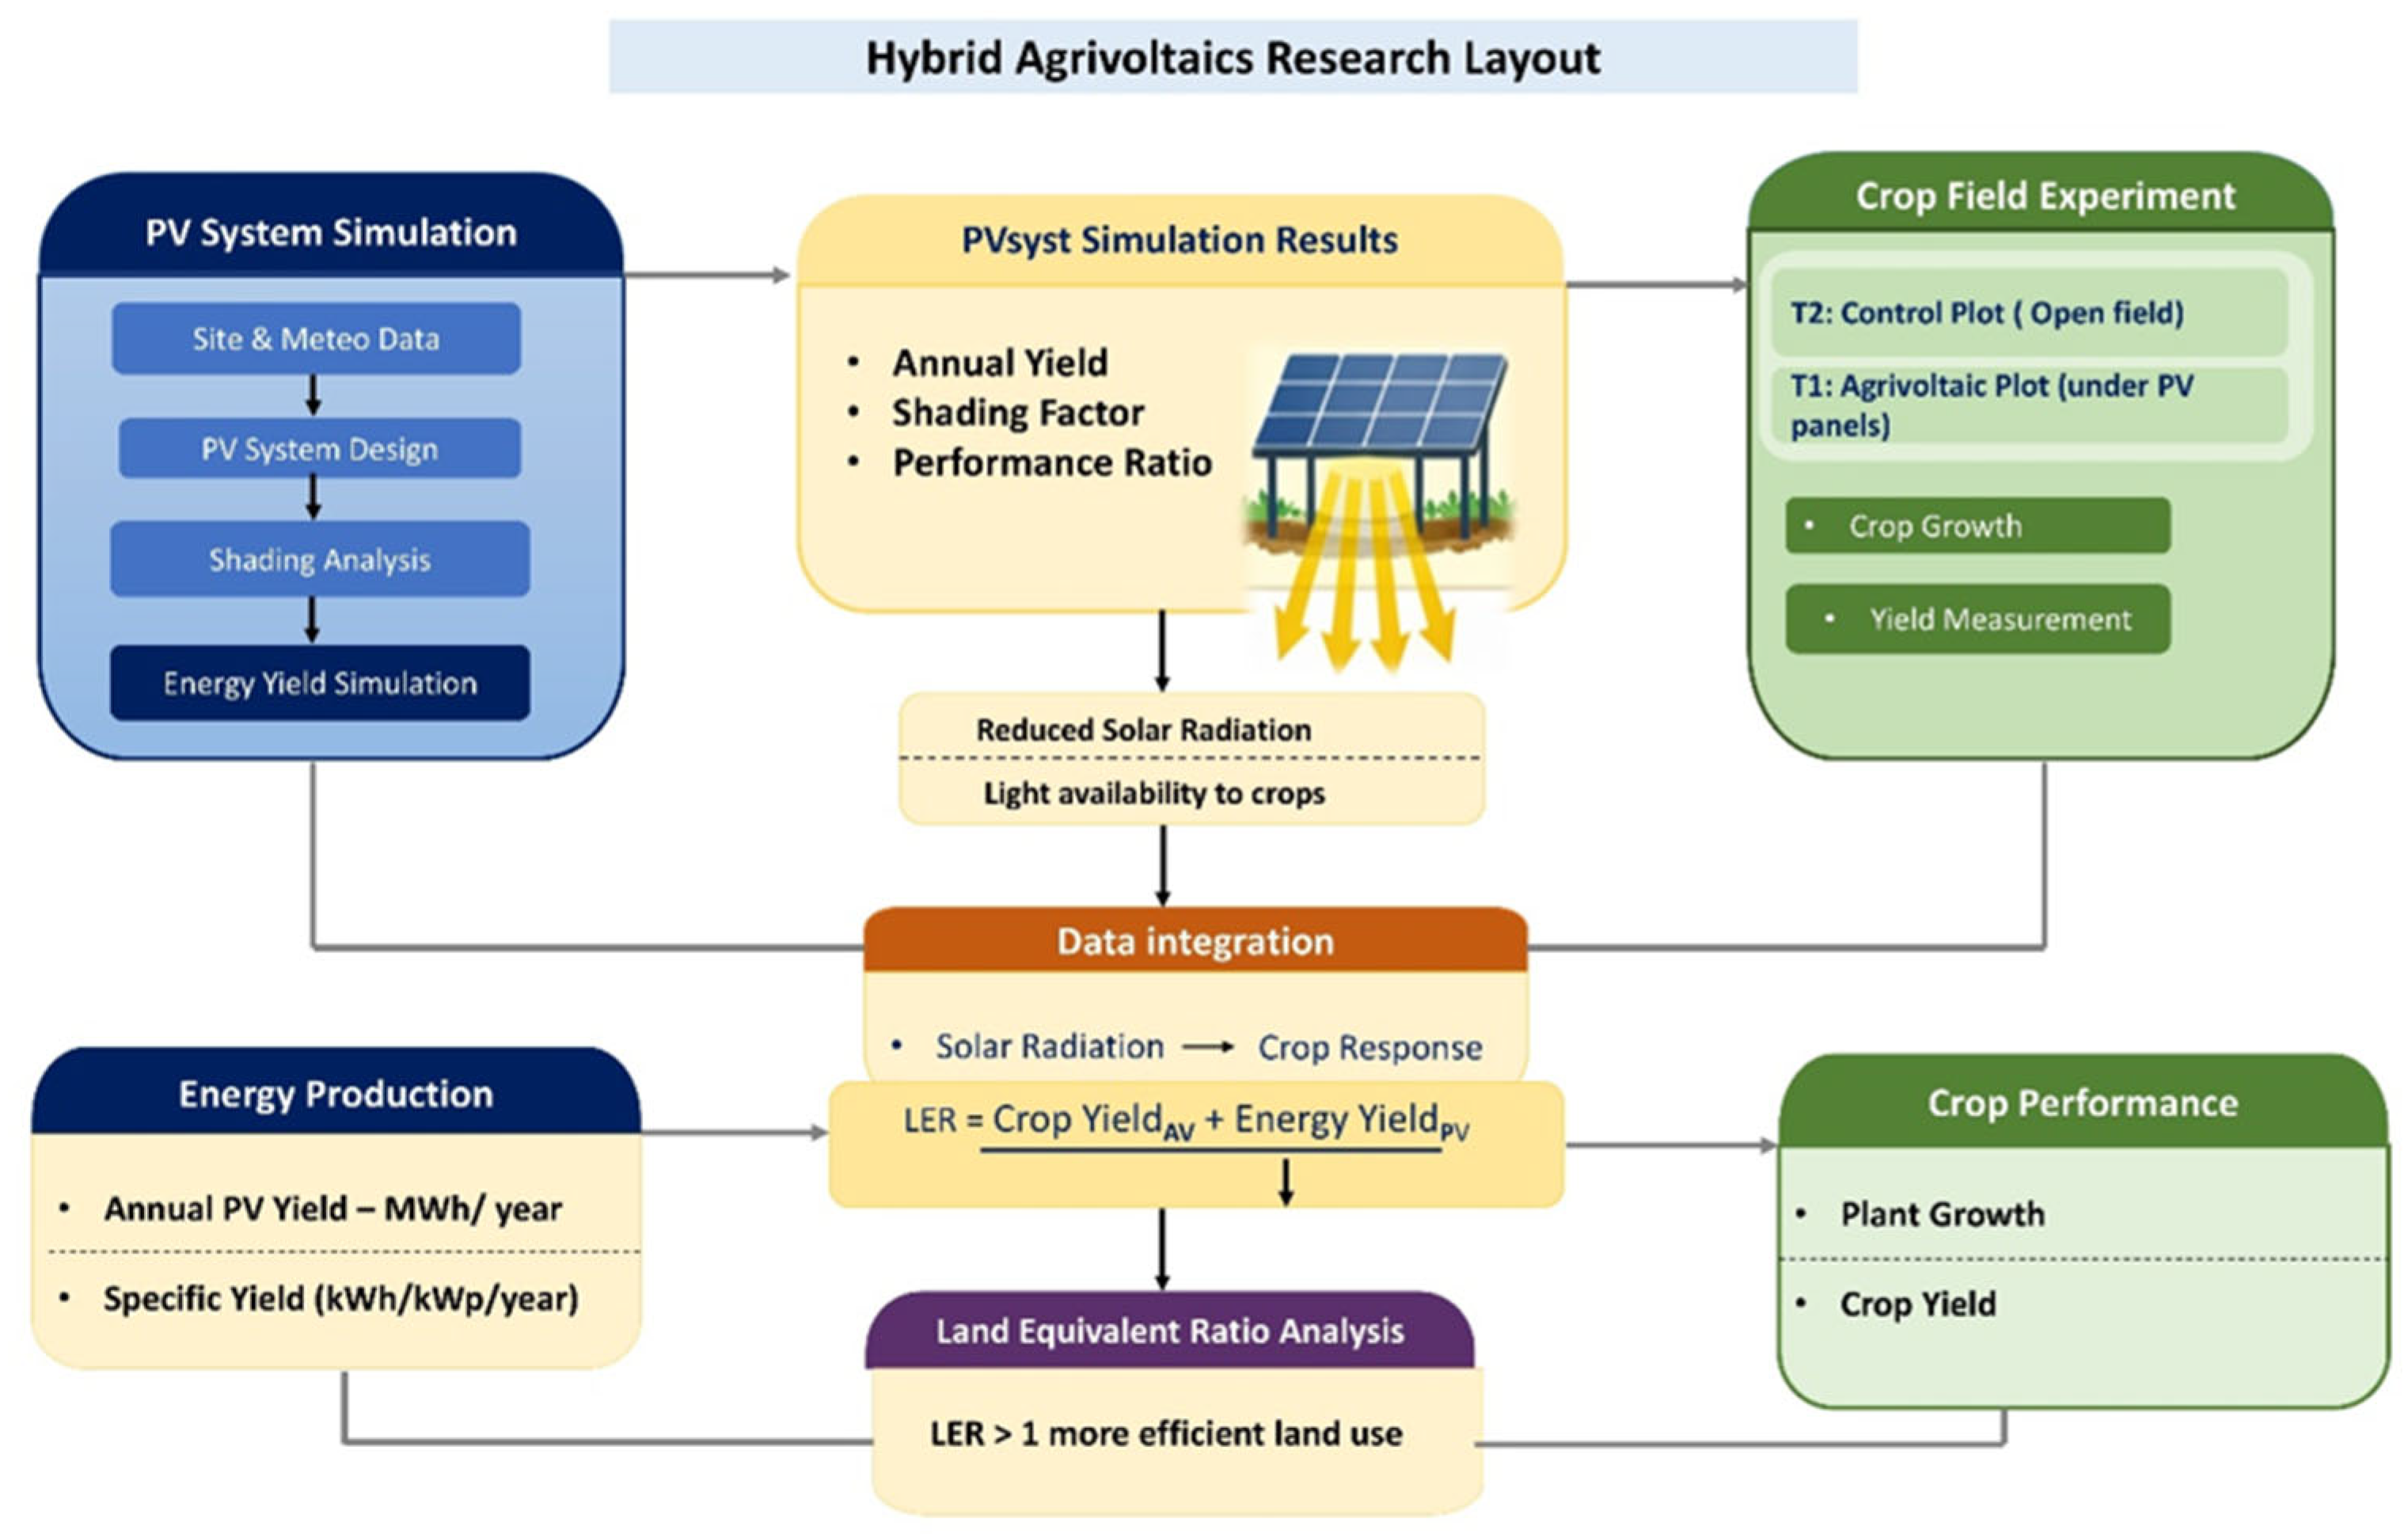
Figure 3.
Schematic 3D layout of the solar photovoltaic panel arrangement showing the 4.0 m panel mounting height, 8.0 m inter-row spacing.
Figure 3.
Schematic 3D layout of the solar photovoltaic panel arrangement showing the 4.0 m panel mounting height, 8.0 m inter-row spacing.
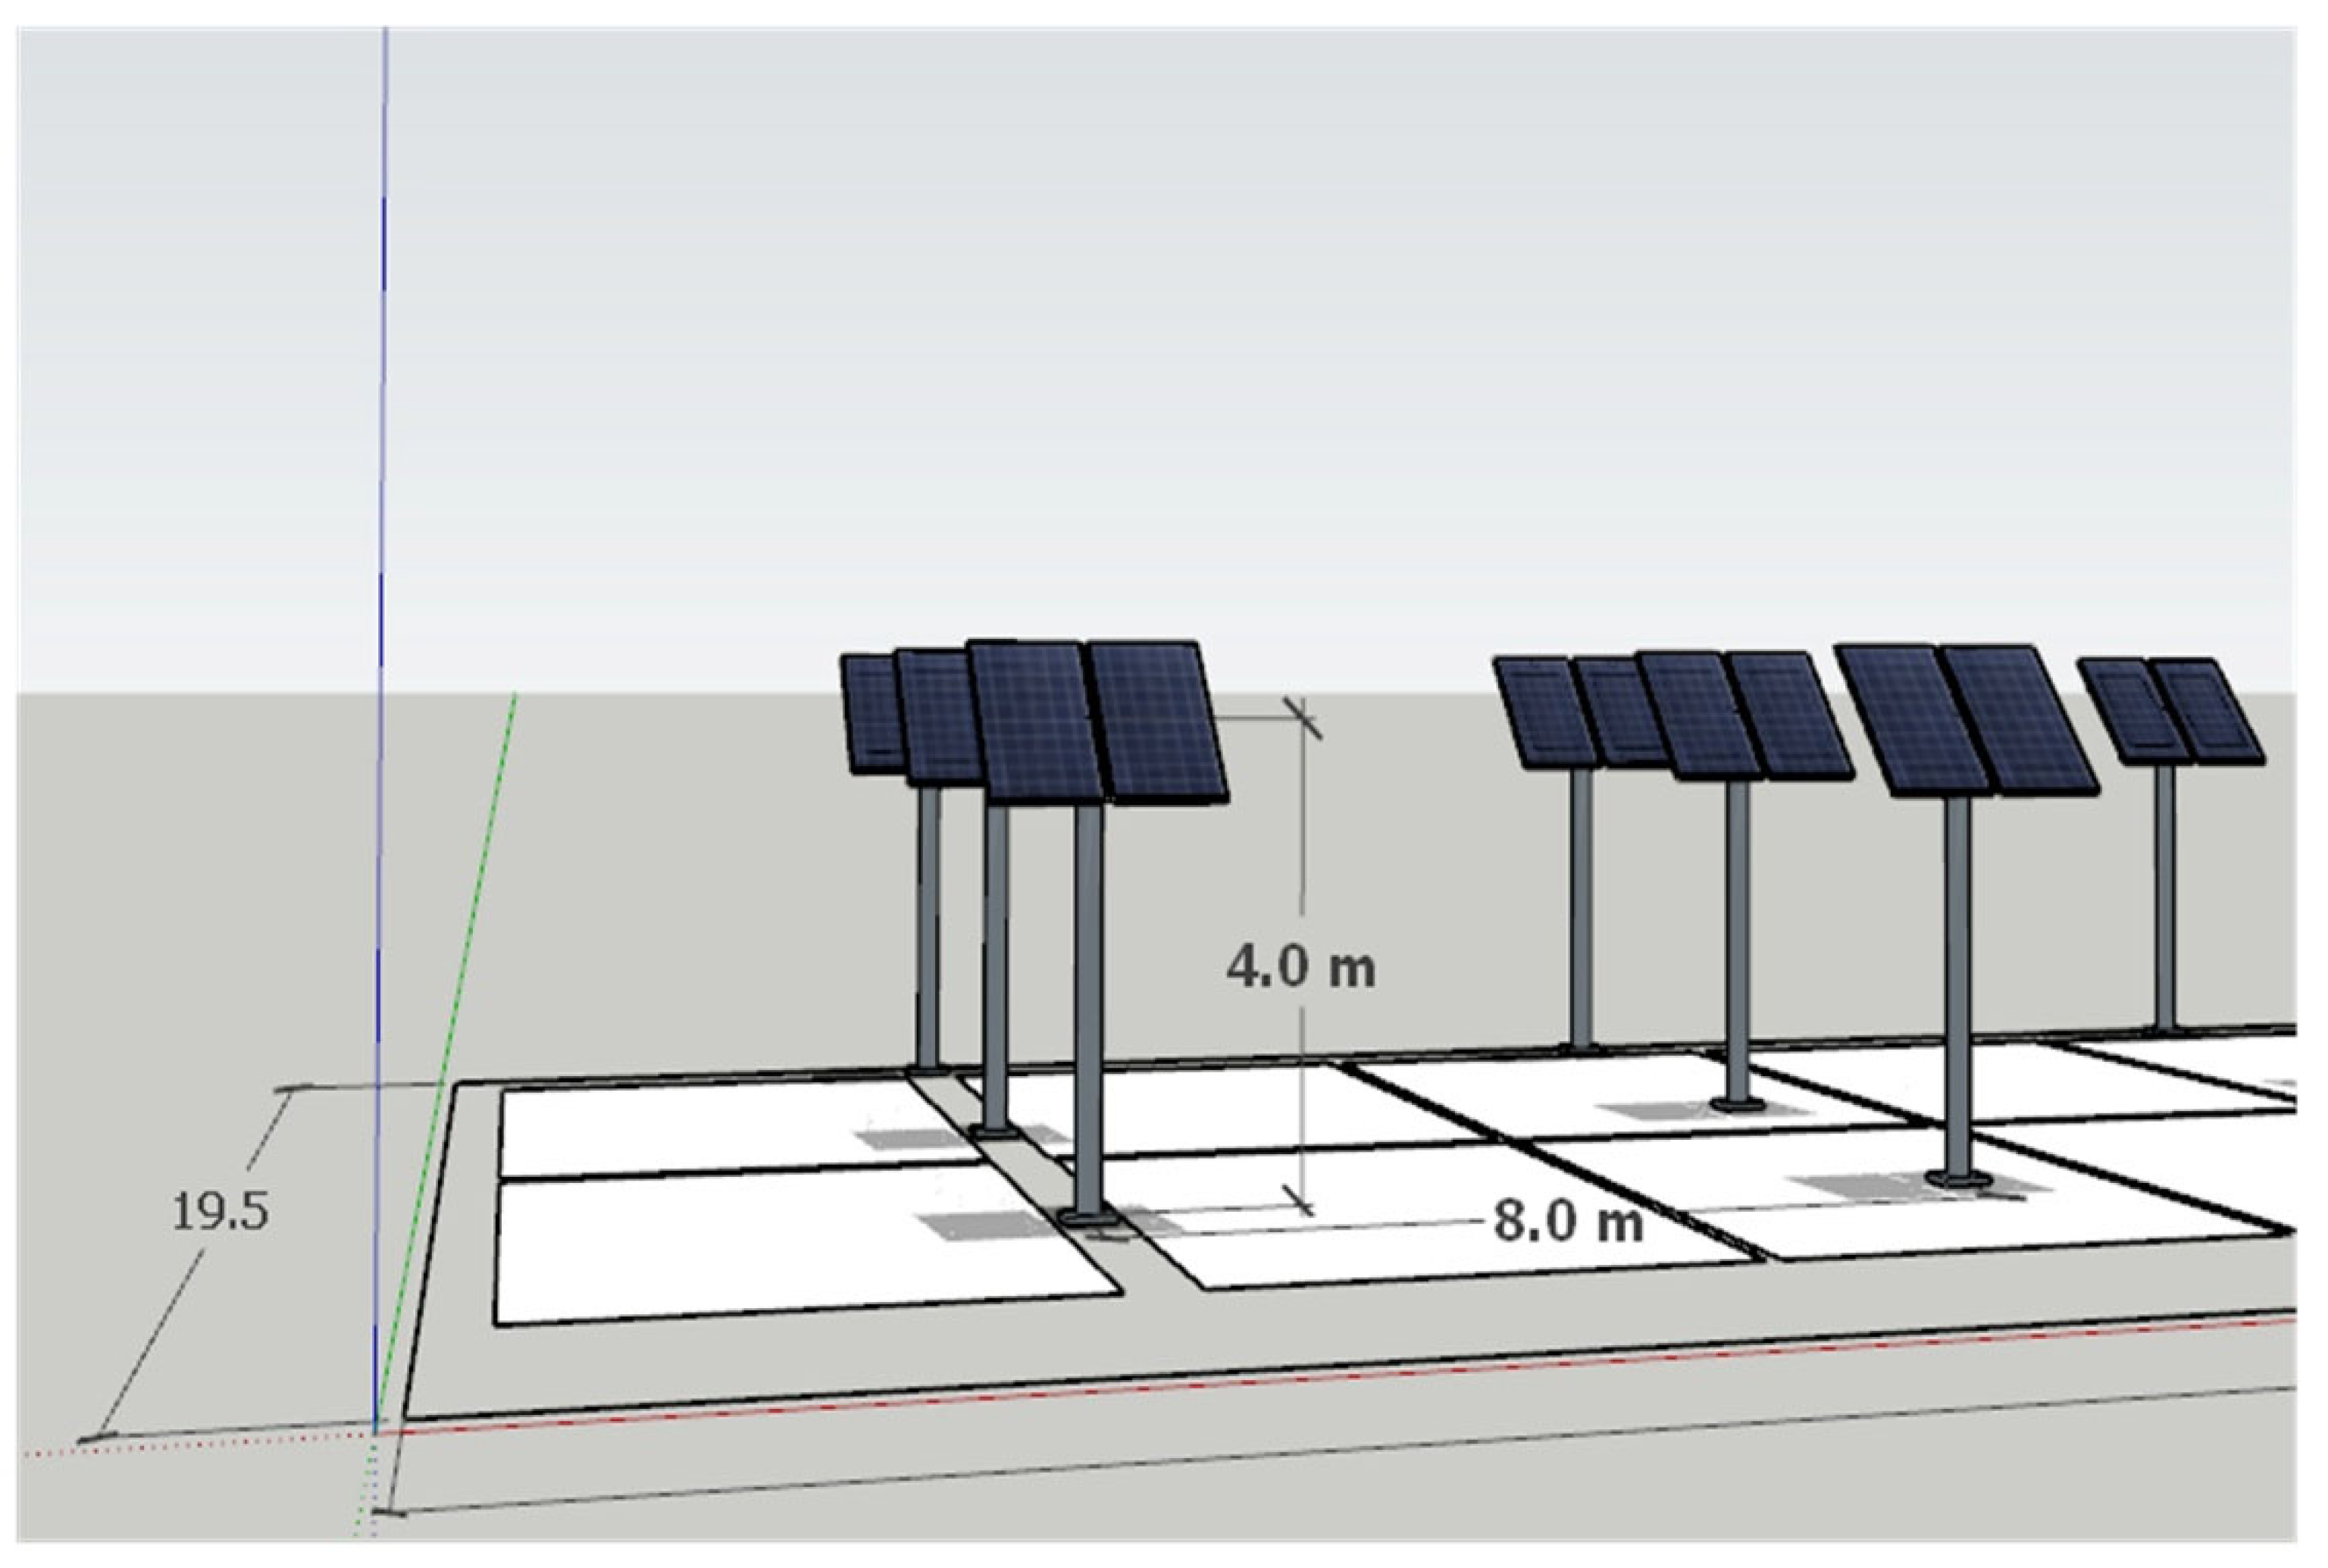
Figure 4.
Module layout showing the spatial arrangement of the PV modules (Rows 1–3 and Columns 1–6) with the corresponding north–south orientation.
Figure 4.
Module layout showing the spatial arrangement of the PV modules (Rows 1–3 and Columns 1–6) with the corresponding north–south orientation.
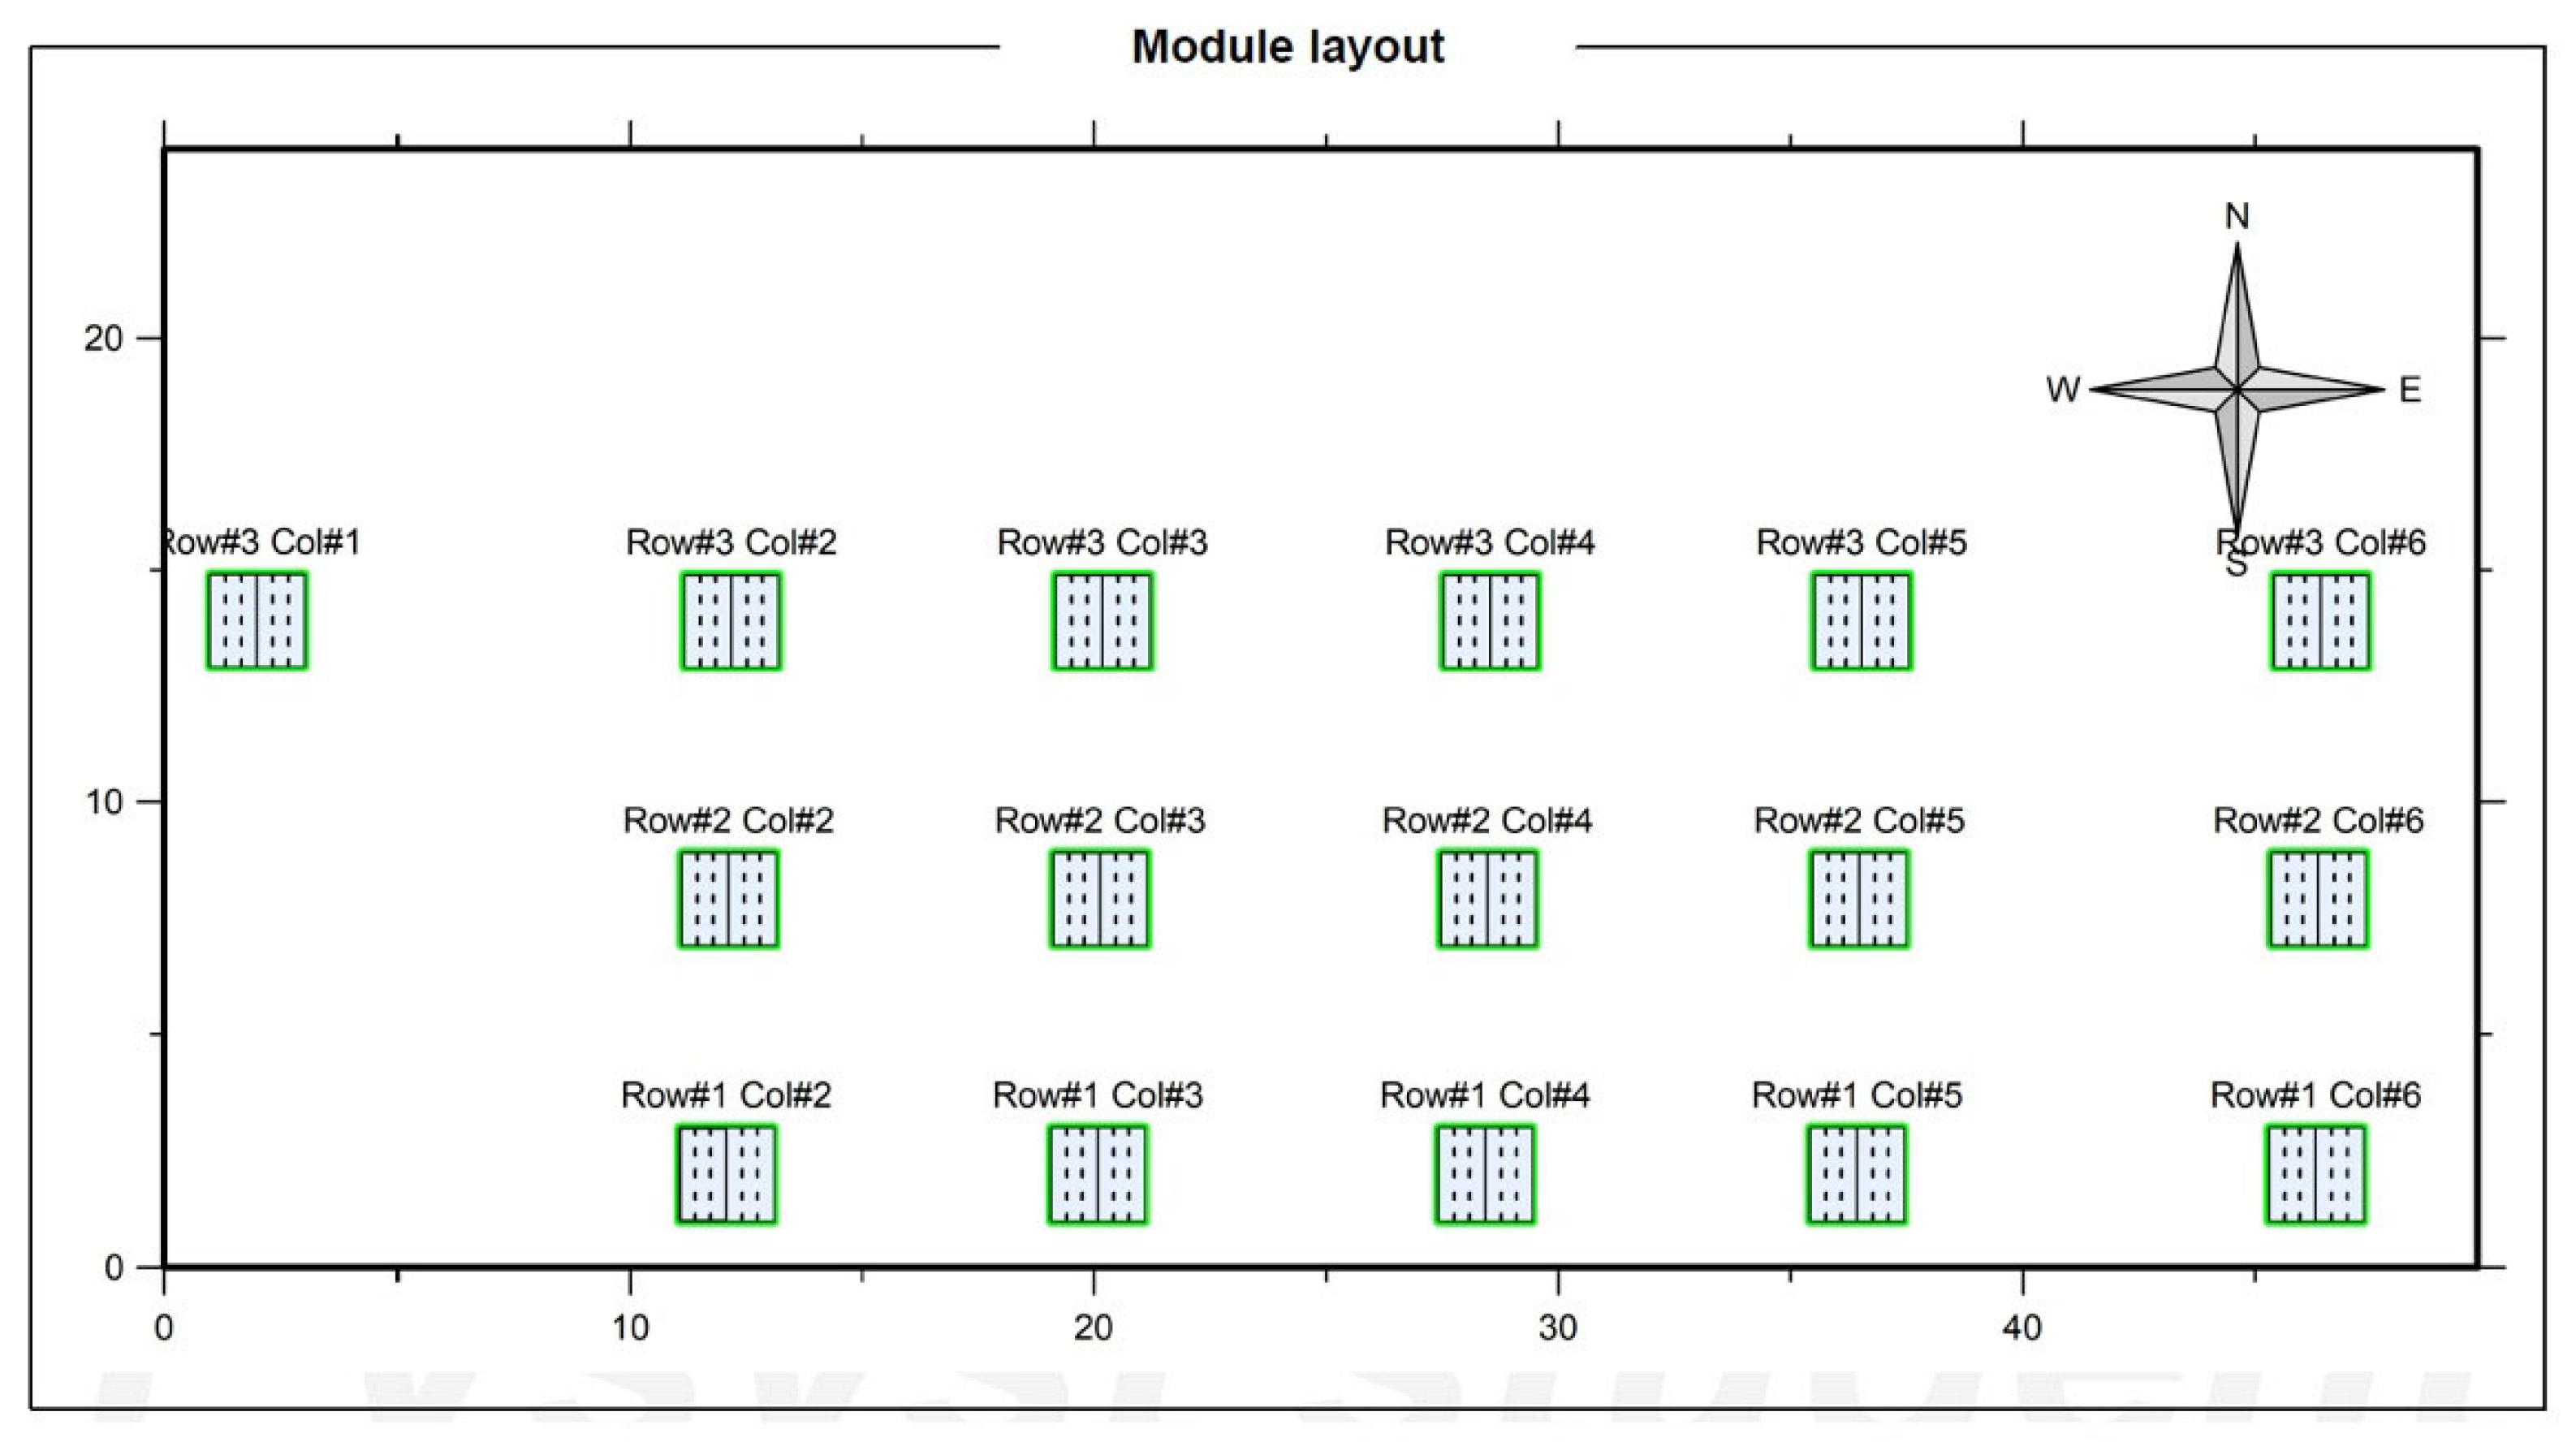
Figure 5.
PV System Energy Flow Diagram.
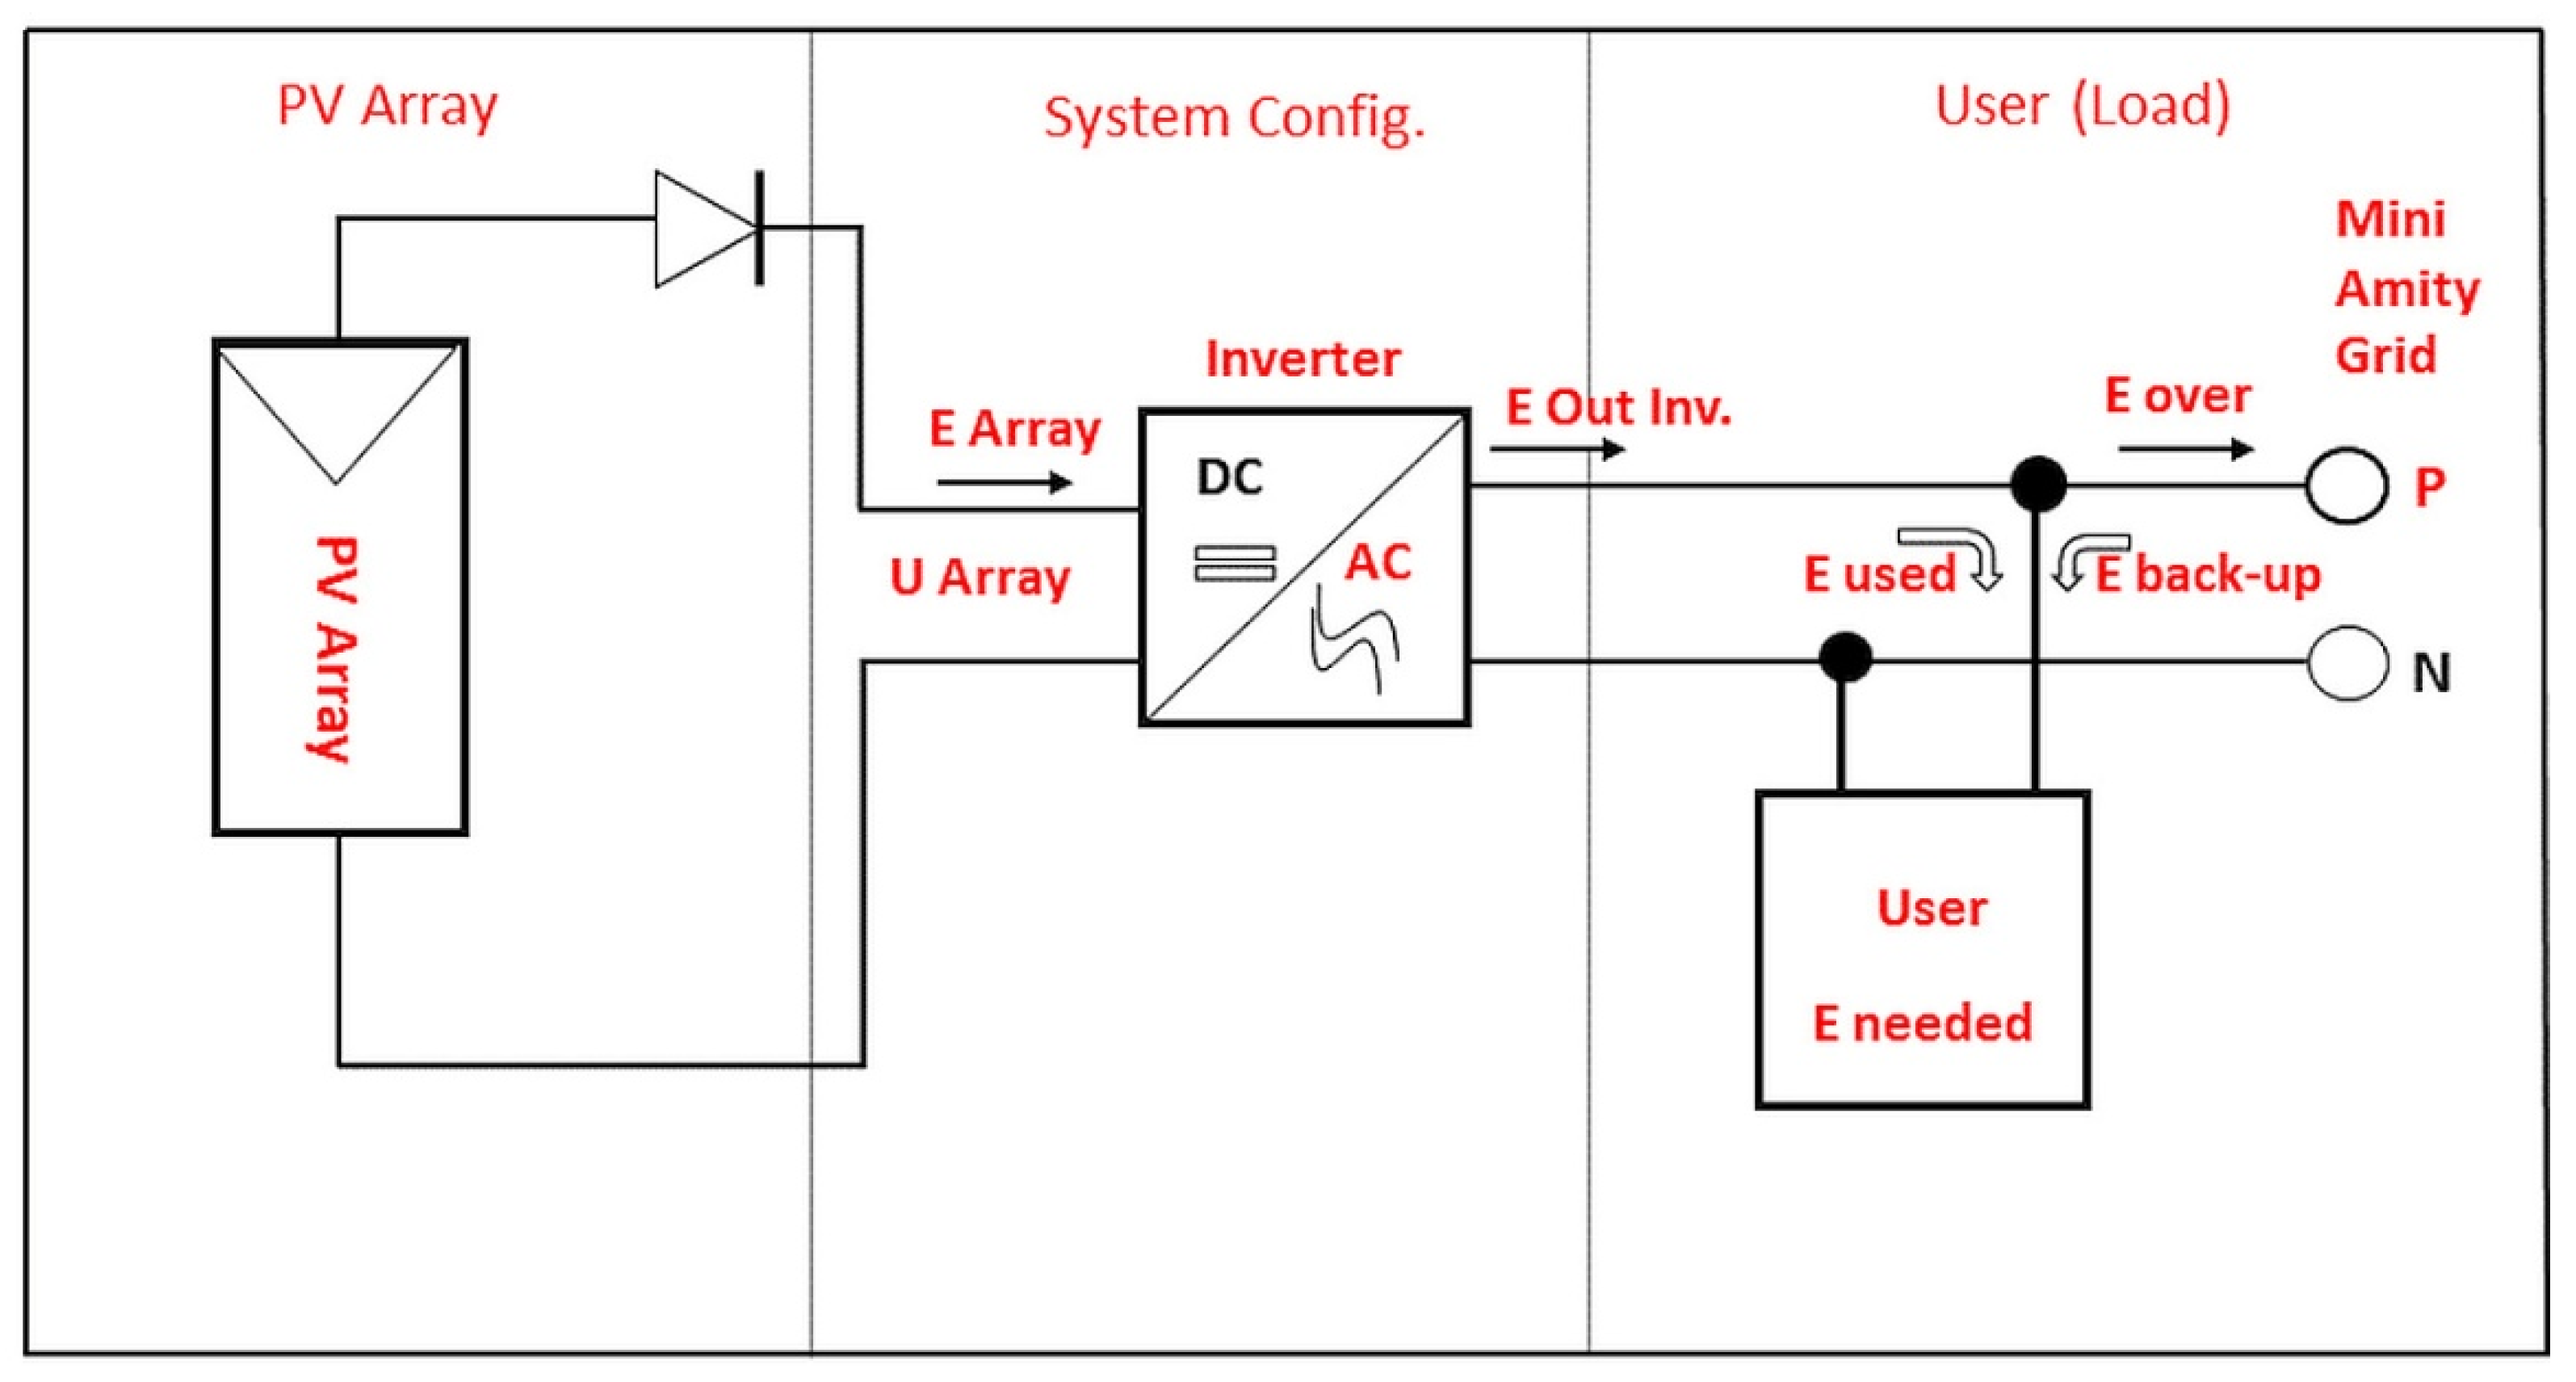
Figure 6.
Image sample of an experiment (Solanum tuberosum) with 8-bit thresholding.
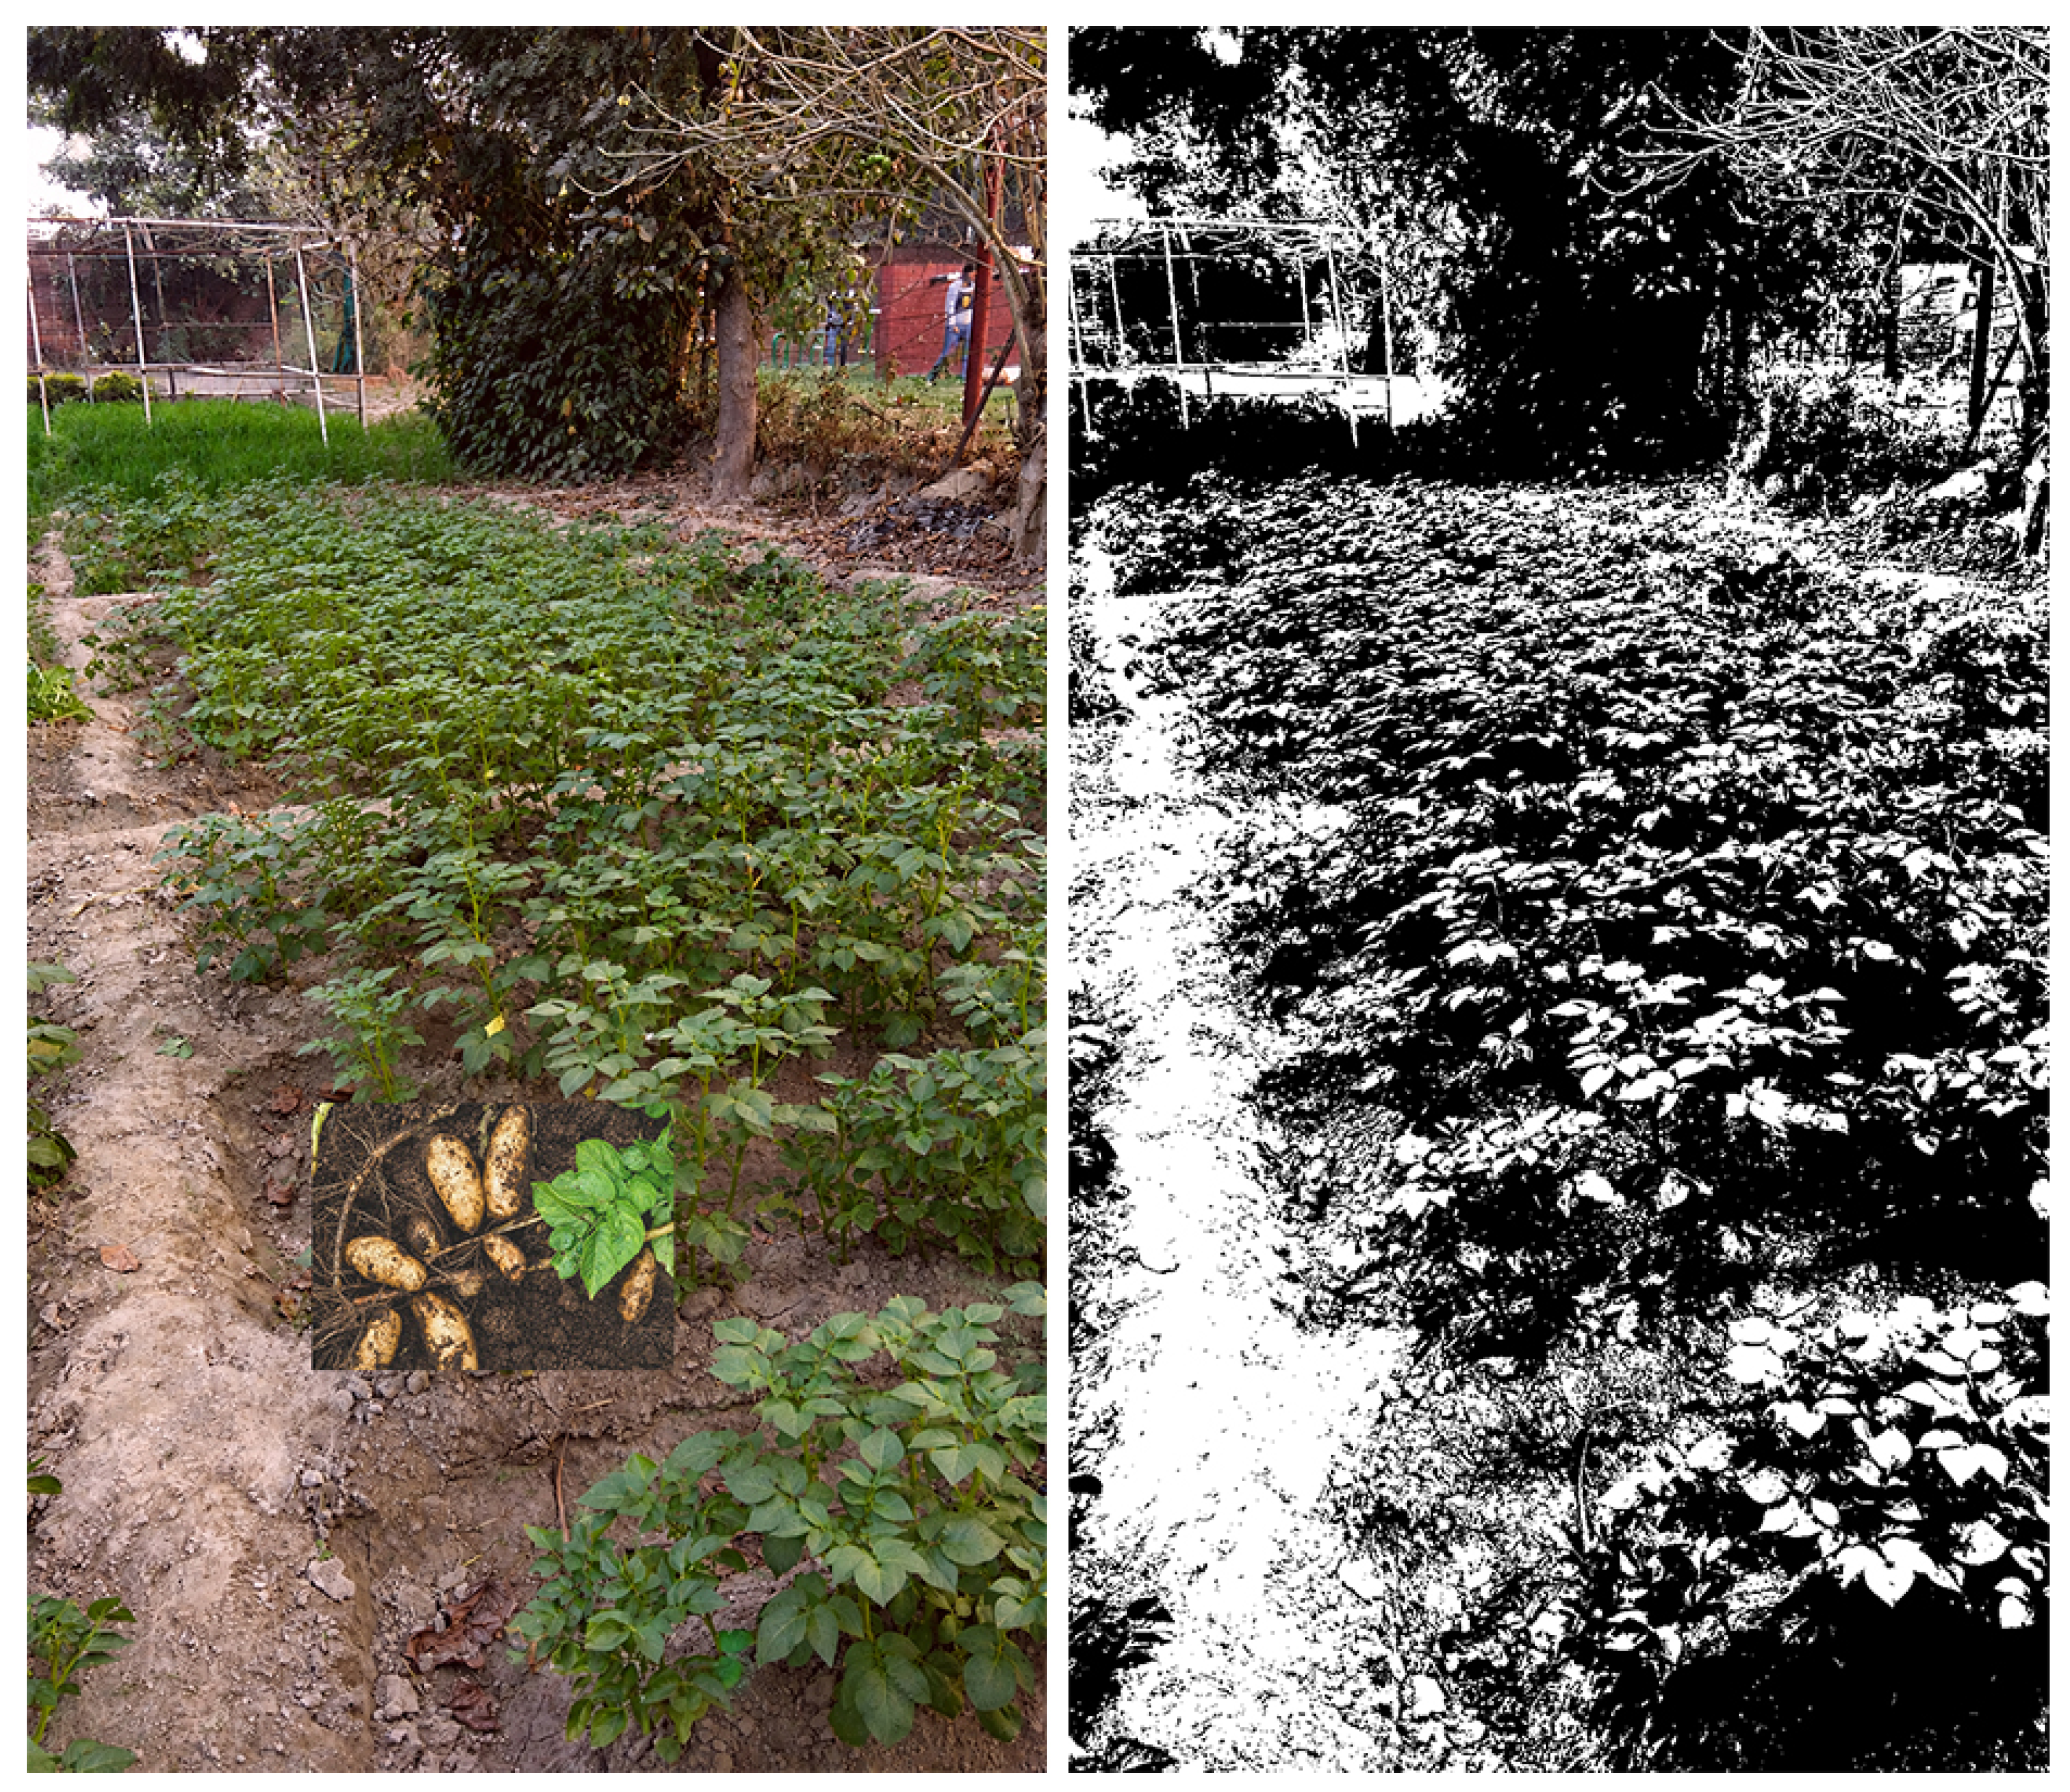
Figure 7.
Variation in SCI from November to March.
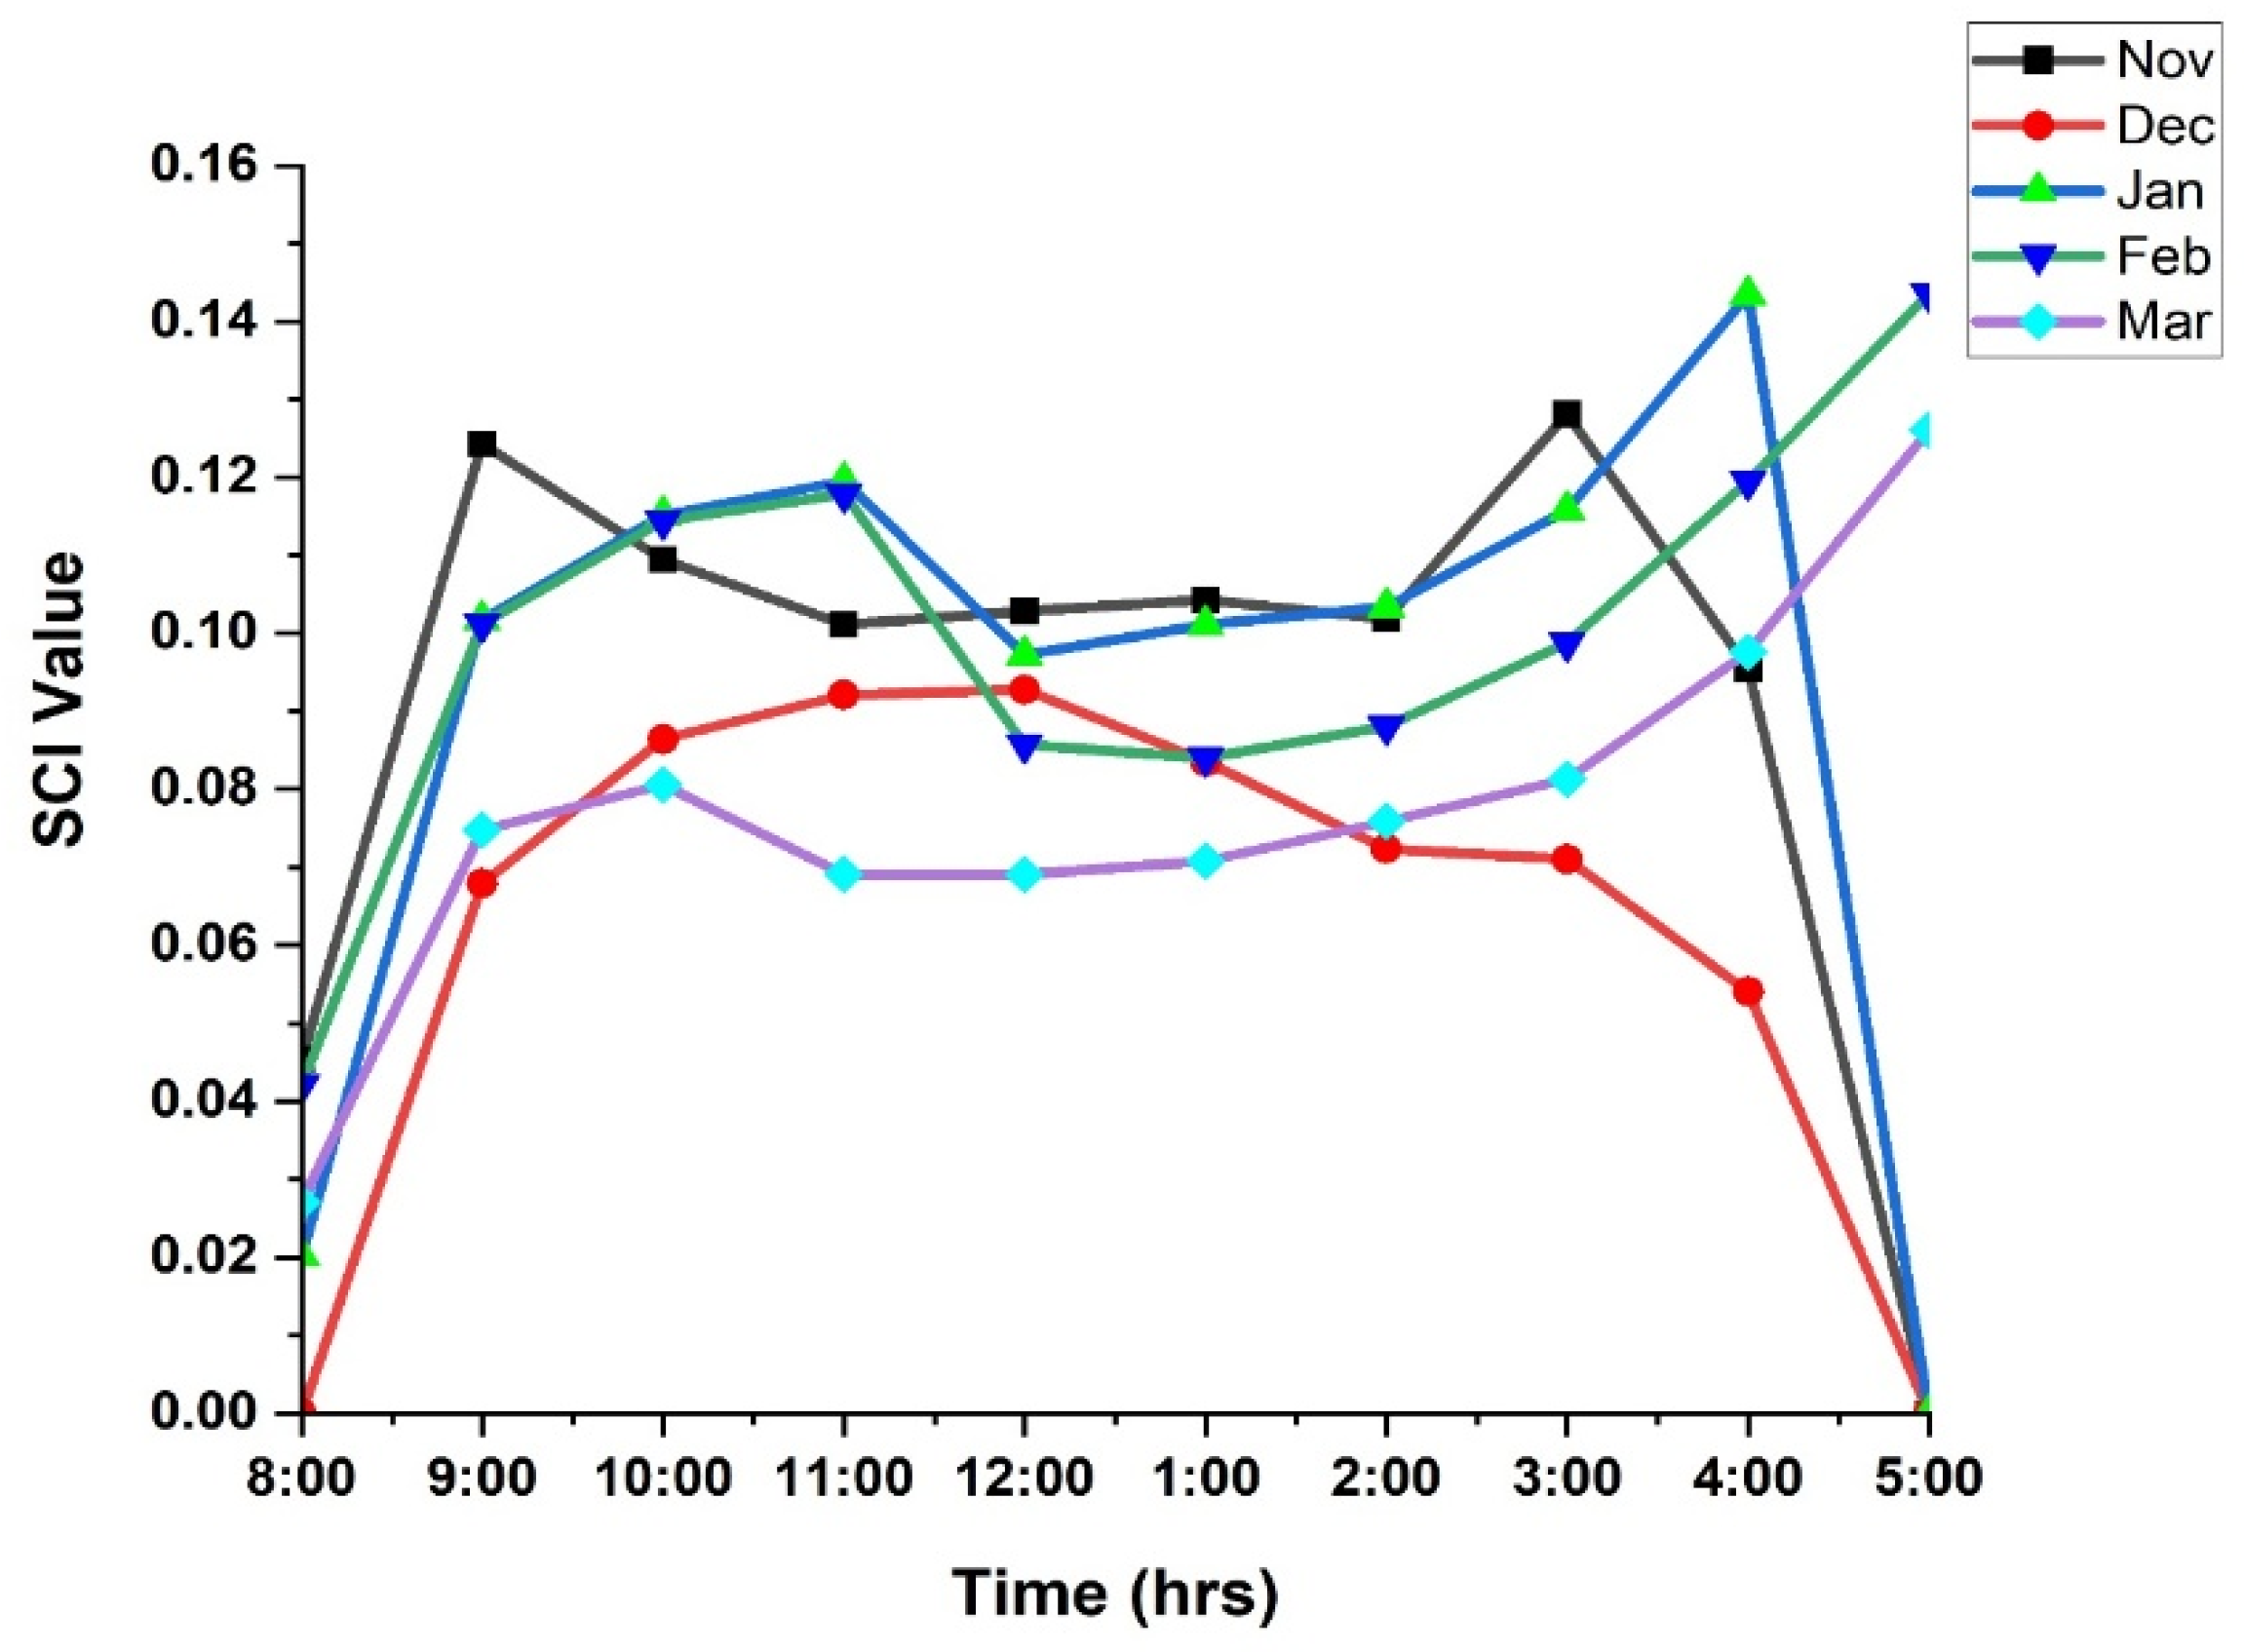
Figure 8.
Comparison of (a) the leaf area of potatoes, (b) the plant height of potatoes, and (c) the number of leaves of potatoes, planted under agrivoltaics with those planted under conventional monocropping system.
Figure 8.
Comparison of (a) the leaf area of potatoes, (b) the plant height of potatoes, and (c) the number of leaves of potatoes, planted under agrivoltaics with those planted under conventional monocropping system.
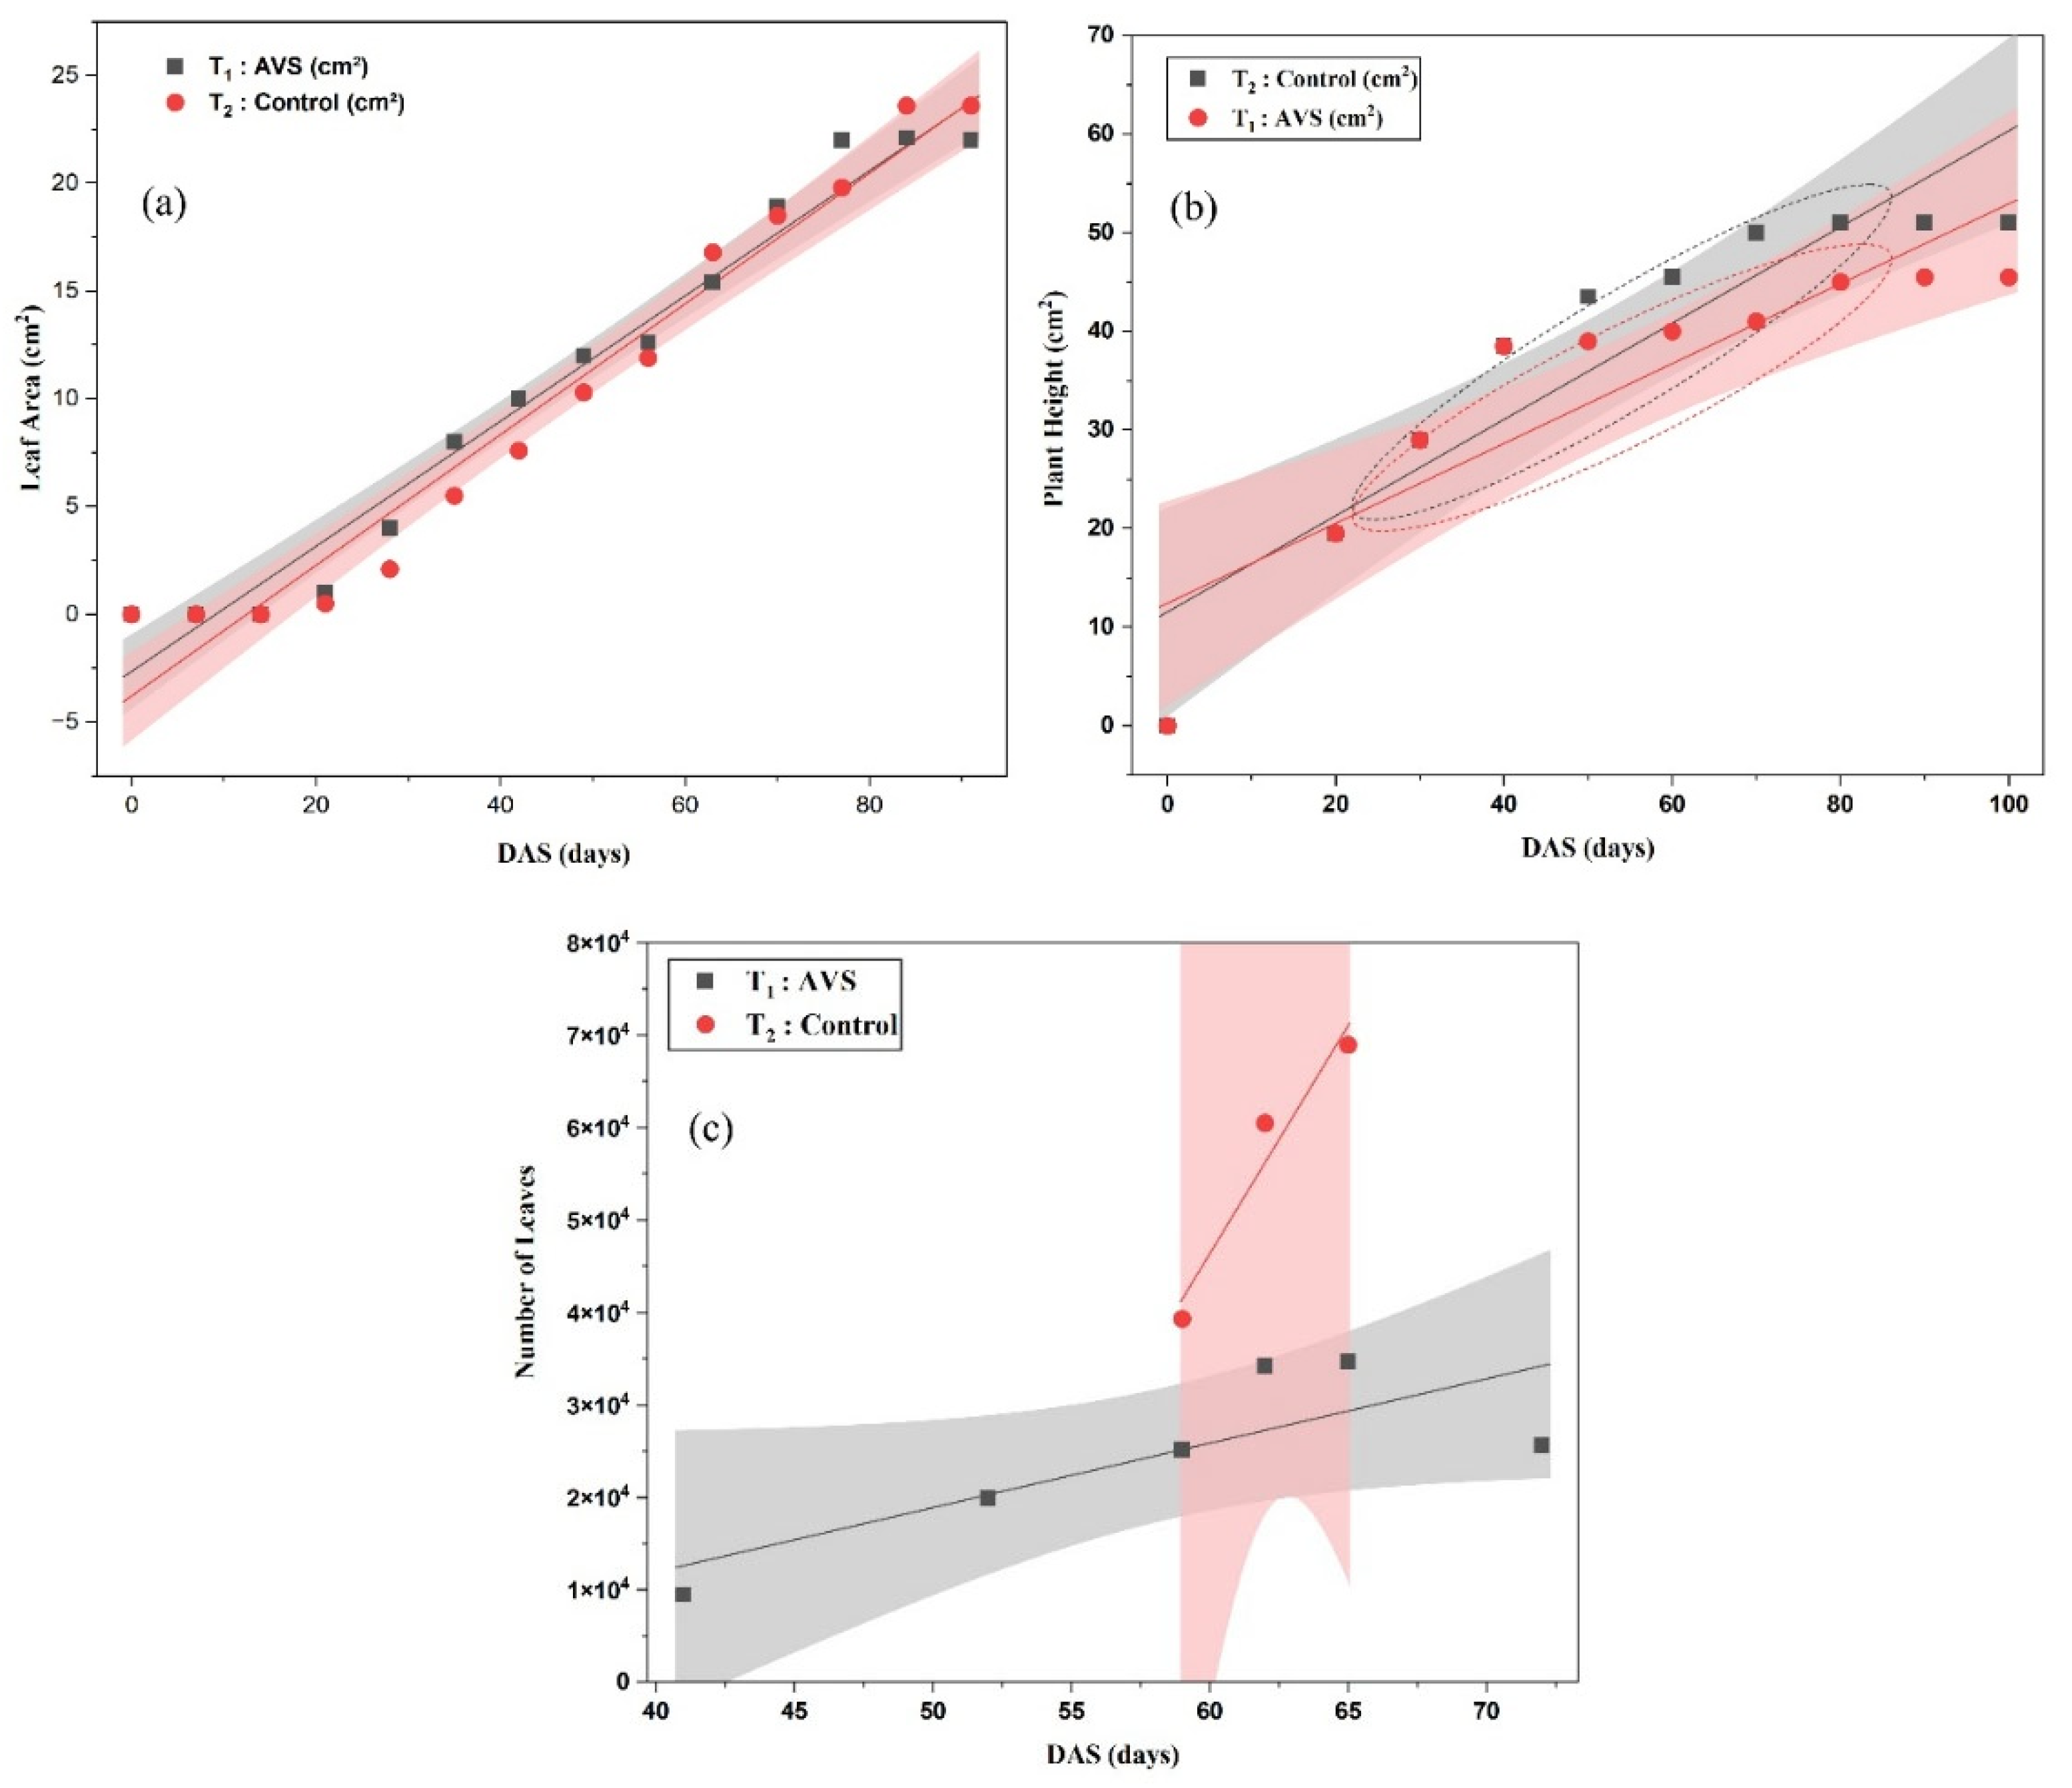
Figure 9.
Comparison of (a) the number of potatoes per stand, (b) the unit weight of potatoes, (c) the dry matter weight of potatoes, and (d) the average yield of potato per plant, planted under agrivoltaics with those planted under conventional monocropping system.
Figure 9.
Comparison of (a) the number of potatoes per stand, (b) the unit weight of potatoes, (c) the dry matter weight of potatoes, and (d) the average yield of potato per plant, planted under agrivoltaics with those planted under conventional monocropping system.
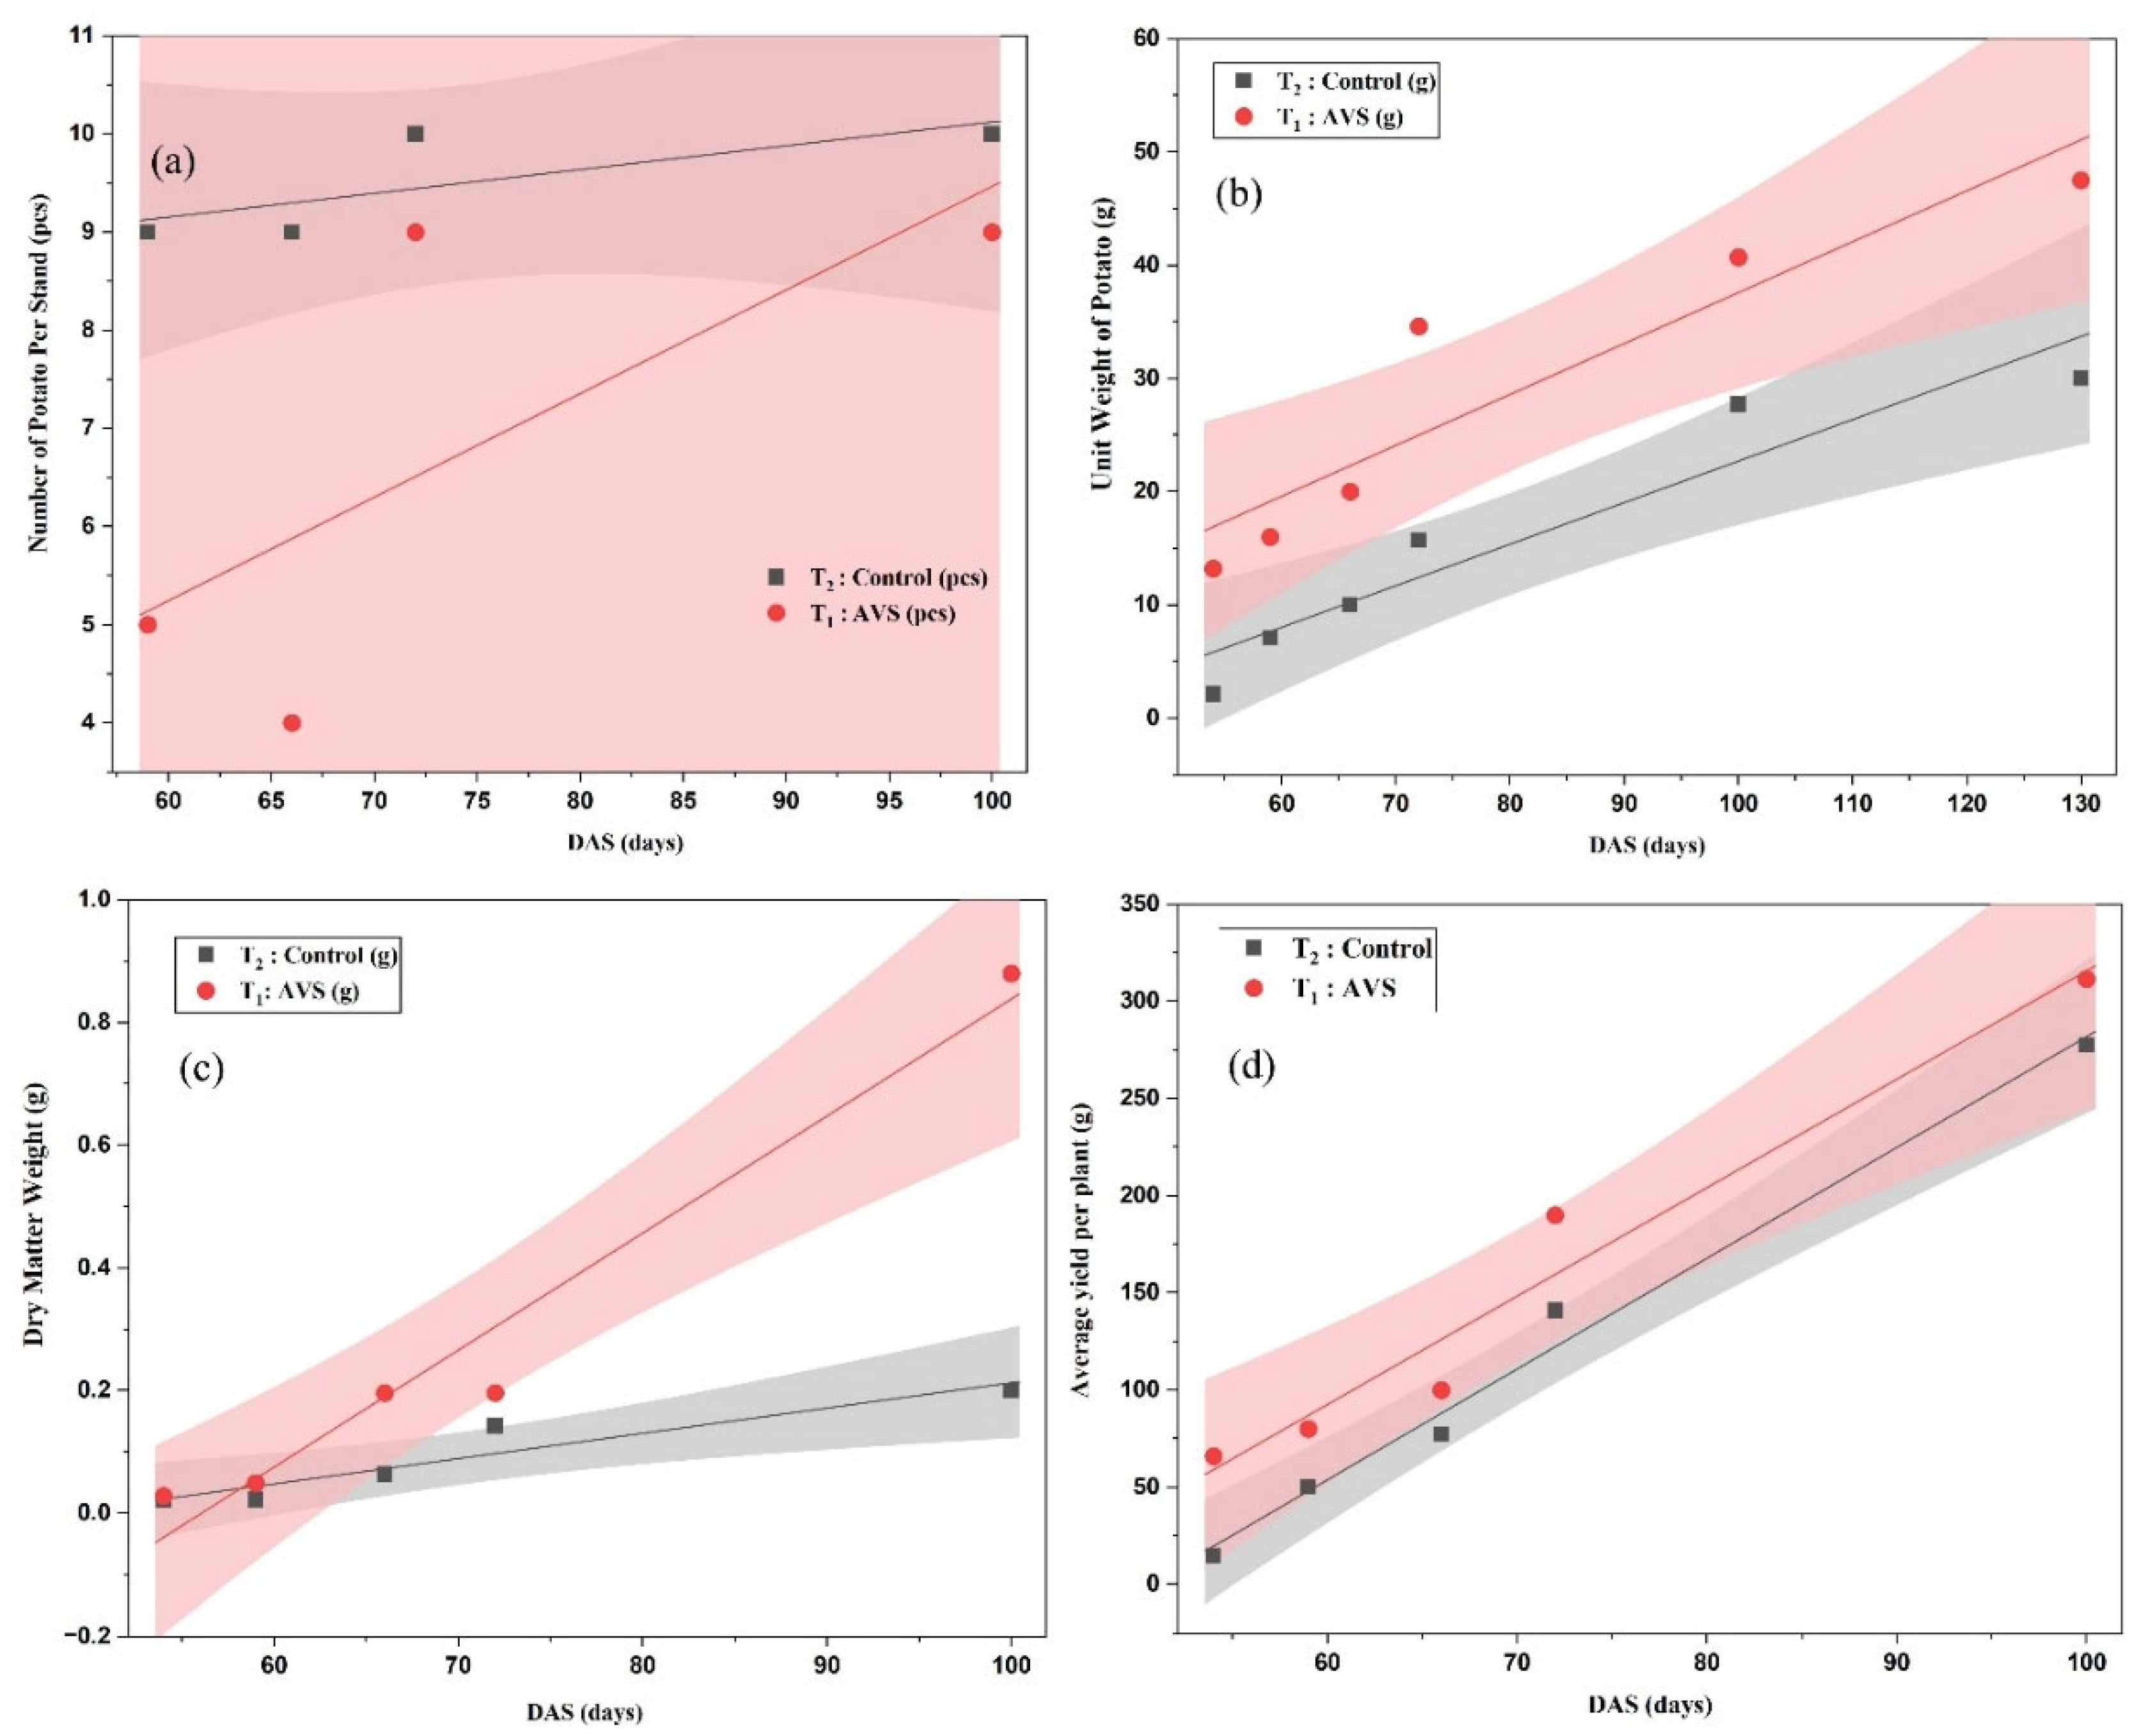
Table 1.
Location Details of the Study Site.
| S. No. | Particulars | Value |
|---|---|---|
| 1. | Site Address | Amity University, Noida |
| 2. | Longitude-Latitude | 28°32′29.44” N 77°19′56.73” E |
| 3. | Solar Radiation/Irradiance (kWh/m2/year) | 1618.87 |
| 4. | Peak Sun Hour | 764 |
| 5. | Available Space | 629 m2 |
| 6. | Ambient Temperature | 28-33 0C |
Table 2.
Climatic/Weather Description of the Site.
| Particulars | Value |
|---|---|
| Coordinate Location | 28.53 0N, 77.39 0E |
| Summer (March–June) Winter (November–February) |
Maximum of 48 °C to a minimum of 30 °C Maximum of 14 0C to a minimum of 7 0C |
| Wind velocity | 1.8 m/s |
| Average annual humidity | 62.1% |
| Global Horizontal Irradiance (GHI) | 1618.8 kWh/m2 |
Table 3.
PV installation design parameters.
| Parameter | Value | Rationale |
|---|---|---|
| Mounting Height (ground to panel lower edge) | 4.0 m | Enhanced air circulation; reduced heat stress; allows passage of agricultural machinery |
| Inter-row Spacing (between PV arrays) | 8.0 m | High lateral light penetration; reduced deep shading; prevents prolonged SCI > 0.2 |
| Panel Tilt Angle | 24° (fixed) | Optimized for winter solar capture at 28°N latitude (Latitude × 0.87) |
| Module Type | Monocrystalline silicon (325 Wp) | High efficiency; widely available |
| Total Installed Capacity | 10.4 kWp | Experimental scale with measurable energy output |
| Ground Coverage Ratio (GCR) | 0.09 | Deliberately low to minimize shading duration |
| Orientation | South-West | Maximizes winter solar irradiance capture |
Table 6.
Agricultural methods pursued during experiment.
| Practice | Details |
|---|---|
| Pre-sowing Irrigation | Deep irrigation two days before planting; fortnightly irrigation until two weeks before harvest; no irrigation during flowering |
| Fertilizer Application | No organic or inorganic fertilizer applied |
| Seed Inoculation | No seed treatment applied |
| Seed Rate | Plant-to-plant distance: 25 cm; Row-to-row distance: 50 cm |
| Weeding and Thinning | Performed 50 and 70 days after sowing (DAS) |
| Harvesting | Continued for two weeks |
Table 7.
Monthly Energy Yield Simulation Results.
| Month | GHI (kWh/m2) | AC Energy (kWh) | Performance Ratio |
|---|---|---|---|
| December | 145.2 | 432 | 0.78 |
| January | 158.7 | 478 | 0.80 |
| February | 168.3 | 510 | 0.82 |
| March | 182.1 | 556 | 0.79 |
| Total/ Average | 654.3 | 1,976 | 0.80 |
Table 8.
Comparative Vegetative Growth Parameters (Mean ± SD).
| Parameter | T2, Control (n=3) | T1, AVS (n=3) | % Change |
|---|---|---|---|
| Plant Height at 90 DAS (cm) | 51.0 ± 2.5 | 45.5 ± 2.8 | -10.8% |
| Leaf Area at 84 DAS (cm2) | 23.6 ± 1.2 | 22.1 ± 1.5 | -6.4% |
| Number of Leaves at 65 DAS | 68,950 ± 4,200 | 34,650 ± 3,800 | -49.8% |
Table 9.
Comparative Yield Attributes (Mean ± SD).
| Parameter | Control (n=3) | AVS (n=3) | % Change |
|---|---|---|---|
| Tubers per Stand | 10.0 ± 0.8 | 9.0 ± 0.9 | -10.0% |
| Unit Weight (g/tuber) | 30.0 ± 3.2 | 47.5 ± 4.1 | +58.3% |
| Dry Matter (g) | 0.200 ± 0.025 | 0.880 ± 0.110 | +340.0% |
| Final Yield (kg/plot) | 15.0 ± 1.8 | 18.3 ± 2.1 | +22.0% |
Table 10.
Land Equivalent Ratio Calculation.
| Parameter | Value | Source |
|---|---|---|
| Potato Yield—Control | 15.0 kg/plot | Field experiment |
| Potato Yield—AVS | 18.3 kg/plot | Field experiment |
| Yield Ratio (Y_AVS / Y_Control) | 1.22 | Calculated |
| Energy Yield—AVS (custom) | 1,976 kWh/year | PVsyst simulation |
| Energy Yield—PV-only | 4,600 kWh/year | PVsyst simulation (theoretical) |
| Energy Ratio (E_AVS / E_PV-only) | 0.43 | Calculated |
| LER | 1.65 | Sum of ratios |
Table 11.
Trade-off Analysis.
| Metric | Represents | Value | Trade-off Role |
|---|---|---|---|
| GCR | PV density on land | 9.44% | ↑ GCR → ↑ energy, ↓ crop yield |
| SCI | Fraction of shaded area/time | < 0.2 | ↑ SCI → microclimate benefit but ↓ irradiance |
| LER | Combined productivity | 1.65 > 1 | LER > 1 → agrivoltaics beneficial |
| Crop Yield (AVS) | Agricultural output | 18.3 kg/plot | Sensitive to shading & crop type |
| Energy Output | Solar PV production | 1,976 kWh/year | Sensitive to irradiance and capacity |
Disclaimer/Publisher’s Note: The statements, opinions and data contained in all publications are solely those of the individual author(s) and contributor(s) and not of MDPI and/or the editor(s). MDPI and/or the editor(s) disclaim responsibility for any injury to people or property resulting from any ideas, methods, instructions or products referred to in the content. |
© 2026 by the authors. Licensee MDPI, Basel, Switzerland. This article is an open access article distributed under the terms and conditions of the Creative Commons Attribution (CC BY) license (http://creativecommons.org/licenses/by/4.0/).
Copyright: This open access article is published under a Creative Commons CC BY 4.0 license, which permit the free download, distribution, and reuse, provided that the author and preprint are cited in any reuse.