

Submitted:
16 September 2026
Posted:
16 September 2026
You are already at the latest version
Abstract
High clean-water throughput does not necessarily translate into rapid fermentation-broth filtration. We hypothesized that a macroporous upstream layer combined with an asymmetric polyethersulfone (PES) membrane could unite rapid filtration at low broth concentration with improved performance under a greater fouling challenge. Development progressed from symmetric and asymmetric manufacturing platforms through layered proof-of-concept tests to a PES composite. Preliminary asymmetric-PES/nitrocellulose assemblies increased average broth flux 4.81-fold at 100-fold dilution and 3.74-fold at 50-fold dilution relative to their respective bare-base controls. A separately cast PES upstream layer was then developed using mixed polyethylene-glycol additives and vapor/non-solvent-induced phase separation. The selected 40-µm layer had an open particulate morphology and a clean-water flux of 146,813 L m⁻² h⁻¹. Its composite filtered 100 mL of 50-fold diluted Escherichia coli broth in 52.35 s versus 185 s for an asymmetric-base reference. Subsequent upstream incorporation of 0.5 wt% acid-form sulfonated PES improved composite broth flux 1.77–2.25-fold despite lower isolated-layer water flux; both tested coupons exceeded two commercial references in the same session. The final PES and PES/sPES-H composites were compared at 50-fold dilution only. These results support the architectural hypothesis and establish a third-generation PES composite through coordinated development of upstream morphology, composition and interlayer contact.
Keywords:
polyethersulfone
; sulfonated PES
; composite membrane
; asymmetric microfiltration
; fermentation broth
; phase separation
; interlayer contact
1. Introduction
Polyethersulfone (PES) microfiltration membranes can be manufactured with a broad range of porous structures by controlling casting-solution composition and phase separation. Experimental studies of hydrophilic PES microfiltration have demonstrated the importance of the additive package and vapor exposure in determining membrane morphology and filtration behavior [1,2,3,4,5]. Macromolecular additives also affect the surface properties, permeability and stability of phase-inversion PES membranes [6,7,8,9,10,11,12]. These variables provide a practical route for developing membranes that combine a controlled nominal grade with high water throughput.
The challenge changes when the feed is a fermentation broth [13,14,15]. A membrane that passes water rapidly may slow markedly when exposed to cells, debris and other broth constituents. Pore blockage and deposit formation provide a physical basis for this difference: the resistance during filtration evolves with the feed and the material already deposited on the membrane. The combined pore-blockage and cake-filtration model of Ho and Zydney [16] and the related blocking-law treatments [17,18,19] describe this coupling for protein and cell microfiltration. In the present development, the relevant engineering question was therefore whether a membrane could retain the fast response observed with dilute broth while avoiding the large performance penalty encountered with a more concentrated broth.
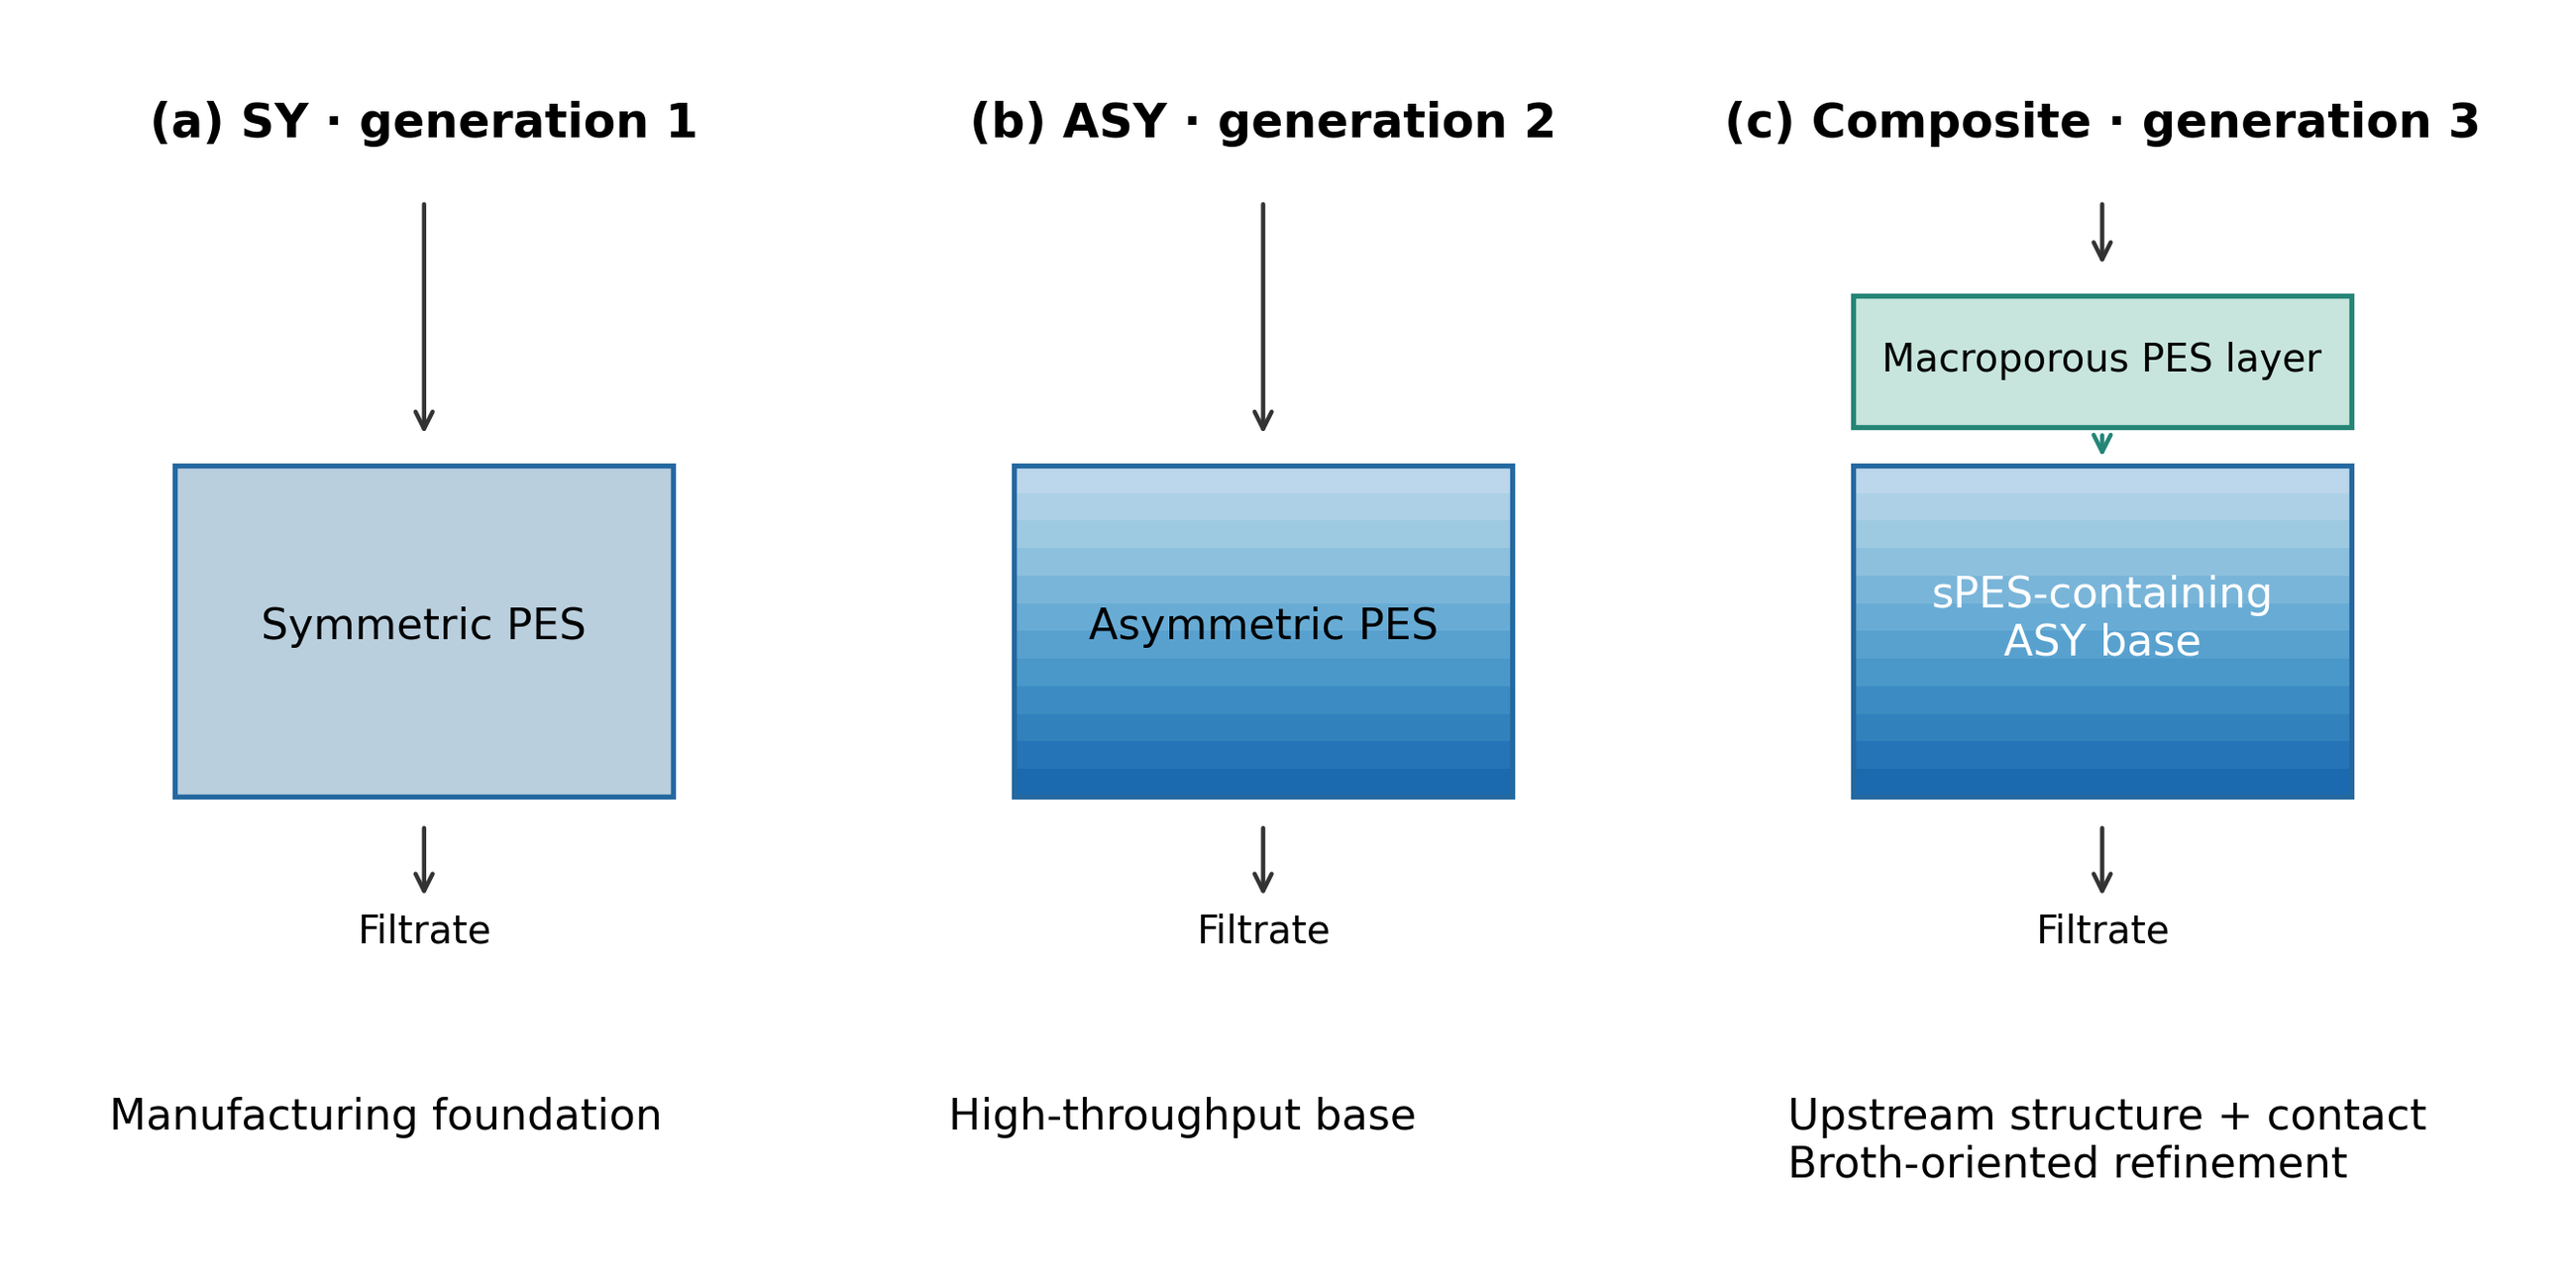
The manufacturing platform was developed in three generations. First-generation symmetric PES membranes (SY) established the casting and pilot-production basis. Second-generation asymmetric membranes (ASY) extended that platform into a higher-throughput manufacturing regime. Both generations included PES-only and sPES-containing formulations; sulfonated PES (sPES) incorporation itself is consequently not the generation boundary. The third generation adds an independently designed macroporous upstream region to an sPES-containing asymmetric base (Figure 1). This architecture permits adjustment of the feed-contacting structure while retaining the established base-manufacturing route.
The original hypothesis was that this composite architecture could combine the strengths sought at both low and higher broth concentrations. In early screening, an in-house ASY sample exceeded the Sartorius reference at 100-fold dilution, whereas a stronger broth challenge exposed the limitations of a single asymmetric sheet. The commercial references also behaved differently: Sartolab 500 (Sartorius) was faster than Stericup (Millipore) at 100-fold dilution, while Stericup was faster at 50-fold dilution in the corresponding screening blocks. These observations defined a practical target: a membrane with rapid dilute-broth filtration and an improved response when more broth material was presented to the membrane. Commercial membranes were used to locate the in-house performance within each comparison, with the same test feed used for the membranes compared in that session.
There is an established rationale for introducing an upstream porous region. Recent work on sterilizing membranes and prefilters showed that an integrated prefilter can improve filtration performance for an mRNA–lipid-nanoparticle feed [20,21,22,23]. Although that feed differs from bacterial broth, it demonstrates that nominal membrane rating alone does not determine application performance [24,25]. Combined vapor-induced and non-solvent-induced phase separation (VIPS/NIPS) has also been used to prepare isotropic macroporous PES components for composite membranes [26]. The present work applies this structural flexibility to a feed-facing layer above an asymmetric microfiltration base, rather than to a support below a newly polymerized selective film.
The use of sPES provides a further compositional variable. PES/sPES blends have been investigated at both membrane and module scales for their mechanical and fouling behavior [27,28,29,30,31,32,33], while recent PES microfiltration work has emphasized the role of surface modification in protein-containing feeds [34,35]. The sPES additive used in the base formulation and its effect on the bubble point–permeability balance of roll-to-roll PES microfiltration membranes are described in a companion study [36]. Here, sPES was already present in the selected ASY base. Acid-form sPES was subsequently introduced into the upstream layer as an additional refinement within the composite architecture. The central contribution is the development and experimental evaluation of that architecture, with the later sPES-H formulation treated as part of the same development sequence.
We report the manufacturing background, the preliminary layered tests at two broth dilutions, the development of a thin macroporous PES layer, and its assembly and comparison with the ASY base and commercial references. The experimental argument follows the original hypothesis: establish the concentration-dependent need, test the benefit of an upstream layer, and implement the concept as a PES composite using controlled formulation, phase separation and contact between the completed membranes.
2. Materials and Methods
2.1. Materials, Datasets and Membrane Designations
PES and in-house sPES were used as membrane-forming polymers. Casting formulations contained polyvinylpyrrolidone (PVP K-30), polyethylene glycol (PEG 200, PEG 400 or PEG 2000), lithium chloride or calcium chloride, and dimethyl sulfoxide (DMSO); ethanol and butanol were used in the selected base formulation. All compositions are expressed as mass percentages of the complete casting dope. The principal formulations are listed in Table 1. Acid-form sPES used in upstream dope 260831-2 is designated sPES-H. The counterion form of the sPES in the historical base-production record is not assigned as H-form.
The historical SY/ASY dataset is the released manufacturing dataset of the companion manufacturing-data study [37]. It contains one consolidated record per casting sample, including formulation, process and performance variables. The standard analysis cohorts comprise 114 SY records from 18 March to 11 November 2024 and 332 ASY records from 16 September 2025 to 8 July 2026. Exact bubble-point and water-throughput measurements are jointly available for 69 and 272 samples, respectively. Missing values were retained; measurements without an observed bubble-through endpoint were excluded from calculations requiring an exact bubble point. Table 2 summarizes the cohorts. Their role here is to establish the manufacturing platform; the composite fabrication and broth comparisons constitute the subsequent experimental development.
ASY-base denotes the sPES-containing asymmetric component. Composite-PES denotes an ASY base combined with a separately formed PES upstream layer, while Composite-sPES-H denotes the corresponding assembly with a PES/sPES-H upstream layer. Original casting identifiers are retained. Initial proof-of-concept assemblies used an in-house nitrocellulose membrane, NC 5K11-5, on an ASY base; these are identified separately as ASY+NC. NC is not a component of the final PES composite. Sartolab 500 (Sartorius) and Stericup (Merck Millipore), both nominal 0.2-µm PES membranes, were the commercial references. All reported reference performance was measured in-house.
2.2. Pilot Manufacture of the Asymmetric Base
The ASY base was manufactured on a continuous roll-to-roll slot-die line with a PET release liner, multistage humidification, aqueous coagulation and a three-zone dryer. The selected dope, 260625-1, contained 11.5 wt% PES, 0.5 wt% sPES, 30 wt% PEG 200, 0.5 wt% PVP K-30, 1 wt% CaCl₂, 5 wt% ethanol, 5 wt% butanol and 46.5 wt% DMSO. Its recorded viscosity was 1146 cP. This composition is also retained in the released dataset as dope lot A-L079.
Base 6G01-4 was produced at a web speed of 0.6 m min⁻¹, with four humidification stages, a NIPS bath set to 50 °C (recorded bath temperature 52 °C) and dryer settings of 50–50–60 °C. The pilot slot-die gap was 300 µm and the recorded membrane width was 502 mm. The remaining dope was used for the subsequent 50-m run 6G01-6 under the same recorded nominal settings. These bases share a dope and process history but retain separate sample identifiers. The upstream layer was placed on the larger-pore face of the base, toward the incoming broth.
2.3. Preparation of the Macroporous Upstream Layer
The early laboratory dope, 260710-1, contained 8 wt% PES, 0.5 wt% LiCl, 6 wt% PVP K-30, 16 wt% PEG 400 and 69.5 wt% DMSO, with a viscosity of 738.8 cP. Films were cast at nominal wet thicknesses of 100 or 150 µm, exposed to humid air for 10 or 20 min, coagulated in water at 40 or 60 °C for 10 min, and dried at 50 °C for 20 min. These conditions produced dry layers of 20–30 µm. The casting matrix and isolated-layer water measurements are reported in Table 3.
The revised formulation, 260728-3, retained 8 wt% PES and 0.5 wt% LiCl, reduced PVP K-30 to 1 wt%, increased PEG 400 to 20 wt%, and introduced 5 wt% PEG 2000, with 65.5 wt% DMSO. Its viscosity was 276 cP. Carrier trials led to selection of polypropylene (PP): an RX600 carrier did not permit release, while a 150-µm wet film on PP folded during coagulation. The selected route used a 250-µm wet casting thickness on PP, 15 min vapor exposure and 20 min aqueous coagulation. The temperature pair 260728-3-5 and 260728-3-6 used 30 and 60 °C baths, respectively, with the other recorded settings held constant. Both were dried at 50 °C for 20 min. PP served as a temporary casting carrier and was removed from the completed membrane.
Later dopes 260811-1 and 260825-1 reproduced the revised PES formulation family. Dope 260825-2 changed PEG 400/PEG 2000 to 15/6 wt%; 260825-3 reduced PES to 7.5 wt%. The subsequent 260831-2 formulation replaced 0.5 wt% of the PES with sPES-H, giving 7.5 wt% PES and 0.5 wt% sPES-H while retaining the principal additive package. Its recorded viscosity was 301 cP. Extending coagulation from 20 to 40 min raised the composite broth flux from 971 to 1129 L m⁻² h⁻¹ (52.35 to 45.02 s for 100 mL) in the 31 July block, and 40-min coagulation was adopted for the later layers. Casting identifiers in the September comparison distinguish individual layer specimens within these dope families.
2.4. Layered Proof of Concept and Composite Assembly
The preliminary ASY+NC tests combined base 6C13-2 with NC 5K11-5, with or without an additional nominal 50-µm mesh. Wet-contact and simply stacked configurations were recorded in the 100-fold-dilution block. The 50-fold block included the bare base, ASY+NC and ASY+NC+mesh. These configurations tested the architectural concept before the independently cast PES upstream layer was established. Table 4 retains the original configurations and elapsed times.
For the final composite route, the PES upstream layer and ASY base were completed separately and assembled with the upstream layer facing the feed. In the later wet-consolidation procedure, the membranes were stacked while wet and 50 mL of deionized water was passed through the pair at a recorded nominal pressure of 1 bar to establish contact. Loose stacks were included for comparison. Wet consolidation describes the assembly procedure and does not imply a permanent adhesive or a measured bond strength.
Attempts to establish contact during coagulation included pretreatment of the base with 20 wt% aqueous glycerol and with 50 wt% DMSO/water for 30 s, 1 min or 5 min. The records followed conformity and separation during immersion and drying. These trials informed the eventual use of wet consolidation after both membranes had formed. Contact comparisons therefore assess the practical assembly condition, which can include differences in wetting and interlayer air as well as conformity.
2.5. Bubble Point, Water Flow and Electron Microscopy
Bubble point was measured using a Palltronic Flowstar IV instrument on deionized-water-wetted coupons pressurized with nitrogen at 22 °C, following the laboratory procedure based on ASTM F316 [38]. The endpoint setting was 7000 mbar; tests without observed bubble-through were recorded as censored. The nominal 0.2-µm designation identifies the ASY base grade. Bubble point and throughput were retained as separate measurements.
Clean-water throughput was determined gravimetrically on 47-mm coupons. The exposed diameter inside the gasket was 40.4 mm, corresponding to a rounded effective area of 12.8 cm². At a water density of 1 g mL⁻¹, a flow of 1 g min⁻¹ corresponds to 46.875 L m⁻² h⁻¹ on that area. Water fluxes in this article use that conversion consistently; source flow rates are retained in the tables. Values are fluxes rather than pressure-normalized permeances because a measured driving pressure is not available for every historical entry.
Scanning electron micrographs were used to compare the surfaces and cross-sections of early and revised upstream layers, an ASY base and the commercial references. In-house images were acquired at 10 kV, with nominal surface magnification of 5000× and cross-section magnifications of 400–2000×, as indicated by the original image metadata. Images from a second instrument were retained for Sartolab 500. Original scale bars were preserved. Each panel is identified by its specimen; separate component cross-sections show the constituent morphologies, not the assembled interlayer boundary. No quantitative pore-size distribution was derived from the displayed fields.
2.6. Broth Filtration and Comparison Basis
Escherichia coli fermentation broth supplied by UNIST was diluted with deionized water. The experimental description identifies the strain as K-12 MG1655. The historical screening and initial layered tests used 100-fold and 50-fold dilutions. These are operationally designated the lower- and higher-concentration conditions; they are relative dilutions of broth, not universal solids-concentration thresholds. The July and September PES-composite comparisons used 50-fold dilution. Broth lots differed between development sessions, including material received in May and a later lot received after the supplier's ion-exchange processing in August. Relative membrane performance was assessed using the same prepared broth for the membranes compared within each experimental block.
A 100-mL charge was filtered in dead-end mode and the elapsed time to completion was recorded. Filtration was vacuum-driven: the recorded setting was a nominal 1 bar, and the 2 September session used house vacuum of approximately −1 bar (gauge) on the filtrate side. Fluxes are calculated from volume, area and time only and are not pressure-normalized. February–July bottle-top tests used effective areas of 70.84 cm² for in-house membranes, 69 cm² for Sartolab 500 and 40 cm² for Stericup. The 2 September comparison was performed on a single day with the same prepared broth, the same 47-mm holder (12.8 cm² effective area) and the same vacuum setting for all membranes, including commercial coupons removed from their housings. Device-specific bottle-top results describe performance in those test configurations; the September comparison provides the common-holder comparison.
The primary performance measure was average flux over the fixed charge, J̄ = V/(At), where V is filtrate volume, A is effective area and t is elapsed time. With V = 100 mL, A in cm² and t in seconds, J̄ = 3,600,000/(At) L m⁻² h⁻¹. Thus, the conversion factors are 50,818.75/t for the in-house bottle-top and 281,250/t for the 47-mm holder. The corresponding volume loads are 14.12 and 78.13 L m⁻². Times and fluxes from these different configurations were not pooled.
For comparisons on a common area and volume, the flux ratio is the inverse elapsed-time ratio, J̄test/J̄reference = treference/ttest. For different bottle-top areas, the stated areas were included explicitly. The absolute mass and composition of broth solids were not used to calculate these ratios. Consequently, relative filtration performance can be quantified within an experimental block without assigning a fully resolved solids concentration to the feed. Commercial membranes serve as measured references for that block.
2.7. Data Processing
Historical cohort summaries were calculated from the canonical CSV files. Broth endpoints were transcribed from the original dilution workbook, the composite-development presentation and the authors' specimen-level comparison tables. Repeated commercial entries are reported individually, and repeated appearances of the same entry in summary columns were not counted as additional experiments. The early July worksheet combines a 2 July header with later casting identifiers; those rows are therefore identified as an earlier development block, while the explicit 31 July block is reported separately.
Ratios describe recorded screening outcomes. The two consolidated sPES-H coupons are separate specimens from one dope, not independent manufacturing-batch replicates. The isolated-layer water range for dope family 0831-2 is a reported range across specimens and is not a confidence interval or a matched water measurement for each broth coupon. Single endpoints are shown without inferential significance tests. Mechanistic explanations are discussed as interpretations of the observed structure, formulation and assembly responses.
3. Results and Discussion
3.1. SY-to-ASY Development Provides a High-Throughput Base
The historical cohorts establish a manufacturing progression that preceded the composite work. SY includes 73 PES-only and 41 sPES-containing records; ASY includes 96 and 236, respectively (Table 2). The structure and processing route, rather than the presence of sPES alone, distinguish these two generations. In the joint bubble-point/throughput subsets, median water flow increased from 290.33 g min⁻¹ for SY to 365.80 g min⁻¹ for ASY, corresponding to approximately 13,609 and 17,147 L m⁻² h⁻¹. Median bubble points were 3733 and 3550 mbar, while median thicknesses across available observations were similar, at 157 and 156 µm.
The approximately 26% water-throughput contrast illustrates the higher-throughput region occupied by the ASY manufacturing platform (Figure 2a). The cohorts span different production periods and formulations, so this comparison is a manufacturing outcome rather than an isolated effect of asymmetry or sPES. It establishes that the third-generation work began with a developed base, not an unoptimized reference film.
The selected 6G01-4 base further improved on the historical ASY median. Its recorded cross-web bubble points were 4100, 4150 and 3700 mbar, with water flows of 511, 611.8 and 595 g min⁻¹, equivalent to approximately 23,953, 28,678 and 27,891 L m⁻² h⁻¹. The related 6G01-6 run used the remaining dope and the same nominal process. These records connect the manufacturing platform to the base component used in the composite experiments.
3.2. Dilution-Dependent Screening Defines the Architectural Hypothesis
The early broth comparisons show why high throughput at low concentration was an incomplete design criterion. At 100-fold dilution, ASY sample 5J20-1 filtered 100 mL in 4.86 s, corresponding to 10,457 L m⁻² h⁻¹ on the in-house bottle-top area. In that screening block, the Sartorius entries were 7684 and 8980 L m⁻² h⁻¹, and the Millipore entries were 5653 and 6470 L m⁻² h⁻¹ (Table 4; Figure 3a). The in-house ASY sample therefore exceeded both references under the recorded lower-concentration condition.
At 50-fold dilution, the corresponding historical ASY entry required 138 s and gave 368 L m⁻² h⁻¹. Sartorius gave 202–237 L m⁻² h⁻¹, whereas Millipore gave 2726–2915 L m⁻² h⁻¹ (Figure 3b). Thus, the ASY membrane retained an advantage over Sartorius but fell well below Millipore in the stronger-broth screening block. The February blocks were measured on different dates, so the change is not used to fit a concentration-response law. The relevant observation is the performance ranking within each block: the low-concentration throughput advantage did not by itself resolve the higher-concentration challenge.
This distinction led to the original composite hypothesis. An open upstream region could alter how broth interacts with the membrane assembly while the asymmetric base supplies the established microfiltration structure. The engineering objective was to maintain rapid filtration in dilute feeds and improve filtration when the feed imposed a larger fouling challenge. The commercial references defined useful performance levels during this development; their catalog specifications were not substituted for measured controls.
3.3. Initial Layered Tests Support the Hypothesis at Both Dilutions
The initial ASY+NC experiments directly tested whether an additional upstream membrane could improve the response at both operational concentration levels. In the 100-fold-dilution block, bare base 6C13-2 required 66.52 s for 100 mL, while wet-contact assembly with NC 5K11-5 required 13.84 s. Average flux increased from 764 to 3672 L m⁻² h⁻¹, a 4.81-fold improvement. A simply stacked ASY+NC entry required 19.31 s, and the assembly with mesh required 19.43 s (Table 4; Figure 3c).
In the 50-fold-dilution block, the bare base required 224.46 s, compared with 60.02 s for ASY+NC. Flux increased from 226 to 847 L m⁻² h⁻¹, a 3.74-fold improvement. The ASY+NC+mesh configuration reached 22.61 s and 2248 L m⁻² h⁻¹, approximately 9.93 times the bare-base value (Figure 3d). The latter stack had a total recorded thickness of 412 µm, compared with 155 µm for the bare base and 335 µm for ASY+NC.
These paired comparisons support the central architectural hypothesis at both tested dilutions: the benefit of an upstream layer was not confined to only the more dilute or the stronger-broth condition. They also show that contact and the arrangement of the layers matter. The NC-based assemblies are an early proof of concept, distinct from the later PES composite. Their role was to establish the value of a layered architecture and motivate an upstream PES component whose thickness, morphology and composition could be developed independently.
3.4. Base Selection Requires Broth Performance as Well as Water Throughput
The April comparison sharpened the selection criterion for the asymmetric base (Table 5). Samples 6C13-2 and 6D14-1 had the same reported bubble point, 3650 mbar, and nearly equal water fluxes, 18,067 and 18,367 L m⁻² h⁻¹. Their 50-fold-broth fluxes differed substantially, at 226.4 and 560.2 L m⁻² h⁻¹, a ratio of 2.47. At 100-fold dilution the recorded values were 847.0 and 952.6 L m⁻² h⁻¹, a ratio of 1.12 (Figure 2b).
The samples differed in polymer composition, dope viscosity and active humidification stages. The combined formulation/process change, rather than any single ingredient, is associated with the better broth response. More importantly for the present design, equal bubble point and almost equal water flux did not predict equal broth filterability. This observation justified retaining broth filtration as the deciding application test while continuing to use water measurements and bubble point for manufacturing characterization.
3.5. Development of a Thin, Open PES Upstream Layer
Transfer of the layered concept to a PES upstream film was not achieved by simple stacking. In the earlier July development block, 6G01-4 alone required 153 s for 100 mL of 50-fold broth. Addition of a separately cast PES layer increased total thickness from 153 to 223 µm and increased filtration time to 351.2 s (Table 6). Early 260710-1 layers also slowed filtration: the V10 and V20 assemblies required 347 s and more than 600 s, respectively. The added porous film could therefore become a net resistance when its structure or assembly was unsuitable.
Reducing thickness alone did not solve this problem. The early 260710-1 formulation produced a 20-µm layer at 100-µm wet casting thickness, but wrinkling occurred after drying. At 150-µm wet casting thickness, the films were approximately 30 µm thick. Their isolated-layer water flow responded strongly to processing: 87.6 g min⁻¹ at 10 min VIPS and 40 °C NIPS, 334.8 g min⁻¹ when the bath was raised to 60 °C, and 808 g min⁻¹ when vapor exposure was extended to 20 min (Table 3). These changes established sensitivity to phase separation but did not guarantee a beneficial composite.
The early surface and cross-section images show a relatively continuous surface perforated by discrete openings above a porous interior (Figure 4a,b). The development record described openings of approximately 1–3 µm, below the intended 10–15 µm design target. This target was a formulation objective, not a measured pore-size distribution for the final membrane. The distinction between an internally porous film and an adequately open external surface was central to the subsequent revision.
The revised 260728-3 dope changed the additive package while retaining 8 wt% PES. Reducing PVP K-30 from 6 to 1 wt%, increasing PEG 400 from 16 to 20 wt% and adding 5 wt% PEG 2000 lowered the recorded viscosity from 738.8 to 276 cP. These constituents changed together, so the outcome is attributed to the formulation package. The sensitivity is consistent with experimental literature on macromolecular additives and combined VIPS/NIPS processing of PES [1,2,6,26]. Carrier release and wet-film handling were addressed at the same time by selecting PP and a 250-µm wet casting thickness.
The matched-temperature pair isolates a useful process contrast within this revised dope. Layer 260728-3-5, coagulated at 30 °C, was 45 µm thick and passed 888 g min⁻¹ of water. At 60 °C, layer 260728-3-6 was 40 µm thick and passed 3132 g min⁻¹, equivalent to 146,813 L m⁻² h⁻¹. The 3.53-fold water-flow increase identified the 60 °C layer as a promising low-resistance upstream component. Its high isolated-layer flux also addressed the dilute-feed design requirement by limiting the hydraulic penalty expected from adding a second layer.
The revised surfaces display an open particulate morphology (Figure 4c,d). A later specimen from the same formulation family, 260811-1-1, shows a comparable surface organization and a porous cross-section (Figure 4e,f). The ASY base, 6H04-3, provides a contrasting, thicker component with a finer surface texture (Figure 4g,h). These images support the distinction between a thin macroporous upstream region and the manufactured base. The SEM base specimen is separate from the 6G01-4/-6 performance specimens, and the later upstream cross-section is not reassigned to the selected July coupon.
The commercial images provide additional morphological context. Sartolab 500 has rounded or elongated openings within a relatively continuous surface above a sponge-like bulk; Stericup presents a more open strut-like surface arrangement (Figure 4i–l). Different fields and scale bars preclude ranking pore sizes from the displayed panel widths. These observations motivate attention to the feed-facing morphology, while the location of broth deposits within each membrane remains an interpretation rather than an SEM result.
3.6. The PES Composite Overcomes the Single-Layer Performance Penalty
The selected upstream layer changed the outcome of assembly. In the explicit 31 July comparison, composite 6G01-4 + 260728-3-6 filtered 100 mL of 50-fold broth in 52.35 s, while the bare 6G01-6 reference required 185 s on the same in-house bottle-top configuration (Table 6; Figure 5a). Average flux increased from 274.7 to 970.7 L m⁻² h⁻¹, a 3.53-fold improvement and a 71.7% reduction in elapsed time. The base identifiers differ, but the manufacturing records connect them to the same dope and nominal process.
The composite was approximately 194 µm thick compared with approximately 150 µm for the base reference. Its improved broth response therefore accompanied an increase in total thickness. Together with the earlier unsuccessful stacks, this result identifies the important change as the developed upstream structure and its assembly, rather than the mere presence of a second membrane or a reduction in total film thickness.
This experiment transfers the benefit first observed with NC-assisted assemblies into the PES composite family. It preserves the existing sPES-containing asymmetric base while adding a thin, independently cast upstream region. The increase in broth flux under a common feed demonstrates the practical result sought from the composite design, without requiring a complete chemical or mass characterization of every broth constituent.
3.7. Interlayer Contact is a Functional Assembly Variable
Attempts to join the membranes during phase separation showed the difficulty of maintaining contact through subsequent processing. Glycerol pretreatment reduced separation during NIPS in the recorded trial, but the membranes separated after drying. The DMSO/water pretreatments were followed by separation upon immersion. These outcomes motivated assembly after the individual layers were complete, followed by wet consolidation.
The September comparisons quantify the importance of the resulting assembly condition (Table 7). For the PES-only family, the wet-consolidated composite required 57.31 s while the loose stack required 153 s, corresponding to approximately 4908 and 1838 L m⁻² h⁻¹. For the sPES-H family, the consolidated entries required 25.45 and 32.33 s, while the loose entry required 40.04 s. Lift-off of the upper layer was observed during filtration of unattached samples. The same practical trend therefore occurred in both formulation families.
Wrinkling, local separation and incomplete wetting can change the area participating in flow and the distribution of liquid entering the base. Interlayer air may also distinguish a dry loose stack from a wet-consolidated pair. These mechanisms were not separated experimentally, but they explain why a highly permeable upstream layer must be evaluated after assembly. The measured result supports control of the complete contact condition rather than a claim of permanent bonding or an isolated adhesion effect.
3.8. Upstream sPES-H Refinement Improves the Common-Feed Comparison
The final refinement introduced sPES-H into the upstream region while retaining the sPES-containing base. Dope 0831-2 contained 7.5 wt% PES and 0.5 wt% sPES-H, corresponding to 6.25 wt% sPES-H in the total membrane-forming polymer fraction. The laboratory record described improved dissolution and a viscosity increase to 301 cP, compared with 292 cP for the PES-only reproduction dope. The isolated-layer water response decreased: 1831–2189 g min⁻¹ for the sPES-H family versus 2672 g min⁻¹ for the PES-only family, an approximately 18–31% reduction (Figure 6a).
Despite that lower water flow, the wet-consolidated sPES-H composites filtered broth faster. In the 2 September common-holder comparison, specimens 0831-2-3 and 0831-2-2 required 25.45 and 32.33 s for 100 mL. Their average broth fluxes were 11,051 and 8699 L m⁻² h⁻¹, compared with 4908 L m⁻² h⁻¹ for PES-only specimen 0825-1-3 (57.31 s). The individual improvements were 2.25-fold and 1.77-fold (Figure 5b and Figure 6b). Both sPES-H specimens were faster than the two commercial references in that session: Stericup required 44.42 s and Sartolab 500 required 208 s. The best composite consequently gave 1.75 and 8.17 times their respective average fluxes.
These comparisons locate the achieved performance relative to commercial membranes using one broth lot, one holder and one effective area. They also show why the upstream formulation could not be selected from clean-water flux alone. The preferred broth formulation had lower isolated-layer water flow yet a higher composite broth flux. The same feed-dependent design principle had already appeared in the base-selection comparison.
The formulation effect is reported at the specimen and assembly level. The sPES-H layers were approximately 48–50 µm thick versus approximately 40 µm for the PES-only family, and the 7.5 wt% PES control without sPES did not have a reported broth endpoint. The observations therefore support the tested sPES-H formulation, without isolating sulfonation from all resulting structural changes. Prior PES/sPES work provides a basis for considering changes in wetting and foulant interaction [27,28], and PES surface-modification studies demonstrate that protein-containing feeds can respond strongly to surface chemistry [34]. A particular electrostatic or adsorption mechanism is not required to establish the measured advantage of the present formulation.
3.9. Interpretation of the Hypothesis and the Third-Generation Contribution
The experiments support the architectural hypothesis through a connected development sequence. The early single-sheet tests established rapid lower-concentration filtration and a performance gap under a stronger broth challenge. The ASY+NC proof-of-concept comparisons then demonstrated improvements at both 100-fold and 50-fold dilution. Developing the PES upstream layer transferred this principle to the intended polymer family, and its common-feed comparison showed a substantial improvement over the ASY base. The subsequent sPES-H and contact comparisons further improved the assembled membrane and placed its performance above the measured commercial references in the September test.
The physical interpretation is that the upstream region changes the evolution of resistance during broth filtration while adding sufficiently little hydraulic resistance of its own. A porous layer can redistribute entry flow, modify where deposits accumulate or delay the concentration of fouling at the finer region of the base. The early unsuccessful PES stacks illustrate the opposite case, in which surface resistance or poor assembly overwhelms any benefit. This interpretation is compatible with pore-blockage/deposit models [16] and with the performance benefits of appropriately selected prefilter structures in other complex feeds [20]. The present SEM and endpoint measurements do not distinguish among these possible deposition mechanisms.
The evidence is most informative when the architectural and formulation questions are kept at their demonstrated levels. Both broth dilutions were tested in the initial layered proof of concept; the final PES and PES/sPES-H specimen comparisons reported here were performed at 50-fold dilution. Accordingly, the results support the original design strategy across the development sequence and establish the final composite's advantage in the tested broth comparisons. They do not assign an unmeasured concentration threshold or a continuous concentration-response curve to the final formulation.
The comparison framework is deliberately application based. A fully resolved broth solids composition is unnecessary for determining which membrane filters the same prepared feed more rapidly under the same test conditions. Lot and device are retained so that these relative results remain interpretable. The fixed-volume endpoints demonstrate improved filtration rate over the specified charge; long-run capacity, product recovery and microbial retention are separate performance attributes. The contribution is a reproducible fabrication concept and a documented improvement in broth filterability, developed from a pilot-manufactured asymmetric platform.
4. Conclusions
A third-generation PES composite membrane was developed by combining an sPES-containing asymmetric base with an independently tailored macroporous upstream layer. The original hypothesis—that a layered architecture could combine rapid dilute-broth filtration with an improved response to a stronger broth challenge—was supported by the development sequence. Initial ASY+NC assemblies increased average flux 4.81-fold at 100-fold dilution and 3.74-fold at 50-fold dilution relative to their corresponding bare-base controls.
The concept was then implemented as a PES composite through coordinated changes in formulation, VIPS/NIPS and layer contact. A 40-µm upstream PES layer with an open particulate morphology reduced the 100-mL endpoint on 50-fold broth from 185 to 52.35 s relative to the same-session ASY-base reference. Subsequent upstream sPES-H incorporation increased composite broth flux a further 1.77–2.25-fold relative to the tested PES-only formulation, despite lower isolated-layer water flux. Both consolidated sPES-H specimens exceeded the two commercial references in the common-holder comparison.
These results establish the practical value of the composite architecture and identify upstream morphology, formulation and wet contact as complementary design variables. They extend the SY-to-ASY manufacturing progression into a broth-oriented membrane platform whose development is guided by measured performance on the intended feed.
Author Contributions
Conceptualization, S.P.; methodology, S.M. and S.P.; investigation, S.M. and J.Y.; resources, J.Y.; data curation, S.M. and S.P.; formal analysis, S.P.; validation, Y.S.; visualization, S.M. and S.P.; writing—original draft preparation, S.M. and S.P.; writing—review and editing, Y.S. and S.P.; supervision, project administration and funding acquisition, S.P.
Funding
This work was supported by the Korea Evaluation Institute of Industrial Technology (KEIT), funded by the Ministry of Trade, Industry and Resources (MOTIR), Republic of Korea, grant No. 00443404.
Institutional Review Board Statement
Not applicable.
Informed Consent Statement
Not applicable.
Data Availability Statement
The historical SY/ASY manufacturing data are those of the companion study [37]; the de-identified datasets (analysis_0p2um_symmetric.csv and analysis_0p2um_asymmetric.csv) will be released with that article and are available to the editors and reviewers on request in the meantime. The formulations, casting conditions and specimen-level broth endpoints supporting the composite study are reported in Table 2, Table 3, Table 4, Table 5, Table 6 and Table 7. Original laboratory workbooks, casting records and microscopy files are maintained by UMTR Co., Ltd. and are available from the corresponding author on reasonable request. The historical data are reused as manufacturing context and are distinguished from the subsequent composite experiments.
Acknowledgments
The authors thank Prof. Sunghoon Park at UNIST for providing the E. coli fermentation broth. Use of Generative AI: ChatGPT (OpenAI) and Claude (Anthropic) were used to assist manuscript organization, language drafting, reference checking, figure preparation and preparation of analysis and plotting code. Numerical results were calculated from the experimental records, and the electron micrographs are the original experimental images. The authors retain responsibility for the scientific interpretation and final manuscript.
Conflicts of Interest
The authors are employees of UMTR Co., Ltd., which develops the membranes described in this work. UMTR has prepared a patent application concerning the macroporous PES composite filter. The commercial membranes were used as in-house experimental references.
References
- Susanto, H.; Stahra, N.; Ulbricht, M. High performance polyethersulfone microfiltration membranes having high flux and stable hydrophilic property. J. Membr. Sci. 2009, 342, 153–164. [Google Scholar] [CrossRef]
- Barzin, J.; Safarpour, M.; Kordkatooli, Z.; Vahedi, M. Improved microfiltration and bacteria removal performance of polyethersulfone membranes prepared by modified vapor-induced phase separation. Polym. Adv. Technol. 2018, 29, 2420–2439. [Google Scholar] [CrossRef]
- Zhao, C.; Xue, J.; Ran, F.; Sun, S. Modification of polyethersulfone membranes – A review of methods. Prog. Mater. Sci. 2013, 58, 76–150. [Google Scholar] [CrossRef]
- Barambu, N. U.; Bilad, M. R.; Bustam, M. A.; Huda, N.; Jaafar, J.; Narkkun, T.; Faungnawakij, K. Development of polysulfone membrane via vapor-induced phase separation for oil/water emulsion filtration. Polymers 2020, 12, 2519. [Google Scholar] [CrossRef] [PubMed]
- Wang, X.; Hao, Z.; Huang, R.; Huang, Y.; Zhang, H.; Hao, X. Seven-channel polyethersulfone hollow-fiber membrane preparation with vapor-induced phase separation. Membranes 2025, 15, 175. [Google Scholar] [CrossRef] [PubMed]
- Susanto, H.; Ulbricht, M. Characteristics, performance and stability of polyethersulfone ultrafiltration membranes prepared by phase separation method using different macromolecular additives. J. Membr. Sci. 2009, 327, 125–135. [Google Scholar] [CrossRef]
- Chakrabarty, B.; Ghoshal, A. K.; Purkait, M. K. Effect of molecular weight of PEG on membrane morphology and transport properties. J. Membr. Sci. 2008, 309, 209–221. [Google Scholar] [CrossRef]
- Guillen, G. R.; Pan, Y.; Li, M.; Hoek, E. M. V. Preparation and characterization of membranes formed by nonsolvent induced phase separation: a review. Ind. Eng. Chem. Res. 2011, 50, 3798–3817. [Google Scholar] [CrossRef]
- Wang, D.-M.; Lai, J.-Y. Recent advances in preparation and morphology control of polymeric membranes formed by nonsolvent induced phase separation. Curr. Opin. Chem. Eng. 2013, 2, 229–237. [Google Scholar] [CrossRef]
- Ismail, N.; Venault, A.; Mikkola, J.-P.; Bouyer, D.; Drioli, E.; Kiadeh, N. Tavajohi Hassan Investigating the potential of membranes formed by the vapor induced phase separation process. J. Membr. Sci. 2020, 597, 117601. [Google Scholar] [CrossRef]
- Khare, V. P.; Greenberg, A. R.; Krantz, W. B. Vapor-induced phase separation—effect of the humid air exposure step on membrane morphology: Part I. Insights from mathematical modeling. J. Membr. Sci. 2005, 258, 140–156. [Google Scholar] [CrossRef]
- Menut, P.; Su, Y. S.; Chinpa, W.; Pochat-Bohatier, C.; Deratani, A.; Wang, D. M.; Huguet, P.; Kuo, C. Y.; Lai, J. Y.; Dupuy, C. A top surface liquid layer during membrane formation using vapor-induced phase separation (VIPS)—Evidence and mechanism of formation. J. Membr. Sci. 2008, 310, 278–288. [Google Scholar] [CrossRef]
- van Reis, R.; Zydney, A. Bioprocess membrane technology. J. Membr. Sci. 2007, 297, 16–50. [Google Scholar] [CrossRef]
- Nagata, N.; Herouvis, K. J.; Dziewulski, D. M.; Belfort, G. Cross-flow membrane microfiltration of a bacterial fermentation broth. Biotechnol. Bioeng. 1989, 34, 447–466. [Google Scholar] [CrossRef] [PubMed]
- Li, S.-L.; Chou, K.-S.; Lin, J.-Y.; Yen, H.-W.; Chu, I.-M. Study on the microfiltration of Escherichia coli-containing fermentation broth by a ceramic membrane filter. J. Membr. Sci. 1996, 110, 203–210. [Google Scholar] [CrossRef]
- Ho, C.-C.; Zydney, A. L. A combined pore blockage and cake filtration model for protein fouling during microfiltration. J. Colloid Interface Sci. 2000, 232, 389–399. [Google Scholar] [CrossRef] [PubMed]
- Hermia, J. Constant pressure blocking filtration laws – application to power-law non-Newtonian fluids. Trans. Inst. Chem. Eng. 1982, 60, 183–187. [Google Scholar]
- Bolton, G.; LaCasse, D.; Kuriyel, R. Combined models of membrane fouling: Development and application to microfiltration and ultrafiltration of biological fluids. J. Membr. Sci. 2006, 277, 75–84. [Google Scholar] [CrossRef]
- Iritani, E. A review on modeling of pore-blocking behaviors of membranes during pressurized membrane filtration. Dry. Technol. 2013, 31, 146–162. [Google Scholar] [CrossRef]
- Messerian, K.; Zverev, A.; Kramarczyk, J. F.; Zydney, A. L. Characterization of sterilizing-grade membranes/prefilters and application to mRNA-LNP process development. Biotechnol. Bioeng. 2026, 123, 164–173. [Google Scholar] [CrossRef] [PubMed]
- Nejatishahidein, N.; Zydney, A. L. Depth filtration in bioprocessing — new opportunities for an old technology. Curr. Opin. Chem. Eng. 2021, 34, 100746. [Google Scholar] [CrossRef]
- Nejatishahidein, N.; Kim, M.; Jung, S. Y.; Borujeni, E. E.; Fernandez-Cerezo, L.; Roush, D. J.; Borhan, A.; Zydney, A. L. Scale-up issues for commercial depth filters in bioprocessing. Biotechnol. Bioeng. 2022, 119, 1105–1114. [Google Scholar] [CrossRef] [PubMed]
- Liu, P.; Hartmann, M.; Shankaran, A.; Li, H.; Welsh, J. Combining descriptive and predictive modeling to systematically design depth filtration-based harvest processes for biologics. Biotechnol. Bioeng. 2024, 121, 2924–2935. [Google Scholar] [CrossRef] [PubMed]
- Badmington, F.; Wilkins, R.; Payne, M.; Honig, E. S. Vmax testing for practical microfiltration train scale-up in biopharmaceutical processing. BioPharm 1995, 8, 46–52. [Google Scholar]
- Dippel, J.; Handt, S.; Hansmann, B.; Loewe, T. Scalability of sterilizing-grade filters in different filtration modes. PDA J. Pharm. Sci. Technol. 2020, 74, 644–659. [Google Scholar] [CrossRef] [PubMed]
- ElSherbiny, I. M. A.; Ghannam, R.; Khalil, A. S. G.; Ulbricht, M. Isotropic macroporous polyethersulfone membranes as competitive supports for high performance polyamide desalination membranes. J. Membr. Sci. 2015, 493, 782–793. [Google Scholar] [CrossRef]
- Fang, L.; Yang, H.; Cheng, L.; Kato, N.; Jeon, S.; Takagi, R.; Matsuyama, H. Effect of molecular weight of sulfonated poly(ether sulfone) (SPES) on the mechanical strength and antifouling properties of poly(ether sulfone)/SPES blend membranes. Ind. Eng. Chem. Res. 2017, 56, 11302–11311. [Google Scholar] [CrossRef]
- Fang, L.; Kato, N.; Yang, H.; Cheng, L.; Hasegawa, S.; Jeon, S.; Matsuyama, H. Evaluating the antifouling properties of poly(ether sulfone)/sulfonated poly(ether sulfone) blend membranes in a full-size membrane module. Ind. Eng. Chem. Res. 2018, 57, 4430–4441. [Google Scholar] [CrossRef]
- Li, Y.; Chung, T.-S. Exploration of highly sulfonated polyethersulfone (SPES) as a membrane material with the aid of dual-layer hollow fiber fabrication technology for protein separation. J. Membr. Sci. 2008, 309, 45–55. [Google Scholar] [CrossRef]
- Tavangar, T.; Ashtiani, F. Zokaee; Karimi, M. Morphological and performance evaluation of highly sulfonated polyethersulfone/polyethersulfone membrane for oil/water separation. J. Polym. Res. 2020, 27, 252. [Google Scholar] [CrossRef]
- Noor, N.; Koll, J.; Scharnagl, N.; Abetz, C.; Abetz, V. Hollow fiber membranes of blends of polyethersulfone and sulfonated polymers. Membranes 2018, 8, 54. [Google Scholar] [CrossRef] [PubMed]
- Wen, X.; He, C.; Hai, Y.; Ma, R.; Sun, J.; Yang, X.; Qi, Y.; Wei, H.; Chen, J. Fabrication of an antifouling PES ultrafiltration membrane via blending SPSF. RSC Adv. 2022, 12, 1460–1470. [Google Scholar] [CrossRef] [PubMed]
- Meng, N.; Mi, J.; Chen, X.; Liu, J.; Zhu, H.; Zheng, X. Preparation of highly antibacterial polyethersulfone/sulfonated polyethersulfone blend composite membrane and research on its dye separation performance. Molecules 2025, 30, 781. [Google Scholar] [CrossRef] [PubMed]
- Yun, K. H.; Sim, S.; Hong, H. S.; Jeong, K. J.; Bae, T. H. Optimizing PES microfiltration membranes for sterile filtration: A comparative study of polydopamine coating in acidic and basic conditions to minimize protein adsorption. J. Membr. Sci. 2025, 713, 123398. [Google Scholar] [CrossRef]
- Yun, K. H.; Sim, S.; Jeong, C.; Jeong, K. J.; Bae, T. H. Hydrophilic modification of PES microfiltration membranes via tannic acid/silica coating for enhanced sterile filtration. J. Membr. Sci. 2026, 740, 124969. [Google Scholar] [CrossRef]
- Moon, S.; Yoo, J.; Park, S.; Lee, M.-H. Effect of a sulfonated poly(ether sulfone) additive on the bubble point–permeability trade-off of polyethersulfone microfiltration membranes prepared by roll-to-roll vapor-induced phase separation; Materials; manuscript ID materials-4571307, 2026. [Google Scholar]
- Park, S.; Moon, S.; Yu, J.; Shin, Y. Multi-level explainable machine learning of pilot-scale manufacturing data separates the control axes of water flow rate and bubble point in asymmetric PES microfiltration membranes The de-identified 0.2-µm symmetric and asymmetric datasets (analysis_0p2um_symmetric.csv; analysis_0p2um_asymmetric.csv) will be released with that article. submitted (manuscript ID 1450492); J. Appl. Polym. Sci. 2026. [Google Scholar]
- ASTM International. ASTM F316-03(2019): Standard Test Methods for Pore Size Characteristics of Membrane Filters by Bubble Point and Mean Flow Pore Test; ASTM International. West Conshohocken, PA, USA, 2019. [CrossRef]
Figure 1.
Development from SY to ASY and the third-generation composite. The asymmetric base is oriented with its larger-pore face toward the feed. The separately cast macroporous PES layer is placed upstream and wet-consolidated onto the base. Schematic cross-sections show pore space in white and polymer in grey; pore-size gradients are indicative, layer thicknesses are drawn to a common scale and pore sizes are not. (d,e) SEM cross-sections of the ASY base (6H04-3, ×400) and of an upstream layer (260811-1-1, ×1500).
Figure 1.
Development from SY to ASY and the third-generation composite. The asymmetric base is oriented with its larger-pore face toward the feed. The separately cast macroporous PES layer is placed upstream and wet-consolidated onto the base. Schematic cross-sections show pore space in white and polymer in grey; pore-size gradients are indicative, layer thicknesses are drawn to a common scale and pore sizes are not. (d,e) SEM cross-sections of the ASY base (6H04-3, ×400) and of an upstream layer (260811-1-1, ×1500).
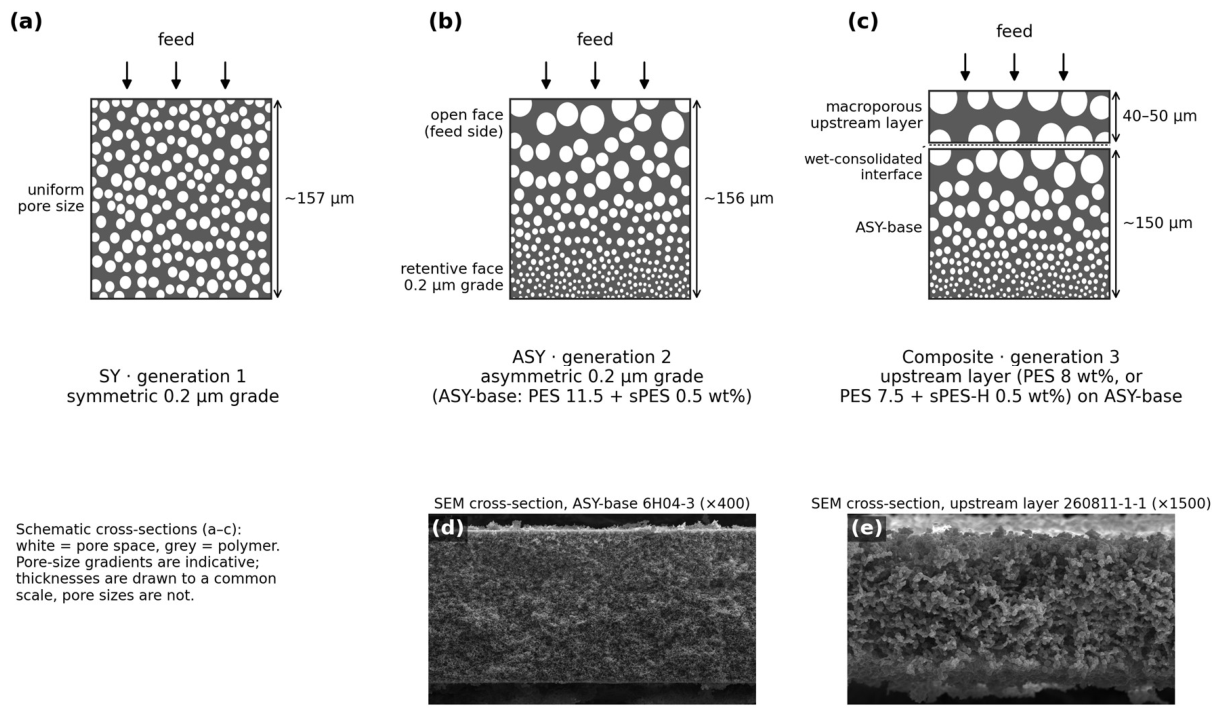
Figure 2.
Manufacturing platform and feed-dependent base selection. (a) Bubble point versus clean-water flux for the joint-measurement subsets of the historical SY (n = 69) and ASY (n = 272) cohorts; diamonds mark cohort medians. (b) Reported average broth flux of the eight April 2026 base-development samples at 50-fold and 100-fold dilution, with PES/sPES content; 6C13-2 and 6D14-1 (bold) share a bubble point of 3650 mbar. The two panels represent separate datasets and are not pooled.
Figure 2.
Manufacturing platform and feed-dependent base selection. (a) Bubble point versus clean-water flux for the joint-measurement subsets of the historical SY (n = 69) and ASY (n = 272) cohorts; diamonds mark cohort medians. (b) Reported average broth flux of the eight April 2026 base-development samples at 50-fold and 100-fold dilution, with PES/sPES content; 6C13-2 and 6D14-1 (bold) share a bubble point of 3650 mbar. The two panels represent separate datasets and are not pooled.
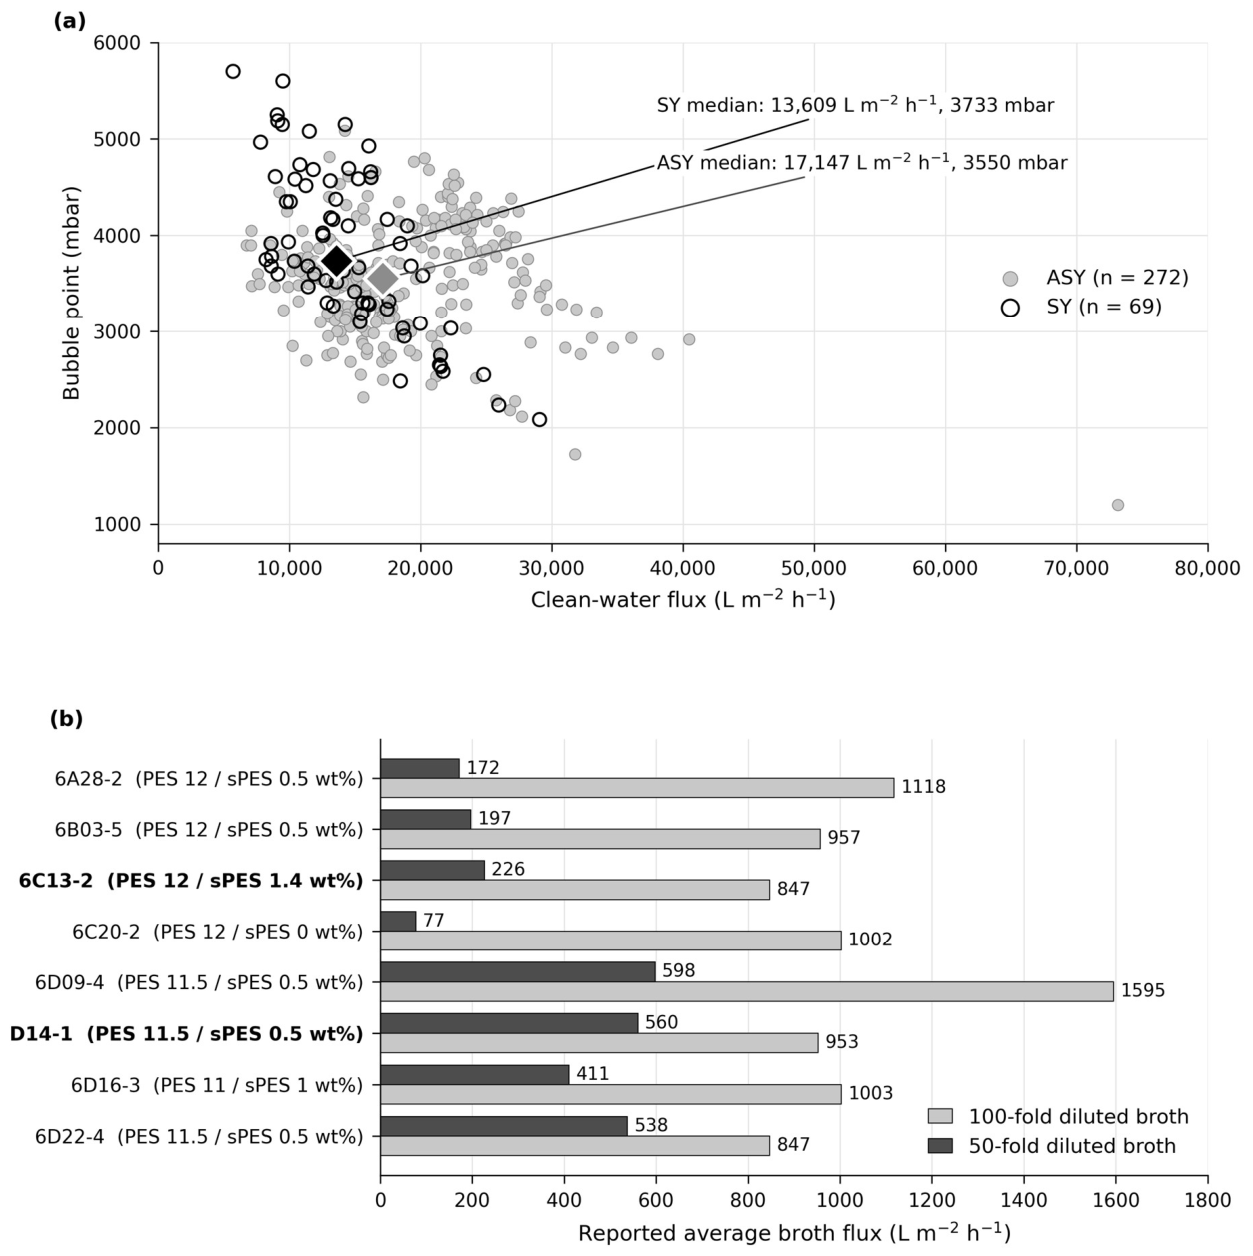
Figure 3.
Dilution-dependent reference screening and architectural proof of concept. (a,b) ASY 5J20-1 and commercial references in the separate February 100-fold and 50-fold blocks. (c,d) March ASY+NC comparisons at 100-fold and 50-fold dilution. All endpoints are for 100 mL; areas are listed in Table 4. NC assemblies are the preliminary layered designs, not the final PES composite. Bars represent individual recorded entries, with no inferred replicate uncertainty.
Figure 3.
Dilution-dependent reference screening and architectural proof of concept. (a,b) ASY 5J20-1 and commercial references in the separate February 100-fold and 50-fold blocks. (c,d) March ASY+NC comparisons at 100-fold and 50-fold dilution. All endpoints are for 100 mL; areas are listed in Table 4. NC assemblies are the preliminary layered designs, not the final PES composite. Bars represent individual recorded entries, with no inferred replicate uncertainty.
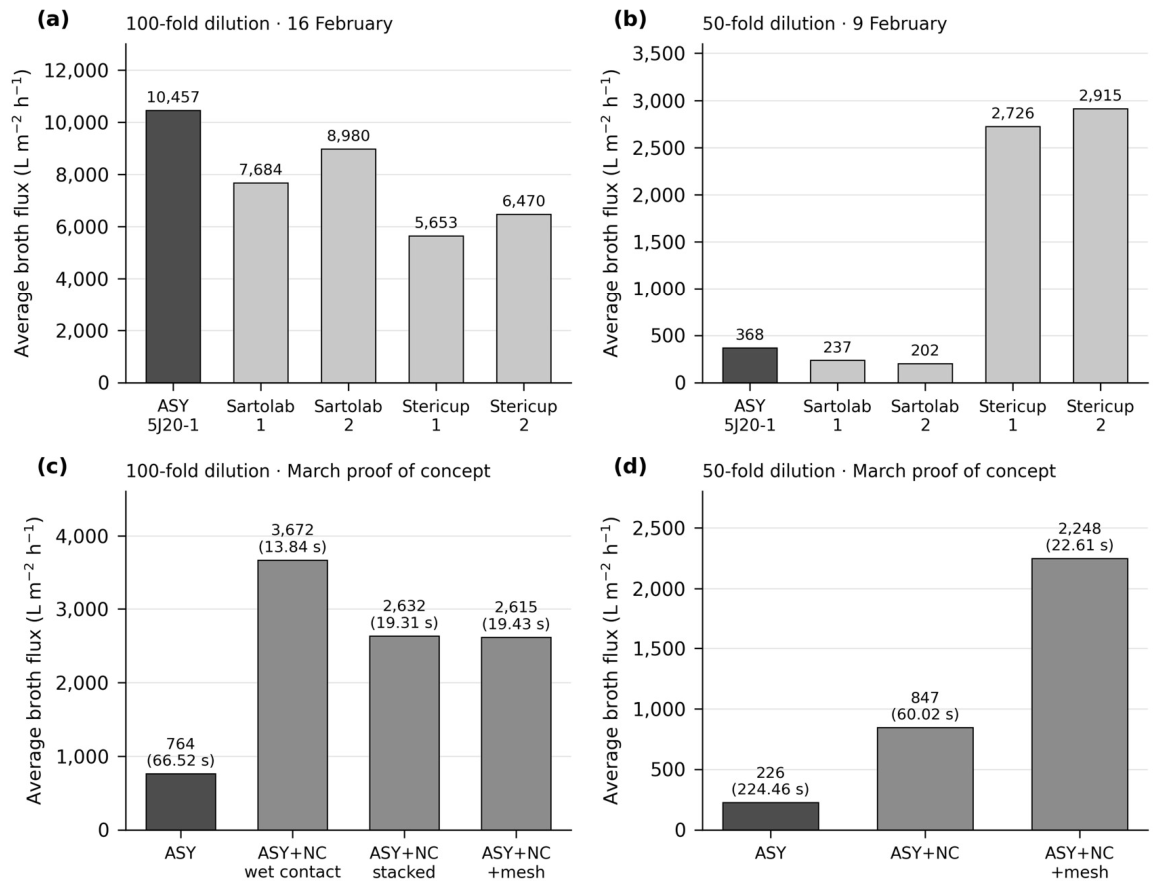
Figure 4.
Upstream-layer, base and commercial-reference morphology. (a,b) Early 260710-1-1 surface and cross-section; (c,d) revised 260728-3-5 (30 °C NIPS) and 260728-3-6 (60 °C NIPS) surfaces; (e,f) later 260811-1-1 surface and cross-section. Original scale bars: a,c,d,e, 2 µm; b, 5 µm; f, 10 µm. The original SEM fields, panel labels and instrument metadata are preserved. The later cross-section is a separate specimen from the selected July layer. (g,h) ASY base 6H04-3 surface and cross-section; (i,j) Sartolab 500; (k,l) Stericup. Original scale bars: g,k, 2 µm; h,l, 20 µm; i, 10 µm; j, 100 µm. Commercial panels have different fields and scales. Base 6H04-3 is a morphological specimen distinct from the 6G01-4/-6 performance bases. These images show separate components and do not show the assembled interface.
Figure 4.
Upstream-layer, base and commercial-reference morphology. (a,b) Early 260710-1-1 surface and cross-section; (c,d) revised 260728-3-5 (30 °C NIPS) and 260728-3-6 (60 °C NIPS) surfaces; (e,f) later 260811-1-1 surface and cross-section. Original scale bars: a,c,d,e, 2 µm; b, 5 µm; f, 10 µm. The original SEM fields, panel labels and instrument metadata are preserved. The later cross-section is a separate specimen from the selected July layer. (g,h) ASY base 6H04-3 surface and cross-section; (i,j) Sartolab 500; (k,l) Stericup. Original scale bars: g,k, 2 µm; h,l, 20 µm; i, 10 µm; j, 100 µm. Commercial panels have different fields and scales. Base 6H04-3 is a morphological specimen distinct from the 6G01-4/-6 performance bases. These images show separate components and do not show the assembled interface.
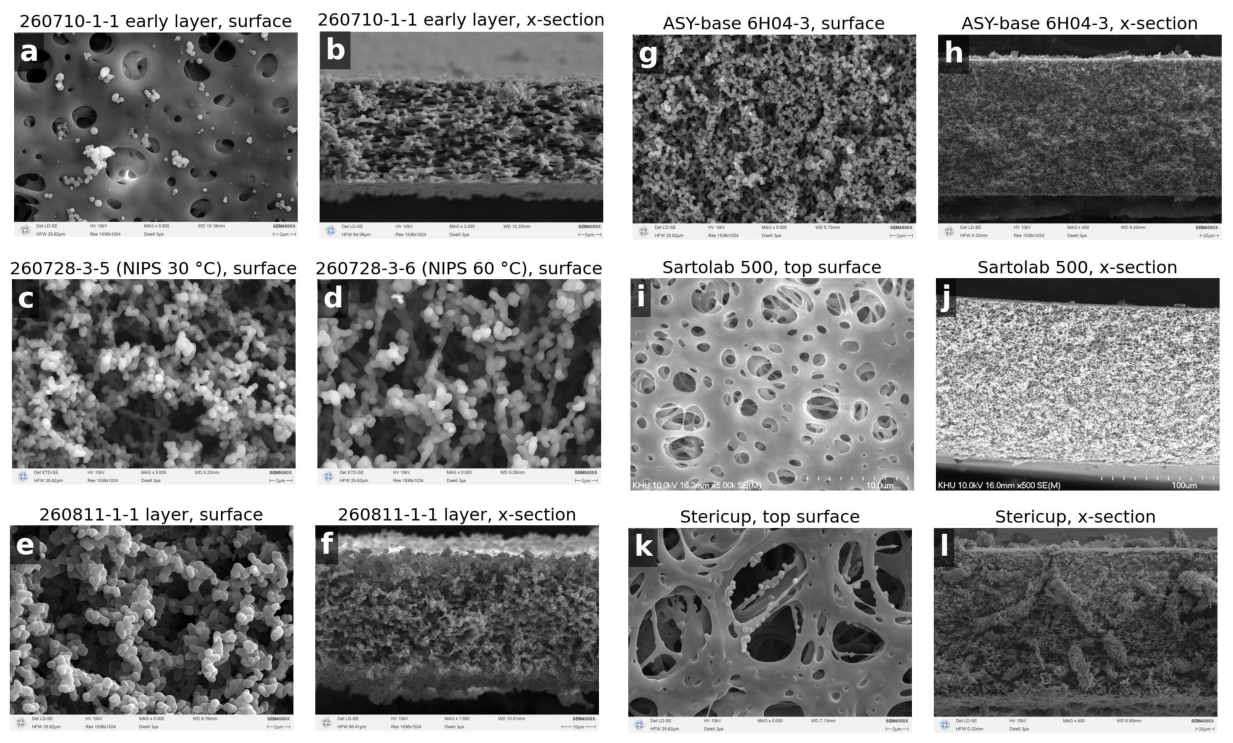
Figure 5.
PES-composite performance in separate experimental sessions. (a) ASY-base reference and selected PES composite on 31 July, using the in-house bottle-top area. (b) The common-holder comparison on 2 September, including PES and PES/sPES-H composites and the commercial references. Numbers show average flux followed by the 100-mL time in parentheses. Hatched bars indicate loose stacks; solid bars indicate wet consolidation. Sessions use separate axes because broth and device differ.
Figure 5.
PES-composite performance in separate experimental sessions. (a) ASY-base reference and selected PES composite on 31 July, using the in-house bottle-top area. (b) The common-holder comparison on 2 September, including PES and PES/sPES-H composites and the commercial references. Numbers show average flux followed by the 100-mL time in parentheses. Hatched bars indicate loose stacks; solid bars indicate wet consolidation. Sessions use separate axes because broth and device differ.
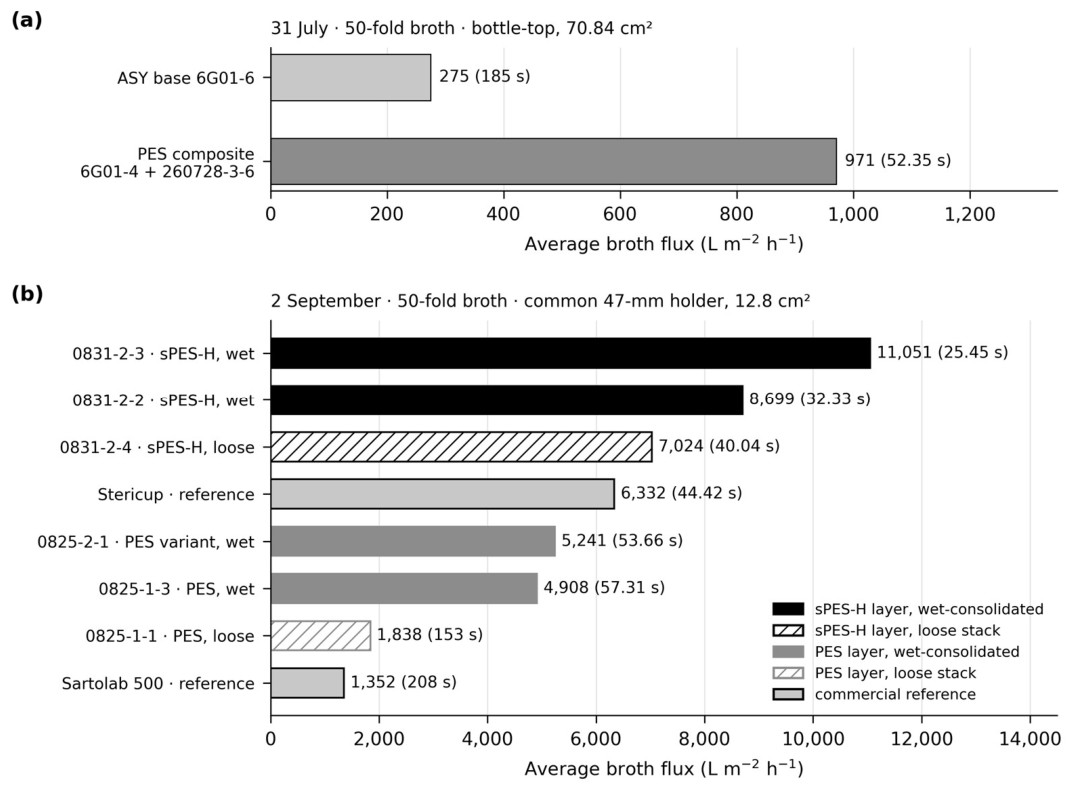
Figure 6.
Upstream sPES-H refinement. (a) Isolated-layer water flux for the PES-only family and the reported range for the sPES-H family; the vertical segment is a specimen range, not an error bar or confidence interval. (b) Individual wet-consolidated composite endpoints expressed as average broth flux on 2 September. The two measurements concern different material states—isolated layer and assembled composite—and the water range is not assigned to either individual broth-test coupon.
Figure 6.
Upstream sPES-H refinement. (a) Isolated-layer water flux for the PES-only family and the reported range for the sPES-H family; the vertical segment is a specimen range, not an error bar or confidence interval. (b) Individual wet-consolidated composite endpoints expressed as average broth flux on 2 September. The two measurements concern different material states—isolated layer and assembled composite—and the water range is not assigned to either individual broth-test coupon.
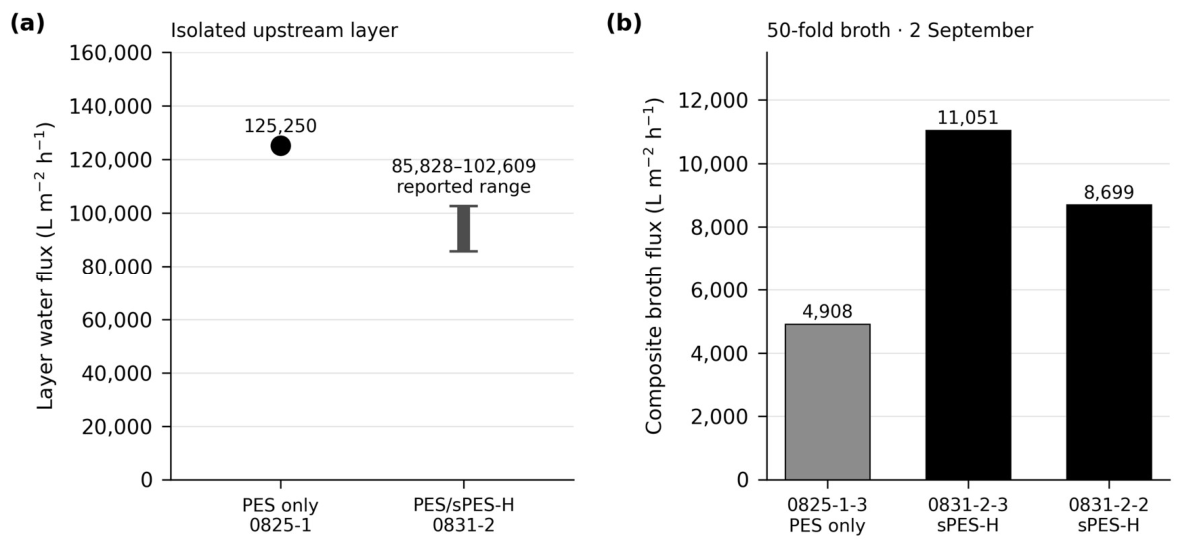

Table 1.
Principal casting-dope compositions (wt% of complete dope).
| Component |
ASY base 260625-1 |
Early layer 260710-1 |
PES layer 260728-3 |
sPES-H layer 260831-2 |
| PES | 11.5 | 8.0 | 8.0 | 7.5 |
| sPES | 0.5 | 0 | 0 | 0.5 (H-form) |
| PVP K-30 | 0.5 | 6.0 | 1.0 | 1.0 |
| PEG 200 | 30.0 | 0 | 0 | 0 |
| PEG 400 | 0 | 16.0 | 20.0 | 20.0 |
| PEG 2000 | 0 | 0 | 5.0 | 5.0 |
| CaCl₂ | 1.0 | 0 | 0 | 0 |
| LiCl | 0 | 0.5 | 0.5 | 0.5 |
| Ethanol | 5.0 | 0 | 0 | 0 |
| Butanol | 5.0 | 0 | 0 | 0 |
| DMSO | 46.5 | 69.5 | 65.5 | 65.5 |
| Total | 100 | 100 | 100 | 100 |
| Recorded viscosity, cP | 1146 | 738.8 | 276 | 301 |
The base formulation is retained in the canonical release as A-L079. Upstream dope 260831-2 replaces 0.5 wt% PES with acid-form sPES; the sPES counterion of the base is not assigned. PP is the removable upstream casting carrier, not a retained component.
Table 2.
Historical manufacturing cohorts and the ASY platform.
| Metric | SY, generation 1 | ASY, generation 2 |
| Standard casting records | 114 | 332 |
| Production period | Mar–Nov 2024 | Sep 2025–Jul 2026 |
| Records with water throughput | 69 | 305 |
| Exact BP + throughput pairs | 69 | 272 |
| PES-only / sPES-containing records | 73 / 41 | 96 / 236 |
| Median thickness, µm | 157 (n = 109) | 156 (n = 303) |
| Median water flow, g min⁻¹ | 290.33 | 365.80 |
| Median water flux, L m⁻² h⁻¹ | 13,609 | 17,147 |
| Median bubble point, mbar | 3733 | 3550 |
| Median dope viscosity, cP | 2964 | 1620 |
Water and bubble-point medians use the joint-measurement subsets. Thickness medians use all numerical thickness observations. Cohorts are non-contemporaneous; the contrast is manufacturing context. Source: canonical SY/ASY dataset of the companion study [37].
Table 3.
Upstream-layer casting trials and isolated-layer water response.
| Casting ID |
Wet/dry µm |
VIPS min |
NIPS °C/min |
Water g min⁻¹ |
Water flux L m⁻² h⁻¹ |
| 260710-1-1 | 100 / 20 | 10 | 40 / 10 | 823.2 | 38,588 |
| 260710-1-3 | 150 / 30 | 10 | 40 / 10 | 87.6 | 4106 |
| 260710-1-4 | 150 / 30 | 10 | 60 / 10 | 334.8 | 15,694 |
| 260710-1-5 | 150 / 30 | 20 | 60 / 10 | 808 | 37,875 |
| 260728-3-5 | 250 / 45 | 15 | 30 / 20 | 888 | 41,625 |
| 260728-3-6 | 250 / 40 | 15 | 60 / 20 | 3132 | 146,813 |
All listed layers were dried at 50 °C for 20 min. Water flux was calculated from the source flow at 12.8 cm². The selected temperature pair shares dope, wet casting thickness, vapor exposure, bath duration and drying conditions. Source: 3세대 막 lab test.pptx, formulation and casting tables.
Table 4.
Dilution-dependent screening and the initial layered proof of concept.
| Block / dilution | Membrane or assembly |
Area cm² |
100 mL s |
Average flux L m⁻² h⁻¹ |
| 16 Feb / 100× | ASY 5J20-1 | 70.84 | 4.86 | 10,457 |
| 16 Feb / 100× | Sartolab 500, entries 1; 2 | 69 | 6.79; 5.81 | 7684; 8980 |
| 16 Feb / 100× | Stericup, entries 1; 2 | 40 | 15.92; 13.911 | 5653; 6470 |
| 9 Feb / 50× | ASY 5J20-1 | 70.84 | 138 | 368 |
| 9 Feb / 50× | Sartolab 500, entries 1; 2 | 69 | 220; 258 | 237; 202 |
| 9 Feb / 50× | Stericup, entries 1; 2 | 40 | 33.02; 30.88 | 2726; 2915 |
| March / 100× | ASY 6C13-2 | 70.84 | 66.52 | 764 |
| March / 100× | ASY + NC 5K11-5, wet contact | 70.84 | 13.84 | 3672 |
| March / 100× | ASY + NC 5K11-5, stacked | 70.84 | 19.31 | 2632 |
| March / 100× | ASY + NC + nominal 50-µm mesh | 70.84 | 19.43 | 2615 |
| March / 50× | ASY 6C13-2 | 70.84 | 224.46 | 226 |
| March / 50× | ASY + NC 5K11-5 | 70.84 | 60.02 | 847 |
| March / 50× | ASY + NC + nominal 50-µm mesh | 70.84 | 22.61 | 2248 |
The initial NC assemblies are distinct from the final PES composites. Flux comparisons are made within each block. The March workbook headers are 25 March (100×) and 27 March (50×); subsequent additions to the sheets are not assigned those dates. Source: original 발효액 테스트 .xlsb.xlsx and the later 발효액 테스트.xlsx, corresponding dilution sheets.
Table 5.
April base-development comparison.
| Variable | 6C13-2 | 6D14-1 |
| PES / sPES, wt% | 12.0 / 1.4 | 11.5 / 0.5 |
| Dope viscosity, cP | 2082 | 1373 |
| Active humidification stages | 1–2 | 1–4 |
| Bubble point, mbar | 3650 | 3650 |
| Water flux, L m⁻² h⁻¹ | 18,067 | 18,367 |
| 50-fold broth flux, L m⁻² h⁻¹ | 226.4 | 560.2 |
| 100-fold broth flux, L m⁻² h⁻¹ | 847.0 | 952.6 |
Fluxes are retained from the original base-development comparison and dilution workbook. The samples differ in formulation and processing; the response is not assigned to sPES concentration alone.
Table 6.
PES upstream development: 100-mL endpoints on 50-fold broth.
| Block / configuration |
Total thickness µm |
Time s |
Average flux L m⁻² h⁻¹ |
| Earlier: ASY base 6G01-4 | 153 | 153 | 332 |
| Earlier: base + separately cast PES layer | 223 | 351.2 | 145 |
| Earlier: base + 260710-1, VIPS 10 min | 173 | 347 | 146 |
| Earlier: base + 260710-1, VIPS 20 min | 183 | >600 | <85 |
| 31 July: ASY reference 6G01-6 | 150 | 185 | 275 |
| 31 July: 6G01-4 + 260728-3-6 | 194 | 52.35 | 971 |
In-house bottle-top area: 70.84 cm². The earlier block contains a 2 July header and later casting IDs, and is not assigned one date. The 31 July comparison is explicitly dated. Bases 6G01-4 and 6G01-6 share dope and nominal process but are separate samples. Source: original laboratory presentation and dilution workbook.
Table 7.
Common-holder comparison on 50-fold E. coli broth, 2 September 2026.
| Specimen / reference | Upstream layer / contact |
Time s |
Average flux L m⁻² h⁻¹ |
| 0831-2-3 | PES/sPES-H; wet consolidated | 25.45 | 11,051 |
| 0831-2-2 | PES/sPES-H; wet consolidated | 32.33 | 8699 |
| 0831-2-4 | PES/sPES-H; loose stack | 40.04 | 7024 |
| Stericup | Commercial reference | 44.42 | 6332 |
| 0825-2-1 | PES; PEG 400/2000 15/6; wet | 53.66 | 5241 |
| 0825-1-3 | PES-only; wet consolidated | 57.31 | 4908 |
| 0825-1-1 | PES-only; loose stack | 153 | 1838 |
| Sartolab 500 | Commercial reference | 208 | 1352 |
One broth lot, 100 mL, a common 47-mm holder and effective area 12.8 cm². Fluxes are individual charge-average results. The two consolidated sPES-H specimens share a dope. The isolated-layer water data are 2672 g min⁻¹ for 0825-1 and a family range of 1831–2189 g min⁻¹ for 0831-2; these are not matched water measurements for each broth coupon. Source: author-provided specimen table, consistent with the 3 September formulation/contact laboratory reports.
Disclaimer/Publisher’s Note: The statements, opinions and data contained in all publications are solely those of the individual author(s) and contributor(s) and not of MDPI and/or the editor(s). MDPI and/or the editor(s) disclaim responsibility for any injury to people or property resulting from any ideas, methods, instructions or products referred to in the content. |
© 2026 by the authors. Licensee MDPI, Basel, Switzerland. This article is an open access article distributed under the terms and conditions of the Creative Commons Attribution (CC BY) license (http://creativecommons.org/licenses/by/4.0/).
Copyright: This open access article is published under a Creative Commons CC BY 4.0 license, which permit the free download, distribution, and reuse, provided that the author and preprint are cited in any reuse.