

Submitted:
15 September 2026
Posted:
16 September 2026
You are already at the latest version
Abstract
Progressive Design-Build (PDB) differs from traditional lump-sum Design-Build (DB) by allowing project design, scope, and cost to be progressively developed before the final construction price is established. However, empirical comparisons of these two delivery methods across infrastructure sectors remain limited. This study compares the performance of lump-sum DB and PDB projects in the transportation, water/wastewater, and aviation sectors using data obtained from the Design-Build Institute of America database. After data screening, the final sample consisted of 95 lump-sum DB and 37 PDB projects. We evaluated cost growth, schedule growth, and construction intensity using descriptive statistics and nonparametric statistical tests. PDB projects exhibited significantly lower mean cost growth than lump-sum DB projects (1.76% vs. 3.24%, respectively; p = 0.006). Construction intensity was also significantly lower for PDB projects (\(141K/day) than for lump-sum DB projects (\)358K/day) (p < 0.001). No statistically significant difference was found in schedule growth (p = 0.131). Overall, the findings suggest that PDB may offer improved cost control while maintaining schedule performance comparable to lump-sum DB for infrastructure projects.
Keywords:
Progressive Design-Build
; Design-Build
; project delivery methods
; project performance
; cost growth
; schedule growth
; construction intensity
; infrastructure projects
1. Introduction
In the construction industry, project owners increasingly face pressure to deliver projects faster, within budget, and at the required quality. Infrastructure projects, however, frequently experience cost overruns, schedule delays, and change orders, often associated with management challenges and project complexity (Shrestha et al., 2022; Shrestha & Shrestha, 2024). In response to that, alternative project delivery methods have gained growing attention to improve project performance (Adamtey S., 2021).
Among alternative delivery methods, Design-Build (DB) has emerged as one of the fastest growing approaches in the United States. The method has been adopted in both private and public-sector projects and across multiple project types, such as vertical construction, transportation, and water and wastewater infrastructure. In DB, the owner contracts with a single entity to develop both the project design and construction (DBIA, 2026). This arrangement establishes a single point of responsibility and promotes coordination between designers and contractors (Songer & Molenaar, 1997; Chen et al., 2016). Given the large number of DB projects implemented in the US, numerous studies have evaluated DB performance and compared it with other delivery methods, such as traditional Design-Bid- Build (DBB) and Construction Manager at Risk (CMAR) (Salih et al., 2024). These studies generally indicate that DB projects tend to outperform DBB and CMAR in schedule and cost performance, although the literature has also identified limitations and challenges (Adamtey, 2021).
In the DB delivery method, the design and construction contracts are provided to the design-builder. Some advantages of the DB method include value engineering, constructability, a single point of contact, the design-builder's ability to provide innovative design, design-and-construction overlap to reduce design-construction duration, and the elimination of design change orders. For these reasons, most empirical studies have shown that DB is superior to the traditional delivery methods, DBB, and CMAR in terms of cost and schedule performance. All these empirical studies of DB were conducted using lump-sum data on DB project performance. In the lump-sum DB project, the design-builder is selected based on their qualifications and the total lump-sum cost for design and construction. However, most owners believe that locking in construction costs before completing 70% to 90% of the design is not beneficial, as it can create a significant risk of cost overruns for contractors. Therefore, a variation of the lump-sum design, called Progressive Design-Build (PDB), was developed. In PDB, the design-builder is selected based on their qualifications, since the construction cost is unknown during the bidding phase. The owner will enter into a contract with the selected design-builder for the design portion of the project. After the design is about 70%-90% complete, the owner will request a bid for construction costs from the design-builder. The owner will also use an Independent Cost Estimator (ICE) to ensure the construction cost is reasonable. If the owner believes the design-builder's bid construction cost is reasonable, they will proceed with construction with the design-builder. However, if the design-builder's bid construction cost is not reasonable, the owner will solicit bids from other contractors and perform the contract as DBB. This is called an off-ramp route, and the project will be completed using the traditional DBB method.
PDB has recently gained increasing attention and has been applied to several project types, including building construction, airports, and water and wastewater infrastructure, with more recent adoption in transportation projects (Alleman & Tran, 2020). Previous studies across different project sectors have suggested that PDB may offer advantages over lump-sum DB in terms of schedule acceleration and cost reduction, shortening procurement timelines and improving cost transparency through increased collaboration between the owner and the design-builder during project development (Liang et al., 2020; Adamtey, 2021; Salih et al., 2024).
Numerous authors have conducted project performance studies of lump-sum DB to assess whether its cost and schedule performance are better than other delivery methods. Because the PDB method was recently introduced, few studies have evaluated its project performance. Therefore, this literature review has been divided into two major sections: one comparing the performance of lump-sum DB with other delivery methods, such as traditional DBB and CMAR, and another covering studies on PDB across various project types, including infrastructure and buildings.
1.1. Performance Comparison of Lump-Sum DB with DBB and CMAR
Several studies have compared the performance of lump-sum DB with traditional DBB and CMAR delivery methods. Prior research consistently reports that lump-sum DB outperforms DBB in schedule and cost performance, especially for large and complex projects. Some empirical analyses have found that lump-sum DB projects generally experience lower schedule and cost growth than traditional DBB projects. This is often attributed to the integration of design and construction responsibilities, improved coordination, and earlier contractor involvement associated with the lump-sum DB method (Shrestha, 2023).
Sullivan et al. (2017) conducted a literature review comparing lump-sum DB, CMAR, and DBB delivery methods. The study synthesized findings from 30 quantitative studies involving 4,623 projects of various types and evaluated project performance using cost growth, unit cost, schedule growth, delivery speed, and quality as metrics. The results indicated that DB was the most effective method for controlling cost growth, with a weighted-average increase of 2.8%, compared to 5.8% for CMAR and 5.1% for DBB. In terms of schedule growth, both DB (10.7%) and CMAR (10.2%) outperformed DBB (18.4%). DB also consistently demonstrated faster delivery than the other methods. The authors acknowledged several limitations associated with synthesizing quantitative results from multiple independent studies, including potential publication bias and reliance on aggregated study results rather than individual project data.
Chen et al. (2016) analyzed the time and cost performance of 418 lump-sum DB projects using data from the Design-Build Institute of America (DBIA) database. The study used analysis of variance (ANOVA) to examine how project characteristics influence schedule and cost outcomes, measured by time-overrun rate, early-start rate, early-completion rate, and cost-overrun rate. The analyzed project characteristics included project type (commercial and institutional buildings, civil infrastructure, and industrial facilities), owner type (public agencies and private corporations), procurement methods, contract methods, and LEED certification levels. The results showed that lump-sum DB projects generally performed better on schedule than on cost. More than 75% of the projects were completed on or ahead of schedule, whereas over 50% experienced cost overruns. The ANOVA results further showed that qualification-based procurement methods were associated with better schedule performance compared to cost-focused selection methods. The study also found that cost performance varied depending on owner type and contract method. Given the large sample size, the authors suggested that the average time and cost performance values derived from the dataset could serve as useful benchmarks for future lump-sum DB projects. They emphasized the need for performance data from alternative delivery methods to enable quantitative comparisons across delivery systems.
Liang et al. (2019) applied data mining techniques and statistical analyses to identify patterns and interaction effects among project attributes that influence cost performance in lump-sum DB projects. The authors used a dataset of 148 lump-sum DB projects from the DBIA, including buildings (civic, educational, governmental, healthcare, industrial, office) and transportation nonbuilding projects, from the U.S and Canada. They evaluated thirteen project attributes and found that five had statistically significant effects on project performance. Progressive DB was identified as a procurement method attribute, and the results indicated that projects delivered using progressive DB were associated with superior cost outcomes.
In later work, Liang et al. (2020) expanded the analysis to a larger dataset of 167 lump-sum DB projects from the DBIA database, using the same project types as before (2019), and examined both cost and schedule performance using clustering and statistical analyses. Their results again identified procurement method as one of the main attributes that explain the variability in lump-sum DB projects’ performance, where progressive DB exhibited the best cost performance (1.2% mean cost change ratio) compared to other procurement methods, including Best Value (8.2%), Qualification-Based (2.9%), Sole Source (1.9%), and Lowest Bid (12%) selection, and showed potential to improve both cost and schedule outcomes. The authors further relate PDB cost superiority to the negative impact of owner-directed changes on project cost performance. They also discuss how performance variability is better explained by combinations of project attributes, such as procurement or contract method and industry sector, rather than by independent attributes. The study recommended that future research validate these findings with a larger sample of lump-sum DB projects and explore whether and how PDB may deliver better cost and schedule performance across different project types. Although these studies provided useful findings regarding lump-sum DB performance drivers, PDB was treated only as a procurement method, rather than as a distinct delivery method subject to independent evaluation, highlighting a gap in the literature.
While previous work establishes the performance advantages of lump-sum DB, it provides limited findings into the performance of newer DB variants, such as the PDB delivery method.
1.2. Studies Related to Progressive Design-Build
In contrast to lump-sum DB, PDB has received limited empirical investigation as an independent delivery method. Gransberg & Molenaar (2019) critically compared PDB and construction manager/general contractor (CM/GC) contracting methods in highway projects using a qualitative content analysis approach. Their analysis indicated that the differences between PDB and CM/GC are limited and primarily related to how design responsibility is structured, whether the owner retains responsibility for design services or assigns it to the design-builder. The authors emphasized that selecting either PDB or CM/GC does not eliminate risks related to cost, schedule, or quality, similar to other project delivery methods. Instead, they highlighted that both methods provide mechanisms to actively manage these risks during the design phase through collaborative processes and negotiated risk sharing between the owner and the contractor. While this comparison offers insight into the similarities and structural differences between PDB and CM/GC, the study does not include empirical performance data or statistical analysis to evaluate how these delivery methods compare in cost, schedule, or construction outcomes.
To evaluate differences in schedule and cost performance between PDB and lump-sum DB, Adamtey (2021) analyzed 75 PDB and 92 lump-sum DB projects from the DBIA database across multiple project types using a one-way analysis of variance. The sample contained a high proportion of industrial PDB projects, with relatively few civil infrastructure projects, whereas commercial and institutional projects dominated the DB sample. Among civil infrastructure projects, most were water and wastewater treatment plants, with few highways and roads. The study used time and cost overrun rates as performance metrics, analogous to the commonly used schedule growth and cost growth metrics. The results indicated that PDB projects tended to perform better on schedule than on cost, with about 80% finishing on or ahead of schedule, compared to 74% for lump-sum DB. However, the study found no statistically significant difference in cost performance between the two methods. Overall, the results suggested that PDB outperformed lump-sum DB in terms of schedule performance (0.41% versus 8% time overrun), and the author observed that lump-sum DB generally outperforms DBB, implying that PDB offers advantages over DBB. The study acknowledges limitations in sample size and uneven project-type distribution and recommends using additional data sources and other qualitative factors in future research.
In a recent study, Salih et al. (2024) conducted statistical and content analyses of 21 PDB water and wastewater projects using data from the DBIA database. The study examined project characteristics, performance metrics, and the frequency of cost and schedule risks. The study used cost growth ratio, schedule growth ratio, and construction intensity as performance metrics. The results indicated strong PDB project performance, with 71% completed on or ahead of schedule and 57% delivered under budget. While the findings suggest that PDB may outperform lump-sum DB, the authors emphasize that these results require further validation using normalized data across other project types and sectors. They also caution against overgeneralizing these findings, as project-sector characteristics play an important role in delivery-method performance.
1.3. Gaps in the Literature
Despite its increasing adoption across infrastructure sectors, empirical research on PDB remains relatively limited. Existing studies often focus on specific project sectors or project delivery methods, including case studies of PDB applications in airports, highways, water and wastewater facilities, and building projects (Salih et al., 2024). Consequently, quantitative analyses and comparisons of project performance between PDB and lump-sum DB across general infrastructure sectors remain scarce.
Given the growing use of PDB as an alternative delivery method, it is important to evaluate whether this new innovative PDB method leads to improved project outcomes compared with lump-sum DB. Therefore, comparing the performance of lump-sum DB and PDB projects, especially in infrastructure, can provide insights into how different delivery methods affect infrastructure project costs and schedules and help public agency decision-makers use taxpayers' dollars more efficiently.
Although existing studies contribute meaningfully to understanding lump-sum DB and PDB performance, several gaps remain. First, most empirical studies either focus on lump-sum DB or treat a lump-sum DB project procured through the best-value method as a PDB project, which is incorrect. Second, statistical comparisons between lump-sum DB and PDB across multiple infrastructure sectors are limited. Third, relatively few studies focus on PDB, and they rely on small or sector-specific samples, which limits their statistical power and the generalizability of their findings. These gaps highlight the need for a comprehensive empirical comparison of lump-sum DB and PDB performance across infrastructure sectors, which is the focus of the present study.
2. Materials and Methods
The methodology adopted in this research consisted of four main phases: data collection, performance metric development, hypothesis development, and statistical analysis. Each step is described in detail in the following subsections.
2.1. Data Collection
Project data were obtained from the Design-Build Institute of America (DBIA) database for both PDB and lump-sum DB projects. In the database, lump-sum DB projects were categorized as those procured using Best Value and Qualifications-Based Selection (QBS), excluding projects explicitly categorized as PDB (DBIA, 2026). PDB projects cannot be selected under Best Value (BV) procurement because the construction cost component will not be reviewed during the design-builder selection process, unless construction cost is not considered a cost component. In previous studies using DBIA data, most researchers included BVS projects as PDB projects. Because the authors are unsure whether this BVS method accounts for other cost factors (e.g., markups, overhead, and profit percentages), this study excluded those data. This data collection also includes recent project data completed after 2024. Additionally, this database includes only projects in the Transportation, Water/Wastewater, and Aviation sectors to ensure comparability across similar public works infrastructure projects. For each project, the following information was collected: project location, contract start and completion dates, actual start and completion dates, initial contracted cost, and completion cost. These data were used to determine performance metrics for subsequent analysis.
2.2. Performance Metrics Development
Project success in construction is commonly evaluated based on cost and schedule performance, which are widely recognized as critical indicators of project delivery success (Shrestha & Shrestha, 2024). To calculate the performance metrics used in this study, the collected data were first examined for completeness and consistency, and the project costs were then normalized to account for inflation. All cost values were adjusted to equivalent costs as of October 2025 using indices from the National Highway Construction Cost Index (NHCCI), the most recent available index. Although NHCCI is primarily designed for transportation projects, it was applied across all infrastructure sectors in this study to ensure consistent inflation adjustment for comparative analysis.
The adjusted total project cost was calculated as shown in Equation (1):
To assess project performance, the metrics Cost Growth, Schedule Growth, and Construction Intensity were calculated using Equations (2), (3), and (4), respectively.
2.3. Research Hypothesis
This study aims to evaluate whether statistically significant differences exist in project performance between PDB and lump-sum DB delivery methods across infrastructure projects. Based on prior literature suggesting potential improvements under PDB, the following research hypotheses are proposed.
- Research Hypothesis 1: There is a statistically significant difference in mean cost growth between DB and PDB projects.
- Research Hypothesis 2: There is a statistically significant difference in mean schedule growth between DB and PDB projects.
- Research Hypothesis 3: There is a statistically significant difference in mean construction intensity between DB and PDB projects.
For statistical testing purposes, the research hypotheses were reformulated as the following null hypotheses:
- Null Hypothesis 1: There is no statistically significant difference in mean cost growth between DB and PDB projects.
- Null Hypothesis 2: There is no statistically significant difference in mean schedule growth between DB and PDB projects.
- Null Hypothesis 3: There is no statistically significant difference in mean construction intensity between DB and PDB projects.
2.4. Statistical Analysis
To evaluate the research and null hypotheses, statistical analyses were conducted using IBM SPSS Statistics. The analysis included descriptive statistics, assumption testing, and hypothesis testing to ensure that the appropriate statistical methods were applied to the dataset.
First, descriptive statistics were computed to summarize the central tendency and variability of each performance metric, including cost growth, schedule growth, and construction intensity.
A power analysis was also performed to assess whether the sample size was sufficient to detect statistically significant differences among the groups analyzed.
Normality was then assessed using the Kolmogorov-Smirnov and Shapiro-Wilk tests for the project delivery methods comparison groups. For groups with small sample sizes (n < 50), like PDB projects, emphasis was placed on the Shapiro-Wilk test. A p-value greater than 0.05 indicates that the normality assumption is not violated, while a value below 0.05 indicates non-normal data.
Next, homogeneity of variance was evaluated using Levene’s test. This test examines whether the variability of the performance metrics is statistically equivalent across the comparison groups. A non-significant result (p > 0.05) indicates equal variances, while a significant result suggests unequal variability.
Because the performance metrics exhibited non-normal distributions and unequal variances, nonparametric tests were used as the primary approach for statistical comparison. The Mann-Whitney U test was used to compare performance metrics between two independent groups, based on project delivery method. For comparisons involving more than two groups, the Kruskal-Wallis test was employed to assess whether statistically significant differences exist. When the overall test was statistically significant, pairwise post-hoc comparisons were conducted to identify which group combinations contributed to the observed differences.
3. Results
3.1. Descriptive Statistics Results
The entire DBIA dataset was downloaded and analyzed to identify three types of lump-sum DB and PDB infrastructure projects. Projects related to transportation, water/wastewater, and aviation were included in this study. To reduce the influence of atypical deviations, projects with cost or schedule growth of more than ±20% were examined individually. Cases in which deviations were not justified by owner-directed scope changes, unforeseen site conditions, or force majeure events, such as disruptions caused by the COVID-19 pandemic, were excluded from the final analysis to avoid biasing the comparison of delivery-method performance. After this screening process, Table 1 summarizes the final sample sizes by delivery method and project sector type.
The distribution of delivery methods varied across infrastructure sectors, as shown in Figure 1. Of the 62 transportation projects, 95.2% were lump-sum DB and 4.8% were PDB. The water/wastewater sector had the most balanced distribution, with 49.1% lump-sum DB projects and 50.9% PDB projects. Among the 15 aviation projects, 60.0% were lump-sum DB and 40.0% were PDB. Overall, the dataset consisted of 95 lump-sum DB projects (72.0%) and 37 PDB projects (28.0%). This uneven distribution, particularly the limited number of transportation PDB projects, may restrict the ability to make robust delivery-method comparisons within individual infrastructure sectors.
The infrastructure projects analyzed were geographically distributed across 22 U.S. states for DB projects, 14 U.S. states for PDB projects, and two projects (DB) located in Canada, as presented in Table 2. The represented U.S. states included: Arizona, Arkansas, California, Colorado, Connecticut, Florida, Georgia, Hawaii, Idaho, Kansas, Kentucky, Maryland, Michigan, Minnesota, Missouri, New Mexico, North Carolina, New York, Ohio, Oregon, Pennsylvania, Rhode Island, South Carolina, Tennessee, Texas, Utah, Virginia, Vermont, and Washington. Among these, Florida, Georgia, and Texas account for the largest number of PDB projects, while Virginia, Missouri, and New York have the highest concentration of Lump-Sum DB projects. California has the highest number of lump-sum DB and PDB projects together.
Project costs for lump-sum DB projects ranged from $1.395 million to $4.78 billion, while PDB project costs ranged from $5.272 million to $528.074 million. The average project cost data show that lump-sum DB projects are larger than PDB projects. Project completion durations ranged from 149 to 1,636 working days for lump-sum DB projects and from 87 to 1,284 working days for PDB projects. The project completion duration data show that both lump-sum DB and PDB have similar average project completion durations. Table 3 summarizes the minimum, maximum, and mean values of adjusted project cost and completion duration for lump-sum DB and PDB projects.
Table 4 shows the Cost Growth, Schedule Growth, and Construction Intensity performance metrics for lump-sum DB and PDB projects. The data analysis shows that the cost growth for lump-sum DB (3.24%) is higher than for PDB projects (1.76%). In terms of schedule growth, the lump-sum DB projects (-1.36%) have lower growth than PDB projects (0.05%). The construction intensity of lump-sum DB projects ($358 K/day) is three times that of PDB projects ($141 K/day).
3.2. Statistical Tests
Three types of statistical tests are conducted to determine whether cost growth, schedule growth, and construction intensity in lump-sum DB projects differ significantly from those in PDB projects. They are the t-test, the t-test with bootstrapping, and the Mann-Whitney non-parametric test. These mean differences are computed across three samples: first, the entire sample; second, after removing the transportation project data; and third, using only the water and wastewater project data. To determine whether the sample size was sufficient, we conducted a power analysis, and the results are explained in the following sections.
3.2.1. Power Analysis Test Results
Three power analysis tests were conducted based on the three different sample sizes. The results shown in Table 5 indicate that the power of statistical tests for cost and schedule growth is low; however, the power of the construction intensity test is very high across the entire sample. The low power for cost and schedule growth stems from the high standard deviations of these performance metrics among lump-sum DB and PDB projects.
3.2.2. Normality Test Results
One assumption of the t-test is that the data for these performance metrics across the two project types are normally distributed. To test this assumption, the Kolmogorov-Smirnov and Shapiro-Wilk tests were conducted. Table 6 shows the test results, indicating that the performance metrics for the two project types are not normally distributed. The p-values were less than 0.05, indicating that the tests failed to reject the null hypothesis of normality for the data.
3.2.3. Homogeneity of Variance Results
Homogeneity of variance was evaluated using Levene’s test. The results indicated that only cost growth satisfied the homogeneity of variance assumption, with p = 0.137 based on the mean. The other performance metrics violated the homogeneity of variance assumption, as shown in Table 7.
3.3. Comparison Between DB and PDB Performance Within the Entire Dataset
Given the presence of non-normal distributions and unequal variances, nonparametric statistical methods were adopted as the primary approach for performance comparisons.
Performance comparisons between DB and PDB projects across the entire dataset were conducted using the Mann-Whitney U test. The results indicate that DB projects had significantly higher cost growth than PDB projects, with mean cost growth values of 3.24% and 1.76%, respectively (p = 0.006). Construction intensity likewise differed significantly between the two delivery methods, with DB projects showing higher daily expenditure rates than PDB projects (p < 0.001). No statistically significant difference was observed in schedule growth between DB and PDB projects (p = 0.131), indicating comparable schedule performance between these two delivery methods. Table 8 summarizes the mean performance metrics for DB and PDB projects along with the corresponding Mann-Whitney U statistics and p-values.
3.4. Comparison of DB and PDB Performance Within Project Types
Comparisons of the DB and PDB projects across the transportation, water/wastewater, and aviation sectors did not indicate statistically significant differences in the analyzed performance metrics.
3.5. Comparison of PDB Performance Among Different Project Types
Comparisons of PDB performance across infrastructure sectors did not identify statistically significant differences in any performance metric.
3.6. Comparison of DB Performance Among Different Project Types
Differences in DB project performance among transportation, water/wastewater, and aviation sectors were evaluated using the Kruskal-Wallis test due to non-normal data distributions, unequal variances, and unbalanced sample sizes across sectors.
Table 9 presents the mean performance metrics by project type along with the corresponding Kruskal-Wallis test results. The analysis identified statistically significant differences among project sectors for construction intensity (p = 0.002). In contrast, no statistically significant differences were observed for cost growth (p = 0.523) or schedule growth (p = 0.650).
Because statistically significant differences were identified in construction intensity, pairwise post hoc comparisons were conducted to determine which combinations of project types contributed to these differences. Table 10 shows the pairwise comparison results for construction intensity.
For construction intensity, statistically significant differences were observed between transportation and water/wastewater projects (p < 0.001) and between water/wastewater and aviation projects (p = 0.028). No statistically significant difference was found between transportation and aviation projects (p = 0.881).
4. Discussion
The discussion below interprets the findings in relation to this study's research objectives and situates them within the existing literature, while acknowledging the dataset's limitations.
4.1. DB and PDB Performance Comparison Within General Infrastructures
The results indicate statistically significant differences between the DB and PDB projects in cost growth and construction intensity. DB projects had higher cost growth than PDB projects, suggesting that PDB may offer advantages in cost control in infrastructure projects. These findings align with prior research that associates PDB with improved cost outcomes, like Liang et al. (2019; 2020), who identified statistically significant differences among procurement methods within DB projects and reported that the progressive DB approach showed better cost performance, in terms of cost overrun, compared to more traditional procurement methods.
One possible explanation for improved cost performance in PDB is early contractor involvement and flexibility in scope development during the design phase. The progressive structure allows project requirements to be refined before a final price commitment, which may reduce owner-directed changes and redesign in later stages.
Adamtey (2021), however, did not identify a statistically significant difference in cost performance between lump-sum DB and PDB projects. The differences between that study and the present findings may be attributable to variations in sample composition, as Adamtey’s sample comprised mostly industrial and commercial/institutional projects, with very limited civil infrastructure. The present study focuses specifically on infrastructure sectors, such as transportation, water/wastewater, and aviation. It suggests that sector characteristics may influence the relative performance of delivery methods and that PDB cost advantages may vary by project type.
Construction intensity was also significantly higher for lump-sum DB projects, indicating higher daily expenditure rates than for PDB projects. This result likely reflects differences in project scale and how resources are deployed over the project duration. Higher construction intensity in lump-sum DB projects may reflect larger project scale or compressed construction schedules, rather than superior or inferior performance. Conversely, the lower construction intensity observed in PDB projects suggests a more gradual distribution of expenditures over time, which may improve cost predictability. Therefore, construction intensity should be interpreted with caution, as it reflects the spending rate rather than direct efficiency.
No statistically significant difference was identified in schedule growth between lump-sum DB and PDB projects. This result suggests that, despite differences in cost outcomes, both delivery methods achieve comparable schedule performance in the analyzed infrastructure sectors, since the lump-sum DB delivery already provides schedule advantages over the traditional DBB method. In contrast, Adamtey (2021) reported statistically significant differences in schedule performance, concluding that PDB projects outperformed lump-sum DB projects in terms of time overrun. Another study by Jeong et al. (2022) also suggests that PDB may not always lead directly to cost reductions and emphasizes that PDB primarily enhances schedule performance and project predictability. Differences may also explain the divergence between these findings, including sector composition, project characteristics, and dataset sample sizes.
4.2. Performance Comparisons Within Project Types
Comparisons among infrastructure projects using both lump-sum DB and PDB across the transportation, water/wastewater, and aviation sectors did not show statistically significant differences in the performance metrics analyzed. This result is attributable to limited sample sizes across certain sectors and delivery methods, especially for PDB transportation and aviation projects, due to the relatively recent adoption of PDB in some infrastructure sectors and the limited availability of publicly reported performance data. These findings should therefore be interpreted as exploratory rather than as confirmation of statistical equivalence or differences between delivery methods at the sector level.
4.3. PDB Performance Among Different Project Types
As with the comparisons of infrastructure project types in the previous section, comparisons of PDB projects’ performance across the transportation, water/wastewater, and aviation sectors did not reveal statistically significant differences in the performance metrics analyzed. Although this result may suggest that PDB performance is relatively consistent across infrastructure sectors, the small number of PDB projects in transportation and aviation categories reduces statistical power. It limits the ability to draw definitive conclusions.
4.4. DB Performance Among Different Project Types
Comparisons among lump-sum DB projects across infrastructure sectors revealed statistically significant differences in construction intensity. Water and wastewater projects exhibited significantly lower construction intensity than both transportation and aviation projects. These differences reflect variations in project scale, technical complexity, and capital requirements across sectors. One reason construction intensity was low in water and wastewater projects is that water treatment plants involve installing complex machinery and equipment, which can take considerable time. The findings indicate that sector characteristics play a major role in spending dynamics under DB delivery, in line with prior research (Salih et al., 2024).
However, no statistically significant differences were observed across sectors for cost growth or schedule growth in lump-sum DB projects, indicating comparable relative cost and schedule performance among DB project types. This suggests that, despite large variations in project size and capital intensity, DB delivery achieves relatively consistent cost and schedule performance across different infrastructure project types.
5. Conclusions
This study evaluated the performance of PDB and lump-sum DB delivery methods in infrastructure projects using cost growth, schedule growth, and construction intensity as performance metrics. The analysis combined descriptive statistics and statistical tests to evaluate differences between the delivery methods and across infrastructure sectors.
The results indicate that PDB projects exhibited significantly lower cost growth compared with DB projects, suggesting that the progressive approach may contribute to improved cost control in infrastructure projects. PDB projects also showed lower construction intensity than DB projects, reflecting variations in project scale and spending rates. In contrast, no statistically significant differences were identified in schedule growth between DB and PDB projects, indicating that both delivery methods achieve comparable schedule performance within the analyzed infrastructure. Comparisons across the transportation, aviation, and water/wastewater sectors in lump-sum DB projects revealed significant differences in construction intensity, suggesting that sector characteristics may be associated with project scale and expenditure rates. However, cost and schedule growth remained relatively consistent across sectors, suggesting that the lump-sum DB method achieves comparable relative performance across project types.
Overall, the findings contribute to the growing body of literature evaluating PDB as an emerging project delivery method. Within the analyzed sample, the results suggest that PDB may offer cost advantages while maintaining schedule performance comparable to that of lump-sum DB delivery.
Despite these contributions, several limitations should be acknowledged. First, the dataset relied on publicly available project information, which limited the number of PDB projects available for analysis. Another limitation concerns the source of project data. The DBIA project database is based on information voluntarily submitted by industry participants. Therefore, the database may be biased, as unsuccessful projects experiencing substantial performance problems, claims, disputes, or litigation are unlikely to be reported, so the projects included in the database may not fully represent the broader population of lump-sum DB and PDB projects. Although both delivery methods were evaluated using data from the same source and consistent inclusion and exclusion criteria, the findings should be interpreted as representative of the projects available in the analyzed database rather than as a complete representation of the performance of all DB and PDB projects.
An additional limitation is the uneven distribution of project delivery methods across infrastructure sectors. The lump-sum DB sample consisted mainly of water/wastewater projects. Only three transportation projects used PDB, limiting the ability to make reliable comparisons of delivery methods within this sector. Although exploratory analyses were conducted within individual project types, no statistically significant differences between lump-sum DB and PDB were identified across the sectors analyzed, as the relatively small and uneven subgroup sample sizes may have limited the statistical power of these comparisons. Because project characteristics and performance may vary across infrastructure sectors, the different sector compositions of the lump-sum DB and PDB samples may have influenced the overall comparison. Therefore, the significant differences identified in the overall sample should be interpreted as findings for the combined infrastructure dataset and should not be assumed to apply equally to transportation, water/wastewater, aviation, or other infrastructure sectors individually. Future research should include larger and more balanced samples of DB and PDB projects within each sector to determine whether the observed performance differences are consistent across project types.
In this sense, future research should validate these findings using additional data sources, including public agencies, state departments of transportation, and project records that include projects experiencing claims, disputes, or significant performance challenges. Future studies should also incorporate larger and more balanced samples of PDB and lump-sum DB projects within individual infrastructure sectors to determine whether the observed performance differences are consistent across project types. Future research should investigate how project characteristics influence the performance of these delivery methods, thereby providing a more complete understanding of the conditions under which PDB may offer the greatest benefits for infrastructure project delivery.
References
- Adamtey, S. Cost and time performance analysis of progressive design-build projects. Journal of Engineering, Design and Technology 2021, 686–697. [Google Scholar] [CrossRef]
- Alleman, D.; Tran, D. Challenges of Implementing Progressive Design-Build in Highway Construction Projects. Journal of Legal Affairs and Dispute Resolution in Engineering and Construction 2020, 04519036. [Google Scholar]
- Chen, Q.; Jin, Z.; Wu, P.; Skitmore, M. Time and Cost Performance of Design–Build Projects—Journal of Construction Engineering and Management. 2016, 04015074. [Google Scholar]
- Design-Build Institute of America. What Is Design-Build? 2 March 2026. Available online: https://dbia.org/what-is-design-build/.
- Gransberg, D.; Molenaar, K. R. Critical Comparison of Progressive Design-Build and Construction Manager/General Contractor Project Delivery Methods. Transportation Research Record: Journal of the Transportation Research Board 2019, 261–268. [Google Scholar] [CrossRef]
- Jeong, E.; Anderson, C.; Lin, K.-Y.; Migliaccio, G. Progressive Design-Build: Its Functions as a Contracting Method and the Four Pillars of Project Success; The 9th International Conference on Construction Engineering and Project Management: Las Vegas, 2022. [Google Scholar]
- Liang, Y.; Ashuri, B.; Sun, W. Identifying Patterns in Design-Build Projects in Terms of Project Cost Performance. In ASCE International Conference on Computing in Civil Engineering 2019; American Society of Civil Engineers: Atlanta, 2019; pp. 122–129. [Google Scholar]
- Liang, Y.; Ashuri, B.; Sun, W. Analysis of the Variability of Project Cost and Schedule Performance in the Design-Build Environment. Journal of Construction Engineering and Management 2020, 04020060. [Google Scholar]
- Salih, F.; Eissa, R.; El-adaway, I. Data-Driven Analysis of Progressive Design Build in Water and Wastewater Infrastructure Projects. Journal of Construction Engineering and Management 2024, 04023149. [Google Scholar]
- Shrestha, B.; Shrestha, P. Project Performance Comparison of Public–Private Partnership (P3) Highway Projects against Design-Build (DB) and Design-Bid-Build (DBB) Highway Projects. Buildings 2024, 2622. [Google Scholar] [CrossRef]
- Shrestha, B.; Shrestha, P.; Maharjan, R.; Gransberg, D. Cost, Change Order, and Schedule Performance of Highway Projects. Journal of Legal Affairs and Dispute Resolution in Engineering and Construction 2022. [Google Scholar] [CrossRef]
- Shrestha, S. Performance Comparison of Design-Bid-Build (DBB), Design-Build (DB), and Construction Management-At-Risk (CMAR) Methods, and Identification of Critical Success Factors for DB and CMAR in Water and Wastewater Projects; UNLV Theses, Dissertations, Professional Papers: Las Vegas, 2023. [Google Scholar]
- Songer, A. D.; Molenaar, K. R. Project characteristics for successful public-sector design-build. Journal of Construction Engineering and Management 1997, 123(1), 34–40. [Google Scholar] [CrossRef]
- Sullivan, J.; El Asmar, M.; Chalhoub, J.; Obeid, H. Two Decades of Performance Comparisons for Design-Build, Construction Manager at Risk, and Design-Bid-Build: Quantitative Analysis of the State of Knowledge on Project Cost, Schedule, and Quality. Journal of Construction Engineering and Management 2017, 04017009. [Google Scholar]
Figure 1.
Distribution of Delivery Methods by Infrastructure Sector.
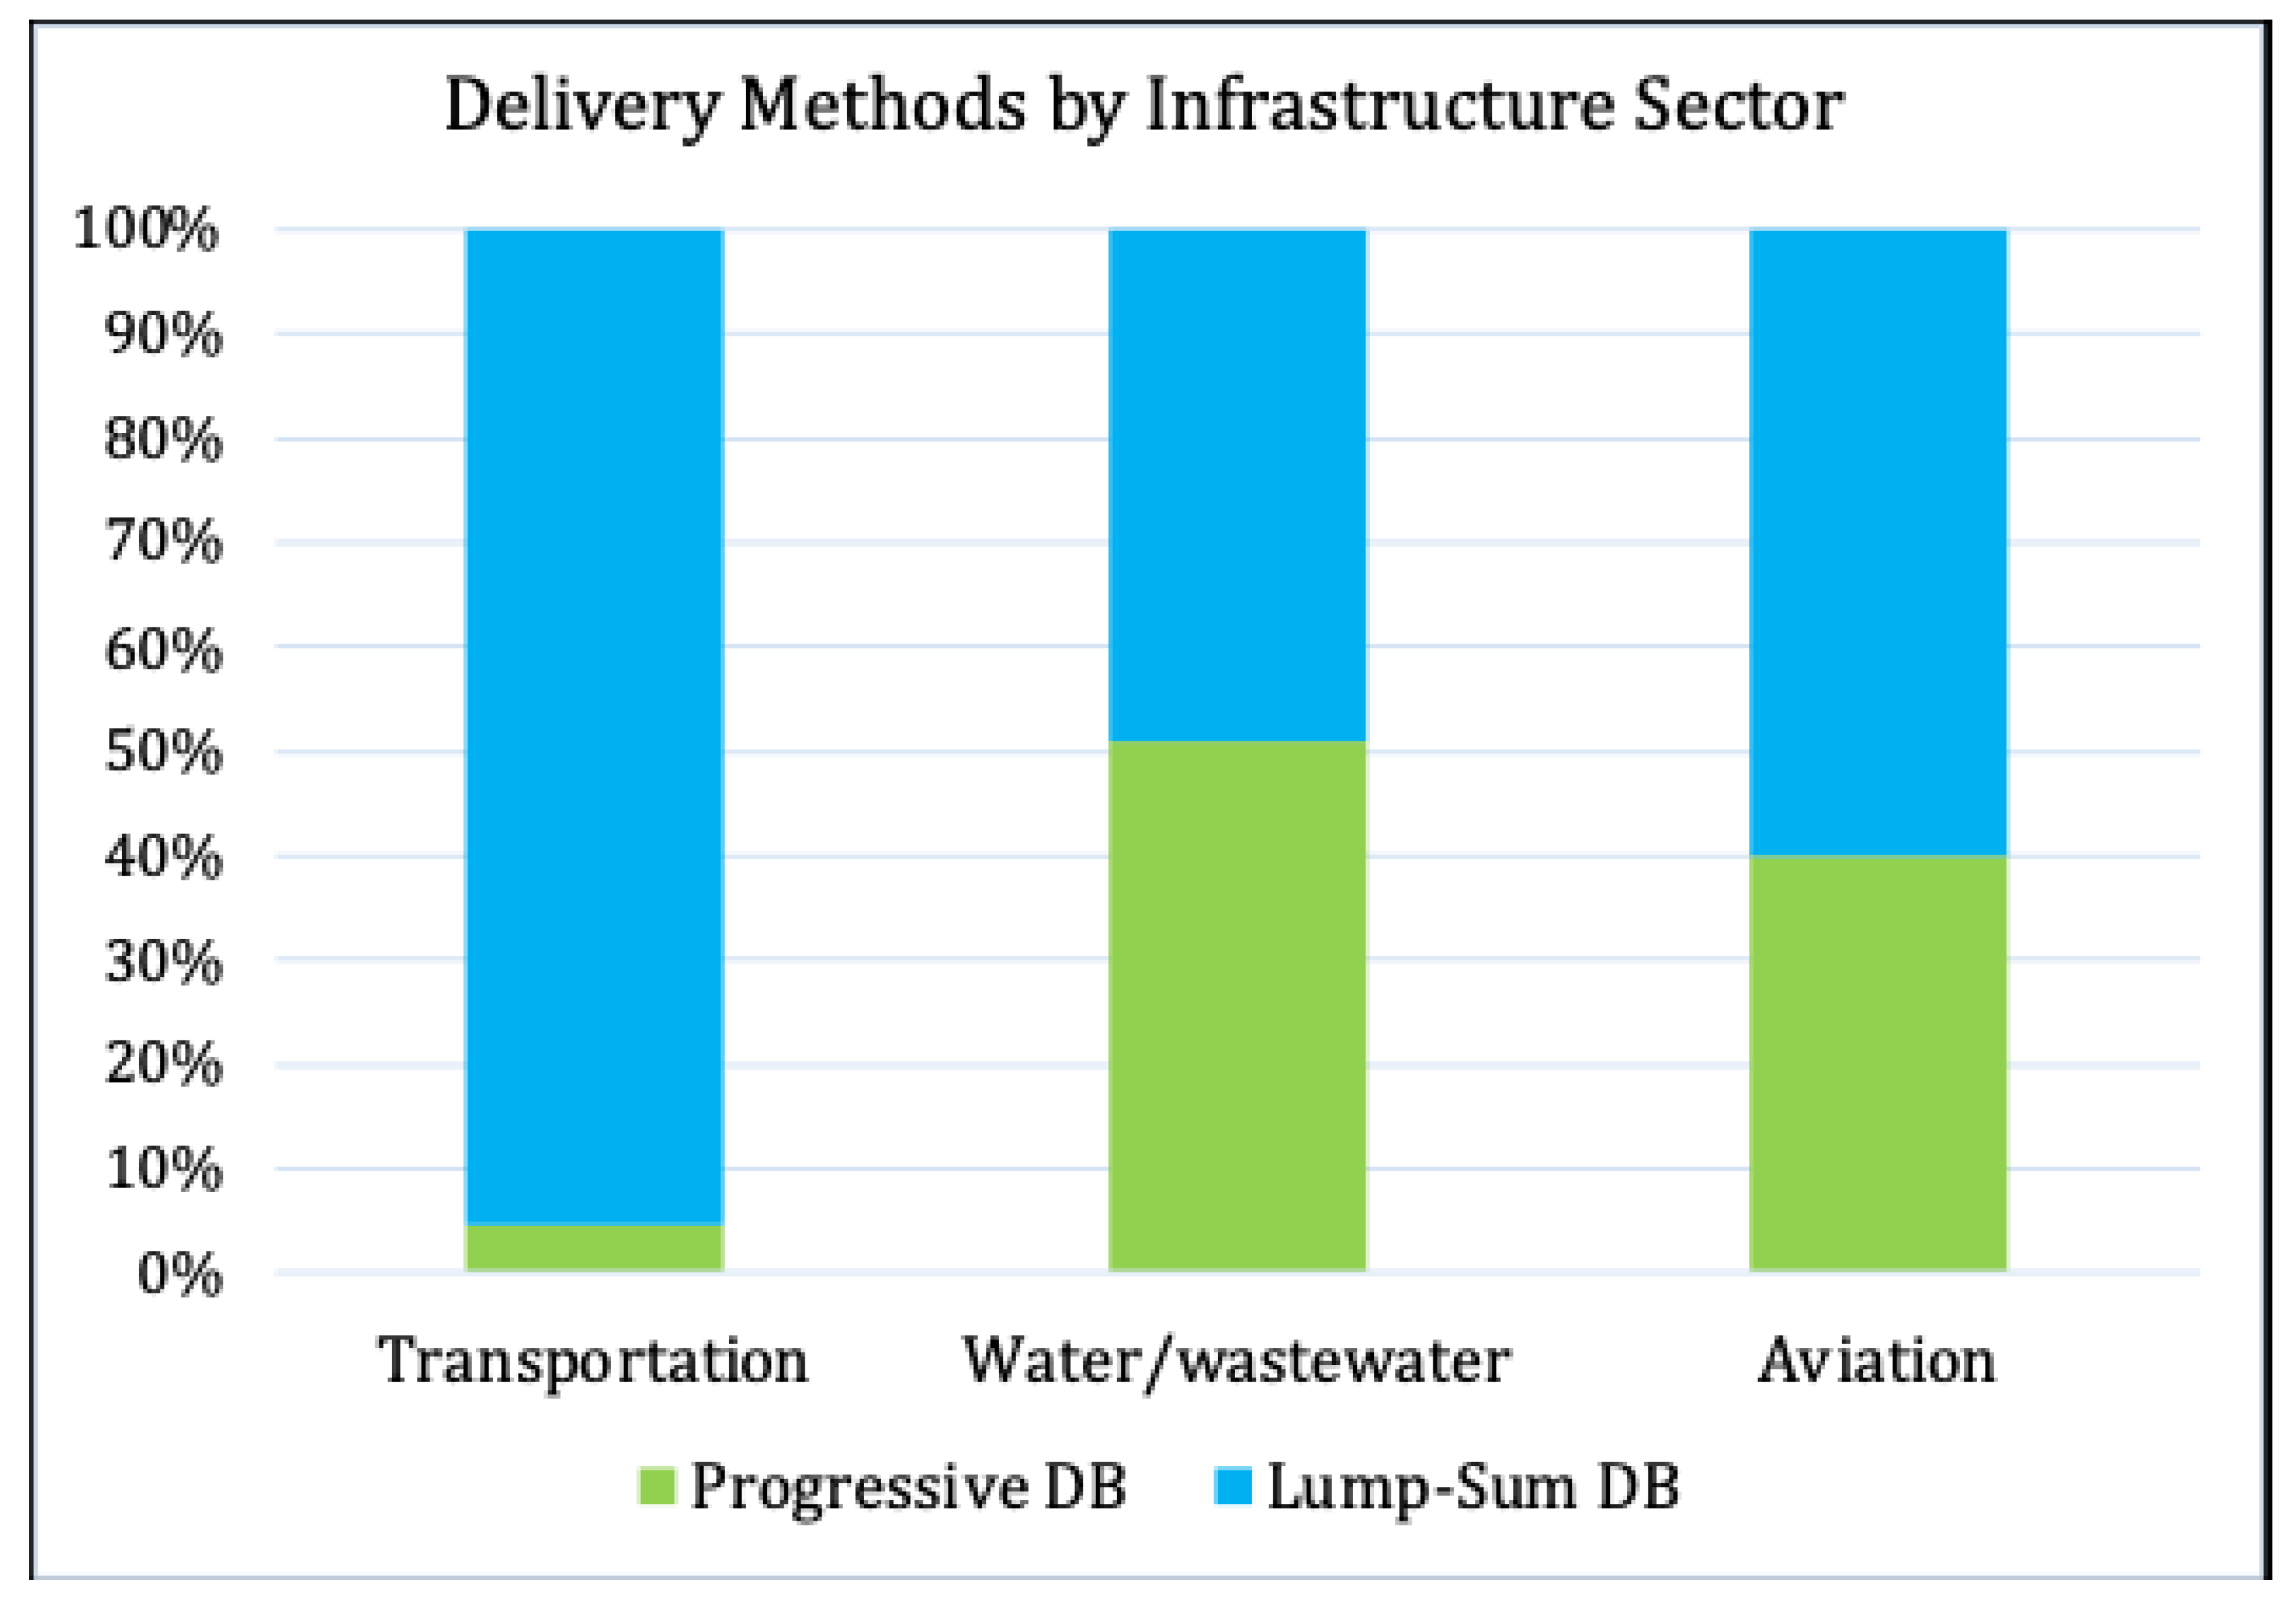

Table 1.
Final Sample Distribution of DB and PDB Projects.
| Project type | Original Data | Data after Screening | ||
| Progressive DB | Lump-Sum DB | Progressive DB | Lump-Sum DB | |
| Transportation | 3 | 78 | 3 | 59 |
| Water/wastewater | 31 | 34 | 28 | 27 |
| Aviation | 11 | 14 | 6 | 9 |
| Total | 45 | 126 | 37 | 95 |
Table 2.
Distribution of the projects based on locations.
| State/Country | PDB | % | Lump-Sum DB | % |
|---|---|---|---|---|
| Arizona | 2 | 5 | 0 | 0 |
| Arkansas | 0 | 0 | 2 | 2 |
| California | 7 | 19 | 11 | 12 |
| Colorado | 3 | 8 | 2 | 2 |
| Connecticut | 1 | 3 | 0 | 0 |
| Florida | 6 | 16 | 8 | 8 |
| Georgia | 5 | 14 | 3 | 3 |
| Hawaii | 0 | 0 | 1 | 1 |
| Idaho | 1 | 3 | 0 | 0 |
| Kansas | 0 | 0 | 1 | 1 |
| Kentucky | 1 | 3 | 0 | 0 |
| Maryland | 0 | 0 | 5 | 5 |
| Minnesota | 0 | 0 | 2 | 2 |
| Missouri | 0 | 0 | 11 | 12 |
| New Mexico | 2 | 5 | 0 | 0 |
| New York | 0 | 0 | 10 | 11 |
| North Carolina | 2 | 5 | 3 | 3 |
| Ohio | 0 | 0 | 2 | 2 |
| Oregon | 2 | 5 | 0 | 0 |
| Pennsylvania | 0 | 0 | 1 | 1 |
| Rhode Island | 0 | 0 | 1 | 1 |
| South Carolina | 1 | 3 | 3 | 3 |
| Tennessee | 1 | 3 | 2 | 2 |
| Texas | 3 | 8 | 7 | 7 |
| Utah | 0 | 0 | 3 | 3 |
| Vermont | 0 | 0 | 1 | 1 |
| Virginia | 0 | 0 | 12 | 13 |
| Washington | 0 | 0 | 2 | 2 |
| Canada | 0 | 0 | 2 | 2 |
| Total | 37 | 100 | 95 | 100 |
Table 3.
Cost and Duration Data of Lump-Sum DB and PDB.
| Attribute | Statistics | Lump-Sum DB | PDB |
|---|---|---|---|
| Adjusted Final Project Cost | Minimum | $1.395M | $5.272M |
| Maximum | $4,780.995M | $528.074M | |
| Mean | $299.80M | $107.64M | |
| Final Project Duration | Minimum | 149 days | 87 days |
| Maximum | 1,636 days | 1,284 days | |
| Mean | 681 days | 738 days |
Table 4.
Descriptive Statistics of Project Performance Metrics.
| Metrics | Sample Type | Statistics | Lump-Sum DB | PDB |
|---|---|---|---|---|
| Cost Growth | Entire Sample | Mean | 3.24% | 1.76% |
| SD | 5.92% | 13% | ||
| Water/Wastewater + Aviation | Mean | 2.27% | 2.0% | |
| SD | 5.36% | 13.49% | ||
| Water/Wastewater | Mean | 2.2% | 2.81% | |
| SD | 5.88% | 1.39% | ||
| Schedule Growth | Entire Sample | Mean | -1.36% | 0.05% |
| SD | 9.41% | 5.87% | ||
| Water/Wastewater + Aviation | Mean | -1.51% | 0.15% | |
| SD | 7.88% | 5.23% | ||
| Water/Wastewater | Mean | -1.90% | 0.09% | |
| SD | 8.84% | 5.68% | ||
| Construction Intensity | Entire Sample | Mean | $358 K/day | $141 K/day |
| SD | $473 K/day | $146 K/day | ||
| Water/Wastewater + Aviation | Mean | $259 K/day | $146 K/day | |
| SD | $519 K/day | $152 K/day | ||
| Water/Wastewater | Mean | $146 K/day | $122 K/day | |
| SD | $123 K/day | $113 K/day |
Table 5.
Power Analysis Test Results.
| Sample Types | Cost Growth | Schedule Growth | Construction Intensity |
|---|---|---|---|
| Entire Sample | 0.15 | 0.13 | 0.76 |
| Water & Wastewater + Aviation | 0.05 | 0.17 | 0.22 |
| Water & Wastewater | 0.08 | 0.16 | 0.12 |
Table 6.
Kolmogorov-Smirnov and Shapiro-Wilk Test Results.
| Performance Metrics | Project Delivery Method | Shapiro-Wilk Test Statistics |
Kolmogorov-Smirnov Test Statistics | p-value |
|---|---|---|---|---|
| Cost Growth | DB | 0.923 | 0.163 | <0.001 |
| PDB | 0.596 | 0.300 | <0.001 | |
| Schedule Growth | DB | 0.878 | 0.243 | <0.001 |
| PDB | 0.805 | 0.280 | <0.001 | |
| Construction Intensity | DB | 0.657 | 0.230 | <0.001 |
| PDB | 0.707 | 0.231 | <0.001 |
Table 7.
Levene’s Test Results (Based on Mean).
| Performance Metrics | Levene’s Statistic | p-value |
|---|---|---|
| Cost Growth | 2.235 | 0.137 |
| Schedule Growth | 5.154 | 0.025 |
| Construction Intensity | 12.019 | <0.001 |
Table 8.
Comparison of DB and PDB Project Performance (Mann-Whitney U Results).
| Metric | DB Mean | PDB Mean | Mann-Whitney U | p-value |
|---|---|---|---|---|
| Cost Growth | 3.24% | 1.76% | 1217 | 0.006* |
| Schedule Growth | -1.36% | 0.05% | 2042 | 0.131 |
| Construction Intensity | $358K/Day | $141K/Day | 1090 | <0.001* |
* Significant.
Table 9.
DB Performance by Project Type (Kruskal-Wallis Results).
| Metric | Transportation Mean | Water/Wastewater Mean | Aviation Mean | Kruskal-Wallis (χ²) | p-value |
|---|---|---|---|---|---|
| Cost Growth | 3.85% | 2.19% | 2.44% | 1.3 | 0.523 |
| Schedule Growth | -1.22% | -2.00% | -0.33% | 0.86 | 0.650 |
| Construction Intensity | $418.71K/day | $144.84K/day | $604.19K/day | 12.44 | 0.002* |
* Significant.
Table 10.
Construction Intensity Pairwise Post-Hoc Comparison Results (DB Projects).
| Performance Metric | Project Type | Pairwise Test Statistic (z) | p-value |
|---|---|---|---|
| Construction intensity | Transportation | 21.9 | <0.001* |
| Water/Wastewater | |||
| Transportation | -1.47 | 0.881 | |
| Aviation | |||
| Water/Wastewater | -23.37 | 0.028* | |
| Aviation |
* Significant.
Disclaimer/Publisher’s Note: The statements, opinions and data contained in all publications are solely those of the individual author(s) and contributor(s) and not of MDPI and/or the editor(s). MDPI and/or the editor(s) disclaim responsibility for any injury to people or property resulting from any ideas, methods, instructions or products referred to in the content. |
© 2026 by the authors. Licensee MDPI, Basel, Switzerland. This article is an open access article distributed under the terms and conditions of the Creative Commons Attribution (CC BY) license (http://creativecommons.org/licenses/by/4.0/).
Copyright: This open access article is published under a Creative Commons CC BY 4.0 license, which permit the free download, distribution, and reuse, provided that the author and preprint are cited in any reuse.