

Submitted:
14 September 2026
Posted:
15 September 2026
You are already at the latest version
Abstract
Excessive blue light exposure might severely threaten retinal health and disrupt circadian rhythms. To mitigate these hazards, candlelight-style sources were developed; however, fabricating high-efficiency, large-area, wet-processed candlelight organic light-emitting diodes (OLEDs) remains challenging. This study demonstrates a high-efficiency, blue-light-free candlelight OLED fabricated via wet-process by incorporating a [2-(3,6-dimethoxy-9H-carbazol-9-yl)ethyl]phosphonic acid (MeO-2PACz) self-assembled monolayer between hole injection and emissive layers. At 1,000 cd/m², the resultant power efficacy, current efficiency and external quantum efficiency can be increased by 22%, 15% and 12%, respectively. Notably, at a high luminance of 10,000 cd/m², the corresponding efficiencies remain enhanced by 34%, 22%, and 19%, respectively. This device exhibits a color temperature of 1,991 K, permitting at 100 lx a maximum exposure limit of 71,211 seconds, 130 times longer than a cold-white OLED. The enhancement of device efficiencies may be attributed to the reduction of hole injection resistance and the suppression of non-radiative electron leakage.
Keywords:
organic light-emitting diodes (OLEDs)
; candlelight-style OLEDs
; self-assembled monolayers
; MeO-2PACz
; hole injection
; solution processing
1. Introduction
Overexposure to blue-light-rich white light environments poses potential hazards to visual health [1]. Clinical research indicates a high correlation between such exposure and ocular diseases, including photoretinitis [2,3,4,5,6,7,8,9], retinal detachment [10,11], cataracts [12,13,14], glaucoma [15,16,17], and macular degeneration [18,19]. When occurring at night, such exposure suppresses melatonin secretion, inducing sleep disorders and circadian rhythm disruption [20,21,22], which further increases the risk of breast and prostate cancer [23,24,25,26]. Furthermore, non-planar light sources such as incandescent bulbs, LEDs, and fluorescent tubes can easily produce uncomfortable glare if they lack proper secondary optical treatment, affecting visual quality [27,28].
To address these risks, Jou et al. successfully developed the world's first candlelight OLED in 2012, with a light color similar to traditional candles and a luminous efficiency twice that of incandescent lamps [29]. Subsequently, the team published a wet-processed candlelight OLED in 2016 [30]. Additionally, Lai et al. proposed the first candlelight LED in 2013 [31]. These studies established the technical foundation for blue-hazard-free lighting.
The advantage of OLEDs lies in their intrinsic planar light emission mechanism, which achieves high uniformity and glare-free soft lighting without adjustment via secondary optical elements such as diffusers or lenses [29]. Such characteristics demonstrate significant application potential and research value in the field of developing blue-hazard-free, bio-friendly light sources that comply with circadian rhythms.
However, balancing luminous efficiency, device lifetime, and cost remains a key challenge. Although vacuum evaporation can prepare high-performance devices, it suffers from disadvantages such as poor thermal stability of organic materials, high manufacturing costs, and low material utilization [32]. In contrast, wet-process technology offers significant advantages in large-area, high-throughput, and roll-to-roll processing, but the development of solution-processable materials that possess high stability and maintain excellent performance remains a current research focus [33].
Addressing the efficiency bottlenecks of wet processes, Self-Assembled Monolayers (SAMs) provide a molecular-level solution. SAMs form ultrathin ordered films through chemisorption [34,35], optimizing injection barriers by modulating the work function via molecular dipole moments [36], and contribute to interfacial modification by passivating surface defects and reducing non-radiative charge recombination pathways [37].
Recent studies indicate that SAMs featuring a carbazole core and a phosphonic acid anchoring group exhibit excellent hole transport characteristics and effectively repair interface defects in perovskite solar cells [38,39,40]. Such materials have also begun to be applied in light-emitting diode devices to replace traditional hole injection layers (HILs) [41].
Among these materials, MeO-2PACz (hereinafter referred to as SAM) possesses a moderate HOMO level, enabling it to act as a buffer between the traditional HIL and the emitting layer. This transforms the originally significant injection barrier into a stepped energy level structure, effectively reducing hole injection resistance and driving voltage. Furthermore, its terminal phosphonic acid group can generate a p-type doping effect at the PEDOT:PSS interface to enhance charge transfer [42,43]. Combined with its ultrathin nature and low optical loss, it demonstrates the potential to optimize traditional HIL structures.
In view of this, this study aims to introduce MeO-2PACz as an interfacial modifier within the hole injection architecture. By comparing the effects of traditional PEDOT:PSS, a single-layer SAM, and a stepped structure combining both on device performance, and further exploring the role of different SAM concentrations (0.3, 1.0, and 2.0 mg/mL) in efficiency optimization, this research seeks to improve the device efficiency of wet-processed candlelight OLEDs.
2. Experimental
2.1. Materials
Indium tin oxide (ITO) coated glass substrates (125 nm, 15 Ω/sq, 3 cm x 3 cm) and Tris(2-phenylquinoline)iridium(III) (Ir(2-phq)3, >99%) were purchased from Shine Materials Technology. Poly(3,4-ethylenedioxythiophene):poly(styrene sulfonate) (PEDOT:PSS, Al 4083) was obtained from Heraeus. (2-(3,6-dimethoxy-9H-carbazol-9-yl)ethyl)phosphonic acid (MeO-2PACz, >99%, see Figure 1 for its molecular structure), 4,4',4″-Tris(carbazol-9-yl)triphenylamine (TCTA, >99.5%), and 1,3,5-Tris(1-phenyl-1H-benzimidazol-2-yl)benzene (TPBi, 99.9%) were purchased from Lumtec. Tris(2-phenylpyridine)iridium(III) (Ir(ppy)3, >99.5%) and lithium fluoride (LiF, 99.99%) were acquired from Luminosa Materials. Aluminum (Al) was purchased from Guv Team International. Ethanol, acetone, isopropanol (IPA), and tetrahydrofuran (THF) were obtained from Echo Chemical.
2.2. Device Fabrication
The ITO substrates were cleaned via sequential ultrasonication in neutral detergent, deionized (DI) water, acetone, and isopropanol, followed by a 20-minute UV-Ozone treatment.
The emitting layer (EML) solution was prepared using THF as the solvent at a total concentration of 5 mg/mL, with TCTA host and guests mixed at an 8:1 ratio; the guest consisted of Ir(ppy)3 and Ir(2-phq)3 at a 1:1 ratio. MeO-2PACz solutions were prepared in ethanol at concentrations of 0.3, 1.0, and 2.0 mg/mL, respectively.
PEDOT:PSS was spin-coated (4,000 rpm, 30 s, ~40 nm) and annealed at 120 °C for 20 min. Subsequently, the SAM solution was applied via static spin-coating (3,000 rpm, 30 s, ~1-2 nm) and annealed at 100 °C for 10 min. After cooling, a dynamic rinse with ethanol (3,000 rpm, 30 s) was performed, followed by annealing at 80 °C for 5 min. EML was then spin-coated (2,500 rpm, 20 s, ~30 nm) and annealed at 90 °C for 10 min. All the steps were conducted in a glove box. Finally, TPBi (35 nm), LiF (1 nm), and Al (200 nm) were deposited sequentially via thermal evaporation under a high vacuum environment (< 6 × 10⁻⁶ Torr).
2.3. Measurement
The contact angle of DI water on the sample surfaces was analyzed using ImageJ with the DropSnake plugin. The current density-voltage-luminance (I-V-L) characteristics of the devices were measured using a Keithley 2400 source meter, a Minolta CS-100A, and a PR655 spectrometer.
2.4. Calculation
The formulas for power efficacy (PE), current efficiency (CE), and external quantum efficiency (EQE) are as follows:
Where L represents the forward luminance (cd/m2); J represents the current density (A/m2); V represents the applied voltage; e represents the elementary charge (C); h represents the Planck constant (J⋅s); c represents the speed of light in vacuum (m/s); Km represents the maximum spectral luminous efficacy for photopic vision (lm/W); S(λ) represents the relative electroluminescence intensity spectrum; V(λ) represents the CIE standard photopic luminous efficiency function, and λ represents the light wavelength (nm).
2.4.1. Maximum Permissible Retina Exposure Limit (MPE)
According to the guidelines established by the International Commission on Non-Ionizing Radiation Protection (ICNIRP), the MPE limit for retinal safety, expressed in seconds, can be determined using the following relation [44]:
Where EB is blue-light-weighted radiation ( W/m2), which is quantified by integrating the spectral distribution as follows:
Where Eλ represents the spectral irradiance (W/m2⋅nm); B(λ) signifies the dimensionless blue light hazard weighting function; and λ represents the light wavelength (nm).
2.4.2. Melatonin Suppression Sensitivity (MSS)
To evaluate the melatonin suppression sensitivity of a specific light source, the action spectrum of melatonin suppression per photon quanta, denoted as SPQ (λ), is utilized. This conceptual framework was originally introduced by Jou et al [45]. The governing mathematical expression is defined as follows:
where SPQ (λ) represents the relative suppression efficiency per photon quantum of a monochromatic wavelength against a specific reference wavelength (λr), and C serves as an empirical fitting constant. A blue light wavelength of 480 nm is designated as the reference standard.
To enhance practical applicability in illumination engineering, the aforementioned quantum-based relation is converted into a lumen-based metric (per lux, lx), yielded as:
Where SL (λ) signifies the melatonin suppression sensitivity action spectrum normalized per lux, and V(λ) represents the photopic luminosity function.
For polychromatic or continuous spectrum light sources, the composite melatonin suppression power per lux, SLC(λ), can be expressed as follows.
Where SI (λ) is measured spectrum of a given light source.
2.4.3. Spectrum Resemblance Index (SRI)
Proposed by Jou et al [46]., SRI evaluates the similarity between a test light source and natural light based on human visual perception by comparing the luminance spectrum of the test source with that of blackbody radiation at an identical color temperature. The calculation formula can be expressed as follows.
Where LBRLS (λ,T) represents the luminance spectrum of the blackbody radiation after brightness normalization, and Ls (λ,T) denotes the overlapping area between the luminance spectrum of the test light source and the corresponding blackbody radiation spectrum.
3. Results and Discussion
Figure 2 illustrates the schematic energy-level diagram of the studied candlelight OLEDs, with the corresponding detailed HIL configurations and SAM concentrations summarized in Table 1. All devices share a common architecture of ITO/variable HIL configurations/TCTA:Ir(ppy)3:Ir(2-phq)3/TPBi/LiF/Al. As tabulated, the investigation encompasses three primary categories: Device I serves as the control group incorporating a single conventional PEDOT:PSS layer, Devices II-1 to II-3 consist of a single MeO-2PACz layer with concentrations varying from 0.3 to 2.0 mg/mL, and Devices III-1 to III-3 feature a bilayer structure composed of MeO-2PACz deposited on PEDOT:PSS at equivalent concentration intervals.
By introducing the SAM interlayer to establish a stepped injection configuration, the substantial energy barrier of 0.8 eV between PEDOT:PSS (HOMO=−4.9 eV) and the TCTA host matrix (HOMO=−5.7 eV) is effectively partitioned into two smaller energetic steps of 0.4 eV each. This alignment is strategically designed to mitigate the hole injection resistance across the organic hetero-interfaces. Furthermore, the shallower LUMO level of the SAM (−2.12 eV) compared to that of PEDOT:PSS (−3.3 eV) provides a more effective electron-blocking barrier against the LUMO level of TCTA (−2.3 eV), thereby suppressing non-radiative electron leakage at high luminance.
To evaluate the impact of different HIL configurations on device performance, the power efficacy, current efficiency, and external quantum efficiency as a function of luminance are depicted in Figure 3(a),(b),(c), respectively, with key performance metrics summarized in Table 2.
When PEDOT:PSS is entirely replaced by a single-layer SAM (Device II), all efficiency metrics decline substantially. At 1,000 cd/m², Device I exhibits a PE, CE, and EQE of 16.1 lm/W, 21.1 cd/A, and 9.0%, whereas those of Device II decrease by up to 61, 51, and 51%, respectively (as low as 6.3 lm/W, 10.3 cd/A, and 4.4%). Nevertheless, Device II demonstrates a notably flatter efficiency–luminance profile with reduced roll-off at high luminance, owing to the superior electron-blocking capability of the SAM layer.
By introducing the bilayer stepped HIL, the reduced hole injection resistance enables Device III to enhance efficiency across all investigated concentrations, with Device III-2 yielding the most pronounced improvement. Specifically, at a practical luminance of 1,000 cd/m², Device III-2 achieves a PE, CE, and EQE of 19.7 lm/W, 24.2 cd/A, and 10.1%, representing substantial increments of 22, 15, and 12% over Device I, respectively. At an elevated luminance of 10,000 cd/m², Device III-2 continues to outperform Device I, achieving a power efficacy of 8.7 lm/W, a current efficiency of 16.7 cd/A, and an EQE of 6.9%, corresponding to improvements of 34, 22, and 19%, respectively. Furthermore, within the luminance range of 1,000 to 10,000 cd/m², the EQE drop of Device III-2 is restricted to 31.8% compared to the 35.1% drop observed in Device I, demonstrating superior efficiency stability at high brightness. Driven by this optimized charge balance, the maximum luminance is simultaneously elevated from 23,230 to 28,340 cd/m², achieving a 22% enhancement.
Figure 4 illustrates the J–V and L–V characteristics of all studied devices. As shown in Figure 4(a),(b), replacing PEDOT:PSS entirely with a single-layer SAM (Device II) induces a pronounced rightward shift in both curves, indicating a higher driving voltage is required to achieve equivalent current density and luminance compared to Device I. This behavior is consistent with the insufficient hole injection arising from the work function mismatch at the ITO/organic interface in the absence of PEDOT:PSS. More critically, Device II also exhibits a pronounced leakage current in the sub-threshold region (< 2.5 V), attributed to the inherent surface roughness of ITO, where protruding spikes remain exposed above the ultrathin SAM layer, forming localized conduction pathways that lead to non-radiative current flow prior to device turn-on.
Conversely, Device III demonstrates clear improvements across all metrics, with current density increasing progressively with SAM concentration at equivalent driving voltages. While the luminance outputs remain comparable across all Device III configurations, the sub-threshold leakage current is reduced by up to two orders of magnitude compared to Device I, and the turn-on voltage is lowered by approximately 0.1 V. These results suggest that the improvement in device performance is primarily governed by the hole injection characteristics of HIL, which will be further examined in the following section.
To further elucidate the origin of this improvement, the current density–voltage characteristics of hole-only devices comparing Device I and Device III at various SAM concentrations were measured, with a device structure of ITO/HIL/TCTA/Al, as shown in Figure 5. Within the low-voltage regime, Device III-1 to III-3 exhibit substantially higher current densities than Device I, confirming that the bilayer stepped HIL effectively reduces the injection barrier and enhances hole injection capability. This enhancement can be attributed to two cooperative mechanisms: the stepped energy level structure formed by MeO-2PACz, which partitions the original injection barrier into two smaller energetic steps, and the p-type doping effect induced by its phosphonic acid group at the PEDOT:PSS interface, which may further promote interfacial charge transfer [47]. Moreover, the current density increases progressively with SAM concentration, suggesting that higher SAM coverage on the PEDOT:PSS surface leads to more complete interfacial modification and thus more efficient hole injection.
To further investigate the monolayer coverage of SAM on different surfaces, deionized water contact angle measurements were performed, as shown in Figure 6. Results reveal distinct film-forming behaviors attributed to differences in their respective anchoring mechanisms.
On UV-ozone-treated ITO surface, the contact angle remains stable at approximately 57–58° regardless of concentration, suggesting that sufficient surface coverage is achieved even at the lowest concentration of 0.3 mg/mL, with further increases in concentration yielding no additional change in surface wettability. This behavior is attributed to the strong chemisorption bonds formed between the phosphonic acid head groups of MeO-2PACz and the hydroxyl groups on the ITO surface [48], which enable rapid molecular adsorption.
In contrast, when SAM is deposited onto PEDOT:PSS surface, the contact angle rises progressively from 18° to 39°, 45°, and 53° as concentration increases from 0 to 0.3, 1.0, and 2.0 mg/mL, indicating a strongly concentration-dependent adsorption behavior. This behavior may be attributed to the ionic interaction between the deprotonated phosphonic acid group and the sulfonium cation of PEDOT [49], which compared to the strong chemisorption on ITO, provides a weaker driving force that requires a higher solution concentration to sustain surface coverage.
Despite the higher surface coverage achieved by Device II, its efficiency remains significantly lower than that of Device I, which can be attributed to the inherent surface roughness of ITO, approximately 3.76 nm. The protruding spikes on the ITO surface are prone to inducing leakage current through localized short-circuiting, as evidenced by the J-V characteristics discussed previously. Furthermore, these sharp protrusions facilitate tip discharge, leading to dielectric breakdown and substantially degrading the luminance performance of the devices. Upon spin-coating a PEDOT:PSS layer of approximately 40 nm onto the ITO surface, the surface roughness is reduced from 3.76 to 1.26 nm, as confirmed by our previous study [50]. This planarization effectively suppresses leakage current and tip discharge, thereby accounting for the superior efficiency and luminance performance observed in Device III.
Among the Device III configurations, the superior performance of Device III-2 can be rationalized by the interplay between interfacial coverage and charge balance. The progressive SAM film formation with increasing concentration reduces hole injection resistance, as corroborated by the hole-only device characteristics (Figure 5). However, while current density continues to increase from Device III-2 to III-3, no corresponding luminance enhancement is observed (Figure 4), suggesting that excessive hole injection disrupts charge balance within the emitting layer, driving the additional current toward non-radiative recombination. Device III-2 at 1.0 mg/mL therefore represents the optimal trade-off between sufficient interfacial coverage and charge balance.
To confirm that the observed efficiency enhancement was not accompanied by any shift in emission color, the normalized electroluminescence (EL) spectra and CIE chromaticity diagram at 1,000 cd/m² are shown in Figure 7. The results indicate that the emission peaks of all devices are near 584 nm, with the EL spectral profiles almost completely overlapping; the corresponding CIE coordinates are approximately (0.55, 0.44). This confirms that adjustment of the HIL structure did not interfere with the exciton recombination mechanism within the EML, ensuring that the device maintains a highly consistent spectral power distribution while achieving performance improvements.
Based on the stable electroluminescence characteristics, a quantitative evaluation of the retinal friendliness indicators (MPE and MSS) and light quality metrics (CT, CRI, and SRI) was performed at an illuminance of 100 lx, with conventional solid-state lighting sources incorporated as benchmark baselines, as summarized in Table 3.
The color temperatures of the fabricated devices range between 1,944 K and 2,050 K, with Device III exhibiting a color temperature of approximately 1,994 K, which is closer to traditional candles than that of Device II. Owing to this lower color temperature and reduced short-wavelength emission, all fabricated candlelight devices demonstrate exceptionally high retinal friendliness. Conventional cold-white LEDs and OLEDs exhibit severely low MPE values of 343 and 548 seconds, respectively. In stark contrast, Device III-2 achieves an MPE of 71,211 seconds (approximately 19.8 hours), representing a 130-fold enhancement in retinal safety over the cold-white OLED benchmark (208-fold over cold-white LED), effectively eliminating retinal hazard risk under typical indoor lighting durations.
Regarding circadian rhythm indicators, the MSS values of Device III-2 under short- and long-term exposure scenarios (1.5 and 6.5 hours) are restricted to only 25 and 32%, remaining well contained even under prolonged illumination, in stark contrast to the 83% suppression observed in conventional cold-white sources.
In terms of light quality, the SRI of all devices remains stable at 76, while the CRI is maintained at approximately 39 ± 1. The relatively low CRI of the fabricated candlelight OLED is mainly attributed to their narrow orange-red emission profile and reduced short-wavelength component, reflecting a spectral trade-off between color rendering and physiological safety [30].
4. Conclusions
In summary, this study demonstrates a high-efficiency wet-processed candlelight OLED by incorporating a MeO-2PACz self-assembled monolayer between PEDOT:PSS and the emissive layer to construct a stepped bilayer hole injection architecture. The optimized device with a SAM concentration of 1.0mg/mL achieves a power efficacy of 19.7lm/W, current efficiency of 24.2cd/A, and EQE of 10.1% at 1,000cd/m², corresponding to improvements of 22, 15, and 12%, respectively, compared with the PEDOT:PSS-only control. This enhancement is mainly attributed to the stepped energy-level alignment introduced by MeO-2PACz, which reduces the hole injection barrier and facilitates hole injection into the emissive layer. Notably, at a high luminance of 10,000cd/m², the optimized device still maintains enhanced power efficacy, current efficiency, and EQE by 34%, 22%, and 19%, respectively. The sustained efficiency improvement under high-luminance operation can be associated with the electron-blocking capability of the MeO-2PACz LUMO level, which suppresses non-radiative electron leakage. Meanwhile, the device maintains a stable candlelight emission without altering the EL spectral profile, exhibiting a color temperature of 1,991K and an MPE of 71,211s at 100lx, which is 130 times longer than that of a cold-white OLED. The melatonin suppression sensitivity is also limited to 32% after 6.5h exposure. These results suggest that the MeO-2PACz-based bilayer interfacial strategy provides an effective and scalable route for developing high-efficiency, retina-friendly, solution-processed candlelight OLEDs.
Author Contributions
Conceptualization, Z.-C.L., S.-Z.C. and J.-H.J.; methodology, Z.-C.L. and S.-Z.C.; investigation, Z.-C.L.; validation, Z.-C.L.; formal analysis, Z.-C.L.; data curation, Z.-C.L.; visualization, Z.-C.L.; writing—original draft preparation, Z.-C.L. and R.-J.X.; writing—review and editing, R.-J.X. and J.-H.J.; supervision, J.-H.J.
Funding
This research received no external funding.
Acknowledgments
The authors gratefully appreciate the research platform provided by National Tsing Hua University. The technical support and helpful assistance from the colleagues and researchers within the laboratory are also gratefully acknowledged.
Data Availability
All data generated or analyzed during this study are included in this article.
Conflicts of Interest
The authors declare no conflict of interest.
References
- Hammond, B.R.; Buch, J. The evidentiary basis and challenges associated with studying the role of light damage on ocular health. Journal of Optometry 2026, 19(3), 100616. [CrossRef]
- Organisciak, D.T.; Vaughan, D.K. Retinal light damage: mechanisms and protection. Progress in retinal and eye research 2010, 29(2), 113–134. [CrossRef]
- Walker, D.P.; Vollmer-Snarr, H.R.; Eberting, C.L.D. Ocular hazards of blue-light therapy in dermatology. Journal of the American Academy of Dermatology 2012, 66(1), 130–135. [CrossRef]
- Sparrow, J.R.; Nakanishi, K.; Parish, C.A. The lipofuscin fluorophore A2E mediates blue light–induced damage to retinal pigmented epithelial cells. Investigative ophthalmology & visual science 2000, 41(7), 1981–1989.
- Grimm, C.; Wenzel, A.; Williams, T.P.; Rol, P.O.; Hafezi, F.; Remé, C.E. Rhodopsin-mediated blue-light damage to the rat retina: effect of photoreversal of bleaching. Investigative ophthalmology & visual science 2001, 42(2), 497–505.
- Lin, C.H.; Wu, M.R.; Li, C.H.; Cheng, H.W.; Huang, S.H.; Tsai, C.H.; et al. Editor's highlight: periodic exposure to smartphone-mimic low-luminance blue light induces retina damage through Bcl-2/BAX-dependent apoptosis. Toxicological Sciences 2017, 157(1), 196–210. [CrossRef]
- Kuse, Y.; Ogawa, K.; Tsuruma, K.; Shimazawa, M.; Hara, H. Damage of photoreceptor-derived cells in culture induced by light emitting diode-derived blue light. Scientific reports 2014, 4(1), 5223. [CrossRef]
- King, A.; Gottlieb, E.; Brooks, D.G.; Murphy, M.P.; Dunaief, J.L. Mitochondria-derived reactive oxygen species mediate blue light-induced death of retinal pigment epithelial cells¶. Photochemistry and photobiology 2004, 79(5), 470–475. [CrossRef]
- Sharma, A.; Regillo, C.D.; Kuppermann, B.D.; PRISM Study Group. Photic retinal injury: Time to move beyond case reports—A PRISM Study Group perspective. Eye 2026. [CrossRef]
- Ripandelli, G.; Coppé, A.M.; Parisi, V.; Stirpe, M. Fellow eye findings of highly myopic subjects operated for retinal detachment associated with a macular hole. Ophthalmology 2008, 115(9), 1489–1493. [CrossRef]
- Takano, M.; Kishi, S. Foveal retinoschisis and retinal detachment in severely myopic eyes with posterior staphyloma. American journal of ophthalmology 1999, 128(4), 472–476. [CrossRef]
- Liu, Y.C.; Wilkins, M.; Kim, T.; Malyugin, B.; Mehta, J.S. Cataracts. The Lancet 2017, 390(10094), 600–612. [CrossRef]
- Pan, C.W.; Cheng, C.Y.; Saw, S.M.; Wang, J.J.; Wong, T.Y. Myopia and age-related cataract: a systematic review and meta-analysis. American journal of ophthalmology 2013, 156(5), 1021–1033. [CrossRef]
- Wu, X.; Zhang, X.; Jiang, Y.; Gu, Z.; Li, C.; Zhu, X.; Huang, Y.; Li, B.; Ma, M.; Zhao, S.; et al. Association of high-intensity evening light exposure with risk of incident age-related macular degeneration, cataract, and glaucoma: a prospective cohort study of 82,826 participants. GeroScience 2026. [CrossRef]
- Mitchell, P.; Hourihan, F.; Sandbach, J.; Wang, J.J. The relationship between glaucoma and myopia: the Blue Mountains Eye Study. Ophthalmology 1999, 106(10), 2010–2015.
- Rukmini, A.V.; Milea, D.; Baskaran, M.; How, A.C.; Perera, S.A.; Aung, T.; Gooley, J.J. Pupillary responses to high-irradiance blue light correlate with glaucoma severity. Ophthalmology 2015, 122(9), 1777–1785. [CrossRef]
- Marcus, M.W., de Vries, M.M.; Montolio, F.G.J.; Jansonius, N.M. Myopia as a risk factor for open-angle glaucoma: a systematic review and meta-analysis. Ophthalmology 2011, 118(10), 1989–1994. [CrossRef]
- Morgan, I.G.; Ohno-Matsui, K.; Saw, S.M. Myopia. The Lancet 2012, 379(9827), 1739–1748. [CrossRef]
- RABB, M.F.; GAROON, I.; LA FRANCO, F.P. Myopic macular degeneration. International ophthalmology clinics 1981, 21(3), 51–69. [CrossRef]
- Gooley, J.J.; Rajaratnam, S.M.; Brainard, G.C.; Kronauer, R.E.; Czeisler, C.A.; Lockley, S.W. Spectral responses of the human circadian system depend on the irradiance and duration of exposure to light. Science translational medicine 2010, 2(31), 31ra33–31ra33. [CrossRef]
- Brainard, G.C.; Sliney, D.; Hanifin, J.P.; Glickman, G.; Byrne, B.; Greeson, J.M.; et al. Sensitivity of the human circadian system to short-wavelength (420-nm) light. Journal of biological rhythms 2008, 23(5), 379–386. [CrossRef]
- West, K.E.; Jablonski, M.R.; Warfield, B.; Cecil, K.S.; James, M.; Ayers, M.A.; et al. Blue light from light-emitting diodes elicits a dose-dependent suppression of melatonin in humans. Journal of applied physiology 2011, 110(3), 619–626. [CrossRef]
- Stevens, R.G.; Brainard, G.C.; Blask, D.E.; Lockley, S.W.; Motta, M.E. Breast cancer and circadian disruption from electric lighting in the modern world. CA: a cancer journal for clinicians 2014, 64(3), 207–218. [CrossRef]
- Sigurdardottir, L.G.; Markt, S.C.; Rider, J.R.; Haneuse, S.; Fall, K.; Schernhammer, E.S.; et al. Urinary melatonin levels, sleep disruption, and risk of prostate cancer in elderly men. European urology 2015, 67(2), 191–194. [CrossRef]
- Stevens, R.G.; Davis, S. The melatonin hypothesis: electric power and breast cancer. Environmental health perspectives 1996, 104(Suppl 1), 135. [CrossRef]
- Stevens, R.G.; Blask, D.E.; Brainard, G.C.; Hansen, J.; Lockley, S.W.; Provencio, I.; et al. Meeting report: the role of environmental lighting and circadian disruption in cancer and other diseases. Environmental health perspectives 2007, 115(9), 1357. [CrossRef]
- Paul, B.M.; Einhorn, H.D. Discomfort glare from small light sources. International Journal of Lighting Research and Technology 1999, 31(4), 139–144. [CrossRef]
- Kasahara, T.; Aizawa, D.; Irikura, T.; Moriyama, T.; Toda, M.; Iwamoto, M. Discomfort glare caused by white LED light sources. Journal of Light & Visual Environment 2006, 30(2), 95–103. [CrossRef]
- Jou, J.H.; Hsieh, C.Y.; Tseng, J.R.; Peng, S.H.; Jou, Y.C.; Hong, J.H.; et al. Candle light-style organic light-emitting diodes. Advanced Functional Materials 2013, 23(21), 2750–2757. [CrossRef]
- Jou, J.H.; Su, Y.T.; Liu, S.H.; He, Z.K.; Sahoo, S.; Yu, H.H.; et al. Wet-process feasible candlelight OLED. Journal of Materials Chemistry C 2016, 4(25), 6070–6077. [CrossRef]
- Lai, C.F.; Hsieh, C.L.; Wu, C.J. Light-spectrum modification of warm white-light-emitting diodes with 3D colloidal photonic crystals to approximate candlelight. Optics Letters 2013, 38(18), 3612–3615. [CrossRef]
- Sudheendran Swayamprabha, S.; Dubey, D.K.; Shahnawaz; Yadav, R.A.K.; Nagar, M.R.; Sharma, A.; et al. Approaches for long lifetime organic light emitting diodes. Advanced Science 2021, 8(1), 2002254. [CrossRef]
- Chiadmi, Y.; Cicek, P.V.; Izquierdo, R. Solution-Processed OLEDs: A Critical Review and Methodology Proposal for Stack Optimization. Micromachines 2026, 17(2), 217. [CrossRef]
- Love, J.C.; Estroff, L.A.; Kriebel, J.K.; Nuzzo, R.G.; Whitesides, G.M. Self-assembled monolayers of thiolates on metals as a form of nanotechnology. Chemical reviews 2005, 105(4), 1103–1170. [CrossRef]
- Ulman, A. Formation and structure of self-assembled monolayers. Chemical reviews 1996, 96(4), 1533–1554. [CrossRef]
- De Boer, B.; Hadipour, A.; Mandoc, M.M., Van Woudenbergh, T.; Blom, P.W. Tuning of metal work functions with self-assembled monolayers. Advanced Materials 2005, 17(5), 621–625. [CrossRef]
- Bedis, H. Effect of self-assembled monolayers on the performance of organic photovoltaic cells. Journal of Surface Engineered Materials and Advanced Technology 2011, 1(2), 42.
- Al-Ashouri, A.; Köhnen, E.; Li, B.; Magomedov, A.; Hempel, H.; Caprioglio, P.; et al. Monolithic perovskite/silicon tandem solar cell with> 29% efficiency by enhanced hole extraction. Science 2020, 370(6522), 1300–1309. [CrossRef]
- Han, P.; Zhang, Y. Recent Advances in Carbazole-Based Self-Assembled Monolayer for Solution-Processed Optoelectronic Devices. Advanced Materials 2024, 36(33), 2405630. [CrossRef]
- Zhong, L.; Liu, C.; Lai, S.; Li, B.E.; Zheng, B.; Zhang, X. Recent advances in self-assembled molecular application in solar cells. Nanomaterials 2024, 14(9), 779. [CrossRef]
- Gkeka, D.; Hamilton, I.; Stavridis, T.; Liu, Z.; Faber, H.; Naphade, D.; et al. Tuning Hole-Injection in Organic-Light Emitting Diodes with Self-Assembled Monolayers. ACS Applied Materials & Interfaces 2024, 16(30), 39728–39736. [CrossRef]
- Li, J.; Zong, W.; Li, X.; Jia, X.; Qin, D. The enhanced performance of organic light-emitting diode with self-assembled monolayer assisting hole injection. Optical Materials 2025, 159, 116634. [CrossRef]
- Kim, T.H.; Kim, B.W.; Im, S.H. A Self-Assembling Molecule for Improving the Mobility in PEDOT: PSS Hole Transport Layer for Efficient Perovskite Light-Emitting Diodes. Advanced Electronic Materials 2025, 11(6), 2400626. [CrossRef]
- International Commission on Non-Ionizing Radiation Protection. ICNIRP guidelines on limits of exposure to incoherent visible and infrared radiation. Health Physics 2013, 105(1), 74–96. [CrossRef]
- Jou, J.-H. Melatonin Suppression Extent Measuring Device U.S. Patent 8,812,242 B2, 2014. U.S. Patent and Trademark Office.
- Jou, J.H.; Chou, K.Y.; Yang, F.C.; Agrawal, A.; Chen, S.Z.; Tseng, J.R.; et al. A universal, easy-to-apply light-quality index based on natural light spectrum resemblance. Applied Physics Letters 2014, 104(20). [CrossRef]
- Chen, M.; Kapil, G.; Wang, L.; Sahamir, S.R.; Baranwal, A.K.; Nishimura, K.; et al. High performance wide bandgap Lead-free perovskite solar cells by monolayer engineering. Chemical Engineering Journal 2022, 436, 135196. [CrossRef]
- Hotchkiss, P.J.; Jones, S.C.; Paniagua, S.A.; Sharma, A.; Kippelen, B.; Armstrong, N.R.; Marder, S.R. The modification of indium tin oxide with phosphonic acids: mechanism of binding, tuning of surface properties, and potential for use in organic electronic applications. Accounts of chemical research 2012, 45(3), 337–346. [CrossRef]
- Cho, S.; Pandey, P.; Yoon, S.; Ryu, J.; Lee, D.G.; Shen, Q.; et al. Anchoring self-assembled monolayer at perovskite/hole collector interface for wide bandgap Sn-based solar cells with a record efficiency over 12%. Surfaces and Interfaces, 42, 103478. 2023. [CrossRef]
- Kesavan, K.K.; Lee, H.; Swyamprabha, S.S.; Tavgeniene, D.; Blazevicius, D.; Krucaite, G.; et al. Solution processable fluorene-based hole transporting materials for high-efficiency OLEDs. Synthetic Metals 2025, 117921. [CrossRef]
Figure 1.
Chemical molecular structure of (2-(3,6-dimethoxy-9H-carbazol-9-yl)ethyl)phosphonic acid (MeO-2PACz) utilized as the self-assembled monolayer in this study.
Figure 1.
Chemical molecular structure of (2-(3,6-dimethoxy-9H-carbazol-9-yl)ethyl)phosphonic acid (MeO-2PACz) utilized as the self-assembled monolayer in this study.
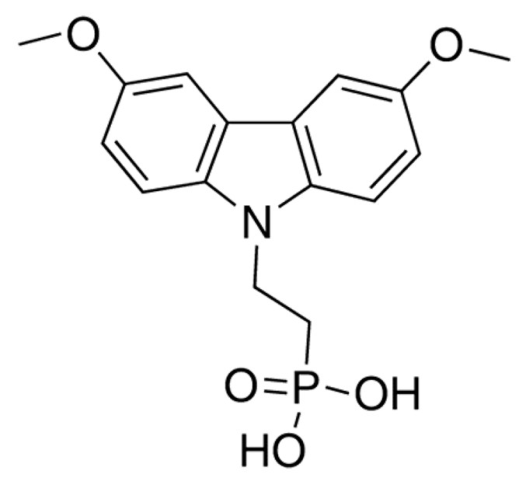
Figure 2.
Schematic energy-level diagram of the studied candlelight OLEDs incorporating different hole injection materials, i.e. a single layer of PEDOT:PSS (Device I), a single layer of MeO-2PACz (Device II), and a bilayer of MeO-2PACz on PEDOT:PSS (Device III).
Figure 2.
Schematic energy-level diagram of the studied candlelight OLEDs incorporating different hole injection materials, i.e. a single layer of PEDOT:PSS (Device I), a single layer of MeO-2PACz (Device II), and a bilayer of MeO-2PACz on PEDOT:PSS (Device III).
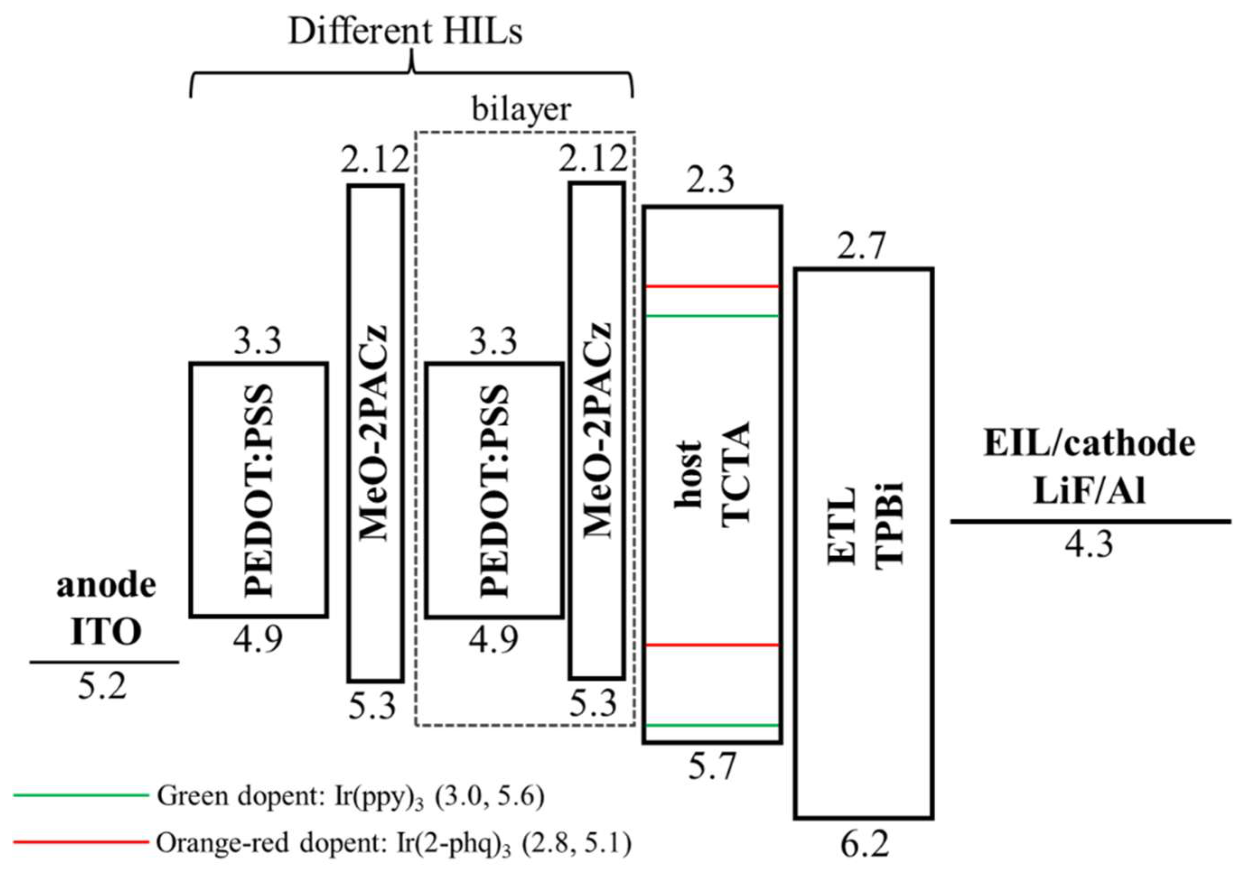
Figure 3.
Effects of different HIL configurations and SAM concentrations on the (a) power efficacy, (b) current efficiency, and (c) external quantum efficiency of the candlelight OLEDs.
Figure 3.
Effects of different HIL configurations and SAM concentrations on the (a) power efficacy, (b) current efficiency, and (c) external quantum efficiency of the candlelight OLEDs.
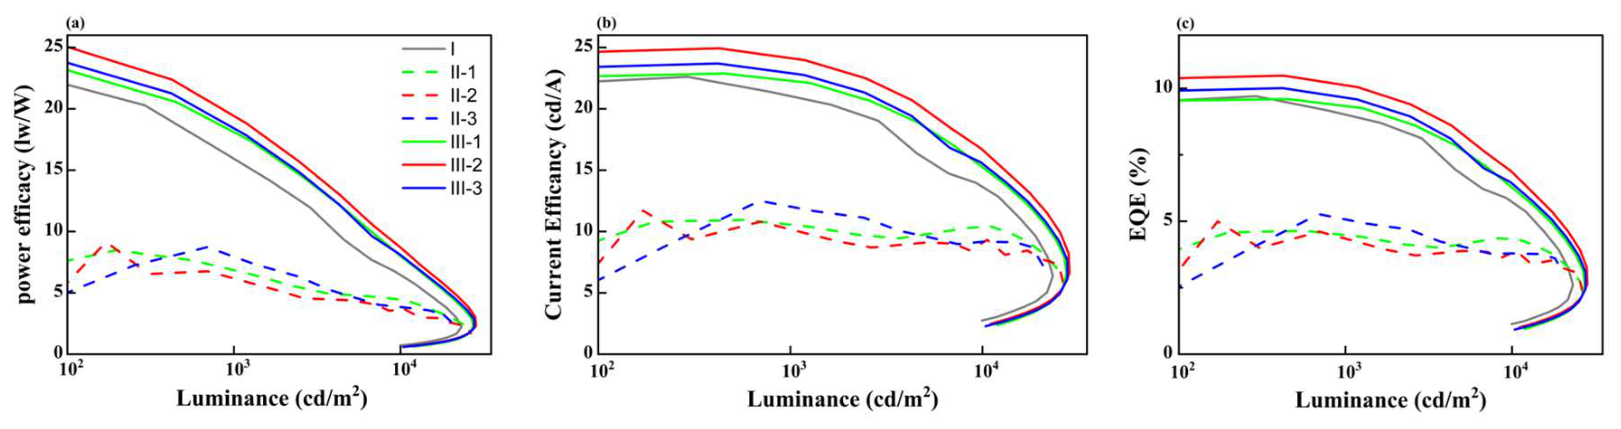
Figure 4.
Characteristics of the studied candlelight OLEDs with different HIL configurations and SAM concentrations: (a) current density versus voltage, (b) luminance versus voltage.
Figure 4.
Characteristics of the studied candlelight OLEDs with different HIL configurations and SAM concentrations: (a) current density versus voltage, (b) luminance versus voltage.
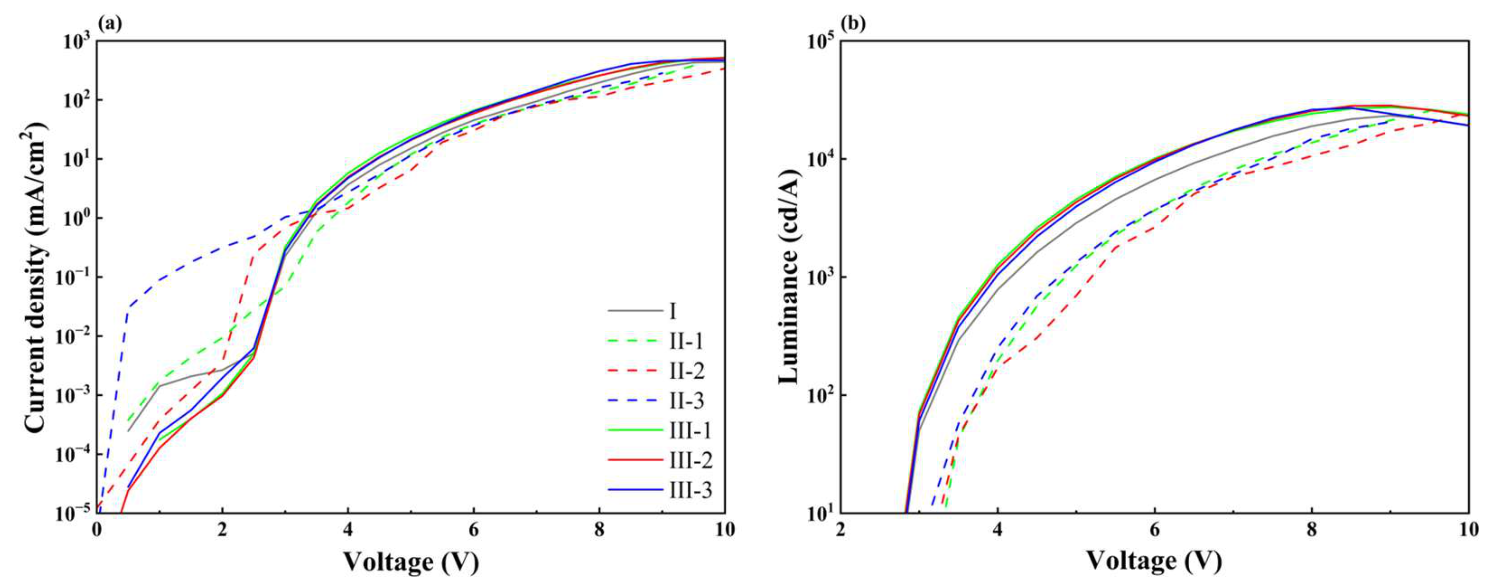
Figure 5.
Current density–voltage characteristics of hole-only devices comparing Device I and Device III at various SAM concentrations, with a structure of ITO/HIL/TCTA/Al.
Figure 5.
Current density–voltage characteristics of hole-only devices comparing Device I and Device III at various SAM concentrations, with a structure of ITO/HIL/TCTA/Al.
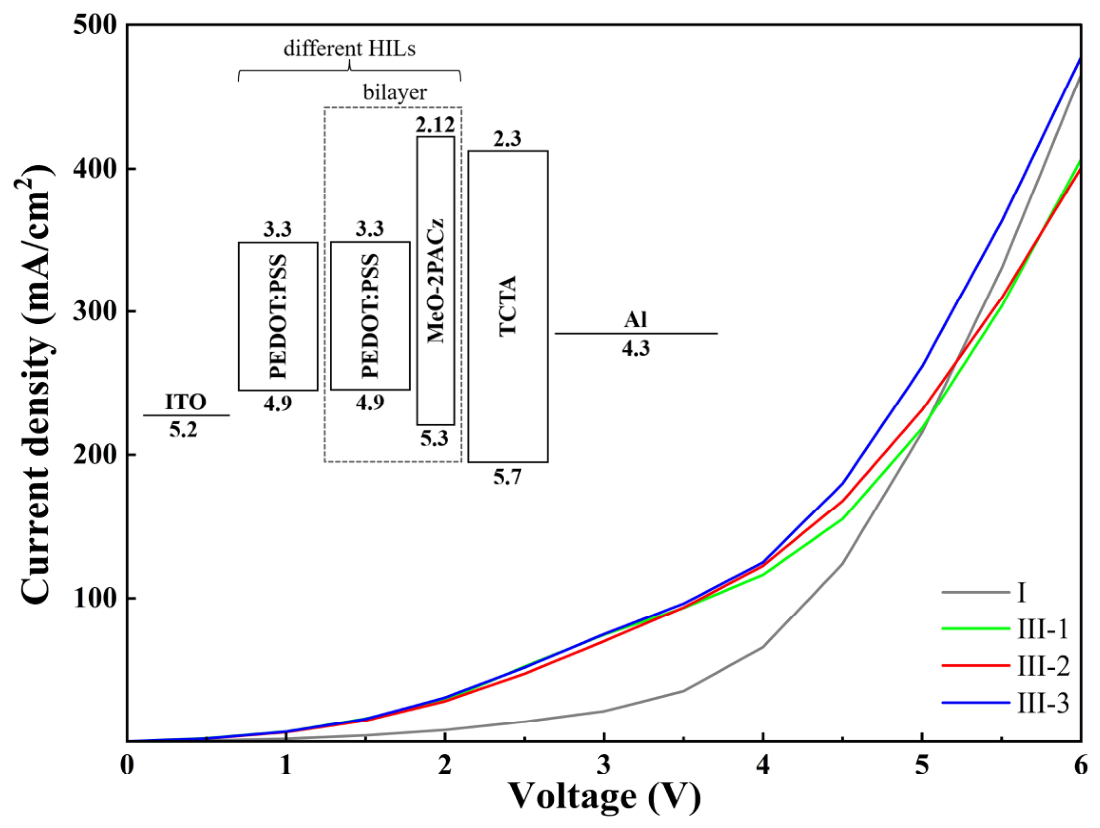
Figure 6.
Surface coverage of SAM on (a) UV-treated ITO and (b) PEDOT:PSS surfaces before and after SAM modification at various concentrations (0.3, 1.0, and 2.0 mg/mL), as characterized by deionized water contact angle measurements.
Figure 6.
Surface coverage of SAM on (a) UV-treated ITO and (b) PEDOT:PSS surfaces before and after SAM modification at various concentrations (0.3, 1.0, and 2.0 mg/mL), as characterized by deionized water contact angle measurements.
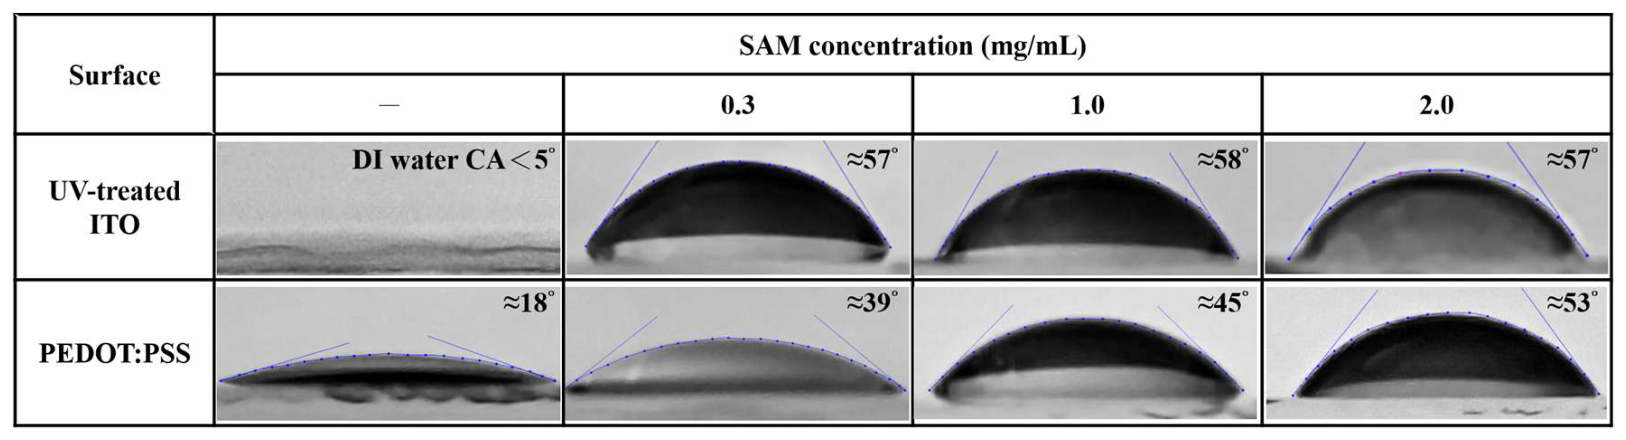
Figure 7.
Effects of different HIL configurations and SAM concentrations on the electroluminescence spectra and the corresponding CIE color coordinates of the candlelight OLEDs.
Figure 7.
Effects of different HIL configurations and SAM concentrations on the electroluminescence spectra and the corresponding CIE color coordinates of the candlelight OLEDs.
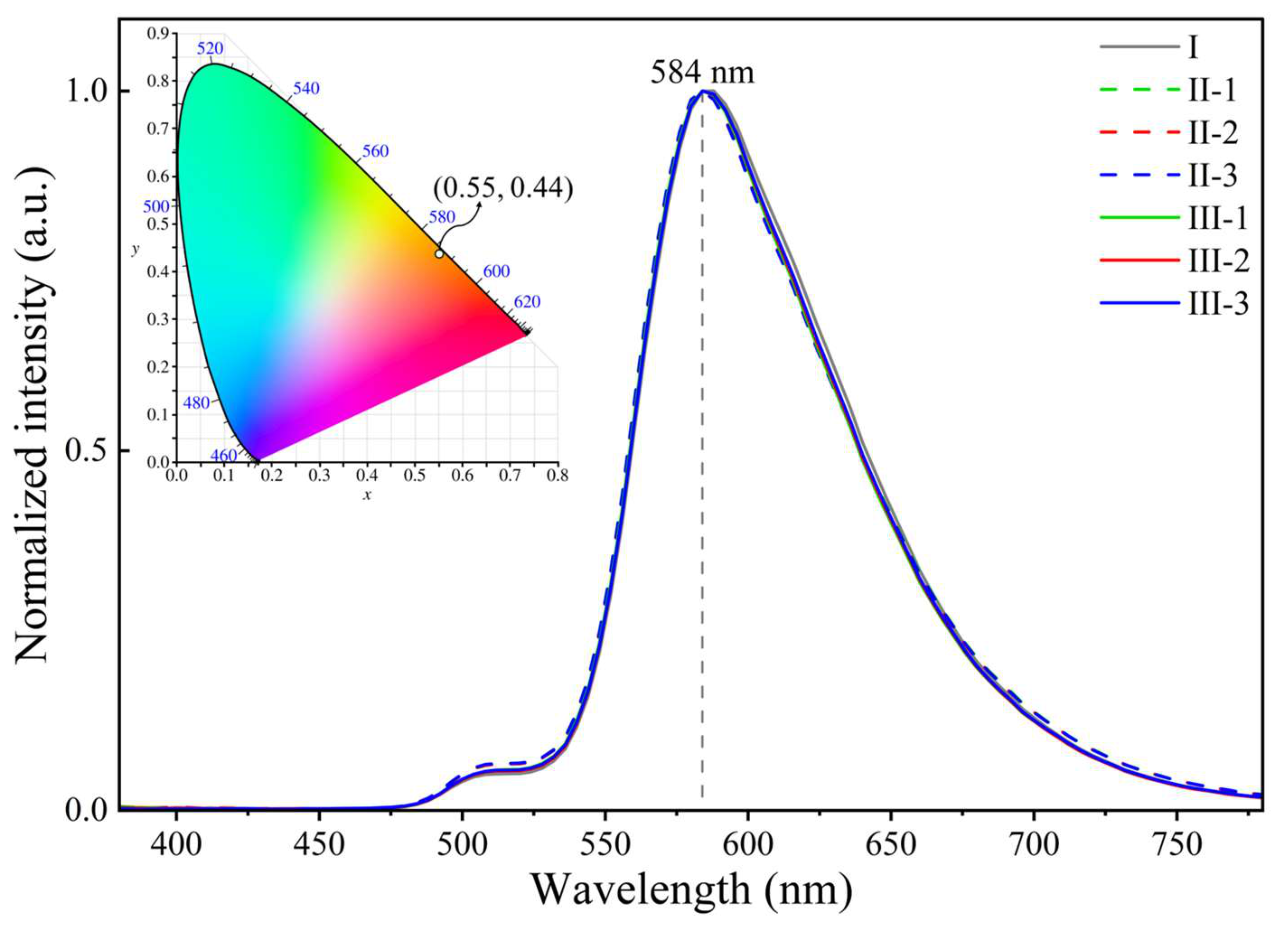

Table 1.
Detailed HIL configurations and corresponding SAM concentrations for the studied candlelight OLEDs (devices I, II-1 to II-3, and III-1 to III-3) schematically illustrated in Figure 2.
Table 1.
Detailed HIL configurations and corresponding SAM concentrations for the studied candlelight OLEDs (devices I, II-1 to II-3, and III-1 to III-3) schematically illustrated in Figure 2.
| Device ID | HIL structure | SAM concentration (mg/mL) |
|---|---|---|
| I | PEDOT:PSS | — |
| II-1 | MeO-2PACz | 0.3 |
| II-2 | MeO-2PACz | 1.0 |
| II-3 | MeO-2PACz | 2.0 |
| III-1 | PEDOT:PSS/MeO-2PACz | 0.3 |
| III-2 | PEDOT:PSS/MeO-2PACz | 1.0 |
| III-3 | PEDOT:PSS/MeO-2PACz | 2.0 |
Table 2.
Effects of different HIL configurations and SAM concentrations on the electroluminescence properties of the candlelight OLEDs. @ 100/1,000/10,000 cd/m² (Operation Voltage, Power Efficacy, Current Efficiency, EQE, CIE).
Table 2.
Effects of different HIL configurations and SAM concentrations on the electroluminescence properties of the candlelight OLEDs. @ 100/1,000/10,000 cd/m² (Operation Voltage, Power Efficacy, Current Efficiency, EQE, CIE).
| Device ID | Driving Voltage (V) | Operation Voltage (V) | Power Efficacy (lm/W) | Current Efficiency (cd/A) | EQE (%) | CIE | Max Luminance (cd/m²) |
|---|---|---|---|---|---|---|---|
| I | 2.7 | 3.1 / 4.1 / 6.6 | 22.5 / 16.1 / 6.5 | 22.1 / 21.1 / 13.7 | 9.5 / 9.0 / 5.8 | (0.55, 0.44) / (0.55, 0.44) / (0.55, 0.45) | 23,230 |
| II-1 | 3.1 | 3.7 / 4.8 / 7.3 | 7.3 / 6.9 / 4.5 | 8.6 / 10.6 / 10.4 | 3.7 / 4.5 / 4.3 | (0.55, 0.45) / (0.55, 0.45) / (0.54, 0.45) | 25,510 |
| II-2 | 3.1 | 3.7 / 5.1 / 7.9 | 4.5 / 6.3 / 3.6 | 5.7 / 10.3 / 9.1 | 2.4 / 4.4 / 3.8 | (0.55, 0.45) / (0.55, 0.45) / (0.54, 0.45) | 26,400 |
| II-3 | 3.0 | 3.6 / 4.7 / 7.5 | 4.5 / 8.1 / 3.9 | 5.2 / 12.1 / 9.2 | 2.2 / 5.1 / 3.8 | (0.55, 0.45) / (0.55, 0.45) / (0.54, 0.45) | 20,580 |
| III-1 | 2.6 | 3.0 / 3.8 / 6.0 | 23.5 / 18.4 / 8.0 | 22.6 / 22.4 / 15.3 | 9.5 / 9.4 / 6.3 | (0.55, 0.44) / (0.55, 0.45) / (0.54, 0.45) | 27,420 |
| III-2 | 2.6 | 3.0 / 3.9 / 6.0 | 25.4 / 19.7 / 8.7 | 24.6 / 24.2 / 16.7 | 10.8 / 10.1 / 6.9 | (0.55, 0.44) / (0.55, 0.44) / (0.54, 0.45) | 28,340 |
| III-3 | 2.6 | 3.0 / 3.9 / 6.0 | 24.2 / 18.7 / 8.1 | 24.3 / 23 / 15.5 | 9.9 / 9.7 / 6.5 | (0.55, 0.44) / (0.55, 0.44) / (0.54, 0.45) | 27,690 |
Table 3.
Comparison of color temperature, health effects (MPE, MSS), and light quality metrics (SRI, CRI) between the fabricated candlelight OLED devices and conventional light sources, evaluated at an illuminance of 100 lx.
Table 3.
Comparison of color temperature, health effects (MPE, MSS), and light quality metrics (SRI, CRI) between the fabricated candlelight OLED devices and conventional light sources, evaluated at an illuminance of 100 lx.
| Light Source | CT (K) | MPE (s) @100 lx |
MSS (%) @1.5 h @100 lx |
MSS (%) @6.5 h @100 lx |
SRI | CRI |
|---|---|---|---|---|---|---|
| Candle | 1,816 | 16,475 | 15 | 26 | 99 | 97 |
| LED — Warm-white | 2,632 | 990 | 55 | 71 | 96 | 93 |
| LED — Cold-white | 5,501 | 343 | 64 | 83 | 94 | 84 |
| OLED — Warm-white | 3,187 | 1,099 | 32 | 41 | 90 | 81 |
| OLED — Cold-white | 4,124 | 548 | 64 | 83 | 90 | 79 |
| OLED — Candlelight I | 1,944 | 80,016 | 23 | 30 | 76 | 39 |
| OLED — Candlelight II-1 | 2,033 | 68,124 | 27 | 34 | 76 | 40 |
| OLED — Candlelight II-2 | 2,050 | 60,015 | 27 | 34 | 76 | 40 |
| OLED — Candlelight II-3 | 2,039 | 63,556 | 26 | 34 | 76 | 40 |
| OLED — Candlelight III-1 | 2,003 | 66,182 | 23 | 29 | 76 | 39 |
| OLED — Candlelight III-2 | 1,991 | 71,211 | 25 | 32 | 76 | 39 |
| OLED — Candlelight III-3 | 1,988 | 68,289 | 26 | 33 | 76 | 39 |
Disclaimer/Publisher’s Note: The statements, opinions and data contained in all publications are solely those of the individual author(s) and contributor(s) and not of MDPI and/or the editor(s). MDPI and/or the editor(s) disclaim responsibility for any injury to people or property resulting from any ideas, methods, instructions or products referred to in the content. |
© 2026 by the authors. Licensee MDPI, Basel, Switzerland. This article is an open access article distributed under the terms and conditions of the Creative Commons Attribution (CC BY) license (http://creativecommons.org/licenses/by/4.0/).
Copyright: This open access article is published under a Creative Commons CC BY 4.0 license, which permit the free download, distribution, and reuse, provided that the author and preprint are cited in any reuse.