

Submitted:
04 September 2026
Posted:
15 September 2026
You are already at the latest version
Abstract
Local-government autonomy is intended to strengthen subnational discretion over public resources, but greater financial access does not necessarily produce substantive autonomy or better budget implementation. This study examines Nigeria's 2024 local-government autonomy reform using Gombe State as a subnational case. A mixed-methods design combines financial records for all 11 LGAs in 2023–2024 with semi-structured interviews on fund control, state–LGA relations, budget implementation and accountability. Quantitative analysis uses descriptive statistics, year-on-year changes, Pearson correlations and principal component analysis across 22 LGA-year observations. Mean total revenue increased from 3,423.14 in 2023 to 5,126.46 in 2024, while actual expenditure rose from 3,085.93 to 4,716.27. However, IGR remained about 1% of total revenue, while revenue and expenditure implementation declined from 80.44% to 65.64% and from 72.55% to 59.07%, respectively. Financial responses were highly heterogeneous, particularly in IGR growth and capital expenditure. IGR share was not significantly associated with implementation, whereas revenue and expenditure implementation were strongly associated. Interviews indicate that financial access remained shaped by administrative procedures, state–LGA relations and accountability constraints. The findings show that financial expansion alone did not produce substantive autonomy, highlighting the need to align financial discretion, implementation capacity and accountability.
Keywords:
local-government autonomy
; fiscal decentralisation
; financial autonomy
; intergovernmental relations
; budget implementation
; local accountability
; Gombe State
; Nigeria
1. Introduction
Local-government autonomy is central to decentralised governance because transferring public functions downward is expected to align public decisions with local preferences. Fiscal federalism provides the basis for allocating revenue and expenditure responsibilities across government levels according to their capacity to deliver services efficiently and respond to geographically differentiated needs (Musgrave, 1959; Oates, 1972; Tiebout, 1956). Yet decentralisation does not necessarily produce autonomy: local governments may assume assigned responsibilities while retaining limited control over revenues, expenditure decisions and resource implementation (Ebel & Yilmaz, 2002; Rodden, 2003, 2016). Meaningful autonomy therefore depends on both access to resources and the discretion and capacity to use them.
Research on local finance examines fiscal autonomy, revenue structures, spending performance, efficiency and accountability. Studies show variation in the ability of local governments to convert financial resources into expenditure and services, while own-source revenue may strengthen accountability to taxpayers depending on institutional conditions (Afonso & Fernandes, 2008; Ambrosiano & Bordignon, 2006; Bamidele, 2025; Ebel & Yilmaz, 2002; Gadenne, 2017; Okorie et al., 2023; Pöschl & Weingast, 2013; Rodden, 2003). Comparative evidence further indicates that formal decentralisation can coexist with transfer dependence, administrative constraints and uneven local performance, including among governments operating within similar institutional arrangements (Dalimunthe et al., 2023; Inanga & Osei Wusu, 2004; Monkam, 2014; Treisman, 2006). Thus, greater financial responsibility does not automatically produce greater autonomy or better implementation.
This issue is particularly important in Nigeria, where local-government financial control and autonomy remain contested. The 2024 reform has renewed attention to the financial position of local governments and raises a central question: does greater financial access translate into substantive local autonomy? Increased resources may expand financial space without altering revenue dependence, budget implementation capacity or state–LGA relations. The effects may also differ across LGAs because of variation in own-source revenue, expenditure priorities and administrative capacity.
Despite extensive research on fiscal decentralisation and local-government performance, limited evidence examines the combined relationship between financial expansion, implementation performance, LGA-level heterogeneity and accountability during a specific reform transition. This is particularly relevant where formal autonomy is accompanied by continued dependence on statutory resources and uneven implementation capacity.
This study addresses this gap by examining all 11 LGAs in Gombe State during 2023–2024. It combines LGA-level financial records with semi-structured interviews to examine changes in financial capacity, budget implementation and expenditure allocation and the institutional mechanisms underlying variation across LGAs. Rather than treating autonomy as binary, the study conceptualises it as a progression from financial access to discretion, implementation and accountability, distinguishing increased financial resources from substantive capacity to control and implement them.
The study asks: (1) How did the financial resource base, budget implementation and expenditure structure of Gombe's LGAs change between 2023 and 2024? (2) To what extent were these changes associated with differences in financial autonomy and implementation across LGAs? (3) What institutional mechanisms shaped the translation of financial resources into local discretion and accountability? By combining quantitative and qualitative evidence, the study contributes empirically by documenting heterogeneous LGA responses to Nigeria's 2024 autonomy transition and conceptually by shifting attention from how much local governments receive to who controls resources, how they are implemented and how resulting decisions are held accountable.
The study addresses three questions: (1) How did the financial resource base, budget implementation and expenditure structure of Gombe's LGAs change between 2023 and 2024? (2) To what extent were these changes associated with differences in local financial autonomy and implementation across LGAs? and (3) What institutional mechanisms shaped the translation of financial resources into local discretion and accountability? By combining quantitative evidence on LGA financial performance with qualitative evidence on institutional processes, the study contributes to the decentralisation literature in two ways. Empirically, it provides LGA-level evidence on the heterogeneous financial response to Nigeria's 2024 local-government autonomy transition. Conceptually, it shifts the assessment of autonomy beyond how much money local governments receive toward the linked questions of who controls resources, how those resources are implemented, and how resulting decisions are held accountable.
2. Materials and Methods
2.1. Fiscal Decentralisation and the Foundations of Local Financial Autonomy
Fiscal decentralisation concerns the allocation of public revenue and expenditure responsibilities across government levels. Its theoretical foundation lies in fiscal federalism, particularly the proposition that some functions are more efficiently and responsively performed at lower levels when local preferences and information differ across jurisdictions (Musgrave, 1959; Oates, 1972). Decentralisation can therefore improve allocative efficiency by bringing expenditure decisions closer to affected populations (Besley & Coate, 2003; Tiebout, 1956).
However, decentralisation does not necessarily imply meaningful autonomy. Fiscal decentralisation includes revenue assignment, expenditure responsibilities and the degree of discretion associated with them (Ebel & Yilmaz, 2002). Rodden (2016) similarly shows that decentralised rule is shaped by arrangements governing revenue and intergovernmental transfers. The key issue is therefore who controls resources and expenditure decisions, and under what institutional constraints.
Formal financial decentralisation may produce limited practical change when higher levels retain influence over revenues, transfers or expenditure. Subnational governments can therefore occupy different positions along a continuum of fiscal discretion (Ebel & Yilmaz, 2002; Rodden, 2016). Recent Nigerian research reinforces the distinction between legal authority and practical autonomy, highlighting continuing state influence and institutional constraints (Ajayi & Omotoso, 2024; Egwuagu et al., 2024; Okorie et al., 2023).
2.2. Fiscal Autonomy, Revenue Dependence and Local-Government Performance
Fiscal autonomy is generally stronger where subnational governments exercise meaningful control over revenues and expenditure rather than relying predominantly on higher-level resources (Boetti et al., 2012; Ebel & Yilmaz, 2002). Revenue composition therefore matters alongside total resources. Own-source revenue may strengthen incentives for efficiency and responsiveness because fiscal consequences are more closely linked to local taxpayers, whereas transfer dependence can weaken this connection (Gadenne, 2017; Gervasoni, 2010; Timmons, 2005). Recent Nigerian studies similarly identify weak local revenue generation as a constraint on practical fiscal autonomy (Amoako et al., 2024; Dalimunthe et al., 2023; Onuoha et al., 2021).
Empirical studies also show substantial differences in the ability of local governments to transform financial inputs into expenditure and services (Afonso & Fernandes, 2008; Balaguer Coll et al., 2007; Benito Lopez et al., 2010; Boetti et al., 2012). Fiscal autonomy and performance are therefore related but not synonymous. An increase in total revenue may indicate greater financial capacity without demonstrating greater autonomy if resources remain externally determined or are not translated into implemented expenditure (Okorie et al., 2023).
This distinction provides the basis for examining Gombe's LGAs: the study treats financial autonomy and financial performance as analytically distinct, allowing resource expansion to be assessed alongside own-source revenue and implementation outcomes.
2.3. Decentralisation, Accountability and the Fiscal Relationship with Citizens
Fiscal decentralisation also has a political dimension because the source of public finance can shape accountability. Taxation forms part of a fiscal relationship between citizens and government, and locally generated revenue may strengthen incentives for responsiveness and oversight (Gadenne, 2017; Timmons, 2005).
These effects are conditional on institutional and political conditions. Decentralisation can create opportunities for participation and accountability without ensuring effective monitoring or influence by citizens (Crook & Manor, 1998). Fiscal institutions similarly shape whether decentralised resources generate effective governance (Careaga & Weingast, 2003). Recent Nigerian research reinforces the importance of these institutional conditions (Ajayi & Omotoso, 2024; Okorie et al., 2023).
Financial autonomy should therefore be evaluated alongside accountability. Greater discretion may strengthen responsiveness where citizens can observe and sanction performance, but its governance effects are weaker where information, oversight and institutional checks are limited (Crook & Manor, 1998; Gadenne, 2017).
2.4. Institutional Capacity and Uneven Decentralisation Outcomes
Decentralisation also produces uneven outcomes because administrative capacity, institutional quality and local conditions mediate fiscal arrangements. Research on local-government efficiency identifies substantial variation in the ability of municipalities to transform financial inputs into outputs (Afonso & Fernandes, 2008; Balaguer Coll et al., 2007; Monkam, 2014). Fiscal autonomy therefore does not remove the importance of organisational capacity.
The wider political and institutional environment also matters. Decentralised arrangements involve political incentives and distributional considerations (Lockwood, 2002), while governance effects depend on institutional conditions rather than following uniformly from decentralisation (Treisman, 2006). The fiscal relationship with higher levels of government can further shape political behaviour and institutional development (Gervasoni, 2010). Recent Nigerian research identifies state influence, regulation and institutional capacity as continuing constraints on local-government autonomy (Bamidele, 2025; Onuoha et al., 2021).
These findings make LGA-level heterogeneity analytically important. Although Gombe's 11 LGAs share a state-level institutional environment, they may differ in revenue mobilisation, budget implementation and expenditure allocation. The question is therefore not only whether decentralisation changes local finances on average, but how local governments respond differently to the same reform.
2.5. Research Gap and Analytical Perspective
The literature establishes that fiscal decentralisation can increase local discretion when revenue and expenditure responsibilities are meaningfully transferred, but revenue dependence, intergovernmental controls and institutional constraints can limit substantive autonomy (Ebel & Yilmaz, 2002; Oates, 1972; Rodden, 2016). Fiscal autonomy is also connected to spending performance and accountability, although these relationships depend on institutional capacity and fiscal relations with citizens (Boetti et al., 2012; Gadenne, 2017). Recent Nigerian research extends these concerns to the contemporary autonomy debate (Bamidele, 2025; Egwuagu et al., 2024).
What remains less developed is an integrated examination of financial expansion, budget implementation, LGA heterogeneity and institutional accountability within the same reform process. This raises a central question: when local governments gain greater access to financial resources, does that access translate into effective discretion and improved implementation, and under what institutional conditions?
This study addresses that question through Gombe State. It conceptualises financial autonomy as a progression from financial access to effective discretion, implementation and accountability: resources create the opportunity for autonomy, discretion concerns their allocation, implementation concerns their translation into expenditure, and accountability concerns scrutiny of their use. This framework distinguishes expansion of local financial space from deeper substantive autonomy.
3. Materials and Methods
3.1. Research Design and Case Selection
This study adopts a mixed-methods case-study design to examine local-government financial autonomy in Gombe State during the 2023–2024 transition. Quantitative analysis examines revenue, budget implementation and expenditure allocation, while interviews examine the institutional mechanisms through which financial authority is translated into discretion and accountability.
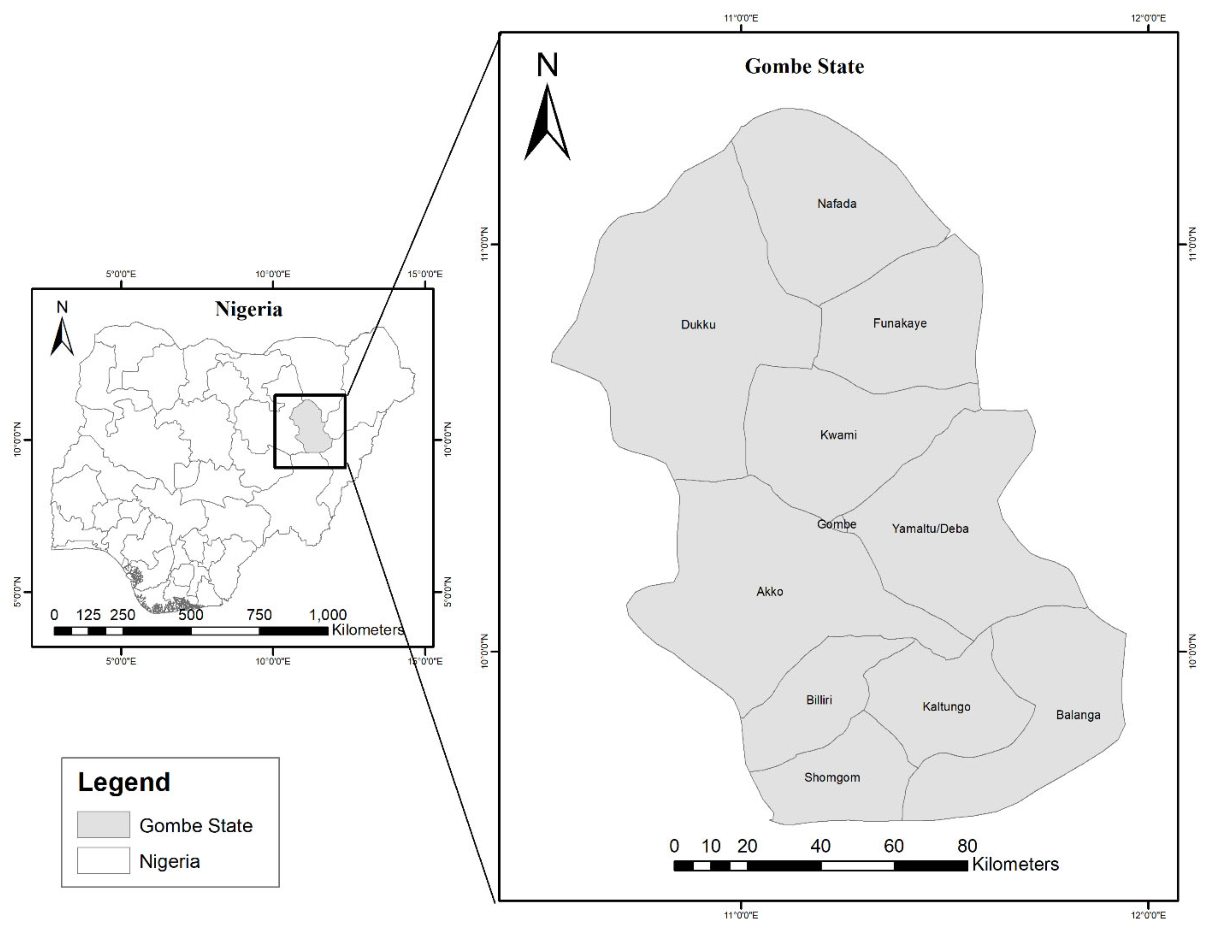
Gombe was selected because its 11 local governments share a state-level institutional environment but differ in revenue generation, budget implementation and expenditure allocation. The analysis covers Akko, Balanga, Billiri, Dukku, Funakaye, Gombe, Kaltungo, Kwami, Nafada, Shongom and Yamaltu-Deba, producing 22 LGA-year observations.
The period captures the financial transition surrounding the 2024 autonomy reform. It is not treated as a conventional pre-/post-reform causal design because 2024 represents a reform-period environment rather than a clean post-intervention period. The comparison instead identifies changes in financial resources, implementation and expenditure during the transition (Bamidele, 2025; Ebel & Yilmaz, 2002).
Figure 1.
Study area showing the location of Gombe State and its 11 local government areas.
3.2. Data Sources and Data Preparation
The quantitative analysis uses LGA-level financial records for 2023 and 2024 from the Auditor General for Local Governments, Gombe State, through the Gombe State Ministry of Finance and Economic Development. The dataset covers statutory revenue, IGR, total revenue, budgeted and actual revenue, budgeted and actual expenditure, recurrent expenditure and capital expenditure, capturing financial capacity, budget implementation and expenditure structure (Boetti et al., 2012; Ebel & Yilmaz, 2002).
Records were organised as an LGA-year dataset and checked for missing observations, duplicate records and consistent LGA identifiers, producing 22 observations. The Ministry portal also identifies the Audited Accounts of the 11 LGAs Gombe State–2024 as an official entry point to the records.
Semi-structured interviews complemented rather than reproduced the financial data. They examined fund control, IGR administration, state–LGA financial relations, budget implementation, expenditure discretion, institutional constraints, transparency and perceived changes following the 2024 reform. These interviews provide mechanisms that financial records alone cannot establish.

Table 1.
Data sources and analytical use of variables.
| Data category | Variables | Period | Unit of analysis | Analytical use |
| Revenue | Statutory revenue; IGR; total revenue | 2023–2024 | LGA-year | Financial capacity |
| Revenue budget | Budgeted revenue; actual revenue | 2023–2024 | LGA-year | Revenue implementation |
| Expenditure budget | Budgeted expenditure; actual expenditure | 2023–2024 | LGA-year | Expenditure implementation |
| Expenditure structure | Recurrent expenditure; capital expenditure | 2023–2024 | LGA-year | Expenditure allocation |
| Derived indicators | IGR share; implementation rates; capital share | 2023–2024 | LGA-year | Financial autonomy and implementation |
| Change indicators | Revenue, IGR, expenditure and capital growth; percentage-point changes | 2023–2024 | LGA | Financial transition |
| Interviews | Semi-structured interview responses | Reform period | Participant | Institutional mechanisms |
Note: Financial data were derived from the Report of the Auditor General for Local Governments, Gombe State (2024), published by the Gombe State Ministry of Finance and Economic Development.
3.3. Measures and Operational Definitions
The analysis distinguishes financial capacity, budget implementation, expenditure structure and financial change. Financial capacity is represented by statutory revenue, IGR, total revenue and IGR share; implementation by the extent to which budgeted revenue and expenditure were realised; expenditure structure by recurrent and capital spending; and change by year-on-year differences.
Derived indicators distinguish the size of the resource envelope from own-source revenue and implementation, allowing financial expansion to be assessed separately from financial autonomy and performance (Ebel & Yilmaz, 2002; Oates, 1972).
The principal derived indicators were calculated as follows:
For total revenue, IGR, actual expenditure and capital expenditure, percentage change between 2023 and 2024 was calculated as:
Changes in IGR share, revenue implementation, expenditure implementation and capital expenditure share were expressed as percentage-point differences rather than percentage growth.
Together, these measures distinguish resource expansion from own-source revenue capacity and budget implementation, reflecting the literature's distinction between fiscal assignment, autonomy and performance (Ebel & Yilmaz, 2002; Oates, 1972).
3.4. Analytical Strategy
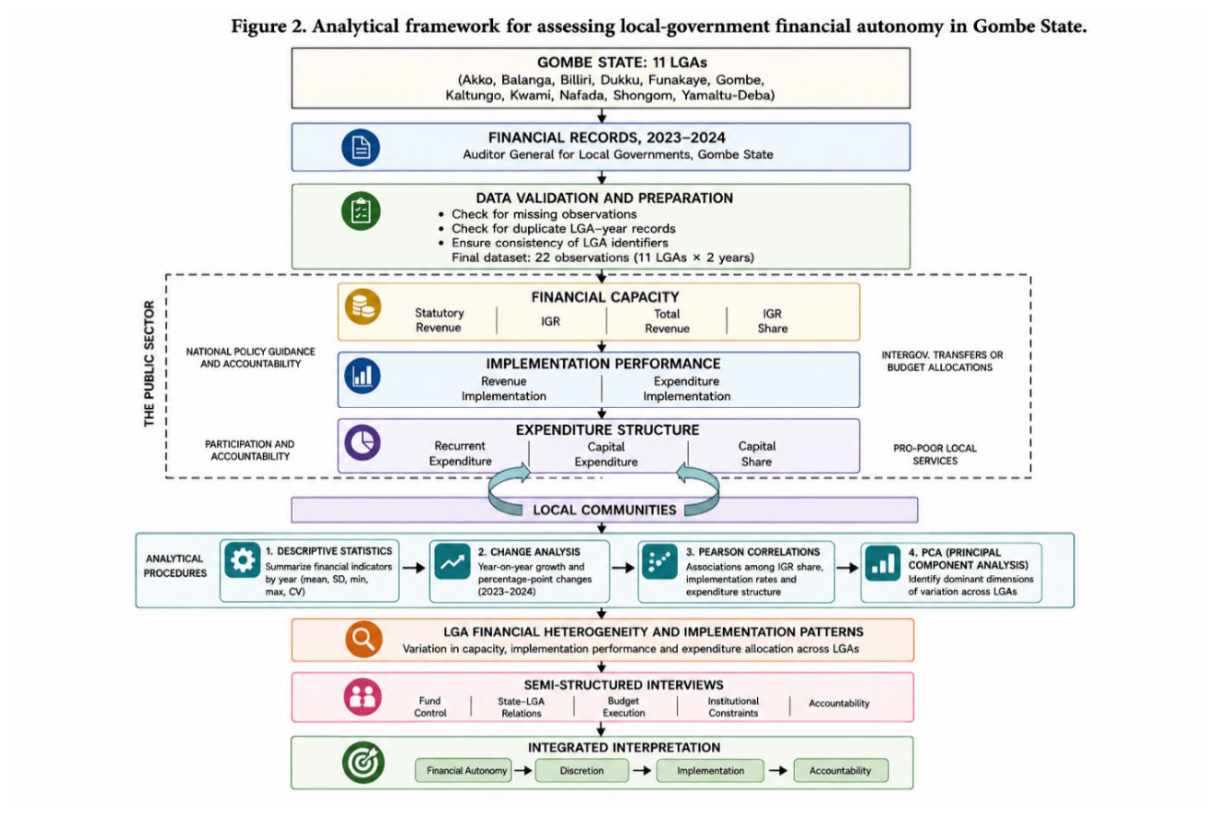
Quantitative analysis proceeded in four stages: descriptive statistics, year-on-year change analysis, Pearson correlations and PCA.
Descriptive statistics (mean, standard deviation, minimum, maximum and coefficient of variation) established overall financial profiles and cross-LGA dispersion.
Year-on-year changes identified common system-wide shifts and divergent LGA trajectories between 2023 and 2024.
Pearson correlations using the 22 LGA-year observations examined linear associations among IGR share, revenue implementation, expenditure implementation and capital expenditure share. Pearson correlation was selected to assess association rather than causal effects; results are therefore interpreted descriptively given the small sample and two-year period (Boetti et al., 2012; Treisman, 2006).
For multidimensional heterogeneity, financial variables were standardised and analysed using PCA to summarise dominant patterns across total revenue, IGR share, revenue implementation, expenditure implementation and capital expenditure share. PCA was used as an exploratory dimension-reduction technique rather than a causal model.
The analytical sequence moves from financial resources to implementation, expenditure allocation, heterogeneity and financial associations, reflecting the view that decentralisation depends on the capacity to exercise discretion and convert resources into expenditure (Oates, 1972; Treisman, 2006).
3.5. Qualitative Analysis and Integration
Interview data were analysed thematically and integrated with quantitative findings through an explanatory approach. The interviews identified institutional mechanisms underlying financial patterns rather than providing a separate account of local finances.
Coding covered fund control, revenue administration, state–LGA relations, budget implementation, expenditure discretion, institutional constraints, transparency and perceived reform effects. These themes were interpreted alongside quantitative differences in resources and implementation.
This integration distinguishes what changed financially from how institutional procedures and relationships mediated those changes, consistent with the distinction between formal fiscal arrangements and practical discretion (Ebel & Yilmaz, 2002; Rodden, 2016).
3.6. Methodological Framework
Figure 2.
Analytical framework for assessing local-government financial autonomy in Gombe State.
4. Results
4.1. Financial Resources and Revenue Structure Across Local Governments
Gombe's local governments experienced substantial financial expansion between 2023 and 2024 alongside continued dependence on statutory revenue. Mean total revenue increased from 3,423.14 to 5,126.46, while mean IGR rose from 36.60 to 53.16; however, IGR's share of total revenue changed only from 1.02% to 1.04% (Figure 1a–b; Table 1).
Figure 1.
Financial resource structure across Gombe LGAs, 2023–2024. (a) Total revenue; (b) IGR share; (c) revenue growth; (d) change in revenue composition.
Figure 1.
Financial resource structure across Gombe LGAs, 2023–2024. (a) Total revenue; (b) IGR share; (c) revenue growth; (d) change in revenue composition.
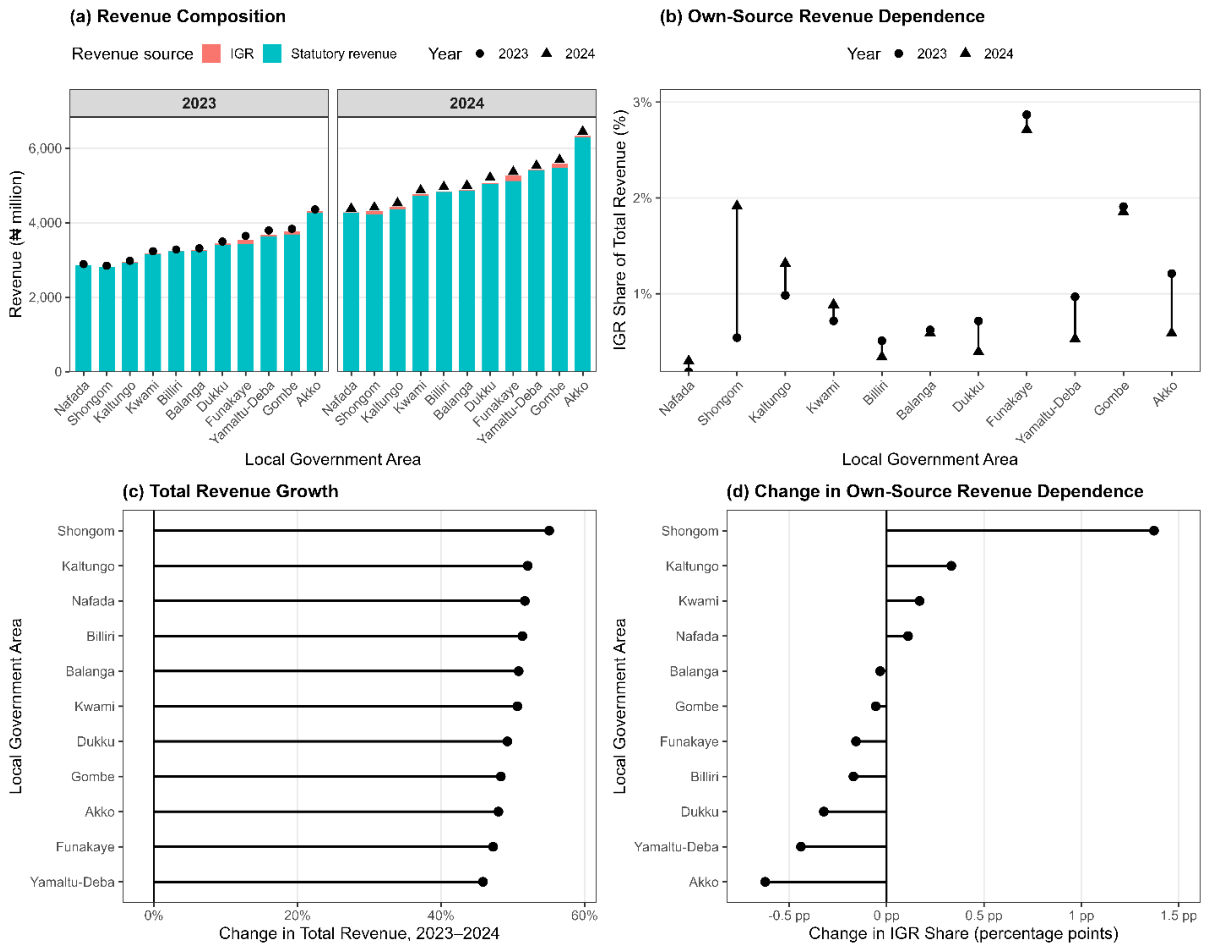
The expansion was therefore driven predominantly by statutory revenue rather than a structural strengthening of own-source capacity. The persistently small IGR share indicates that the LGA resource base remained strongly transfer-dependent during the reform period.
Table 1.
Descriptive statistics of LGA financial indicators, 2023–2024.
| Year | Indicator | Mean | SD | Minimum | Maximum | CV (%) |
| 2023 | Statutory revenue | 3331.46 | 426.89 | 2803.95 | 4262.37 | 12.8 |
| IGR / independent revenue | 36.60 | 29.44 | 5.37 | 104.55 | 80.4 | |
| Total revenue | 3423.14 | 460.58 | 2845.10 | 4357.11 | 13.5 | |
| Budgeted revenue | 4306.07 | 661.62 | 3313.20 | 5569.00 | 15.4 | |
| Actual revenue | 3423.14 | 460.58 | 2845.10 | 4357.11 | 13.5 | |
| Budgeted expenditure | 4306.07 | 661.62 | 3313.20 | 5569.00 | 15.4 | |
| Actual expenditure | 3085.93 | 452.24 | 2368.56 | 4130.02 | 14.7 | |
| Recurrent expenditure | 2632.54 | 486.92 | 1917.67 | 3772.75 | 18.5 | |
| Capital expenditure | 274.79 | 277.63 | 86.64 | 952.39 | 101.0 | |
| IGR share of total revenue | 1.02 | 0.76 | 0.19 | 2.87 | 74.5 | |
| Revenue implementation | 80.44 | 11.55 | 61.98 | 105.44 | 14.4 | |
| Expenditure implementation | 72.55 | 11.31 | 51.59 | 97.30 | 15.6 | |
| Capital expenditure share | 8.86 | 9.00 | 3.16 | 31.54 | 101.6 | |
| Recurrent expenditure share | 85.34 | 8.92 | 63.51 | 91.35 | 10.5 | |
| 2024 | Statutory revenue | 4962.96 | 609.93 | 4225.35 | 6287.36 | 12.3 |
| IGR / independent revenue | 53.16 | 42.15 | 12.96 | 145.51 | 79.3 | |
| Total revenue | 5126.46 | 618.74 | 4379.33 | 6448.10 | 12.1 | |
| Budgeted revenue | 7889.42 | 847.15 | 6601.21 | 9112.38 | 10.7 | |
| Actual revenue | 5126.46 | 618.74 | 4379.33 | 6448.10 | 12.1 | |
| Budgeted expenditure | 8021.17 | 845.46 | 6712.51 | 9599.99 | 10.5 | |
| Actual expenditure | 4716.27 | 775.04 | 3883.90 | 6154.85 | 16.4 | |
| Recurrent expenditure | 3832.59 | 546.95 | 2990.43 | 5008.85 | 14.3 | |
| Capital expenditure | 731.04 | 711.75 | 115.31 | 2229.72 | 97.4 | |
| IGR share of total revenue | 1.04 | 0.80 | 0.30 | 2.71 | 77.5 | |
| Revenue implementation | 65.64 | 10.29 | 50.19 | 82.57 | 15.7 | |
| Expenditure implementation | 59.07 | 9.44 | 46.70 | 74.41 | 16.0 | |
| Capital expenditure share | 14.37 | 12.45 | 2.80 | 36.23 | 86.6 | |
| Recurrent expenditure share | 82.37 | 12.04 | 61.04 | 94.23 | 14.6 |
Note: Revenue and expenditure amounts are reported in the original financial units. CV = coefficient of variation.
IGR remained highly heterogeneous, ranging from 5.37–104.55 in 2023 and 12.96–145.51 in 2024, with a coefficient of variation of about 80% in both years. This was substantially greater than variation in statutory and total revenue, indicating uneven own-source capacity.
While Shongom, Nafada, Kaltungo and Kwami recorded substantial IGR increases, others declined (Figure 1b–d; Table 3). The reform-period resource expansion therefore did not produce uniform fiscal self-reliance.
Statutory and total revenue had relatively low dispersion, whereas IGR, capital expenditure and capital expenditure share were much more variable (Table 1).
The baseline is therefore clear: LGAs had substantially more nominal resources but remained transfer-dependent and uneven in own-source revenue generation.
4.2. Budget Implementation and Expenditure Allocation
Mean revenue implementation fell from 80.44% in 2023 to 65.64% in 2024, while expenditure implementation fell from 72.55% to 59.07% (Figure 2a; Table 1). Thus, budget realisation weakened as the resource envelope expanded.
At the same time, actual expenditure increased from 3,085.93 to 4,716.27 and capital expenditure from 274.79 to 731.04, raising the mean capital share from 8.86% to 14.37% (Table 1; Figure 2b). LGAs therefore spent more in absolute terms while implementing a smaller proportion of their budgets.
The decline in implementation should consequently be distinguished from absolute spending capacity: the main change was a wider gap between planned and realised financial activity (Figure 2a,c).
Capital expenditure also changed unevenly: Funakaye increased by 276.6%, Kwami by more than 1,000% and Dukku by 198.94%, whereas Billiri, Gombe and Nafada recorded declines (Figure 2d; Table 3).
Figure 2.
Budget implementation and expenditure allocation across Gombe LGAs, 2023–2024 (a) Budget implementation; (b) expenditure composition; (c) implementation change; (d) capital expenditure change.
Figure 2.
Budget implementation and expenditure allocation across Gombe LGAs, 2023–2024 (a) Budget implementation; (b) expenditure composition; (c) implementation change; (d) capital expenditure change.
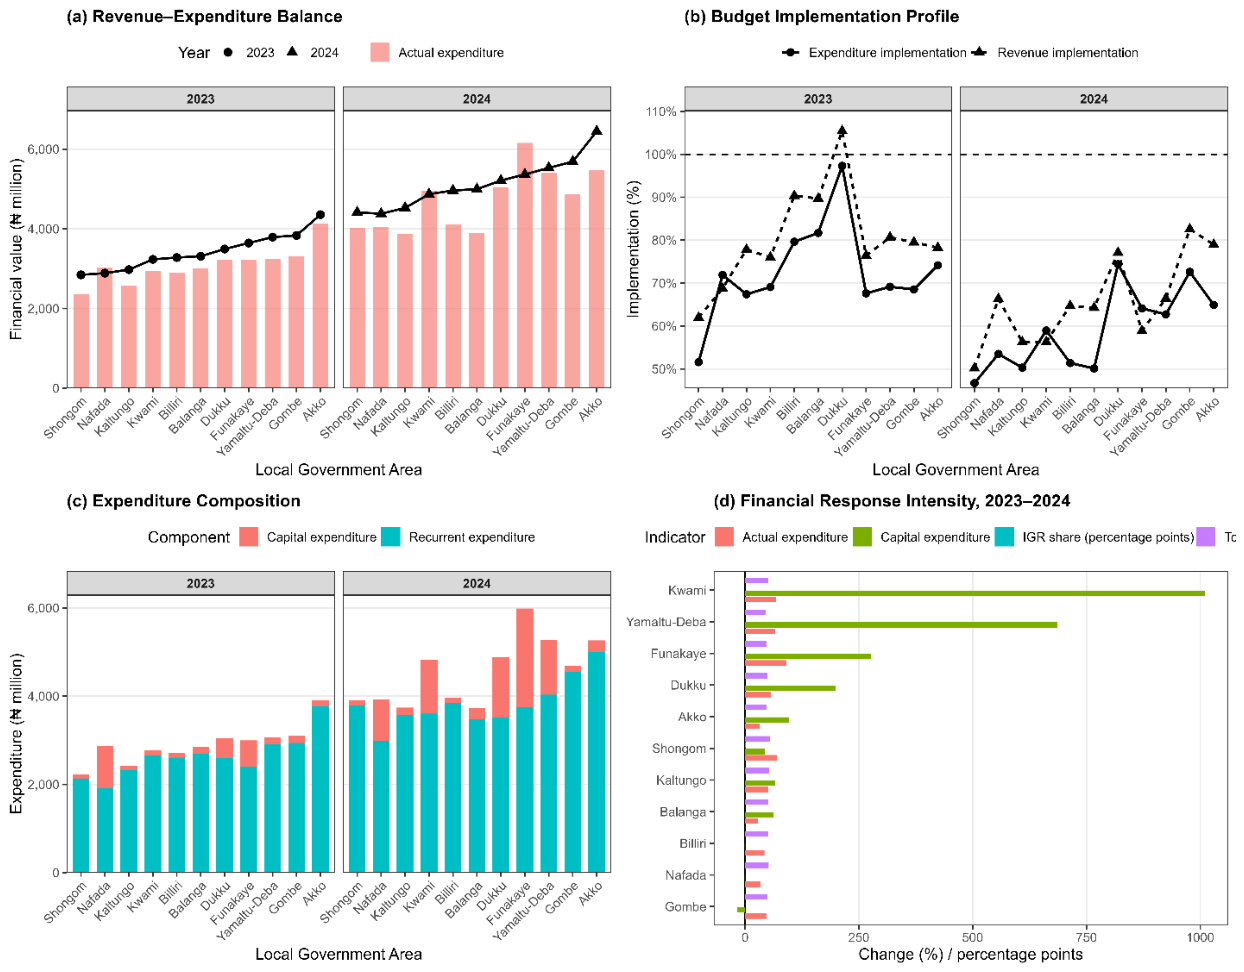
Actual expenditure increased, but implementation weakened and capital expansion was concentrated in particular LGAs rather than evenly distributed across the state (Figure 2).
Table 2.
LGA-level financial performance and budget implementation, 2023–2024.
| Year | LGA | Total revenue | IGR | IGR share (%) | Revenue implementation (%) | Expenditure implementation (%) | Actual expenditure | Capital expenditure | Capital share (%) |
| 2023 | Akko | 4357.11 | 52.74 | 1.21 | 78.24 | 74.16 | 4130.02 | 130.41 | 3.16 |
| 2023 | Balanga | 3312.67 | 20.59 | 0.62 | 89.71 | 81.69 | 3016.64 | 153.77 | 5.10 |
| 2023 | Billiri | 3279.33 | 16.68 | 0.51 | 90.33 | 79.63 | 2890.97 | 116.72 | 4.04 |
| 2023 | Dukku | 3493.43 | 24.98 | 0.72 | 105.44 | 97.30 | 3223.78 | 453.63 | 14.07 |
| 2023 | Funakaye | 3644.15 | 104.55 | 2.87 | 76.42 | 67.61 | 3224.22 | 592.06 | 18.36 |
| 2023 | Gombe | 3833.86 | 73.22 | 1.91 | 79.50 | 68.53 | 3304.72 | 173.12 | 5.24 |
| 2023 | Kaltungo | 2975.79 | 29.25 | 0.98 | 77.81 | 67.40 | 2577.59 | 95.50 | 3.71 |
| 2023 | Kwami | 3233.42 | 23.15 | 0.72 | 76.00 | 69.08 | 2938.85 | 110.55 | 3.76 |
| 2023 | Nafada | 2887.34 | 5.37 | 0.19 | 68.75 | 71.89 | 3019.24 | 952.39 | 31.54 |
| 2023 | Shongom | 2845.10 | 15.39 | 0.54 | 61.98 | 51.59 | 2368.56 | 86.64 | 3.66 |
| 2023 | Yamaltu-Deba | 3792.36 | 36.70 | 0.97 | 80.66 | 69.14 | 3250.66 | 157.93 | 4.86 |
| 2024 | Akko | 6448.10 | 37.85 | 0.59 | 78.97 | 64.92 | 5481.31 | 255.66 | 4.66 |
| 2024 | Balanga | 4995.95 | 29.41 | 0.59 | 64.26 | 50.12 | 3887.57 | 250.54 | 6.44 |
| 2024 | Billiri | 4962.61 | 16.79 | 0.34 | 64.72 | 51.39 | 4114.81 | 115.31 | 2.80 |
| 2024 | Dukku | 5213.44 | 20.46 | 0.39 | 77.10 | 74.41 | 5049.41 | 1356.08 | 26.86 |
| 2024 | Funakaye | 5365.97 | 145.51 | 2.71 | 58.89 | 64.11 | 6154.85 | 2229.72 | 36.23 |
| 2024 | Gombe | 5686.55 | 105.43 | 1.85 | 82.57 | 72.62 | 4874.41 | 142.27 | 2.92 |
| 2024 | Kaltungo | 4525.29 | 59.53 | 1.32 | 56.26 | 50.30 | 3883.90 | 158.47 | 4.08 |
| 2024 | Kwami | 4870.95 | 43.12 | 0.89 | 56.30 | 58.96 | 4955.88 | 1226.98 | 24.76 |
| 2024 | Nafada | 4379.33 | 12.96 | 0.30 | 66.34 | 53.49 | 4043.30 | 939.42 | 23.23 |
| 2024 | Shongom | 4411.90 | 84.47 | 1.91 | 50.19 | 46.70 | 4022.38 | 124.58 | 3.10 |
| 2024 | Yamaltu-Deba | 5530.95 | 29.18 | 0.53 | 66.42 | 62.72 | 5411.19 | 1242.44 | 22.96 |
Note: IGR = internally generated revenue.
Overall, the 2024 period combined greater nominal resources and actual expenditure with lower budget implementation and a higher but uneven capital expenditure share.
4.3. Heterogeneity in Local-Government Financial Responses
Total revenue increased in all 11 LGAs, ranging from 45.84% in Yamaltu-Deba to 55.07% in Shongom, but IGR growth varied sharply: it declined in Akko, Dukku and Yamaltu-Deba, while rising 448.86% in Shongom and 141.34% in Nafada (Figure 3c; Table 3).
Thus, relatively uniform total-revenue growth did not produce a common trajectory of fiscal self-reliance.
Implementation was also heterogeneous. Revenue implementation fell by 25.45 percentage points in Balanga and 28.34 in Dukku but rose 3.06 points in Gombe. Capital-share changes ranged from +21.00 points in Kwami and +17.86 in Funakaye to −8.31 in Nafada (Table 3).
The standardised profiles and PCA show distinct combinations of own-source revenue capacity, implementation and expenditure allocation rather than a common LGA response (Figure 3a–d).
The multidimensional evidence confirms differentiated financial trajectories within a common institutional environment; Table 3 reports the magnitude and direction of change for each LGA.
Table 3.
Changes in LGA financial performance between 2023 and 2024.
| LGA | Revenue growth (%) | IGR growth (%) | Actual expenditure growth (%) | Capital expenditure growth (%) | IGR share change (pp) | Revenue implementation change (pp) | Expenditure implementation change (pp) | Capital share change (pp) |
| Akko | 47.99 | −28.23 | 32.72 | 96.04 | −0.62 | 0.73 | −9.24 | 1.51 |
| Balanga | 50.81 | 42.84 | 28.87 | 62.93 | −0.03 | −25.45 | −31.57 | 1.35 |
| Billiri | 51.33 | 0.66 | 42.33 | −1.21 | −0.17 | −25.61 | −28.24 | −1.24 |
| Dukku | 49.24 | −18.09 | 56.63 | 198.94 | −0.32 | −28.34 | −22.89 | 12.78 |
| Funakaye | 47.25 | 39.18 | 90.89 | 276.60 | −0.16 | −17.53 | −3.50 | 17.86 |
| Gombe | 48.32 | 43.99 | 47.50 | −17.82 | −0.06 | 3.06 | 4.09 | −2.32 |
| Kaltungo | 52.07 | 103.52 | 50.68 | 65.94 | 0.33 | −21.55 | −17.10 | 0.38 |
| Kwami | 50.64 | 86.26 | 68.63 | 1009.89 | 0.17 | −19.70 | −10.12 | 21.00 |
| Nafada | 51.67 | 141.34 | 33.92 | −1.36 | 0.11 | −2.41 | −18.41 | −8.31 |
| Shongom | 55.07 | 448.86 | 69.82 | 43.79 | 1.37 | −11.78 | −4.89 | −0.56 |
| Yamaltu-Deba | 45.84 | −20.49 | 66.46 | 686.70 | −0.44 | −14.24 | −6.42 | 18.10 |
Note: pp = percentage points.
All LGAs gained total revenue, but differed substantially in own-source revenue growth, implementation and expenditure allocation. The reform-period change was therefore characterised by differentiated local responses rather than a common financial trajectory.
4.4. Financial Autonomy and Implementation Outcomes
The analysis next examines whether greater own-source financial capacity was associated with implementation and expenditure outcomes.
IGR was strongly correlated with its share of total revenue (r = 0.954, p < 0.001), as expected from their mathematical relationship. More substantively, revenue and expenditure implementation were strongly and positively associated (r = 0.905, p < 0.001; Table 4).
IGR share was not significantly associated with revenue implementation (r = −0.151, p = 0.503), expenditure implementation (r = −0.056, p = 0.804) or capital share (r = 0.066, p = 0.771). Total revenue was also not significantly associated with revenue implementation (r = −0.278, p = 0.211) or expenditure implementation (r = −0.279, p = 0.208).
Figure 4 shows the strong co-movement of revenue and expenditure implementation and the weak relationships involving IGR share.
The strongest substantive relationship was therefore between revenue and expenditure implementation, not own-source revenue capacity. This suggests that budget execution is an interconnected financial process, while greater IGR share alone does not imply stronger implementation.
The quantitative evidence provides limited support for a direct relationship between financial autonomy and implementation. It identifies financial patterns but cannot establish whether constraints arise from administrative capacity, procedures, political control, transfer timing or other mechanisms.
4.5. Institutional Mechanisms Underlying Financial Autonomy and Accountability
Interviews were used to explain why greater financial resources did not necessarily correspond to stronger implementation outcomes.
Three recurring mechanisms linked formal autonomy to practical discretion: the distinction between formal and effective control over resources; administrative procedures affecting conversion of resources into expenditure; and accountability and oversight surrounding discretionary use.
These mechanisms help explain the divergence between resource expansion and budget implementation (Table 5): possession of resources does not necessarily equal effective discretion.
The qualitative evidence therefore shifts attention from whether LGAs received more resources to whether they acquired effective discretion over those resources, providing the institutional interpretation of the quantitative findings
5. Discussion
5.1. Financial Expansion Does Not Necessarily Produce Substantive Local Autonomy
The central finding is that financial expansion did not translate proportionately into substantive fiscal autonomy. Mean total revenue rose from 3,423.14 to 5,126.46 and actual expenditure from 3,085.93 to 4,716.27, yet IGR remained about 1% of total revenue and revenue and expenditure implementation declined from 80.44% to 65.64% and 72.55% to 59.07%, respectively. Greater access therefore expanded financial space without necessarily increasing local control over financial priorities.
This finding is consistent with Nigerian research identifying restricted revenue rights, fiscal dependence and institutional constraints as limits on local financial autonomy (Ajayi & Omotoso, 2024; Onuoha et al., 2021). The Gombe evidence extends this argument by showing that dependence can persist even as the nominal resource base expands.
The very low IGR share is especially important: although statutory transfers remain essential, heavy dependence on them limits control over the size and structure of the local resource base. Recent Nigerian scholarship similarly highlights weak local revenue capacity and the gap between formal autonomy and practical discretion (Ajayi & Omotoso, 2024; Bamidele, 2025; Egwuagu et al., 2024; Onuoha et al., 2021).
5.2. Greater Financial Space was Accompanied by Uneven Implementation Capacity
The second finding is substantial variation in LGA responses. Although total revenue increased everywhere, IGR, implementation and expenditure allocation changed differently across LGAs. Capital expenditure illustrates this variation particularly clearly. A common reform environment therefore did not generate a uniform local-government response.
This is consistent with decentralisation research showing that institutional reforms are mediated by administrative capacity and intergovernmental controls. Recent Nigerian studies likewise emphasise regulatory constraints, state influence and institutional capacity (Dalimunthe et al., 2023; Modibbo & Chukkol, 2025).
Revenue and expenditure implementation were strongly correlated, whereas IGR share was not significantly associated with either. Budget execution therefore appears to depend on a broader process involving resource availability, budget preparation, administrative procedures and expenditure execution rather than own-source revenue alone.
Interview evidence reinforces this interpretation: administrative capacity, procedures and financial controls can constrain implementation even when financial resources increase. Decentralisation creates the opportunity for autonomy, but institutional capacity shapes how far it is realised (Bamidele, 2025).
5.3. The Reform Expanded Local Financial Space Without Eliminating State–LGA Dependence
The reform also appears to have expanded financial space without completely removing state-level influence. Interviews indicate greater access to resources alongside continuing state influence over aspects of local financial administration and decision-making. Autonomy is therefore multidimensional: financial access may increase while effective discretion remains constrained by intergovernmental relationships.
This interpretation is consistent with evidence that state–local financial arrangements shape the practical scope of autonomy (Okorie et al., 2023). The Gombe findings suggest that the reform is better understood as a reconfiguration of state–LGA financial relations than as a complete withdrawal of state influence.
5.4. Greater Autonomy Increases the Importance of Accountability
Greater financial discretion also increases the importance of accountability. Interview evidence indicates continuing challenges in reporting, oversight and administrative capacity, showing that greater access to resources has not automatically produced stronger accountability. Decentralisation likewise does not by itself guarantee effective monitoring or governance (Bamidele, 2025).
Autonomy and accountability should therefore be treated as complementary. Greater discretion creates greater responsibility for financial decisions, requiring reliable information, reporting and oversight, particularly where budget implementation remains weak.
5.5. From Formal Autonomy to Substantive Local Autonomy
The findings distinguish formal autonomy, substantive autonomy and accountable autonomy. Formal autonomy concerns authority established through reform; substantive autonomy concerns meaningful discretion over resources; accountable autonomy adds the capacity to justify and be scrutinised for those decisions.
These dimensions did not advance at the same pace in Gombe: resources expanded, statutory revenue remained dominant, implementation declined and local responses diverged. Financial autonomy is therefore better understood as the capacity to control resources, translate them into locally determined expenditure and remain accountable for their use (Okorie et al., 2023).
The Gombe case shows that the 2024 reform expanded the opportunity for local financial discretion without fully establishing the institutional conditions required for substantive autonomy.
5.6. Implications for Decentralisation Policy
Financial transfer should therefore be treated as a means rather than the endpoint of decentralisation. Direct access should be accompanied by stronger local revenue administration, financial-management capacity, budget implementation and reporting; the very low IGR share indicates that financial access alone will not remove structural dependence on statutory transfers (Ajayi & Omotoso, 2024).
The decline in implementation despite revenue growth further shows the need for administrative systems supporting budget execution, expenditure control and transparent reporting. Decentralisation outcomes depend on the institutional conditions under which local responsibilities are exercised (Boetti et al., 2012).
Ultimately, greater autonomy should be matched by stronger accountability. For Gombe, effective decentralisation requires financial authority to be accompanied by the capacity and oversight mechanisms needed to exercise that authority effectively and transparently.
6. Conclusions
The findings show that Gombe's implementation of local-government autonomy created greater financial space without automatically producing substantive fiscal autonomy. Resources expanded while statutory revenue remained dominant, budget implementation declined and LGA responses diverged. Financial access alone is therefore insufficient for effective local decision-making.
Autonomy is shaped by the institutional conditions surrounding resources. Differences in implementation and expenditure responses, together with interview evidence, indicate that administrative capacity, financial procedures and intergovernmental relationships mediate practical discretion. Autonomy is best understood as a process connecting financial access, discretion, implementation and accountability.
For Nigeria's autonomy reforms, greater financial access should be accompanied by stronger local revenue administration, budget execution, financial-management capacity and transparent oversight. Greater discretion should also carry clearer accountability so that responsibility for financial decisions is matched by effective scrutiny.
Future research should extend beyond the two-year transition, compare states and link financial autonomy to service delivery and citizen accountability to assess whether greater local discretion produces sustained governance improvements.
Supplementary Materials
The following supporting information can be downloaded at the website of this paper posted on Preprints.org. Supplementary materials include the cleaned quantitative dataset, R analysis scripts, interview guide and additional analytical outputs.
Author Contributions
The author conceived the study, developed the research design, collected and analysed the data, conducted the interviews, interpreted the findings, and wrote and revised the manuscript.
Funding
This research received no specific grant from any funding agency in the public, commercial or not-for-profit sectors.
Data Availability
The quantitative data used in this study were derived from publicly available financial records of the Local Governments of Gombe State, including the Report of the Auditor General for Local Governments, Gombe State 2024, published by the Gombe State Ministry of Finance and Economic Development. The derived dataset and analytical code used in this study can be made available from the corresponding author upon reasonable request.
Informed consent
All interview participants provided informed consent before participation. Participants were informed of the purpose of the study, the voluntary nature of participation and their right to withdraw.
Code availability
The R scripts used for data cleaning, statistical analysis and figure generation are available from the corresponding author upon reasonable request.
Declaration of generative AI and AI‐assisted technologies
During the preparation of this manuscript, the authors used generative artificial intelligence tools for language editing, organisation and drafting assistance. The authors reviewed and verified all content and remain fully responsible for the accuracy, originality and integrity of the manuscript.
Acknowledgments
The author thanks the relevant Gombe State and local-government officials and all interview participants for their time and contributions to this study.
Conflicts of Interest
The authors declare no conflict of interest.
References
- Afonso, A.; Fernandes, S. Assessing and explaining the relative efficiency of local government. The Journal of Socio-Economics 2008, 37(5), 1946–1979. [Google Scholar] [CrossRef]
- Ajayi, F.; Omotoso, F. An Assessment of Revenue Rights and Fiscal Jurisdictions of Local Governments in Nigeria’s Federation. Journal of Science, Humanities and Arts - JOSHA 2024, 11(6). [Google Scholar] [CrossRef]
- Ambrosiano, M. F.; Bordignon, M. Normative versus positive theories of revenue assignments in federations. In Handbook of Fiscal Federalism; Ahmad, E., Brosio, G., Eds.; Edward Elgar Publishing, 2006; pp. 306–344. [Google Scholar] [CrossRef]
- Amoako, C.; Adamtey, R.; Dinye, I.-N.; Kwarteng Amaka-Otchere, A. B. Locational Factors for Local Revenue Mobilisation in a Peri-Urban Municipal Area around Accra, Ghana. City, Culture and Society 2024, 36, 100568. [Google Scholar] [CrossRef]
- Balaguer Coll, M. T.; Prior, D.; Tortosa-Ausina, E. On the determinants of local government performance: A two-stage nonparametric approach. European Economic Review 2007, 51(2), 425–451. [Google Scholar] [CrossRef]
- Bamidele, S. Fiscal Federalism and Local Governments’ Struggle for Autonomy in Nigeria. Commonwealth Journal of Local Governance 2025, 30, 111–127. [Google Scholar] [CrossRef]
- Benito Lopez, B.; Bastida, F.; Garcia, J. A. The determinants of efficiency in municipal governments. Applied Economics 2010, 42(4), 515–528. [Google Scholar] [CrossRef]
- Besley, T.; Coate, S. Centralised versus decentralised provision of local public goods: A political economy approach. Journal of Public Economics 2003, 87(12), 2611–2637. [Google Scholar] [CrossRef]
- Boetti, L.; Piacenza, M.; Turati, G. Decentralisation and local governments’ performance: How does fiscal autonomy affect spending performance? FinanzArchiv 2012, 68(3), 269–302. [Google Scholar] [CrossRef]
- Careaga, M.; Weingast, B. R. Fiscal federalism, good governance, and economic growth in Mexico. In In Search of Prosperity: Analytic Narratives on Economic Growth; Rodrik, D., Ed.; Princeton University Press, 2003; pp. 399–436. [Google Scholar]
- Crook, R. C.; Manor, J. Democracy and Decentralisation in South Asia and West Africa: Participation, Accountability and Performance; Cambridge University Press, 1998. [Google Scholar] [CrossRef]
- Dalimunthe, T.; Ikhsan, A.; Zainal, A. The Effect of Local Government Fiscal Decentralization on Financial Reporting Accountability with Financial Performance as a Moderating Variable: Study of Regency and City Local Governments in North Sumatra in 2016–2020. In Proceedings of the 8th Annual International Seminar on Transformative Education and Educational Leadership (AISTEEL 2023); 2023. [Google Scholar] [CrossRef]
- Ebel, R. D.; Yilmaz, S. On the Measurement and Impact of Fiscal Decentralisation; World Bank Publications, 2002. [Google Scholar] [CrossRef]
- Egwuagu, U. B.; Nnamani, D. O.; Okolie, N. U. The Overbearing Role of State Over Local Government and Provisions of 1999 Constitution: Where is Local Level Autonomy in Nigeria? Journal of Policy and Development Studies 2024, 15(2), 186–203. [Google Scholar] [CrossRef]
- Gadenne, L. Tax me, but spend wisely? Sources of public finance and government accountability. American Economic Journal: Applied Economics 2017, 9(1), 274–314. [Google Scholar] [CrossRef]
- Gervasoni, C. A rentier theory of subnational regimes: Fiscal federalism, democracy, and authoritarianism in the Argentine provinces. World Politics 2010, 62(2), 302–340. [Google Scholar] [CrossRef]
- Inanga, E. L.; Osei Wusu, D. Financial resource base of sub-national governments and fiscal decentralization in Ghana. African Development Review 2004, 16(1), 72–114. [Google Scholar] [CrossRef]
- Lockwood, B. Distributive politics and the cost of centralisation. Review of Economic Studies 2002, 69, 313–337. [Google Scholar] [CrossRef]
- Modibbo, R.; Chukkol, O. G. AGF v AG Abia State & 36 Ors (2024): Demystifying the Pros and Pitfalls of the Supreme Court Decision on Local Government Autonomy. ABU Law Journal 2025, 43(1), 233–249. [Google Scholar] [CrossRef]
- Monkam, N. Local municipality productive efficiency and its determinants in South Africa. Development Southern Africa 2014, 31(2), 275–298. [Google Scholar] [CrossRef]
- Musgrave, R. A. The Theory of Public Finance: A Study in Public Economy; McGraw Hill, 1959. [Google Scholar]
- Oates, W. E. Fiscal Federalism; Harcourt-Brace, 1972. [Google Scholar]
- Okorie, C.; Obasi, T.; Nwosu, C.; Arua, C. Local Government Autonomy in Nigeria: Implications for Quality Service Delivery at the Grassroots Level. African Journal of Politics and Administrative Studies 2023, 16(2), 293–312. [Google Scholar] [CrossRef]
- Onuoha, C. B.; Ufomba, H.; Bassey, E. I. Between the Devil and Lying Angels: An Invitation for a New Perspective on State Interference in Local Government Fiscal Autonomy in Nigeria. Journal of Social and Political Sciences 2021, 4(1). [Google Scholar] [CrossRef]
- Pöschl, C.; Weingast, B. R. The fiscal interest approach: The design of tax and transfer systems. SSRN 2013. [Google Scholar] [CrossRef]
- Rodden, J. Reviving Leviathan: Fiscal federalism and the growth of government. International Organization 2003, 57(4), 695–729. [Google Scholar] [CrossRef]
- Rodden, J. Decentralized Rule and Revenue; Cambridge University Press, 2016. [Google Scholar]
- Tiebout, C. M. A pure theory of local expenditure. Journal of Political Economy 1956, 64(5), 416–424. [Google Scholar] [CrossRef]
- Timmons, J. F. The fiscal contract: States, taxes, and public services. World Politics 2005, 57(4), 530–567. [Google Scholar] [CrossRef]
- Treisman, D. Fiscal decentralisation, governance and economic performance: A reconsideration. Economics and Politics 2006, 18(2), 219–235. [Google Scholar] [CrossRef]
Figure 3.
Heterogeneity in LGA financial responses, 2023–2024. (a) Standardized financial profiles; (b) financial trajectories; (c) multidimensional response; (d) principal component structure.
Figure 3.
Heterogeneity in LGA financial responses, 2023–2024. (a) Standardized financial profiles; (b) financial trajectories; (c) multidimensional response; (d) principal component structure.
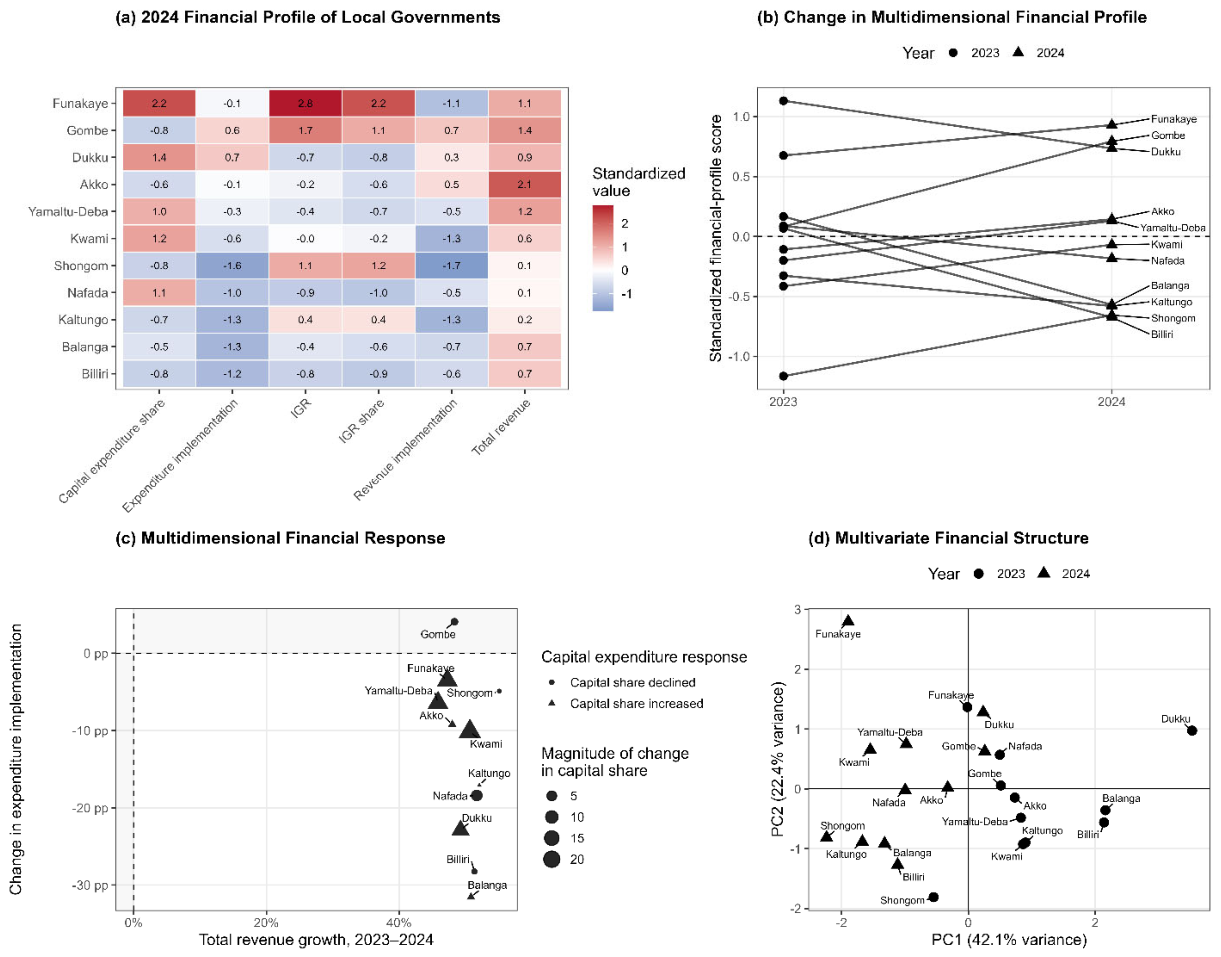
Figure 4.
Associations between financial autonomy and implementation outcomes. (a) IGR share and revenue implementation; (b) IGR share and expenditure implementation; (c) revenue implementation and capital share; (d) expenditure implementation and capital share.
Figure 4.
Associations between financial autonomy and implementation outcomes. (a) IGR share and revenue implementation; (b) IGR share and expenditure implementation; (c) revenue implementation and capital share; (d) expenditure implementation and capital share.
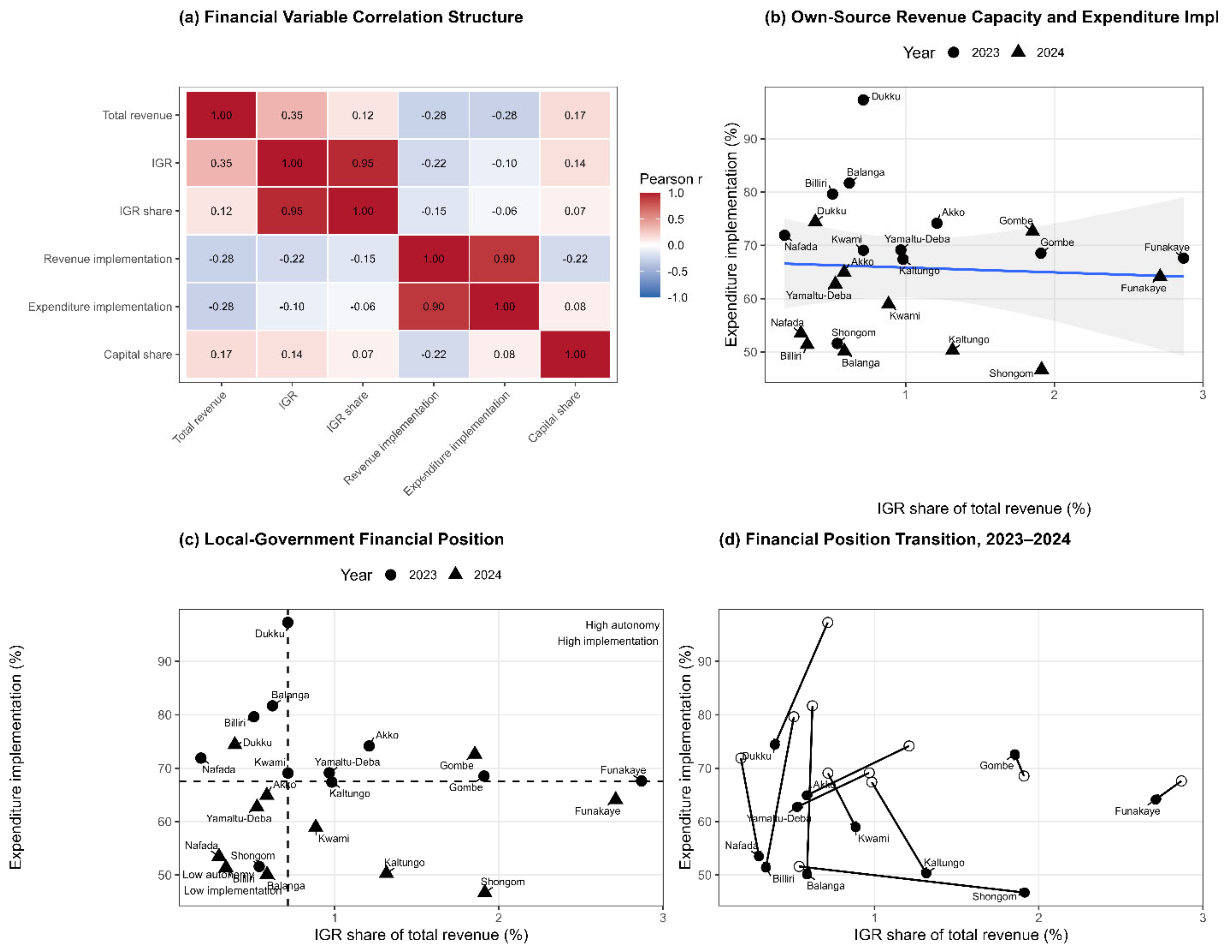
Table 4.
Pearson correlations among financial autonomy and implementation indicators.
| Variable 1 | Variable 2 | Pearson r | p-value | Significance |
| Total revenue | IGR | 0.349 | 0.1115 | |
| Total revenue | IGR share | 0.119 | 0.5966 | |
| Total revenue | Revenue implementation | −0.278 | 0.2107 | |
| Total revenue | Expenditure implementation | −0.279 | 0.2083 | |
| Total revenue | Capital expenditure share | 0.168 | 0.4559 | |
| IGR | IGR share | 0.954 | <0.001 | *** |
| IGR | Revenue implementation | −0.223 | 0.3179 | |
| IGR | Expenditure implementation | −0.100 | 0.6582 | |
| IGR | Capital expenditure share | 0.144 | 0.5225 | |
| IGR share | Revenue implementation | −0.151 | 0.5029 | |
| IGR share | Expenditure implementation | −0.056 | 0.8041 | |
| IGR share | Capital expenditure share | 0.066 | 0.7708 | |
| Revenue implementation | Expenditure implementation | 0.905 | <0.001 | *** |
| Revenue implementation | Capital expenditure share | −0.224 | 0.3158 | |
| Expenditure implementation | Capital expenditure share | 0.079 | 0.7277 |
Note: Pearson correlations are based on the 22 LGA-year observations. **p < 0.001.
Table 5.
Interview themes and institutional mechanisms affecting local financial autonomy.
| Theme | Subtheme | Representative evidence | Actors | Mechanism | Autonomy implication | Accountability implication |
| 1. Fund control | Access and control | Direct access to LGA funds, with continuing controls | State; LGAs | Fund access and disbursement | ↑ Financial discretion | ↑ Responsibility |
| 2. Revenue administration | IGR collection | IGR remains limited and uneven across LGAs | Revenue officials; taxpayers | Revenue mobilisation | Limited own-source autonomy | Need for transparency |
| 3. State–LGA relations | State influence | Continued state influence over local finances | State; LGA officials | State oversight | Constrained substantive autonomy | ↑ Upward accountability |
| 4. Budget implementation | Approval and execution | Delays and gaps between approved and available resources | LGA officials; representatives | Budget procedures | Constrained spending discretion | Weaker budget alignment |
| 5. Expenditure discretion | Recurrent and capital spending | Variation in local spending priorities | LGA leadership; finance officials | Expenditure allocation | ↑ Spending discretion | Need for expenditure oversight |
| 6. Institutional constraints | Capacity and procedures | Capacity and procedural constraints persist | LGA officials | Administrative capacity | Constrained effective autonomy | Weaker reporting capacity |
| 7. Transparency | Reporting and oversight | Continuing challenges in reporting and oversight | Officials; representatives; citizens | Financial reporting | Transparency conditions autonomy | Weaker public accountability |
| 8. 2024 reform effects | Changes after reform | Greater financial space, but uneven practical autonomy | State; LGAs; citizens | Direct access; state–LGA relations | ↑ Formal autonomy; uneven substantive autonomy | ↑ Local accountability responsibility |
Disclaimer/Publisher’s Note: The statements, opinions and data contained in all publications are solely those of the individual author(s) and contributor(s) and not of MDPI and/or the editor(s). MDPI and/or the editor(s) disclaim responsibility for any injury to people or property resulting from any ideas, methods, instructions or products referred to in the content. |
© 2026 by the authors. Licensee MDPI, Basel, Switzerland. This article is an open access article distributed under the terms and conditions of the Creative Commons Attribution (CC BY) license (http://creativecommons.org/licenses/by/4.0/).
Copyright: This open access article is published under a Creative Commons CC BY 4.0 license, which permit the free download, distribution, and reuse, provided that the author and preprint are cited in any reuse.