

Submitted:
14 September 2026
Posted:
15 September 2026
You are already at the latest version
Abstract
The present work provides a detailed experimental and numerical study on suppression of a heptane medium-scale pool fire by applying water mist. The customarily described well defined structure of the flame does not exist any longer by application of water mist. It is observed that the size and shape of the flame vary randomly and continuously due to sudden and short mist vaporization periods. An injection of the finely divided water mist (50μm) into a buoyancy-induced fire has a combustion-supporting effect of a heptane pool fire. In no mist case, contribution of the radiation heat flux to the pyrolysis rate of liquid fuel seems predominant. However, with addition of water mist, an increasing trend in burning rate is related mainly to the significance of convective heat flux due to moving of the flame region towards the liquid surface. This behavior suggests that extinguishment is achieved by total clearance of the liquid surface rather than from reduction in flame-to-liquid surface heat feedback. The numerical work provides the detailed temperature and species fields in addition to radiation/convection heat fluxes over the liquid surface during the addition of a water mist by using various drag force models.
Keywords:
modeling
; fire chemistry
; suppression
; heat transfer
; toxicity
; water mist
1. Introduction
Since water curtain exhibits a thermal shielding effect via attenuation of radiation heat, a water mist spray is widely applicable to suppression or extinction of gas, liquid and solid combustible fires [1]. The performance of protection systems via water mist to reduce fire damage is controlled by many operating parameters such as water application time, flux density, nozzle ejection rate, orientation of mist injection, spray dynamics, droplet size and distance between the pool fire and the nozzle [2,3,4,5,6,7]. If water mist is applied horizontally, the flame is deflected and the rate of air entrainment into the plume is increased. It is only for angles greater than about 60° (opposed flow configuration) that penetration of droplets into the flame becomes to be efficient [2]. Therefore, great attention must be paid to the location and orientation of the nozzles, to their type, to mist momentum and to mass of water added but also to droplet size distribution. The success in extinguishing liquid fires requires droplets distributed with large size and enough energy to penetrate the flame and mix turbulently and, as much as possible, uniformly in all zones of the flame [8]. Typically, for surface wetting via sensible cooling of the fuel surface, large droplets are preferred to small droplets from water mist because they have a stronger momentum and are less sensitive to evaporation so that they can reach the fire source (surface) more easily [9]. Solely at the early stage of fire growth, activation of fire suppression system allows to reduction the flame temperature below a critical value necessary to sustain combustion [10]. The fire suppression is significantly affected by the buoyancy-induced airflows in water mist, smoke extraction systems and fire load [11]. Droplets evaporation can absorb only about 6-11% of the combustion heat from a specific fire configuration [12]. Absorption of heat radiation from a fire source becomes more effective only when the entire fire extinguishing space is filled by a high-pressure water mist via the atomization effect [13]. Mist suppression performance of full-scale, turbulent fires was investigated without the detailed characterization and controlled conditions necessary for model validation [14,15]. A numerical study using FDS6 [16] addressed the potential importance of a lot of parameters in water mist sprays in non-fire conditions [17]. It is found that only by changing the drag to an ad-hoc constant of 0.15 results in a significant improvement of the predicted water flux density at floor level [17]. Impact of water mist on CO emission is investigated [18,19] by using gas fuel burner, and both the prediction [18] and the experimental data [19] highlight an increase in yields of carbon monoxide after water spray activation.
In the present work, a diagnostic calculation is performed to discover if an optimized drag coefficient of 0.15 in non-fire condition [17] can give a good prediction during the fire-water interaction on both the flame shape and heat transfer phenomena. Although, it is not physical to assign a constant drag coefficient to all droplets everywhere in the computational domain, the built-in calculation tends to highlight a systematic deviation to the measurement by using both the drag coefficient in a wide range from 0.08 to 0.3, and the drag reduction model. Both the complexity required for relation to strong inter-particle aerodynamic interactions and the detailed diagnostics required for validation of CFD models have been contained. Ultimately, the study leads to highlight the importance of the drag force model for the complex fire scenarios considered here. It is concluded that a consecutive efficient cooling of thermal plume by applying water mist leads to only a reduction in flame-to-liquid surface radiation heat feedback. However, an injection of the finely divided water mist (50 μm) does not conduct to extinguishing of a fully developed turbulent fire due to an increase of liquid burning rate via an enhancement of convection heat flux. Such an assessment is performed based on the overall shape of the flame, burning rate, gas temperature, soot and the radiation/convection heat fluxes over the liquid surface.
2. Experimental Set-Up
Experiments were performed with a heptane pool fire subjected to a water mist system, as shown in Figure 1(a, b, c, d). The smoke extraction hood is installed at the top of the experimental apparatus with a height of 2 m, and its size is also 2 m on each side. The smoke extraction of the hood generates an upward suction flow rate of 540 m3/h, and such suction does not disturb the experimental conditions, but merely facilitates natural extraction to prevent the accumulation of smoke and fine water mist particles in the atmosphere. The water mist system used consists of three nozzles which are located symmetrically with respect to the flame axis (120°) and directed toward the fuel surface center with an angle of 35°. Water mist is delivered as an opposed buoyancy-induced flow, properly oriented with high momentum, in order to push the water vapor formed against the fuel surface. The distance between the nozzles and the liquid surface is 1.3 m with a radial position 0.7 m. As shown in Figure 1b, each nozzle with a hole diameter of 3.5 mm is twin fluid (water/air) pressure assisted atomizers permitting the control of the droplet size, flow density, and momentum of the mist. The applied air pressure and water flow are chosen in such a way that complete extinguishment does not occur immediately or even does not occur at all. This allows to analyze in a long duration, on one hand, the perturbation influence of a water mist addition on the interaction between flame destabilization and extinction, and on the other hand, on the radiant heat feedback over the pyrolysis surface. Each nozzle works at a normal operating air-pressure of 1 bar and provides a water mass flow rate of 3.5 g/s. Non-fire tests involving only water spray from one nozzle, as illustrated in Figure 1c, were carried out. The local speed and particle size of the droplet at 70 cm distance from the injection are measured by using a laser anemometry system called PDPA (Phase Doppler Particle Analyser).
Heptane was contained in a circular steel pan, 10 cm deep, with a diameter of 23 cm, giving a fuel supply rate of 0.66 ± 0.05 g/s in no mist case. During the test, the level was kept constant by means of a gravity liquid feeding system based on an electronically controlled on/off valve, as schematized in Figure 1d. A reservoir containing fresh fuel is placed on a load cell that emits a continuous signal proportional to the mass it supports. Heptane with boiling point of 98 °C flows by gravity to the tank through a temperature-controlled solenoid valve, controlled by a signal from a thermocouple whose tip is just below the surface of the liquid. During combustion, the liquid level drops, giving way to a higher-temperature gaseous phase. This abrupt temperature gradient is exploited as such a way: when the thermocouple tip emerges from the liquid, the solenoid valve opens and the fuel level rises; when the liquid level rises above the thermocouple tip, the solenoid valve closes. The fuel level is thus regulated and the combustion rate is deduced from the slope of the curve representing the mass loss of the fuel reserve as a function of time, this evolution being practically linear after the system has been brought into operation.
To measure the radiant heat flux over the fuel surface, three Gardon-gauge-type radiometers Medtherm are used. Each radiometer was water cooled and equipped with a window to eliminate the conductive and convective components from the flame [20]. The window used was in calcium fluoride with a spectral transmittance between 0.3 and 11.5 μm which covers the spectral range of a luminous flame between 0.5 and 5 μm. The view factor of these radiometers was 150° and uncertainty in heat flux measurements is within 3%. The gas temperature was measured with four thermocouple trees at the locations of x=0, 3, 6, 9 cm, type K of chromel-alumel and 0.5 mm wire which are arranged at intervals of 2.5 cm [20].
3. Calculation Tool
Fire Dynamics Simulator (FDS6.9) [16] is used for the simulations conducted throughout this study. In order to reduce calculation time, FDS uses an approximated expression of the Navier-Stokes equations where acoustic waves are filtered whereas it still permits big density and temperature changes. Large Eddy Simulation (LES) and the Lagrangian approach are adopted to describe respectively turbulence and water droplet transport. The hydrodynamic model in gas phase consists of the fully three-dimensional, transient equations of mass, momentum, energy and species conservation. For clarity, only the most relevant mathematical models for the present water mist simulation are described here. The governing equations for both the gas and the droplet phases are discretized and iteratively solved, and a detailed description is given in FDS6 user guide [16].
3.1. Lagrangian Particle Model
The droplet model such as a Lagrangian approach consists of the change rates of the vapor mass, the droplet temperature, and the gas temperature. The drop size distribution is characterized by Cumulative Volume Fraction, which agrees well with the Rosin-Rammler-lognormal curve [16]. The dispersion factor (gamma) is specified with the default value of 2.4.
In the gas phase, the momentum lost from a particle is added to the fluid and vice versa through the drag force
where Ad refers the droplet cross-sectional area, ud the droplet velocity, md the droplet mass, u the gas velocity, ρ the gas density and g the gravitational acceleration.
The acceleration of a single spherical droplet is given by
The parameter Cd in Equations (1, 2) represents the drag coefficient between the droplet and the gas, and is a function of the droplet Reynolds number, Red.
where rd is the droplet radius and μ the dynamic gas phase viscosity.
3.2. Drag Reduction
It is worth noting that in a Lagrangian approach, the droplets occupy no volume in the Eulerian space, and the separation lengths would be of sub-grid scale. As a consequence, in a dense water spray, aerodynamic interactions between the individual particles cannot be captured explicitly by the current Eulerian-Lagrangian model. The separation distance, Ld, is obtained from the local particle volume fraction, [16]:
Since local quantities are averaged over a single computational cell, the aerodynamic interactions become significant when the ratio, Ld/Dd, of the inter-droplet spacing, Ld, to the droplet diameter, Dd, is less than 10. The reduction of the drag force on the second droplet in a dense water spray is modeled as [16]:
where Cd,0 is the single droplet drag coefficient and Fd/ Fd,0 is the hydrodynamic force ratio of the trailing particle to an isolated particle.
where Red is the single particle Reynolds number and W is the non-dimensional, non-disturbed wake velocity at the center of the trailing particle.
In the simulation, the drag reduction factor in Equation (7) is only activated when the local droplet volume fraction, , exceeds 10−5.
3.3. Combustion Model
It is cost-prohibitive to include a detailed heptane-air chemical reaction mechanism in 3D fire simulations. Thus, a three-step chemistry scheme is assumed for the combustion of heptane in rich conditions [21].
C7H16 + 10O2 → 6 CO2 + 7 H2O + CO + H2
2 H2 + O2↔2 H2O
Effects of finite-rate kinetic reactions on ignition processes of gas phase combustion attached to the fuel type greatly complicate the numerical modelling. Therefore, a mixing-controlled infinitely fast chemistry approach is employed for the primitive fuel combustion (Equation 9).

where denotes key mixing timescale, ζ(t) the unmixed fraction at time step t, and the initial value of unmixed fraction, ζ0, is set to 1. The rate of change in the mass fraction of species i in the mixed reactor zone, , can be determined by summing the mass rate of the reaction per unit volume for species i across all chemical reactions. Equation 12 is combined with a finite-rate Arrhenius reverse chemistry to create a mixed reaction. The exothermic reaction of carbon monoxide oxidation and the reversible endothermic reaction of CO2 (Equation 10) are expressed as follows:
The presence of the water vapor in Equation 10 for CO oxidation (Equation 13) and CO2 dissociation (Equation 14) is required, but its concentration does not explicitly participate in the reaction. The hydrogen combustion with oxygen is formulated as:
The rate of the corresponding reverse water vapor (H2O) dissociation is obtained from equilibrium [16]. It is worth noting that in FDS6 [16], interaction between turbulence and finite-rate chemistry is not incorporated. If an infinitely fast chemistry approach (Equation 12) is prescribed in the chemistry equations 10 and 11, the CO and H2 productions are almost suppressed.
3.4. Radiation and Soot Models
Radiation Transfer Equation (RTE) is solved with a ray-based method [16] in angular discretization and a finite volume method in spatial discretization. The absorption coefficient in the RTE includes gas-phase radiation of the most important combustion product controlling the thermal radiation, such as H2O, CO, CO2 and soot in addition to water mist. Advanced soot modeling [22] is constrained due to a lack of knowledge of relevant empirical parameters for any condensed fuel. In the present work, the more robust LSP (Laminar Smoke Point) model [23] is implemented in FDS6.8 instead of a simple soot-yield model for heptane fire in under-ventilated conditions. In such approach, the soot precursory rate is calculated as a function of temperature and mixture fraction. The pre-exponential factor in an Arrhenius formulation for soot precursory rate is reversely proportional to smoke height. The pre-exponential factor, the activation energy of the soot formation rate and the mixture fraction range over which soot is formed are detailed in Ref. [23]. The soot oxidation rate to CO2 is calculated from an Arrhenius expression as a function of the gas temperature and the soot/oxygen concentrations via the following chemistry scheme [16]:
Cs + O2 → CO2
It is worth noting that a three-step chemistry model does not allow to take into account the elementary reactions including OH* and O* radicals in soot oxidation mechanism [22,24]. The sub-grid soot variance modelling is not carried out, and soot is calculated from the filtered gas temperature and chemical species from LES.
3.5. Heat and Mass Balances at Interface
A circular pan of the fire source in the experiment can be accurately approximated by a circle in FDS6. The heat balance is established on the front surface to calculate the surface temperature of liquid through the convective and radiative heat fluxes.
where the point x=0 represents the surface of liquid. A one-dimensional heat conduction equation for the thermally-thick condensed phase temperature Ts(x, t) is applied in the direction x pointing into the liquid phase.
The evaporation rate of liquid fuel is calculated from the Stefan equation [16].
where D denotes the mass diffusivity, L the length scale and Nu Nusselt number. The Clausius–Clapeyron relation is employed in an equilibrium state to find the mass fraction of fuel vapor, YF,i, at the interface as a function of the liquid surface temperature. The radiation heat flux is calculated from the radiation intensity by solving RTE [16]. In liquid fuel modeling, radiation penetrates the liquid, and the absorption coefficient of heptane is set to 187 m−1. The wall model for velocity is used, which is based on the law with a semi-log fit connecting the limits of the viscous and log regions. By analogy to the near-wall model for velocity, the convective heat flux over the liquid surface is obtained from the non-dimensional temperature scale and the resistance to the heat and momentum transport close to the wall [16].
3.6. Computational Domain
Based on the experimental configuration (Figure 1a), the three dimensional computational domain of 2x2x1.6 m3 in the x, y and z directions respectively, is chosen. Such a calculation domain is large enough to exclude the negative effect of boundary entrainment on flow field. The liquid surface is embedded in the z=0 plane, centred in the x and y directions. Zero gradient conditions are used for the farfield free boundary values of the variables. A free boundary usually refers to a boundary where inflow and outflow are free, as illustrated in Figure 1a with a dashed lines. The mesh is attached to the sides of the experimental apparatus shown in Figure 1a to straighten the flow. A mesh size optimization is based on the fire characteristic length spreading over sixteen computational cells [16]. The grid system contains 110x110x150 cells, and the computational domain consists of more than one computational mesh with a grid size of 1 cm around the fire source and 2 cm near the free boundary. Such grid size usually gives grid-independent prediction for the calculation of the reacting fluid motion outside the flame thickness zone [20]. An extremely small grid size of 1 mm is required to fully resolve finite-rate chemistry in the flame zone, making practical 3D fire simulations difficult. By using 16 processors through parallel processing of a Linux cluster, the CPU time for a simulation with a physical time of about 120 s is approximately 100 h.
4. Results and Discussion
In FDS6 [16], the volume-median diameter of droplet and injection velocity must be prescribed at the nozzle exit. A series of parametric study by varying the droplet diameter from 30 to 50 μm and injection velocity from 10 to 25 m/s was first performed in non-fire conditions from one nozzle to calibrate injection condition at the nozzle exit. At a distance of 70 cm from the nozzle exit, droplet Sauter Mean Diameter and injection velocity were experimentally determined. After the post-processing of the numerical results, the predicted droplet Sauter Mean Diameter and injection velocity are compared with the experimental data in Figure 2 and Figure 3. Globally, the comparison between the numerical and the experimental results on the distribution of the droplet size and velocity is deemed satisfactory by prescribing the volume-median diameter of D=50 μm and an injection velocity of U=10 m/s at the nozzle exit. Thus, such two values are chosen as an input to perform the computation in the fire conditions.
Qualitative instantaneous images from a CCD camera are presented in Figure 4 to depict a time-varying visible flame oscillation which is characterized by a flame necking phenomenon and the intermittent zone. Just at application time of t0=60 s (Figure 4a), an injection of finely divided water mist (50 μm) into a flame has a combustion-supporting effect with a total destruction of the flame. Five seconds after addition of water vapor (t=t0+5 s, Figure 4b), the two competing effects such as a random lateral ejection of premixed flame pockets due to hydrogen increase via water–gas shift reaction, and an established diffusion flame take place with the occasional wisp of flame at the top of the reactive zone. The reason for flame expansion is attributed to penetration of droplets, in all regions of the flame, and of their rapid evaporation and expansion which causes gas displacement in the vicinity. Ten seconds after application of mist (t=t0+10 s, Figure 4c), water vapor precedes only partial fire extinguishment with a reduction in the flame size.
The experimental temperature contours are obtained from the thermocouple trees and presented in Figure 5 and Figure 6(a). Before application of water mist, both experiment and prediction show in Figure 5(a, b) that, the overall time-averaged temperature distributions are well characteristic of a diffusion flame with a temperature peak near the edge of the pool. However, the presence of high reactivity at the edge of the pool fire is not numerically reproduced with a temperature lower than the measured one.
As illustrated in Figure 4 with addition of water mist, the distinction between rich and lean regions becomes ill-defined due to random lateral ejection in time and space of reacting hot gaseous pockets. Thus, time-averaged data, as those obtained in Figure 6(a, b, c), cannot be expected to give deeper insight into the detailed mechanisms. As an illustration, the computed temperature fields (Figure 6b, c) obtained from both a drag reduction model and a drag coefficient of Cd=0.08 are compared to the measured one (Figure 6a). A visual similarity between the prediction with Cd=0.08 and the measurement shows that the temperature maximum is moved toward the pyrolysis surface under conditions of water vapor addition. The drag reduction model conducts to a lateral ejection of flame towards the right edge of the pyrolysis zone. This implies that a significant amounts of water vapor from a drag reduction model, which behaves as an inert diluent and heat sink, is essentially related to the absorption of a large part of the combustion energy at the center of the pyrolysis region. The observed experimental phenomenon is partly a temperature effect via activation energies associated with the water–gas shift reaction downstream of the flame. The addition in droplet evaporation enhances buoyancy and shifts the region of high reactivity, inferred by the temperature distribution, towards the burning surface. It is most probable that there are two competing effects such as a cooling effect due to the addition of water vapor which play the role of heat sink, and an exothermic effect associated with the shift of the water gas equilibrium reaction towards CO2 and H2 [21]. Such phenomenon cannot be numerically reproduced from the current modelling.
The predicted and measured temperature profiles along the flame axis at the four radial positions (r=0, 3, 6, 9 cm) are presented in Figure 7 before activation of water mist. There is a good fit between the predicted and measured gas temperature in no mist case except at r=3 cm where a flame necking phenomenon appears, and the temperature is significant over-predicted.
Profiles of predicted and measured axial temperature along the four thermocouple trees (r=0, 3, 6, 9 cm) after application of water mist are presented in Figure 8. Regardless of the drag coefficient, the general characteristics of the predicted temperature are in qualitative agreement with the measurements of gas temperature. It seems that with a drag reduction model, the water droplets evaporate well before approaching the flame sheet, and a consecutive efficient cooling of the thermal plume conduct to a temperature peak close to the experimental data. The predicted temperature peak increases with a reduction in the drag coefficient, and exceeds a critical value of 400 °C necessary to sustain combustion. A systematic deviation is found by increasing or decreasing the drag coefficient of Cd=0.15 by a factor of two, and the validation of the temperature profiles with a drag reduction model is just qualitative. However, it does provide a good indication of the impact of the drag coefficient on the temperature magnitude which influences the flame radiation.
The predicted liquid temperature at a steady state along the longitudinal co-ordinate x on the central plane (y=0) is provided in Figure 9. Without addition of water mist, the surface temperature of liquid fuel reaches to a peak of 80 °C, and more cold air is entrained at the edge of the pool fire with a significant drop in liquid temperature. Once starting water mist, a decrease of the liquid temperature occurs to 50 °C with a drag reduction model. With an increase of the drag coefficient from 0.08 to 0.3, the liquid fuel in the entire pyrolysis area becomes easy to preheat with a uniform temperature distribution. The computed liquid temperature with a drag coefficient of Cd=0.08 gives a similar trend to that in no mist case due to a shift of the high temperature region towards the liquid surface (Figure 6b).
As shown in Figure 10, the pyrolysis rate reaches a steady state to supply a permanently burning flame once the liquid temperature is established over its surface (Figure 9). Without addition of water mist, the peak of the pyrolysis rate moves towards the edge of the pool fire. There is a good fit in no mist case between the predicted and measured pyrolysis rates except near the edge of the pool fire where the experimental data are not available. Once the water spray with an injection velocity of 10 m/s is activated, the mass loss rate (MLR) cannot be again measured because the droplets influence the weight of the liquid fuel pan. Activation of water mist induces an enhancement of the burning rate due to the expansion effect of the water vapour which shifts the region of high reactivity towards the liquid surface (Figure 6b). By applying water mist, a sharp increase in burning rate by a factor of two compared to that in no mist case gives rise to a strong mixing between the flow of volatiles and entrained air. This results in a premixed convective type of a reaction zone rather than from a purely diffusive one at the fire base (Figure 4). The pyrolysis rate remains practically uniform with addition of water mist except near the edge of pool fire where an abrupt decrease of burning rate occurs due to a strong dilution of fuel vapor at the interface (Equation 15) via a buoyancy-induced flow. Impact of the drag force model on the pyrolysis rate seems less pronounced with a slight increase in burning rate near the edge of the pool at Cd=0.08 by a factor of 10% compared to that with a drag reduction model.
As shown in Figure 11, before activation of water mist, an abrupt increase of the Heat Release Rate (HRR) in an initial transient period is followed by a subsequent progressive increase. Starting from 40 s, the fire becomes fuel-controlled, and a fully developed, quasi steady state is characterized by a plateau with a HRR close to 36 kW which is derived from the measured MLR of liquid fuel (Figure 10). Once the water spray is activated at t0=60 s, the HRR is not available due to lack of the experimentally determined MLR. It appears that the water mist even with a rather high momentum provides an unsuppressed flame condition, and a higher HRR of about 70 kW is achieved. This is attributed to the buoyancy-induced rising plume which is sufficient to deflect the water mist spray away from the burning surface. Moreover, an interplay of the gas-phase combustion within the water mist cloud induces a stronger oscillation in the HRR with a drag reduction model compared to that with Cd=0.08. This implies that the drag coefficient impacts significantly the momentum lost in the gas phase and the acceleration of a single droplet (Equations 1, 2) via the drag force.
It would be worthwhile to analyse the resulting radiant emission in Figure 12 from the flame which in turn determines the burning rate (Figure 10). The radiative flux is a temperature-sensitive volumetric mechanism associated with both the gas temperature and concentration of emitting species as CO2, H2O and soot. In no water mist case, a high radiative heat flux covers the entire pyrolysis area because a larger flame zone (Figure 5) yields substantial soot and luminous radiation with a peak in radiation flux of about 15 kW/m2. Globally, the comparison is deemed satisfactory in no mist case with an uncertainty within 30%. Application of water mist conducts to a decrease of the peak in radiation flux to 10 kW/m2 which is over-predicted by a factor of two compared to the experimental data by using a drag reduction model. A low drag coefficient of Cd=0.08 conducts to a more important deviation of the predicted radiation flux with a peak of 16 kW/m2 in relation to the measured one. The difference between the prediction and the measurement might be caused by an over-prediction of the gas temperature around the fire source (Figure 8) and uncertainties in measuring radiative heat flux during addition of water mist.
The convective heat exchange from the flame to the liquid surface is shown in Figure 13. Before activation of water mist, the convective heat flux exhibits a peak of about 6 kW/m2 at the edge of pool fire due to a strong interaction between the buoyancy-induced flow and the fuel injection. A sharp decrease to 1 kW/m2 once far away from the edge region is a result of a reduction in temperature gradient at the centre of the pyrolysis zone where the flame is significantly lifted above the fuel surface. By applying water mist, there is a great trend to increase the convective heat flux by a factor of five with a drag reduction model compared to that without mist except near the edge region. A low drag coefficient of Cd=0.08 conducts to a peak in convection flux of about 7 kW/m2 at the edge of pool fire. Such an increase in convection flux is attributed to a shift of flame region with addition of mist towards the burning surface which enhances the temperature gradient there (Figure 6). Without addition of water vapour, contribution of the radiation heat flux (Figure 12) to the pyrolysis rate (Figure 10) seems predominant although the convection heat flux is certainly predominant at the edge of the pool fire. After application of water mist, an increase of the burning rate (Figure 10) is related mainly to the significance of convective heat flux.
A typical example of the distribution of the predicted concentrations (mol/mol) of carbon monoxide and carbon dioxide on the symmetrical plane (x, z) is presented in Figure 14 and Figure 15(a, b, c). In no mist case (Figure 14a), the buoyancy-induced flow carries abundant CO along the forward flow with a slow decay of the CO emission. An application of water mist allows to entrain more water vapour via droplet evaporation which is capable of providing a quick decay of the CO emission in a thermal plume region. It seems that the peak in CO molar fraction is weakly dependent on water vapor addition with a maximum of roughly 1%. The total smoke production at the extraction hood was not collected for identifying the CO yields. Carbon dioxide (CO2) production, as shown in Figure 15(a, b, c), particularly influences fire suppression system. The buoyancy-induced flow facilitates a large presence of CO2 in the visible flame zone with a maximum of about 10% without spray. Water mist leads to a decay of CO2, and its peak reaches to roughly 7%, implying a low chemical reactivity due to water vapour addition. It is somewhat expected that a reduction in CO concentration in presence of water mist should decrease the peak of CO2 [21]. The prediction indicates that a drag reduction model conducts to a significant dilution effect in the visible flame zone, which appears larger than the chemical one. No measurements are made of the chemical species present in the flame before and after activation of water mist. In reality, since the competing reactions involving H2, CO and soot are coupled with water mist addition, the interpretation from the numerical results can only be of qualitative and speculative nature. In addition, there are rather complex combinations of mixing and reaction processes with water mist addition, neither of which are stationary in space and time. Usually, CO and soot formations are closely related with existing of obvious kinetic links between them [24].
Iso-contours of the predicted concentrations (mol/mol) of hydrogen and water vapor on the symmetrical plane (x, z) are depicted in Figure 16 and Figure 17(a, b, c). In no water mist case, a buoyancy-induced fire (Figure 16a) correlates to a large extent of hydrogen concentration above 0.5% in the high temperature region. In this context of water vapour addition in a hot environment, it is expected that H2 increases and H2O decreases. However, an application of water mist significantly reduces the extent of H2 concentration above 0.5% due to a decrease in reactive zone (Figure 6). It is found that the maximum H2 undergoes an increase only in fuel rich region when the temperature is sufficiently high, and later, enters quickly the decay phase. The extent of H2 molar fraction above 0.2% in no mist case increases by a factor of ten compared to that after activating water mist. Globally, hydrogen occurs only in the fuel-rich, an oxygen-starved area at locations where the temperature is high enough to trigger its activation. It is worth noting that H2 is highly flammable with an ignition energy that is smaller than that of unburnt hydrocarbons [24]. A drag reduction model conducts to a significant dilution effect in the visible flame zone, which appears larger than the chemical one. An interaction between the gas-phase combustion and the water mist cloud induces a small extent of hydrogen with a constant of Cd=0.08 compared to that with a drag reduction model. This implies that the drag coefficient impacts significantly the evaporation of water mist in the gas phase via the acceleration of a single droplet.
Iso-contours of the predicted unburnt hydrocarbon concentration (mol/mol) as heptane on the symmetrical plane (x, z) are depicted in Figure 18(a, b, c). The most severe production of unburnt fuels with a peak of about 10% nearby the pyrolysis zone is mainly attributed to the under-ventilated condition due to lack of oxygen with or without spray. After application of water mist, the unburnt hydrocarbons can be easily suppressed downstream once away from the fuel rich region of fire source regardless of drag force model. However, a water vapour addition heavily restricts fresh air supply into the pool fire base, leading to again a significant molar fraction of the unburnt hydrocarbons there.
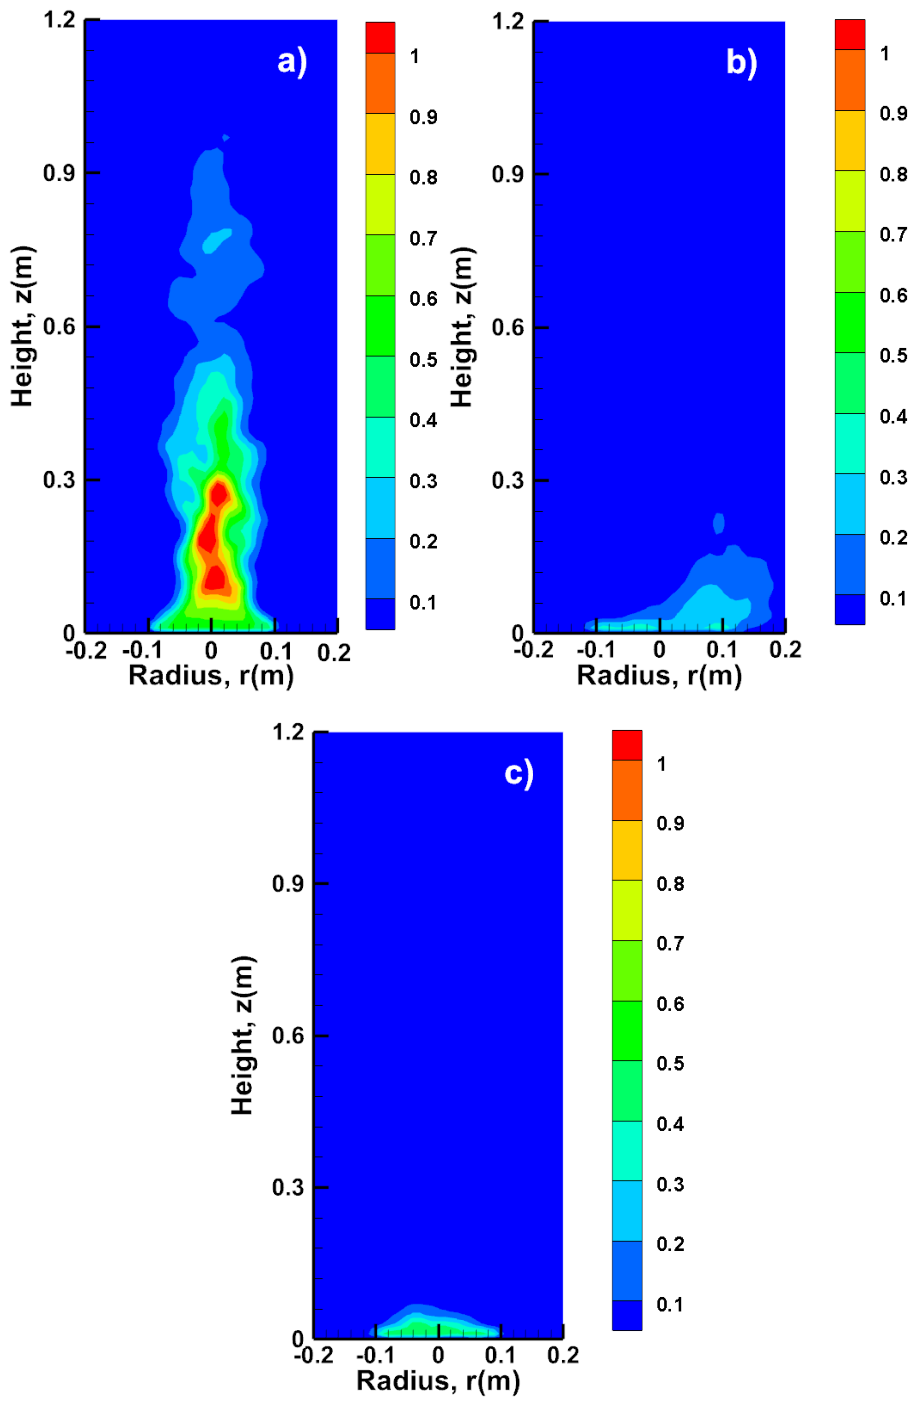
Iso-contours of the predicted soot volume fraction (ppm) before and after activation of water mist on the axis of symmetry are depicted in Figure 19(a, b, c). In no mist case, the concentration of soot is low near the liquid surface due to the quasi-absence of oxidant species penetration for any reaction of fuel vapour and pyrolysis products. Without spray, the majority of soot emission takes place downstream in the fuel-rich core with a peak of about 1 ppm where heat is released as the fuel reacts with the entrained air. Natural convection is favorable for dilution in the thermal plume with a decreasing trend in soot emission peak. After activation of water mist, reduction in soot emission is significant with a peak of about 0.5 ppm, and the majority of soot formation takes place at the bottom of the fire regardless of the drag force model. It seems that the soot precursory rate weakly correlates to concentration of the unburnt hydrocarbons with water vapour addition. The highly reactive radicals induced by water mist react quickly with hydrocarbon species causing an effective reduction in the rates of soot initiation and growth. Soot emission in the thermal plume is suppressed as soon as the mist-plume interface approaches the flame sheet. This implies that the drag coefficient impacts slightly the soot formation in the gas phase via the momentum loss of a single droplet.
5. Conclusions
An experimental and numerical study on the suppression of a turbulent diffusion flame by applying water mist has been conducted. This numerical study has provided an in-depth analysis on the main parameter of drag force when evaluating the precision of an interaction model between fire and water mist which should be the influence of the thermal expansion and chemical species distribution. It should be noted that a systematic deviation is not solely due to errors induced by a drag force model. Rather, it is associated with uncertainties associated with a multitude of potential errors in combustion, turbulence and soot models. Any attempt to solely vary an ad-hoc reduction of the drag coefficient to match the experimental data for all water mist sprays is discouraged. Variation of drag coefficient over a range of values emphasizes the need for developing advanced numerical models for the droplet interactions, such as coalescence in water mist sprays. In fact, the accurate results depend on the fire scenario related to fuel type/size and ventilation conditions via the strong coupling between soot radiation and pyrolysis rate.
Although, many aspects of the models used in the present work still require verification due to lack of the experimental data, the impact of water mist on the flame behavior and chemical species due to a dilution and volumetric expansion is clearly shown. The water mist leads mainly to a reduction in both the resultant flame temperature and reactive zone. The numerical results do not allow to point to evidence that water vapor addition interacts chemically in the flame, such as a decrease of soot, CO and an increase of CO2. The explanation of the observed mist effects from the present case is of a purely speculative nature as no measurements are made of the chemical species or radicals present in the flame. With addition of water vapor, the two competing effects such as a random lateral ejection of premixed flame pockets due to hydrogen ignition via water–gas shift reaction, and an established diffusion flame at the base are to a large extent unexplored. The future study aims to calls upon new developments for droplet coalescence modelling in mist sprays because of the perturbing influence of the injected water vapor at the flame base. It should provide also the more potential experimental data on the measurements of HRR, CO and H2 at the level of the extraction for the validation of the modelling in the future study.
References
- Liu, 1 Y.; Wang, X.; Liu, T.; Ma, J.; Li, G.; Zhao, Z. Preliminary study on extinguishing shielded fire with water mist. Process Saf. Environ. Prot. 2020, 141, 344–354. [Google Scholar] [CrossRef]
- Liu, Z.; Kim, A. K. Review of water mist fire suppression systems – fundamental studies. J. Fire Prot. Eng. 2000, 10, 32–50. [Google Scholar] [CrossRef]
- Dasgotra; Rangarajan, G.; Tauseef, S.M. CFD-based study and analysis on the effectiveness of water mist in interacting pool fire suppression. Process Saf. Environ. Prot. 2021, 152, 614–629. [Google Scholar] [CrossRef]
- Prasad, K.; Li, C.; Kailasanath, K.; Ndubizu, C.; Ananth, R.; Tatem, P. Numerical modeling of water mist suppression of methane-air diffusion flames. Combust. Sci. Technol. 1998, 132, 325–364. [Google Scholar] [CrossRef]
- Zegers, E.; Williams, B.; Fleming, J. Dynamics and suppression effectiveness of monodisperse water droplets in non-premixed counterflow flames. Proc. Combust. Inst. 2000, 28(2), 2931–2937. [Google Scholar] [CrossRef]
- Thomas, G. The quenching of laminar methane-air flames by water mists. Combust. Flame 2002, 130(1), 147–160. [Google Scholar] [CrossRef]
- Ananth, R.; Mowrey, R. Ultra-fine water mist extinction dynamics of a co-flow diffusion flame. Combust. Sci. Technol. 2008, 180(9), 1659–1692. [Google Scholar] [CrossRef]
- Acherar, L.; Wang, H. Y.; Coudour, B.; Garo, J. P. Impact of airflow rate on fire suppression via water mist in a mechanically ventilated compartment. Fire Technol. 2025, 61, 1557–1578. [Google Scholar] [CrossRef]
- Jenft; Boulet, P.; Collin, A.; trevisan, N.; Mauger, P.N.; Pianet, G. Modeling of fire suppression by fuel cooling. Fire Saf. J. 2017, 91, 680–687. [Google Scholar] [CrossRef]
- Grant, G.; Brenton, J.; Drysdale, D. Fire suppression by water sprays, Progress. Energy Combust. Sci. 2000, 26, 79–130. [Google Scholar] [CrossRef]
- James, P. W.; Verma, S.; Keller, E.; Hao, A.; Trouvé, A.; Marshall, A. W. Water mist suppression of a turbulent line fire. Fire Saf. J. 2017, 91, 705–713. [Google Scholar] [CrossRef]
- Mehaddi, R.; Collin, A.; Boulet, P.; Acem, Z. Use of a water mist for smoke confinement and radiation shielding in case of fire during tunnel construction. Int. J. Therm. Sci. 2020, 148, 106156. [Google Scholar] [CrossRef]
- Yao, Y.; Li, Y. Z.; Ingason, H.; Cheng, X.; Zhang, H. Theoretical and numerical study on influence of wind on mass loss rates of heptane pool fires at different scales. Fire Saf. J. 2020, 120, 103048. [Google Scholar] [CrossRef]
- Jenft; Collin, A.; Boulet, P.; Pianet, G.; Breton, A.; Muller, A. Experimental and numerical study of pool fire suppression using water mist. Fire Saf. J. 2014, 67, 1–12. [Google Scholar] [CrossRef]
- Ingason, H.; Li, Y. Z. Large scale tunnel fire tests with different types of large droplet fixed fire fighting systems. Fire Saf. J. 2019, 107, 29–43. [Google Scholar] [CrossRef]
- McGrattan, K.; Hostikka, S.; Floyd, J.; McDermott, R.; Vanella, M.; Mueller, E. Fire Dynamics Simulator User’s Guide, NIST Special Publication (2024) 1019, sixth ed.
- Liu, Y.; Beji, T.; Thielens, M.; Tang, Z.; Fang, Z.; Merci, B. Numerical analysis of a water mist spray: The importance of various numerical and physical parameters, including the drag force. Fire Saf. J. 2021, 127, 103515. [Google Scholar] [CrossRef]
- Miyanoiri, Y.; Tanaka, F.; Morita, D.; Beji, T. On the increase in carbon monoxide production during the activation of water mist spray on a fire. Fire Saf. J. 2025, 156, 104473. [Google Scholar] [CrossRef]
- Tanaka, F.; Kato, D. Experimental and numerical study on fire extinguishing by water spray. Fire Saf. J. 2023, 141, 103984. [Google Scholar] [CrossRef]
- Acherar, L.; Wang, H. Y.; Garo, J.P.; Coudour, B. Impact of air intake position on fire dynamics in mechanically ventilated compartment. Fire Saf. J. 2020, 118, 103210. [Google Scholar] [CrossRef]
- Kanury, Murty. Introduction to Combustion Phenomena; Gordon: New York, 1984; ISBN 0-677-02690-0. [Google Scholar]
- Guibaud; Consalvi, J. L.; Orlac’h, J. M.; Citerne, O. J. M.; Legros, G. Soot production and radiative heat transfer in opposed flame spread over a polyethylene insulated wire in microgravity. Fire Technol. 2020, 56, 287–314. [Google Scholar] [CrossRef]
- Yao, W.; Zhang, J. P.; Nadjai, A.; Beji, T.; Delichatsios, M. A. A global soot model developed for fires: Validation in laminar flames and application in turbulent pool fires. Fire Saf. J. 2011, 7, 371–387. [Google Scholar] [CrossRef]
- Richard, J.; Garo, J. P.; Souil, J. M.; Vantelon, J. P.; Knorre, V. G. Chemical and physical effects of water vapor addition on diffusion flames. Fire Saf. J. 2003, 38, 569–587. [Google Scholar] [CrossRef]
Figure 1.
Scheme of the experimental set up consisting of a pool fire subjected to water mist.
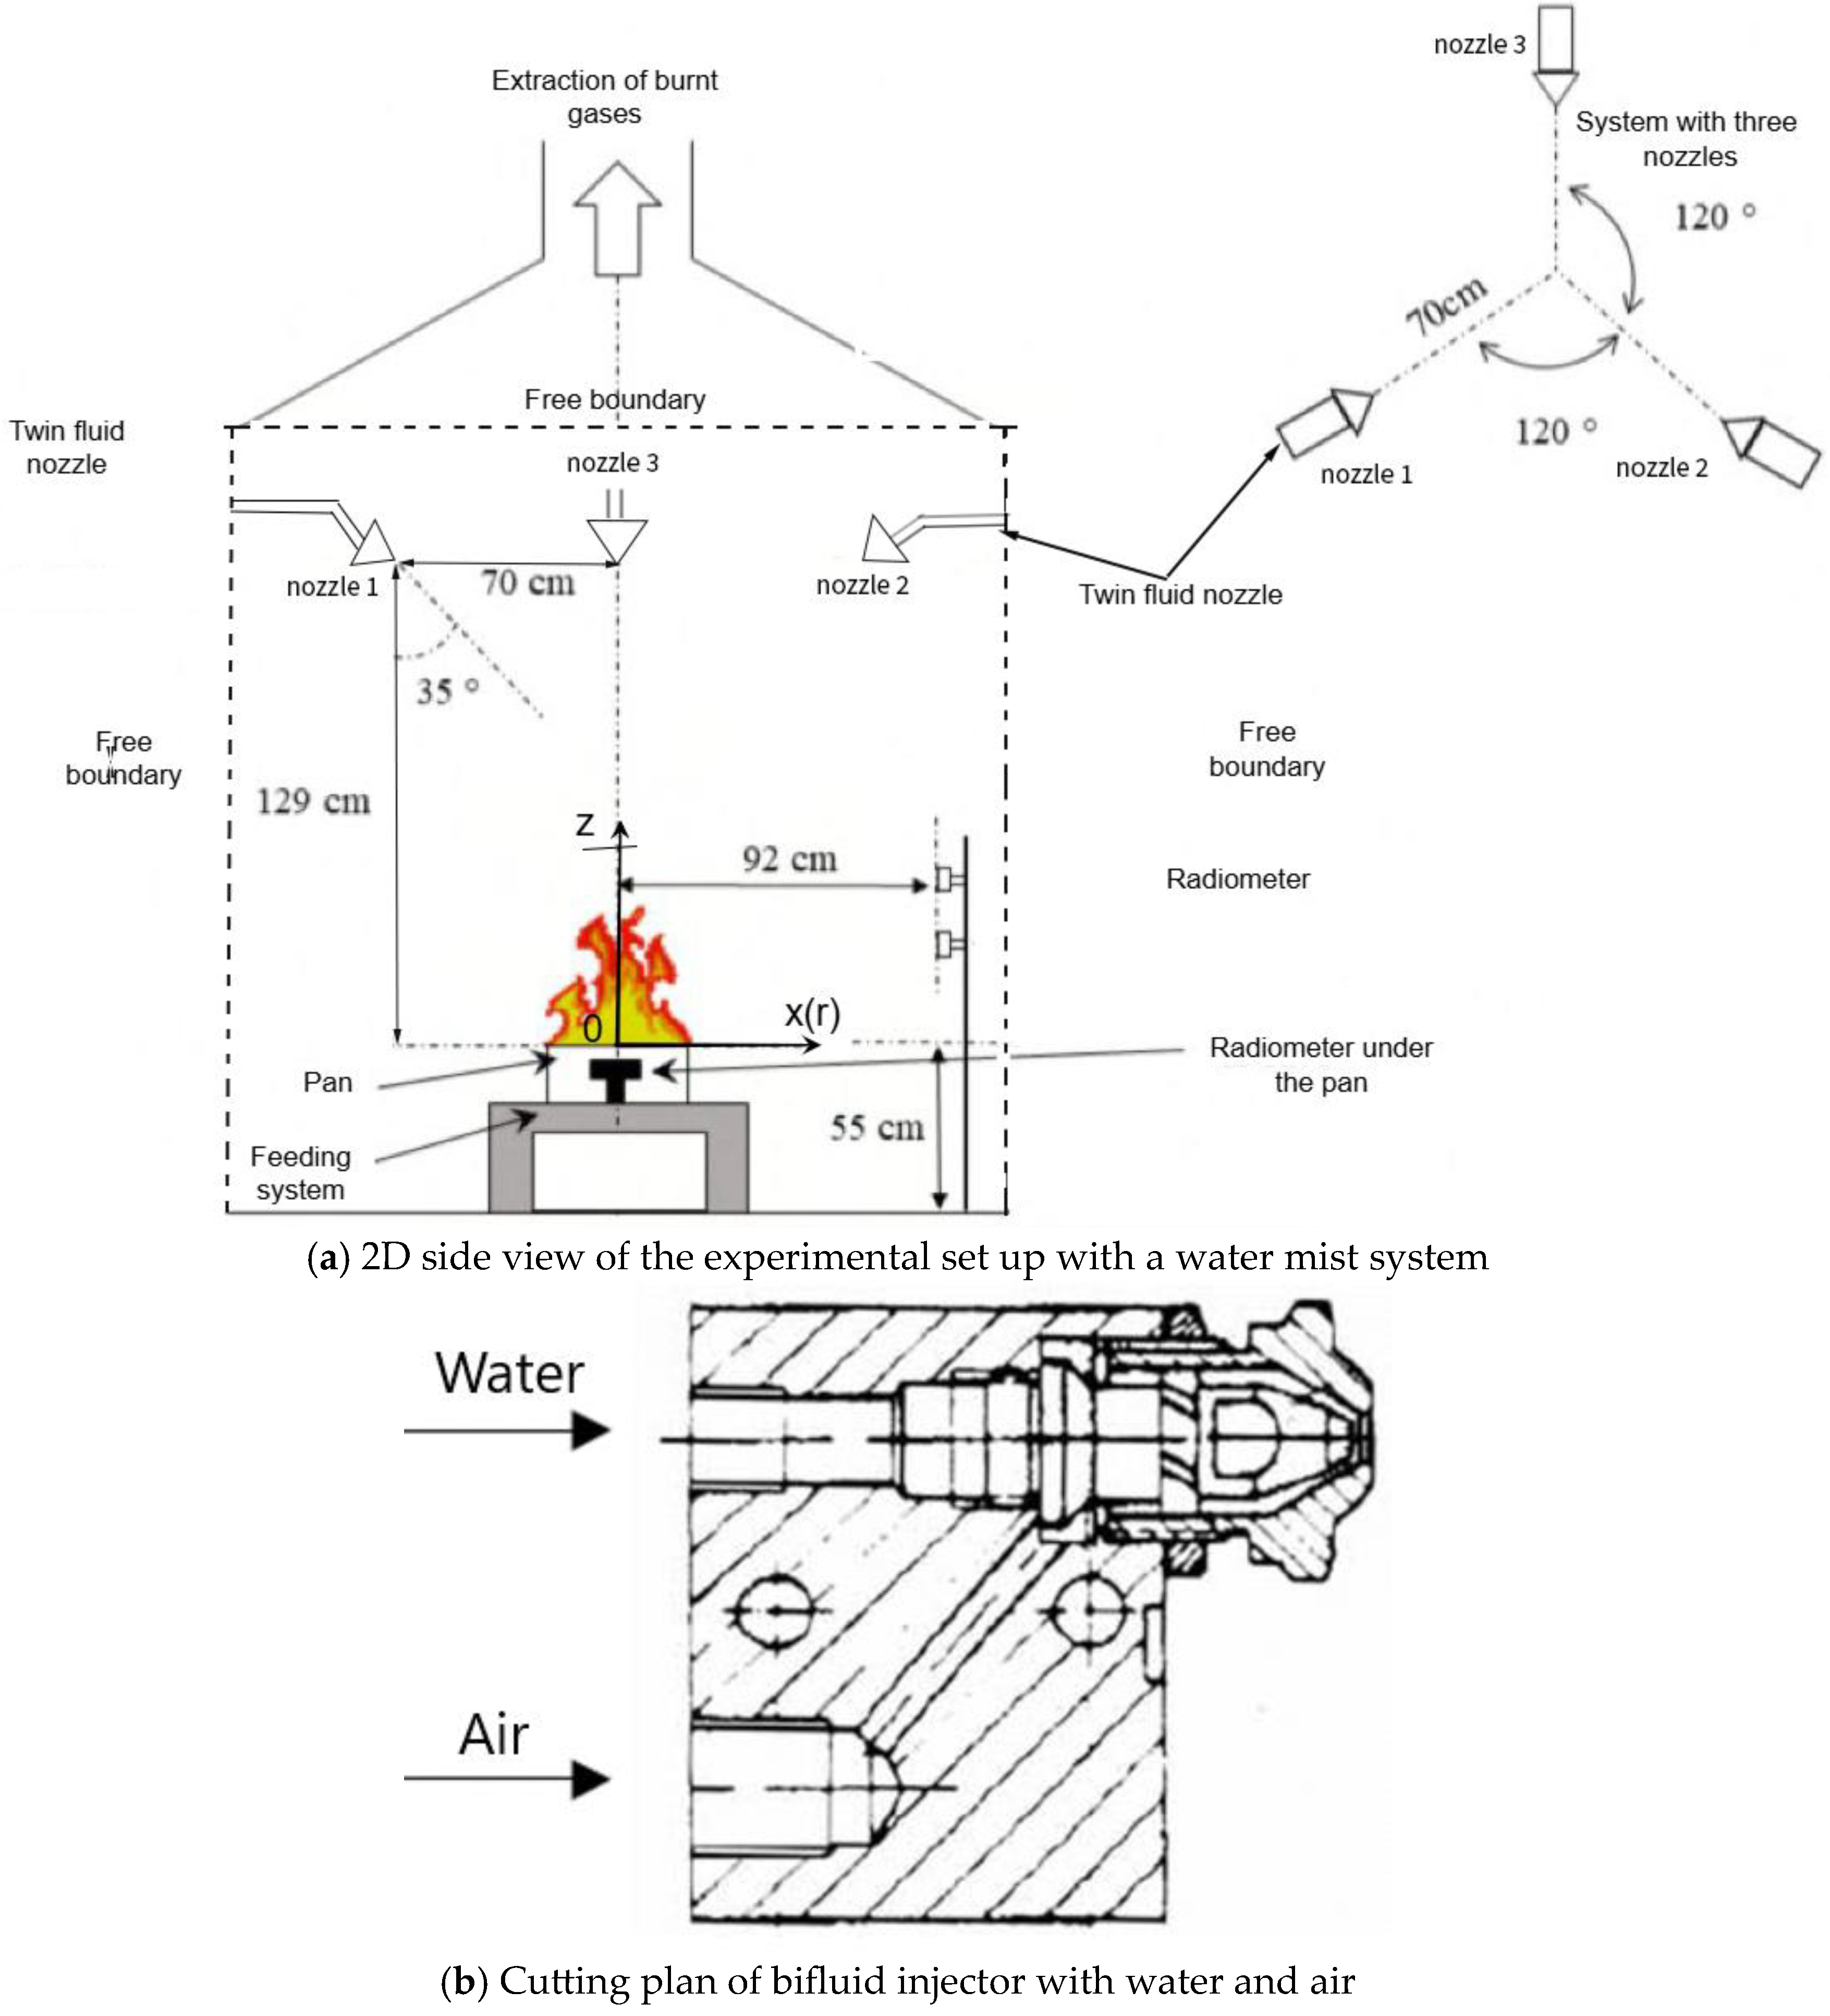
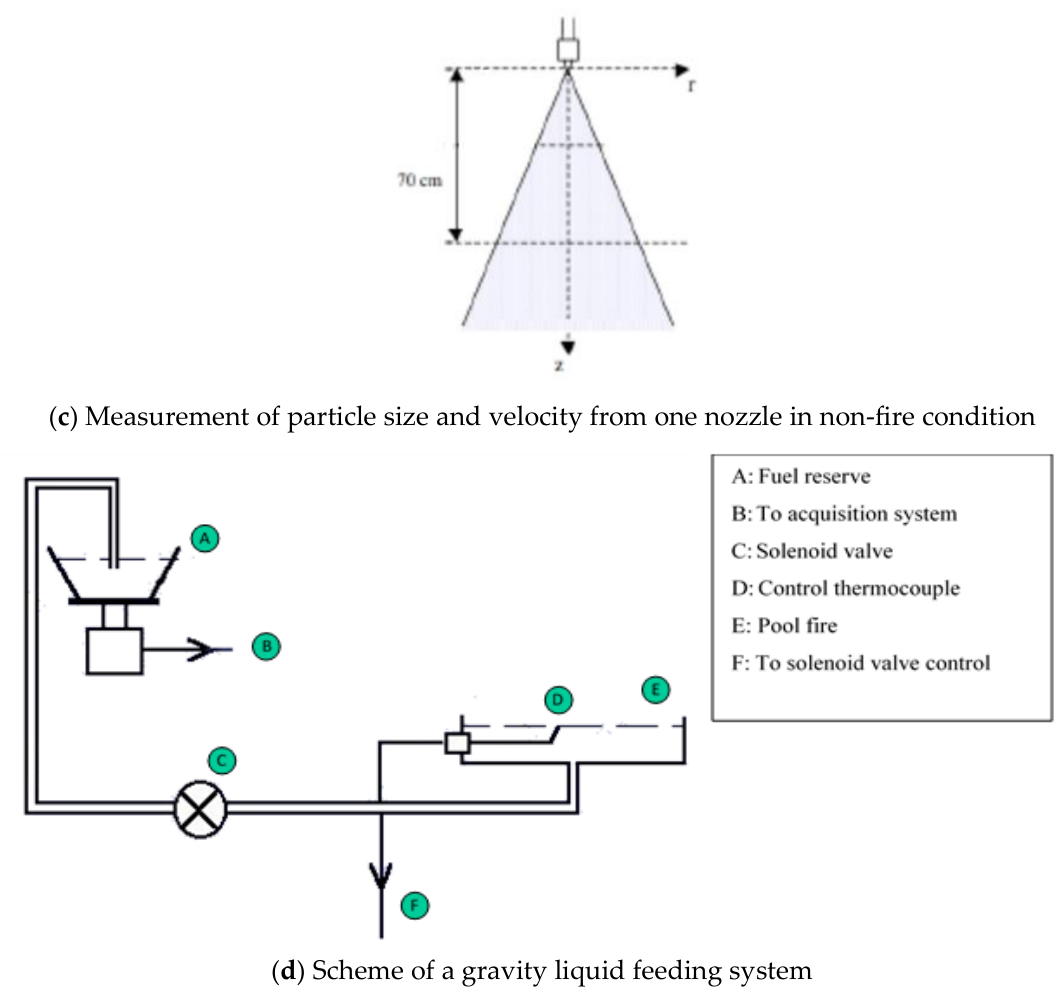
Figure 2.
Sauter Mean Diameter.
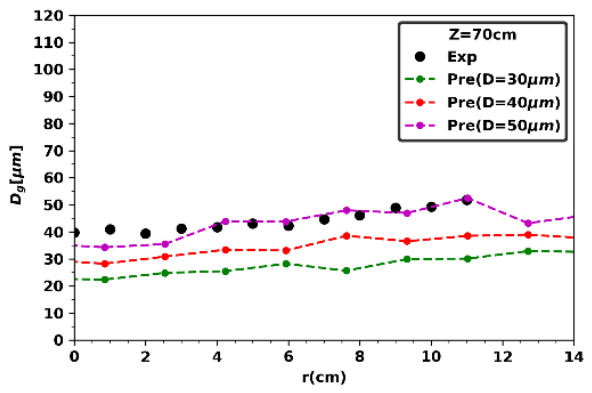
Figure 3.
Mist injection velocity.
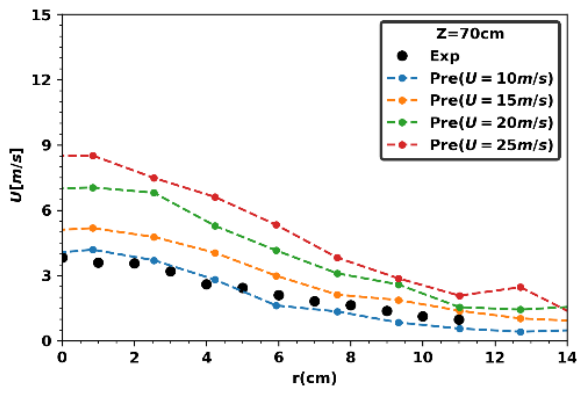
Figure 4.
Instantaneous flame images during interaction between fire and water mist with application time at t0=60 s (a) t=t0+5 s (b) and t=t0+10 s (c).
Figure 4.
Instantaneous flame images during interaction between fire and water mist with application time at t0=60 s (a) t=t0+5 s (b) and t=t0+10 s (c).
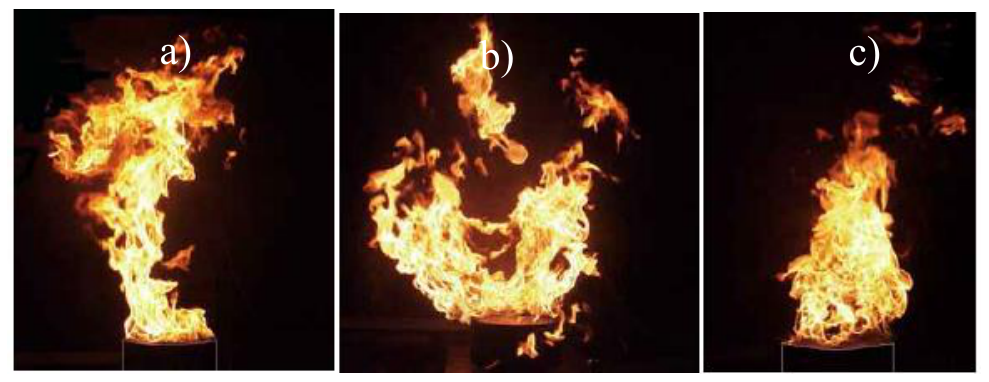
Figure 5.
Time-averaged temperature distribution without spray; a) Measurement; b) prediction.
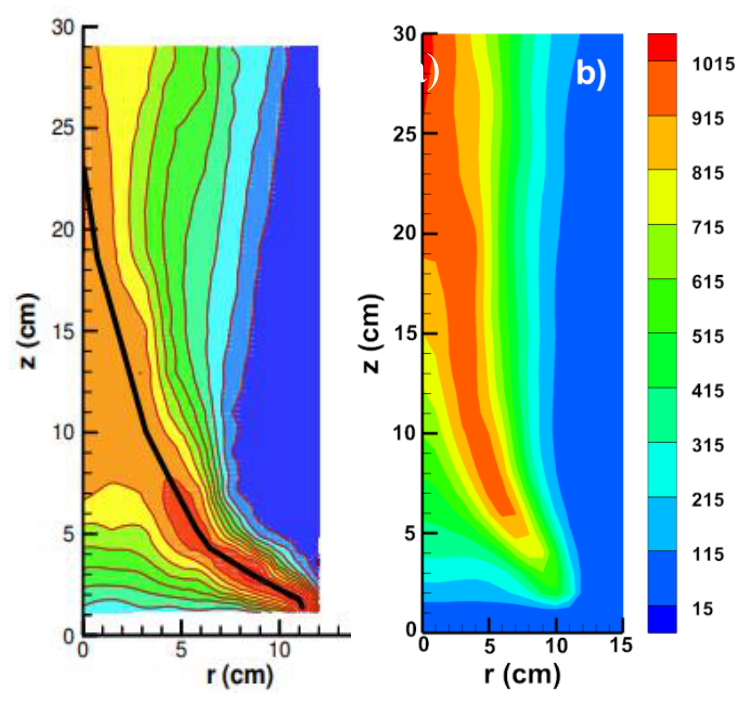
Figure 6.
Time averaged temperature distribution during fire-mist interaction; a) Measurement; b) prediction with drag reduction; c) prediction with Cd=0.08.
Figure 6.
Time averaged temperature distribution during fire-mist interaction; a) Measurement; b) prediction with drag reduction; c) prediction with Cd=0.08.
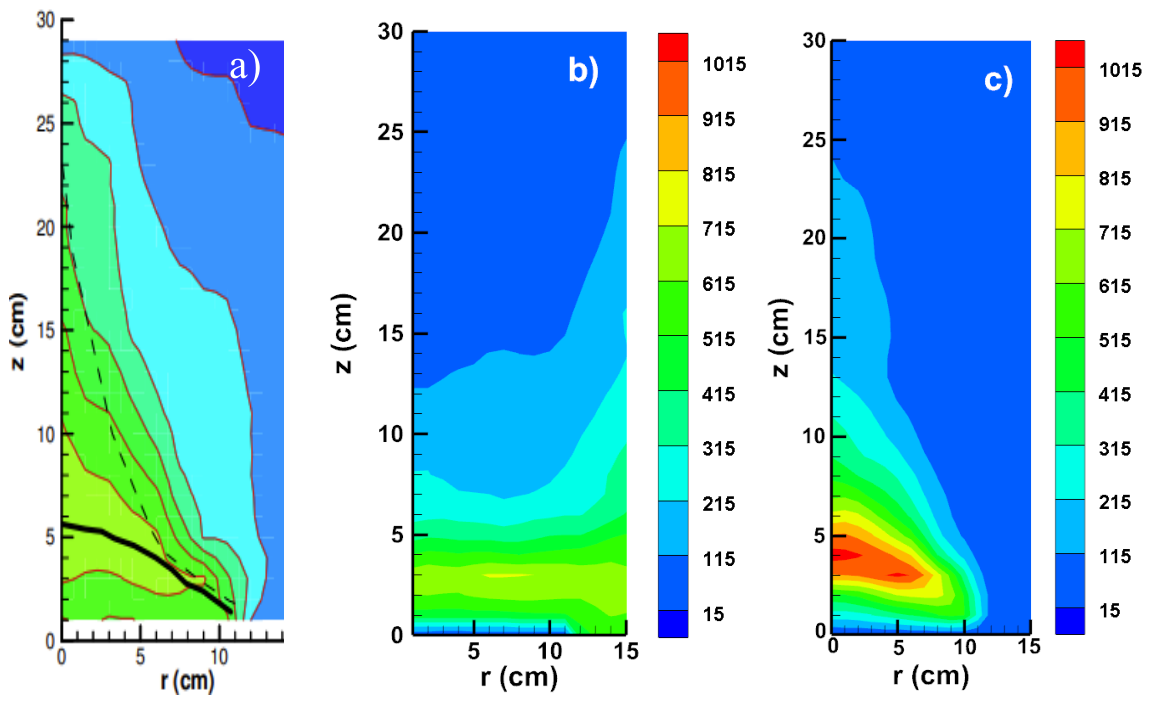
Figure 7.
Predicted and measured axial temperature along the four thermocouple trees in no mist case.
Figure 7.
Predicted and measured axial temperature along the four thermocouple trees in no mist case.
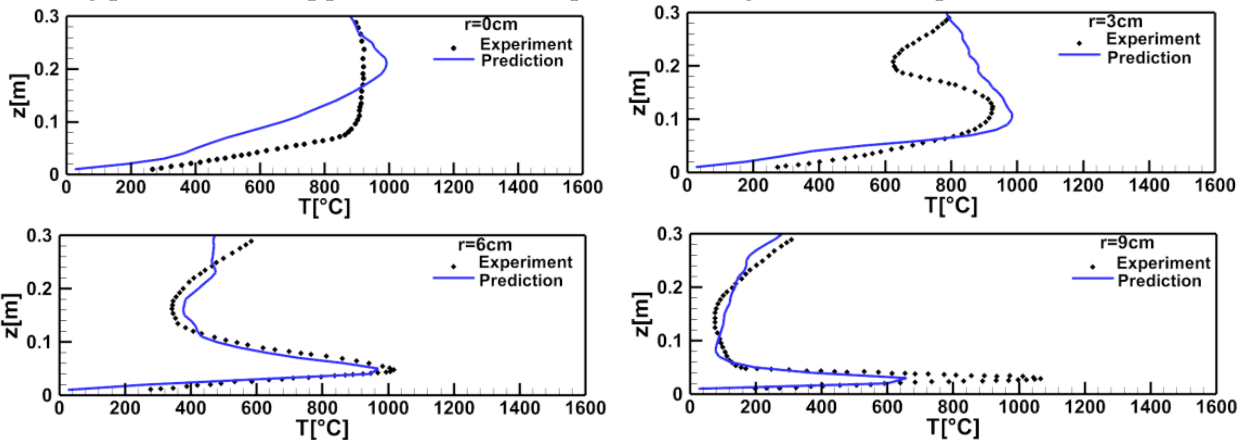
Figure 8.
Prediction and measurement of the temperature profiles along the four thermocouple trees after activation of water mist.
Figure 8.
Prediction and measurement of the temperature profiles along the four thermocouple trees after activation of water mist.
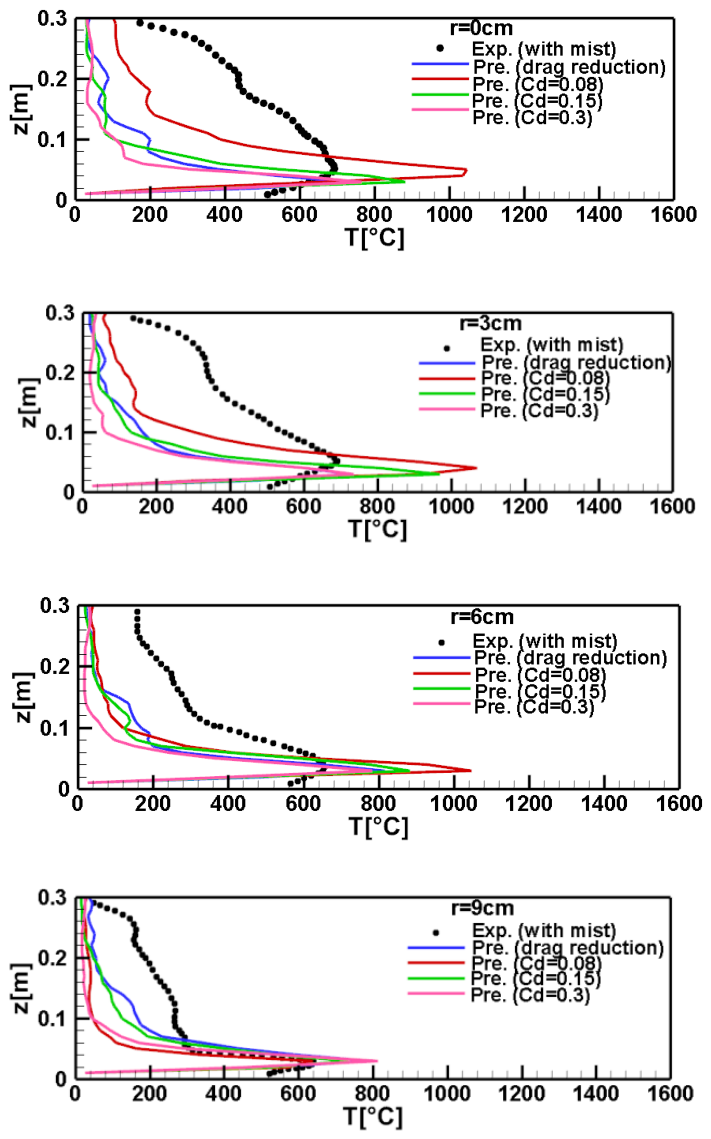
Figure 9.
Liquid surface temperature before and after application of water mist.
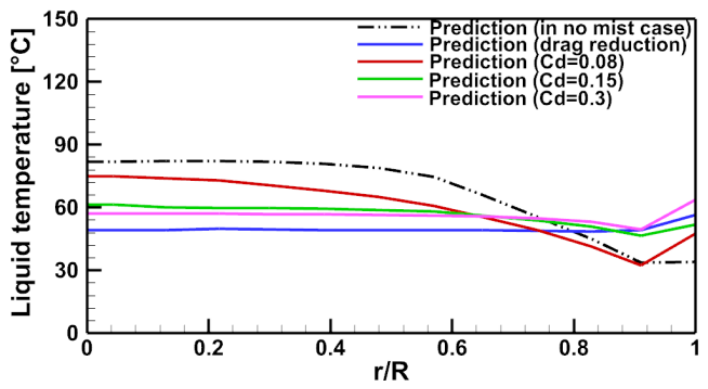
Figure 10.
Pyrolysis rate of liquid fuel before and after application of water mist.
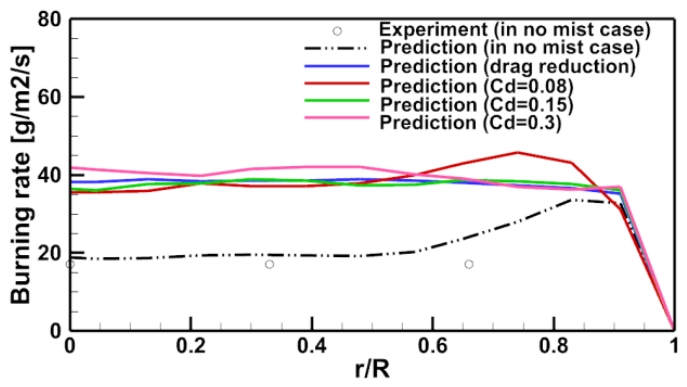
Figure 11.
Impact of water mist on evolution of the predicted heat release rate.
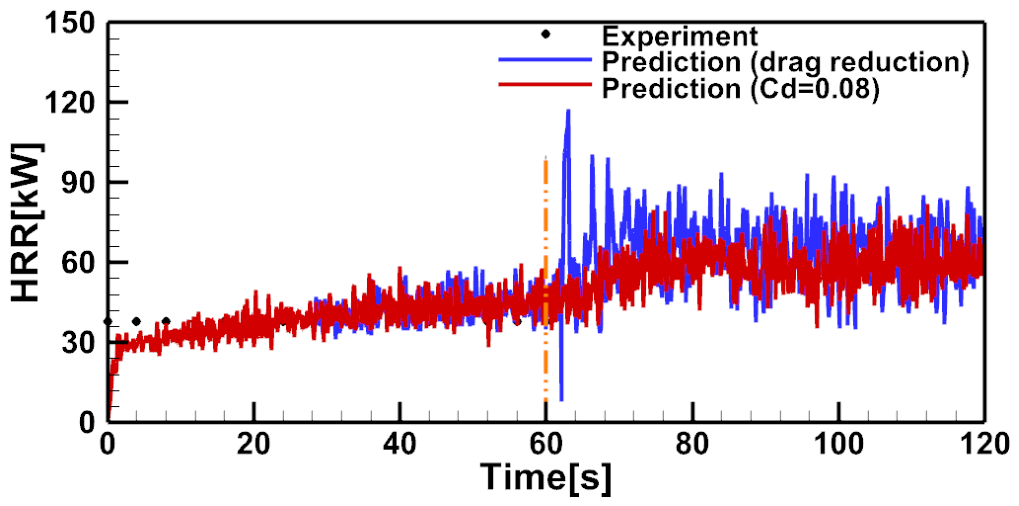
Figure 12.
Radiation heat flux before and after application of water mist.
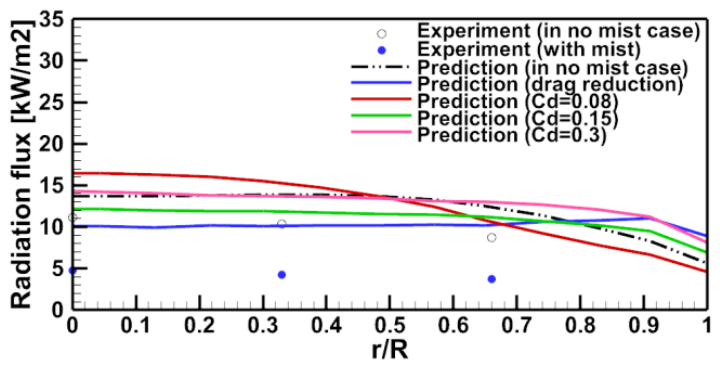
Figure 13.
Convection heat flux before and after application of water mist.
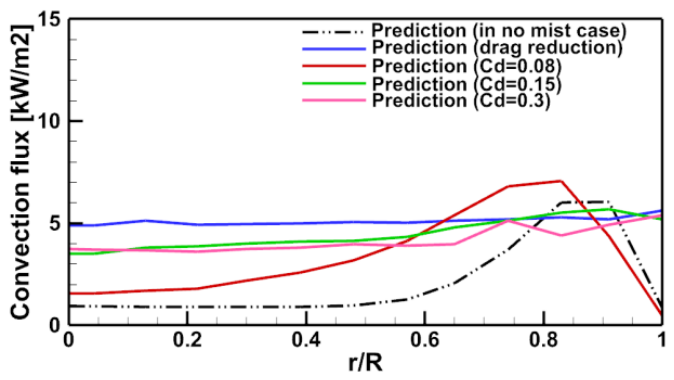
Figure 14.
Carbon monoxide concentration (a) without spray; (b) with water mist for drag reduction model (c) with water mist for Cd=0.08.
Figure 14.
Carbon monoxide concentration (a) without spray; (b) with water mist for drag reduction model (c) with water mist for Cd=0.08.
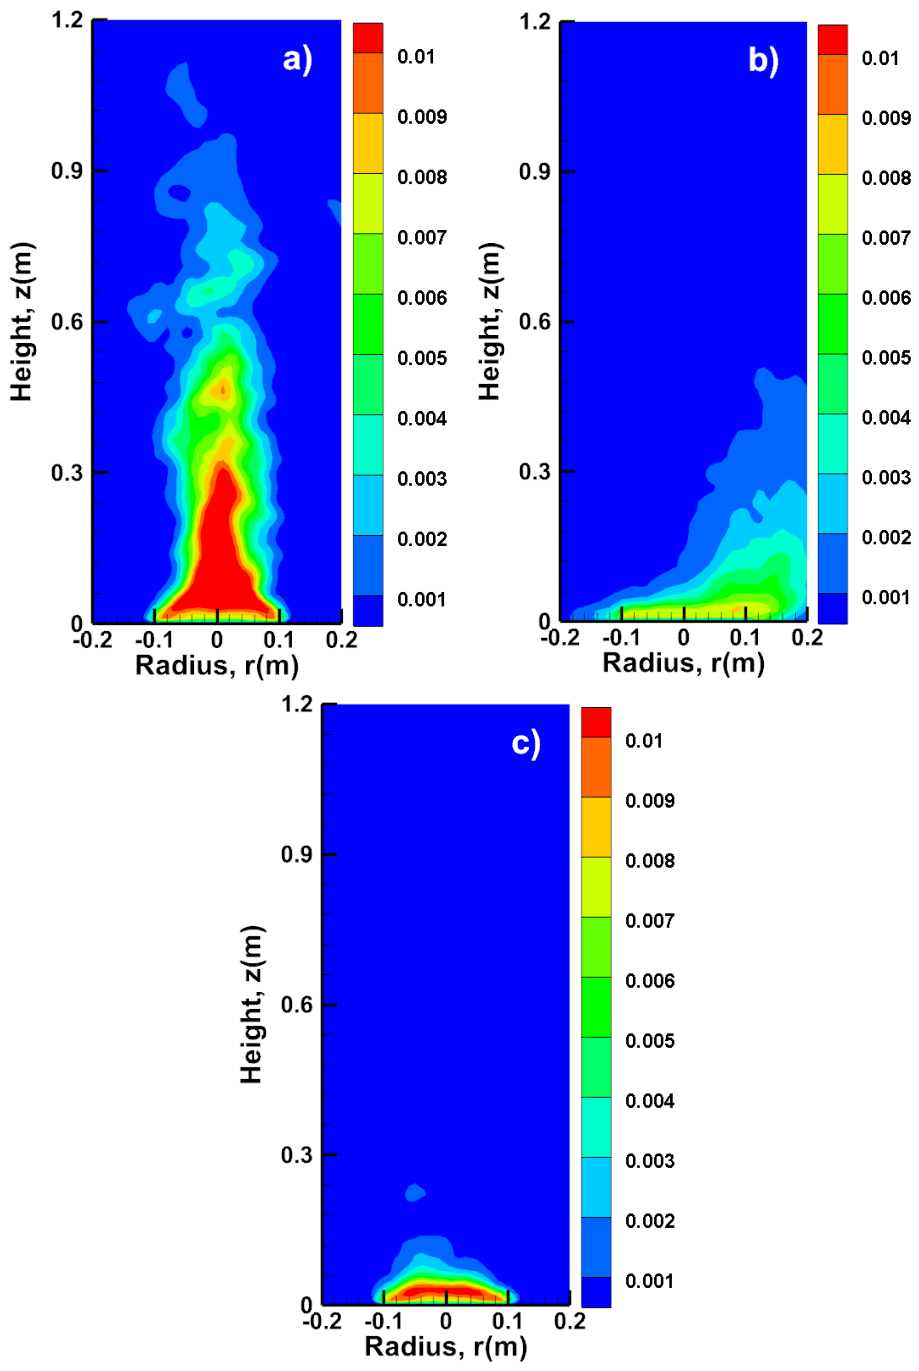
Figure 15.
Carbon dioxide concentration (a) without spray; (b) with water mist for drag reduction model; (c) with water mist for Cd=0.08.
Figure 15.
Carbon dioxide concentration (a) without spray; (b) with water mist for drag reduction model; (c) with water mist for Cd=0.08.
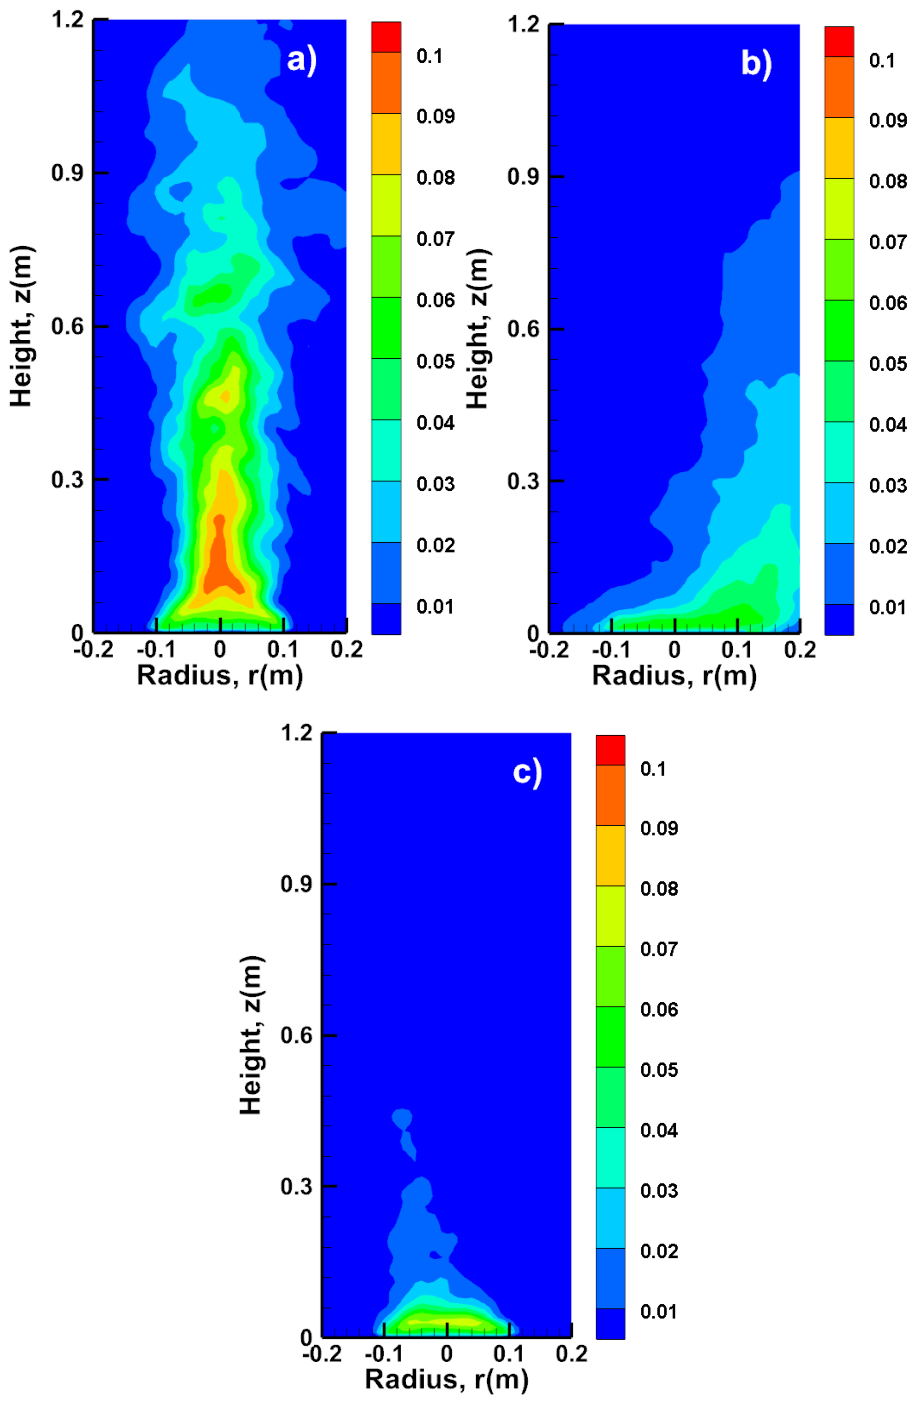
Figure 16.
Hydrogen concentration (a) without spray; (b) with water mist for drag reduction model; (c) with water mist for Cd=0.08.
Figure 16.
Hydrogen concentration (a) without spray; (b) with water mist for drag reduction model; (c) with water mist for Cd=0.08.
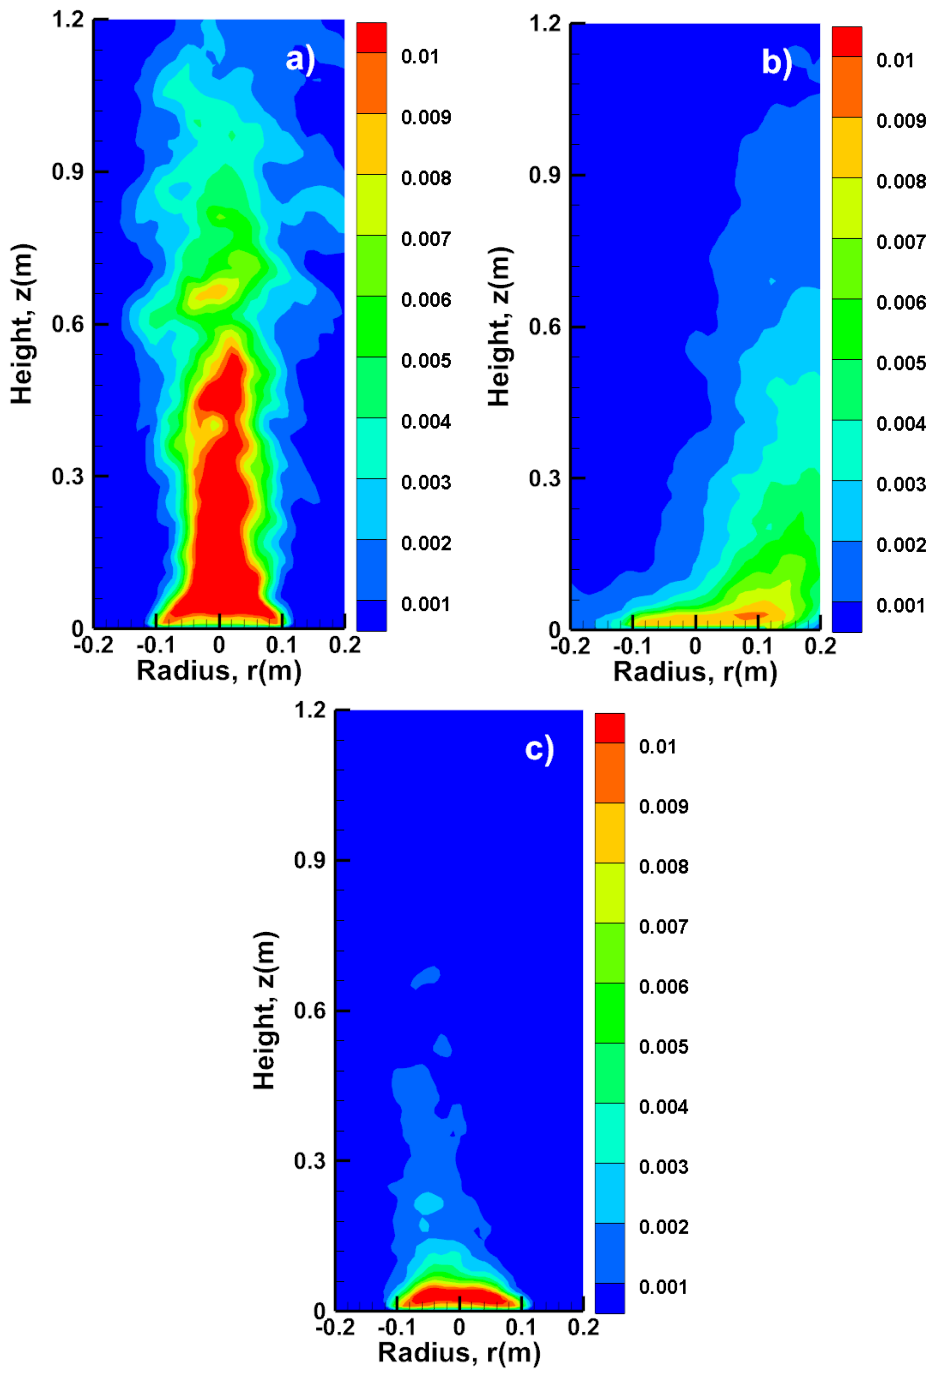
Figure 17.
Water vapor concentration (a) without spray; (b) with water mist for drag reduction model; (c) with water mist for Cd=0.08.
Figure 17.
Water vapor concentration (a) without spray; (b) with water mist for drag reduction model; (c) with water mist for Cd=0.08.
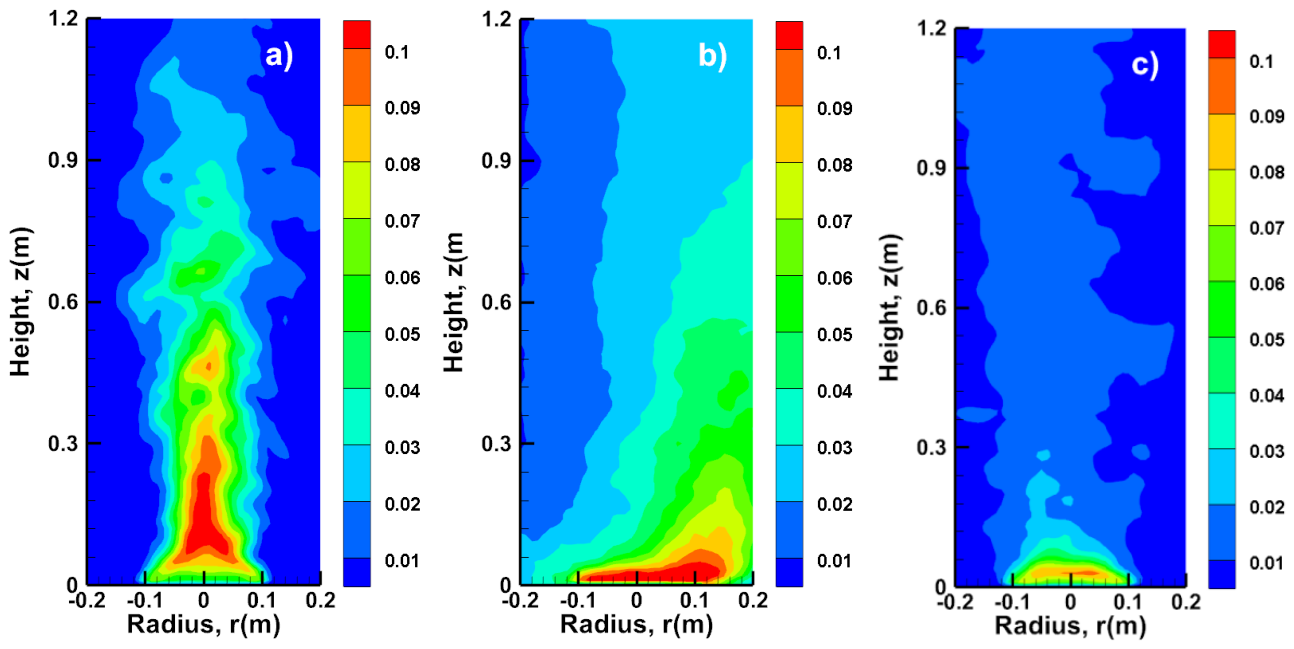
Figure 18.
Unburnt hydrocarbon (heptane) concentration (a) without spray; (b) with water mist for drag reduction model; (c) with water mist for Cd=0.08.
Figure 18.
Unburnt hydrocarbon (heptane) concentration (a) without spray; (b) with water mist for drag reduction model; (c) with water mist for Cd=0.08.
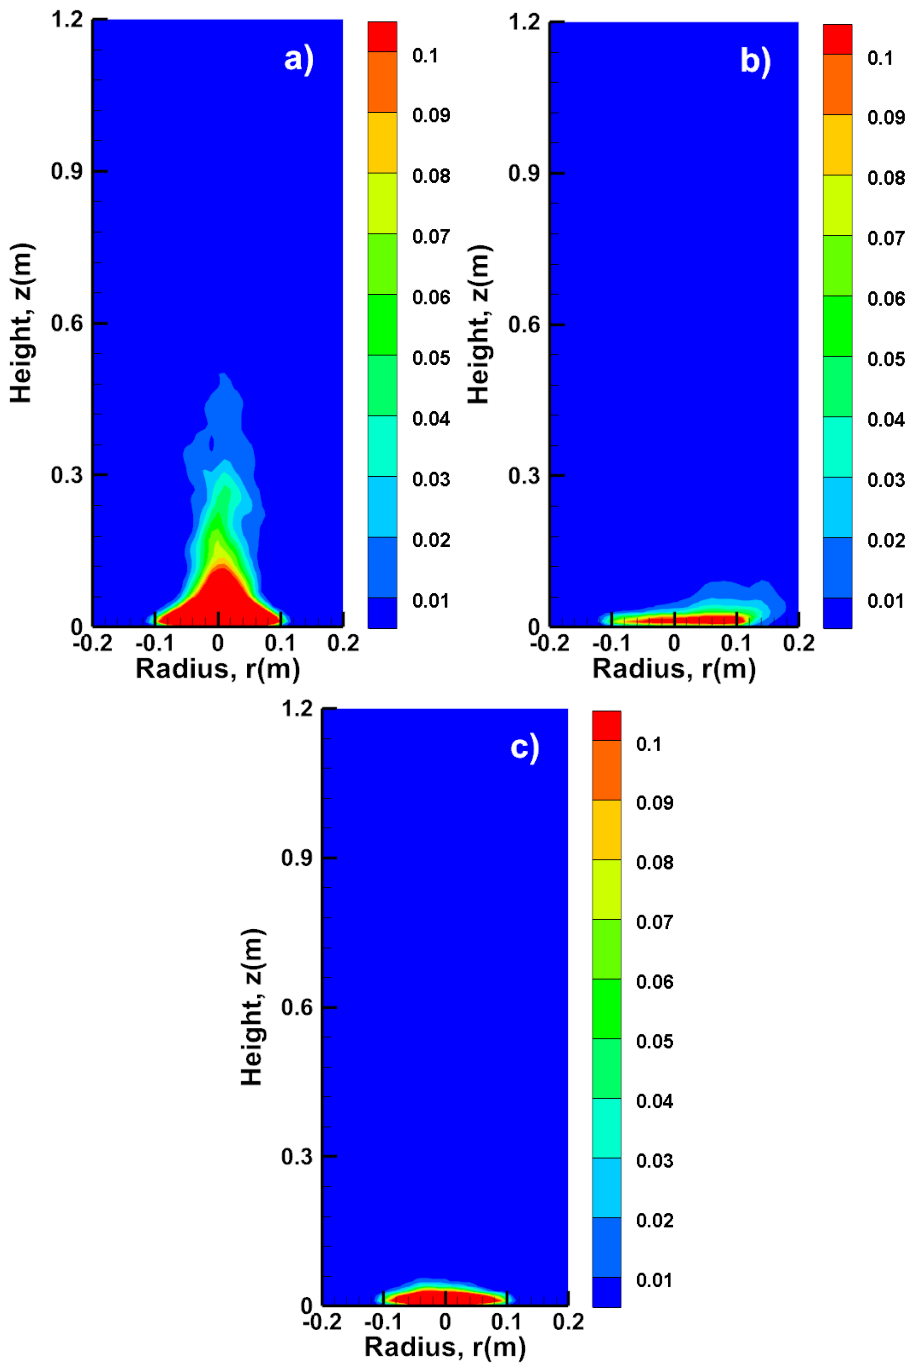
Figure 19.
Soot volume fraction (a) without spray; (b) with water mist for drag reduction model; (c) with water mist for Cd=0.08.
Figure 19.
Soot volume fraction (a) without spray; (b) with water mist for drag reduction model; (c) with water mist for Cd=0.08.
Disclaimer/Publisher’s Note: The statements, opinions and data contained in all publications are solely those of the individual author(s) and contributor(s) and not of MDPI and/or the editor(s). MDPI and/or the editor(s) disclaim responsibility for any injury to people or property resulting from any ideas, methods, instructions or products referred to in the content. |
© 2026 by the authors. Licensee MDPI, Basel, Switzerland. This article is an open access article distributed under the terms and conditions of the Creative Commons Attribution (CC BY) license (http://creativecommons.org/licenses/by/4.0/).
Copyright: This open access article is published under a Creative Commons CC BY 4.0 license, which permit the free download, distribution, and reuse, provided that the author and preprint are cited in any reuse.