

Submitted:
14 September 2026
Posted:
15 September 2026
You are already at the latest version
Abstract
This study is devoted to the experimental and analytical investigation of the mechanism underlying the formation of the ‘black crackle’ decorative effect on the surface of ceramic glaze, which arises as a result of the thermochemical transformation of a bio-derived organic precursor under reducing conditions. The aim of the study was to assess the influence of the thermal conversion products of the bio-precursor on the phase composition, microstructure, local distribution of elements and optical properties of the ceramic glaze, as well as to establish the mechanism underlying the formation of the decorative effect. The experimental programme covered various combinations of temperature, storage time and the amount of bioprecursor, using the Taguchi method. The resulting samples were analyzed using X-ray diffraction (XRD), Fourier-transform infrared spectroscopy (FTIR), scanning electron microscopy with energy-dispersive X-ray analysis (SEM–EDS), and spectrophotometric measurements using the CIELAB system. The results of X-ray diffraction analysis (XRD) showed that the decoration process did not lead to any significant change in the composition of the main crystalline phase of the glaze. FTIR spectroscopic analysis revealed chemical changes consistent with carbonization resulting from the thermal degradation of the bioprecursor. SEM-EDS observations showed that the carbonized products are distributed unevenly across the entire surface and are mainly localized in individual microzones of the craquelure network. Spectrophotometric results confirmed a reduction in brightness and an increase in the total color difference in the decorated samples. An integrated analysis of the results showed that the black crackle decorative effect is formed not through the formation of a new crystalline phase, but through the local accumulation of carbonized products in specific areas of the crackle network—products formed as a result of the thermochemical transformation of the bio-precursor under reducing conditions—and the optical contrast created thereby. The proposed approach opens up new scientific and technological prospects for the use of bio-waste as a functional precursor in the decoration of ceramic surfaces.
Keywords:
bio-derived precursor
; crackle-effect decoration
; ceramic glaze
; carbonization
1. Introduction
Ceramic materials play a significant role in both traditional and modern materials science and design, owing to their high thermal stability, chemical resistance, mechanical strength and extensive decorative potential. Glazes play a particular role in determining the functional and aesthetic characteristics of ceramic products. As well as protecting the ceramic surface from external influences, the glaze acts as a glass-like surface system that determines the optical, textural and decorative properties of the product [1]. One of the significant decorative phenomena observed in glaze coatings is craquelure, that is, the formation of a network of cracks. Craquelure is primarily associated with the relaxation of residual tensile stresses arising from differences in the thermal expansion of the glaze and the ceramic body. During the cooling stage, when the stresses accumulated in the glaze layer exceed a certain threshold, an interconnected system of microcracks forms on the surface. What was once considered a technical flaw has subsequently become a means of aesthetic expression in the art of ceramics and decorative surface design.
Recent research shows that the morphology of the crack network is determined not only by differences in the coefficients of thermal expansion. The density, width, depth and distribution of cracks across the surface are significantly influenced by the chemical composition of the glaze, the viscosity of the glass phase, the thickness of the coating, the firing and cooling conditions, as well as the microstructure and porosity of the ceramic body. In this respect, the ‘crackle’ phenomenon is not merely a decorative effect, but can be regarded as a complex phenomenon in the field of materials science, associated with residual stresses, crack formation and the development of the surface microstructure in multilayer ceramic systems.
Traditional crackle-effect decoration techniques involve filling the network of cracks with various coloring agents. Metal oxides, pigments, inks and carbon-based materials are used for this purpose. Typically, the coloring agent is applied to the surface, allowed to penetrate the cracks, and any excess is then removed. Although these methods are effective from a decorative point of view, they have certain limitations relating to uneven coloring, surface contamination, the need for additional processing steps, material consumption and the durability of the decorative effect [1].
In recent years, non-contact surface modification methods have attracted particular interest in the field of materials science. In particular, the interaction between the surface and gas-phase products, aerosol particles and carbonized residues formed as a result of thermal conversion is considered a promising avenue for the development of new functional and decorative coatings. The structure, porosity, functional groups and optical properties of carbonized products formed during the pyrolysis of biomaterials vary depending on the composition of the starting material and the thermal treatment conditions [2].
The thermal conversion of bio-precursors under conditions of limited oxygen access can result in the formation of a complex system comprising amorphous carbon, carbonized organic residues, volatile products and mineral components. Ca urbanization processes, particularly those occurring in the temperature range of 400–700 °C, are accompanied by the formation of dark-colored, optically active products that tend to deposit on surfaces [3].
The microgeometric structure of the crack network creates favorable conditions for the selective accumulation of such products. The crack system can act as a network of microchannels, facilitating the transport of thermal conversion products into the cracks and onto their walls. In turn, the complex micro-topography of the cracks may enhance the visual darkening of the surface through multiple internal reflections and light absorption. Consequently, the black decorative effect observed in the crack network can be regarded as the combined result of changes in the surface’s micro-optical properties involving carbonization products.
An analysis of the existing literature shows that, despite the existence of various technological approaches to the creation of ‘crackle’ finishes, the non-contact decoration process—based on the thermochemical conversion of a bioprecursor under reducing conditions—has not been sufficiently studied. In particular, data on a comprehensive investigation of this process in terms of phase composition, functional groups, surface microstructure, local elemental composition and optical properties are very limited.
This study aims to fill this research gap. The present work investigates the non-contact decoration of the craquelure pattern formed in stoneware products as a result of the thermochemical transformation of a bio-derived organic precursor under reducing conditions. The experimental part of the study was carried out based on a technological solution developed and patented by the authors [4]. The samples obtained were analyzed using X-ray diffraction (XRD), Fourier transform infrared spectroscopy (FTIR), scanning electron microscopy with energy-dispersive X-ray analysis (SEM–EDS) and spectrophotometric color measurements.
The main objective of the study is to determine the characteristics of the formation of the crackle decorative effect in a glaze coating as a result of the thermochemical transformation of a biogenic precursor, to evaluate the phase, microstructural and optical consequences of this process, and to substantiate a possible physico-chemical mechanism underlying the decorative effect.
The scientific novelty of this study lies in the first comprehensive justification of the non-contact formation of the decorative crackle effect in ceramic glaze using carbonized products formed as a result of the thermochemical transformation of a biogenic precursor under reducing conditions, based on phase, microstructural, local elemental and spectrophotometric results.
2. Materials and Methods
2.1. Methodological Framework of the Study
The aim of the study was to identify the mechanism underlying the formation of a decorative effect within a network of cracks and the microstructural consequences of this process arising from the thermochemical transformation of a bioprecursor under reducing conditions. To this end, an experimental program me comprising four consecutive stages was developed:
1. Preparation of the ceramic body and glaze system for the formation of a crack network;
2. Carrying out the decoration process under reducing conditions using a precursor of biological origin;
3. Analysis of the decorated and control samples in terms of phase composition, structure and local chemical composition;
4. Optical and comparative assessment of the decorative effect.
The methodological approach is based on the integration of ceramic technologies, surface engineering and instrumental methods of materials analysis. In this study, the decorative effect is considered not merely as a visual phenomenon, but as a process involving local microstructural and optical changes occurring on the surface of the glaze coating and within the crackle network.
The experimental part of the study is based on two main hypotheses. According to the first hypothesis, the carbonization products formed as a result of the thermal decomposition of the bio-precursor under reducing conditions may accumulate selectively within the crackle network, creating a decorative effect. The second hypothesis suggests that the observed dark decorative effect is linked not only to changes in chemical composition, but also to the microgeometry of the cracks, as well as to changes in the optical properties of the surface.
To test these hypotheses, a comparative study was carried out on samples with and without decoration; the phase composition was analyzed using X-ray diffraction (XRD), and the functional groups were analyzed using Fourier-transform infrared spectroscopy (FTIR), Surface morphology and local elemental composition were studied using SEM–EDS. To quantitatively assess the decorative effect on the selected samples, spectrophotometric measurements were carried out using CIELAB color coordinates and ΔE2000 values.
2.2. Materials Used
During the study, a high-temperature-fired ‘stoneware’ ceramic body was used as the main substrate. The composition of the ceramic body was selected to ensure that its thermal characteristics were compatible with the glaze coating, to achieve sufficient mechanical strength, and to create favourable conditions for the formation of a craquelure effect.
The composition of the ceramic slip (by mass, %) was as follows: plastic refractory clay – 26%; kaolin – 24%; feldspar – 45%; quartz sand – 3%; dolomite – 2%.
Feldspar, as the main component of the melt, facilitated the formation of a glassy phase; kaolin and clay improved plasticity and mouldability; quartz ensured dimensional stability and thermal stability; and dolomite served to regulate the melting characteristics.
A low-firing majolica-type glaze was primarily used to create the crackle pattern and for the decorative process. The composition of the glaze (by mass, %) was as follows: perlite – 32.3%; boric acid – 25.8%; dolomite – 6.5%; lithium carbonate – 1.5%; strontium carbonate – 7.5%; zinc oxide – 11.7%; calcium fluoride – 5.7%; kaolin – 9.0%.
This glaze system was selected due to its high capacity for forming a vitreous phase and its favorable thermal properties, which contribute to the formation of a craquelure effect. Initially, a low-lead glaze system was also tested for comparison; however, as it produced a safer, more uniform and more distinctive craquelure pattern, the subsequent main stages of the experiment were carried out using a majolica-type glaze.
A bio-based organic material was used to create the decorative material. Organic waste derived from poultry was selected as the feedstock. The choice of a bio-precursor derived from poultry is also justified by the fact that it forms a particle system with a high degree of dispersion, is more sensitive to heat treatment, and possesses a high capacity to interact with surfaces as a result of mechanical and biochemical processing within the digestive system.
Prior to use, the bio-precursor of avian origin was dried at 105 °C to constant weight, then mechanically ground, sieved to obtain a homogeneous fraction, and stored in airtight containers in dry conditions. This preparation stage was necessary to stabilize the moisture content of the starting material and ensure the reproducibility of the experimental results.
Analytical Equipment and Test Conditions
A Bruker D2 Phaser (Germany) X-ray diffractometer was used to determine the phase composition of the samples. Measurements were carried out using CuKα radiation (λ = 1.5406 Å) in the 2θ range from 5 to 75°, with a step size of 0.2° and a scanning speed of 1°/min.
FTIR analyses were carried out on a Bruker ALPHA II (Germany and the USA) instrument using the Platinum-ATR module. Spectra were recorded in the range 7500–350 cm−1 with a resolution of 2 cm−1.
The microstructural characteristics of the surface were studied using a JEOL JSM-6610LV (Japan) scanning electron microscope at an accelerating voltage of 20 kV. An EDS analyzer integrated into the SEM system was used to determine the local elemental composition. Prior to SEM analysis, the samples were coated with carbon to create a conductive layer; this factor was therefore taken into account separately when interpreting the EDS results.
Spectrophotometric measurements were carried out using an X-Rite MA-T6 (USA) instrument with a D65 light source and a 10° viewing angle.
2.3. Sample Preparation
The ceramic samples were produced in the laboratory in the form of test tiles of standard dimensions. The mixture of raw materials was homogenized with water until a plastic mass was obtained, molded into shapes and subjected to initial drying at room temperature. In the next stage, the samples were subjected to further drying to completely remove any residual moisture.
The dried samples were first subjected to bisque firing at a temperature of 950 °C. At this stage, the clay minerals were dehydrated, the organic components were burned off, and the initial ceramic matrix was formed. A glaze slurry was applied to the surface of the bisque samples, after which a final firing was carried out at a temperature of 1150 °C. At this stage, the glaze melted, a glassy phase was formed, and a strong bond between the glaze and the ceramic body was established.
2.4. Formation of a ‘Crackle’ Crack Network
To induce a ‘crackle’ crack network, glazed specimens were subjected to various cooling regimes following final firing. The aim was to assess the effect of the cooling regime on the density, uniformity and geometric characteristics of the crack network. To this end, natural cooling, accelerated cooling and thermal shock regimes were tested.
Initial observations showed that, in the majolica-type glaze system used, the accelerated cooling regime resulted in the formation of a more pronounced and uniform network of microcracks. For this reason, samples produced under the accelerated cooling regime—which ensures a more uniform and reproducible formation of the crack network—were selected for subsequent decoration experiments.
2.5. Experimental Design and the Decoration Process
2.5.1. Experimental Design and Sample Coding Based on the Taguchi Approach
To systematically assess the influence of the main technological parameters of the decoration process using a bioprecursor on the crackle finish effect, an experimental programme was developed based on the Taguchi approach [5]. In this approach, temperature, holding time at maximum temperature and the amount of bioprecursor were considered as the main factors influencing the process. In this study, the Taguchi approach was used not as a purely statistical optimization tool, but as an experimental design tool for the systematic selection and comparative testing of the main process parameters affecting the decorative effect.
During the initial stage of the experimental programme, tests were carried out using various combinations of temperature, time and precursor quantity, after which 10 samples were selected that reflected different levels of decorative effect. These samples were subsequently adopted as the main experimental basis for visual observations, spectrophotometric color measurements and comparative interpretation. The selected samples included: a control sample without decoration (P-CTR), a sample with an average intensity of decorative effect (P-MID), a sample with an optimal decorative effect (P-OPT) and other comparative test samples.
This article presents selected samples that reflect different levels of decorative effect intensity and are considered relevant for subsequent instrumental analysis; it does not provide a complete statistical analysis of all samples obtained in accordance with the Taguchi plan. The coding of the selected samples and their corresponding heat treatment parameters are given in Table 1.
As can be seen from Table 1, the selected samples cover a range of decorative effect intensities, which depend on temperature, storage time and the amount of bioprecursor. This approach has enabled a comparative assessment of the parameters influencing the formation of the decorative effect and a more systematic interpretation of the subsequent instrumental results.
2.5.2. The Decoration Process Using a Bio-Precursor
The decoration process was carried out based on the principle of thermal conversion of the bio-precursor under conditions of limited oxygen access. The aim of this approach was to ensure the pyrolysis and reductive conversion of the precursor, rather than free combustion, and to achieve interaction between the resulting volatile and carbonized products and a glossy surface with a mesh-like structure.
During the experiment, the pre-dried and homogenized bioprecursor was placed on a refractory ceramic substrate. A glazed sample with a mesh-like crack structure was placed on top of this layer of precursor in such a way that the products formed during the thermal transformation could be in direct or indirect contact with the surface of the sample to be decorated. The system was then sealed with a refractory ceramic coating, thereby creating a local microenvironment in which oxygen access was restricted. This environment provided the conditions for the carbonization of the biomaterial without combustion and the formation of products involved in the decoration process.
A general diagram of the experimental decoration process is shown in Figure 1.
The heat treatment experiments were carried out under various temperature-time conditions. Once the maximum temperature was reached, the samples were held at that temperature for a specified period, after which they were cooled. This approach made it possible to assess how the degree of bioprecursor conversion, the formation of carbonized products and the intensity of the decorative effect varied with temperature and holding time.
The amount of bioprecursor was also considered as a variable factor in the decoration process. The aim was to conduct a comparative study of the influence of the relative quantities of products formed during thermal conversion on the decorative effect resulting in the craquelure pattern. Thus, the samples obtained using various combinations of temperature, holding time and precursor quantity served as the primary material basis for the subsequent analytical investigation into the mechanism underlying the formation of the decorative effect.
2.5.3. Sampling for Comparative Experimental Studies and Analytical Studies
In order to assess the mechanism underlying the formation of the decorative effect more objectively, a comparative analysis was carried out not only of visually appealing samples, but also of samples exhibiting varying degrees of decorative effect. This approach made it possible to evaluate the decorative effect not only as ‘successful decoration’, but also as a process resulting from the interaction of temperature, time, the amount of bioprecursor and the surface microstructure.
Three main types of samples were selected for subsequent instrumental analysis of the results:
1. Sample with the optimal decorative effect (P-OPT) — a sample in which the black decorative effect is observed in the most striking and visually appealing form;
2. A sample of medium intensity (P-MID) — a sample in which the decorative effect is present but is less pronounced or less uniform compared with the optimal sample;
3. Undecorated control sample (P-CTR) — a sample with a network of cracks, which has not been treated with a bioprecursor and serves as a basis for the comparative assessment of the decorative effect.
The main aim of this approach was to compare the various stages involved in the formation of the decorative effect within a single analytical model. This approach made it possible, on the one hand, to trace more clearly the role of the bioprecursor in the decoration process and, on the other, to examine the relationship between the decorative effect and the phase composition, functional groups, surface morphology, local elemental composition and color characteristics.
At the same time, a more extensive sample set was retained for spectrophotometric colour measurements — namely, the 10 sets of samples listed in Table 1. This approach enabled a multi-level assessment of the decorative effect, both in terms of instrumental optical parameters and in terms of changes in the structural and phase composition.
2.6. Methods of Structural, Phase and Optical Analysis
In order to carry out an objective and comprehensive assessment of the results of the decoration process, the phase composition, microstructural characteristics, local distribution of elements and optical properties of the samples were investigated using instrumental analysis methods. The aim of developing the analytical programme was not only to confirm the presence of the decorative effect, but also to identify the structural, physicochemical and optical changes associated with its formation. For this purpose, X-ray diffraction analysis (XRD), Fourier-transform infrared spectroscopy (FTIR), scanning electron microscopy (SEM), energy-dispersive X-ray analysis (EDS) and spectrophotometric color measurements were used.
2.6.1. X-Ray Diffraction Analysis
X-ray diffraction analysis was used to determine the phase composition of the decorated and undecorated control samples [6]. The main aim of the X-ray diffraction analysis was to assess whether new crystalline phases had formed in the glaze system following the decoration process, and whether any significant changes had occurred in the glaze’s main mineral phase composition. This approach enabled us to determine whether the decorative effect is limited to superficial color changes or whether it is accompanied by more profound phase transformations.
A comparative analysis of the X-ray diffraction (XRD) results was carried out by comparing the diffractograms of the decorated sample with those of the control sample. During this comparison, particular attention was paid to the position of characteristic peaks, the intensity distribution and the appearance of new peaks. Thus, X-ray diffraction analysis was used to assess whether the decorative treatment had led to a fundamental change in the phase composition or whether this process was predominantly superficial and localized in nature.
2.6.2. FTIR Analysis
FTIR analysis was used to identify the functional groups of the products formed as a result of the thermal transformation of the bioprecursor, the characteristics of the decomposition of organic components, and any possible signs of carbonization [7]. This method made it possible to compare the state of the bioprecursor before and after thermal treatment, as well as to track the characteristics of the chemical transformations of the organic and mineral components involved in the decoration process.
The FTIR analysis focused primarily on absorption bands that could be attributed to carbonization and thermal decomposition, in particular on signals associated with C–H bonds, oxygen-containing functional groups and the main structural bonds of the silicate matrix. This approach made it possible to indirectly assess the stages of chemical transformations during which the bioprecursor contributes to the formation of the decorative effect. At the same time, the FTIR results served as an analytical basis for interpreting the data in conjunction with subsequent observations using SEM–EDS and spectrophotometry.
2.6.3. SEM Analysis
To determine whether the decorative effect was accompanied not only by a change in colour but also by changes in the surface micro-topography and the structure of the crack zones, an analysis was carried out using a scanning electron microscope (SEM). Particular attention was paid to the comparative study of dark deposits, local surface heterogeneity and possible structural differences within the craquelure lines and their boundary zones. In this regard, scanning electron microscopy (SEM) has become one of the main methods for verifying the visual characteristics of the decorative effect at the microstructural level.
2.6.4. EDS Analysis
In parallel with observations under a scanning electron microscope (SEM), the elemental composition in selected microzones was determined using energy-dispersive X-ray spectroscopy (EDS) [8]. EDS analyses were carried out on selected microzones in both decorated and undecorated samples; a comparative assessment of the elemental composition was carried out, in particular in the crack zone, in the surrounding background areas and on the control surface. This approach played an important role in determining whether the decorative effect is uniform across the entire surface or is localized.
The main objective of the EDS analysis was to determine the effect of the decoration process on the main oxide composition of the glaze, as well as to indirectly check for the presence of carbonisation products. To this end, local analysis points were selected in areas where the decorative effect was most pronounced, along crack lines and on the control surface. Analysis of the EDS results, combined with scanning electron microscopy (SEM) data, made it possible to assess whether the decorative effect was associated not only with optical but also with local chemical heterogeneity.
2.6.5. Spectrophotometric Analysis
An optical quantitative assessment of the decorative effect was carried out using an X-Rite MA-T6 instrument with a D65 light source and a 10° observer geometry. The results were calculated on the basis of the color coordinates of the samples, processed in the CIELAB color system, and the colour differences relative to the reference surface using the parameters ΔL*, Δa*, Δb*, ΔC*, ΔH* and the total colour difference ΔE2000 [9]. An uncoated control sample (P-CTR) was used as the reference for comparison.
The choice of a polygonal measurement geometry was dictated by the need to assess more accurately the non-uniform optical characteristics of the ‘crack’ decorative effect across the entire surface and the changes in its visual perception from different viewing angles.
3. Results and Discussion
3.1. Visual and Spectrophotometric Assessment of the Decorative Effect
Colour measurements were carried out on 10 samples selected in accordance with the Taguchi plan, with the aim of quantitatively assessing the optical results of the decoration process using a bio-based precursor. The measurements were carried out using an X-Rite MA-T6 multispectral colour measurement instrument, and the results were processed using the CIELAB colour system. An untreated control sample (P-CTR, sample 10) was taken as the reference for comparison, and the colour differences of all other samples were determined relative to the control surface using the indices ΔL*, Δa*, Δb*, ΔC*, ΔH* and ΔE2000 [9] (Table 2). The spectral reflectance curves of the selected reference samples are shown in Figure 2.
In the instrumental assessment of the decorative effect, the focus was on two parameters: the ΔL* value characterised the change in surface lightness, i.e. the degree of darkening or lightening compared with the control sample [10], whilst ΔE2000 was regarded as an integral measure of the overall colour difference. Since the contrast between the network of cracks and the darkening of the surface plays a decisive role in shaping the visual perception of the decorative effect, these two parameters were of particular importance in interpreting the results.
Spectrophotometric measurements showed that the decoration methods had a significant effect on the optical properties of the ceramic glaze. The ΔE2000 values for the selected samples ranged from 1.04 to 12.26, indicating that treatment with a bioprecursor can result in both minor and very pronounced differences in colour compared with the control sample. At the same time, the negative value of the ΔL* parameter in all samples with decorative finishes indicated that their surfaces were, on the whole, darker than that of the control sample. This trend is consistent with the formation of a dark decorative effect within the crack network.
A comparison of the results showed that the greatest overall colour deviation was observed in sample 5 (550 °C, 30 minutes, 9 g of bioprecursor); for this sample, values of ΔE2000 = 12.26 and ΔL* = −18.40 were recorded. This result indicates that, under these conditions, the surface not only became significantly darker but also underwent a substantial change in its overall colour characteristics compared with the control sample. However, visual observations showed that achieving maximum colour contrast does not always coincide with the aesthetic and morphological optimality of the decorative effect. In other words, the setting that provides the greatest contrast from a spectrophotometric point of view may not be the same as the setting that produces the most balanced and expressive craquelure pattern from a visual point of view.
In this regard, sample No. 3 — P-OPT (450 °C, 60 minutes, 9 g of biological precursor) — was of particular interest. For this sample, values of ΔE2000 = 10.08 and ΔL* = −15.36 were recorded. Although these values are slightly lower than those for sample 5, they nevertheless indicate a significant colour difference and a marked darkening. The main difference was that sample No. 3 exhibited clearer visual definition of the craquelure lines, a more balanced distribution of the black decorative phase and a more aesthetically pleasing overall decorative composition. Therefore, in this study, the P-OPT sample was deemed optimal in terms of decorative effect, not only on the basis of the maximum ΔE2000 value, but also on the basis of a comprehensive assessment of instrumental results and visual quality indicators [11].
For the second sample (450 °C, 15 minutes, 3 g of bioprecursor), which was classified as P-MID, the values ΔE2000 = 7.08 and ΔL* = −10.87 were recorded. These results indicate that a noticeable decorative effect has already formed, although it lags behind the P-OPT sample in terms of both colour difference and visual contrast. This result shows that processing time and the amount of bioprecursor play an important role in the formation of the decorative effect: within the same temperature range, a shorter processing time and a smaller amount of precursor led to a less pronounced formation of the dark decorative phase within the crack network.
The results of the analysis of other samples treated at temperatures ranging from 550 °C to 650 °C showed that the decorative effect does not vary linearly with temperature. For example, in sample 1 (550 °C, 15 minutes, 6 g), ΔE2000 = 5.65, whereas in sample 6 (550 °C, 60 minutes, 3 g), ΔE2000 = 3.40. This comparison shows that increasing the holding time at the same temperature does not necessarily lead to an enhancement of the decorative effect. A similar trend was observed in the 650 °C range: in sample 7 (650 °C, 15 minutes, 9 g), ΔE2000 = 6.94; in sample 8 (650 °C, 20 minutes, 6 g), ΔE2000 = 1.04; In sample 9 (650 °C, 10 minutes, 3 g), a value of ΔE2000 = 2.15 was recorded. The slight difference in colour, particularly in samples 8 and 9, indicates that high temperature alone does not enhance the decorative effect.
As the results show, the formation of the decorative effect is determined by the interaction of temperature, holding time and the amount of bioprecursor. The results of the spectrophotometric analysis, which show the greatest colour difference in sample 5, whilst sample 3 exhibits a more balanced correlation between visual-aesthetic and instrumental parameters, indicate that the optimal decoration regime should be selected not by maximising a single parameter, but on the basis of a multi-criteria assessment. For this reason, in subsequent analyses using XRD, FTIR and SEM-EDS methods, the P-OPT sample was used as the primary reference for the undecorated sample, and the P-MID sample as an intermediate reference for intensity comparison. An image of the decorative effect obtained on the cup is shown below (Figure 3).
A comparison of the spectral reflectance curves also confirmed these results (Figure 2). In most of the treated samples, a reduction in reflectance in the visible range was observed compared with the control sample, which is consistent with the darkening of the surface. The lower reflectance in samples with higher ΔE2000 values and more negative ΔL* values, particularly in those where ΔE2000 values are higher and ΔL* values are more negative, indicates that the dark products formed as a result of the thermal transformation of the bioprecursor have a significant effect on the optical properties of the surface.
Overall, the results of the spectrophotometric analysis showed that the decoration process using a bioprecursor alters the optical properties of the ceramic glaze to a quantitatively measurable extent. However, the ‘optimality’ of the decorative effect should be assessed not only by the maximum value of the total colour difference, but also taking into account criteria such as the visual distinctiveness of the craquelure pattern, the distribution of decorative contrast across the surface, and aesthetic integrity. For this reason, the P-OPT specimen, obtained following 60 minutes of heat treatment at 450 °C, was selected as the primary reference specimen for subsequent microstructural and mechanistic investigations.
3.2. X-ray Diffraction (XRD) Analysis: The Effect of the Decoration Process on the Phase Composition
To assess the effect of the decoration process on the phase composition of the glaze system, comparative analyses were carried out on the X-ray diffraction results of an optimally decorated sample (P-OPT) and an undecorated control sample (P-CTR) (Figure 4). The main aim of the analysis was to determine whether the decoration process, carried out using a precursor of biological origin, led to the formation of new crystalline phases in the glaze system, or whether the observed decorative effect was predominantly superficial and local in nature.
A comparison of the diffractograms of the decorated and control samples showed that the positions of the main peaks in both samples were broadly similar in character, and that the basic phase composition of the glaze system had not changed significantly following the decoration process. The preservation of the main peak positions indicates that the decoration process using a bio-derived precursor did not lead to the formation of new dominant crystalline phases in the glaze matrix. This result can be regarded as preliminary evidence that the decorative effect is associated to a greater extent with local changes in the optical and microstructural properties of the surface than with a volume-scale phase transformation.
Furthermore, the diffractogram of the coated sample may show relative changes in the intensity of certain peaks and minor differences in the nature of the amorphous background. However, these changes are insufficient to allow for a clear and independent identification of a new phase; they are largely the result of local surface inhomogeneity, which can be explained by slight fluctuations in the relative proportion of crystalline components present in the glaze layer, or by changes in signal intensity caused by the surface being coated with carbonisation products during the decoration process. In other words, the X-ray diffraction (XRD) results show that the decoration process does not lead to a radical change in the structure of the glaze’s main mineral framework.
This result is also consistent with the overall rationale of the study. If the decorative effect is primarily due to the localised accumulation of carbonisation products, formed as a result of the thermal conversion of the bioprecursor, within the crack network and on the crack walls, then it is to be expected that no new, highly crystalline phases will be detected by X-ray diffraction analysis. Some of these products may be amorphous or weakly crystalline; on the other hand, their quantity may not be sufficient to be identified as a separate phase, given the integral approach of X-ray diffraction analysis across the entire glaze surface. In this regard, the X-ray diffraction results support the hypothesis that the decorative effect is not due to a bulk phase transformation, but is associated with surface carbonisation, microstructural heterogeneity and local chemical changes.
Thus, X-ray diffraction analysis has shown that the decoration process using a bioprecursor does not lead to a fundamental change in the main phase composition of the ceramic glaze. The observed decorative effect appears to be associated not with the formation of a new bulk crystalline phase, but with local changes in the structural and optical properties of the surface. This result provides an important basis for the subsequent interpretation of the results of FTIR analysis and, in particular, SEM–EDS analysis, as it allows the source of the decorative effect to be attributed to a greater extent to the local distribution of carbonisation products and the microstructural features of the crack network, rather than to a phase transformation.
Overall, the proposed decoration technique preserves the glaze’s main mineralogical composition (Table 3), and the decorative effect is achieved not through the formation of new crystalline phases, but as a result of microstructural and optical changes occurring on the surface.
The values given represent calculated relative fractions derived from a comparative analysis of X-ray diffraction (XRD) results and should not be regarded as a complete quantitative phase analysis.
To investigate this hypothesis further, the next stage involved using FTIR spectroscopy to analyse the chemical composition of the products formed as a result of the thermal conversion of the bioprecursor.
3.3. FTIR Spectroscopic Analysis of the Thermal Transformation of a Precursor of Biological Origin
FTIR spectroscopic analysis was carried out to assess the chemical transformations and changes in functional groups occurring during the thermal treatment of the bioprecursor. For comparison, the spectra of samples treated at 450 °C, 550 °C and 650 °C were analysed alongside the spectrum of the untreated bioprecursor (0) (Figure 5). Possible interpretations of the main absorption bands are given in Table 4.
A comparative analysis of the FTIR spectra, taking into account the possible identifications of the peaks listed in Table 4, revealed sequential changes in the chemical structure of the bioprecursor during its thermal treatment. The most noticeable changes were observed in the 1500–500 cm−1 range. The intensity and shape of the peaks recorded at different temperatures indicate that the thermal decomposition process proceeds differently depending on the temperature.
A comparison of the FTIR spectra revealed that the main differences between the bioprecursor samples — both those that had not undergone heat treatment and those treated at various temperatures — are observed, in particular, in the 1500–500 cm−1 range. The intense absorption bands observed in the 1000–1100 cm−1 region can be attributed to silicate Si–O bonds present in the mineral components of the bioprecursor [12]. Changes in the intensity and shape of the peaks in this range, observed as the heat treatment temperature increases, can be explained by an increase in the relative proportion of mineral phases and structural reorganisation against a background of organic component decomposition. The bands observed in the 1400–1500 cm−1 range can be attributed to carbonate-type groups, oxygenated organic residues and carbonisation products formed during the thermal treatment process.
The bands observed in the 1400–1500 cm−1 range can be attributed to carbonate-type groups, oxygen-containing organic residues and carbonisation products. Changes in the intensity of these bands under different temperature conditions indicate that the thermal decomposition of the bioprecursor and the carbonisation process are temperature-dependent. The more pronounced nature of this peak in the spectra obtained at 450 °C and 550 °C can be explained by the formation, as a result of thermal decomposition, of carbonised and partially oxidized products which are not entirely volatile. However, the results of FTIR analysis indicate that these products are present not as specific crystalline phases, but as amorphous or weakly ordered chemical residues. FTIR analysis allows us to characterise not the ceramic glaze itself, but the process of thermal transformation of the bioprecursor. Therefore, the results obtained are regarded not as direct evidence of a decorative effect, but as an analytical basis explaining the formation of carbonised products involved in the decoration process. These results, taken together with SEM-EDS analysis data indicating localised carbon enrichment in the crack zones, support the hypothesis that the products formed as a result of the thermal decomposition of the bioprecursor contribute to the formation of the ‘craquelure’ decorative effect.
3.4. Results of Scanning Electron Microscopy and Energy-Dispersive X-Ray Analysis (SEM–EDS)
To assess the microstructural characteristics of the decoration process and the local chemical composition of the black decorative effect, decorated and undecorated samples were examined using SEM–EDS techniques. SEM observations made it possible to determine the surface morphology, the structure of the crack network and the local changes occurring in the crack zones, whilst EDA analysis enabled a comparison of the elemental composition in selected microzones.
Although images obtained using a scanning electron microscope (SEM) of the control sample without decorative finishing showed a typical network of cracks on the glaze surface, these cracks were essentially empty morphological lines in which neither dark precipitates nor microstructural features indicating the presence of an additional phase were observed (Figure 6a). The crack walls and the surface background were relatively homogeneous in terms of microstructure. This result suggests that the mere presence of a craquelure network is not sufficient to create a decorative effect.
By contrast, in the images obtained using a scanning electron microscope (SEM), locally darkened areas and microstructures resembling weights were visible on the treated sample along the crack lines and in some intersecting regions (Figure 6b). Interestingly, these structures were not distributed with equal intensity along all cracks, but were concentrated in specific microzones. This suggests that the decorative effect is formed not as a continuous surface coating, but in separate sections of the crack network.
The results of the energy-dispersive spectrometry (EDS) analysis carried out on selected microzones based on scanning electron microscopy (SEM) data are presented in Table 5. At both analysis points on the control sample, SiO2, Al2O3, Na2O, K2O, CaO and a small amount of MgO were identified, which are characteristic of a silicate glaze matrix; no carbon was detected. This result indicates that the cracks exist solely as structural elements and that no carbonisation products have accumulated within them.
However, in the decorated sample, the elemental composition varied considerably depending on the microzone. The detection of a high carbon content (28.76% by mass) at point S8, located within the crack, as well as a reduction in the relative proportion of silicate components, indicate the localisation of carbonisation products formed as a result of the thermal transformation of the bioprecursor in this area. At another analysis point on the same sample (S9), the carbon content was only 9.51% by mass, whilst the main components were once again oxides characteristic of a silicate matrix. This marked difference observed between points S8 and S9 indicates that the carbonisation products are not distributed uniformly across the surface, but accumulate selectively in specific fractured zones.
When analysed in conjunction with the results of scanning electron microscopy (SEM), the energy-dispersive X-ray spectroscopy (EDS) data indicate that, from both a morphological and chemical perspective, the decorative effect is caused by the same mechanism. Visually darker areas of the cracks are characterised by a high carbon content, whilst the remaining areas consist predominantly of the silicate matrix of the glaze. Thus, the black decorative effect is not due to the formation of a single, uniform coating, but to the localised accumulation of carbonisation products in specific areas of the crack network.
When interpreting EDS results, it is also necessary to take methodological limitations into account. As samples analysed by SEM are coated with carbon, part of the carbon signal recorded in the spectra may originate from the technical coating. However, the absence of carbon in the control sample and the detection of high carbon content only in specific microzones on the uncoated sample indicate that this signal cannot be explained solely by the presence of the coating. Thus, the high carbon content observed can be explained by local enrichment with carbonisation products formed as a result of the thermal transformation of the bioprecursor.
Overall, the SEM–EDS results are consistent with the thermal decomposition products identified during FTIR analysis, as well as with the optical changes recorded during spectrophotometric measurements. These results support the hypothesis that the decorative ‘black craquelure’ effect is formed not as a result of a change in the overall phase composition of the sap, but as a result of the carbonisation of the biological precursor under reducing conditions, which is localised in specific parts of the craquelure network.
3.5. General Description of the Mechanism Behind the ‘Crackle’ Decorative Effect
A comprehensive analysis of the results of the analytical studies carried out revealed that the decorative ‘black crackle’ effect achieved using the bioprecursor is the result of the interaction between thermal transformation processes, microstructural properties and optical changes, rather than the consequence of individual factors. Comprehensive analysis of X-ray diffraction (XRD) data, Fourier transform infrared spectroscopy (FTIR), scanning electron microscopy with energy-dispersive X-ray spectrometry (SEM–EDS) and spectrophotometric measurements shows that the decorative effect is not due to a change in the composition of the main phase of the ceramic gdazur, but rather by the localisation of carbonisation products, formed as a result of the thermal transformation of the bioprecursor, in specific regions of the crack network.
The initial stage of this mechanism is linked to the pre-existing network of cracks on the surface of the glaze. Observations of the control sample showed that these cracks serve a purely structural function, without creating any decorative effect. Therefore, although the network of fine cracks provides the necessary structural basis for creating the black decorative effect, it cannot, in itself, be regarded as a sufficient factor.
In the next stage, the bioprecursor undergoes thermal decomposition under reducing conditions, resulting in the formation of carbonised residual products. The results of FTIR spectroscopy reveal changes in the chemical structure of the bioprecursor during this process, whilst X-ray diffraction (XRD) analysis indicates that no new dominant crystalline phases are formed. This suggests that the decorative effect is mainly due to the presence of amorphous or weakly ordered carbonised products.
The carbonised products formed are distributed unevenly across the surface. Observations using a scanning electron microscope (SEM) revealed the presence of localised fillings along the crack lines, whilst analysis using energy-dispersive spectroscopy (EDS) showed a significant increase in the carbon content in these microzones. Sharp fluctuations in carbon content at different sampling points indicate that the carbonisation products are distributed unevenly across the surface and are selectively concentrated in certain areas of the crack network.
In this respect, craquelure cracks are not only a morphological feature, but also act as areas of localised accumulation of carbonisation products. The geometric structure of the cracks and the micro-relief of the surface help to trap charred particles in these areas, resulting in high optical contrast between the light-coloured glaze background and the charred products. Thus, the network of cracks serves both as a structural framework and a functional medium in creating a decorative effect.
Spectrometric analyses quantitatively confirm the optical results of this mechanism. The decrease in the ΔL* value and the increase in the ΔE2000 values in the samples subjected to decorative treatment indicate that the contrast created by the carbonisation products is also detected instrumentally. In particular, the high colour difference value observed in the P-OPT sample, selected as the optimal treatment, was consistent with the results of microstructural observations.
The results obtained also show that temperature and storage time play a decisive role in the formation of the decorative effect. An excessive increase in temperature or an optimally selected treatment time may lead either to the complete oxidation of the carbonised products or to their detachment from the surface without sufficient stabilisation within the crack network. On the contrary, the optimal thermal conditions produce a more pronounced decorative effect by aligning the carbonisation kinetics of the bioprecursor with the morphology of the cracks.
Thus, the formation of the ‘black craquelure’ decorative effect using a bioprecursor can be explained by the following sequence of processes: 1) the formation of a network of fine cracks (craquelure) on the surface of the glaze; 2) thermal decomposition of the bioprecursor under reducing conditions and the formation of carbonisation products; 3) local accumulation of these products in specific areas of the crackle network; 4) the formation of optical contrast along the crack lines; 5) the result is the creation of a ‘black crackle’ decorative effect.
The proposed mechanism provides an explanation for the results of X-ray diffraction (XRD), Fourier-transform infrared spectroscopy (FTIR), scanning electron microscopy with energy-dispersive spectroscopy (SEM–EDS) and spectrophotometric analysis within a single model. At the same time, this approach lays the scientific groundwork for the use of organic waste of biological origin as a functional precursor for decorating ceramic surfaces and provides a theoretical basis for future research in this field.
4. Discussion
The main aim of this study was to explain the mechanism behind the formation of the ‘black craquelure’ decorative effect on white glaze using an organic precursor of biological origin, not only from a visual and aesthetic perspective, but also on the basis of structural, chemical and optical parameters. The results obtained show that the observed decorative effect is not due to the formation of a new three-dimensional crystalline phase, but rather to an existing network of cracks on the glaze surface, which acts as a medium for the selective accumulation of carbonisation products formed as a result of the thermal transformation of the biological precursor.In other words, in this technology, the decorative effect is achieved not so much by ‘creating a new phase of the material’ as by the principle of ‘optically activating the existing crackle pattern’.
4.1. The Decorative Effect Is Due Not to a Phase Transition, but to a Local Modification of the Surface
X-ray diffraction (XRD) results showed that there were no fundamental differences between the coated and uncoated samples in terms of the main crystalline phases; quartz and albite phases predominated in both systems, with only minor changes observed in the semi-quantitative phase ratios. This result has important methodological implications. If the decorative effect were linked to the formation of a new crystalline black phase — for example, a carbide, phosphide or other reduction product — additional peaks would have appeared in the diffraction patterns, or there would have been more pronounced changes in the position and intensity of existing peaks. The absence of such changes suggests that the source of the decorative effect is to be found not in the ore’s three-dimensional mineral framework, but in its localised near-surface zones.
The literature on the decorative modification of ceramic glazes also shows that optical effects on the surface do not always correspond to a phase transition within the material. In particular, when using decorative techniques such as reduction, etching, patination with metal salts or carbon-based methods, the visual result is often produced by micrometre-scale surface deposits, semi-amorphous residues or localised accumulations within a network of cracks; this may not manifest as a distinct dominant phase when using integral methods such as X-ray diffraction (XRD). In this regard, the ‘negative result’ of the X-ray diffraction (XRD) analysis in this study — that is, the absence of a new crystalline phase — actually provides compelling scientific evidence explaining the nature of the decorative effect: the black crackle effect can occur without any change to the overall mineralogical structure of the glaze.
4.2. The Role of the Bioprecursor as a Carbon Source During Carbonisation
One of the main conclusions of the study is that the biologically derived precursor does not act as a passive impurity or an incidental colouring component in the decoration process, but rather as a functional precursor that contributes to the formation of the decorative effect through thermal transformation. The results of the analysis show that the role of the precursor is not limited to that of a carbon source. This approach is consistent with the findings of recent studies demonstrating the potential of biochar—produced by thermal conversion—as a functional material for various applications [3,13]. This is consistent with the general concept presented in the literature, according to which biochar can find new applications as a functional material as a result of its thermal transformation [3,14]. The products formed during its thermal decomposition serve as the basis for subsequent microstructural and optical changes [2,3].
Analysis using FTIR spectroscopy made it possible to characterise not the ceramic glaze itself, but the process of thermal transformation of the bioprecursor. The spectra obtained under various temperature conditions indicate sequential changes in the chemical structure of the bioprecursor, the decomposition of organic components during heat treatment, and the formation of carbonised residual products. These results indicate that, when exposed to high temperatures, the bio-precursor does not burn completely; instead, part of it is converted into more stable carbonisation products, which may participate in subsequent decarboxylation processes. This is consistent with existing data on the structural and chemical changes observed during the thermal conversion of biochar [3,15].
This approach is also consistent with the results of X-ray diffraction (XRD) and scanning electron microscopy with energy-dispersive spectroscopy (SEM–EDS). The absence of new dominant crystalline phases in the X-ray diffraction results indicates that the carbonisation products are predominantly amorphous or have a weakly ordered structure [3,16]. However, analysis using SEM–EDS shows that these products are not distributed uniformly across the entire surface, but are localised in specific microzones within the crack network. Thus, the products formed as a result of the thermal transformation of the biological precursor constitute the microstructural basis of the decorative effect.
The high degree of dispersion of the biological precursor may also play an important role in this process. The fine-grained distribution of organic and mineral components, resulting from the mechanical and biochemical processing of material of avian origin within the bird’s digestive system, can accelerate its thermal transformation and facilitate the penetration of the carbonised products formed as a result of this process into the microporous cavities of the crack network. Although this hypothesis is consistent with the available analytical results, further experimental studies are required to assess it quantitatively.
Thus, the bio-derived precursor used in this study can be regarded not only as a source of carbon, but also as a structural precursor which, upon thermal conversion, forms carbonised products that contribute to the formation of optical contrast within the crack network [17].
4.3. The Functional Role of the ‘Crackle’ Network as a Zone of Selective Accumulation
The results of analytical studies show that, in this technology, the network of cracks serves not merely as a decorative element, but as a functional component of the decoration process. In the traditional approach, cracks are primarily regarded as passive structural elements into which colouring agents are subsequently introduced. However, the results of this study show that, upon application of a bio-derived precursor, the network of cracks is transformed into micro-accumulation zones in which the products of thermal conversion accumulate selectively.
The detection of charred deposits exclusively in specific fracture zones during scanning electron microscopy (SEM), as well as significant variations in carbon content across different microzones, identified during analysis using energy-dispersive spectroscopy (EDS), indicate that this process does not proceed according to the principle of forming a homogeneous coating, but rather via a mechanism of selective localisation. Thus, the decorative effect is not due to the surface having blackened overall, but to the local optical contrast created by the accumulation of charring products in certain areas of the crack network.
From this perspective, ‘crackle’-type cracks are not merely a morphological feature, but can also be regarded as functional zones for micro-reactions and the accumulation of carbonisation products. The geometric structure, surface energy, microtopography and capillary properties of the cracks may contribute to the retention in these zones of particles formed during the thermal transformation process. Although the research carried out has not succeeded in fully elucidating all the physical aspects of this mechanism, the results of scanning electron microscopy with energy-dispersive spectroscopy (SEM–EDS) confirm the existence of such a functional model.
This approach differs to some extent from traditional crackle-finish techniques. With traditional methods, the crack pattern is subsequently highlighted visually using ink, pigments or metal salt solutions. However, in the proposed technology, the decorative component is not a pigment applied from the outside, but rather the carbonisation products formed as a result of the thermal conversion of a bio-derived precursor. Consequently, the decorative effect is not achieved by adding extra colourants, but results from the interaction between thermochemical transformations and the morphology of the cracks that form within the material itself.
This concept demonstrates the potential for using bio-based waste not only as an alternative source of carbon, but also as a functional precursor for the decorative finishing of ceramics with controlled microstructural properties. At the same time, this approach provides a theoretical basis for future research into the influence of crack geometry, crack density and microstructure characteristics on the formation of the decorative effect.
4.4. Consistency of the Spectrophotometric Measurement Results with the Proposed Mechanism
Spectrometric analysis made it possible to quantify the optical characteristics of the decorative effect. The changes observed in the ΔL* and ΔE2000 parameters indicate that the optical properties of the surface changed significantly as a result of the application of the bioprecursor. Thus, the decorative effect was confirmed not only by visual observation but also by instrumental measurements.
The main significance of these results lies in their consistency with microstructural observations. Whilst SEM-EDD analysis shows that the carbonisation products are localised in specific areas of the crack network, spectrophotometric measurements reflect the macroscopic optical consequences of this localisation. In other words, the carbon enrichment observed at the microstructural level is accompanied by a reduction in brightness and an increase in overall colour contrast on the surface.
In ‘crackle’ finishes, the visual effect is created not by an overall darkening of the surface, but by the local contrast between the light background and the charred lines of the cracks. For this reason, in some cases, a relatively small overall difference in colour cannot be regarded as detracting from the decorative effect. Whilst spectrophotometric measurements characterise the average optical properties of the entire surface, the decorative effect is determined primarily by the local contrast of the microscale network of cracks.
Thus, the results of the spectrophotometric measurements complement the optical component of the proposed deactivation mechanism and demonstrate that the selective localisation of carbonisation products formed as a result of the thermal conversion of a bio-derived precursor is evident not only at the microstructural level, but also in the form of measurable optical changes.
4.5. A Possible Explanation for the Optimal Processing Regime
A comprehensive evaluation of the results of spectrophotometric analysis, FTIR spectroscopy and SEM–EDS shows that the most pronounced decorative effect was achieved with a annealing regime of 60 minutes at 450 °C. The available analytical results allow us to hypothesise that this annealing regime provides a favourable balance between the thermal transformation of the biological precursor and the localisation of carbonisation products within the crack network.
At relatively low temperatures, the thermal decomposition of the bio-precursor may prove insufficient to produce the required quantity of carbonised products. Conversely, at higher temperatures or under conditions of prolonged treatment, the carbonised products are more likely to undergo partial oxidation, decomposition or transformation, which does not contribute to the formation of the decorative effect. The literature also shows that the physicochemical properties and structural stability of biochar depend to a large extent on the pyrolysis temperature [12,18,19,20]. In this regard, the decorative effect can be regarded as a kinetic process that depends not only on temperature, but also on the interaction between temperature and time.
The high optical contrast, microstructural heterogeneity and localised distribution of carbonisation products observed under optimal conditions are consistent with indirect analytical data, which indicate that, within this temperature range, the products of thermal transformation are retained more effectively within the crack network. Nevertheless, in future studies, it would be advisable to employ thermogravimetric analysis (TGA), differential scanning calorimetry (DSC) and an analysis of the gas-phase composition to determine the precise thermodynamic and kinetic mechanisms of this process.
Thus, the 450 °C–60-minute regime can be regarded not only as a process parameter that ensures the best decorative effect, but also as an experimental regime in which the most favourable balance is observed between the thermal transformation of the biological precursor, the local accumulation of carbonisation products, and the formation of optical contrast.
5. Conclusions
In this study, based on a comprehensive interpretation of the results obtained using complex analytical methods, the mechanism underlying the formation of the ‘black craquelure’ decorative effect on the surface of white-body ceramics using a bio-based precursor was investigated. Experimental studies have shown that the decorative effect is not due to a change in the composition of the main phase of the ceramic slurry, but rather to the localisation of carbonisation products—formed as a result of the thermal transformation of the biological precursor under reducing conditions—in specific areas of the crack network.
Cross-validation of analytical results using X-ray diffraction (XRD), Fourier transform infrared spectroscopy (FTIR), scanning electron microscopy with energy-dispersive spectroscopy (SEM–EDS) and spectrophotometry provided independent data that complement various aspects of the proposed mechanism. X-ray diffraction (XRD) results show that the modification process does not alter the main mineral phase composition of cellulose, FTIR spectroscopy analysis made it possible to characterise the formation of carbonised products during the thermal decomposition of the biological precursor; observations using SEM–EDS revealed their local distribution within the crack network; and spectrophotometric measurements quantified their optical effects. A comprehensive analysis of these results has made it possible to explain the decorative effect by means of a single mechanism.
The main scientific novelty of this study lies in the consideration of the bio-precursor not as a passive colouring component in ceramic decoration, but as a functional decorative precursor that forms carbonised products as a result of thermal transformation. Furthermore, it has been demonstrated that the ‘crackle’ pattern is not merely a decorative element, but also acts as an area where carbonisation products accumulate selectively; it has also been confirmed that the decorative effect is produced precisely as a result of this interaction.
The results obtained open up new prospects for the use of bio-based waste as a functional material in ceramic decoration techniques. The proposed approach is of practical interest for the development of biological decoration techniques in artistic, studio and architectural ceramics, and is also consistent with the principles of using environmentally sustainable materials.
Future research should involve a more detailed investigation of the mechanism of thermal conversion of the biological precursor using thermogravimetric and surface-sensitive analytical methods. Furthermore, assessing the distribution of carbonisation products on the surface using high-resolution mapping techniques may enable the proposed model to be further refined.
Author Contributions
The manuscript was written through contributions of all authors. All authors have given approval to the final version of the manuscript. CRediT: Yasin Khalilov conceptualization, data curation, methodology; writing — review and editing; Sevinj Akbarova writing — original draft, writing-review and editing, investigation, data curation: Vasif Shahmarov data curation, writing — review and editing; investigation, resources; Oruch Kerimli investigation.
Conflicts of Interest
The authors declare no conflict of interest.
References
- Carter, C.B.; Norton, M.G. Ceramic Materials: Science and Engineering, 2nd ed.; Springer, 2013. [Google Scholar] [CrossRef]
- İppolito, J.A.; Cui, L.; Kammann, C.; Wrage-Mönnig, N.; Estavillo Aurre, J.M.; Fuertes Mendizábal, T.; Cayuela, M.L.; Sigua, G.; Novak, J.; Spokas, K.; Borchard, N. Feedstock choice, pyrolysis temperature and type influence biochar characteristics: A comprehensive meta-data analysis review. Biochar 2020, 2(4), 421–438. [Google Scholar] [CrossRef]
- Tomczyk, A.; Sokołowska, Z.; Boguta, P. Biochar physicochemical properties: Pyrolysis temperature and feedstock kind effects. In Reviews in Environmental Science and Bio/Technology; 2020; Volume 19, pp. 191–215. [Google Scholar] [CrossRef]
- Khalilov, Y.H.; Akbarova, S.M.; Shahmarov, V.U. A method for producing a decorative ‘crackle’ finish on porcelain stoneware and ceramic products. Azerbaijan Patent, 2025. No. A 2025 0035.
- Taguchi, G. System of Experimental Design; UNIPUB, 1987. [Google Scholar]
- Cullity, B.D.; Stock, S.R. Elements of X-Ray Diffraction, 3rd ed.; Pearson, 2014. [Google Scholar]
- Stuart, B. Infrared Spectroscopy: Fundamentals and Applications; John Wiley & Sons, 2004. [Google Scholar]
- Goldstein, J.I.; Newbury, D.E.; Michael, J.R.; Ritchie, N.W.M.; Scott, J.H.J.; Joy, D.C. Scanning Electron Microscopy and X-Ray Microanalysis, 4th ed.; Springer, 2018. [Google Scholar]
- CIE. Colorimetry, CIE Publication No. 15, 3rd ed.; 2004. [Google Scholar]
- Melgosa, M. Testing CIELAB-based color-difference formulas. Color Res. Appl. 2000, 25(1), 49–55. [Google Scholar] [CrossRef]
- Westland, S.; Ripamonti, C.; Cheung, V. Computational Colour Science Using MATLAB, 2nd ed.; Wiley, 2012. [Google Scholar]
- Tiwari, M.; Dirbeba, M.J.; Lehmusto, J.; Yrjas, P.; Vinu, R. Analytical and applied pyrolysis of challenging biomass feedstocks: Effect of pyrolysis conditions on product yield and composition. J. Anal. Appl. Pyrolysis 2024, 177. 106355. [Google Scholar] [CrossRef]
- Wang, J.; Wang, S. Preparation, modification and environmental application of biochar: A review. J. Clean. Prod. 2019, 227. 1002–1022. [Google Scholar] [CrossRef]
- Kammann, C.; Ippolito, J.; Hagemann, N.; Borchard, N.; Cayuela, M.L.; Estavillo, J.M.; Fuertes-Mendizabal, T.; Jeffery, S.; Kern, J.; Novak, J.; Rasse, D.; Saarnio, S.; Schmidt, H.-P.; Spokas, K.; Wrage-Mönnig, N. Biochar as a tool to reduce the agricultural greenhouse-gas burden: Knowns, unknowns and future research needs. J. Environ. Eng. Landsc. Manag. 2018, 25(2), 114–139. [Google Scholar] [CrossRef]
- Weber, K.; Quicker, P. Properties of biochar. Fuel 2018, 217, 240–261. [Google Scholar] [CrossRef]
- Lehmann, J.; Joseph, S. (Eds.) Biochar for Environmental Management: Science, Technology and Implementation, 2nd ed.; Routledge, 2015. [Google Scholar]
- Sharma, G.; Wu, W.; Dalal, E.N. The CIEDE2000 color-difference formula: Implementation notes, supplementary test data, and mathematical observations. Color Res. Appl. 2005, 30(1), 21–30. [Google Scholar] [CrossRef]
- Leng, L.; Huang, H.; Li, H.; Li, J.; Zhou, W. Biochar stability assessment by incubation and modelling: Methods, drawbacks and recommendations. Sci. Total Environ. 2019, 664, 11–23. [Google Scholar] [CrossRef] [PubMed]
- Kingery, W.D.; Bowen, H.K.; Uhlmann, D.R. Introduction to Ceramics, 2nd ed.; John Wiley & Sons, 1976. [Google Scholar]
- Reed, J.S. Principles of Ceramics Processing, 2nd ed.; John Wiley & Sons, 1995. [Google Scholar]
Figure 1.
Flowchart of the decoration process using a bioprecursor.
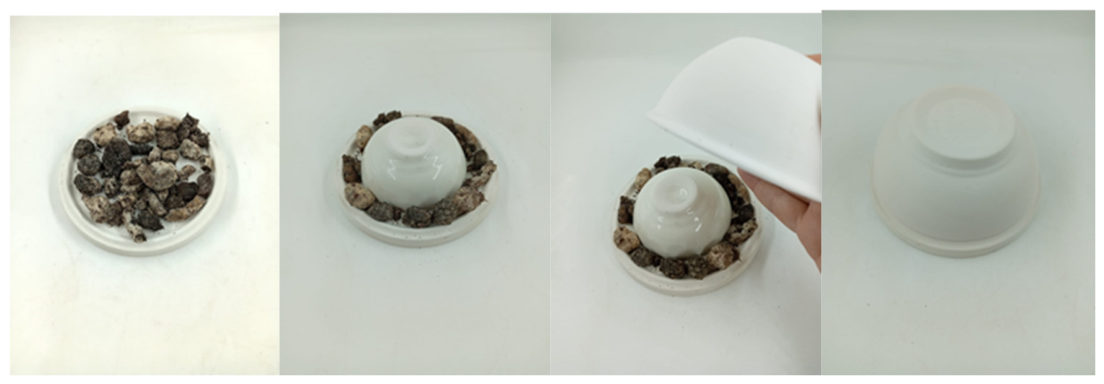
Figure 2.
Spectral reflectance curves for selected samples, measured using an X-Rite MA-T6 instrument.
Figure 2.
Spectral reflectance curves for selected samples, measured using an X-Rite MA-T6 instrument.
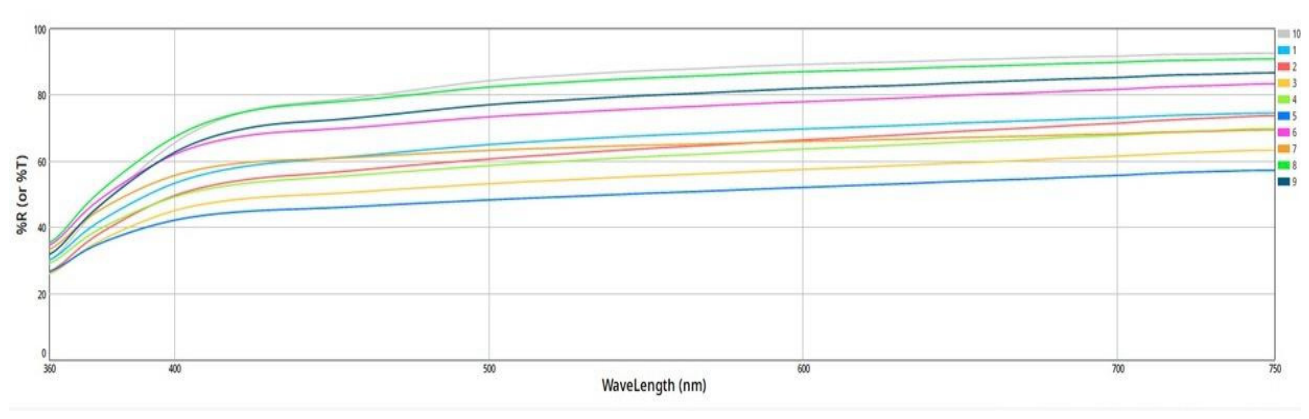
Figure 3.
Macroscopic view of a surface with a ‘craquelure’ effect, decorated with a bio-based precursor.
Figure 3.
Macroscopic view of a surface with a ‘craquelure’ effect, decorated with a bio-based precursor.
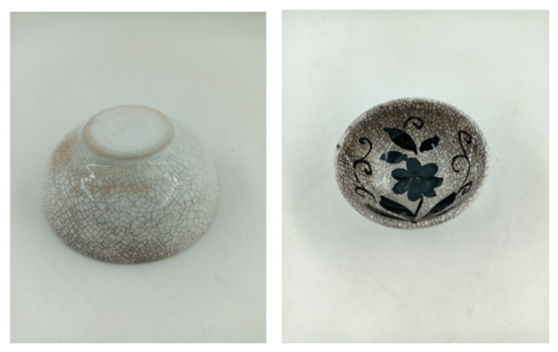
Figure 4.
Comparison of the XRD patterns of the undecorated control sample (a) and the decorated sample (b), and identification of the main phase peaks.
Figure 4.
Comparison of the XRD patterns of the undecorated control sample (a) and the decorated sample (b), and identification of the main phase peaks.
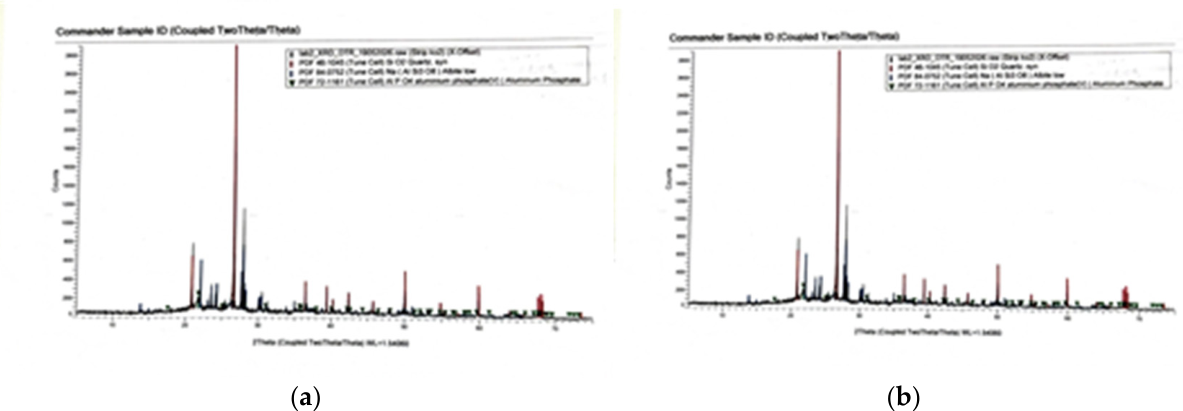
Figure 5.
FTIR spectra of the bioprecursor samples: freshly synthesised (0) and samples treated at 450 °C (60 min, 9 g), 550 °C (30 min, 9 g) and 650 °C (20 min, 6 g).
Figure 5.
FTIR spectra of the bioprecursor samples: freshly synthesised (0) and samples treated at 450 °C (60 min, 9 g), 550 °C (30 min, 9 g) and 650 °C (20 min, 6 g).
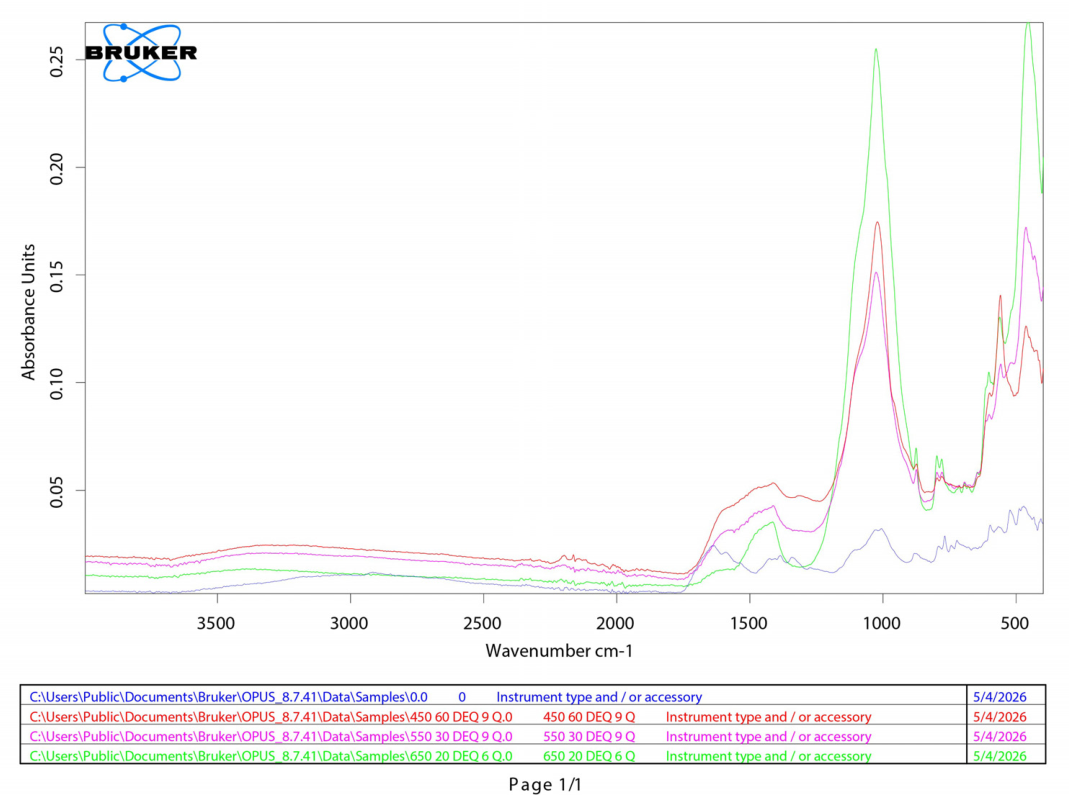
Figure 6.
Scanning electron microscope (SEM) images of an undecorated sample (a) and a decorated sample (b), together with the distribution of analysis points obtained by energy-dispersive spectroscopy (EDS).
Figure 6.
Scanning electron microscope (SEM) images of an undecorated sample (a) and a decorated sample (b), together with the distribution of analysis points obtained by energy-dispersive spectroscopy (EDS).
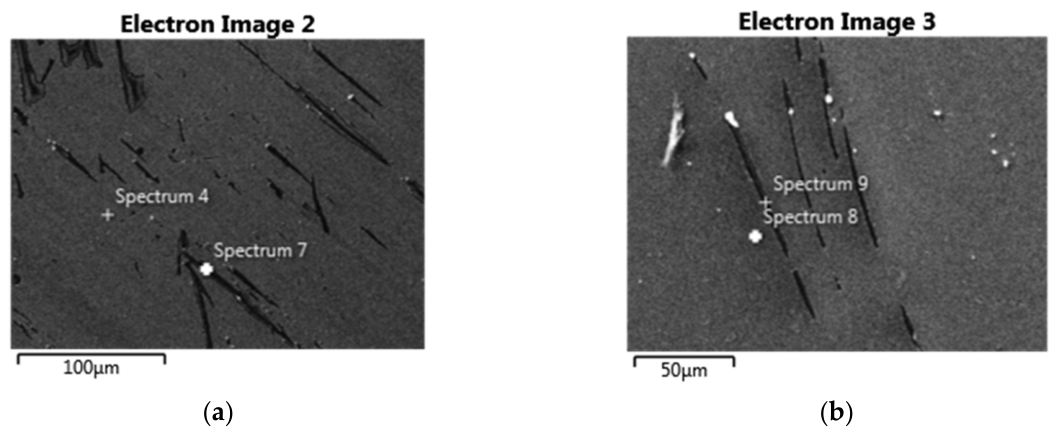

Table 1.
Codification of selected samples and heat treatment conditions based on the Taguchi design.
Table 1.
Codification of selected samples and heat treatment conditions based on the Taguchi design.
| Sample code | Provisional title | Temperature, °C |
Storage time, mins | Amount of bioprecursor, g | Note |
|---|---|---|---|---|---|
| 1 | Sample 1 | 550 | 15 | 6 | Sample for comparative testing |
| 2 | P-MID | 450 | 15 | 3 | A decorative effect of medium intensity |
| 3 | P-OPT | 450 | 60 | 9 | Optimal decorative effect |
| 4 | Sample 4 | 450 | 30 | 6 | Sample for comparative testing |
| 5 | Sample 5 | 550 | 30 | 9 | Sample for comparative testing |
| 6 | Sample 6 | 550 | 60 | 3 | Sample for comparative testing |
| 7 | Sample 7 | 650 | 15 | 9 | Sample for comparative testing |
| 8 | Sample 8 |
650 | 20 | 6 | Sample for comparative testing |
| 9 | Sample 9 | 650 | 10 | 3 | Sample for comparative testing |
| 10 | P-CTR | – | – | – | Undecorated control sample |
Table 2.
CIELAB colour difference values for selected samples in accordance with the Taguchi plan (relative to the control sample P-CTR).
Table 2.
CIELAB colour difference values for selected samples in accordance with the Taguchi plan (relative to the control sample P-CTR).
| Name of the reference sample | L* | a* | b* | C* | h* | |
|---|---|---|---|---|---|---|
| 10 | 94.66 | -0.24 | 6.21 | 6.21 | 92.20 | |
| Samples | DL* | Da* | Db* | DC* | Dh* | DE2000 |
| 1 | -8.91D | 0.64R | -0.49B | -0.48D | -0.64R | 5.65 |
| 2 | -10.87D | 1.23 R | 0.16Y | 0.23B | -1.22R | 7.08 |
| 3 | -15.36D | 1.13 R | -1.12B | -1.04D | -1.20 R | 10.08 |
| 4 | -12.13D | 1.14 R | -0.66B | -0.59D | -1.18 R | 7.89 |
| 5 | -18.40D | 1.22 R | -1.72B | -1.61D | -1.35 R | 12.26 |
| 6 | -4.92D | 0.77 R | -1.37B | -1.35D | -0.81 R | 3.40 |
| 7 | -10.33D | 0.47 R | -2.85B | -2.85D | -0.49 R | 6.94 |
| 8 | -0.88D | 0.34 R | -0.96B | -0.96D | -0.33 R | 1.04 |
| 9 | -3.18D | 0.52 R | -0.70B | -0.70D | -0.53 R | 2.15 |
Table 3.
Calculated relative proportions of the main phases, determined on the basis of the interpretation of XRD diffractograms.
Table 3.
Calculated relative proportions of the main phases, determined on the basis of the interpretation of XRD diffractograms.
| Sample | Quartz | Albite | AlPO4, % |
|---|---|---|---|
| Control | 40.5 | 58.4 | 1.1 |
| Decorated | 48.4 | 51.5 | 0.1 |
Table 4.
Possible interpretation of the main bands observed in FTIR spectra.
| Wavenumber, cm−1 | Possible significance | Comment |
|---|---|---|
| ~1000–1100 | Si–O–Si / Si–O–Al | Mineral (silicate) components of the bioprecursor |
| ~1400–1500 | carbonate / oxygenated organic residues | may be associated with the products of the thermal conversion of a biological precursor |
| ~500–800 | metal–oxygen/deformation vibrations | local structural changes |
Table 5.
Comparative composition (mass %) of the main elements and oxide components, determined in selected microzones based on SEM-EDS analysis.
Table 5.
Comparative composition (mass %) of the main elements and oxide components, determined in selected microzones based on SEM-EDS analysis.
| Sample | SiO2 | Al2O3 | Na2O | MgO | K2O | CaO | FeO | C |
|---|---|---|---|---|---|---|---|---|
| Without decoration (S4) |
72.34 | 16.38 | 4.37 | 0.59 | 1.56 | 4.75 | - | - |
| Without decoration (S7) |
72.81 | 15.73 | 4.09 | 0.73 | 1.76 | 4.88 | - | - |
| With decoration (S8) |
51.11 | 11.24 | 2.78 | 0.39 | 1.37 | 4.02 | 0.33 | 28.76 |
| With decoration (S9) |
65.10 | 14.19 | 3.66 | 0.62 | 2.06 | 5.11 | - | 9.51 |
Disclaimer/Publisher’s Note: The statements, opinions and data contained in all publications are solely those of the individual author(s) and contributor(s) and not of MDPI and/or the editor(s). MDPI and/or the editor(s) disclaim responsibility for any injury to people or property resulting from any ideas, methods, instructions or products referred to in the content. |
© 2026 by the authors. Licensee MDPI, Basel, Switzerland. This article is an open access article distributed under the terms and conditions of the Creative Commons Attribution (CC BY) license (http://creativecommons.org/licenses/by/4.0/).
Copyright: This open access article is published under a Creative Commons CC BY 4.0 license, which permit the free download, distribution, and reuse, provided that the author and preprint are cited in any reuse.