

Submitted:
03 November 2026
Posted:
05 November 2026
You are already at the latest version
Abstract
Granite-hosted uranium ores exhibit heterogeneous mineral assemblages and complex pore structures, which may restrict lixiviant accessibility and uranium dissolution during acid leaching. This study investigated a mixed nonionic surfactant system comprising OP-10 and Tween 80 for sulfuric acid leaching of a granite-hosted uranium ore containing 787.5 ppm U. Mineralogical characterization, surface-tension measurements, stirred-leaching and column-leaching experiments, and kinetic modeling were conducted to evaluate the leaching performance. The ore was dominated by quartz, feldspar, and other aluminosilicate minerals, with a heterogeneous pore network. OP-10 exhibited a greater surface-tension-reducing ability than Tween 80, and a 3:1 OP-10/Tween 80 volume ratio was selected. In stirred-leaching tests at 30 °C, a liquid-to-solid ratio of 5.0 mL·g⁻¹, and 20 g·L⁻¹ H₂SO₄, uranium recovery after 10 h increased from 72.4% in the H₂SO₄ system to 87.8% in the mixed-surfactant system. Separate kinetic experiments were conducted at 20 °C and a liquid-to-solid ratio of 2.5 mL·g⁻¹. After 31 d of column leaching, cumulative uranium recoveries were 74.0% and 92.6% for the H₂SO₄-only and mixed-surfactant columns, respectively. Nonlinear first-order fitting yielded apparent rate constants of 0.04176 and 0.06480 d⁻¹, respectively. These column results are descriptive observations because only one independent column was tested per condition. Kinetic model comparisons did not establish a unique rate-controlling mechanism, and the possible contributions of interfacial behavior and solution transport remain to be verified. This study provides experimental evidence for evaluating mixed nonionic surfactants in granite-hosted uranium leaching and offers a basis for further optimization of surfactant-assisted leaching conditions for complex hard-rock uranium ores.
Keywords:
uranium leaching
; granite-hosted uranium ore
; OP-10
; Tween 80
; nonionic surfactant
; interfacial properties
; leaching kinetics
; column leaching
1. Introduction
Granite-hosted uranium ores represent an important category of hard-rock uranium resources, characterized by complex mineral compositions and diverse uranium occurrence states. Uranium minerals commonly coexist with quartz, feldspar, and other silicate minerals [1,2,3]. Compared with mineralogical characteristics, the influence of heterogeneous pore structures within ores on leaching processes has attracted increasing attention in recent years. Pore size, pore-throat characteristics, degree of microfracture development, and particle size collectively affect the migration of leaching solutions into ore particles and the accessibility of uranium-bearing reaction zones to lixiviants [4,5,6]. During acid leaching, mineral dissolution may generate or enlarge certain mass-transfer channels, whereas migration of fine particles, mineral alteration, and secondary precipitation may locally narrow or block pore pathways, resulting in changes in pore structures and reactive transport conditions throughout the leaching process [4,6,7,8,9]. Therefore, sulfuric acid leaching of granite-hosted uranium ores involves not only interfacial dissolution reactions but also lixiviant transport, intraparticle diffusion, and mineral–solution interfacial reactions.
Previous kinetic studies have demonstrated that the apparent rate-controlling behavior in hard-rock uranium leaching is influenced by ore particle size, pore structure, acidity, and oxidation conditions, and may involve interfacial chemical reactions, diffusion through product layers, or a combination of these processes [1,2,10,11]. Zeng et al. reported that the controlling characteristics of hard-rock uranium ore sulfuric acid leaching vary at different stages of the process [2]. Qi et al. further indicated that particle size and particle-size fractal characteristics of granite-hosted uranium ores are closely related to uranium recovery [5]. These findings suggest that, as leaching progresses from the particle surface toward the interior, the accessibility of reactive regions may become an important factor affecting the apparent leaching kinetics. For ores containing multiscale pore systems and localized microfractures, increasing acid concentration or temperature may not necessarily eliminate internal transport limitations. Modification of liquid-solid interfacial conditions may provide an alternative means of improving lixiviant access to reactive regions within the ore. In this context, changes in wettability and pore accessibility are possible factors that may influence leaching performance, although their individual contributions require direct experimental verification.
Surfactants can modify liquid-solid interfacial properties and may consequently affect mass-transfer conditions during leaching. Their ability to reduce liquid surface tension is consistent with changes in the interfacial conditions of the leaching solution and may contribute to improved access of the lixiviant to fine pores, fractures, and interparticle spaces [12,13,14]. However, a reduction in surface tension alone does not directly demonstrate improved mineral wettability or enhanced pore-scale penetration. Direct measurements such as contact-angle analysis, surfactant-adsorption measurements, and pore-scale transport characterization are therefore required to establish these effects quantitatively. Previous uranium leaching studies have employed surfactants such as SDS, SDBS, CTAB, OP-10, and Tween 80 to modify interfacial and transport conditions in acidic leaching systems [15,16,17,18,19,20,21,22,23]. Among them, OP-10-based composite surfactants used in low-permeability sandstone-type uranium ores were reported to improve formation permeability and uranium recovery. Kinetic analyses further suggested changes in the apparent rate-controlling characteristics under surfactant-assisted conditions [18]. Recent studies have also reported improved ore permeability and changes in mass-transfer behavior under acidic leaching conditions when surfactants were used in stirred leaching, heap leaching, and simulated in situ leaching processes [15,16,17]. These findings suggest that the effects of surfactants may involve changes in interfacial conditions and mass-transfer processes; however, the specific contributions of wettability, pore accessibility, adsorption, and interfacial reaction kinetics may depend on the characteristics of the ore and the experimental conditions.
OP-10 and Tween 80 are both nonionic surfactants, but their molecular structures and interfacial properties differ, potentially resulting in different adsorption and wetting behaviors on mineral surfaces [12,13]. Recent studies on granite-hosted uranium ores have focused on improving sulfuric acid leaching through oxidation enhancement, particle-size optimization, and characterization of pore structure and reactive transport [4,5,11]. Meanwhile, investigations of nonionic surfactant adsorption and wettability modification on sandstone and quartz surfaces have provided further insights into surfactant–mineral interactions [24, 25]. Previous studies have also separately investigated the applications of OP-10 and Tween 80 in uranium leaching and mineral interfacial systems [13,15,18,20,23]. However, the application of mixed OP-10/Tween 80 systems to sulfuric acid leaching of granite-hosted uranium ores remains insufficiently investigated, particularly regarding the relationships among surfactant composition, interfacial properties, uranium recovery, and apparent leaching kinetics under stirred-leaching and column-leaching conditions. Furthermore, whether changes in apparent kinetic behavior reflect differences in the underlying rate-controlling processes remains uncertain for heterogeneous ores with multiscale pore structures.
Accordingly, this study investigates the application of an OP-10/Tween 80 mixed-surfactant system in sulfuric acid leaching of granite-hosted uranium ore. The specific objectives are to (i) characterize the mineralogical features and multiscale pore structure of the investigated ore; (ii) evaluate the effects of OP-10/Tween 80 composition and concentration on solution surface tension; (iii) investigate uranium recovery under sulfuric acid stirred-leaching and column-leaching conditions; and (iv) compare the apparent kinetic behavior of different leaching systems using first-order, pseudo-second-order, and shrinking core models. Particular attention is given to the relationships among surfactant composition, interfacial properties, and observed leaching behavior. It should be noted that contact-angle measurements, surfactant adsorption behavior, and pore-scale mass-transfer processes were not directly measured in this study. Therefore, improved wettability, increased pore accessibility, and reduced mass-transfer resistance are considered possible explanations for the observed leaching behavior rather than mechanisms directly demonstrated by the present experiments.
2. Materials and Methods
2.1. Ore Sample and Reagents
The uranium ore sample used in this study was collected from a granite-hosted uranium deposit in southern China. Given the pronounced heterogeneity of the ore, the collected bulk sample was crushed and thoroughly homogenized, followed by coning and quartering to obtain representative subsamples. The subsamples were subsequently sieved to obtain the particle-size fractions required for mineralogical characterization and leaching experiments. For the stirred-leaching experiments, the fraction passing through a 100-mesh sieve (approximately 150 μm) was used as the feed material. For the column-leaching experiments, the particle-size distribution of the ore was standardized to ensure comparable feed materials in the two columns and facilitate comparison of their leaching behavior.
Sulfuric acid was used as the primary leaching agent. OP-10 and Tween 80 were selected as representative nonionic surfactants for investigating the effects of surfactant composition on the interfacial properties and uranium leaching behavior. The grades and purities of the chemical reagents used in this study are summarized in Table 1. All reagents were procured through the centralized purchasing system of Shaoguan University. The purity and active matter content of Tween 80 were not specified on the original reagent label. The manufacturer further confirmed that the active ingredient content of its Tween 80 products was not determined. Accordingly, these parameters are reported as "Not specified" in Table 1.
2.2. Ore Characterization Methods
2.2.1. XRF Analysis
X-ray fluorescence (XRF) spectrometry was used to characterize the bulk chemical compositions of the granite uranium ore and leaching residues. The concentrations of major and minor elements were determined using a PANalytical Zetium wavelength-dispersive X-ray fluorescence spectrometer equipped with a Rh-target X-ray tube operated at 2.4 kW. Before measurement, all samples were prepared as pressed pellets. The elemental compositions were subsequently quantified using the Omnian standardless semi-quantitative program, and the results were presented in both oxide and elemental forms.
2.2.2. XRD Analysis
X-ray diffraction (XRD) was used to identify the mineral phases present in the ore sample. Measurements were performed using a Bruker D8 Advance diffractometer with Cu Kα radiation (λ = 1.5406 Å). The data were collected in continuous scanning mode within a 2θ range of 5–90°, with a scanning rate of 10° min-1 and a step size of 0.02°. The instrument was operated at 40 kV and 40 mA. The divergence slit (DS) and receiving slit (RS) were set to 0.1–0.6° and 1–3.3°, respectively. Measurements were carried out in symmetric reflection geometry without the use of a monochromator.
2.2.3. XPS Analysis
X-ray photoelectron spectroscopy (XPS) was employed to analyze the surface elemental composition and chemical states of the ore sample. Both the survey spectrum and the high-resolution spectra of key elements were used to characterize the surface properties relevant to surfactant interaction and acid leaching. XPS measurements were carried out on a Thermo Scientific ESCALAB Nexsa G2 instrument using monochromatic Al Kα radiation (hν = 1486.6 eV). The analysis was conducted with a spot size of 500 μm under a tube voltage of 15 kV and a current of 10 mA. The base pressure in the analysis chamber was maintained at 1 × 10⁻⁹ mbar to ensure high vacuum conditions. All binding energies were calibrated using the C 1s peak at 284.8 eV.
2.2.4. SEM Analysis
Scanning electron microscopy (SEM) was used to characterize the surface morphology and microstructural characteristics of the ore samples before and after leaching. SEM observations were performed using a Sigma 500 scanning electron microscope (Carl Zeiss, Germany) equipped with an XFlash 6130 energy-dispersive X-ray spectroscopy (EDS) detector (Bruker, Germany). Powder samples (<100 mesh) were uniformly mounted on conductive carbon tape, and loosely attached particles were removed using an air blower. The samples were subsequently sputter-coated with gold using a Q150R S sputter coater (Quorum Technologies, UK) prior to SEM observation. Representative regions were selected for morphological observation and EDS analysis.
2.2.5. BET Analysis
The specific surface area, pore volume, and pore size distribution of the samples were determined using nitrogen adsorption–desorption measurements at 77 K on an ASAP 2460 analyzer. Prior to analysis, all samples were degassed for 12 h. The specific surface area was calculated using the Brunauer–Emmett–Teller (BET) method, and the resulting pore structure parameters were used to characterize the properties of the ore.
2.2.6. MIP Analysis
For granite-hosted uranium ore with low permeability and multiscale pore systems, mercury intrusion porosimetry (MIP) was used to characterize macropores and pore-throat characteristics relevant to fluid transport, while N₂ adsorption analysis was used to characterize the mesopore structure and specific surface area. The combined use of these methods enables pore structures over a broader size range to be evaluated.
MIP measurements were performed using an AutoPore IV 9500 instrument (Micromeritics Instrument Corporation, Norcross, GA, USA) over a pressure range of 0.10–61,000 psia. Mercury was used as the intrusion medium with an assumed contact angle of 130°. The pore-size distribution, cumulative pore volume, and porosity were calculated from the mercury intrusion data.
2.2.7. FTIR Analysis
Fourier transform infrared (FTIR) spectroscopy was performed using a Thermo Fisher Scientific Nicolet 6700 spectrometer equipped with a DTGS detector and a potassium bromide beam splitter to identify the main surface functional groups and characteristic chemical bonds of the ore. Measurements were performed in the mid-infrared region with a spectral resolution of 4 cm⁻¹. To improve the signal-to-noise ratio, 32 scans were collected for both the sample and the background. The mirror velocity was set to 0.4747 cm·s⁻¹, and the aperture setting was 100.
2.3. Measurement of Surface Tension
Surface tension was measured using a DMPY-2C surface tensiometer (Nanda Wanhe Technology Co., Ltd., Nanjing, China). The surface tensions of single-component and mixed-surfactant solutions were all determined at 20 °C.
OP-10 and Tween 80 surfactant solutions with different concentrations were prepared using deionized water as the solvent. The stock solutions were diluted to obtain a series of surfactant concentrations of 5.0, 2.0, 1.0, 0.5, 0.2, 0.1, 0.05, 0.02, 0.01, 0.005, 0.004, 0.003, 0.002, and 0.001 g·L⁻¹. For the single-surfactant systems, 30 mL of each OP or Tween 80 solution was directly transferred into centrifuge tubes for surface tension measurements. The surface-tension data obtained under these conditions are denoted as OP-10 (original) and Tween 80 (original), respectively, in Figure 10.
To investigate the effects of dilution and acidic conditions on surfactant performance, 6 mL of each surfactant solution was mixed with 24 mL of either deionized (DI) water [denoted as OP-10 (DI-H₂O) and Tween 80 (DI-H₂O) in Figure 10] or a 25 g·L⁻¹ H₂SO₄ aqueous solution [denoted as OP-10 (H₂SO₄-aq.) and Tween 80 (H₂SO₄-aq.) in Figure 10], giving a final solution volume of 30 mL. Accordingly, the final surfactant concentration in these secondary-dilution systems was one-fifth of the corresponding initial concentration.
For mixed surfactant systems, OP-10 and Tween 80 solutions with identical initial concentrations (1.0, 0.5, 0.2, 0.1, 0.05, 0.04, 0.03, and 0.02 g·L⁻¹) were prepared separately and blended at different OP-10/Tween 80 volume ratios (4:1, 3:1, 2:1, 1:1, 1:2, 1:3, and 1:4). Single-component controls (OP-10/Tween 80 = 1:0 and 0:1) were also prepared. In each mixed system, a total of 6 mL of the surfactant mixture was added to 24 mL of 25 g·L⁻¹ H₂SO₄ solution, giving a final volume of 30 mL. Here, C0 denotes the initial concentration of each surfactant solution before mixing. After mixing and dilution to a final volume of 30 mL, the final concentration of total surfactant, Cf, was C0 /5. The final H₂SO₄ concentration in all solutions containing either a single surfactant or a mixed surfactant system was 20 g·L⁻¹.
2.4. Stirred-Leaching Experiments
The stirred leaching experiments were divided into two parts. The first part consisted of single-factor experiments to investigate the effects of sulfuric acid concentration, temperature, and leaching time on uranium recovery in three systems: (i) sulfuric acid leaching without the addition of surfactants (H₂SO₄ system); (ii) sulfuric acid leaching with the addition of OP-10 (OP-10 system); and (iii) sulfuric acid leaching with the addition of a mixed OP-10/Tween 80 surfactant (mixed surfactant system). The second part involved stirred leaching kinetics experiments to investigate the leaching kinetic characteristics of four systems, including the three systems used in the single-factor experiments and an additional system in which uranium ore was leached using H₂SO₄ and Tween 80 (Tween 80 system).
The ore samples used in the leaching experiments were homogeneous fractions obtained by sieving through a 100-mesh screen, with particle sizes below 100 mesh (approximately 150 μm). In the single-factor stirred leaching experiments, 10 g of ore sample was used for each experiment, with a liquid-to-solid ratio of 5.0 mL·g⁻¹ (50 mL of total leaching solution per 10 g of ore). In the stirred leaching kinetics experiments, 20 g of ore sample was used, with a liquid-to-solid ratio of 2.5 mL·g⁻¹ (50 mL of total leaching solution per 20 g of ore). The stirring speed was maintained at 250 rpm throughout all stirred leaching experiments. The concentrations of individual surfactants and mixed surfactants used in the stirred leaching experiments were selected based on the relatively favorable surface tension responses observed in the surface tension measurements described in Section 2.3. The concentrations and volumes of all reagents used are detailed in Section 3.3, Section 3.4 and Section 3.5 of this study.
After leaching, the slurry was subjected to solid–liquid separation, and the uranium concentration in the leachate was determined using inductively coupled plasma optical emission spectrometry (ICP-OES; Avio 220 Max, PerkinElmer). Quantitative analysis of uranium was performed using the external calibration method, with a calibration blank and uranium standard solutions at concentrations of 20, 40, 60, 80, 100, 120, 140, 160, and 180 mg·L⁻¹. The emission wavelength used for uranium determination was 385.958 nm. For the single-factor stirred leaching experiments, leachate samples with uranium concentrations within the calibration range were analyzed directly without dilution. The linear calibration equation was I = 1700.38C + 338.43, where I represents the emission intensity and C represents the uranium concentration (mg·L⁻¹), with a correlation coefficient of 0.999863.
For the stirred leaching kinetics experiments, the leachate samples were diluted tenfold to bring the uranium concentrations within the calibration range. The corresponding linear calibration equation was I = 1708.67C + 344.62, where I represents the emission intensity and C represents the uranium concentration (mg·L⁻¹), with a correlation coefficient of 0.999910. The uranium concentration in the original leachate was calculated by multiplying the measured concentration by the dilution factor of 10.
Each sample solution was analyzed in triplicate using ICP-OES, and the relative standard deviation (RSD) of the three replicate measurements was used to evaluate analytical precision. The RSD values ranged from 0.4% to 7.8%. The instrumental limit of detection (LOD) for uranium was calculated as three times the standard deviation of ten replicate measurements of the calibration blank (LOD = 3σblank, n = 10). The mean concentration of the calibration blank was 0.0360 mg·L⁻¹, with a standard deviation of 0.00126 mg·L⁻¹, resulting in an LOD of 0.00378 mg·L⁻¹.
The uranium recovery was calculated according to Equation (1):
where η is the uranium recovery (%), C is the uranium concentration in the leachate(mg·L⁻¹), V is the volume of the leachate(L), m is the initial mass of the ore sample(g), and ω is the initial uranium mass fraction in the ore, expressed as a dimensionless decimal. The factor of 1000 is used to convert the uranium mass in the ore from grams to milligrams, ensuring consistency in the mass units used in the calculation. Each experimental condition was independently performed in triplicate (n = 3), and the results are presented as the mean ± standard deviation (SD), with error bars representing the SD.
2.4.1. Effect of Sulfuric Acid Concentration
The effect of sulfuric acid concentration on uranium leaching was investigated at a constant temperature of 30 °C and a leaching time of 4 h. The final H₂SO₄ concentrations were maintained at identical levels across the three leaching systems, specifically 10, 15, 20, and 25 g·L⁻¹. When adjusting the sulfuric acid concentration, only the target final acid concentration was varied. Throughout these experiments, the ore mass, ore particle size, total leaching solution volume, liquid-to-solid ratio, stirring speed, and the composition and dosage of surfactant additives corresponding to each leaching system were kept constant. Therefore, sulfuric acid concentration was the sole experimental variable. Based on the surface tension measurements, the final concentration of the single surfactant OP-10 was maintained at the same level as that of the mixed surfactant formulation.
2.4.2. Effect of Temperature
The final H₂SO₄ concentration was determined based on the experimental results obtained in Section 2.4.1 and was maintained constant throughout the temperature experiments. The leaching time was fixed at 4 h, while the temperature was varied from 15 to 35 °C (15, 20, 25, 30, and 35 °C) to evaluate its effect on uranium recovery. In all temperature experiments, the ore mass, particle size, total leaching solution volume, liquid-to-solid ratio, stirring speed, and the composition and dosage of surfactant additives corresponding to each leaching system were kept constant. These parameters were controlled to ensure that temperature was the sole experimental variable, thereby allowing an accurate evaluation of its effect on uranium recovery under otherwise identical leaching conditions.
2.4.3. Effect of Leaching Time
The final H₂SO₄ concentration and temperature used in these experiments were selected based on the overall trends in uranium recovery observed in the stirred leaching experiments and other relevant experimental considerations. The leaching time was varied from 2 to 10 h, with experimental durations of 2, 4, 6, 8, and 10 h. Throughout these experiments, the final H₂SO₄ concentration, temperature, ore mass, particle size, total leaching solution volume, liquid-to-solid ratio, stirring speed, and the composition and dosage of surfactant additives corresponding to each leaching system were maintained constant. Therefore, leaching time was the sole experimental variable.
2.5. Column Leaching Experiments
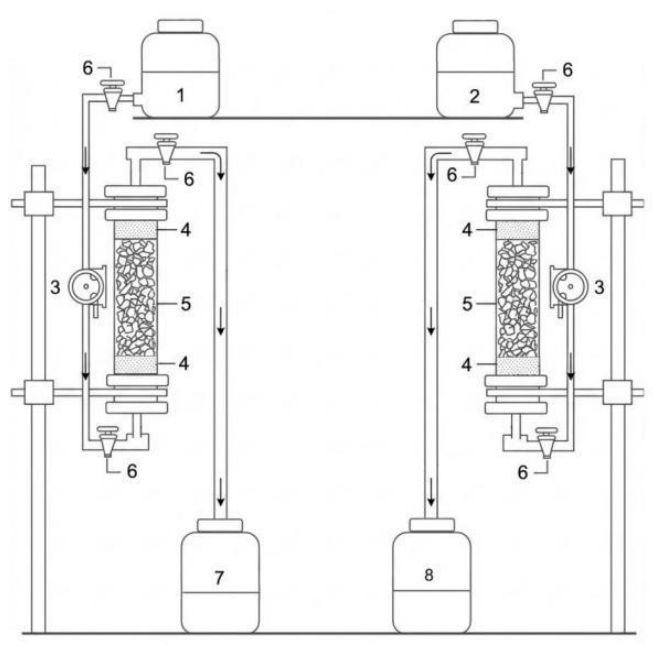
To evaluate the enhancement effect of the mixed surfactant system under percolation conditions, column leaching experiments were conducted (Figure 1). The column had an inner diameter of 8 cm and a height of 30 cm. The column feed consisted of 2.0 kg of crushed and size-classified ore. The ore was classified into different particle size fractions, including 1–3 mm (50 wt%), 0.25–1 mm (35 wt%), and <0.25 mm (15 wt%), and all fractions were thoroughly mixed before column packing. To improve the uniformity of solution distribution, quartz sand layers (0.5 kg for each layer, with different particle sizes) were placed at both ends of the ore bed as filtration layers. During packing, the ore sample was immersed in clean water and slightly compacted to obtain a relatively uniform packed structure. The height of the packed ore bed was approximately 20 cm, and the bulk porosity of the packed bed was determined by the water saturation method, with a value of approximately 41.3%. The value of 41.3% represents the packed-bed (interparticle) void fraction, which describes the fraction of the total packed-bed volume occupied by void spaces between ore particles. It is distinct from the intraparticle porosity measured by mercury intrusion porosimetry (MIP), which characterizes the pore structure within individual ore particles. These two parameters describe different structural features.
This column leaching experiment compared two leaching systems. Column 1 adopted a surfactant-assisted sulfuric acid leaching system (mixed surfactant system), while Column 2 used sulfuric acid solution without surfactant addition (H₂SO₄ system). In the mixed surfactant system, the injection volume ratio of the mixed surfactant solution to the sulfuric acid solution was set to 1:4, and the final sulfuric acid concentration matched that of the H₂SO₄ system. During the preparation of the mixed surfactant solution, the concentrations and volume ratio of OP-10 and Tween 80 were determined according to the surface tension measurement results described in Section 2.3. An individual column was used for each leaching condition; thus, the column-leaching results correspond to single-column experimental data (n = 1 per condition). No independent replicate columns were established. Accordingly, differences in uranium recovery and fitted kinetic parameters between the two columns were interpreted descriptively; treatment-level statistical comparisons were not performed.
The column leaching experiments were conducted at ambient temperature and atmospheric pressure. The leaching solution was introduced from the bottom of the column and flowed upward through the packed ore bed at a constant flow rate of 0.5 mL·min⁻¹. Leachate samples were collected daily and diluted tenfold to bring the uranium concentrations within the calibration range. The uranium concentrations in the leachate were determined using inductively coupled plasma optical emission spectrometry (ICP-OES). The linear calibration equation was I = 1692.78C − 184.21, where I represents the emission intensity and C represents the uranium concentration (mg·L⁻¹), with a correlation coefficient of 0.999863 and absolute residuals below 4%. The uranium concentration in the original leachate was calculated by multiplying the measured concentration by the dilution factor of 10. The uranium recovery calculation formula is given by Equation (13-15).
Figure 1.
Schematic diagram of the up-flow column leaching apparatus: (1) leaching-agent storage tank for H₂SO₄ solution containing OP-10/Tween 80 mixed surfactants; (2) leaching-agent storage tank for H₂SO₄ solution; (3) peristaltic pump; (4) quartz-sand layer; (5) uranium-ore bed; (6) flow-control valve; (7) leachate-collection bottle for the mixed-surfactant system; and (8) leachate-collection bottle for the H₂SO₄ system.
Figure 1.
Schematic diagram of the up-flow column leaching apparatus: (1) leaching-agent storage tank for H₂SO₄ solution containing OP-10/Tween 80 mixed surfactants; (2) leaching-agent storage tank for H₂SO₄ solution; (3) peristaltic pump; (4) quartz-sand layer; (5) uranium-ore bed; (6) flow-control valve; (7) leachate-collection bottle for the mixed-surfactant system; and (8) leachate-collection bottle for the H₂SO₄ system.
2.6. Kinetic Analysis
To characterize and compare the apparent kinetic behavior of different uranium leaching systems, experimental data from both stirred-leaching and column-leaching experiments were fitted using the shrinking core model (SCM), first-order kinetic model, and pseudo-second-order (PSO) kinetic model. Within the SCM framework, film diffusion, product-layer diffusion, and interfacial chemical reaction were considered as potential processes influencing the leaching rate.
The kinetic equations used in this study are presented in Equations (2) to (11).
For nonlinear fitting of the column-leaching data, Equation (2) was equivalently expressed as
x = 1 - exp(-k1t)
The linearized form was used for linear regression analysis, whereas the equivalent nonlinear form was used for direct nonlinear fitting of the cumulative uranium-recovery data.
Chemical-reaction-controlled SCM[28,29]:
where x represents the fractional uranium recovery at leaching time t, xe denotes the model-derived asymptotic fractional uranium recovery predicted by the pseudo-second-order (PSO) model, and t is the leaching time. The parameters k1, k2, and k represent the apparent rate constants of the corresponding kinetic models. These rate constants are model-dependent and should not be directly compared across different kinetic expressions.
1 - (1 - x)1/3 = kt
The kinetic models used in this study describe different aspects of the leaching process. The first-order and pseudo-second-order (PSO) models are empirical kinetic expressions used to characterize the overall time-dependent uranium recovery behavior and estimate apparent kinetic parameters; they do not independently identify the rate-controlling mechanism. In contrast, the shrinking core model (SCM) provides a simplified mechanistic framework for examining possible rate limitations associated with different transport and reaction processes. Specifically, the film-diffusion-controlled model describes mass transfer across the liquid boundary layer surrounding the ore particles, the product-layer-diffusion-controlled model considers diffusion through the reacted solid layer, and the chemical-reaction-controlled model describes the reaction at the interface between the unreacted core and the leaching solution. These models represent idealized limiting cases, and their applicability may be affected by the heterogeneous mineral composition and complex pore structure of the ore. Therefore, the models were used to compare possible kinetic behaviors rather than to assume a single controlling mechanism in advance.
For the linearized kinetic expressions, the regression procedures were determined based on the mathematical formulation of each model. For the linearized first-order model and all three linearized shrinking core model (SCM) expressions, the intercept was fixed at zero, and the regression lines were constrained to pass through the origin, consistent with the corresponding theoretical equations. Specifically, the film-diffusion-controlled SCM is expressed as (x=kt), which passes through the origin by definition. The same zero-intercept constraint was applied to the linearized product-layer-diffusion-controlled and chemical-reaction-controlled SCM expressions, as well as the first-order kinetic model. In contrast, the intercept of the linearized pseudo-second-order (PSO) model was allowed to vary freely because it represents a model parameter rather than a zero constant (Equation (8)). Therefore, the regression constraints were selected to remain consistent with the mathematical formulation of each kinetic model.
For the linearized PSO model, the intercept (a) and slope (b) were obtained by linear regression and used to estimate xe and k2, according to the following relationships:
Thus, xe and k2 were calculated as:
The uncertainty of the estimated k2 was quantified using its standard error (SE) and 95% confidence interval (95% CI). Model performance was evaluated using the coefficient of determination (R2), adjusted coefficient of determination (adjusted R2), root mean square error (RMSE), and residual sum of squares (RSS).
Given the complex mineralogical composition and heterogeneous pore structure of the ore, the kinetic models were used as analytical tools to evaluate the possible contributions of interfacial reactions and diffusion processes to the observed leaching behavior. All kinetic fitting, parameter estimation, statistical evaluation, and graphical processing were performed using Origin software.
For the first-order kinetic model applied to column leaching, both linearized and nonlinear fitting approaches were employed for comparison. Nonlinear fitting was performed directly using the measured fractional uranium recovery data, whereas linear regression was conducted using the logarithmic transformation of the first-order kinetic equation. The nonlinear fitting results were used as the primary estimates of the apparent rate constants, while the linearized results were retained for comparison to evaluate the sensitivity of the fitted parameters to the regression approach.
2.7. Determination of Uranium Content in Raw Ore
Because uranium was not detected by X-ray fluorescence (XRF) analysis under the measurement conditions used in this study, the uranium content of the raw ore was determined using a ferrous sulfate reduction–ammonium vanadate oxidation titration method. The ore samples were thoroughly homogenized prior to analysis. The uranium content of the ore was determined by redox titration.
For each determination, 1.0000 g of sample was accurately weighed into a 100 mL beaker, followed by the sequential addition of 10 mL of hydrochloric acid, 3 mL of hydrogen peroxide, and 1 mL of hydrofluoric acid. The beaker was covered with a watch glass and allowed to stand for 3 min. After the vigorous reaction had subsided, the solution was heated and evaporated to approximately 2 mL. The watch glass was washed three times with hot hydrochloric acid, and the solution was quantitatively filtered into a 150 mL conical flask. The beaker and filter paper were washed at least three times with hot hydrochloric acid to obtain a final filtrate volume of approximately 20 mL. Subsequently, 12 mL of phosphoric acid and 2 mL of ferrous sulfate solution were added. After mixing and standing for 2 min, the solution was cooled to 20–30 °C. Sodium nitrite solution was added dropwise with continuous agitation until the brown coloration disappeared, followed by the addition of 5 mL of urea solution. The solution was agitated until gas evolution ceased and then allowed to stand for 5 min. Three drops of sodium diphenylamine sulfonate indicator were added, and the solution was titrated with standardized ammonium vanadate solution until a faint purplish-red color persisted for 30 s. The uranium content was calculated from the titer and consumption volume of the ammonium vanadate solution and the sample mass. All ore samples were independently analyzed in triplicate (n = 3), and the results are reported as mean ± standard deviation (SD). The ammonium vanadate standard solution had a uranium titer of T = 0.04995 mg U·mL−1, and the uranium content was calculated according to Equation (12). The uranium content of the ore sample was 787.50 ± 2.24 ppm (n = 3), with a relative standard deviation (RSD) of 0.28%.
where T is the uranium titer of the ammonium vanadate standard solution (mg U·mL−1), V is the volume of ammonium vanadate standard solution consumed during titration (mL), and W is the mass of the sample (g).
3. Results and Discussion
3.1. Analysis of Mineral and Leaching Residue Properties
3.1.1. XRF Analysis Results
XRF analysis of the raw ore showed that the sample was predominantly composed of SiO₂ (62.24 wt.%) and Al₂O₃ (22.93 wt.%), accounting for approximately 85.17 wt.% of the total composition. Minor components included CaO (3.63 wt.%), K₂O (3.46 wt.%), Na₂O (3.28 wt.%), Fe₂O₃ (1.46 wt.%), and MgO (1.39 wt.%), whereas P₂O₅, SO₃, Cl, and MnO were present at relatively low levels. These results indicate that the sample has a matrix rich in silica and alumina, likely dominated by silicate and aluminosilicate minerals. However, the specific mineral phases require confirmation through XRD analysis. The relatively low CaO content (3.63 wt.%) suggests a limited abundance of Ca-bearing gangue minerals. These compositional characteristics are compatible with the use of sulfuric acid as the leaching agent in the present study.

Table 2.
Major oxide composition of the sample determined by XRF (wt.%).
| Component | Content (wt.%) | Component | Content (wt.%) |
|---|---|---|---|
| SiO₂ | 62.24 | MgO | 1.39 |
| Al₂O₃ | 22.93 | SO₃ | 0.90 |
| CaO | 3.63 | Cl | 0.40 |
| K₂O | 3.46 | P₂O₅ | 0.16 |
| Na₂O | 3.28 | MnO | 0.15 |
| Fe₂O₃ | 1.46 |
3.1.2. XRD Analysis Results
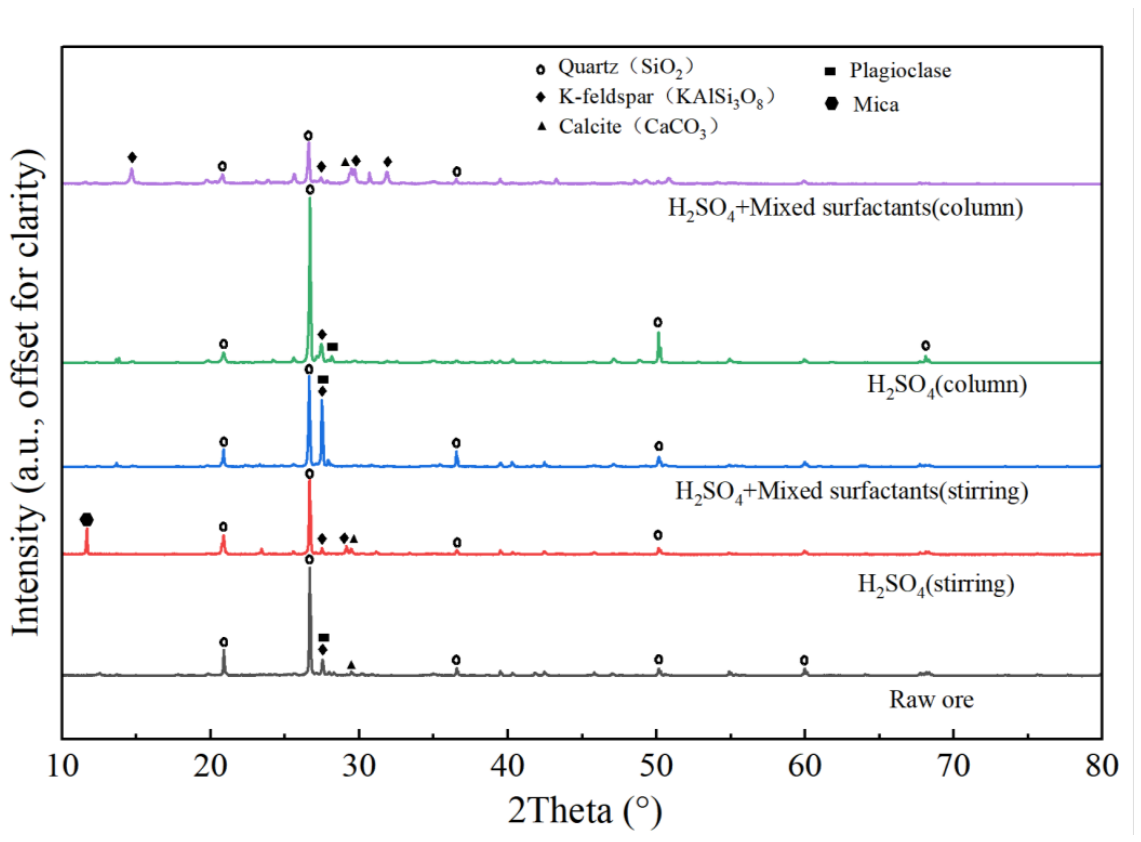
XRD was employed to investigate the mineral-phase evolution of the raw ore and its residues under different leaching conditions, with results shown in Figure 2. The raw ore exhibited typical granite mineral diffraction patterns, primarily comprising quartz (Qtz), potassium feldspar, plagioclase, mica-like minerals, and trace amounts of calcite. Quartz exhibited its strongest diffraction peak at approximately 26.6°, along with characteristic peaks at 20.8°, 36.5°, and 50.1°, confirming quartz as a major crystalline phase in the granite-hosted uranium ore. Diffraction peaks in the ranges of 27.4–27.5° and 27.9–28.1° correspond to potassium feldspar and plagioclase, respectively, while a weak peak at approximately 29.4° is attributed to calcite (CaCO₃). No distinct crystalline uranium-bearing phase was identified by XRD, which is consistent with the low uranium concentration and a dispersed occurrence of uranium-bearing phases below the detection limit of XRD.
Under stirred-leaching conditions, the intensity of the calcite peak at approximately 29.4° decreased markedly after sulfuric acid leaching, consistent with the dissolution of acid-sensitive carbonate minerals. The weakening of this reflection can be explained by the reaction of calcite with acid (CaCO₃ + 2H⁺ → Ca²⁺ + CO₂↑ + H₂O), which consumes acid and contributes to the dissolution of carbonate gangue minerals. However, the XRD data alone do not allow the extent of carbonate dissolution to be quantified. Meanwhile, changes in the relative intensities of feldspar-related diffraction peaks (27.4–28.1°) suggest possible alterations in the relative abundance and structural state of aluminosilicate phases under acidic conditions [32]. Compared with conventional sulfuric acid leaching, more pronounced changes in the feldspar-related diffraction peaks, particularly in the 27–29° range, were observed after mixed-surfactant-assisted leaching. These variations may reflect differences in the relative abundance and structural state of feldspar-related phases and may be associated with differences in mineral–solution interactions in the presence of the mixed surfactants.
Under column-leaching conditions, the quartz peak at approximately 26.6° in the H₂SO₄ leaching residue showed a marked increase in relative intensity, which may primarily reflect the relative enrichment of quartz following the preferential dissolution of more acid-reactive mineral phases, such as feldspar and carbonates, rather than the formation of new quartz-bearing phases. In contrast, after column leaching assisted by the mixed-surfactant system, the relative intensity of the quartz peak decreased, while changes in diffraction peaks associated with silicate minerals became more pronounced. These observations suggest more pronounced changes in the diffraction patterns of mineral phases in the mixed-surfactant system and may reflect differences in mineral–solution interactions during leaching. Overall, the XRD results suggest that mixed-surfactant-assisted leaching was associated with more pronounced mineralogical changes. However, these observations alone are insufficient to establish the underlying interfacial mechanisms or pore-scale transport behavior.
Figure 2.
X-ray diffraction patterns of the raw ore and leaching residues obtained under different leaching conditions. For clarity, the diffraction intensities of the raw ore, the residue from sulfuric acid stirred leaching, and the residue from mixed-surfactant-assisted column leaching were multiplied by a factor of 5. The identified mineral phases include quartz (SiO₂), K-feldspar (KAlSi₃O₈), plagioclase (NaAlSi₃O₈–CaAl₂Si₂O₈), mica, and minor calcite (CaCO₃).
Figure 2.
X-ray diffraction patterns of the raw ore and leaching residues obtained under different leaching conditions. For clarity, the diffraction intensities of the raw ore, the residue from sulfuric acid stirred leaching, and the residue from mixed-surfactant-assisted column leaching were multiplied by a factor of 5. The identified mineral phases include quartz (SiO₂), K-feldspar (KAlSi₃O₈), plagioclase (NaAlSi₃O₈–CaAl₂Si₂O₈), mica, and minor calcite (CaCO₃).
3.1.3. XPS Analysis Results
XPS analysis was performed on the raw ore and the leaching residues obtained from the H₂SO₄ and mixed-surfactant systems in the stirred-leaching experiments. These two leaching conditions were selected for XPS characterization to compare the surface chemical characteristics of the ore before and after leaching in the absence and presence of the mixed surfactants.
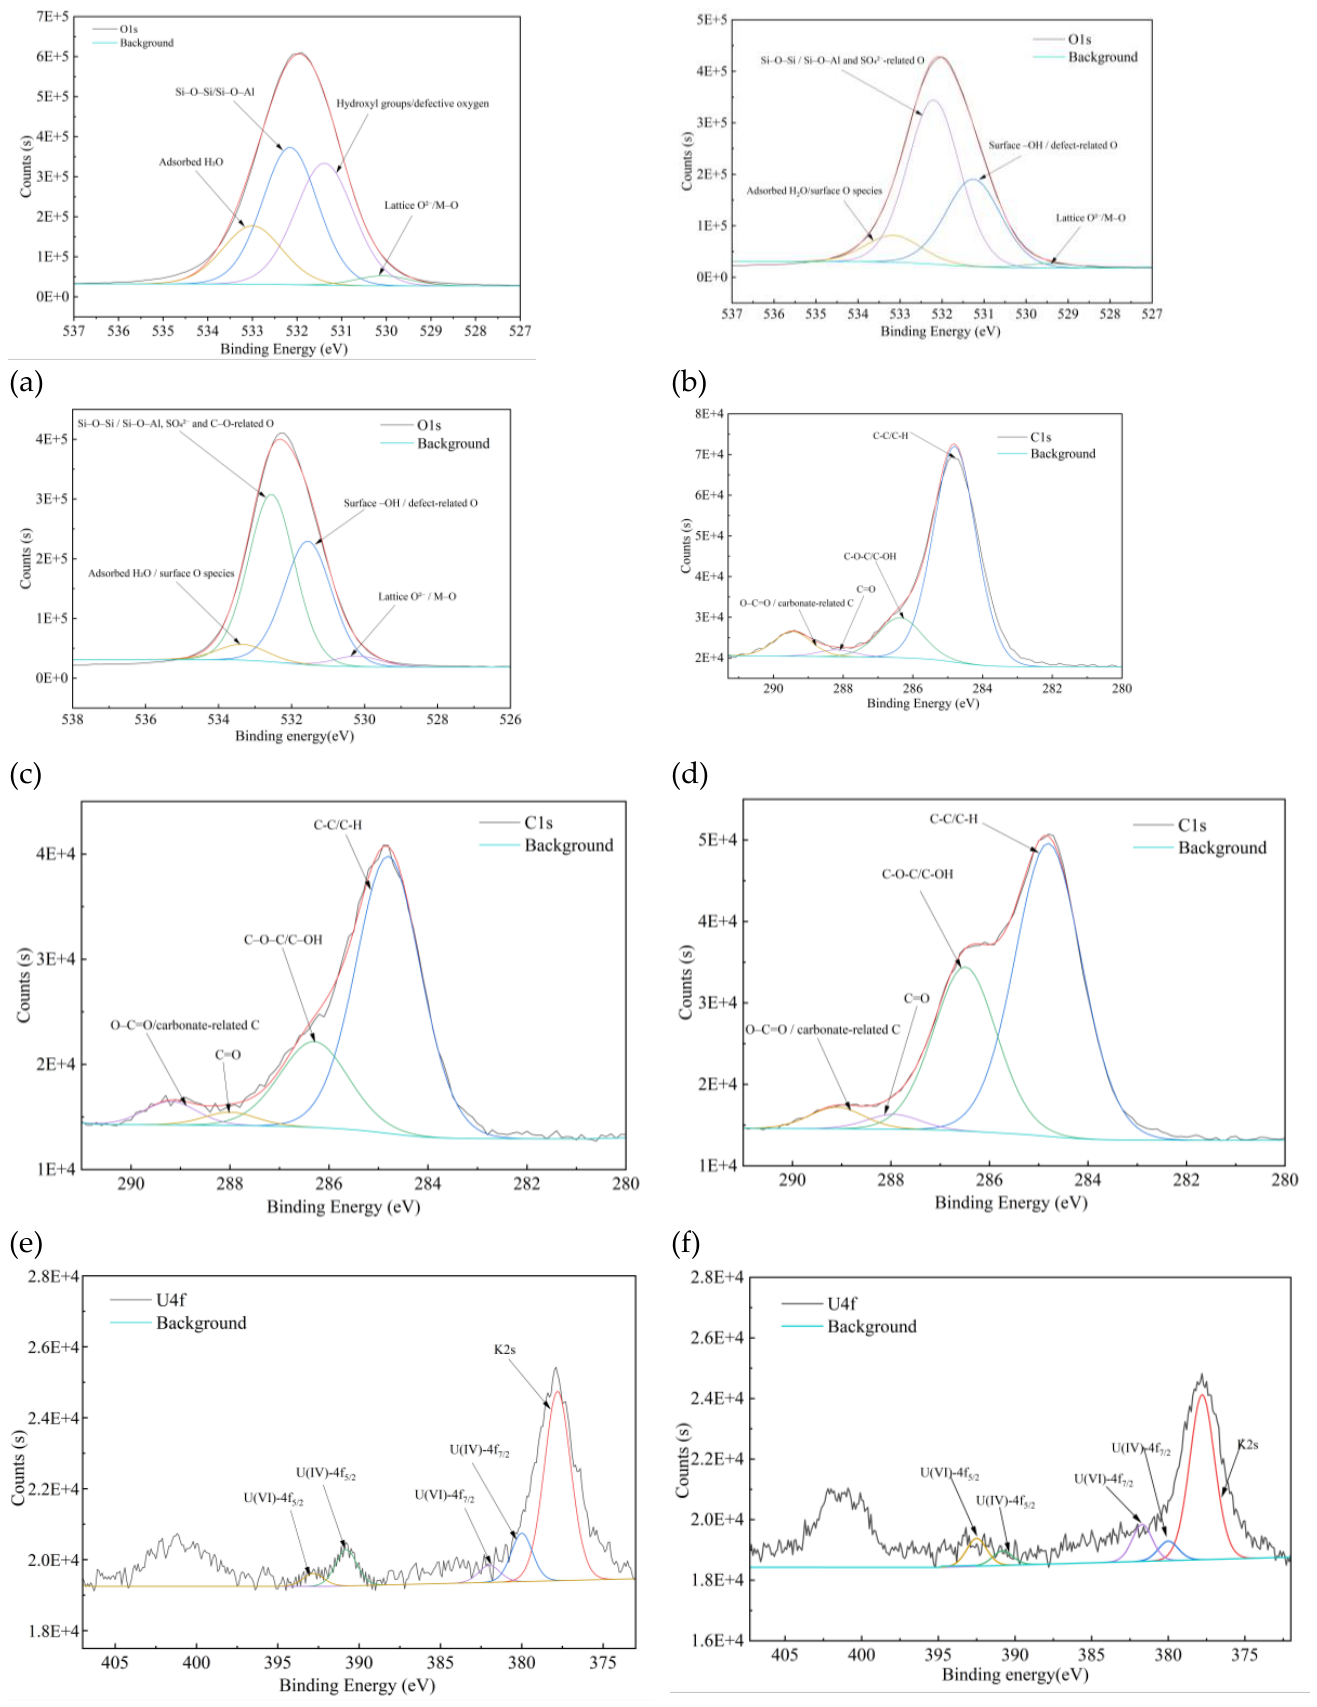
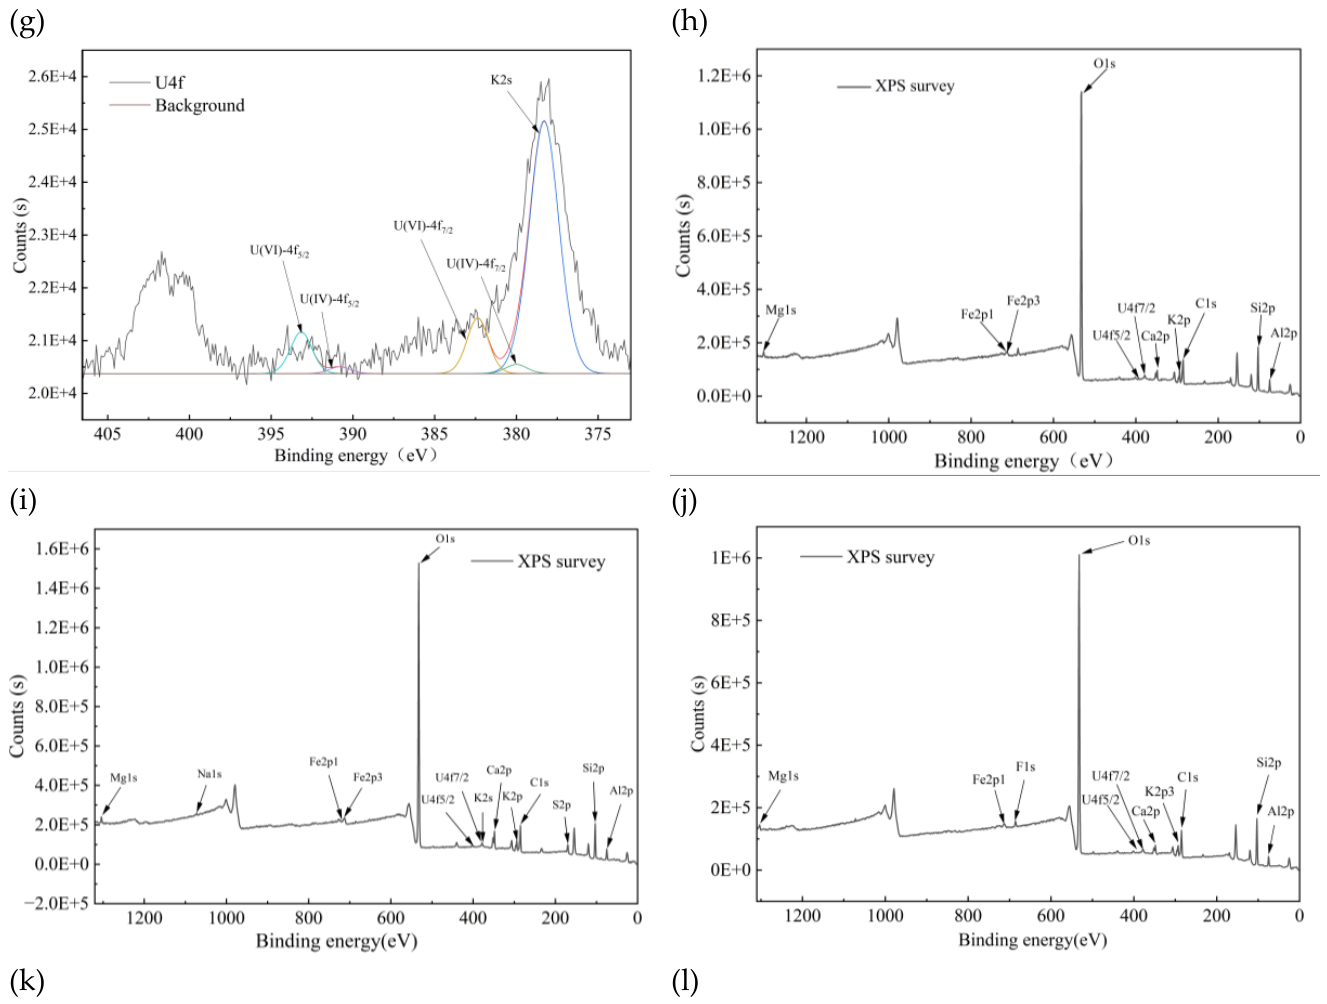
Based on literature data, the U 4f spectra were fitted using constrained spin–orbit doublets. For each uranium oxidation state, the energy separation between the U 4f₇/₂ and U 4f₅/₂ components was fixed at approximately 10.8 eV, with an area ratio of 4:3 and identical full widths at half maximum (FWHMs) [33,34,35]. A GL(30) line shape and a Shirley background were employed for peak fitting. Uranium oxidation states were assigned based on the binding energies of the main peaks together with the characteristic shake-up satellite features. A satellite feature near 398.0 eV was used only as supporting evidence for oxidation-state assignment and was not included in the fitting or quantitative analysis of the main U 4f peaks. The resulting XPS spectra are presented in Figure 3.
The XPS survey spectra show that the surfaces of the raw ore and leaching residues are dominated by O, Si, Al, Fe, and Ca, with S-related signals also detected. Deconvolution of the O 1s spectrum reveals that oxygen species on the raw ore surface are mainly assigned to Si–O–Si/Si–O–Al, surface –OH/defect-associated oxygen, adsorbed H₂O, together with a minor fraction of lattice O²⁻ (M–O). After sulfuric acid leaching, the signal near 532 eV arises from overlapping contributions of silicate oxygen and sulfate oxygen, implying alteration of the surface oxygen environment during leaching. Upon the addition of OP-10 and Tween 80, C–O-type oxygen also contributes to this spectral region. Meanwhile, the C–O–C/C–OH component in the C 1s spectrum becomes more prominent, consistent with polyoxyethylene moieties of nonionic surfactants and suggestive of possible surfactant adsorption onto the residue surface. The C 1s spectra are dominated by C–C/C–H, alongside minor C=O and O–C=O/carbonate-related carbon species. Constrained fitting of the high-resolution U 4f spectra resolved components attributable to both U(IV) and U(VI), suggesting the coexistence of different uranium oxidation states on the surfaces of the leaching residues. In acidic sulfate media, uranium mobilization may involve the oxidation of U(IV) to U(VI) and the subsequent formation of soluble uranyl–sulfate complexes[36-37]. However, the XPS results reflect the chemical states of uranium remaining on the solid surfaces and do not directly establish the oxidation pathways or aqueous uranium speciation during leaching. Therefore, these processes should be considered possible chemical pathways rather than experimentally confirmed mechanisms, as dissolved uranium speciation was not determined in this study.
Because of the low U signal intensity, interference from K 2s, and background noise, reliable U atomic concentrations could not be obtained from the survey spectra. Therefore, the XPS data were not used to quantitatively compare the total uranium contents among the samples. Overall, sulfuric acid leaching and the addition of surfactants altered the surface oxygen- and carbon-containing species, while both U(IV) and U(VI) remained detectable on the surfaces of the leaching residues.
Figure 3.
XPS spectra of the raw ore and leaching residues obtained under different stirred-leaching conditions: (a) O 1s spectrum of the raw ore; (b) O 1s spectrum of the residue from the H₂SO₄ system; (c) O 1s spectrum of the residue from the mixed-surfactant system; (d) C 1s spectrum of the raw ore; (e) C 1s spectrum of the residue from the H₂SO₄ system; (f) C 1s spectrum of the residue from the mixed-surfactant system; (g) U 4f spectrum of the raw ore; (h) U 4f spectrum of the residue from the H2SO4 system; (i) U 4f spectrum of the residue from the mixed-surfactant system; (j) survey spectrum of the raw ore; (k) survey spectrum of the residue from the H₂SO₄ system; and (l) survey spectrum of the residue from the mixed-surfactant system.
Figure 3.
XPS spectra of the raw ore and leaching residues obtained under different stirred-leaching conditions: (a) O 1s spectrum of the raw ore; (b) O 1s spectrum of the residue from the H₂SO₄ system; (c) O 1s spectrum of the residue from the mixed-surfactant system; (d) C 1s spectrum of the raw ore; (e) C 1s spectrum of the residue from the H₂SO₄ system; (f) C 1s spectrum of the residue from the mixed-surfactant system; (g) U 4f spectrum of the raw ore; (h) U 4f spectrum of the residue from the H2SO4 system; (i) U 4f spectrum of the residue from the mixed-surfactant system; (j) survey spectrum of the raw ore; (k) survey spectrum of the residue from the H₂SO₄ system; and (l) survey spectrum of the residue from the mixed-surfactant system.
3.1.4. SEM Analysis Results
The SEM images (Figure 4) and corresponding EDS spectra (Figure 5) show that the raw ore particles exhibit an irregular blocky morphology with a relatively compact surface. Localized lamellar exfoliation, microcracks, and irregular pores are clearly observed, together with fine particles attached to the surface, indicating pronounced microstructural heterogeneity within the mineral particles. At higher magnification, platy or sheet-like mineral phases are distributed across the particle surface and are accompanied by micron-scale pores and fractures. These structural defects may provide potential pathways for solution access during leaching.
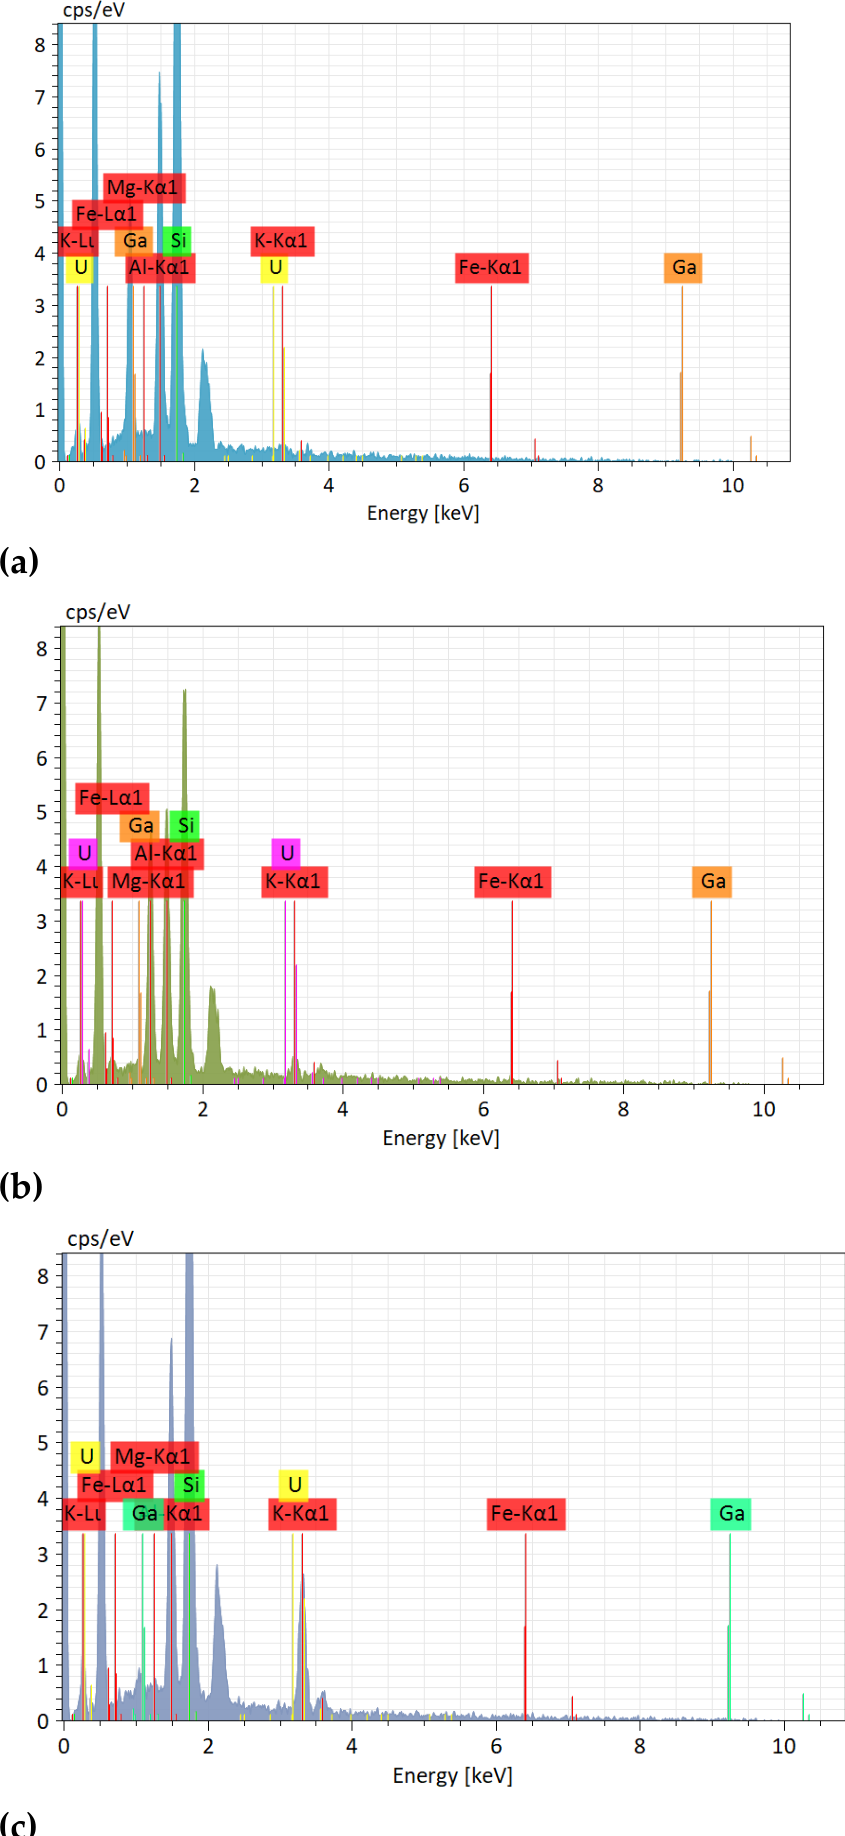
The EDS spectra (Figure 5) reveal distinct compositional variations among the analyzed regions. Spectrum 1 is dominated by Si, Al, and K, with minor Fe and Mg, corresponding to a quartz–aluminosilicate-rich region. In Spectrum 2, U is detected together with Si, Al, K, and Fe, indicating heterogeneous uranium distribution and local spatial association with aluminosilicate-rich regions. U is also detected in Spectrum 3, accompanied by Fe, Mg, and Si, suggesting a local spatial association between U and Fe–Mg-bearing silicate minerals. Overall, the granitic uranium ore is characterized by mineralogical heterogeneity, uneven uranium distribution, and local mineral associations. The presence of microcracks and pores may facilitate the access of acidic leaching solution to U-bearing phases.
Figure 4.
SEM images showing the morphology, microcracks, and pore features of the raw ore.
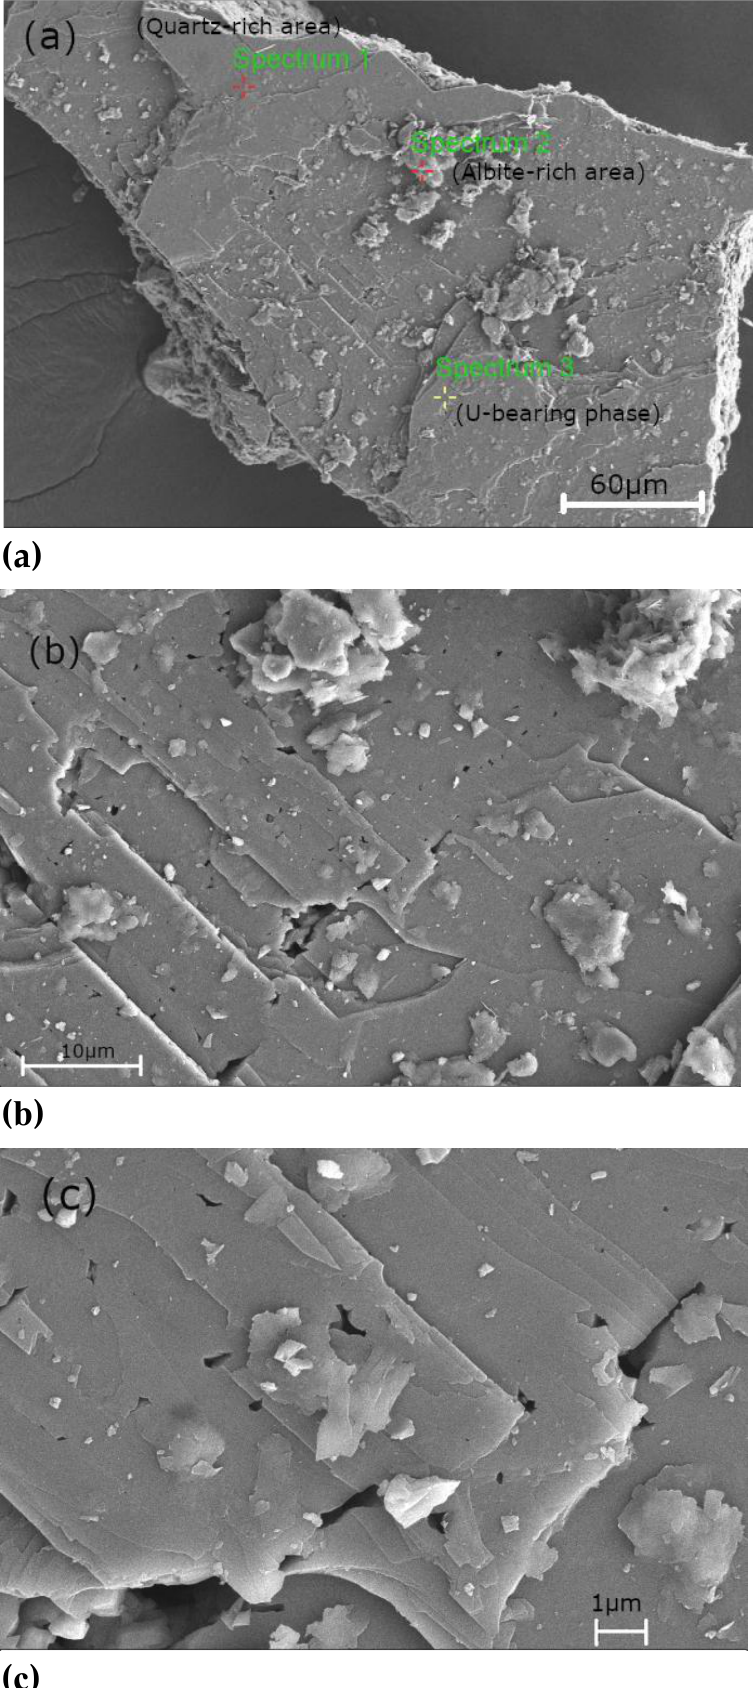
Figure 5.
EDS spectra corresponding to the selected regions in Figure 4a: (a) Spectrum 1; (b) Spectrum 2; and (c) Spectrum 3.
Figure 5.
EDS spectra corresponding to the selected regions in Figure 4a: (a) Spectrum 1; (b) Spectrum 2; and (c) Spectrum 3.
3.1.5. BET and MIP Analysis Results
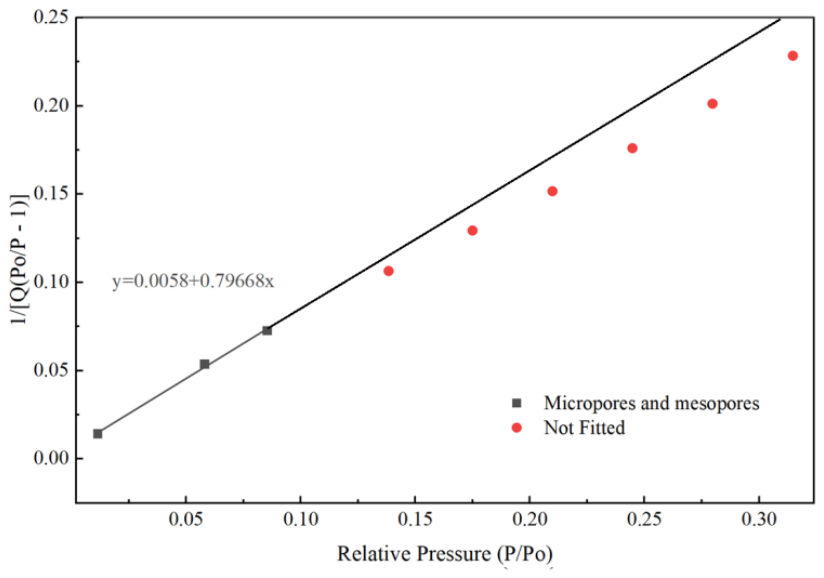
The N₂ adsorption–desorption isotherm and BET plot of the granite-hosted uranium ore sample are shown in Figure 6 and Figure 7, respectively. The sample exhibited a relatively low BET specific surface area of 5.4240 m²·g-1 and a total pore volume of 0.0171 cm³·g-1. The t-plot analysis yielded a micropore area of 0.979 m²·g-1 and an external surface area of 4.445 m²·g-1, with the micropore area accounting for approximately 18.0% of the BET surface area. The corresponding micropore volume was only 0.000829 cm³·g-1, representing about 4.9% of the total pore volume, indicating a limited contribution of micropores to the overall pore system.
The pore structure parameters derived from the N₂ adsorption–desorption measurements are summarized in Table 3. The BJH adsorption cumulative pore volume within the diameter range of 1.79–56.22 nm was 0.0167 cm³·g-1, accounting for approximately 97.9% of the total pore volume. In addition, the average pore diameter calculated from the adsorption branch using the BET 4V/A method was 12.58 nm, whereas the BJH adsorption average pore diameter was 11.96 nm. The close agreement between these values, together with the pronounced contribution of pores within the mesopore size range, indicates that the pore system accessible to N₂ adsorption is dominated by mesoporous contributions.
Overall, the N₂ adsorption results indicate a relatively low specific surface area and total pore volume, with a limited contribution from micropores. The BJH adsorption average pore diameter of 11.96 nm indicates a pronounced mesoporous contribution within the pore-size range accessible to N₂ adsorption. These mesopores may provide internal solid–liquid interfaces and transport pathways during leaching; however, N₂ adsorption alone does not fully characterize the larger pores and pore-throat structures relevant to fluid penetration. Therefore, MIP was further employed to characterize the pore system over a broader pore-size range.
Table 3.
Textural properties of the granite-hosted uranium ore sample determined by N₂ adsorption–desorption analysis.
Table 3.
Textural properties of the granite-hosted uranium ore sample determined by N₂ adsorption–desorption analysis.
| Parameter | Value |
|---|---|
| BET specific surface area | 5.4240 m²·g-1 |
| Total pore volume | 0.0171 cm³·g-1 |
| t-plot micropore volume | 0.000829 cm³·g-1 |
| t-plot micropore area | 0.979 m²·g-1 |
| External surface area | 4.445 m²·g-1 |
| BJH adsorption average pore diameter | 11.956 nm |
Figure 6.
N₂ adsorption–desorption isotherm of the granite-hosted uranium ore sample at 77 K.
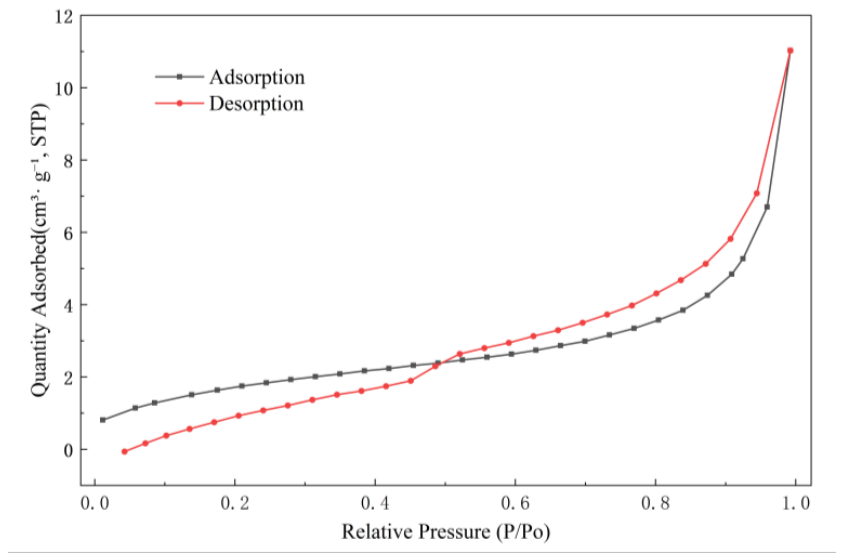
Figure 7.
BET plot of the granite-hosted uranium ore sample.
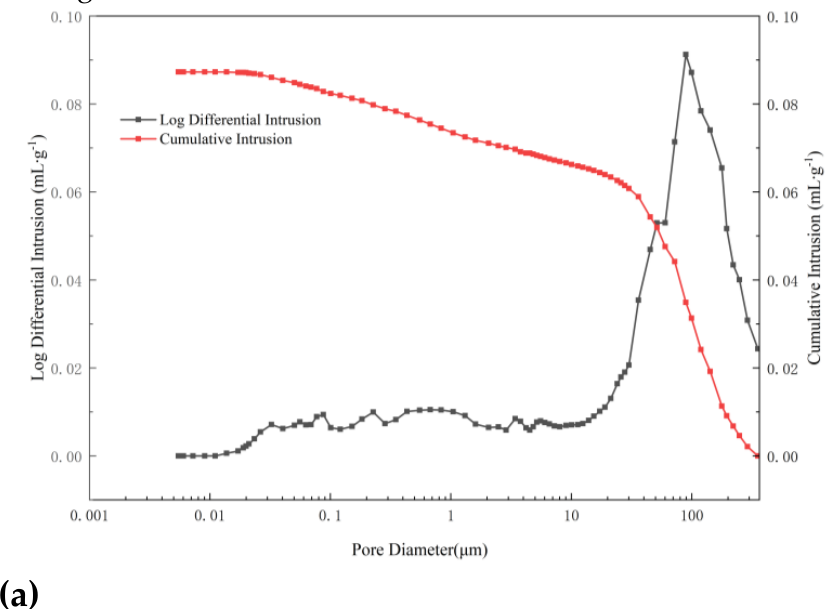
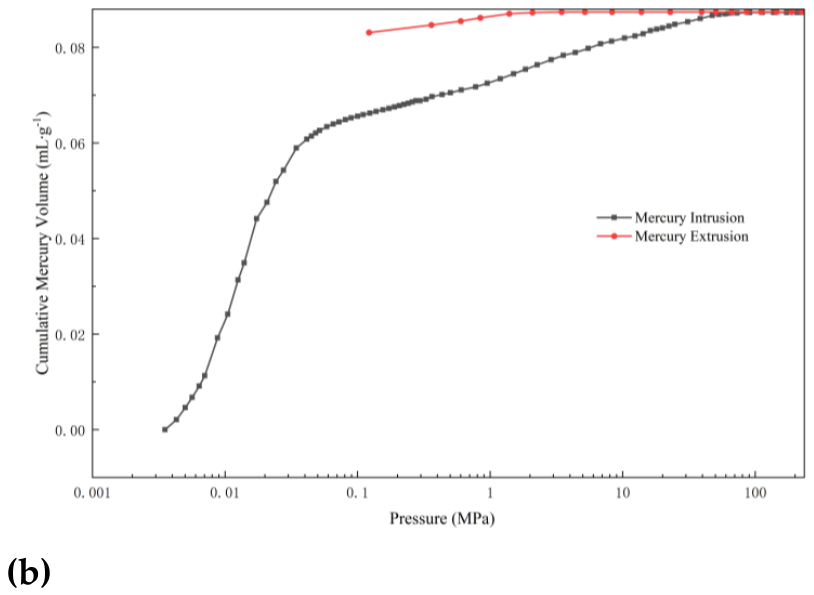
MIP measurements showed a broad pore-size distribution in the raw granite-hosted uranium ore (Figure 8). The differential intrusion curve exhibited a pronounced peak at approximately 70–100 μm, indicating a considerable contribution from large pores and pore throats. The total mercury intrusion volume was 0.0873 mL·g-1, with a porosity of 18.64%. The average pore diameter (4V/A) was 578.39 nm, and the volume-based median pore diameter was 73.23 μm. Pores larger than approximately 72 μm accounted for 50.6% of the total intrusion volume, while more than 95% of the cumulative intrusion occurred at pore diameters above approximately 77 nm. Together with the mesopores identified by N₂ adsorption, the MIP results indicate that the ore contains pores and pore throats spanning from the nanometer to micrometer scale.
This pore structure is likely to influence the transport and accessibility of the leaching solution within the ore. Larger pores and pore throats may provide relatively accessible pathways for solution transport, whereas smaller pores contribute additional internal surface area available for mineral-solution contact. The pronounced intrusion–extrusion hysteresis further indicates the presence of restricted pore throats and heterogeneous pore accessibility, which may limit solution access to some internal surfaces. Under these conditions, surfactant-induced changes in interfacial properties may influence the accessibility of the acidic solution to the pore network. These pore characteristics provide structural context for interpreting the observed behavior of surfactant-assisted uranium leaching.
Figure 8.
Mercury intrusion porosimetry characteristics of the raw granite-hosted uranium ore: (a) pore-size distribution and cumulative intrusion volume; (b) mercury intrusion–extrusion curve.
Figure 8.
Mercury intrusion porosimetry characteristics of the raw granite-hosted uranium ore: (a) pore-size distribution and cumulative intrusion volume; (b) mercury intrusion–extrusion curve.
3.1.6. FTIR Analysis Results
Figure 9.
FTIR spectra of the raw ore and leaching residues obtained under different leaching conditions.
Figure 9.
FTIR spectra of the raw ore and leaching residues obtained under different leaching conditions.
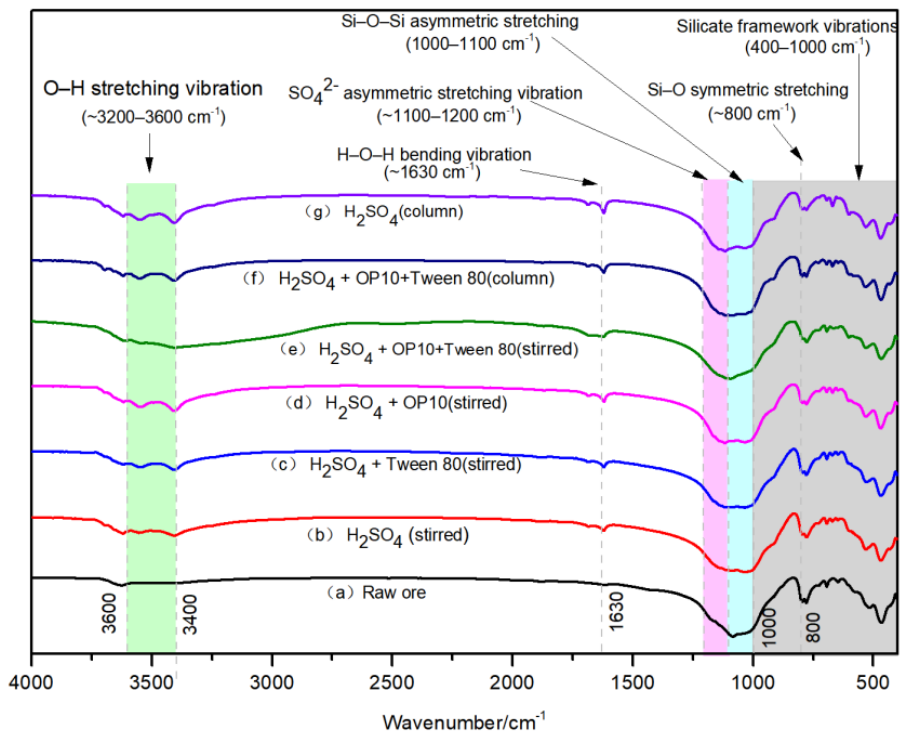
Figure 9 compares the FTIR spectra of the raw ore and the leaching residues obtained under different conditions. The raw ore exhibits characteristic absorption bands associated with O–H stretching at approximately 3200–3600 cm⁻¹ and H–O–H bending near 1630 cm⁻¹, together with pronounced bands in the 400–1100 cm⁻¹ region, which are mainly associated with vibrations of the silicate framework. After sulfuric acid leaching, changes in the intensity and profile of the Si–O-related bands indicate that acid treatment affected the surface structure of silicate-bearing minerals. The spectra obtained with Tween 80, OP-10, and the mixed OP-10/Tween 80 system retain the main silicate framework bands, but differences are evident in the 1000–1200 cm⁻¹ region, where Si–O and sulfate-related vibrations overlap. Among the leaching conditions examined, the mixed-surfactant treatment exhibits more pronounced spectral changes in this region than sulfuric acid alone. These spectral variations indicate changes in the local chemical environment of the leaching residues and are consistent with possible differences in solid–liquid interfacial conditions in the presence of the OP-10/Tween 80 mixture.
3.2. Surface Tension Measurement Results
Figure 10.
Surface tension behavior of individual and mixed OP-10/Tween 80 systems under different dilution conditions: (a) OP-10 and Tween 80 in the original solutions and after secondary dilution with DI water or aqueous H2SO4 as a function of the initial concentration (C0); (b) OP-10/Tween 80 mixtures with different mixing ratios as a function of C0; (c) OP-10 and Tween 80 after secondary dilution as a function of the final concentration (Cf); (d) original OP-10 and Tween 80 solutions as a function of Cf; and (e) OP-10/Tween 80 mixtures with different mixing ratios as a function of the final total surfactant concentration (Cf).
Figure 10.
Surface tension behavior of individual and mixed OP-10/Tween 80 systems under different dilution conditions: (a) OP-10 and Tween 80 in the original solutions and after secondary dilution with DI water or aqueous H2SO4 as a function of the initial concentration (C0); (b) OP-10/Tween 80 mixtures with different mixing ratios as a function of C0; (c) OP-10 and Tween 80 after secondary dilution as a function of the final concentration (Cf); (d) original OP-10 and Tween 80 solutions as a function of Cf; and (e) OP-10/Tween 80 mixtures with different mixing ratios as a function of the final total surfactant concentration (Cf).
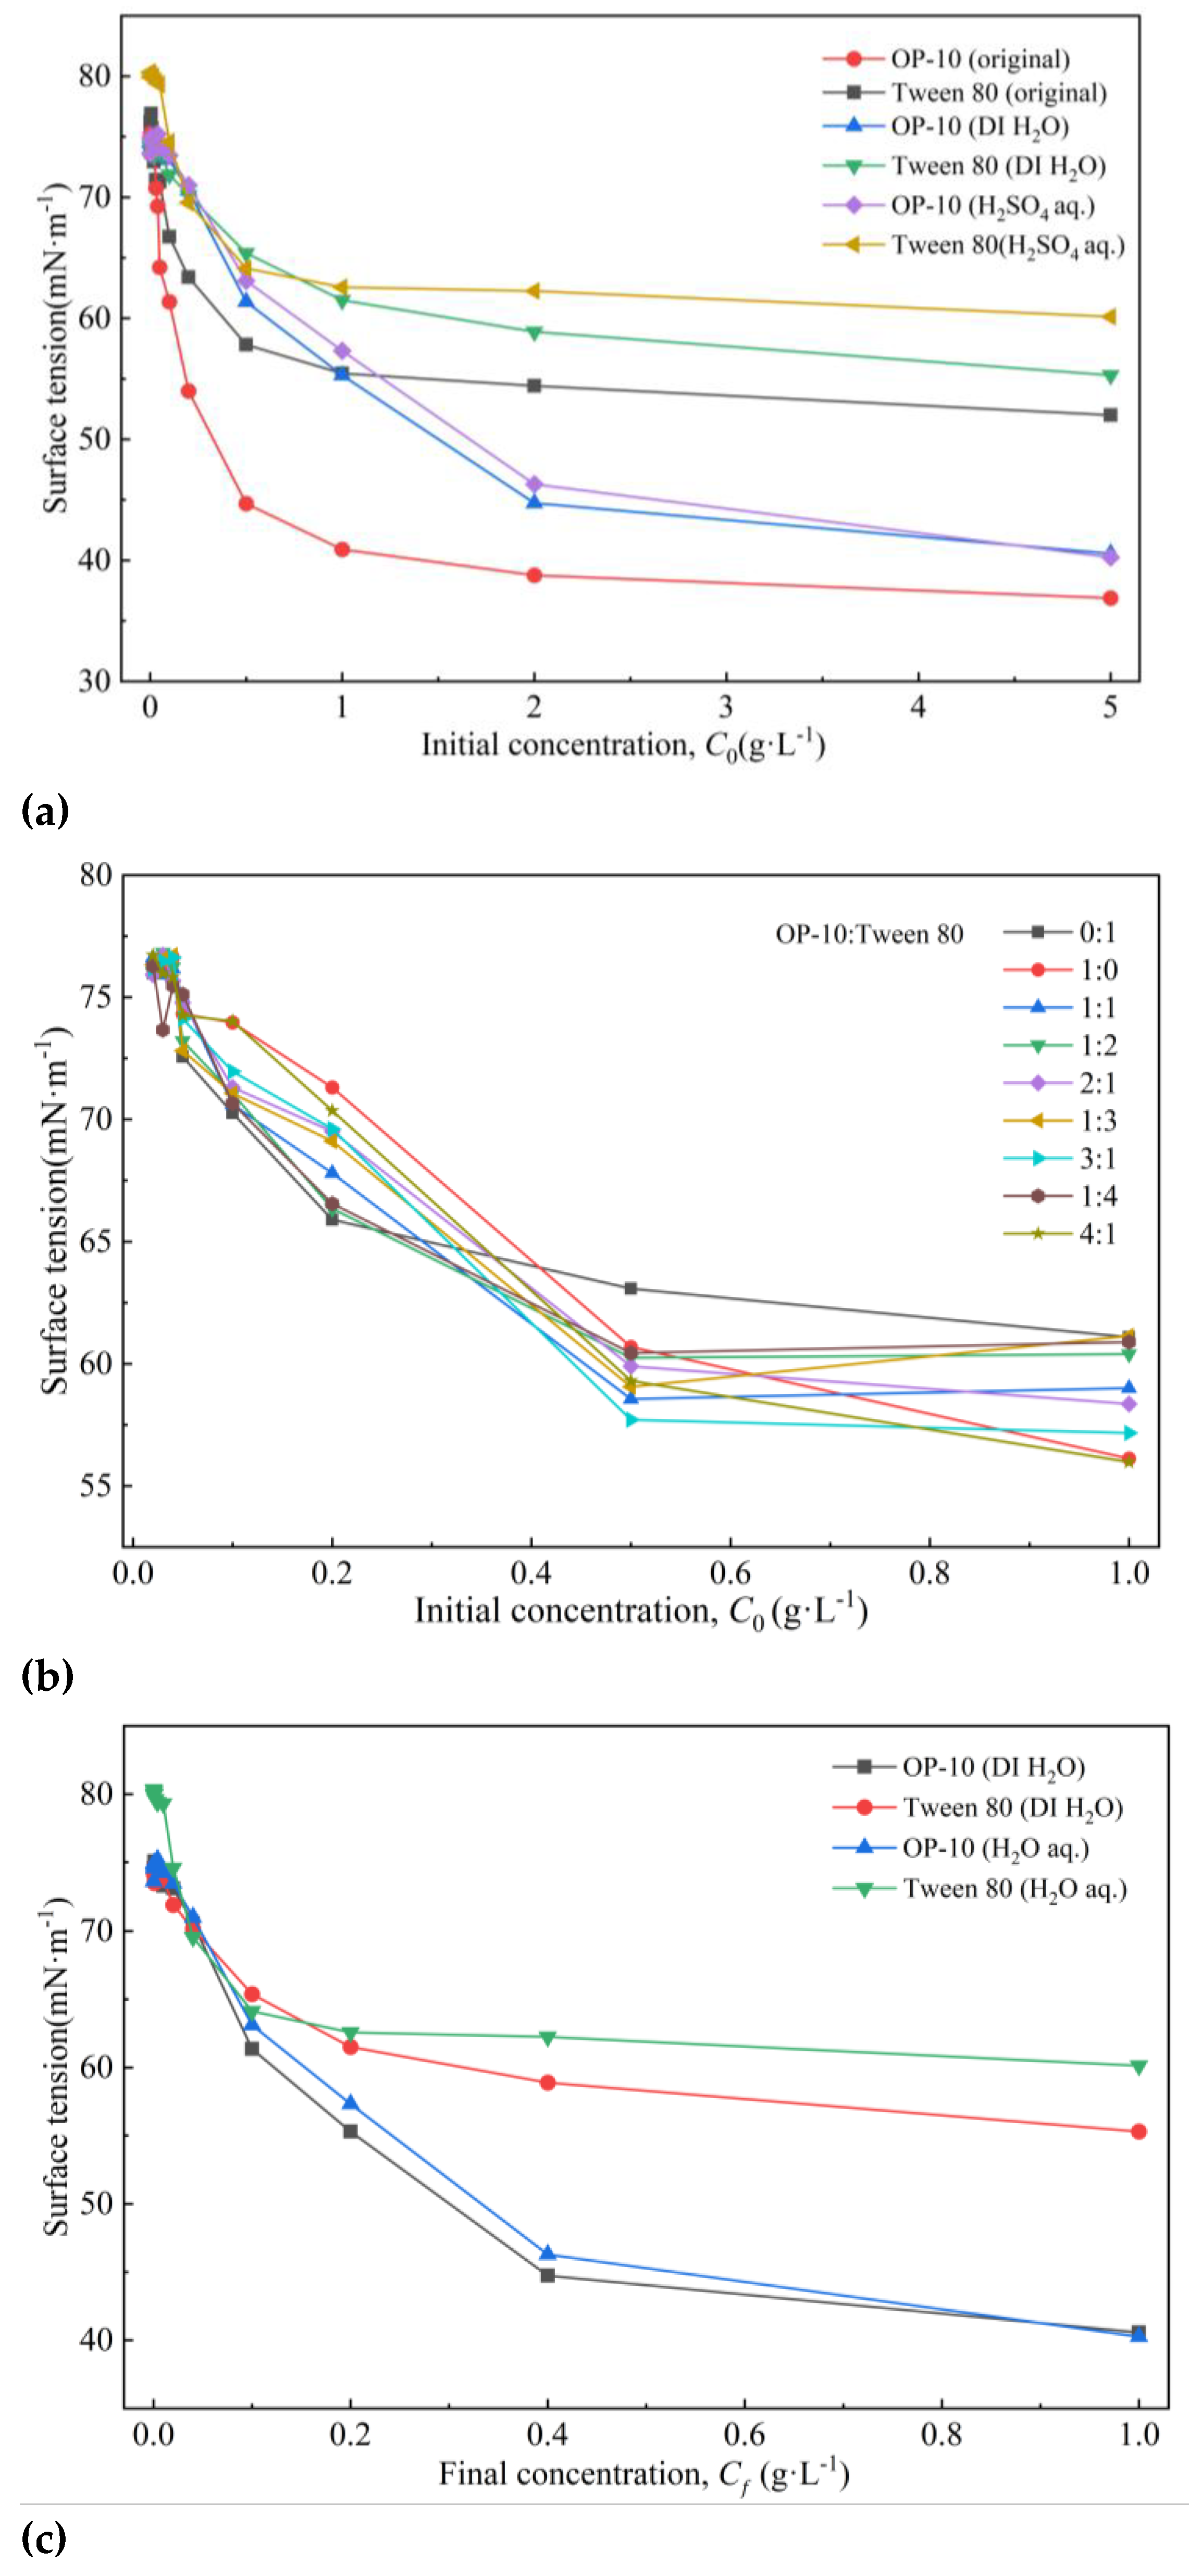
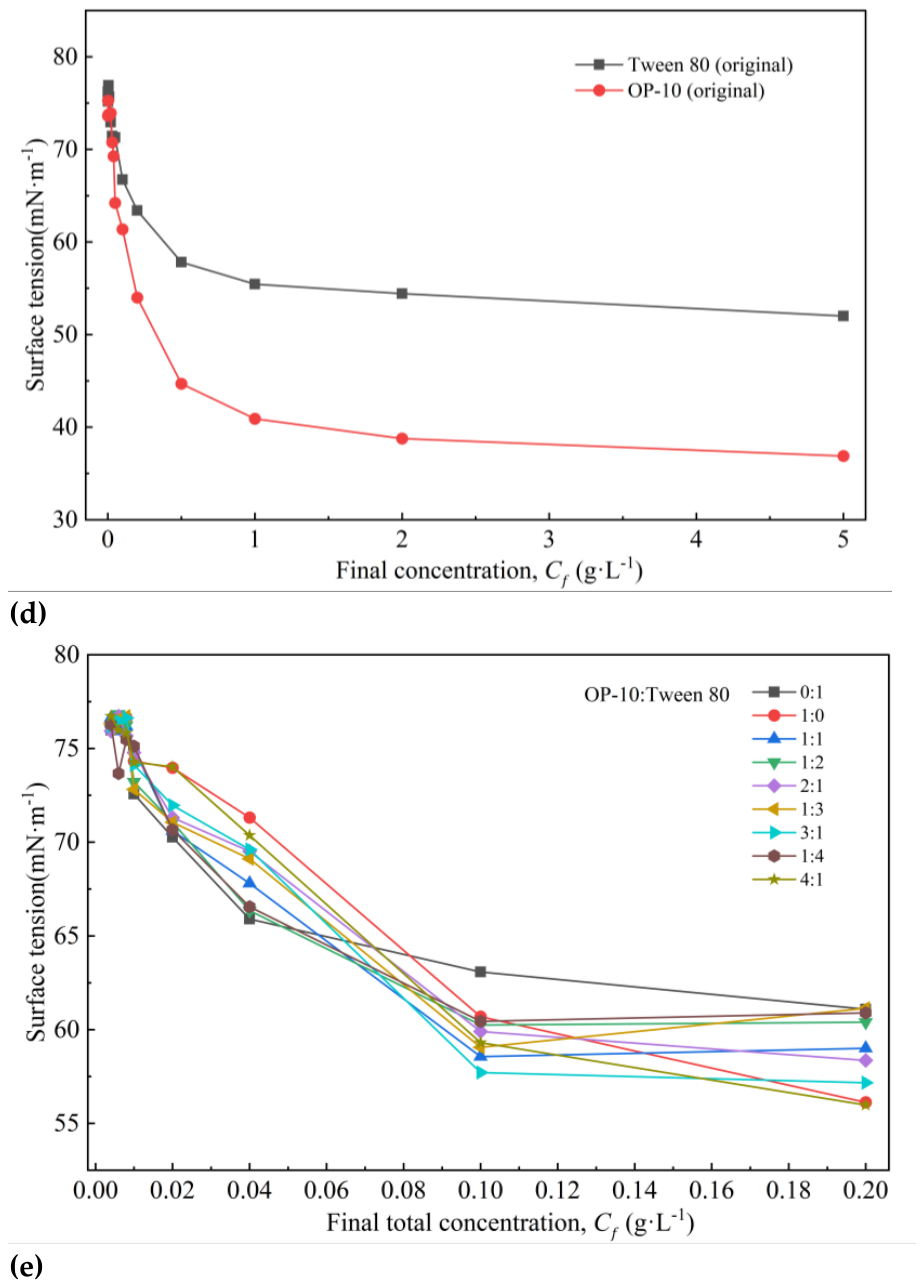
The surface tensions of both OP-10 and Tween 80 decreased with increasing surfactant concentration, although the extent of the decrease differed markedly between the two surfactants (Figure 10a,d). For the original solutions, the surface tension of OP-10 decreased from approximately 44.7 mN·m⁻¹ at 0.5 g·L⁻¹ to 36.9 mN·m⁻¹ at 5.0 g·L⁻¹, whereas that of Tween 80 decreased from approximately 57.8 to 52.0 mN·m⁻¹ over the same concentration range, indicating a greater surface-tension-reducing capacity of OP-10. A similar trend was observed after dilution (Figure 10c). Over most of the concentration range examined, the surface tensions of OP-10 in DI water and aqueous H₂SO₄ were comparable, whereas those of Tween 80 in aqueous H₂SO₄ were slightly higher than those in DI water, particularly above 0.2 g·L⁻¹.
The surface tension of the OP-10/Tween 80 mixtures depended on both surfactant concentration and mixing ratio (Figure 10b,e). As shown in Figure 10e, the surface tension decreased markedly with increasing final total surfactant concentration (Cf), from approximately 72.8–76.8 mN·m⁻¹ at Cf = 0.004–0.01 g·L⁻¹ to 57.7–60.4 mN·m⁻¹ at Cf = 0.10 g·L⁻¹. A further increase to Cf = 0.20 g·L⁻¹ resulted in only a limited additional decrease, with values ranging from approximately 56.0 to 61.1 mN·m⁻¹. The effect of mixing ratio varied with concentration, and no single ratio consistently produced the lowest surface tension over the entire concentration range investigated.
Based on the overall surface-tension responses, an OP-10/Tween 80 volume ratio of 3:1 was selected as the representative formulation for the subsequent leaching experiments because of its relatively low surface tension, particularly approximately 57.7 mN·m⁻¹ at Cf = 0.10 g·L⁻¹. However, the 3:1 mixture did not exhibit the lowest surface tension at all concentrations examined; therefore, its selection should not be interpreted as direct evidence of a synergistic interaction between OP-10 and Tween 80.
For most mixed systems, the surface tension decreased markedly with increasing Cf below approximately 0.10 g·L⁻¹ but changed only slightly between 0.10 and 0.20 g·L⁻¹ (Figure 10e), indicating that the concentration dependence became less pronounced. Because the interfacial adsorption and bulk aggregation behavior of OP-10 and Tween 80 were not directly measured, this leveling-off behavior alone cannot be used to identify interfacial saturation or surfactant aggregation. Accordingly, Cf = 0.10 g·L⁻¹ is regarded only as an empirical concentration region where the surface tension–concentration curves began to level off under the present experimental conditions, rather than as the critical micelle concentration (CMC) or another specific aggregation threshold.
Based on the above experiments, the final concentration of each individual surfactant (OP-10 or Tween 80) and the total concentration of the mixed surfactants were both set at 0.10 g·L⁻¹ in the stirred-leaching kinetic and column-leaching experiments. The volume ratio of OP-10 to Tween 80 in the mixed-surfactant system was fixed at 3:1. In addition, the final H₂SO₄ concentration was set at 20 g·L⁻¹ in both experiments.
3.3. Stirred-Leaching Experiment Results
3.3.1. Effect of Sulfuric Acid Concentration on Uranium Recovery
The effect of sulfuric acid concentration on uranium recovery was examined at 30 °C over 4 h. The final leaching solution volume was 50 mL, and the final H₂SO₄ concentrations were 10, 15, 20, and 25 g·L⁻¹. Three leaching systems were compared: H₂SO₄ system, OP-10 system and mixed-surfactant system.
For the H₂SO₄ system, 40 mL of H₂SO₄ stock solution (12.50, 18.75, 25.00, or 31.25 g·L⁻¹) was combined with 10 mL of deionized water. For the OP-10 system, the deionized water was replaced with 10 mL of 0.50 g·L⁻¹ OP-10 solution, resulting in a final OP-10 concentration of 0.10 g·L⁻¹. For the mixed-surfactant system, 7.5 mL of 0.50 g·L⁻¹ OP-10 solution and 2.5 mL of 0.50 g·L⁻¹ Tween 80 solution were combined with 40 mL of the corresponding H₂SO₄ stock solution. The resulting total surfactant concentration was 0.10 g·L⁻¹ (0.075 g·L⁻¹ OP-10 and 0.025 g·L⁻¹ Tween 80). These nominal concentrations assume additive solution volumes. Ore mass, liquid-to-solid ratio, stirring speed, and all other experimental conditions were held constant. The leaching results for the three systems are presented in Figure 11.
Figure 11.
Effect of final H₂SO₄ concentration on uranium recovery in the H₂SO₄, OP-10, and mixed-surfactant systems (temperature: 30 °C; leaching time: 4 h). Data are mean ± standard deviation (SD) from three independent experiments (n = 3).
Figure 11.
Effect of final H₂SO₄ concentration on uranium recovery in the H₂SO₄, OP-10, and mixed-surfactant systems (temperature: 30 °C; leaching time: 4 h). Data are mean ± standard deviation (SD) from three independent experiments (n = 3).
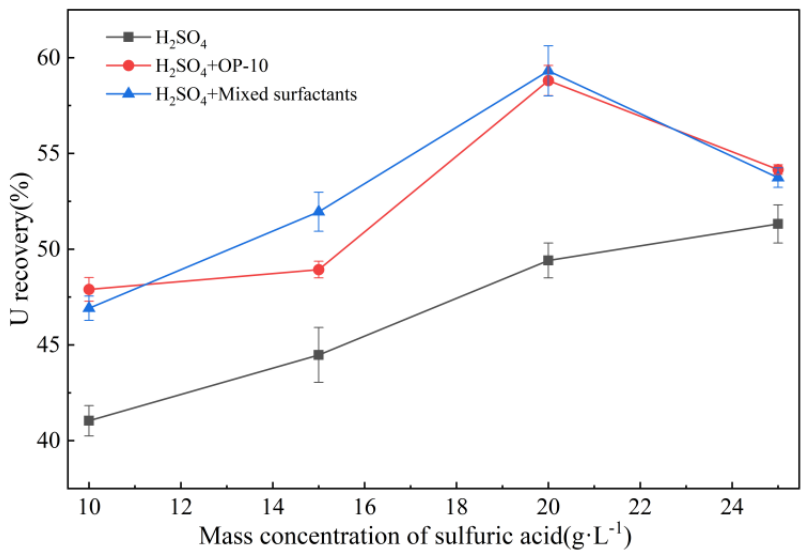
As shown in Figure 11, uranium recovery in the H₂SO₄ system increased from approximately 41.0% at 10 g·L⁻¹ to 51.3% at 25 g·L⁻¹. At 10 g·L⁻¹, the corresponding recoveries with OP-10 and the mixed surfactants were approximately 47.9% and 46.9%, exceeding the H₂SO₄ system result by 6.9 and 5.9 percentage points, respectively. At 15 g·L⁻¹, the mixed-surfactant system achieved approximately 52.0%, compared with 48.9% for OP-10 system and 44.5% for H₂SO₄ system. At 20 g·L⁻¹, recoveries reached approximately 58.8% with OP-10 system and 59.3% with the mixed-surfactant system, compared with 49.4% for H₂SO₄ system. These represent increases of approximately 9.4 and 9.9 percentage points, respectively, and were the largest improvements relative to the H₂SO₄ system within the investigated concentration range. At 25 g·L⁻¹, recoveries decreased to approximately 54.2% and 53.7% in the two surfactant-containing systems, whereas recovery with H₂SO₄ system increased to approximately 51.3%. Thus, the enhancement associated with surfactant addition was non-monotonic with respect to acid concentration and was greatest near 20 g·L⁻¹ under the conditions investigated.
3.3.2. Effect of Temperature on Uranium Recovery
Temperature effects were evaluated at a fixed final H₂SO₄ concentration of 20 g·L⁻¹ and a final solution volume of 50 mL. The tested temperatures were 15, 20, 25, 30, and 35 °C. For the H₂SO₄ system, 40 mL of 25 g·L⁻¹ H₂SO₄ was mixed with 10 mL of deionized water. In the OP-10 system, the 10 mL aqueous component comprised 0.50 g·L⁻¹ OP-10 solution. In the mixed-surfactant system, it comprised 7.5 mL of 0.50 g·L⁻¹ OP-10 solution and 2.5 mL of 0.50 g·L⁻¹ Tween 80 solution. Final surfactant concentrations were therefore 0.10 g·L⁻¹ OP-10 or a total of 0.10 g·L⁻¹ mixed surfactants (0.075 g·L⁻¹ OP-10 and 0.025 g·L⁻¹ Tween 80), assuming additive volumes. Other experimental conditions were kept constant. The leaching results for the three systems are presented in Figure 12.
Figure 12.
Effect of temperature on uranium recovery in the three leaching systems (final H₂SO₄ concentration: 20 g·L⁻¹; leaching time: 4 h). Data are mean ± SD from three independent experiments (n = 3).
Figure 12.
Effect of temperature on uranium recovery in the three leaching systems (final H₂SO₄ concentration: 20 g·L⁻¹; leaching time: 4 h). Data are mean ± SD from three independent experiments (n = 3).
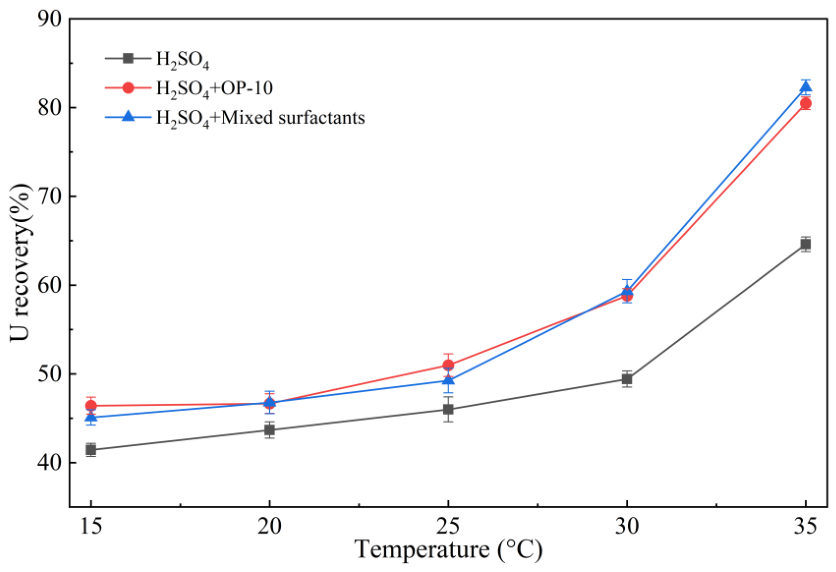
Mean uranium recovery generally increased with temperature in all three systems (Figure 12). Between 15 and 35 °C, recovery increased from approximately 41.4% to 64.6% for H₂SO₄ system, from 46.4% to 80.5% for the OP-10 system, and from 45.1% to 82.3% for the mixed-surfactant system. At 35 °C, the OP-10 and mixed-surfactant systems exceeded the H₂SO₄ system by approximately 15.9 and 17.7 percentage points, respectively. The two surfactant-containing systems exhibited similar mean recoveries between 15 and 30 °C. All three systems showed a marked increase in mean recovery between 30 and 35 °C. Although these observations are consistent with faster overall leaching at elevated temperature, recovery data alone cannot resolve the relative contributions of interfacial reaction kinetics and mass transfer. At 35 °C, the mixed-surfactant system mean (82.3%) was slightly higher than the OP-10 system mean (80.5%); no statistical significance is inferred from this numerical difference.
3.3.3. Effect of Leaching Time on Uranium Recovery
Although higher uranium recovery was achieved at 35 °C (Figure 12), 30 °C was selected as the operating temperature for the stirred leaching experiments in this section because the effect of surfactant addition on uranium recovery remained clearly observable at this temperature. Accordingly, the effect of leaching time on uranium recovery was investigated at final H₂SO₄ concentration of 20 g·L⁻¹ and a temperature of 30 °C. Leaching times were 2, 4, 6, 8, and 10 h, and the final solution volume was 50 mL. The solution preparations were the same as those described in Section 3.3.2: H₂SO₄ alone (H₂SO₄ system); H₂SO₄ with 0.10 g·L⁻¹ OP-10 (OP-10 system); and H₂SO₄ with 0.10 g·L⁻¹ total mixed surfactants (0.075 g·L⁻¹ OP-10 and 0.025 g·L⁻¹ Tween 80)(mixed-surfactant system). Ore mass, liquid-to-solid ratio, stirring speed, and other conditions remained unchanged. The leaching results for the three systems are presented in Figure 13.
Figure 13.
Effect of leaching time on uranium recovery in the three leaching systems (final H₂SO₄ concentration: 20 g·L⁻¹; 30 °C). Data are mean ± SD from three independent experiments (n = 3).
Figure 13.
Effect of leaching time on uranium recovery in the three leaching systems (final H₂SO₄ concentration: 20 g·L⁻¹; 30 °C). Data are mean ± SD from three independent experiments (n = 3).
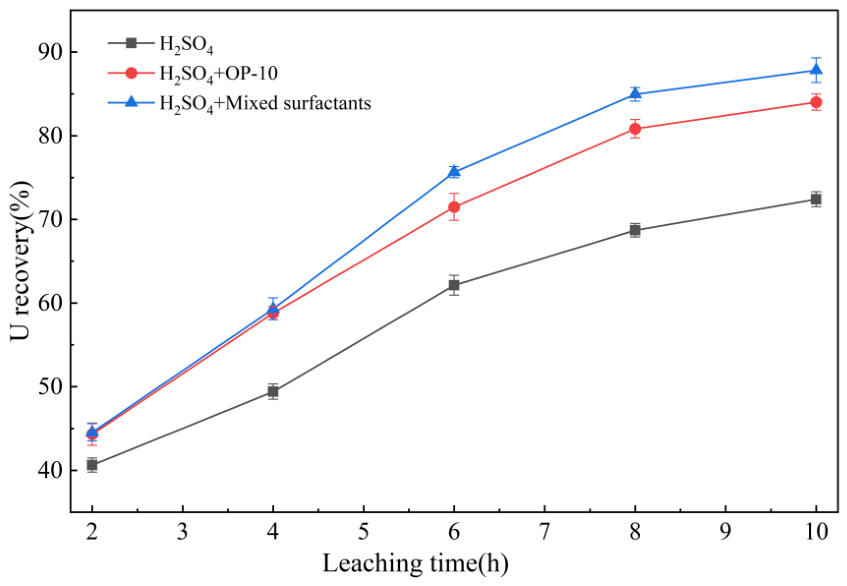
Uranium recovery increased with leaching time in all three systems, although the incremental increase diminished at longer durations (Figure 13). Between 2 and 10 h, recovery increased from approximately 40.6% to 72.4% for H₂SO₄ system, from 44.3% to 84.0% for the OP-10 system, and from 44.6% to 87.8% for the mixed-surfactant system. At 10 h, the two surfactant-containing systems exceeded the H₂SO₄ system by approximately 11.6 and 15.4 percentage points, respectively.
In the mixed-surfactant system, mean recovery increased from approximately 44.6% at 2 h to 75.6% at 6 h, an increase of 31.0 percentage points; from 6 to 10 h it rose by a further 12.2 percentage points. Similar slowing of incremental recovery was observed in the other systems. Across most durations, the mixed-surfactant system exhibited the highest mean recovery, followed by OP-10 and H₂SO₄ alone. Because acid concentration was fixed, the higher recovery in the surfactant-containing systems cannot be attributed to a higher nominal H₂SO₄ concentration. Oxidation and sulfate complexation may contribute to uranium mobilization in acidic sulfate media, while surfactant-related changes in solid–liquid contact and transport may also play a role; however, these mechanisms were not directly established by the present measurements.
3.4. Column Leaching Experiment Results
Aqueous solutions of OP-10 and Tween 80 were prepared separately, each at a concentration of 0.50 g·L⁻¹, and subsequently mixed at a volume ratio of 3:1 (OP-10 : Tween 80). The resulting mixed surfactant solution contained 0.375 g·L⁻¹ OP-10 and 0.125 g·L⁻¹ Tween 80, yielding a total surfactant concentration of 0.50 g·L⁻¹. For Column 1, the mixed surfactant solution was combined with a 25 g·L⁻¹ H₂SO₄ solution at a volume ratio of 1:4 (mixed surfactant solution: H₂SO₄ solution). Consequently, the final leaching solution for Column 1 contained 0.075 g·L⁻¹ OP-10, 0.025 g·L⁻¹ Tween 80, and 20 g·L⁻¹ H₂SO₄, with a total surfactant concentration of 0.10 g·L⁻¹. For Column 2, deionized water was mixed with the 25 g·L⁻¹ H₂SO₄ solution at the same volume ratio of 1:4 (deionized water : H₂SO₄ solution), resulting in a final H₂SO₄ concentration of 20 g·L⁻¹ without the addition of surfactants. Before the start of the formal leaching experiments, the ore beds in both columns were fully saturated with their respective leaching solutions, consisting of either the prepared H₂SO₄ solution or the H₂SO₄ solution containing mixed surfactants (OP-10/Tween 80).
All leachate generated from each column was collected daily in a single container, and the total leachate volume (Vᵢ) was measured and recorded. After thorough mixing, a representative aliquot was withdrawn and diluted tenfold for uranium determination by inductively coupled plasma optical emission spectrometry (ICP-OES). The uranium concentration in the original leachate was calculated by multiplying the measured concentration by the dilution factor of 10. Because the entire daily leachate was collected and homogenized before sampling, the resulting uranium concentration (Cᵢ) represented the daily volume-weighted average uranium concentration in the collected leachate. The daily recovered uranium mass (Mᵢ), cumulative recovered uranium mass(Mcum,n), and cumulative uranium recovery (RU,n) were calculated using Equations (13)–(15), respectively:
where Cᵢ is the daily volume-weighted average uranium concentration in the collected leachate (mg·L⁻¹), Vᵢ is the corresponding daily leachate volume (L), and Mᵢ is the uranium mass recovered on day i (mg). Mcum,n represents the cumulative uranium mass recovered up to day n (mg), and RU,n is the corresponding cumulative uranium recovery (%). The initial uranium inventory (M₀) was estimated from the measured uranium grade of the ore (787.5 mg·kg⁻¹) and the ore mass loaded into each column (2.0 kg), giving M₀ = 1575 mg. Thus, the calculated cumulative recovery represents the proportion of the estimated initial uranium inventory recovered in the collected leachate, rather than the total fraction of uranium dissolved from the ore. The variations in daily leachate uranium concentration and cumulative uranium recovery during column leaching are presented in Figure 14 and Figure 15, respectively.
Mi = CiVi
Figure 14.
Daily uranium concentrations in the leachates collected from the H₂SO₄ system and the mixed-surfactant system during column leaching. Each curve represents one independent column experiment (n = 1).
Figure 14.
Daily uranium concentrations in the leachates collected from the H₂SO₄ system and the mixed-surfactant system during column leaching. Each curve represents one independent column experiment (n = 1).
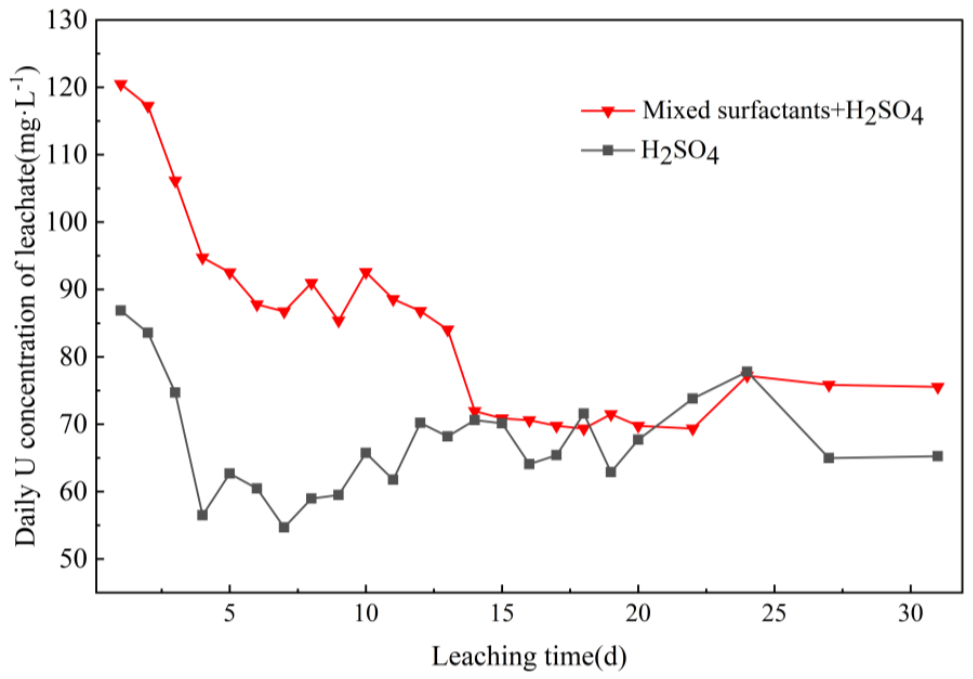
Figure 15.
Cumulative uranium recovery during column leaching with H₂SO₄ system and mixed-surfactant system. Each curve represents one independent column experiment (n = 1).
Figure 15.
Cumulative uranium recovery during column leaching with H₂SO₄ system and mixed-surfactant system. Each curve represents one independent column experiment (n = 1).
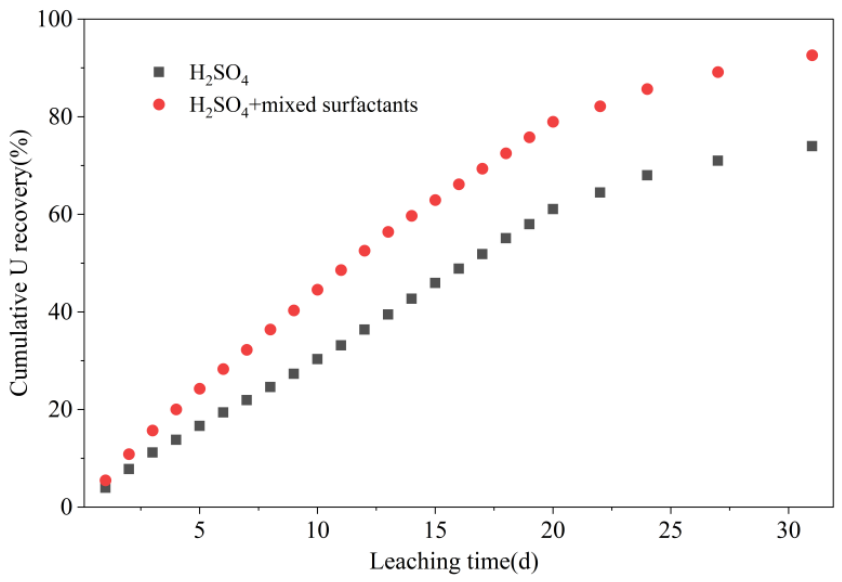
As shown in Figure 14 and Figure 15, the two columns exhibited different uranium-release and cumulative-recovery profiles. During days 1–7, the daily uranium concentration decreased from approximately 120.5 to 86.7 mg·L⁻¹ in the mixed-surfactant column and from approximately 86.9 to 54.7 mg·L⁻¹ in the H₂SO₄-only column. The mixed-surfactant column maintained higher daily effluent uranium concentrations throughout this initial period.
During the intermediate period, daily uranium concentrations fluctuated in both columns. In the mixed-surfactant column, concentrations generally declined over approximately days 7–14 and then remained within a comparatively narrow range for much of the remaining experiment. The H₂SO₄-only column exhibited larger fluctuations over the corresponding period, followed by an increase near day 24. Late in the experiment, the mixed-surfactant column exhibited daily concentrations of approximately 75.5–77.1 mg·L⁻¹, compared with approximately 65.2 mg·L⁻¹ in the H₂SO₄-only column.
After approximately 10 days, cumulative uranium recovery was 44.6% for the mixed-surfactant column and 30.3% for the H₂SO₄-only column; at day 20, these values were approximately 79.0% and 61.1%, respectively. At the end of the 31-day experiment, recoveries reached approximately 92.6% and 74.0%, a difference of 18.6 percentage points (Figure 15). The separation between the cumulative recovery curves generally increased with time.
These observations are consistent with the higher mean uranium recoveries in surfactant-containing stirred-leaching systems. However, only one independent column was tested per condition (n = 1), and the column results were not subjected to statistical comparison. The differences should therefore be interpreted as descriptive single-column observations rather than statistically validated treatment effects. Although changes in interfacial behavior, wetting, surfactant adsorption, or pore-scale transport might explain the observed response, these properties were not directly measured, and the present column data cannot establish a specific mechanism.
3.5. Kinetic Analysis
3.5.1. Kinetic Analysis of Stirred Leaching
(1) Shrinking Core Model (SCM)
To compare the apparent kinetic behavior of uranium leaching under different surfactant conditions, a separate set of stirred-leaching kinetic experiments was conducted at 20 °C. The final H2SO4 concentration, ore mass, liquid-to-solid ratio, and leaching time were fixed at 20 g·L⁻¹, 20 g, 2.5 mL·g⁻¹, and 0–10 h, respectively. Four leaching systems were investigated: (1) H₂SO₄ without surfactant (H₂SO₄ system); (2) H₂SO₄ with OP-10 at a final concentration of 0.10 g·L⁻¹ (OP-10 system); (3) H₂SO₄ with Tween 80 at a final concentration of 0.10 g·L⁻¹ (Tween 80 system); and (4) H₂SO₄ with mixed OP-10/Tween 80 surfactants at a volume ratio of 3:1 and a final total surfactant concentration of 0.10 g·L⁻¹ (mixed-surfactant system). For the mixed-surfactant system, the mixed-surfactant solution and H₂SO₄ solution were added at a volume ratio of 1:4. For detailed solution preparation and concentration information, please refer to Table 4.
It should be noted that the kinetic experiments constituted a separate dataset conducted under experimental conditions different from those used in the preceding stirred-leaching experiments, particularly with respect to temperature and liquid-to-solid ratio. The kinetic experiments were performed at 20 °C and a liquid-to-solid ratio of 2.5 mL·g⁻¹, whereas the preceding stirred-leaching experiments were conducted at a liquid-to-solid ratio of 5.0 mL·g⁻¹ and were mainly discussed at 30 °C. Therefore, the kinetic dataset was used only for internal comparison among the four leaching systems under identical kinetic conditions, and the resulting kinetic parameters should not be directly compared with the recovery values obtained from the preceding stirred-leaching experiments. The temperature, final sulfuric acid concentration, final concentration of individual surfactant, and final concentration of mixed surfactant in this experiment were determined based on the surface tension test results presented in Section 3.2.
The experimental data were analyzed using the SCM expressions corresponding to film diffusion, product-layer diffusion, and interfacial chemical reaction [Equations (5)–(7)]. Figure 16 shows the variation in uranium recovery rate with leaching time under four different systems, whereas Figure 17, Figure 18 and Figure 19 show the corresponding linearized SCM fits. The apparent rate constants (k), their standard errors (SE), 95% confidence intervals (CI), and coefficients of determination (R2) are summarized in Table 5, Table 6 and Table 7. These models were used to compare the apparent kinetic behavior of the different leaching systems rather than to identify a unique rate-controlling mechanism solely on the basis of R2. The k values are shown for within-model comparison among leaching systems and should not be quantitatively compared across different SCM expressions.
Table 4.
Preparation of the four leaching systems for kinetic experiments.
| Experimental system | Surfactant solution or blank solvent (10 mL) | H2SO4 solution (40 mL) | Final H₂SO₄ concentration (g·L⁻¹) | Final surfactant concentration (g·L⁻¹) |
|---|---|---|---|---|
| H2SO4 system | deionized water | 25 g·L⁻¹ | 20 | 0 |
| OP-10 system | 0.50 g·L-1 OP-10 solution | 25 g·L⁻¹ | 20 | 0.1 |
| Tween 80 system | 0.50 g·L⁻¹ Tween 80 solution | 25 g·L⁻¹ | 20 | 0.1 |
| Mixed-surfactant system | OP-10 / Tween 80 mixed solution (total concentration: 0.50 g·L⁻¹; volume ratio: 3:1) | 25 g·L⁻¹ | 20 | 0.1 |
Figure 16.
Uranium recovery as a function of leaching time under four different stirred-leaching conditions. Data are presented as the mean ± standard deviation (SD) of three independent experiments (n = 3).(final H₂SO₄ concentration: 20 g·L⁻¹; 20 °C).
Figure 16.
Uranium recovery as a function of leaching time under four different stirred-leaching conditions. Data are presented as the mean ± standard deviation (SD) of three independent experiments (n = 3).(final H₂SO₄ concentration: 20 g·L⁻¹; 20 °C).
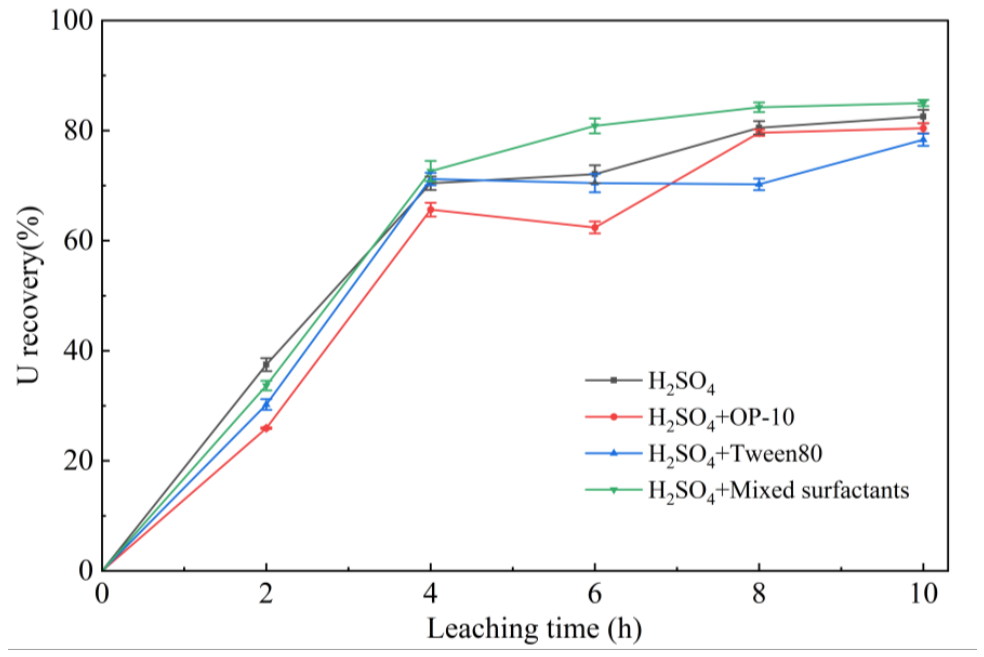
Figure 17.
Linearized fitting of the film-diffusion-controlled SCM for uranium leaching under different stirred-leaching conditions: (a) H₂SO₄ system; (b) OP-10 system; (c) Tween 80 system; and (d) mixed-surfactant system.
Figure 17.
Linearized fitting of the film-diffusion-controlled SCM for uranium leaching under different stirred-leaching conditions: (a) H₂SO₄ system; (b) OP-10 system; (c) Tween 80 system; and (d) mixed-surfactant system.
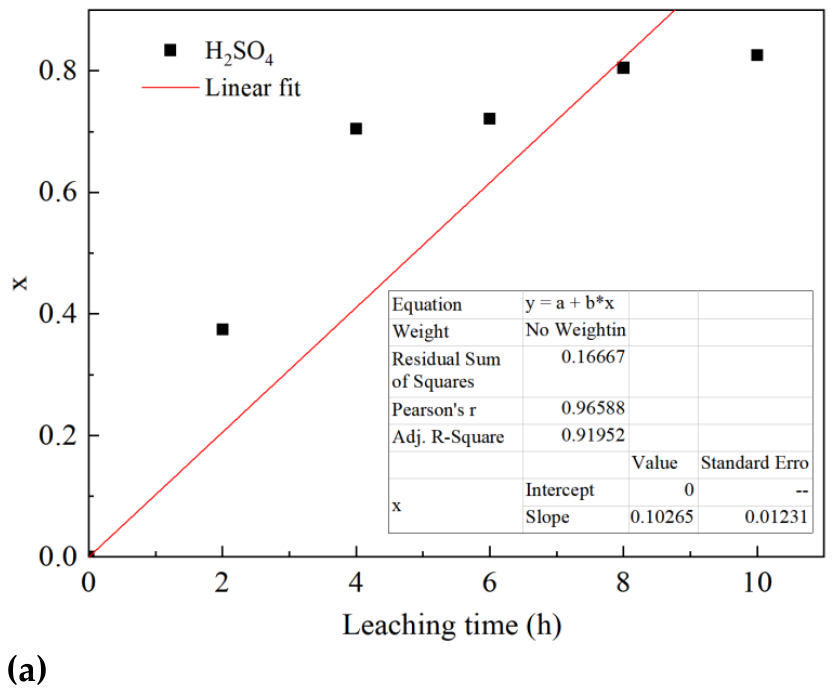
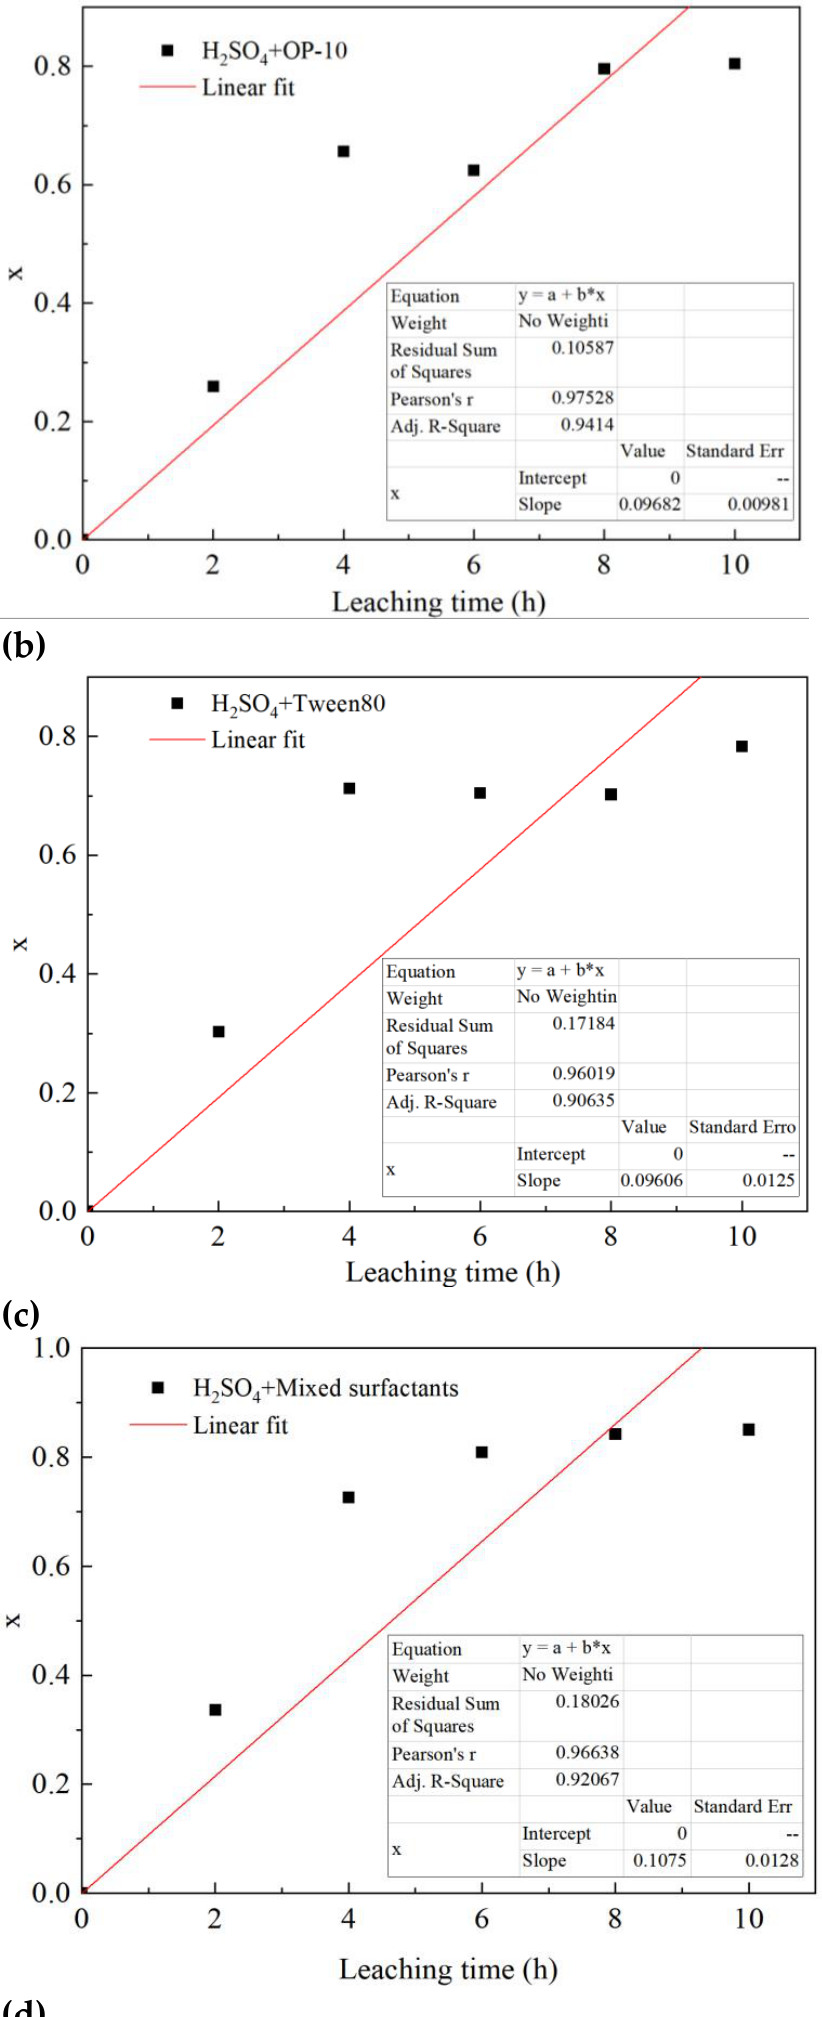
Figure 18.
Linearized fitting of the product-layer-diffusion-controlled SCM for uranium leaching under different stirred-leaching conditions: (a) H2SO4 system; (b) OP-10 system; (c) Tween 80 system; and (d) mixed-surfactant system. .
Figure 18.
Linearized fitting of the product-layer-diffusion-controlled SCM for uranium leaching under different stirred-leaching conditions: (a) H2SO4 system; (b) OP-10 system; (c) Tween 80 system; and (d) mixed-surfactant system. .
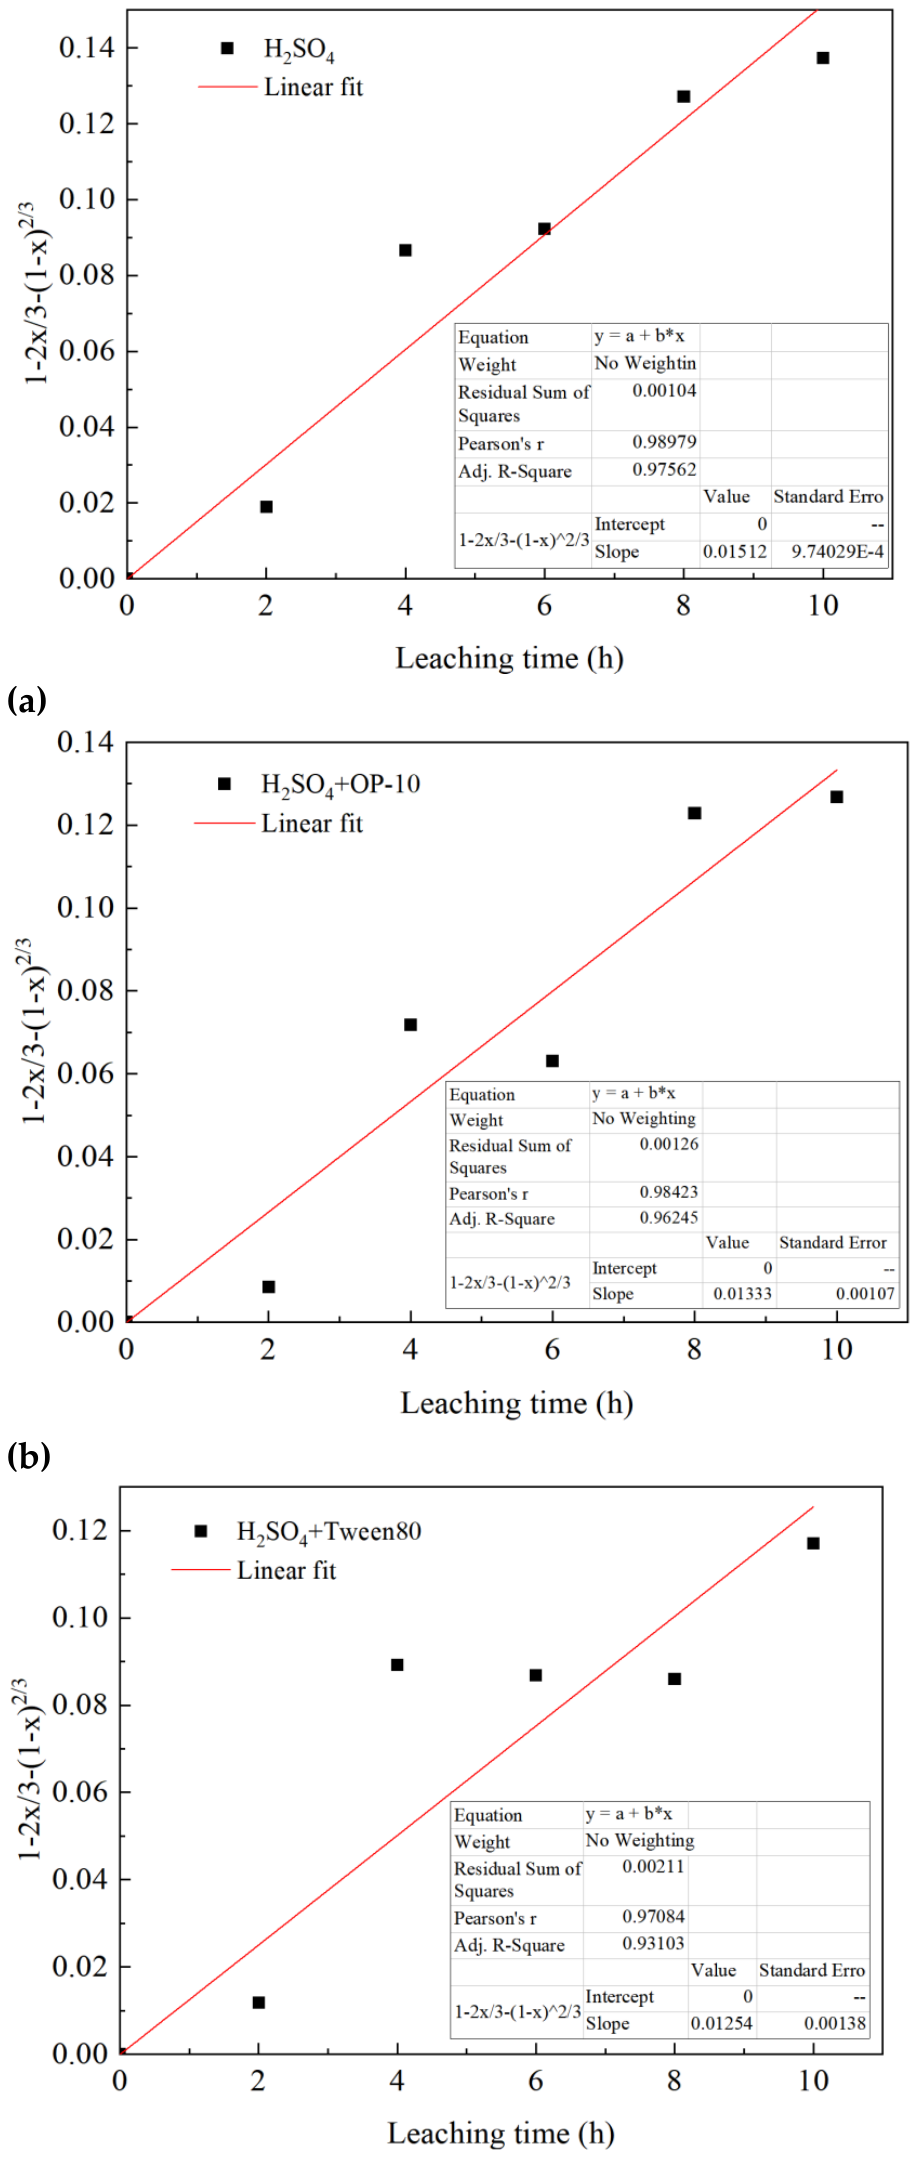
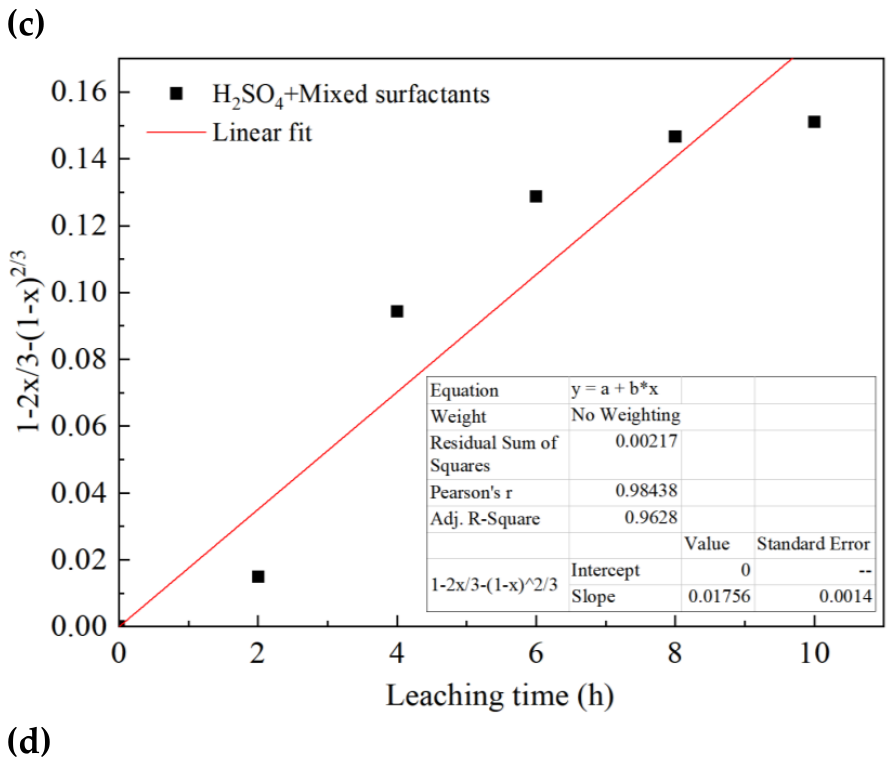
Figure 19.
Linearized fitting of the chemical-reaction-controlled SCM for uranium leaching under different stirred-leaching conditions: (a) H2SO4 system; (b) OP-10 system; (c) Tween 80 system; and (d) mixed-surfactant system. .
Figure 19.
Linearized fitting of the chemical-reaction-controlled SCM for uranium leaching under different stirred-leaching conditions: (a) H2SO4 system; (b) OP-10 system; (c) Tween 80 system; and (d) mixed-surfactant system. .
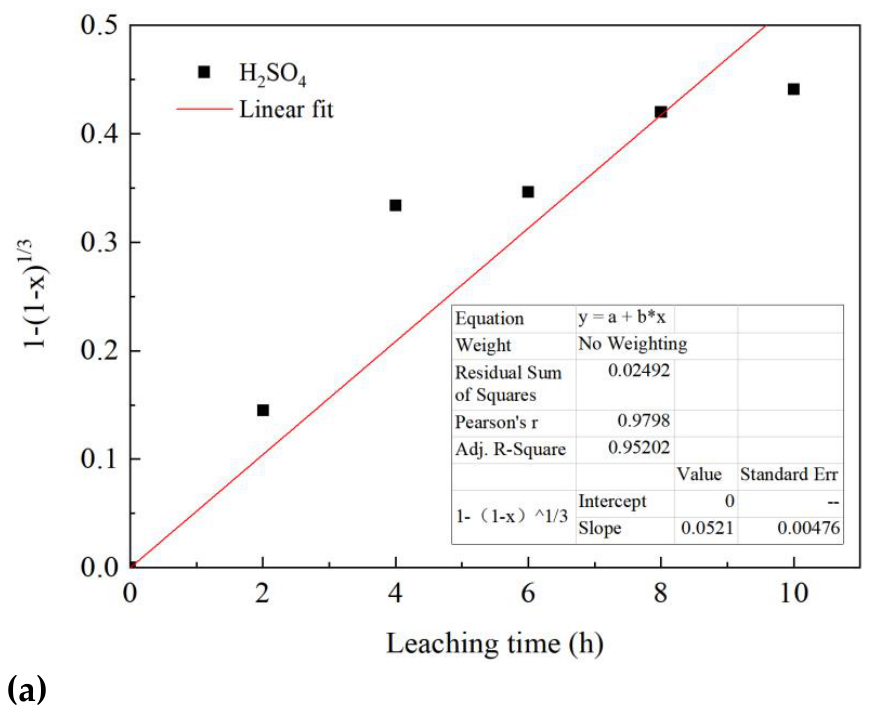
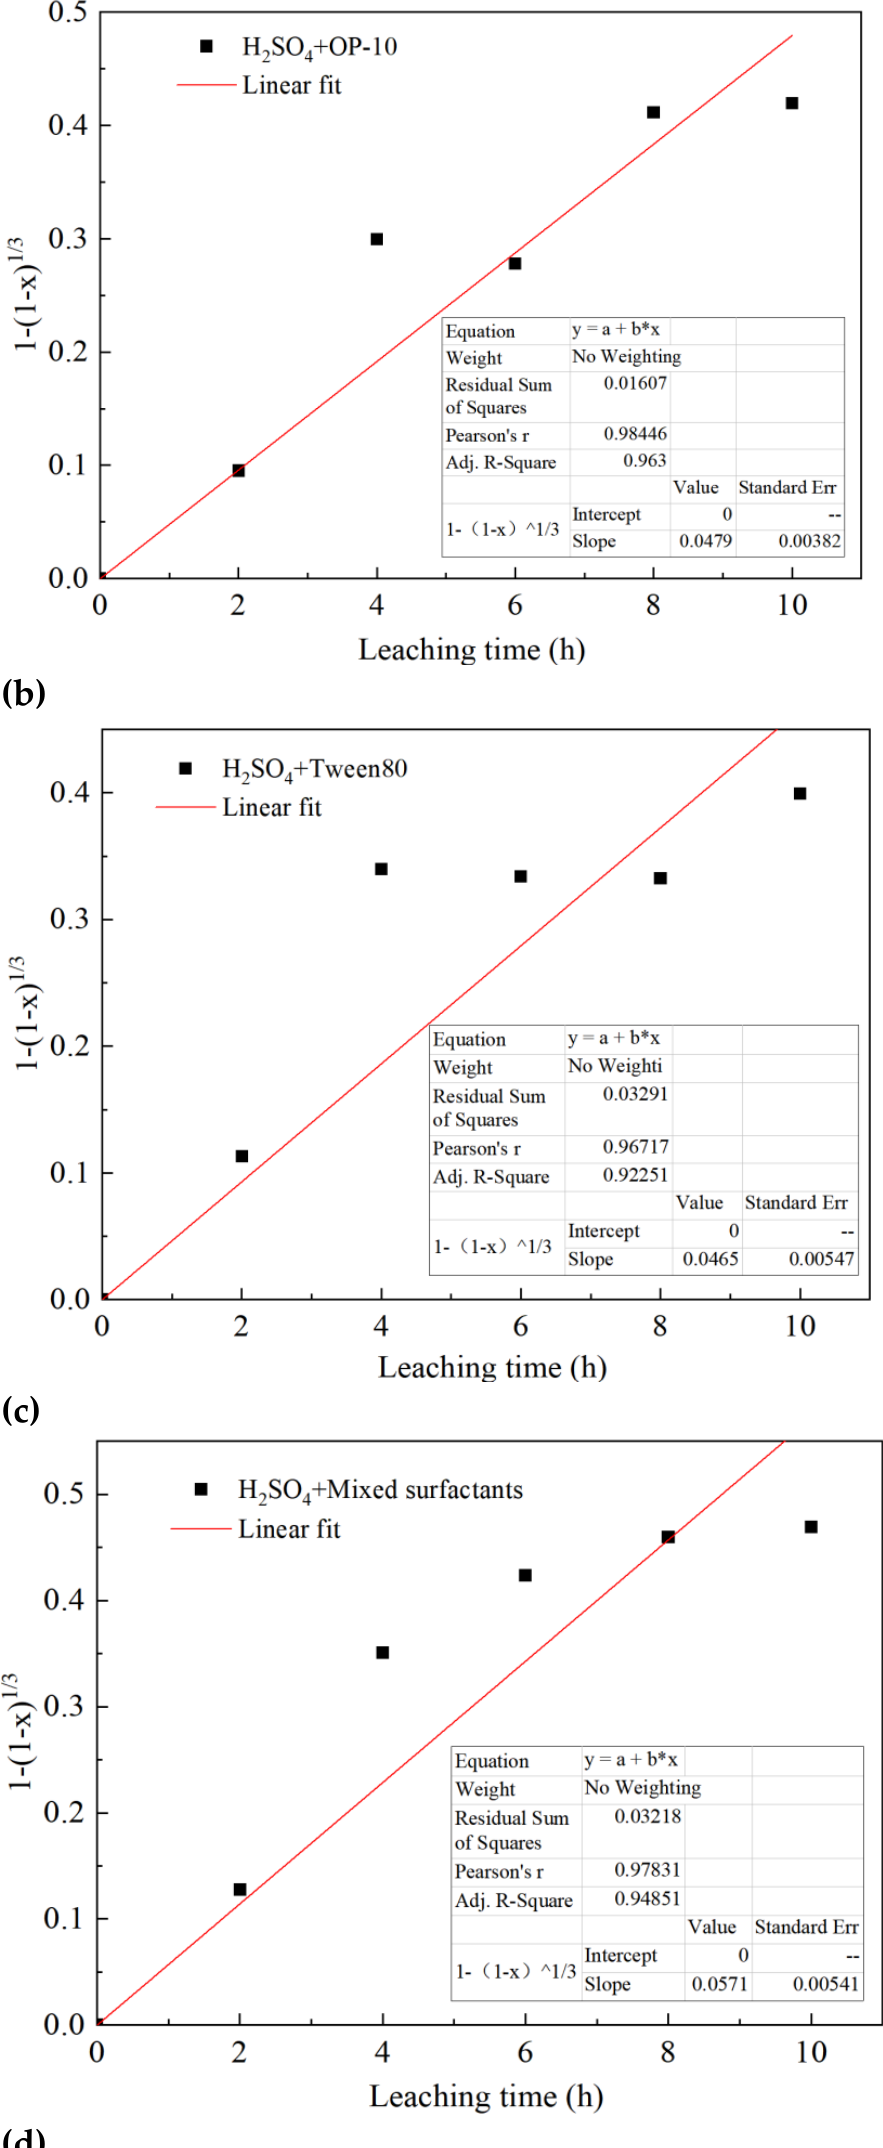
Table 5.
Apparent kinetic parameters obtained from the film-diffusion-controlled SCM under different stirred-leaching conditions.
Table 5.
Apparent kinetic parameters obtained from the film-diffusion-controlled SCM under different stirred-leaching conditions.
| Leaching conditions | H2SO4 | H2SO4 + OP-10 | H2SO4 + Tween 80 | H2SO4 + Mixed surfactants |
|---|---|---|---|---|
| k (h-1) | 0.10265 | 0.09682 | 0.09606 | 0.10759 |
| SE (h-1) | 0.01231 | 0.00981 | 0.01250 | 0.01280 |
| 95% CI (h-1) | 0.07101-0.13430 | 0.07160-0.12203 | 0.06393-0.12819 | 0.07468-0.14049 |
| R2 | 0.93293 | 0.95116 | 0.92196 | 0.93389 |
| Adjusted R2 | 0.91952 | 0.94140 | 0.90635 | 0.92067 |
| RMSE | 0.18258 | 0.13283 | 0.16923 | 0.17333 |
| RSS | 0.16667 | 0.10587 | 0.17184 | 0.18026 |
Table 6.
Apparent kinetic parameters obtained from the product-layer-diffusion-controlled SCM under different stirred-leaching conditions.
Table 6.
Apparent kinetic parameters obtained from the product-layer-diffusion-controlled SCM under different stirred-leaching conditions.
| Leaching conditions | H2SO4 | H2SO4 + OP-10 | H2SO4 + Tween 80 | H2SO4 + Mixed surfactants |
|---|---|---|---|---|
| k (h-1) | 0.01512 | 0.01333 | 0.01254 | 0.01756 |
| SE (h-1) | 0.00097 | 0.00107 | 0.00138 | 0.00140 |
| 95% CI (h-1) | 0.01262-0.01763 | 0.01057-0.01608 | 0.00898-0.01610 | 0.01395-0.02117 |
| R2 | 0.97968 | 0.96871 | 0.94253 | 0.96900 |
| Adjusted R2 | 0.97562 | 0.96245 | 0.93103 | 0.96280 |
| RMSE | 0.01317 | 0.01449 | 0.01875 | 0.01902 |
| RSS | 0.00104 | 0.00126 | 0.00211 | 0.00217 |
Table 7.
Apparent kinetic parameters obtained from the chemical-reaction-controlled SCM under different stirred-leaching conditions.
Table 7.
Apparent kinetic parameters obtained from the chemical-reaction-controlled SCM under different stirred-leaching conditions.
| Leaching conditions | H2SO4 | H2SO4 + OP-10 | H2SO4 + Tween 80 | H2SO4 + Mixed surfactants |
|---|---|---|---|---|
| k (h-1) | 0.05215 | 0.04792 | 0.04655 | 0.05712 |
| SE (h-1) | 0.00476 | 0.00382 | 0.00547 | 0.00541 |
| 95% CI (h-1) | 0.03992-0.06439 | 0.03810-0.05775 | 0.03249-0.06061 | 0.04322-0.07102 |
| R2 | 0.96001 | 0.96917 | 0.93542 | 0.95709 |
| Adjusted R2 | 0.95202 | 0.96300 | 0.92251 | 0.94851 |
| RMSE | 0.06445 | 0.05175 | 0.07406 | 0.07323 |
| RSS | 0.02492 | 0.01607 | 0.03291 | 0.03218 |
Note: For the chemical-reaction-controlled SCM, the apparent rate constant, k, was determined as the absolute value of the fitted slope.
- (2)
- First-Order Kinetic Model
First-order kinetic analysis was performed on the uranium leaching data obtained under the four experimental conditions. The corresponding linear fitting results are presented in Figure 20, and the fitted parameters are summarized in Table 8.
Figure 20.
Linearized fitting of the first-order kinetic model for uranium leaching under different stirred-leaching conditions: (a) H2SO4 system; (b) OP-10 system; (c) Tween 80 system; and (d) mixed-surfactant system. .
Figure 20.
Linearized fitting of the first-order kinetic model for uranium leaching under different stirred-leaching conditions: (a) H2SO4 system; (b) OP-10 system; (c) Tween 80 system; and (d) mixed-surfactant system. .
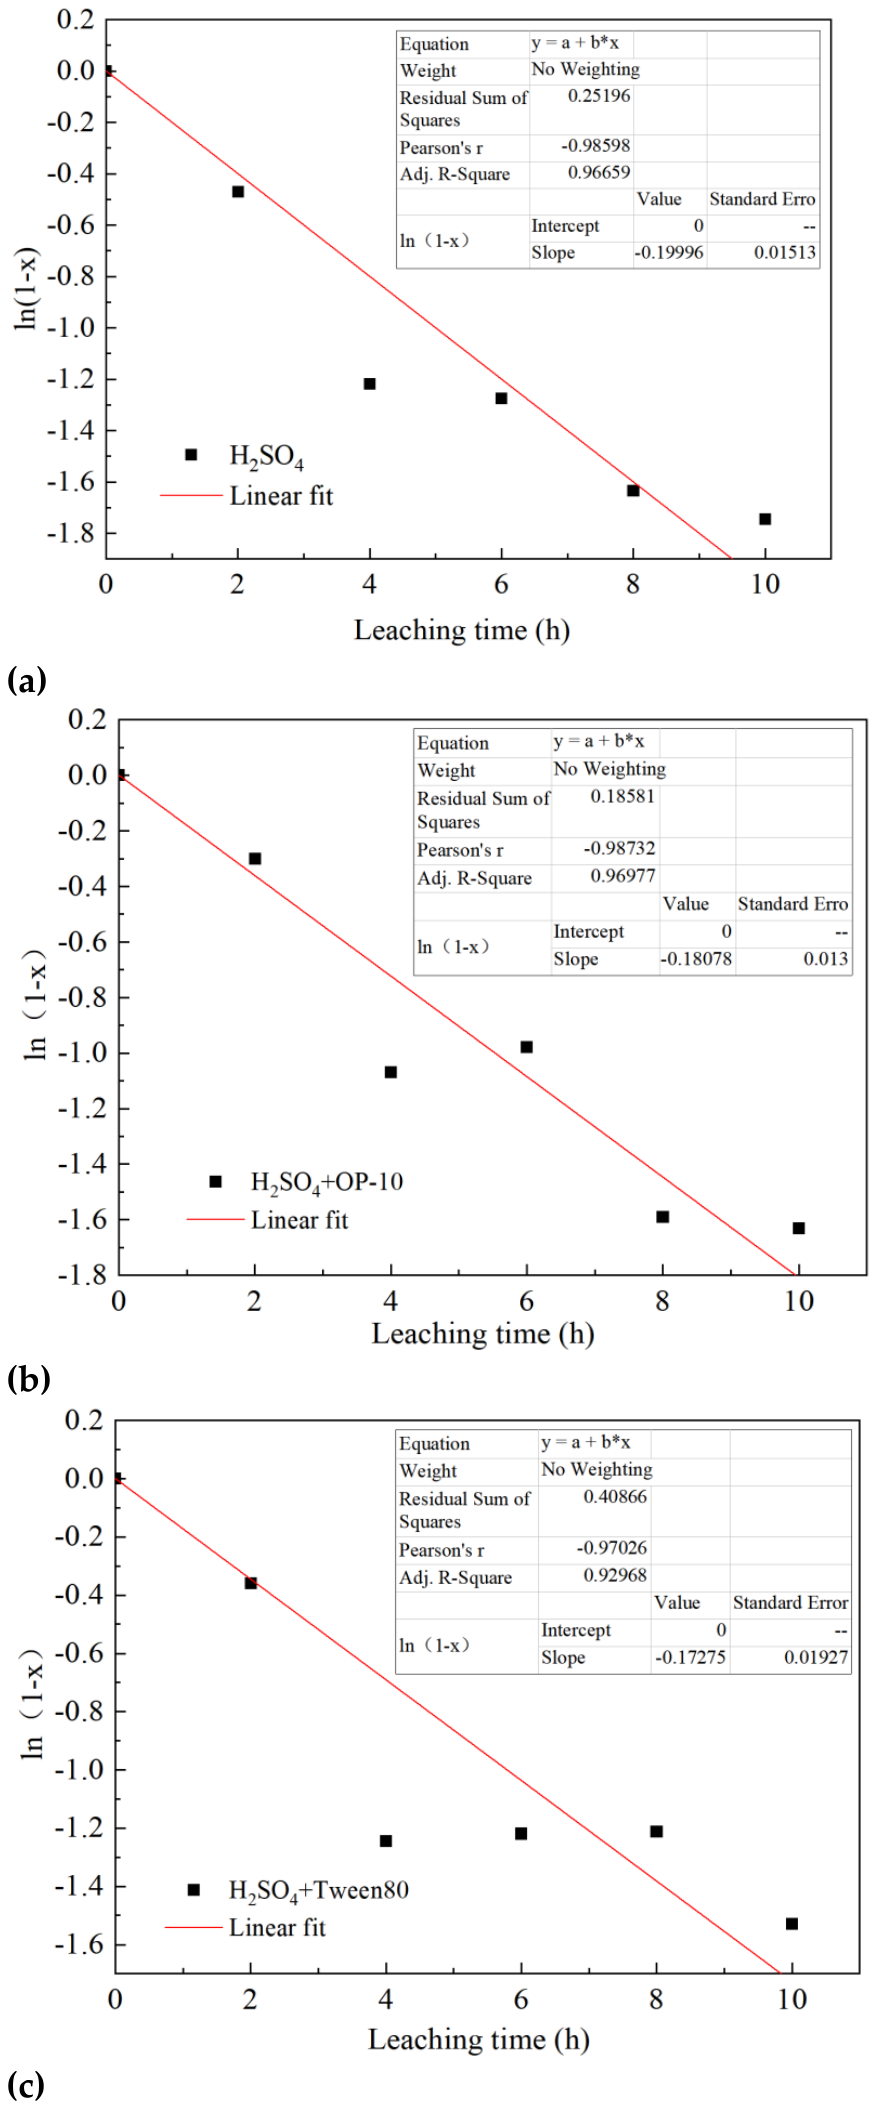
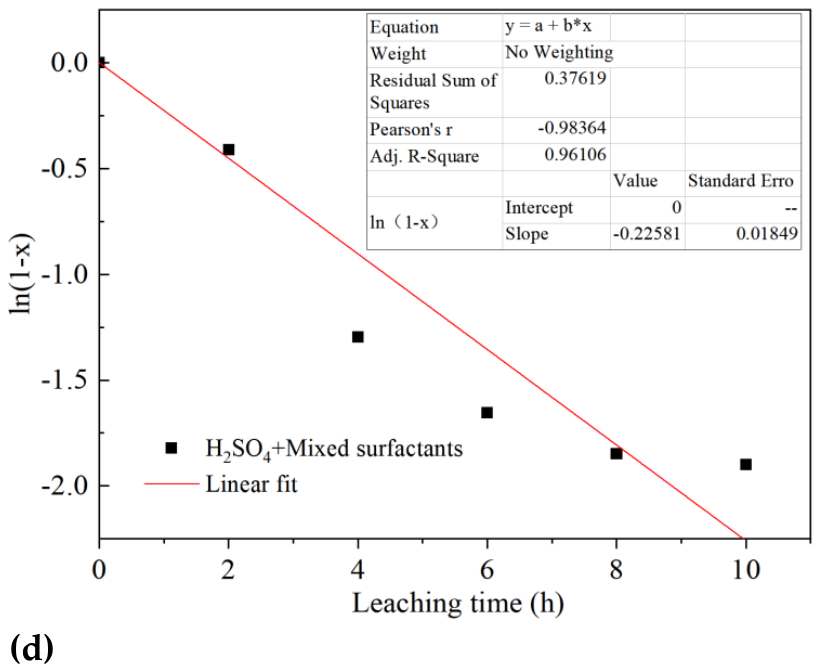
Table 8.
Apparent kinetic parameters obtained from the first-order kinetic model under different stirred-leaching conditions.
Table 8.
Apparent kinetic parameters obtained from the first-order kinetic model under different stirred-leaching conditions.
| Leaching conditions | H2SO4 | H2SO4 + OP-10 | H2SO4 + Tween 80 | H2SO4 + Mixed surfactants |
|---|---|---|---|---|
| k (h-1) | 0.19996 | 0.18078 | 0.17275 | 0.22581 |
| SE (h-1) | 0.01513 | 0.01300 | 0.01927 | 0.01849 |
| 95% CI (h-1) | 0.16106-0.23887 | 0.14737-0.21419 | 0.12320-0.22230 | 0.17827-0.27335 |
| R2 | 0.97216 | 0.97481 | 0.94140 | 0.96755 |
| Adjusted R2 | 0.96659 | 0.96977 | 0.92968 | 0.96106 |
| RMSE | 0.20492 | 0.17598 | 0.26098 | 0.25040 |
| RSS | 0.25196 | 0.17852 | 0.40866 | 0.37619 |
- (3)
- Pseudo-Second-Order Kinetic Model (PSO)
A pseudo-second-order (PSO) kinetic analysis was performed for the uranium leaching data obtained under the four conditions described above. The corresponding linear fits are shown in Figure 21, and the fitted parameters are summarized in Table 9.
Figure 21.
Linearized PSO kinetic fits for uranium leaching under different stirred-leaching conditions: (a) H2SO4 system; (b) OP-10 system; (c) Tween 80 system; (d) mixed-surfactant system.
Figure 21.
Linearized PSO kinetic fits for uranium leaching under different stirred-leaching conditions: (a) H2SO4 system; (b) OP-10 system; (c) Tween 80 system; (d) mixed-surfactant system.
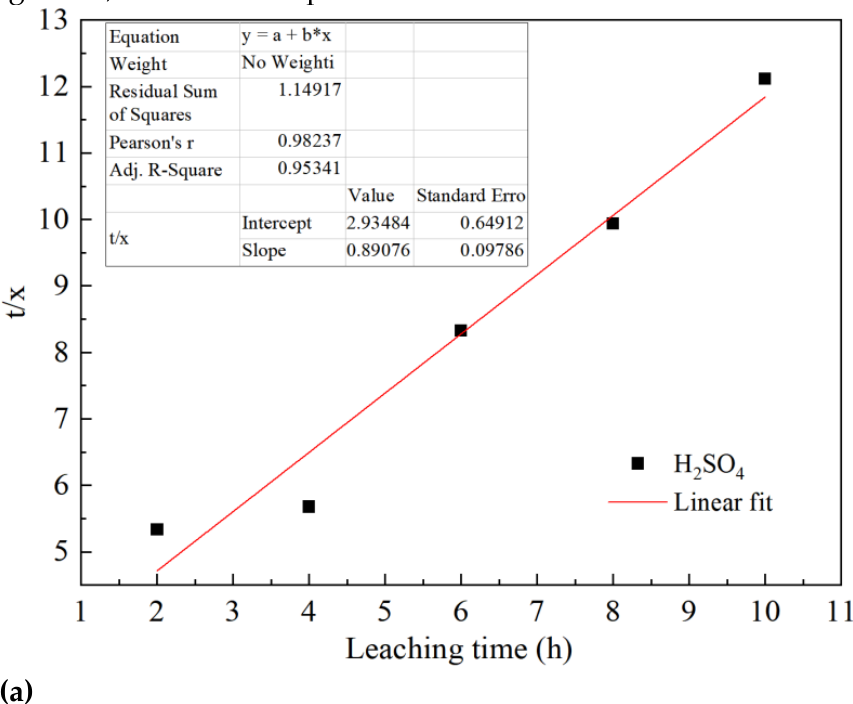
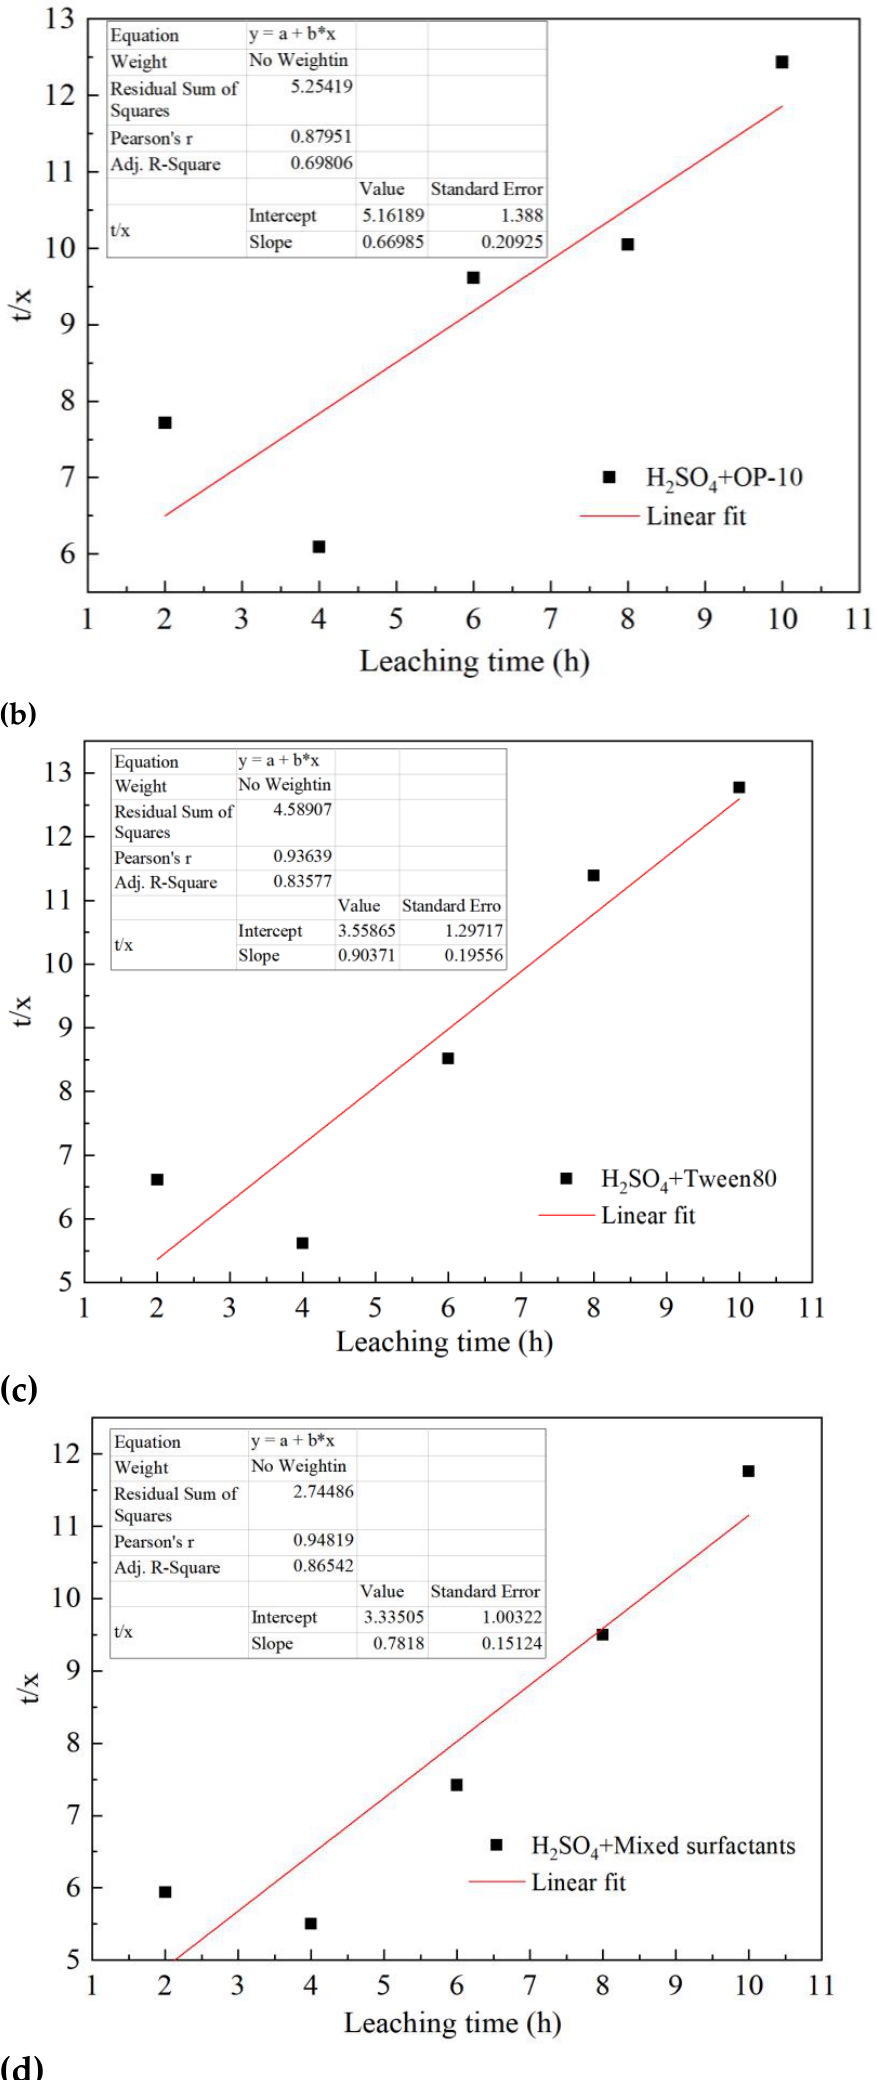
Table 9.
Apparent kinetic parameters obtained from the PSO model under different stirred-leaching conditions.
Table 9.
Apparent kinetic parameters obtained from the PSO model under different stirred-leaching conditions.
| Leaching conditions | H2SO4 | H2SO4 + OP-10 | H2SO4 + Tween 80 | H2SO4 + Mixed surfactants |
|---|---|---|---|---|
| Intercept (a) | 2.93484 | 5.16189 | 3.55865 | 3.33505 |
| Slope (b) | 0.89076 | 0.66985 | 0.90371 | 0.78180 |
| Model-derived xe | 1.12263 | 1.49288 | 1.10656 | 1.27909 |
| k2 (h-1) | 0.27036 | 0.08692 | 0.22949 | 0.18327 |
| SE of k2 | 0.11632 | 0.07610 | 0.17859 | 0.12304 |
| 95% CI of k2 | -0.09983-0.64054 | -0.15528-0.32912 | -0.33885-0.79784 | -0.20830-0.57484 |
| R2 | 0.96506 | 0.77354 | 0.87682 | 0.89906 |
| Adjusted R2 | 0.95341 | 0.69806 | 0.83577 | 0.86542 |
| RMSE | 0.61891 | 1.32341 | 1.23681 | 0.95654 |
| RSS | 1.14917 | 5.25419 | 4.58907 | 2.74486 |
Note: The fitted xₑ values exceed unity and are therefore reported only as model-derived extrapolated parameters without direct physical interpretation as equilibrium uranium recoveries.
The uranium recovery increased rapidly during the first 4 h of stirred leaching and subsequently increased more slowly. After 10 h, the mixed-surfactant system achieved a uranium recovery of approximately 85.0%, compared with approximately 82.5% for the H₂SO₄ system, 80.4% for the OP-10 system, and 78.3% for the Tween 80 system. These results indicate that the mixed-surfactant formulation provided a modest improvement in the final uranium recovery, whereas the individual addition of OP-10 or Tween 80 did not improve the final recovery relative to H₂SO₄ alone.
The kinetic parameters showed a consistent trend across the three shrinking core model (SCM) expressions and the first-order model. The mixed-surfactant system exhibited the highest apparent rate constants among the four stirred-leaching systems. For example, the apparent rate constant obtained from the first-order model increased from 0.19996 h⁻¹ for H₂SO₄ alone to 0.22581 h⁻¹ for the mixed-surfactant system. Similarly, the apparent rate constants derived from the film-diffusion, product-layer-diffusion, and chemical-reaction expressions increased from 0.10265, 0.01512, and 0.05215 h⁻¹ to 0.10759, 0.01756, and 0.05712 h⁻¹, respectively. In contrast, the individual addition of either surfactant resulted in lower apparent rate constants than those obtained with H₂SO₄ alone.
Although the SCM and first-order models generally provided satisfactory linearized fits, the fitting statistics should be interpreted in the context of the different mathematical forms of the models. The PSO model yielded R2 values ranging from 0.77354 to 0.96506, while the model-derived asymptotic fractional recoveries exceeded unity for all four systems. These extrapolated values cannot be interpreted as physically attainable ultimate uranium recoveries. Overall, the mixed OP-10/Tween 80 system exhibited higher apparent rate constants than the H₂SO₄ system within the three SCM expressions and the first-order model, whereas the individual surfactants did not show a consistent kinetic improvement. The SCM fitting results suggest contributions from both reaction- and diffusion-related processes.
3.5.2. Kinetic Analysis of Column Leaching
Figure 22.
First-order kinetic model fitting of uranium column leaching under different leaching conditions: (a) Nonlinear fitting of cumulative uranium recovery as a function of leaching time; (b) Linearized plots of ln(1 − x) versus leaching time.
Figure 22.
First-order kinetic model fitting of uranium column leaching under different leaching conditions: (a) Nonlinear fitting of cumulative uranium recovery as a function of leaching time; (b) Linearized plots of ln(1 − x) versus leaching time.
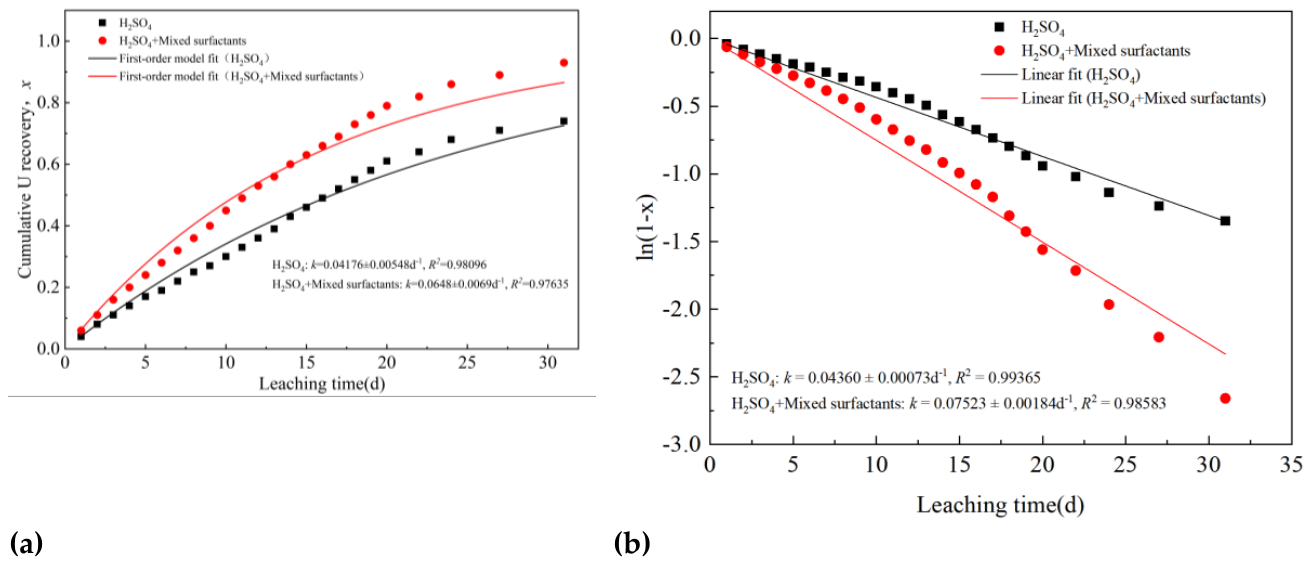
Figure 23.
Linearized fitting of the shrinking core model (SCM) expressions for uranium column leaching: (a) H₂SO₄ system and (b) mixed-surfactant system.
Figure 23.
Linearized fitting of the shrinking core model (SCM) expressions for uranium column leaching: (a) H₂SO₄ system and (b) mixed-surfactant system.
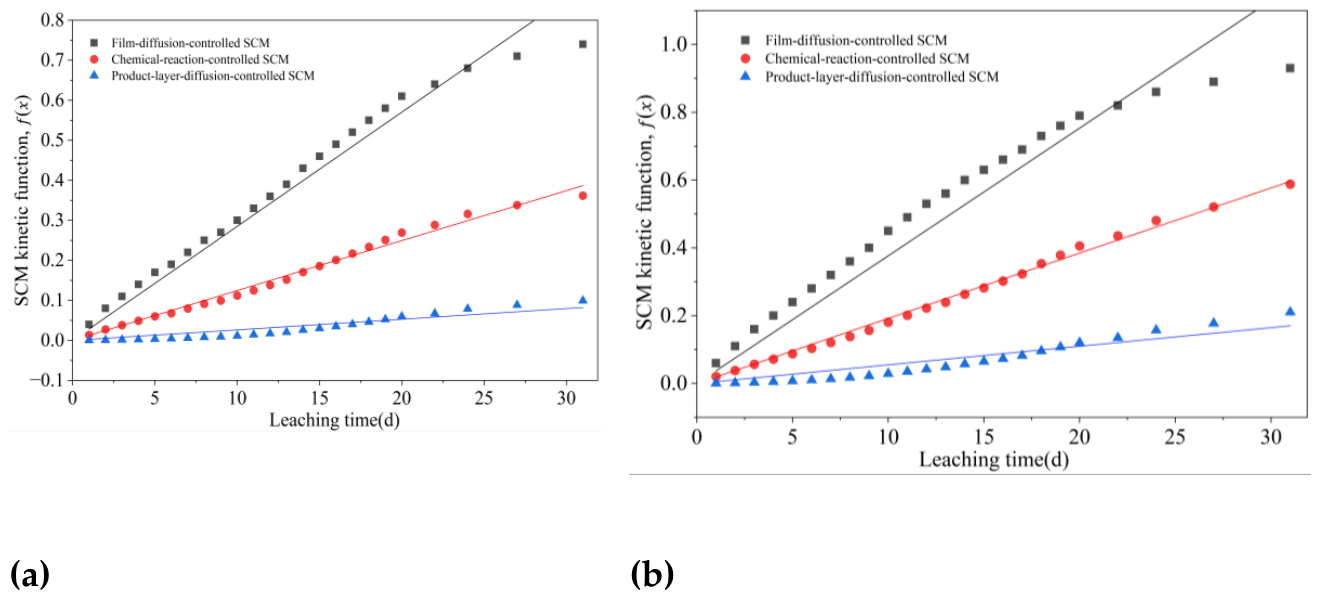
Figure 24.
Linearized PSO kinetic fits for uranium column leaching under different leaching conditions.
Figure 24.
Linearized PSO kinetic fits for uranium column leaching under different leaching conditions.
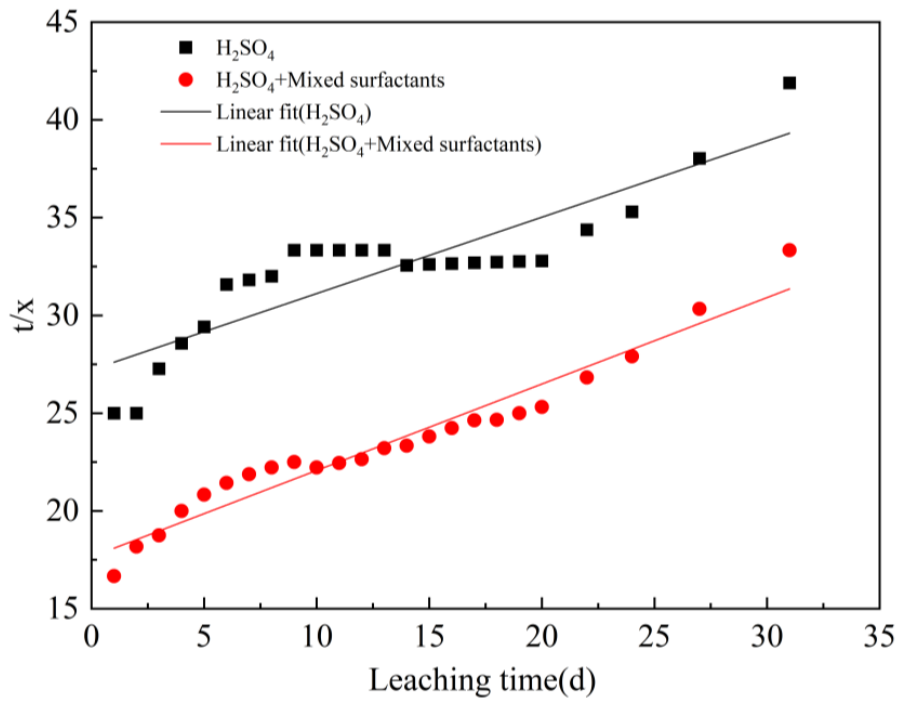
Table 10.
Apparent kinetic parameters obtained from nonlinear first-order model fitting of column leaching data under different leaching conditions.
Table 10.
Apparent kinetic parameters obtained from nonlinear first-order model fitting of column leaching data under different leaching conditions.
| Leaching conditions | H2SO4 | H2SO4 + Mixed surfactants |
|---|---|---|
| k (d-1) | 0.04176 | 0.06480 |
| SE (d-1) | 0.00548 | 0.00690 |
| 95% CI (d-1) | 0.03040-0.05312 | 0.05049-0.07911 |
| R2 | 0.98096 | 0.97635 |
| Adjusted R2 | 0.98009 | 0.97528 |
| RMSE | 0.02870 | 0.03955 |
| RSS | 0.01977 | 0.03754 |
Note: Each leaching condition was evaluated using one independent column (n = 1 per condition). The reported standard errors and 95% confidence intervals reflect model-based uncertainty in the fitted parameters derived from the time-series data of each individual column and do not quantify between-column experimental variability. Therefore, these estimates should not be interpreted as evidence of statistically significant differences between leaching treatments.
Table 11.
Apparent kinetic parameters obtained from linearized first-order model fitting of column leaching data under different leaching conditions.
Table 11.
Apparent kinetic parameters obtained from linearized first-order model fitting of column leaching data under different leaching conditions.
| Leaching conditions | H2SO4 | H2SO4 + Mixed surfactants |
|---|---|---|
| k (d-1) | 0.04360 | 0.07523 |
| SE (d-1) | 0.00073 | 0.00184 |
| 95% CI (d-1) | 0.04210-0.04510 | 0.07142-0.07904 |
| R2 | 0.99365 | 0.98642 |
| Adjusted R2 | 0.99337 | 0.98583 |
| RMSE | 0.05335 | 0.13505 |
| RSS | 0.06831 | 0.43775 |
Note: Each leaching condition was evaluated using one independent column (n = 1 per condition). The reported standard errors and 95% confidence intervals reflect model-based uncertainty in the fitted parameters derived from the time-series data of each individual column and do not quantify between-column experimental variability. Therefore, these estimates should not be interpreted as evidence of statistically significant differences between leaching treatments.
A comparison of the linearized and nonlinear first-order fitting results (Table 10 and Table 11) shows that the estimated apparent rate constants were generally consistent in magnitude but differed depending on the fitting approach. For the H₂SO₄-only column, the rate constants obtained from nonlinear and linearized fitting were 0.04176 and 0.04360 d⁻¹, respectively. For the mixed-surfactant column, the corresponding values were 0.06480 and 0.07523 d⁻¹. The differences may be attributed to the mathematical transformation and regression procedures. Nonlinear fitting directly minimizes the residuals between the measured and predicted fractional uranium recoveries on the original response scale. In contrast, linearized fitting involves logarithmic transformation, which changes the residual distribution and the relative weighting of data points, particularly at higher uranium recoveries. Therefore, the two approaches may yield different parameter estimates. In this study, nonlinear fitting was selected as the primary approach because it evaluates model agreement directly against the experimentally measured recovery data without logarithmic transformation. The linearized results are presented as a complementary comparison rather than as independent experimental evidence. Accordingly, the nonlinear fitting constants are reported in the Abstract and used for the principal interpretation of the column-leaching kinetics.
Table 12.
Apparent kinetic parameters obtained from SCM fitting of uranium column-leaching data under different leaching conditions.
Table 12.
Apparent kinetic parameters obtained from SCM fitting of uranium column-leaching data under different leaching conditions.
| Leaching conditions | H2SO4 | H2SO4 + Mixed surfactants | ||||
|---|---|---|---|---|---|---|
| Film-diffusion-controlled | Product-layer-diffusion-controlled | Chemical-reaction-controlled | Film-diffusion-controlled | Product-layer-diffusion-controlled | Chemical-reaction-controlled | |
| k (d-1) | 0.02852 | 0.01248 | 0.00265 | 0.03768 | 0.01923 | 0.00549 |
| SE (d-1) | 0.00054 | 0.00014 | 0.00015 | 0.00104 | 0.00014 | 0.00028 |
| 95% CI (d-1) | 0.02739-0.02965 | 0.01218-0.01278 | 0.00234-0.00297 | 0.03552-0.03983 | 0.01893-0.01954 | 0.00490-0.00608 |
| R2 | 0.99164 | 0.99690 | 0.92973 | 0.98272 | 0.99867 | 0.94179 |
| Adjusted R2 | 0.99128 | 0.99676 | 0.92667 | 0.98197 | 0.99861 | 0.93926 |
| RMSE | 0.04007 | 0.01065 | 0.01116 | 0.07646 | 0.01074 | 0.02090 |
| RSS | 0.03854 | 0.00272 | 0.00299 | 0.14030 | 0.00277 | 0.01048 |
Note: Each leaching condition was evaluated using one independent column (n = 1 per condition). The reported standard errors and 95% confidence intervals reflect model-based uncertainty in the fitted parameters derived from the time-series data of each individual column and do not quantify between-column experimental variability. Therefore, these estimates should not be interpreted as evidence of statistically significant differences between leaching treatments.
Table 13.
Apparent kinetic parameters obtained from PSO fitting of uranium column-leaching data under different leaching conditions.
Table 13.
Apparent kinetic parameters obtained from PSO fitting of uranium column-leaching data under different leaching conditions.
| Leaching conditions | H2SO4 | H2SO4 + Mixed surfactants |
|---|---|---|
| Intercept (a) | 27.21337 | 17.64947 |
| Slope (b) | 0.39036 | 0.44204 |
| Model-derived xe | 2.56174 | 2.26224 |
| k2(d-1) | 0.0056 | 0.01107 |
| SE of k2 | 0.00143 | 0.00133 |
| 95% CI of k2 | 0.00263–0.00857 | 0.00830–0.01384 |
| R2 | 0.76939 | 0.94467 |
| Adjusted R2 | 0.7589 | 0.94215 |
| RMSE | 1.69622 | 0.84912 |
| RSS | 69.05155 | 17.30395 |
Note: The fitted xₑ values exceed unity and are therefore reported only as model-derived extrapolated parameters without direct physical interpretation as equilibrium uranium recoveries.
Each leaching condition was evaluated using one independent column (n = 1 per condition). The reported standard errors and 95% confidence intervals reflect model-based uncertainty in the fitted parameters derived from the time-series data of each individual column and do not quantify between-column experimental variability. Therefore, these estimates should not be interpreted as evidence of statistically significant differences between leaching treatments.
The mixed-surfactant system exhibited higher cumulative uranium recovery than the H₂SO₄-only system throughout most of the column-leaching period. At approximately 30 days, uranium recovery reached about 90% with the mixed surfactants, compared with approximately 73% with H₂SO₄ alone. This difference demonstrates a more pronounced improvement in uranium extraction than that observed in the stirred-leaching experiments.
For the two individual columns, nonlinear first-order fitting yielded apparent rate constants of 0.04176 d⁻¹ for the H₂SO₄-only column and 0.06480 d⁻¹ for the mixed-surfactant column. The latter fitted value was approximately 55% higher than the former. Similar descriptive differences were observed in the SCM fitting results: the apparent rate constants obtained using the film-diffusion, product-layer-diffusion, and chemical-reaction expressions were 0.02852, 0.01248, and 0.00265 d⁻¹, respectively, for the H₂SO₄-only column, compared with 0.03768, 0.01923, and 0.00549 d⁻¹ for the mixed-surfactant column. These values describe differences between the fitted kinetic parameters of the two individual columns.
The three SCM expressions were used to examine the possible contributions of different rate-limiting processes to uranium leaching. The film-diffusion model describes mass transfer across the external liquid film surrounding the ore particles, whereas the product-layer-diffusion model represents diffusion through the reacted solid layer. The chemical-reaction-controlled model describes the interfacial reaction between the unreacted core and the leaching solution. Among these expressions, the product-layer-diffusion model yielded the highest linearized R² values for both the H₂SO₄-only and mixed-surfactant columns (0.99690 and 0.99867, respectively), indicating a good description of the observed recovery trends. However, because the SCM expressions involve different mathematical transformations, their R² values cannot be directly compared to identify the dominant rate-controlling step. Furthermore, the heterogeneous mineral composition and complex pore structure of the ore may involve multiple transport and reaction processes. Fitting results indicate that diffusion through the product layer may play a certain role.
For the two individual columns, the PSO model yielded fitted apparent rate constants of 0.00560 d⁻¹ for the H₂SO₄-only column and 0.01107 d⁻¹ for the mixed-surfactant column. The corresponding R² values were 0.76939 and 0.94467, respectively, indicating closer agreement between the PSO model and the observed data for the mixed-surfactant column. However, the model-derived asymptotic fractional recoveries exceeded unity in both cases and should therefore be treated as extrapolated fitting parameters rather than physically meaningful ultimate uranium recoveries.
Overall, the mixed-surfactant column exhibited higher cumulative uranium recovery and larger fitted apparent rate constants than the H₂SO₄-only column across the kinetic models examined. The observed recovery difference between the two columns was larger than that observed between the corresponding systems in the stirred-leaching experiments. However, because only one independent column was tested under each condition, these comparisons are descriptive and cannot establish statistically significant treatment differences or quantify between-column variability. Furthermore, the kinetic fitting results do not uniquely identify a rate-controlling mechanism.
4. Conclusions
This study investigated the effects of a mixed OP-10/Tween 80 nonionic surfactant system on sulfuric acid leaching of granite-hosted uranium ore. By combining mineralogical characterization, interfacial measurements, stirred-leaching and column-leaching experiments, and kinetic analysis, the study provides insights into the potential application of mixed surfactants in uranium extraction from complex hard-rock ores. The main findings are as follows.
(1) The ore was dominated by quartz, feldspar, and other aluminosilicate minerals, with a heterogeneous pore structure spanning mesopore-scale to macropore-scale features and associated microfractures. These mineralogical and structural characteristics provide a basis for understanding the accessibility of leaching solutions and the observed uranium recovery behavior.
(2) OP-10 exhibited a greater surface-tension-reducing ability than Tween 80 under the investigated conditions. An OP-10/Tween 80 volume ratio of 3:1 was selected based on its relatively favorable surface-tension response, reaching approximately 57.7 mN·m⁻¹ at a total surfactant concentration of 0.10 g·L⁻¹. However, the mixture did not produce the lowest surface tension at all concentrations, and the measurements do not establish synergistic interactions between the two surfactants.
(3) In the stirred-leaching factor tests conducted at 30 °C, a liquid-to-solid ratio of 5.0 mL·g⁻¹, and 20 g·L⁻¹ H₂SO₄, the 10 h uranium recovery increased from 72.4% in the H₂SO₄ system to 84.0% with OP-10 and 87.8% with the mixed-surfactant system. In a separate set of kinetic experiments conducted at 20 °C and a liquid-to-solid ratio of 2.5 mL·g⁻¹, the corresponding 10 h recoveries were approximately 82.5%, 80.4%, 78.3%, and 85.0% for the H₂SO₄, OP-10, Tween 80, and mixed-surfactant systems, respectively. The mixed-surfactant system exhibited the highest apparent rate constants among the tested systems in the first-order and SCM models, whereas the individual surfactants did not show consistent kinetic improvements over H₂SO₄ alone. These results indicate that the leaching response depends on both surfactant formulation and experimental conditions. The kinetic parameters characterize apparent leaching behavior but do not establish changes in the underlying reaction mechanism or uniquely identify the rate-controlling step.
(4) After 31 d of column leaching, the cumulative uranium recoveries were 74.0% for the H₂SO₄-only column and 92.6% for the mixed-surfactant column. The mixed-surfactant column also exhibited a higher apparent first-order rate constant (0.06480 d⁻¹) than the H₂SO₄-only column (0.04176 d⁻¹). However, because only one independent column was tested per condition, these differences represent descriptive observations and cannot establish statistically significant treatment effects or experimental reproducibility. Future studies should combine replicated and larger-scale column tests with systematic investigations of particle size, surfactant concentration, and OP-10/Tween 80 ratio. Direct interfacial characterization, pore-structure analysis, and three-dimensional imaging are also needed to clarify surfactant–mineral interactions and pore-scale mass-transfer behavior. Such investigations would help establish quantitative relationships among interfacial properties, pore evolution, and leaching kinetics, providing a stronger scientific basis for optimizing surfactant-assisted uranium extraction from complex hard-rock ores.
Author Contributions
Conceptualization, H.L.; data curation, H.Q.; funding acquisition, H.L. and H.Q.; investigation, H.Q., L.L., L.K., Q.F. and Z.C.; methodology, H.Q.; resources, Z.L.; supervision, L.L.; validation, H.Q.; visualization, H.L.; writing—original draft, H.Q.; writing—review and editing, H.L. All authors have read and agreed to the published version of the manuscript.
Funding
This research was funded by the Guangdong Provincial College Students' Innovation and Entrepreneurship Training Program (grant number S202410576046), the Shaoguan University Research Project (grant number SY2023KJ13), and the Shaoguan University Startup Fund for Introduced Talents (grant number 408-99000629).
Institutional Review Board Statement
Not applicable.
Informed Consent Statement
Not applicable.
Data Availability Statement
The data presented in this study are available within the article.
Acknowledgments
The authors gratefully acknowledge the support provided by Shaoguan Jinyuan Uranium Industry Co., Ltd., CNNC, during the preparation of this manuscript.
Conflicts of Interest
Zaidao Liu is affiliated with Guangdong Mining Co., Ltd., CNNC. The company did not provide funding or financial support for this study and had no role in the design of the study; the collection, analysis, or interpretation of data; the writing of the manuscript; or the decision to publish the results.
References
- Zhang, Z.; Li, J.; Li, H.; Guo, J.; Chen, Y.; Su, X.; Hua, R. Research on conventional leaching process and leaching kinetics of a hard rock uranium mine. J. Radioanal. Nucl. Chem. 2023, 332, 4929–4942. [Google Scholar] [CrossRef]
- Zeng, S.; Li, J.; Tan, K.; Zhang, S. Fractal kinetic characteristics of hard-rock uranium leaching with sulfuric acid. R. Soc. Open Sci. 2018, 5, 180403. [Google Scholar] [CrossRef] [PubMed]
- Wang, J.; Sun, Z.; Li, G.; Liu, Y.; Zhou, Z.; Wang, X.; Zheng, Z.; Zhou, Y.; Zhao, K.; Xiang, L.; Wei, J. Geochemistry and acid hydrometallurgy accessibility of uraninite from Mianhuakeng granite-hosted uranium deposit, South China. Minerals 2020, 10, 747. [Google Scholar] [CrossRef]
- Wang, S.; Lian, M.; Ding, D.; He, G.; Fu, H. Evolution of pore structure and reactive transport parameters during acid leaching of sandstone uranium ore. Hydrometallurgy 2024, 226, 106301. [Google Scholar] [CrossRef]
- Qi, Z.; Li, J.; Zhong, F.; Wang, L.; Xue, Q. Synergistic control of particle size and fractal dimension of granite-hosted uranium ores for leaching efficiency optimization. Miner. Eng. 2026, 237, 109967. [Google Scholar] [CrossRef]
- Zeng, S.; Shen, Y.; Sun, B.; Zhang, N.; Zhang, S.; Feng, S. Pore structure evolution characteristics of sandstone uranium ore during acid leaching. Nucl. Eng. Technol. 2021, 53, 4033–4041. [Google Scholar] [CrossRef]
- Liu, X.F.; Liu, J.H.; He, T.; Yang, Y.H.; Xing, Y.G.; Wang, R.Y.; Liang, D.Y.; Yan, X.R.; Huang, J. Spatiotemporal evolution of ore-bearing aquifer permeability during acid in-situ uranium leaching. Nonferrous Met. Extr. Metall. 2025, 5, 78–88. Available online: https://link.cnki.net/doi/10.20237/j.issn.1007-7545.2025.05.010.
- Zhou, X.; Sun, J.; Li, Q.; Li, G.; Li, S.; Xiao, L.; Shu, H.; Fu, H.; Li, T.; Wang, Y.; Cui, Z.; Xie, G. Time-dependent citrate-mediated precipitation inhibition in uranium column leaching: Mechanistic insights into pore evolution and uranium migration. J. Hazard. Mater. 2026, 514, 142812. [Google Scholar] [CrossRef] [PubMed]
- Zhao, L.; Deng, J.; Xu, Y.; Zhang, C. Mineral alteration and pore-plugging caused by acid in situ leaching: A case study of the Wuyier uranium deposit, Xinjiang, NW China. Arab. J. Geosci. 2018, 11, 707. [Google Scholar] [CrossRef]
- Liu, Y.; Liu, J.; Yang, Y.; Wang, J.; Zhou, Y.; Wei, M.; Zheng, W. Leaching and kinetics characteristics of uranium from Hadatu uranium ore in Inner Mongolia by acid method. Nonferrous Met. Extr. Metall. 2025, 2, 217–228. Available online: https://link.cnki.net/doi/10.20237/j.issn.1007-7545.2025.02.024.
- Li, T.; Li, G.; Liu, X.; Sun, J.; Li, Q.; Cui, Z. Enhanced oxidative sulfuric acid leaching of granite-type uranium ore by oxygen nanobubbles: Kinetics and mechanism. Nucl. Eng. Technol. 2025, 57, 103608. [Google Scholar] [CrossRef]
- Ai, C.; Wang, S.; Liu, C.; Li, T. Experimental study on the influence of surfactants on ore surface wettability. ACS Omega 2024, 9, 1056–1068. [Google Scholar] [CrossRef] [PubMed]
- Kang, S.; Jeong, H.Y. Sorption of a nonionic surfactant Tween 80 by minerals and soils. J. Hazard. Mater. 2015, 284, 143–150. [Google Scholar] [CrossRef] [PubMed]
- Ai, C.M.; Sun, P.P.; Wang, Y.M.; Liu, C. Research and application status on the surfactants in solution mining. Metal. Mine (In Chinese) 2019, 5, 9–13. [Google Scholar] [CrossRef]
- Zeng, S.; Sun, J.; Sun, B.; Chen, S.; Zhao, J.; Yang, L. Experimental investigation on the influence of surfactant to the seepage characteristics of acid leaching solution during in-situ leaching of uranium. J. Radioanal. Nucl. Chem. 2023, 332, 3651–3660. [Google Scholar] [CrossRef]
- Feng, J.; Guo, J.; Tang, R.; Li, J.; Su, X.; Hua, R. The effect of surfactants on the efficiency and consumption reduction of acid stirred leaching of uranium ore. J. Radioanal. Nucl. Chem. 2024, 333, 1873–1881. [Google Scholar] [CrossRef]
- Li, J.; Feng, J.; Xue, J.; Huang, Y.; Zhang, Z.; Li, H.; Chen, Y.; Guo, J.; Su, X.; Hua, R. The influence of surfactants on the acid leaching process of a uranium mine in Inner Mongolia. J. Radioanal. Nucl. Chem. 2024, 333, 5845–5855. [Google Scholar] [CrossRef]
- Tan, K.; Li, C.; Liu, J.; Qu, H.; Xia, L.; Hu, Y.; Li, Y. A novel method using a complex surfactant for in-situ leaching of low permeable sandstone uranium deposits. Hydrometallurgy 2014, 150, 99–106. [Google Scholar] [CrossRef]
- Du, R.; Zhang, X.; Li, M.; Wu, X.; Liu, Y.; Jiang, T.; Chen, C.; Peng, Y. Leaching of low permeable sandstone uranium ore using auxiliary materials: Anionic surfactants. J. Radioanal. Nucl. Chem. 2019, 322, 839–846. [Google Scholar] [CrossRef]
- Cai, G.L.; Tan, K.X.; Wang, W.G. Effect of different surfactant on leaching of uranium in sandstone type ores with low permeability. Adv. Mater. Res. 2013, 634–638, 3335–3338. [Google Scholar] [CrossRef]
- Lv, Y.; Lv, J.W.; Zhou, J.L.; Shen, J. Surfactant accelerating leaching of uranium ores. Adv. Mater. Res. 2014, 1051, 166–170. [Google Scholar] [CrossRef]
- Hu, P.; Tan, K.X.; Li, C.G.; Xia, L.S. Selection of surfactants for in-situ leaching of low permeable sandstone uranium deposits. Mod. Min. 2016, 32, 14–16. Available online: https://link.cnki.net/doi/10.3969/j.issn.1674-6082.2016.05.004.
- Lv, Y.; Lv, J.W.; Zhou, J.L.; Shen, J. Surfactant study on promoting leaching rate of uranium. Chin. J. Rare Met. (In Chinese) 2016, 40, 182–187. [Google Scholar] [CrossRef]
- Borges, V.F.d.S.; Monteiro, M.K.S.; da Silva Filho, E.D.; da Silva, D.C.; Fonseca, J.L.C.; Wanderley Neto, A.O.; Braga, T.P. Adsorption of Nonionic Surfactants (Nonylphenols) on Sandstone Rock via Alcoholic Micellar Solution. Langmuir 2024, 40(37), 19430–19440. [Google Scholar] [CrossRef] [PubMed]
- Xing, X.; Lourenço, S.D.N. The wetting behavior of a nonionic surfactant on hydrophobized quartz sand. Colloids Surf. A Physicochem. Eng. Asp. 2024, 684, 133109. [Google Scholar] [CrossRef]
- Dickinson, C.F.; Heal, G.R. Solid-liquid diffusion controlled rate equations. Thermochim. Acta 1999, 340–341, 89–103. [Google Scholar] [CrossRef]
- Crundwell, F.K. The mechanism of dissolution of minerals in acidic and alkaline solutions: Part I—A new theory of electrochemical dissolution. Hydrometallurgy 2014, 149, 265–275. [Google Scholar] [CrossRef]
- Ho, Y.S.; McKay, G. Pseudo-second order model for sorption processes. Process Biochem. 1999, 34, 451–465. [Google Scholar] [CrossRef]
- Tran, H.N.; You, S.J.; Hosseini-Bandegharaei, A.; Chao, H.P. Mistakes and inconsistencies regarding adsorption of contaminants from aqueous solutions: A critical review. Water Res. 2017, 120, 88–116. [Google Scholar] [CrossRef] [PubMed]
- Saldaña, M.; Gálvez, E.; Robles, P.; Castillo, J.; Toro, N. Copper mineral leaching mathematical models—A review. Materials 2022, 15, 1757. [Google Scholar] [CrossRef] [PubMed]
- Ferrier, R.J.; Cai, L.; Lin, Q.; Gorman, G.J.; Neethling, S.J. Models for apparent reaction kinetics in heap leaching: A new semi-empirical approach and its comparison to shrinking core and other particle-scale models. Hydrometallurgy 2016, 166, 22–33. [Google Scholar] [CrossRef]
- Madakkaruppan, V.; Pius, A.; Sreenivas, T.; Sunilkumar, T.S. Behaviour of Si, Al, Fe and Mg during oxidative sulfuric acid leaching of low grade uranium ore: A kinetic approach. J. Environ. Chem. Eng. 2019, 7, 103139. [Google Scholar] [CrossRef]
- Bagus, P.S.; Ilton, E.S.; Nelin, C.J. Theoretical modeling of the uranium 4f XPS for U(VI) and U(IV) oxides. J. Chem. Phys. 2013, 139, 244704. [Google Scholar] [CrossRef] [PubMed]
- Schindler, M.; Hawthorne, F.C.; Freund, M.S.; Burns, P.C. XPS spectra of uranyl minerals and synthetic uranyl compounds I: The U 4f spectrum. Geochim. Cosmochim. Acta 2009, 73, 2471–2484. [Google Scholar] [CrossRef]
- Ilton, E.S.; Bagus, P.S. XPS determination of uranium oxidation states. Surf. Interface Anal. 2011, 43, 1549–1560. [Google Scholar] [CrossRef]
- Wang, B.; Luo, Y.; Li, X.; Liu, Y.-Z.; Xu, C.-R.; Zheng, Y.-X.; Zhang, Y.-H.; Zhou, Y.-R. Water–rock reactions in the acid leaching of uranium: Hydrochemical characteristics and reaction mechanisms. J. Hydrol. 2024, 641, 131798. [Google Scholar] [CrossRef]
- Li, G.; Yao, J. A review of in situ leaching (ISL) for uranium mining. Mining 2024, 4, 120–148. [Google Scholar] [CrossRef]
Table 1.
Chemical reagents used in leaching experiments.
| Reagent | Sulfuric acid | Octylphenol ethoxylate (OP-10) | Polyoxyethylene sorbitan monooleate (Tween 80) |
|---|---|---|---|
|
Chemical formula/ composition |
H₂SO₄ | C₈H₁₇C₆H₄O(CH₂CH₂O)nH (n ≈ 10) | C₆₄H₁₂₄O₂₆ (average) |
| CAS No. | 7664-93-9 | 9041-29-6 | 9005-65-6 |
| Specification | AR grade, purity: 95%–98%, Density: approximately 1.84 g·cm⁻³ (20 °C) |
AR grade, Active Matter Content(ω): ≥98%, pH 6.0–8.0 (25 °C, 10 g/L) |
AR grade, purity and active matter content: Not specified, specific gravity: 1.07–1.10(20 °C), pH 5.0–7.0 (25 °C, 50 g/L), Residue on Ignition (as Sulfate): ≤ 0.3% |
| Function | Leaching agent | Nonionic surfactant | Nonionic surfactant |
| Source | Guangdong Guangshi Reagent Technology Co., Ltd. | Tianjin Kemiou Chemical Reagent Co., Ltd. | Tianjin Damao Chemical Reagent Co., Ltd. |
Note:The value reported for OP-10 represents its active matter content, as specified by the supplier, rather than the purity of a single chemical compound. The purity and active matter content of Tween 80 were not specified in the manufacturer's available documentation.
Disclaimer/Publisher’s Note: The statements, opinions and data contained in all publications are solely those of the individual author(s) and contributor(s) and not of MDPI and/or the editor(s). MDPI and/or the editor(s) disclaim responsibility for any injury to people or property resulting from any ideas, methods, instructions or products referred to in the content. |
© 2026 by the authors. Licensee MDPI, Basel, Switzerland. This article is an open access article distributed under the terms and conditions of the Creative Commons Attribution (CC BY) license (http://creativecommons.org/licenses/by/4.0/).
Copyright: This open access article is published under a Creative Commons CC BY 4.0 license, which permit the free download, distribution, and reuse, provided that the author and preprint are cited in any reuse.