

Submitted:
13 September 2026
Posted:
15 September 2026
You are already at the latest version
Abstract
Granite-hosted uranium ores commonly exhibit complex mineral assemblages and heterogeneous pore structures, which may restrict lixiviant accessibility and uranium dissolution during acid leaching. In this study, a mixed nonionic surfactant system consisting of OP-10 and Tween 80 was investigated for enhancing uranium recovery from a granite-hosted uranium ore containing approximately 787.5 ppm U. Mineralogical and pore-structure characterization, surface tension measurements, stirring leaching, column leaching, and kinetic analyses were conducted to evaluate the effects of the mixed surfactants on uranium leaching. The ore was composed mainly of quartz and aluminosilicate minerals and exhibited a heterogeneous multiscale pore structure. OP-10 showed a greater ability to reduce surface tension than Tween 80, while the OP-10/Tween 80 mixture at a volume ratio of 3:1 maintained relatively low surface tension under the acidic conditions investigated. In stirring leaching at 30 °C with 20 g·L⁻¹ H₂SO₄, the addition of the mixed surfactants increased uranium recovery after 10 h from approximately 72.4% to 87.8%. In a separate kinetic experiment conducted at 20 °C, the apparent rate constant obtained from the chemical-reaction-controlled model for the mixed-surfactant system was 0.20266 h⁻¹. The comparable fitting quality of the internal-diffusion and chemical-reaction models suggested that both processes contributed to the overall leaching kinetics. In column leaching, the mixed surfactants increased the cumulative uranium recovery after 31 d from approximately 74.0% to 92.6%, while the apparent first-order rate constant increased from 0.0418 to 0.0648 d⁻¹. Shrinking-core-model analysis of the column experiments gave the highest fitting quality for the interfacial chemical-reaction model in both systems, although mass-transfer effects remained appreciable. These results indicate that the OP-10/Tween 80 system can enhance uranium recovery and accelerate the apparent leaching kinetics of heterogeneous granite-hosted uranium ore, providing a potential approach for improving sulfuric acid leaching of low-permeability hard-rock uranium resources.
Keywords:
uranium leaching
; granite-hosted uranium ore
; OP-10
; Tween 80
; nonionic surfactant
; interfacial regulation
; leaching kinetics
; column leaching
1. Introduction
Granite-type uranium deposits represent an important category of hard-rock uranium resources, characterized by complex mineral compositions and diverse uranium occurrence states. Uranium minerals commonly coexist with quartz, feldspar, and other silicate minerals [1,2,3]. Compared with mineralogical characteristics, the influence of heterogeneous pore structures within ores on leaching processes has attracted increasing attention in recent years. Pore size, pore-throat characteristics, degree of microfracture development, and particle size collectively regulate the migration of leaching solutions into ore particles and determine whether uranium-bearing reaction zones can be effectively accessed by lixiviants [4,5,6]. During acid leaching, mineral dissolution may generate or enlarge certain mass-transfer channels, whereas migration of fine particles, mineral alteration, and secondary precipitation may locally narrow or block pore pathways, causing continuous changes in pore structures and reactive transport parameters throughout the leaching process [4,6,7,8,9]. Therefore, sulfuric acid leaching of granite-type uranium ores is not merely an interfacial dissolution reaction, but rather a coupled process involving lixiviant transport, intraparticle diffusion, and mineral–solution interfacial reactions.
Previous kinetic studies have demonstrated that the apparent rate-controlling steps in hard-rock uranium leaching are influenced by ore particle size, pore structure, acidity, and oxidation conditions, and may be controlled by interfacial chemical reactions, diffusion through product layers, or a combination of both mechanisms [1,2,10,11]. Zeng et al. reported that the controlling characteristics of hard-rock uranium ore sulfuric acid leaching vary at different stages of the process [2]. Qi et al. further indicated that particle size and particle-size fractal characteristics of granite-type uranium ores are closely related to recovery [5]. These findings suggest that as leaching gradually progresses from the particle surface toward the interior, the accessibility of reactive regions may become a key factor limiting leaching kinetics. For ores containing multiscale pore systems and localized microfractures, simply increasing acid concentration or temperature may not effectively alleviate internal mass-transfer limitations. Instead, improving the wettability and penetration of lixiviants within pore networks and onto mineral surfaces may provide a more direct approach for leaching enhancement.
Surfactants can regulate these mass-transfer processes by modifying mineral–solution interfacial properties. Their ability to reduce liquid surface tension and improve mineral wettability facilitates the penetration of leaching solutions into fine pores, fractures, and interparticle spaces, thereby enhancing the accessibility of internal reaction sites [12,13,14]. Previous uranium leaching studies have employed surfactants such as SDS, SDBS, CTAB, OP-10, and Tween 80 to improve interfacial properties and transport conditions in acidic leaching systems [15,16,17,18,19,20,21,22,23]. Among them, OP-10-based composite surfactants used in low-permeability sandstone-type uranium ores were found to improve formation permeability and increase uranium recovery. Kinetic analyses suggested that their effects involved not only mass-transfer enhancement but also changes in the apparent rate-controlling characteristics [18]. Recent studies have further demonstrated that surfactants can enhance ore permeability under acidic leaching conditions, reduce liquid-film mass-transfer resistance, and promote uranium release during stirred leaching, heap leaching, and simulated in situ leaching processes [15,16,17]. These results indicate that the enhancement effect of surfactants cannot be explained solely by surface tension reduction; rather, it should be considered in terms of wettability, pore accessibility, and the coupling between interfacial reactions and mass transfer.
OP-10 and Tween 80 are both nonionic surfactants; however, differences exist in their molecular structures, interfacial activities, and adsorption behaviors on mineral surfaces [12,13]. Previous studies have separately investigated the effects of OP-10 or Tween 80 on uranium ore leaching and mineral interfacial behavior [13,15,18,20,23]. Nevertheless, investigations into the synergistic enhancement of granite-type uranium ore sulfuric acid leaching using OP-10/Tween 80 mixed surfactant systems remain limited. In particular, the effects of mixed surfactant systems on apparent leaching kinetics under both stirred and percolation conditions have not been systematically compared.
Therefore, this study focuses on granite-type uranium ore. Based on mineralogical characterization and multiscale pore structure analysis, the interfacial properties of OP-10, Tween 80, and their mixed systems were investigated. Their enhancement effects were evaluated through stirred leaching and column leaching experiments. Furthermore, the shrinking core model and related kinetic models were employed to analyze the relative contributions of interfacial reactions and mass-transfer processes, thereby elucidating the effects of the OP-10/Tween 80 mixed surfactant system on the sulfuric acid leaching behavior and apparent kinetic characteristics of granite-type uranium ores.
2. Materials and Methods
2.1. Ore Sample and Reagents
The ore sample used in this study represents a typical granite-type uranium deposit and was collected from a granite-hosted uranium deposit in southern China. The raw ore had an average particle size of approximately 4 mm. After collection, the ore samples were subjected to drying, crushing, homogenization, and sieving processes to obtain the required particle size fractions for subsequent characterization and leaching experiments. Sulfuric acid was used as the primary leaching agent. Considering the excellent surface activity of OP-10 and Tween 80 and their potential applications in hydrometallurgical processes, these two nonionic surfactants were selected as representative surfactant additives in this study. All chemical reagents were of analytical grade, and deionized water was used throughout the experiments.

Table 1.
Chemical reagents used in leaching experiments.
| Reagent | Chemical formula | CAS No. | Purity | Function |
| Sulfuric acid | H₂SO₄ | 7664-93-9 | Analytical reagent (AR), ≥98% | Leaching agent |
| Octylphenol ethoxylate (OP-10) | C8H17C6H4(OCH2CH2)10OH(average) | 9041-29-6 | Reagent grade | Nonionic surfactant |
| Polyoxyethylene sorbitan monooleate (Tween 80) |
C₆₄H₁₂₄O₂₆(average) | 9005-65-6 | Reagent grade | Nonionic surfactant |
2.2. Ore Characterization Methods
2.2.1. XRF Analysis
X-ray fluorescence (XRF) spectrometry was used to characterize the bulk chemical compositions of the granite uranium ore and leaching residues. The concentrations of major and minor elements were determined using a PANalytical Zetium wavelength-dispersive X-ray fluorescence spectrometer equipped with a Rh-target X-ray tube operated at 2.4 kW. Before measurement, all samples were prepared as pressed pellets. The elemental compositions were subsequently quantified using the Omnian standardless semi-quantitative program, and the results were presented in both oxide and elemental forms.
2.2.2. XRD Analysis
X-ray diffraction (XRD) analysis was carried out to identify the mineral phases present in the ore sample.XRD analysis was performed on a Bruker D8 Advance diffractometer using Cu Kα radiation (λ = 1.5406 Å). The data were collected in continuous scanning mode within a 2θ range of 5–90°, with a scanning rate of 10° min⁻¹ and a step size of 0.02°. The instrument was operated at 40 kV and 40 mA. The divergence slit (DS) and receiving slit (RS) were set to 0.1–0.6 mm and 1–3.3°, respectively. Measurements were carried out in symmetric reflection geometry without the use of a monochromator.
2.2.3. XPS Analysis
X-ray photoelectron spectroscopy (XPS) was employed to analyze the surface elemental composition and chemical states of the ore sample. Both the survey spectrum and the high-resolution spectra of key elements were used to characterize the surface properties relevant to surfactant interaction and acid leaching. XPS measurements were carried out on a Thermo Scientific ESCALAB Nexsa G2 instrument using monochromatic Al Kα radiation (hν = 1486.6 eV). The analysis was conducted with a spot size of 500 μm under a tube voltage of 15 kV and a current of 10 mA. The base pressure in the analysis chamber was maintained at 1 × 10⁻⁹ mbar to ensure high vacuum conditions.All binding energies were calibrated using the C 1s peak at 284.8 eV.
2.2.4. SEM Analysis
Scanning electron microscopy (SEM) was used to observe the microstructure, pore development, and mineral intergrowth characteristics of the ore. Representative regions were selected to evaluate the compactness of the ore texture and the occurrence of uranium-bearing minerals.SEM analysis was conducted using a Zeiss Sigma 500 microscope equipped with an EDS detector (Bruker XFlash 6130). Powder samples (<100 mesh) were mounted on conductive carbon tape and coated with gold prior to observation. For dispersed samples, suspensions were prepared in ethanol or deionized water, dropped onto silicon wafers, dried at room temperature, and then sputter-coated before SEM measurement.
2.2.5. BET Analysis
The specific surface area, pore volume, and pore size distribution of the samples were determined using nitrogen adsorption–desorption measurements at 77 K on an ASAP 2460 analyzer. Prior to analysis, all samples were degassed for 12 h. The specific surface area was calculated using the Brunauer–Emmett–Teller (BET) method, and the resulting pore structure parameters were used to characterize the properties of the ore.
2.2.6. MIP Analysis
For granite-hosted uranium ore with low permeability and multiscale pore systems, MIP is used to characterize macropores and pore-throat connectivity relevant to fluid flow, while BET analysis captures micro- and mesopore structures and specific surface area. The combined use of both methods enables a comprehensive evaluation of pore structure across different scales.
Mercury intrusion porosimetry (MIP) was carried out using an AutoPore IV 9500 instrument (Micromeritics Instrument Corporation, Norcross, GA, USA) to analyze the pore structure of the sample. The measurements were performed over a pressure range of 0.10–61,000 psia. Mercury was used as the intrusion medium with an assumed contact angle of 130°. The pore size distribution, cumulative pore volume, and porosity were calculated based on the intrusion data.
2.2.7. FTIR Analysis
Fourier transform infrared spectroscopy (FTIR) was performed to identify the main surface functional groups and characteristic chemical bonds of the ore, thereby providing additional information on the surface chemistry of the sample.Fourier transform infrared (FTIR) spectra were obtained using a Thermo Fisher Scientific Nicolet 6700 spectrometer equipped with a DTGS detector and a potassium bromide beam splitter. Measurements were performed in the mid-infrared region with a spectral resolution of 4 cm⁻¹. To enhance the signal-to-noise ratio, a total of 32 scans were conducted separately for both samples and the background. The mirror speed was set to 0.4747 cm·s⁻¹, and the aperture size was 100.
2.3. Measurement of Surface Tension
Surface tension was measured using a DMPY-2C surface tensiometer (Nanda Wanhe Technology Co., Ltd., Nanjing, China). The surface tensions of single-component and mixed surfactant solutions were all determined at 20 °C.
OP and Tween 80 surfactant solutions with different concentrations were prepared using deionized water as the solvent. The stock solutions were diluted to obtain a series of surfactant concentrations of 5.0, 2.0, 1.0, 0.5, 0.2, 0.1, 0.05, 0.02, 0.01, 0.005, 0.004, 0.003, 0.002, and 0.001 g·L⁻¹. For the single-surfactant systems, 30 mL of each OP or Tween 80 solution was directly transferred into centrifuge tubes for surface tension measurements.The OP-10 and Tween80 measured under these conditions is shown as OP-10 (original) or Tween80 (original) in Figure 10.
To investigate the effects of dilution and acidic conditions on surfactant performance, 6 mL of each surfactant solution was mixed with 24 mL of either deionized (DI) water [denoted as OP-10 (DI-H₂O) and Tween 80 (DI-H₂O) in Figure 10] or a 20 g·L⁻¹ H₂SO₄ aqueous solution [denoted as OP-10 (H₂SO₄-aq.) and Tween 80 (H₂SO₄-aq.) in Figure 10], giving a final solution volume of 30 mL. Accordingly, the final surfactant concentration in these secondary-dilution systems was one-fifth of the corresponding initial concentration.
For mixed surfactant systems, OP-10 and Tween 80 solutions with identical initial concentrations (1.0, 0.5, 0.2, 0.1, 0.05, 0.04, 0.03, and 0.02 g·L⁻¹) were prepared separately and blended at different OP-10/Tween 80 volume ratios (4:1, 3:1, 2:1, 1:1, 1:2, 1:3, and 1:4). Single-component controls (OP-10/Tween 80 = 1:0 and 0:1) were also prepared. In each mixed system, a total of 6 mL of the surfactant mixture was added to 24 mL of 20 g·L⁻¹ H₂SO₄ solution, giving a final volume of 30 mL. Here, C0 denotes the concentration of each surfactant solution before mixing. After mixing and dilution to a final volume of 30 mL, the final total surfactant concentration, Cf, was C0/5.
2.4. Stirred Leaching Experiments
A single-factor experimental approach was adopted to investigate the effects of sulfuric acid concentration, temperature, and leaching time on uranium recovery under different leaching systems. The three leaching systems were selected based on the surface tension measurements and included: (i) sulfuric acid leaching without surfactant addition (H₂SO₄ system); (ii) sulfuric acid leaching assisted by OP-10 (H₂SO₄+OP-10 system); and (iii) sulfuric acid leaching assisted by a mixed nonionic surfactant system consisting of OP-10 and Tween 80 (H₂SO₄+Mixed surfactants system).
For the H₂SO₄ system, 50 mL of sulfuric acid solution was used as the leaching medium. For the H₂SO₄+OP-10 system, 40 mL of sulfuric acid solution and 10 mL of OP-10 solution were mixed before leaching. For the H₂SO₄+Mixed surfactants system, 40 mL of sulfuric acid solution and 10 mL of the mixed OP-10/Tween 80 surfactant solution were used.
The ore sample used in the leaching experiments was the homogenized fraction passing through a 100-mesh sieve, and 10 g of ore sample was used for each experiment. The liquid-to-solid ratio was maintained at 40:10. The concentrations of OP-10 and the mixed surfactant solution were determined according to the surface tension results, corresponding to the concentration at which the minimum surface tension was obtained for the mixed surfactant system.
After leaching, the slurry was subjected to solid–liquid separation, and the uranium concentration in the leachate was determined by inductively coupled plasma optical emission spectrometry (ICP-OES, Avio 220 Max, PerkinElmer). The uranium recovery was calculated according to Equation (1):
where η is the uranium recovery (%), C is the uranium concentration in the leachate, V is the volume of the leachate, m is the mass of the ore sample, and ω is the initial mass fraction of uranium in the ore.
The stirring speed was maintained at 250 rpm throughout all experiments. Each experiment was performed under identical conditions and repeated three times (n = 3), and the average values were reported.
2.4.1. Effect of Sulfuric Acid Concentration
The effect of sulfuric acid concentration on uranium leaching was investigated at a constant temperature of 30 °C and a leaching time of 4 h. The sulfuric acid concentration was varied while maintaining other experimental parameters unchanged. The selected sulfuric acid concentrations were 10, 15, 20, and 25 g·L⁻¹. The sulfuric acid concentration providing the highest uranium recovery was selected for subsequent experiments.
2.4.2. Effect of Temperature
The effect of temperature on uranium leaching was evaluated using the sulfuric acid concentration determined from the sulfuric acid concentration experiments. The leaching time was fixed at 4 h, while the temperature was varied from 15 to 35 °C (15, 20, 25, 30, and 35 °C). Other experimental parameters were kept constant.
2.4.3. Effect of Leaching Time
The effect of leaching time was investigated using the selected sulfuric acid concentration and temperature obtained from the previous single-factor experiments. The leaching time was varied as 2, 4, 6, 8, and 10 h, while all other parameters remained unchanged.
2.5. Column Leaching Experiments
To evaluate the enhancement effect of the mixed surfactant system under percolation conditions, column leaching experiments were conducted (Figure 1). The column had an inner diameter of 8 cm and a height of 30 cm. The ore sample used in the experiment was raw ore with a total mass of 1.5 kg. The ore was classified into different particle size fractions, including 1–3 mm (50 wt%), 0.25–1 mm (35 wt%), and <0.25 mm (15 wt%), and all fractions were thoroughly mixed before column packing. To improve the uniformity of solution distribution, quartz sand layers (0.5 kg for each layer, with different particle sizes) were placed at both ends of the ore bed as filtration layers. During packing, the ore sample was immersed in clean water and slightly compacted to obtain a relatively uniform packed structure. The height of the packed ore bed was approximately 20 cm, and the bulk porosity of the packed bed was determined by the water saturation method, with a value of approximately 41.3%.
Two leaching systems were compared in the column experiments. Column 1 was operated using sulfuric acid solution without surfactant addition (H₂SO₄ system). The sulfuric acid concentration was selected according to the optimal condition obtained from the stirring leaching experiments. Column 2 employed the surfactant-assisted sulfuric acid leaching system (H₂SO₄+Mixed surfactants system). The mixed surfactant solution was prepared using the same OP-10/Tween 80 concentration and volume ratio determined in the stirring leaching experiments. The concentrations of both OP-10 and Tween 80 were maintained at 0.5 g·L⁻¹, with an OP-10/Tween 80 volume ratio of 3:1. The mixed surfactant solution and sulfuric acid solution were introduced at a volume ratio of 1:4, while the sulfuric acid concentration was kept identical to that of the H₂SO₄ system.
The column experiments were performed at ambient temperature and atmospheric pressure. The leaching solution was introduced from the bottom of the column and flowed upward through the packed ore bed at a constant flow rate of 0.5 mL min⁻¹.Leachates were collected daily for volume measurement, pH and Eh determination, and uranium concentration analysis by ICP-OES. The uranium recovery calculation formula is given by Equation (1).The cumulative uranium recovery was calculated as a function of leaching time to compare the leaching performance of the two systems. All reagents used in the experiments were of analytical grade and were used directly without further purification.
1-Leaching agent storage tank (H₂SO₄ solution containing OP-10/Tween 80 mixed surfactants);2-Leaching agent storage tank (H₂SO₄ solution);3-Peristaltic pump;4-Quartz sand layer;5-Uranium ore bed;6-Flow control valve;7-Leachate collection bottle for the Mixed surfactants+H₂SO₄ leaching system;8-Leachate collection bottle for the H₂SO₄ leaching system
2.6. Kinetic Analysis
To elucidate the uranium leaching mechanism, kinetic studies were conducted separately for stirred leaching and column leaching. Stirred leaching was fitted using both the shrinking core model and the pseudo-second-order kinetics model, while column leaching was fitted with the shrinking core model and the first-order kinetics model. These models were employed to determine whether the leaching process is governed by liquid film diffusion, surface chemical reactions, or product layer diffusion. The corresponding kinetic equations were applied to leaching data, and fitting quality was evaluated based on correlation coefficients (R²) and curve consistency. Subsequently, apparent rate constants obtained under different leaching systems were compared. The kinetic equations used in this study are presented in Equations (2) to (5).
(i)External diffusion control (liquid film diffusion control):
(ii)Chemical reaction control (interface reaction control):
(iii)Internal diffusion control (diffusion control at the product layer)
Here, is the uranium recovery at time t (dimensionless), is the equilibrium recovery, and is the leaching time (h). All of 、and are apparent rate constants (h⁻¹).However, their meanings and physical interpretations are not entirely identical, as the leaching process involves multiple coupled steps, including surface reactions and mass transfer processes.
2.7. Determination of Uranium Content in Raw Ore and Leaching Residues
Because XRF analysis is unable to accurately detect uranium at low concentrations, the uranium contents in the solid samples (raw ore and leaching residues) were determined by the ferrous sulfate reduction–ammonium vanadate oxidation titration method. The uranium content of the ore sample was approximately 787.5 ppm (0.07875 wt%), corresponding to about 0.79 mg of uranium per gram of ore. Data fitting and graphical processing were performed using Origin software.
3. Results and Discussion
3.1. Analysis of Mineral and Leaching Residue Properties
3.1.1. XRF Analysis Results
XRF analysis of the raw ore showed that the sample was predominantly composed of SiO₂ (62.24 wt.%) and Al₂O₃ (22.93 wt.%), accounting for approximately 85.17 wt.% of the total composition. Minor components included CaO (3.63 wt.%), K₂O (3.46 wt.%), Na₂O (3.28 wt.%), Fe₂O₃ (1.46 wt.%), and MgO (1.39 wt.%), whereas P₂O₅, SO₃, Cl, and MnO were present at relatively low levels. These results indicate that the sample has a silica- and alumina-rich matrix, likely dominated by silicate and aluminosilicate minerals. However, the specific mineral phases require confirmation through XRD analysis.he relatively low CaO content (3.63 wt.%) suggests a limited carbonate gangue fraction and low potential acid consumption. Therefore, sulfuric acid leaching was selected as the preferred hydrometallurgical route for uranium extraction from this granite-hosted uranium ore.
Table 2.
Major oxide composition of the sample determined by XRF (wt.%).
| Component | Content (wt.%) | Component | Content (wt.%) |
| SiO₂ | 62.24 | MgO | 1.39 |
| Al₂O₃ | 22.93 | SO₃ | 0.90 |
| CaO | 3.63 | Cl | 0.40 |
| K₂O | 3.46 | P₂O₅ | 0.16 |
| Na₂O | 3.28 | MnO | 0.15 |
| Fe₂O₃ | 1.46 |
3.1.2. XRD Analysis Results
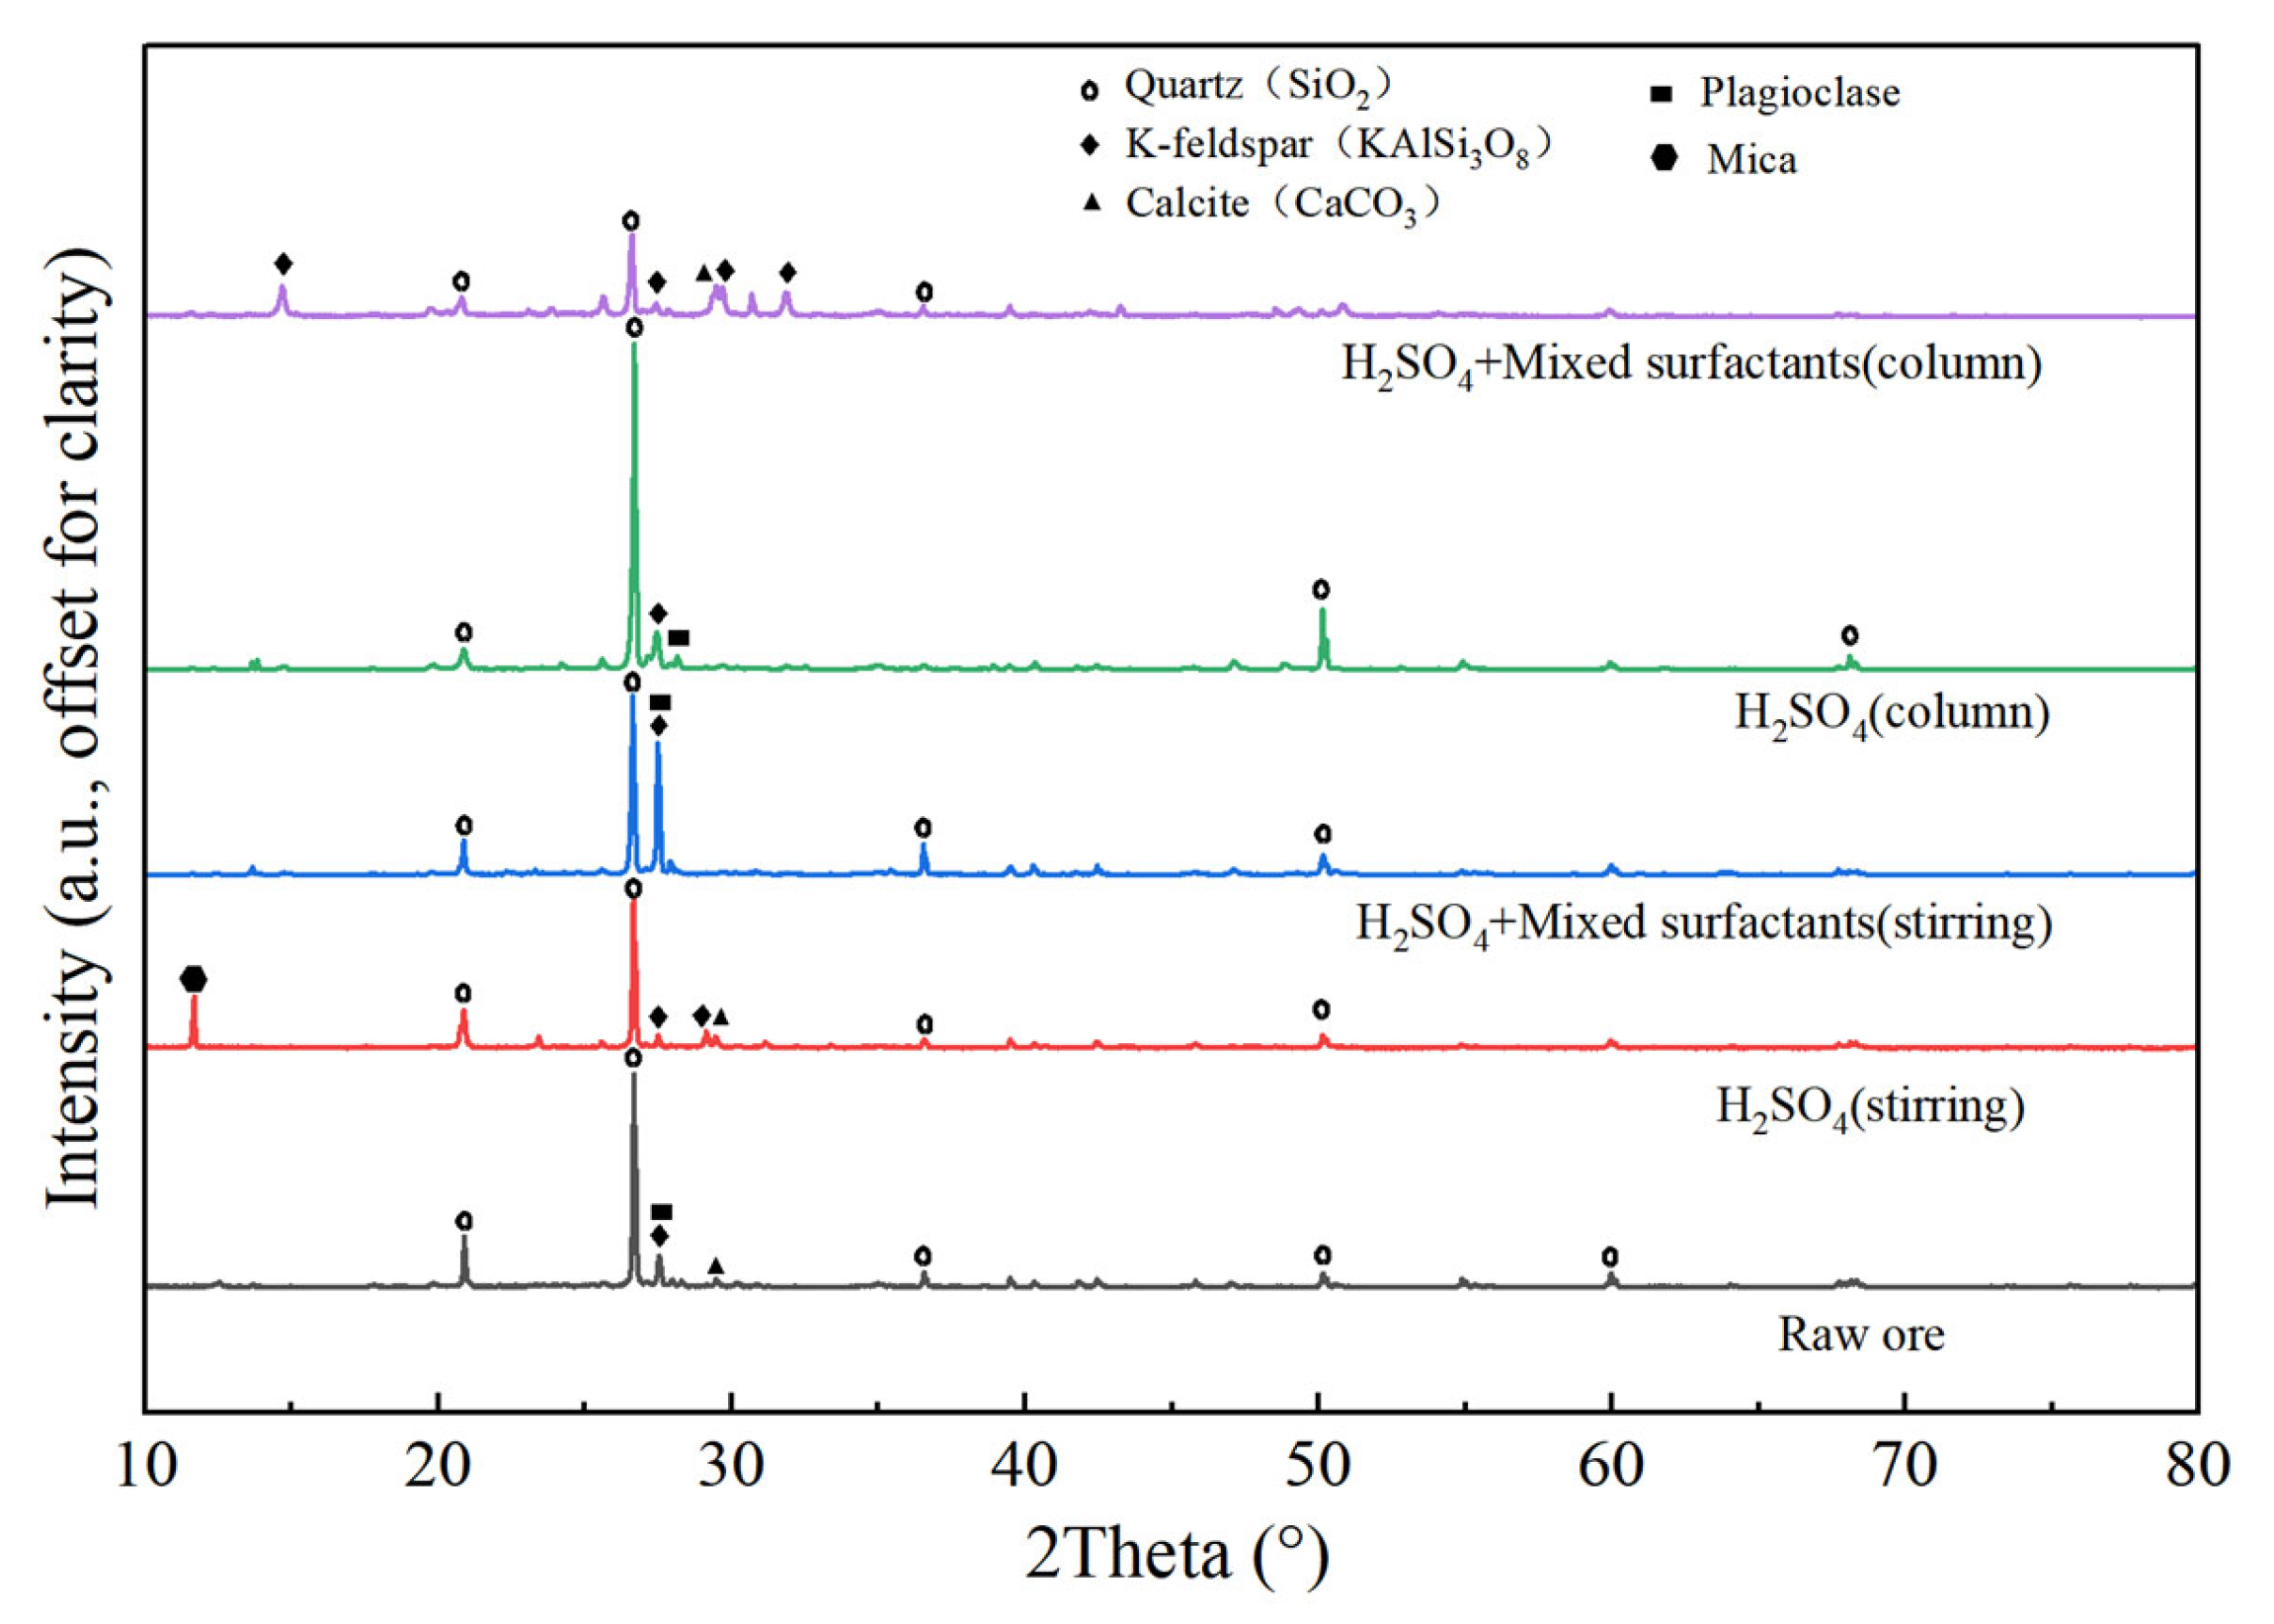
XRD was employed to investigate the mineral phase evolution of the raw ore and its residues under different leaching conditions, with results shown in Figure 4. The raw ore exhibits typical granite mineral diffraction patterns, primarily comprising quartz (Qtz), potassium feldspar, plagioclase, mica-like minerals, and trace amounts of calcite. Quartz demonstrates its strongest diffraction peak at approximately 26.6°, along with characteristic peaks at 20.8°,36.5°, and 50.1°, confirming it as the dominant mineral component of the granite ore's crystal framework. Diffraction peaks in the ranges of 27.4–27.5° and 27.9–28.1° correspond to potassium feldspar and plagioclase, respectively, while a weak peak at around 29.4° represents calcite (CaCO₃). No crystalline uranium-bearing phase was identified by XRD, indicating that uranium occurs in trace amounts and is likely dispersed within the silicate matrix.
Under stirring leaching conditions, the peak intensity of calcite at approximately 29.4° decreased significantly after sulfuric acid leaching, indicating that the acid-sensitive carbonate minerals had been dissolved. Concurrently, changes in the relative intensity of feldspar-related peaks (27.4–28.1°) suggest certain structural degradation of aluminosilicate minerals under acidic conditions [30]. Compared to conventional sulfuric acid leaching, the use of a composite surfactant-assisted leaching process produced more pronounced alterations in feldspar-related diffraction peaks, particularly in the 27–29° region, demonstrating that the composite surfactant enhanced the interaction between the leaching solution and mineral surfaces.
Under column leaching conditions, the quartz peak at approximately 26.6 in H₂SO₄ leaching residue exhibited significant relative intensification, primarily due to relative enrichment of quartz resulting from preferential dissolution of active mineral phases such as feldspar and carbonates, rather than the formation of new non-quartz phases. In contrast, after column leaching assisted by a blended surfactant system, the intensity of the quartz peak decreased while changes in diffractive peaks associated with silicate minerals became more pronounced, indicating that the surfactant system enhances the leaching solution's penetration capacity into mineral aggregates and promotes further dissolution of refractory gangue minerals. Overall, XRD results demonstrate that the blended surfactant system strengthens interfacial interactions between minerals and the leaching agent and facilitates selective dissolution of active mineral phases during uranium-bearing granite leaching.
Figure 2.
X-ray diffraction patterns of raw ore and leached residues obtained under different leaching conditions: The data for raw ore, sulfuric acid stirred leaching, and sulfuric acid+mixed surfactants column leaching process have all been scaled up by a factor of 5. The mineral phases were identified as quartz (SiO₂), K-feldspar(KAlSi₃O₈), plagioclase (NaAlSi₃O₈–CaAl₂Si₂O₈), mica, and minor calcite (CaCO₃).
Figure 2.
X-ray diffraction patterns of raw ore and leached residues obtained under different leaching conditions: The data for raw ore, sulfuric acid stirred leaching, and sulfuric acid+mixed surfactants column leaching process have all been scaled up by a factor of 5. The mineral phases were identified as quartz (SiO₂), K-feldspar(KAlSi₃O₈), plagioclase (NaAlSi₃O₈–CaAl₂Si₂O₈), mica, and minor calcite (CaCO₃).
3.1.3. XPS Analysis Results
XPS analyses were performed on the raw ore, the uranium leaching residue obtained using sulfuric acid alone, and the residue obtained by sulfuric acid leaching in the presence of a mixed surfactant system. Based on literature data, the U 4f spectra were fitted using constrained spin–orbit doublets. For each uranium oxidation state, the energy separation between the U 4f₇/₂ and U 4f₅/₂ components was fixed at approximately 10.8 eV, with an area ratio of 4:3 and identical or comparable full widths at half maximum (FWHMs) [31,32,33]. A GL(30) line shape and a Shirley background were employed for peak fitting. Uranium oxidation states were assigned by considering both the binding energies of the main peaks and the characteristic shake-up satellite features. A characteristic shake-up satellite feature was observed in the corresponding binding-energy region, for example, near 398.0 eV. This feature was used only as supporting evidence for oxidation-state assignment and was not included in the fitting or quantitative analysis of the main U 4f peaks. The resulting XPS spectra are presented in Figure 3.
The XPS survey spectra show that the surfaces of the raw ore and leaching residues are dominated by O, Si, Al, Fe, and Ca, with S-related signals also observed. Deconvolution of the O 1s spectrum indicates that oxygen species on the raw ore surface mainly comprise Si–O–Si/Si–O–Al, surface –OH/defect-related oxygen, adsorbed H₂O, and a minor contribution from lattice O²⁻ (M–O). After sulfuric acid leaching, the component at approximately 532 eV can be assigned to overlapping contributions from silicate oxygen and sulfate-related oxygen, indicating changes in the surface oxygen environment during leaching. Following the addition of OP-10 and Tween 80, C–O-related oxygen also contributes to this region. Meanwhile, the C–O–C/C–OH component in the C 1s spectrum becomes more pronounced, consistent with the polyoxyethylene groups of the nonionic surfactants and supporting their adsorption on the residue surface. C–C/C–H remains the predominant carbon component in the C 1s spectra, accompanied by C=O and O–C=O/carbonate-related carbon species. Constrained fitting of the high-resolution U 4f spectra resolves components attributable to both U(IV) and U(VI), indicating the coexistence of different uranium oxidation states in the residues.
Because of the low U signal intensity, interference from K 2s, and background noise, reliable U atomic concentrations could not be obtained from the survey spectra. Therefore, the XPS data were not used to quantitatively compare the total uranium contents among the samples. Overall, sulfuric acid leaching and the addition of surfactants altered the surface oxygen- and carbon-containing species, while both U(IV) and U(VI) remained detectable on the surfaces of the leaching residues.
3.1.4. SEM Analysis Results
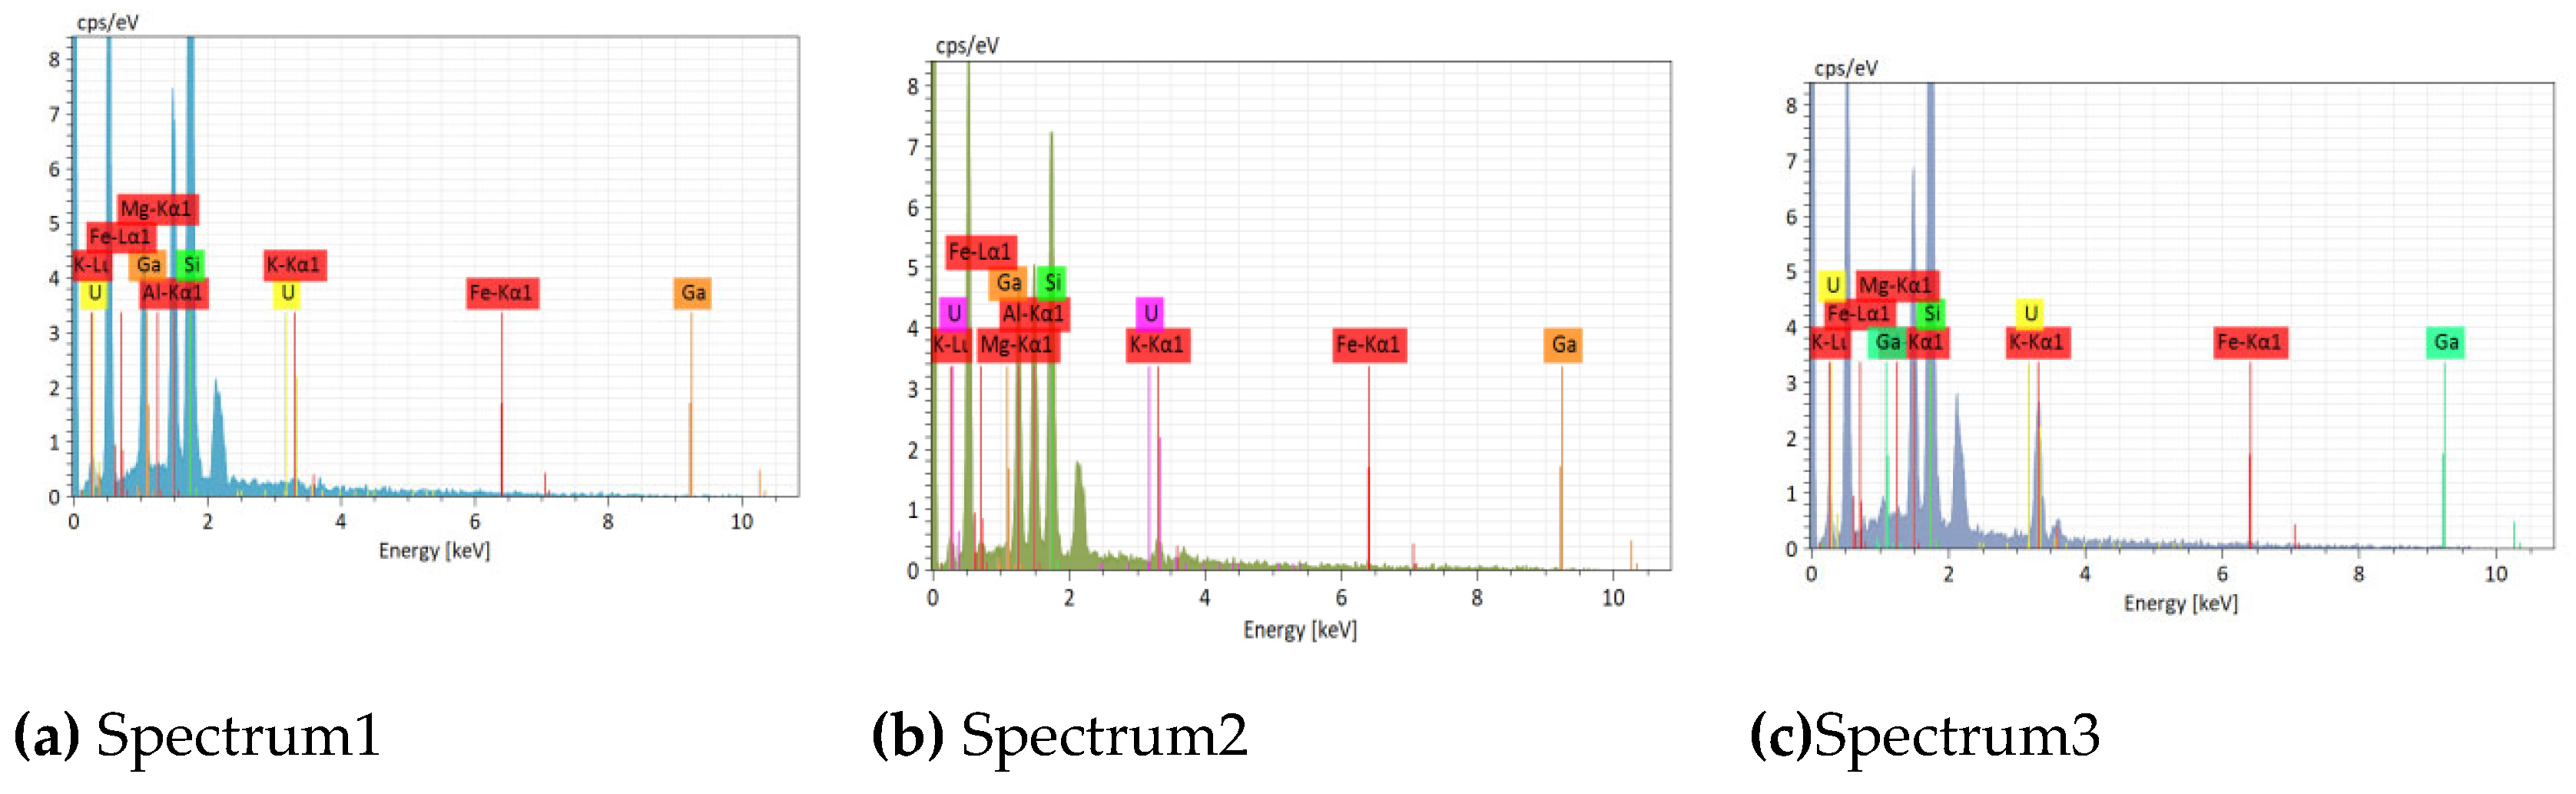
The SEM images(Figure 4) and corresponding EDS spectra (Figure 5)show that the raw ore particles exhibit an irregular blocky morphology with a relatively compact surface. Localized lamellar exfoliation, microcracks, and irregular pores are clearly observed, together with fine particles attached to the surface, indicating pronounced microstructural heterogeneity within the mineral particles. At higher magnification, platy or sheet-like mineral phases are distributed across the particle surface and are accompanied by micron-scale pores and fractures. These structural defects may provide pathways for the penetration of leaching solution into the particles during subsequent leaching.
The EDS spectra(Figure 5) reveal distinct compositional variations among the analyzed regions. Spectrum 1 is dominated by Si, Al, and K, with minor Fe and Mg, corresponding to a quartz–aluminosilicate-rich region. In Spectrum 2, U is detected together with Si, Al, K, and Fe, indicating that uranium is heterogeneously distributed and occurs locally in U-bearing phases or in association with aluminosilicate minerals. U is also detected in Spectrum 3, accompanied by Fe, Mg, and Si, suggesting a spatial association between U-bearing phases and Fe–Mg-bearing silicate minerals. Overall, the granitic uranium ore is characterized by mineralogical heterogeneity, uneven uranium distribution, and local mineral associations. The presence of microcracks and pores may facilitate the access of acidic leaching solution to U-bearing phases.
Figure 4.
SEM images of the microstructure, pore development, and mineral associations of the raw ore.
Figure 4.
SEM images of the microstructure, pore development, and mineral associations of the raw ore.
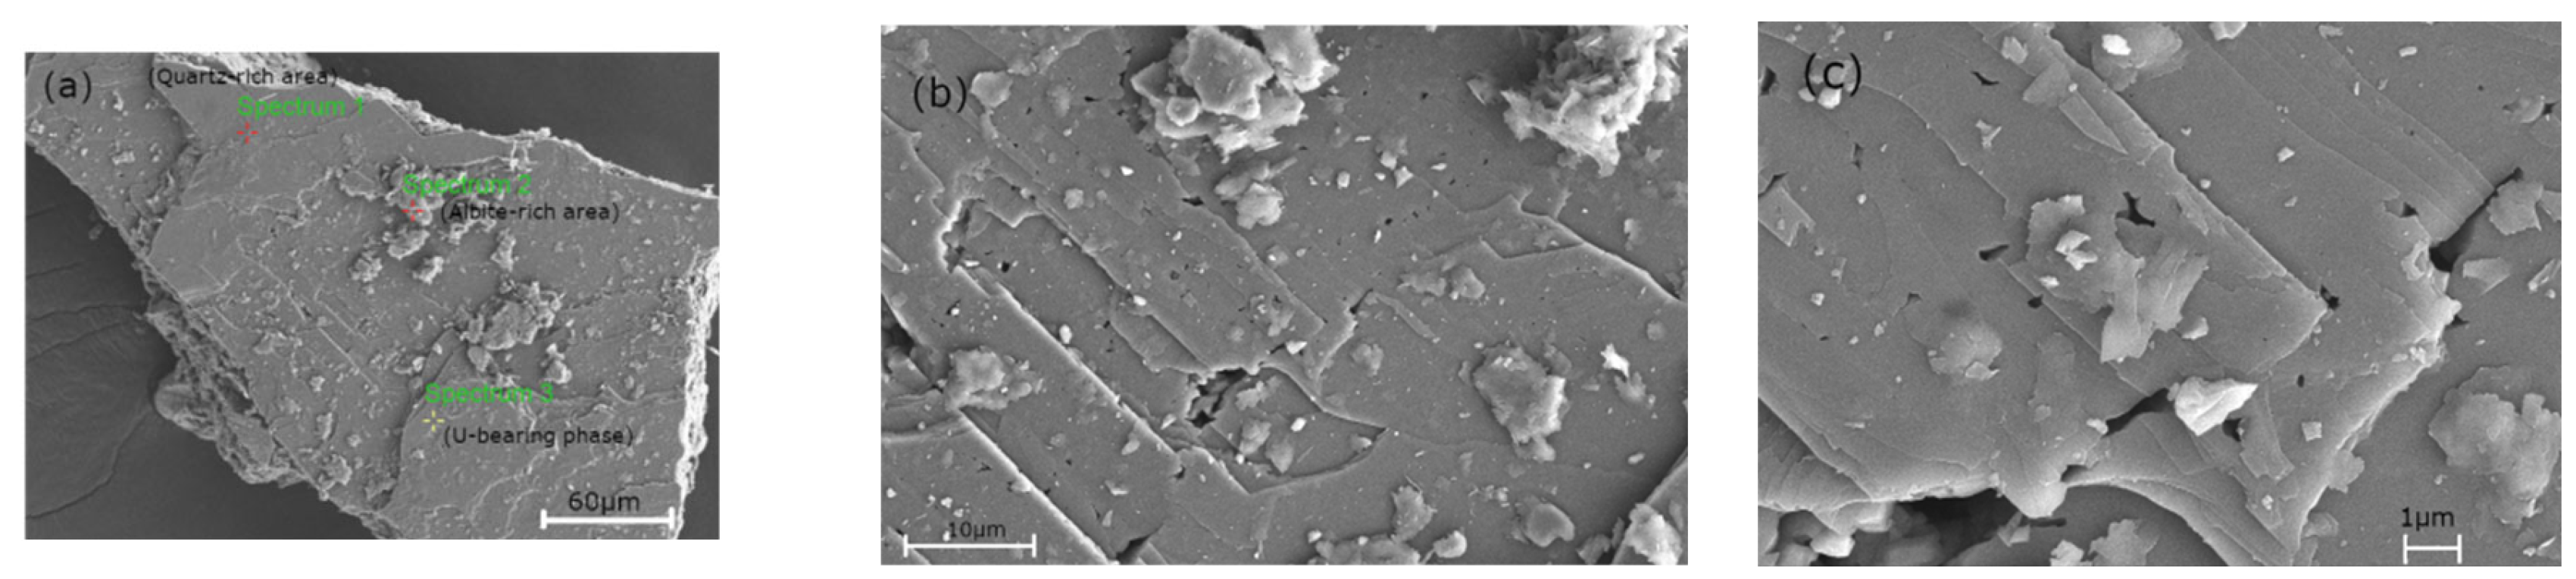
Figure 5.
Electron probe energy dispersive spectrum of Figure 4(a).
Figure 5.
Electron probe energy dispersive spectrum of Figure 4(a).
3.1.5. BET and MIP Analysis Results
The N₂ adsorption–desorption isotherm and BET plot of the granite-hosted uranium ore sample are shown in Figure 6 and Figure 7, respectively. The sample exhibited a relatively low BET specific surface area of 5.424 m²/g and a total pore volume of 0.0171 cm³/g. The t-plot analysis yielded a micropore area of 0.979 m²/g and an external surface area of 4.445 m²/g, with the micropore area accounting for approximately 18.0% of the BET surface area. The corresponding micropore volume was only 0.000829 cm³/g, representing about 4.9% of the total pore volume, indicating a limited contribution of micropores to the overall pore system.
The pore structure parameters derived from the N₂ adsorption–desorption measurements are summarized in Table 3. The BJH adsorption cumulative pore volume within the diameter range of 1.79–56.22 nm was 0.0167 cm³/g, accounting for approximately 97.9% of the total pore volume. In addition, the average pore diameter calculated from the adsorption branch using the BET 4V/A method was 12.58 nm, whereas the BJH adsorption average pore diameter was 11.96 nm. The close agreement between these values, together with the pronounced contribution of pores within the mesopore size range, indicates that the accessible pore system of the sample is predominantly mesoporous.
Overall, the N₂ adsorption results indicate a relatively low specific surface area and total pore volume, with a limited contribution from micropores. The BJH adsorption average pore diameter of 11.96 nm indicates a pronounced mesoporous contribution within the pore-size range accessible to N₂ adsorption. These mesopores may provide internal solid–liquid interfaces and transport pathways during leaching; however, N₂ adsorption alone does not fully characterize the larger pores and pore-throat structures relevant to fluid penetration. Therefore, MIP was further employed to characterize the pore system over a broader pore-size range.
Figure 7.
BET plot of the granite-hosted uranium ore sample.
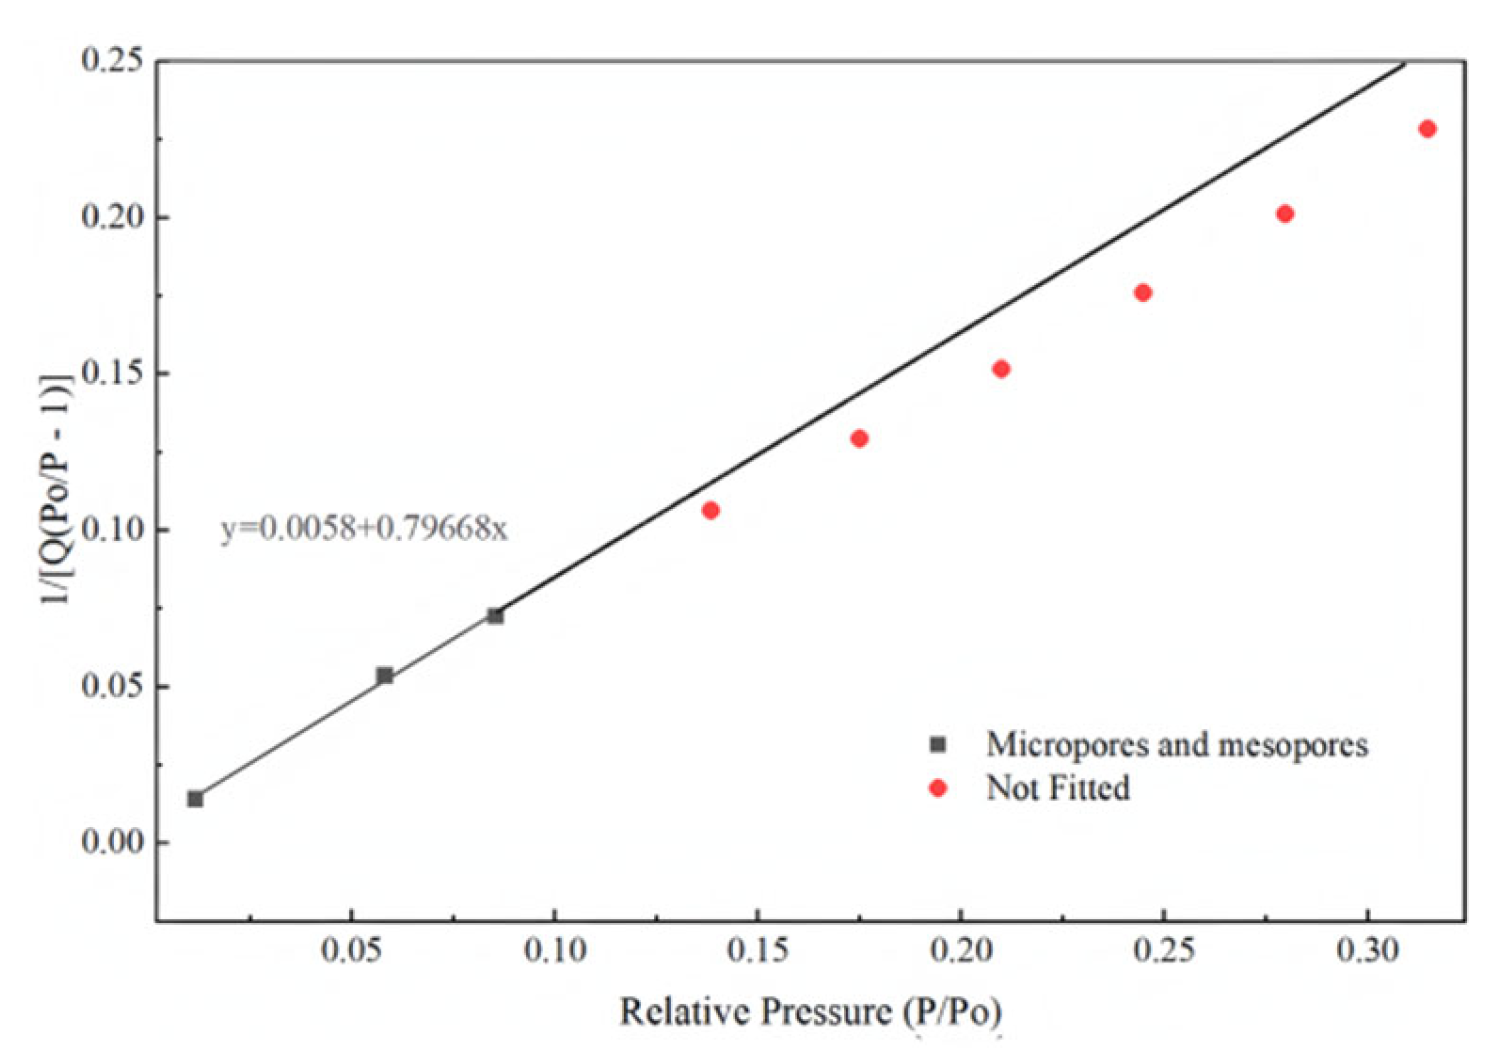
Figure 8.
Mercury intrusion porosimetry characteristics of the raw granite-hosted uranium ore: (a) pore-size distribution and cumulative intrusion volume; (b) mercury intrusion–extrusion curve.
Figure 8.
Mercury intrusion porosimetry characteristics of the raw granite-hosted uranium ore: (a) pore-size distribution and cumulative intrusion volume; (b) mercury intrusion–extrusion curve.
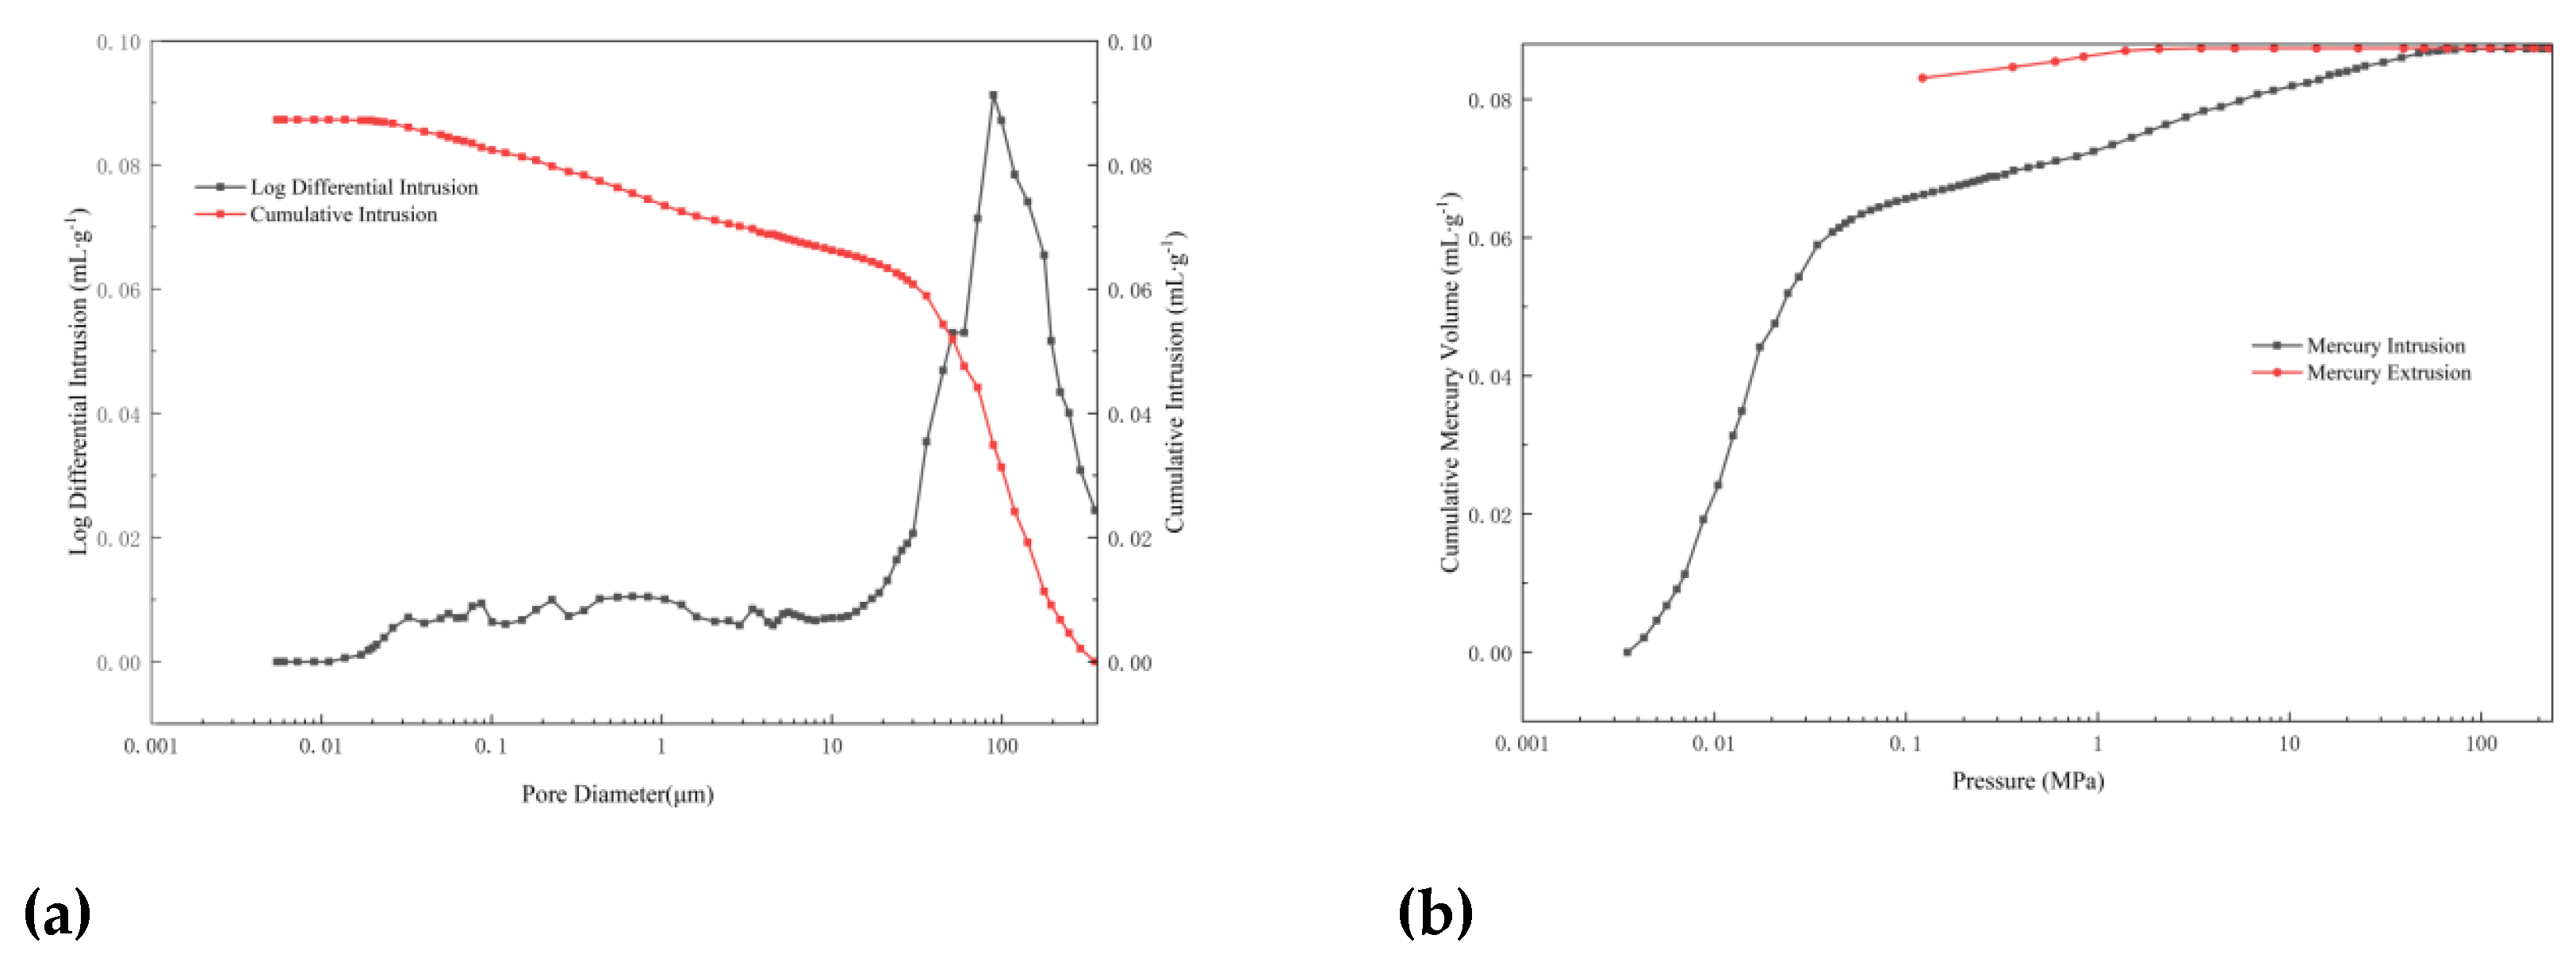
MIP measurements showed a broad pore-size distribution in the raw granite-hosted uranium ore (Figure 8). The differential intrusion curve exhibited a pronounced peak at approximately 70–100 μm, indicating a considerable contribution from large pores and pore throats. The total mercury intrusion volume was 0.0873 mL/g, with a porosity of 18.64%. The average pore diameter (4V/A) was 578.39 nm, and the volume-based median pore diameter was 73.23 μm. Pores larger than approximately 72 μm accounted for 50.6% of the total intrusion volume, while more than 95% of the cumulative intrusion occurred at pore diameters above approximately 77 nm. Together with the mesopores identified by N₂ adsorption, the MIP results indicate that the ore contains pores and pore throats spanning from the nanometer to micrometer scale.
This pore structure is likely to affect the entry and transport of the leaching solution within the ore. Large pores and pore throats can facilitate solution penetration, whereas smaller pores provide additional internal surface area for mineral–solution contact. The marked intrusion–extrusion hysteresis also suggests restricted pore throats and nonuniform pore accessibility, which may limit solution access to some internal surfaces. Under these conditions, changes in mineral wettability and interfacial behavior induced by surfactants could alter the extent to which the acidic solution accesses the pore network. These pore characteristics are therefore relevant to the subsequent evaluation of surfactant-assisted uranium leaching.
3.1.6. FTIR Analysis Results
Figure 9 compares the FTIR spectra of the raw ore and the leaching residues obtained under different conditions. The raw ore exhibits characteristic absorption bands associated with O–H stretching at approximately 3200–3600 cm⁻¹ and H–O–H bending near 1630 cm⁻¹, together with pronounced bands in the 1000–1100, ~800, and 400–1000 cm⁻¹ regions, which are mainly associated with vibrations of the silicate framework. After sulfuric acid leaching, changes in the intensity and profile of the Si–O-related bands indicate that acid treatment affected the surface structure of silicate-bearing minerals. The spectra obtained with Tween 80, OP-10, and the mixed OP-10/Tween 80 system retain the main silicate framework bands, but differences are evident in the 1000–1200 cm⁻¹ region, where Si–O and sulfate-related vibrations overlap. Among the leaching conditions examined, the mixed-surfactant treatments produce more distinct changes in this region than sulfuric acid alone, suggesting that the combined surfactants modify the local solid–liquid interfacial environment during leaching rather than fundamentally altering the silicate framework. These spectral changes are consistent with the proposed role of OP-10/Tween 80 in regulating interfacial interactions and improving contact between the acidic solution and reactive mineral surfaces. When considered together with the wetting, leaching, and kinetic results, the FTIR observations support an interfacial contribution of the mixed nonionic surfactant system to uranium leaching; however, the specific interaction between sulfate and uranium species requires corroboration by XPS or other speciation-sensitive analyses.
3.2. Surface Tension Measurement Results
The surface tensions of both OP-10 and Tween 80 decreased with increasing surfactant concentration, although the extent of the reduction differed markedly between the two surfactants (Figure 10a,d). For the original solutions, OP-10 reduced the surface tension to approximately 44.7 mN· m⁻¹ at 0.5 g·L⁻¹and 36.9 mN·m⁻¹ at 5.0 g·L⁻¹, whereas the corresponding values for Tween 80 were approximately 57.8 and 52 mN·m⁻¹, respectively. Thus, OP-10 exhibited a greater surface-tension-reducing ability over the investigated concentration range. A similar difference was observed after secondary dilution (Figure 10c). The surface-tension curves of OP-10 in DI water and H₂SO₄ solution remained similar over most of the concentration range, whereas Tween 80 generally showed slightly higher surface tension in the H₂SO₄-containing system, particularly at concentrations above 0.2 g·L⁻¹. These results indicate that OP-10 maintained stronger interfacial activity than Tween 80 under both neutral and acidic conditions.
Figure 10.
Surface tension behavior of individual and mixed OP-10/Tween 80 systems under different dilution conditions: (a) Surface tension of OP-10 and Tween 80 in the original solutions and after secondary dilution with DI water or aqueous H₂SO₄ as a function of initial surfactant concentration; (b) surface tension of OP-10/Tween 80 mixtures with different mixing ratios as a function of initial mixed surfactant concentration; (c) surface tension of OP-10 and Tween 80 after secondary dilution as a function of final surfactant concentration; (d) surface tension of the original OP-10 and Tween 80 solutions as a function of final surfactant concentration; and (e) surface tension of OP-10/Tween 80 mixtures with different mixing ratios as a function of final mixed surfactant concentration.
Figure 10.
Surface tension behavior of individual and mixed OP-10/Tween 80 systems under different dilution conditions: (a) Surface tension of OP-10 and Tween 80 in the original solutions and after secondary dilution with DI water or aqueous H₂SO₄ as a function of initial surfactant concentration; (b) surface tension of OP-10/Tween 80 mixtures with different mixing ratios as a function of initial mixed surfactant concentration; (c) surface tension of OP-10 and Tween 80 after secondary dilution as a function of final surfactant concentration; (d) surface tension of the original OP-10 and Tween 80 solutions as a function of final surfactant concentration; and (e) surface tension of OP-10/Tween 80 mixtures with different mixing ratios as a function of final mixed surfactant concentration.
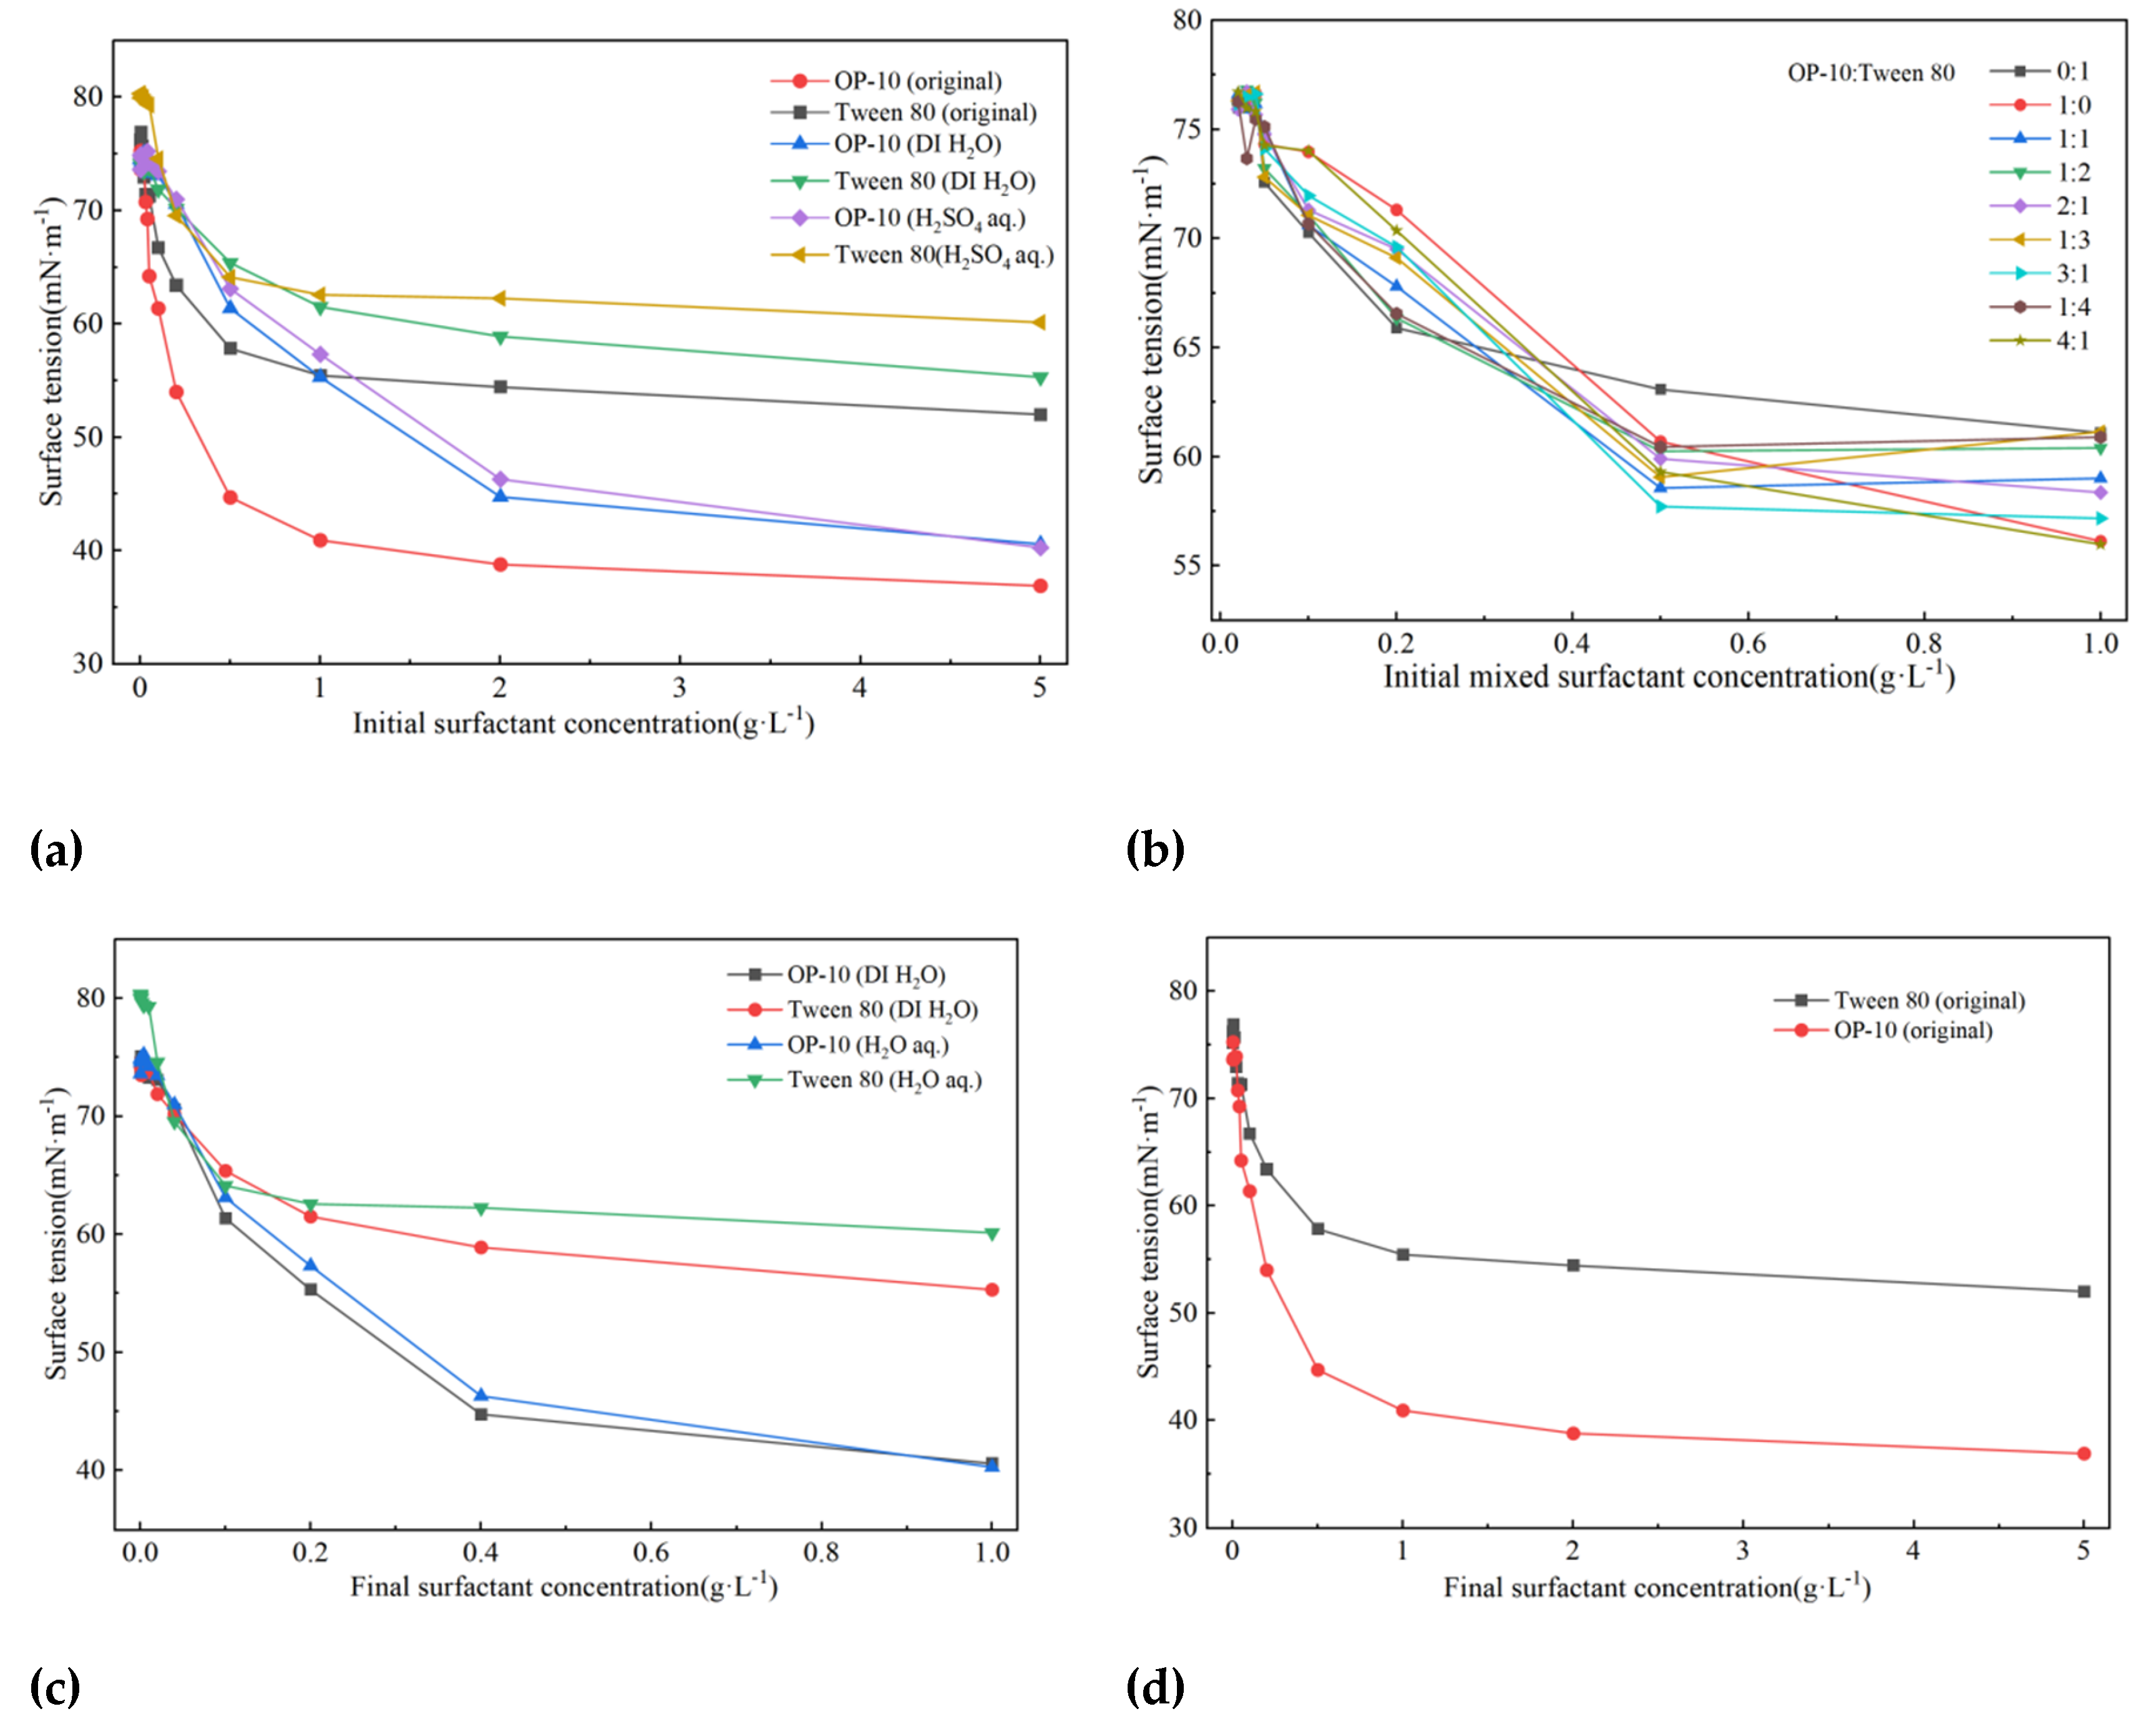
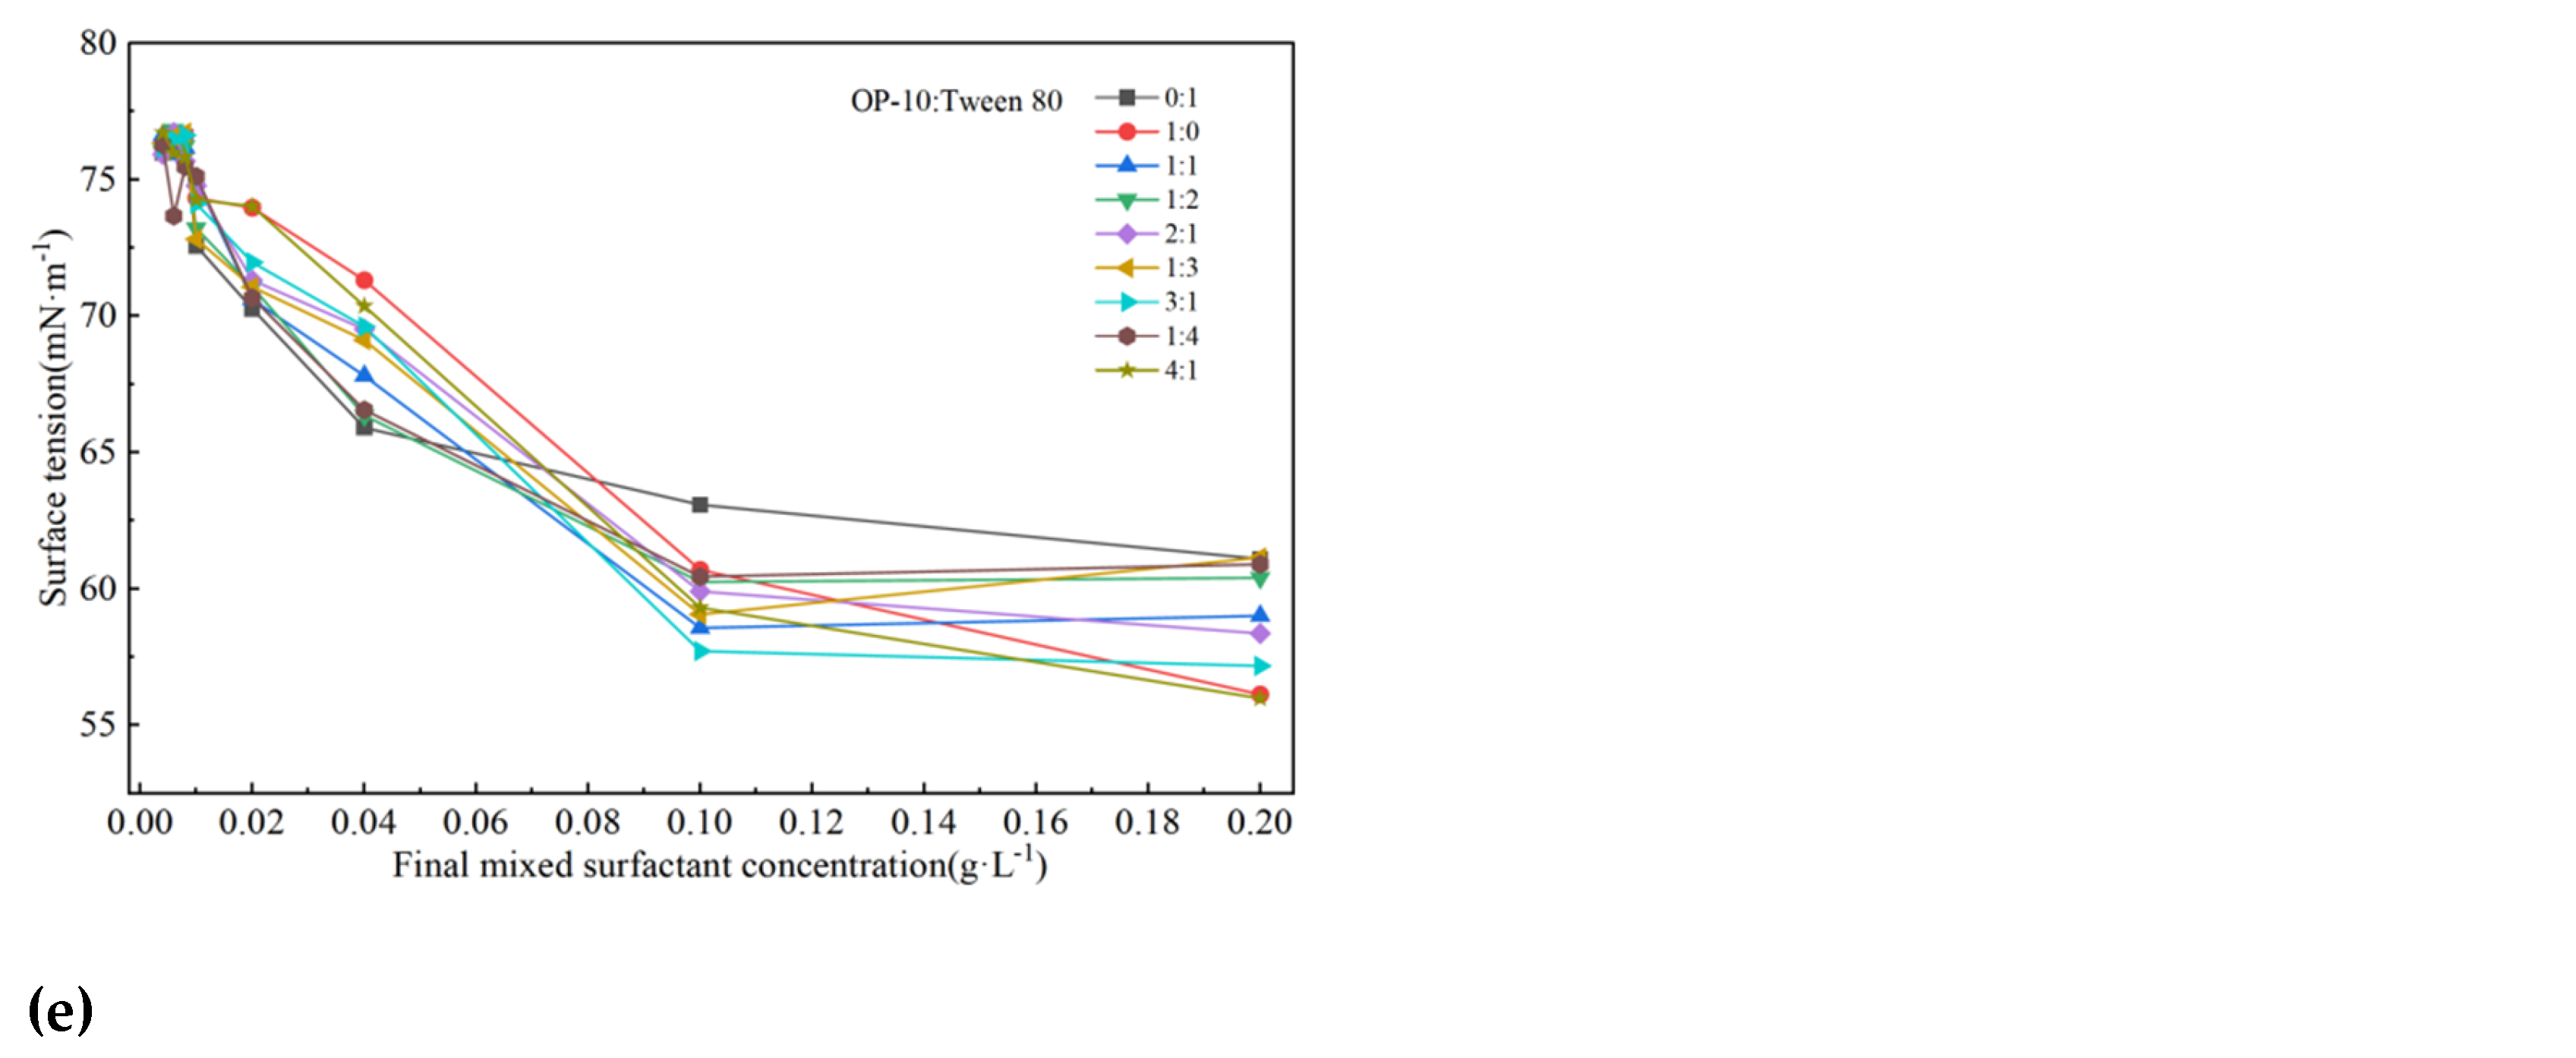
The OP-10/Tween 80 mixed systems also exhibited a pronounced concentration dependence (Figure 10b,e). As shown in Figure 10e, at final total surfactant concentrations of 0.004–0.01 g·L⁻¹, the surface tension remained relatively high, generally within approximately 72.8–76.8 mN·m⁻¹. At 0.04 g·L⁻¹, the surface tension decreased to approximately 66.3–70.4mN·m⁻¹ and further decreased to approximately 57.7–60.4 mN·m⁻¹ at 0.10 g·L⁻¹. Increasing the concentration to 0.20 g·L⁻¹ resulted in only a limited further decrease, with surface tensions of approximately 56.0–61.1 mN·m⁻¹. The effect of the OP-10/Tween 80 ratio on surface tension was also concentration dependent. In particular, the 3:1 mixture exhibited one of the lowest surface tensions at 0.10 g·L⁻¹ (approximately 57.7 mN·m⁻¹); however, no single mixing ratio consistently produced the lowest surface tension over the entire concentration range. These results indicate that the interfacial behavior of the mixed system was governed jointly by the total surfactant concentration and mixture composition rather than solely by the proportion of either individual component.
For most mixed systems, surface tension showed a pronounced concentration dependence below approximately 0.10 g·L⁻¹, whereas the decrease became considerably smaller between 0.10 and 0.20 g·L⁻¹ (Figure 10e). This change in slope suggests that adsorption at the air–liquid interface was approaching saturation, with further addition of surfactant increasingly contributing to aggregation in the bulk solution. Therefore, the concentration region around 0.10 g·L⁻¹ may represent an approximate transition from predominantly interfacial adsorption to surfactant aggregation.
3.3. Stirred Leaching Experiment Results
3.3.1. Effect of Sulfuric Acid Concentration on Uranium Recovery
When investigating the effect of sulfuric acid mass concentration on the uranium leaching rate, the experimental temperature was maintained at 30°C and the leaching time was set to 4 hours; the sulfuric acid mass concentrations were configured at 10,15,20, and 25 g/L, respectively; the results are presented in Figure 11.
As shown in Figure 11, both H₂SO₄ concentration and surfactant addition affected U recovery. Without surfactants, U recovery increased from approximately 41.0% to 51.3% as the H₂SO₄ concentration increased from 10 to 25 g·L⁻¹. Surfactant addition generally resulted in higher U recoveries over the investigated concentration range. At 10 g·L⁻¹ H₂SO₄, U recoveries with OP-10 and mixed surfactants were approximately 47.9% and 46.9%, respectively, representing increases of 6.9 and 5.9 percentage points compared with H₂SO₄ alone. At 15 g·L⁻¹, the mixed-surfactant system achieved approximately 52.0% U recovery, 7.5 and 3.1 percentage points higher than those obtained with H₂SO₄ alone and H₂SO₄ + OP-10, respectively.
At 20 g·L⁻¹ H₂SO₄, U recoveries with OP-10 and mixed surfactants reached approximately 58.8% and 59.3%, respectively, compared with 49.4% for H₂SO₄ alone. The mixed-surfactant system therefore produced the highest U recovery, with an improvement of 9.9 percentage points over the surfactant-free system. However, increasing the H₂SO₄ concentration to 25 g·L⁻¹ decreased U recovery to approximately 54.2% and 53.7% for the OP-10 and mixed-surfactant systems, respectively, whereas the recovery with H₂SO₄ alone increased to 51.3%. These results indicate that the enhancement provided by surfactants reached a maximum at approximately 20 g·L⁻¹ H₂SO₄ rather than increasing continuously with acid concentration.
Overall, surfactant addition enhanced U leaching most effectively at H₂SO₄ concentrations of 10–20 g·L⁻¹. At 20 g·L⁻¹, OP-10 and the mixed surfactants exhibited similar enhancement, while a further increase in acid concentration provided no additional benefit. Considering both U recovery and acid consumption, 20 g·L⁻¹ H₂SO₄ was selected for subsequent experiments.
3.3.2. Effect of Temperature on Uranium Leaching Rate
Through a sulfate concentration effect experiment, the optimal sulfate concentration was determined to be 20 g·L⁻¹, with an leaching time of 4 h and temperatures set at 15,20,25,30, and 35 °C, respectively; the results are presented in Figure 12.
As shown in Figure 12, increasing the temperature significantly promoted uranium leaching under the conditions of 20 g·L⁻¹ sulfuric acid concentration and a leaching time of 4 h. In the H₂SO₄ system, the uranium recovery increased from approximately 41.4% at 15 °C to 64.6% at 35 °C, representing an increase of about 23.2 percentage points. After the addition of OP-10, the recovery increased from approximately 46.4% to 80.5%. The H₂SO₄+Mixed surfactants mixed surfactant system exhibited the highest uranium recovery, increasing from approximately 45.1% to 82.3% over the same temperature range.
Within the temperature range of 15–30 °C, the uranium leaching efficiencies of the single-surfactant-assisted and mixed-surfactant-assisted systems were generally similar, but remained higher than that of the H₂SO₄ system. When the temperature increased to 35 °C, the difference among the systems became more pronounced. The uranium leaching efficiencies of the H₂SO₄+OP-10 and H₂SO₄+Mixed surfactants systems were approximately 15.9 and 17.7 percentage points higher than that of the H₂SO₄ system, respectively. Notably, a significant increase in uranium recovery was observed for all three systems in the temperature range of 30–35 °C, indicating that the leaching kinetics and mass transfer processes were more sensitive to temperature variations within this range.
Overall, increasing temperature not only improved the overall uranium recovery but also enhanced the relative advantage of surfactant-assisted systems compared with the H₂SO₄ system. The H₂SO₄+Mixed surfactants system showed slightly higher recovery than the H₂SO₄+OP-10 system at 35 °C, suggesting that the mixed surfactant system may provide improved solid–liquid interfacial contact and enhance the accessibility of the leaching solution to reactive sites within the ore at elevated temperatures.
3.3.3. Effect of Leaching Time on Uranium Leaching Rate
Although Figure 12 shows that all three leaching systems achieved relatively high uranium recovery at 35 °C, the uranium recovery of the mixed surfactant-assisted system only increased from approximately 58.5% at 30 °C to 82.5% at 35 °C, corresponding to an increase of about 24 percentage points. Meanwhile, further temperature elevation may increase energy consumption and potentially affect the interfacial adsorption behavior of nonionic surfactants and the stability of the slurry system. Therefore, 30 °C was selected as a relatively mild leaching temperature, providing a high uranium recovery while reducing thermal energy consumption for both laboratory experiments and potential industrial applications. Accordingly, 30 °C was selected as the experimental temperature for subsequent studies.
With a sulfuric acid concentration of 20 g/L and a temperature of 30°C, the uranium leaching rates for the three systems were determined at 2, 4, 6, 8, and 10 h; the results are presented in Figure 13.
Under the conditions of sulfuric acid concentration of 20 g·L⁻¹ and temperature of 30 ℃, leaching time exerted a significant effect on uranium recovery. As shown in Figure 13, the uranium recovery continuously increased in all three systems as the leaching time was prolonged from 2 h to 10 h, while the growth rate gradually slowed down. Specifically, the recovery of the H₂SO₄ system rose from approximately 40.6 % to 72.4 %, showing a steady-growth trend.
Considerable improvement was observed after adding OP-10 surfactant: the recovery of the H₂SO₄ + OP-10 system increased from around 44.3 % to 84.0 %, and that of the H₂SO₄ + Mixed surfactants system increased from about 44.6 % to 87.8 %. At 10 h, their leaching efficiencies were approximately 11.6 % and 15.4 % higher than that of the pure H₂SO₄ system, respectively.
In terms of stage-wise variation, rapid growth of recovery occurred within 2-6 h. For instance, the recovery of the H₂SO₄ + Mixed surfactants system increased sharply from 44.6 % to 75.6 % within this interval, with an increment of more than 31 percentage points. By contrast, the increment dropped obviously within 6-10 h (within 12 percentage points), indicating that the leaching process gradually reached a relatively stable state. Comparison among the three systems demonstrated the order: H₂SO₄ + Mixed surfactants system ≥ H₂SO₄ + OP-10 system > H₂SO₄ system over the whole investigated leaching period, and the gaps between different systems were enlarged with increasing leaching time.
The above results reveal that extending leaching time is beneficial to uranium recovery, and the introduction of mixed surfactants can further enhance the leaching performance. Such enhancement may be attributed to the modification of solid-liquid interfacial properties by surfactants, which promotes the contact and mass transfer of reactants to a certain extent.
3.4. Column Leaching Experiment Results
All leachate generated each day was collected, and the daily leachate volume (Vi) was recorded. An aliquot of the leachate was collected for uranium (U) concentration analysis to determine the daily U concentration (Ci). The amount of U leached each day was calculated from the leachate volume and U concentration. The cumulative amount of leached U was then obtained by summing the daily U amounts, and the cumulative U recovery was calculated accordingly.
In Equations (7)–(9),Mi is the amount of U leached on day i, Ci is the U concentration in the leachate collected on day i, Vi is the corresponding leachate volume, Mcum,n is the cumulative amount of U leached up to day n, RU,n is the cumulative U recovery up to day n, and M0 is the total amount of leachable U in the original ore.
As shown in Figure 14 and Figure 15, the composite surfactant system exhibits a continuous enhancing effect during the column leaching process. During the initial phase of column leaching (1–7 d), the uranium concentration in the daily leachate from the composite surfactant system decreased from approximately 120.5 mg·L⁻¹ to 86.7 mg·L⁻¹, whereas for the single H₂SO₄ system, it decreased from approximately 86.9 mg·L⁻¹ to 54.7 mg·L⁻¹; the former maintained a relatively high uranium concentration throughout the rapid leaching stage. During the transition stage (7–24 d), the two leaching systems exhibited distinct evolutionary trends. The uranium concentration of the Mixed surfactants + H₂SO₄ system gradually decreased(7-14 d) and then fluctuated within the range of 69.4–71.3 mg·L⁻¹(14-24 d). By contrast, the H₂SO₄ system showed an upward trend before leveling off(7-14 d), with uranium concentrations fluctuating mainly from 70.6 to 73.8 mg·L⁻¹(14-22 d). After 24 d, both groups entered the steady-leaching stage. The leachate uranium concentration of the Mixed surfactants + H₂SO₄ system remained at 75.5–77.1 mg·L⁻¹, which was consistently higher than the late-stage value (65.2 mg·L⁻¹) for the H₂SO₄ system.
The cumulative leaching results further indicate that the difference between the two systems gradually widened over time. The cumulative uranium leaching rate for the composite surfactant system reached approximately 44.6% after about 10 days, whereas that for the single H₂SO₄ system was approximately 30.3%; after 20 days, these rates were approximately 79.0% and 61.1%, respectively. By the end of the column leaching process after 31 days, the cumulative uranium leaching rate for the composite system reached approximately 92.6%, compared to approximately 74.0% for the single H₂SO₄ system—representing an increase of approximately 18.6 percentage points. Thus, the composite OP-10/Tween 80 system not only enhanced the uranium release rate during the early stages of column leaching but also maintained a high recovery in the middle and later stages. In conjunction with the aforementioned surface tension and pore structure results, this enhanced performance may be attributed to improved acid solution wettability and enhanced pore accessibility, which facilitates the penetration of the leaching solution into the ore and ensures adequate solid–liquid contact.
3.5. Kinetic Analysis
3.5.1. Stirred Leaching Kinetic Analysis Results
(1) Shrinking Core Model (SCM)
Based on the surface tension measurements, the leaching kinetics of uranium ore were investigated by stirring leaching under four different conditions. The temperature, H₂SO₄ concentration, ore sample mass, liquid-to-solid ratio, and leaching time were fixed at 20 °C, 20 g·L⁻¹, 20 g, 50 mL:20 g, and 0–10 h, respectively. The four leaching conditions were as follows: (1) H₂SO₄ without surfactant; (2) H₂SO₄ + OP-10, with a final OP-10 concentration of 0.10 g·L⁻¹; (3) H₂SO₄ + Tween 80, with a final Tween 80 concentration of 0.10 g·L⁻¹; and (4) H₂SO₄ +Mixed surfactants, with an OP-10/Tween 80 volume ratio of 3:1, a mixed surfactant/H₂SO₄ solution volume ratio of 1:4, and a final total surfactant concentration of 0.10 g·L⁻¹.
The calculations were performed according to Equations (4)–(6). Figure 16 shows the relationship between uranium recovery and leaching time under the four different conditions. Figure 17, Figure 18 and Figure 19 show the fitting results for the three rate-controlling mechanisms of the shrinking-core model under the four leaching conditions. The corresponding kinetic parameters for the three rate-controlling mechanisms are summarized in Table 4, Table 5 and Table 6, respectively.
(2) Pseudo-Second-Order Kinetic Model (PSO)
A pseudo-second-order kinetic analysis was performed for the uranium leaching processes under the four conditions described above. The pseudo-second-order kinetic model is given by Equation (3), where is the uranium recovery (%) and is the equilibrium uranium recovery (%). The final uranium recovery measured at 10 h in Figure 16 was used as an approximate value of . The pseudo-second-order kinetic equation can be linearized as, where the ordinate is y=x/t and the abscissa is x=t. The pseudo-second-order rate constant was determined from the intercept (a) and slope (b) of the fitted linear relationship according to Equation (10):
Figure 20.
Pseudo-second-order kinetic model for uranium ore leaching under different conditions.
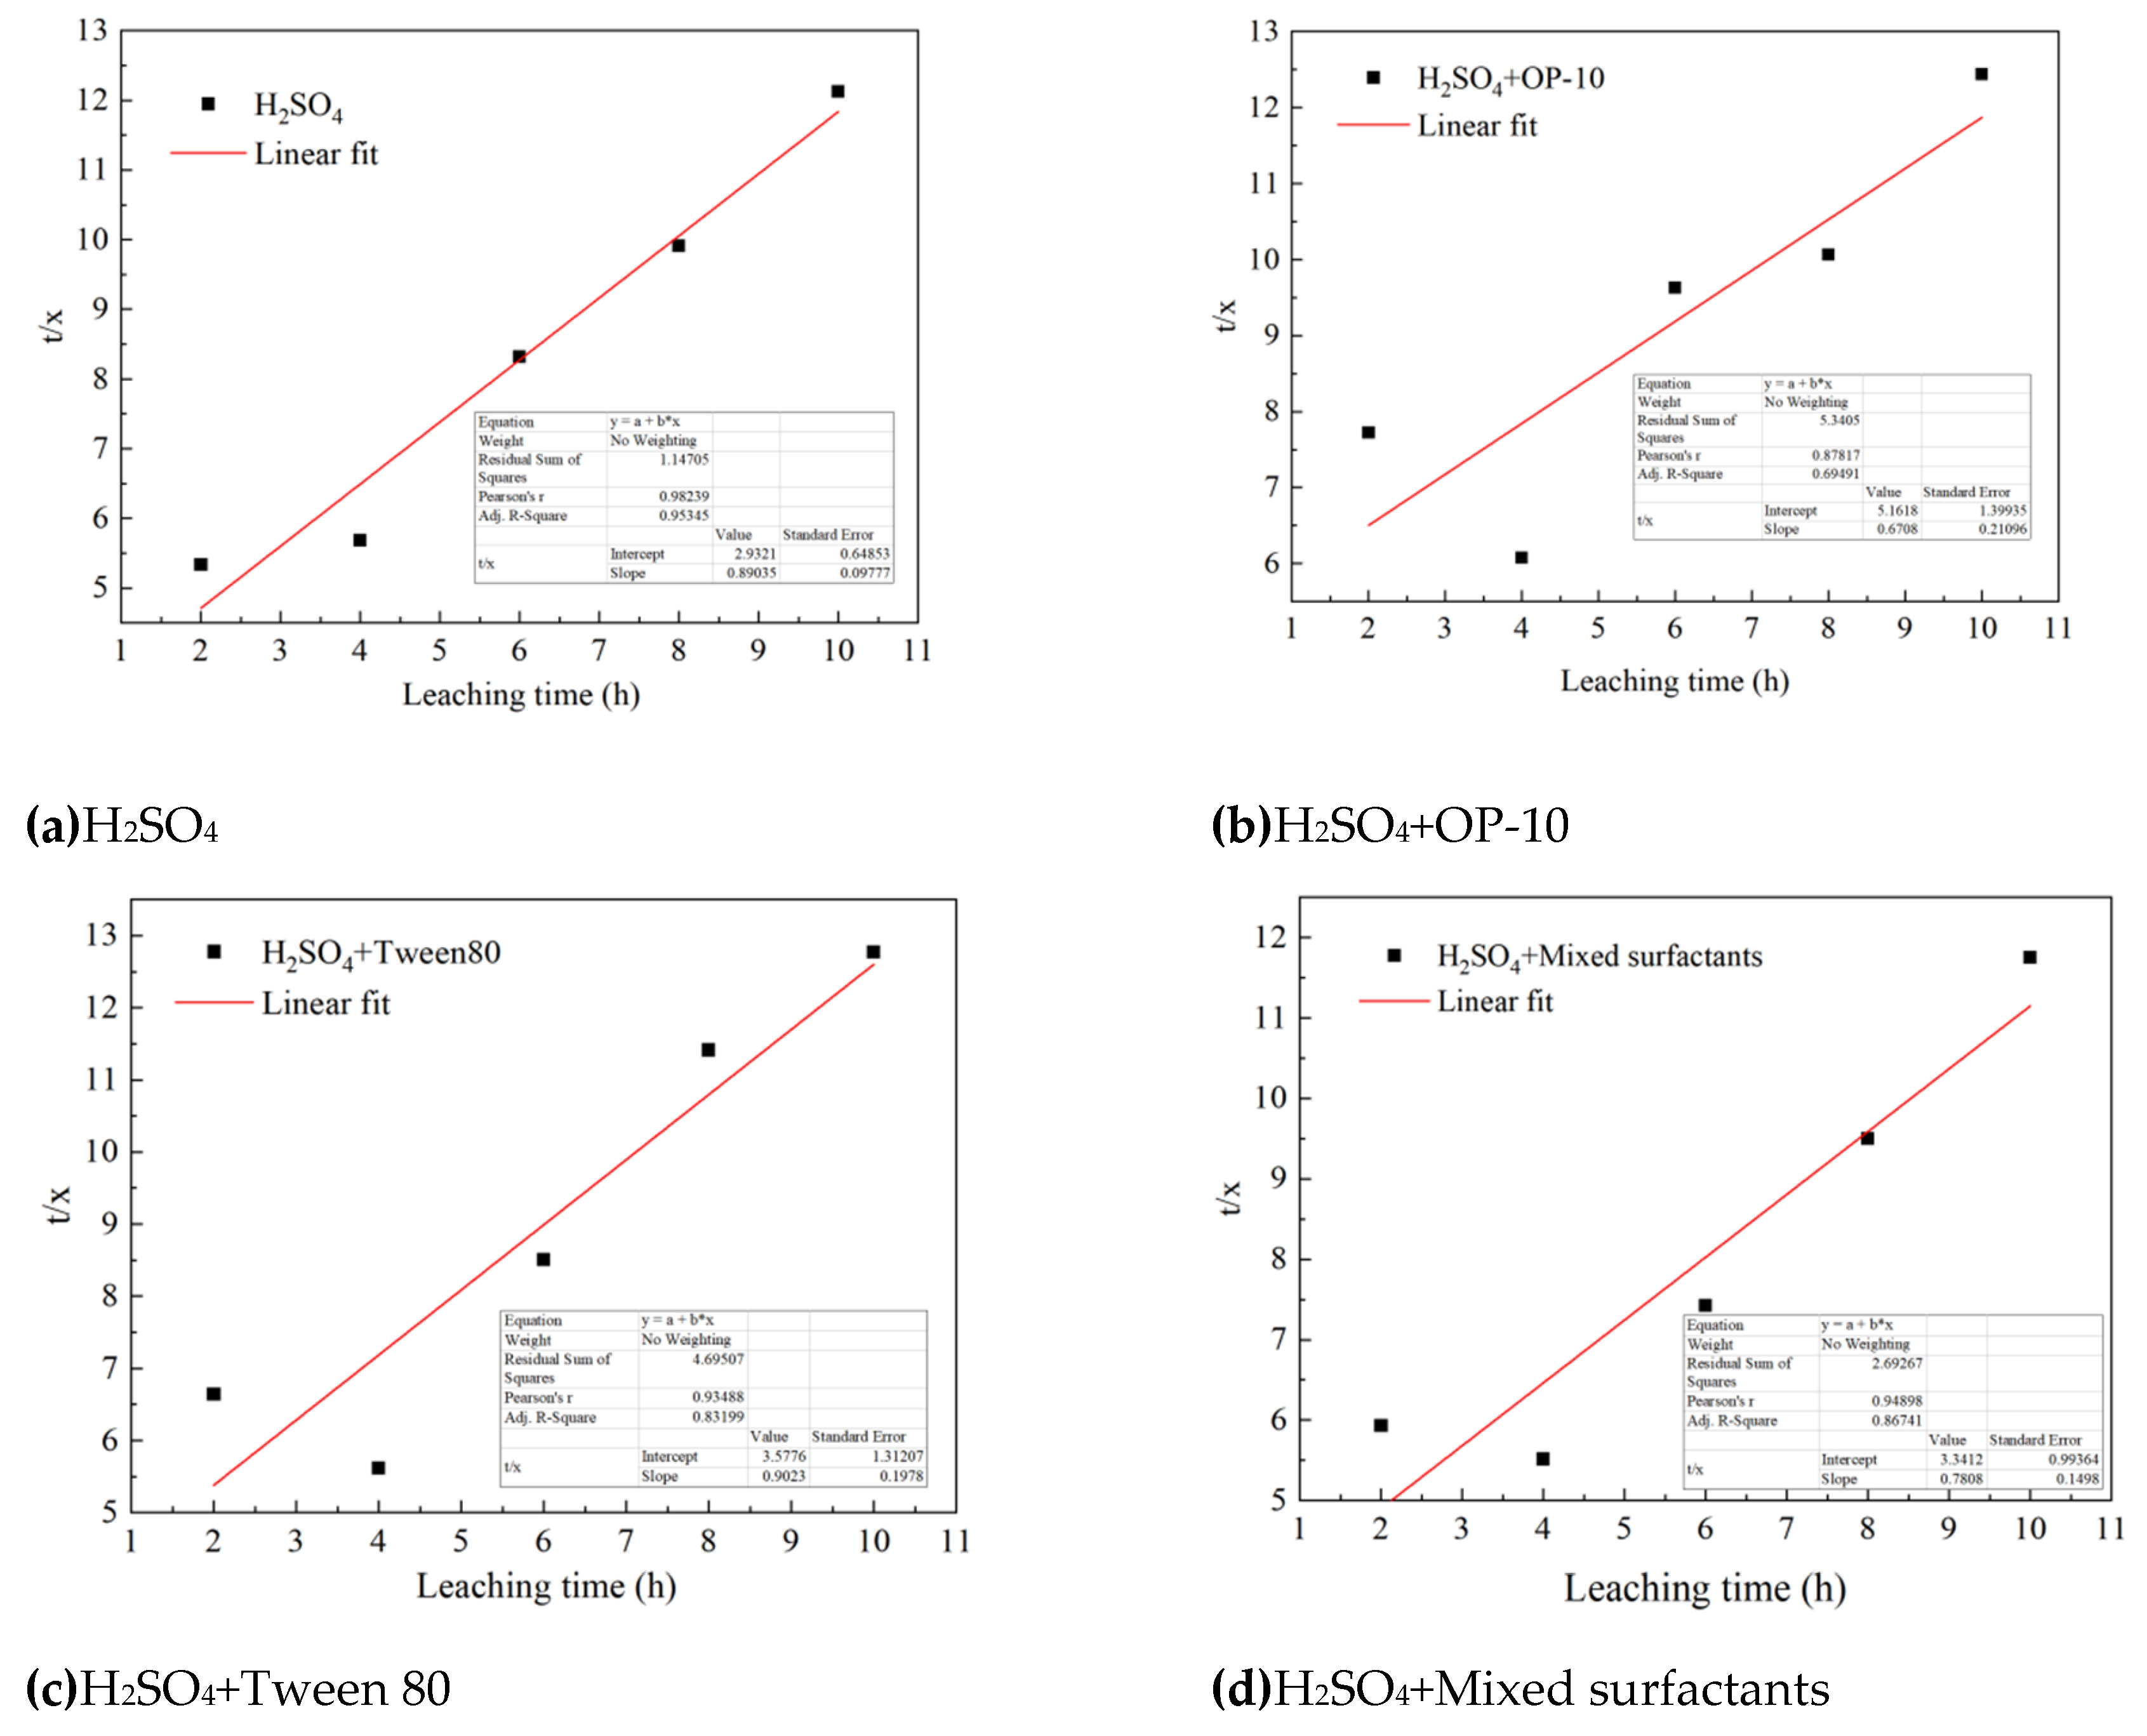
Table 7.
Pseudo-second-order kinetic parameters.
| Leaching conditions | intercept (a) | slope (b) | Rate constant, () | R2 |
| H2SO4 | 2.9321 | 0.8904 | 0.2704 | 0.9651 |
| H2SO4+OP-10 | 5.1618 | 0.6708 | 0.0872 | 0.7712 |
| H2SO4+Tween 80 | 3.5776 | 0.9023 | 0.2276 | 0.8740 |
| H2SO4+Mixed surfactants | 3.3412 | 0.7808 | 0.1825 | 0.9006 |
This study compared the uranium leaching behavior of four systems, namely H₂SO₄, H₂SO₄ + OP-10, H₂SO₄ + Tween 80, and H₂SO₄ + mixed surfactants. The leaching kinetics were analyzed using the Shrinking Core Model (SCM) and the Pseudo-Second-Order (PSO) kinetic model. The main conclusions are as follows:
(ⅰ) The uranium recovery increased with leaching time in all four systems, although different leaching behaviors were observed depending on the surfactant used. The uranium recovery increased rapidly during the first 4 h and then increased more slowly. After 10 h of leaching, the uranium leaching efficiencies of the four systems were approximately 80–85%, with the mixed-surfactant system reaching approximately 85%, the highest among the four systems.
(ⅱ) The shrinking-core model results indicate that the rate-controlling characteristics differ among the leaching systems. For the H₂SO₄ system, the coefficients of determination (R²) for the external diffusion, internal diffusion, and chemical reaction control models were 0.8850, 0.9041, and 0.9186, respectively, with the chemical reaction control model showing the best fit. The corresponding rate constants were 0.04354, 0.0158, and 0.17543 h⁻¹, respectively. Similarly, for the H₂SO₄ + OP-10 system, the chemical reaction control model provided the best fit, with an R² value of 0.9198, whereas the R² values for the external diffusion and internal diffusion models were only 0.7972 and 0.7963, respectively.
(ⅲ) For the Tween 80 system, all three shrinking-core models showed relatively poor fitting performance. The R² values of the external diffusion, internal diffusion, and chemical reaction control models were 0.7320, 0.8083, and 0.8170, respectively. Although the chemical reaction control model exhibited the highest R² value, the fitting performance was insufficient to demonstrate that the overall leaching process could be accurately described by a single rate-controlling step. In contrast, for the mixed-surfactant system, the internal diffusion model yielded an R² value of 0.9080, higher than those of the external diffusion model (0.8334) and the chemical reaction control model (0.9004). The internal diffusion rate constant was 0.01551 h⁻¹, which was close to that of the H₂SO₄ system (0.0158 h⁻¹). These results indicate that the addition of mixed surfactants increased the apparent contribution of diffusion to the leaching process. However, because the chemical reaction control model also exhibited a relatively high goodness of fit, the process is more appropriately interpreted as being jointly influenced by internal diffusion and interfacial chemical reactions rather than being strictly governed by a single rate-controlling step.
(ⅳ) The rate constants obtained from the chemical reaction control model further reveal the kinetic differences among the different systems. The rate constants, k, for the H₂SO₄, H₂SO₄ + OP-10, H₂SO₄ + Tween 80, and H₂SO₄ + mixed surfactant systems were 0.17543, 0.16981, 0.14580, and 0.20266 h⁻¹, respectively. The mixed-surfactant system exhibited the highest rate constant, representing increases of approximately 15.5%, 19.3%, and 39.0% compared with the H₂SO₄, OP-10, and Tween 80 systems, respectively. These results indicate that the combined addition of OP-10 and Tween 80 produces a leaching kinetic response different from those observed when either surfactant is used individually.
(ⅴ) The pseudo-second-order kinetic fitting results reveal kinetic characteristics from a different perspective compared with the shrinking-core model. For the H₂SO₄ system, the pseudo-second-order rate constant(k2)was 0.2704 h⁻¹, with an R² value of 0.9651, representing the best fitting performance among the four systems. The k2 values for the Tween 80 and mixed-surfactant systems were 0.2276 and 0.1825 h⁻¹, respectively, with corresponding R² values of 0.8740 and 0.9006. The OP-10 system exhibited the lowest k2, only 0.0872 h⁻¹, and an R² value of only 0.7712, indicating that the pseudo-second-order model does not adequately describe the entire leaching process in this system.
(ⅵ) Considering both the leaching curves and the two types of kinetic models, the mixed OP-10/Tween 80 system achieved a relatively high uranium recovery at 10 h among the four systems, while its chemical reaction rate constant derived from the shrinking-core model reached 0.20266 h⁻¹. However, the goodness-of-fit results obtained from the different kinetic models indicate that the role of surfactants cannot simply be attributed to an increase in a single kinetic rate constant. The pure H₂SO₄ and OP-10 systems exhibited characteristics more consistent with chemical reaction control, whereas the mixed-surfactant system showed the combined influence of internal diffusion and chemical reactions. In contrast, the Tween 80 system was not adequately described by any single shrinking-core control equation. The addition of mixed surfactants altered the kinetic characteristics of uranium leaching and the relative contributions of the different rate-controlling steps. The relatively high uranium recovery and chemical reaction rate constant of the mixed-surfactant system, together with the comparable goodness of fit of the internal diffusion and chemical reaction control models, suggest that its leaching process is jointly influenced by interfacial chemical reactions and internal diffusion rather than being controlled by a single mass-transfer process.
3.5.2. Column Leaching Kinetic Analysis Results
As shown in Figure 31a, the cumulative uranium recovery increased continuously with leaching time in both column-leaching systems, although the rate of increase gradually decreased as leaching proceeded. The first-order kinetic model provided good fits to the experimental data, with R2 values of 0.981 and 0.976 for the H₂SO₄ and Mixed surfactants + H₂SO₄ systems, respectively. The corresponding apparent rate constants were 0.0418 and 0.0648 d⁻¹. Thus, the addition of the mixed surfactants increased the apparent rate constant by approximately 55%, indicating faster uranium release during column leaching. The linearized plots of ln(1−x)versus time (Figure 31b) gave similar results. The R2 values were 0.988 and 0.983, with rate constants of 0.0472 and 0.0680 d⁻¹ for the H₂SO₄ and Mixed surfactants + H₂SO₄ systems, respectively. Although the rate constants obtained from nonlinear and linearized fitting differed slightly, both approaches consistently showed a higher apparent leaching rate after the addition of the mixed surfactants.
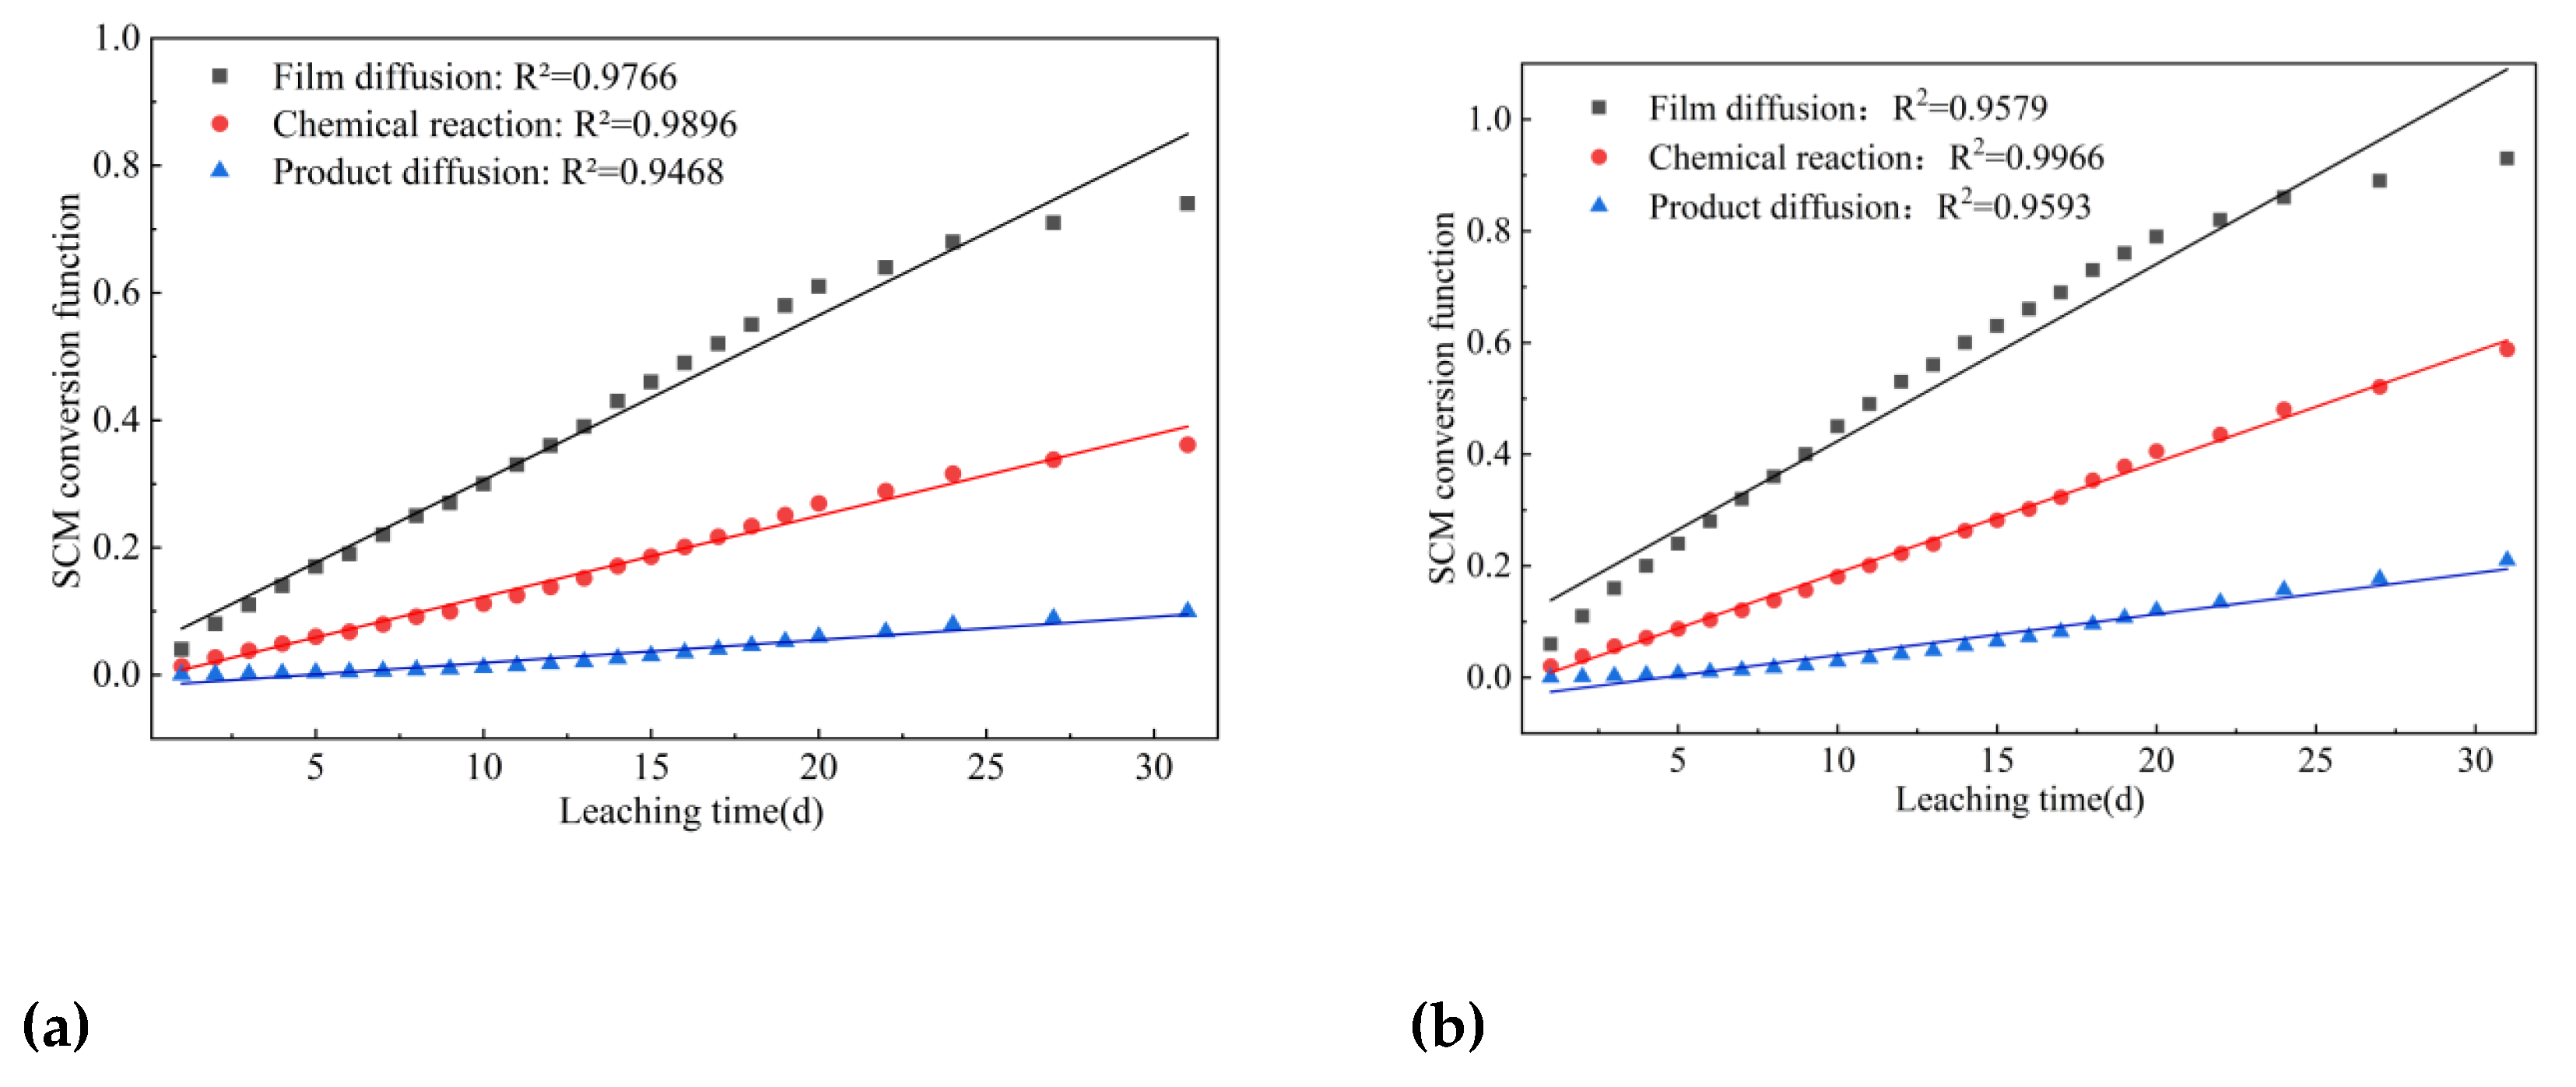
The SCM fitting results are presented in Figure 32. For the H₂SO₄ system, the R2 values obtained for liquid-film diffusion, interfacial chemical reaction, and product-layer diffusion were 0.9766, 0.9896, and 0.9468, respectively. The interfacial chemical-reaction model therefore provided the best fit. A similar trend was observed for the Mixed surfactants + H₂SO₄ system, for which the corresponding R2 values were 0.9579, 0.9966, and 0.9593. The highest R2 value was again obtained for the interfacial chemical-reaction model. These results suggest that, among the SCM expressions examined, the column-leaching kinetics of both systems were most consistent with interfacial chemical reaction as the predominant apparent rate-controlling step. The addition of the mixed surfactants therefore increased the apparent uranium leaching rate without producing an evident change in the predominant SCM control regime.
Nevertheless, the column-leaching process should not be interpreted as being controlled exclusively by the interfacial chemical reaction. The liquid-film-diffusion model also gave relatively high R2 values of 0.9766 for H₂SO₄ and 0.9579 for the mixed-surfactant system, indicating that mass transfer remained relevant to the overall leaching process. Column leaching involves solution percolation through the ore bed, transport from the bulk solution to mineral surfaces, and subsequent interfacial reactions. These kinetic results indicate that, within the SCM framework, interfacial chemical reaction makes the predominant apparent contribution, while mass-transfer resistance remains non-negligible.
Figure 21.
Kinetic analysis of cumulative recovery in leaching experiments.(a)First-order fitting of cumulative recovery. (b)Linearized plots of ln(1-x) versus time for first-order kinetic verification.
Figure 21.
Kinetic analysis of cumulative recovery in leaching experiments.(a)First-order fitting of cumulative recovery. (b)Linearized plots of ln(1-x) versus time for first-order kinetic verification.
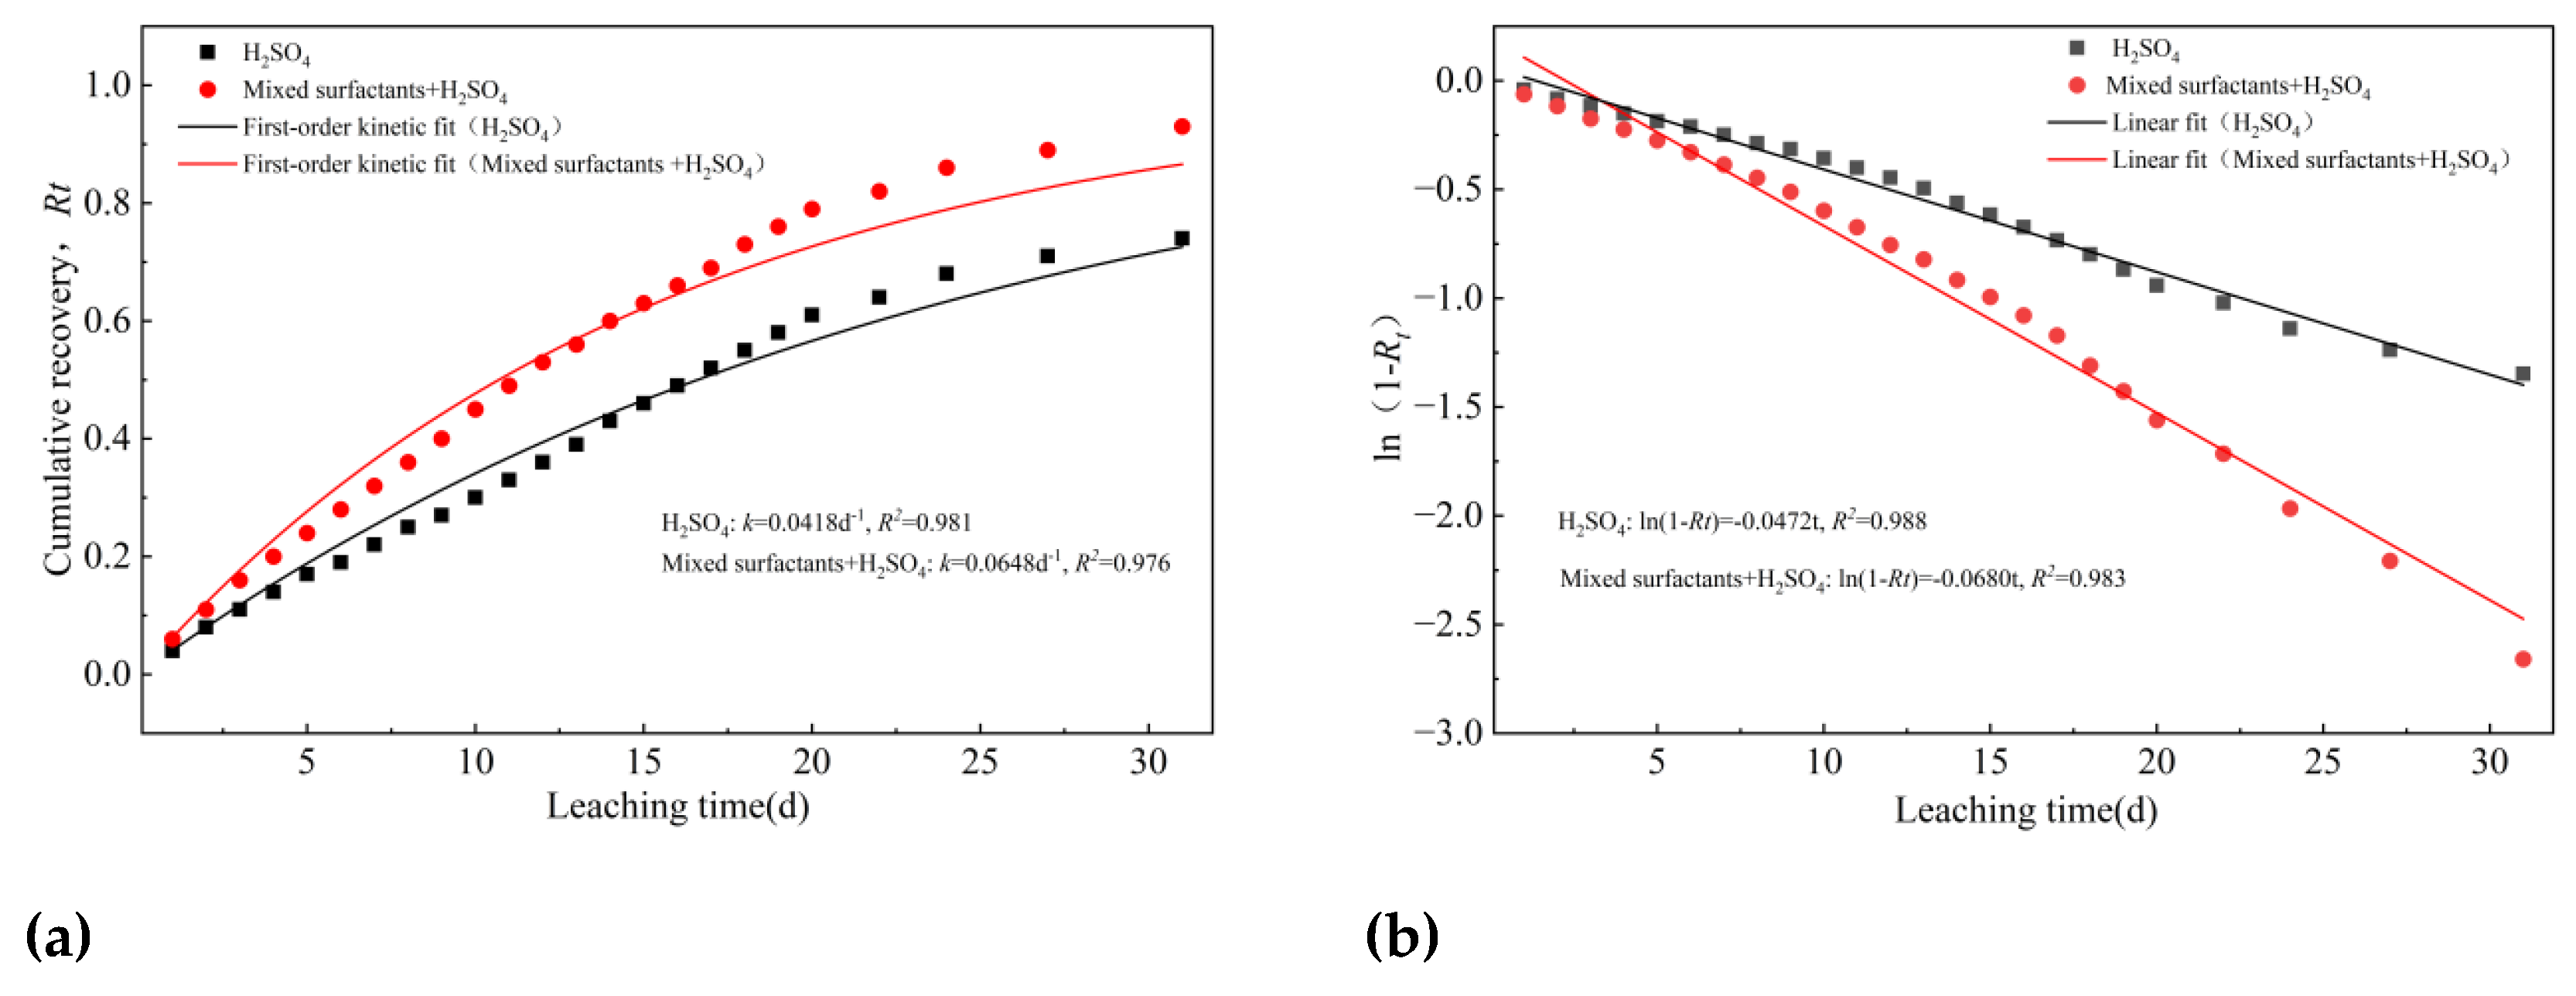
Figure 22.
Shrinking core model (SCM) plots for column leaching under different conditions.(a) H₂SO₄ system.(b) Mixed surfactants+H₂SO₄ system.
Figure 22.
Shrinking core model (SCM) plots for column leaching under different conditions.(a) H₂SO₄ system.(b) Mixed surfactants+H₂SO₄ system.
4. Conclusions
This study investigated the effects of an OP-10/Tween 80 mixed nonionic surfactant system on the sulfuric acid leaching of granite-hosted uranium ore by combining mineralogical and pore-structure characterization, surface-tension measurements, stirring leaching, column leaching, and kinetic analysis. The main conclusions are as follows:
The ore was mainly composed of quartz, feldspar, and other aluminosilicate minerals, with a uranium content of approximately 787.5 ppm. Both the mineral assemblage and uranium distribution were heterogeneous. N₂ adsorption and mercury intrusion porosimetry (MIP) showed that the ore contained a multiscale pore system consisting of mesopores, macropores, and pore throats. The BET specific surface area was 5.424 m².g⁻¹, the BJH average pore diameter was 11.956 nm, and the MIP porosity was 18.64%. This pore structure provides pathways for leaching solution penetration into the ore, while the heterogeneous pore-size distribution and pore-throat restrictions may also result in local mass-transfer limitations.
(2) Both OP-10 and Tween 80 altered the interfacial properties of the solution, although OP-10 exhibited a stronger ability to reduce surface tension within the investigated concentration range. The surface tension of the OP-10/Tween 80 mixed system was jointly affected by the total surfactant concentration and mixing ratio. When the final total surfactant concentration reached approximately 0.10 g·L⁻¹., further increases in concentration produced only a limited additional decrease in surface tension. At approximately 0.10 g·L⁻¹, the 3:1 OP-10/Tween 80 mixture exhibited one of the lower surface-tension values and was therefore selected as a favorable interfacial condition for the subsequent leaching experiments.
(3) Surfactant addition clearly enhanced uranium leaching in the sulfuric acid system. At 20 g·L⁻¹. H₂SO₄ and 30 °C, the uranium leaching efficiencies after 10 h of stirring leaching were approximately 72.4%, 84.0%, and 87.8% for the H₂SO₄, H₂SO₄ + OP-10, and H₂SO₄ + mixed surfactants systems, respectively, with the mixed-surfactant system showing the highest extraction recovery. SCM analysis indicated that the H₂SO₄ and OP-10 systems were better described by the interfacial chemical-reaction model. For the mixed surfactants system, the R2 values of the internal-diffusion and chemical-reaction models were 0.9080 and 0.9004, respectively, suggesting that both intraparticle mass transfer and interfacial reaction contributed to the apparent leaching kinetics. The apparent rate constant obtained from the chemical-reaction model for the mixed-surfactant system was 0.20266 h⁻¹, which was higher than those of the other three systems. However, this parameter should be interpreted together with the fitting performance of the different kinetic models rather than being used alone as evidence for a change in the rate-controlling mechanism.
(4) The enhancing effect of OP-10/Tween 80 was more pronounced under column-leaching conditions. After 31 d, the cumulative uranium recovery reached approximately 92.6% in the mixed-surfactant system, compared with approximately 74.0% for the H₂SO₄-only system, corresponding to an increase of 18.6 percentage points. Nonlinear first-order kinetic fitting showed that the apparent rate constant increased from 0.0418 to 0.0648 d⁻¹, representing an increase of approximately 55%. The SCM results showed that the interfacial chemical-reaction model provided the best fit for both column-leaching systems, although the liquid-film-diffusion model also yielded relatively high R2 values, indicating that mass-transfer resistance remained relevant. Considering the pore structure, interfacial properties, and kinetic results together, the enhancement produced by the OP-10/Tween 80 mixture is more reasonably attributed to improved mineral–solution interfacial conditions and greater accessibility of reactive regions. These effects allowed the acidic leaching solution to contact uranium-bearing regions within the ore more effectively, thereby increasing both the apparent column-leaching rate and the final uranium recovery.
Although the OP-10/Tween 80 mixed system improved uranium extraction and affected the apparent leaching kinetics, the relationship between interfacial regulation and pore-scale mass transfer remains unclear. Future studies should combine contact-angle and surfactant adsorption measurements with pore-structure characterization and three-dimensional imaging to clarify surfactant–mineral interactions and transport pathways. The effects of particle size, surfactant concentration, and OP-10/Tween 80 ratio should also be systematically evaluated through longer-term and larger-scale column tests. Establishing quantitative relationships among interfacial properties, pore evolution, and kinetic parameters would provide a stronger basis for applying mixed nonionic surfactants to hard-rock uranium leaching.
Author Contributions
Conceptualization,H.L.; data curation, H.Q.; funding acquisition, H.L. and H.Q.; investigation, H.Q., L.L., L.K., Q.F. and Z.C.; methodology, H.Q.; resources, Z.L.; supervision, L.L.; validation, H.Q.; visualization, H.L.; writing-original draft, H.Q.; writing—review and editing, H.L. All authors have read and agreed to the published version of the manuscript.
Funding
This research was funded by the Guangdong Provincial College Students' Innovation and Entrepreneurship Training Program (grant number S202410576046), the Shaoguan University Research Project (grant number SY2023KJ13), and the Shaoguan University Startup Fund for Introduced Talents (grant number 408-99000629).
Institutional Review Board Statement
Not applicable.
Informed Consent Statement
Not applicable.
Data Availability Statement
Data is contained within the article.
Acknowledgments
The writing process of the paper received support from Shaoguan Jinyuan Uranium Industry Co., Ltd., CNNC. The authors express their gratitude.
Conflicts of Interest
The authors declare no conflict of interest.
References
- Zhang, Z.; Li, J.; Li, H.; Guo, J.; Chen, Y.; Su, X.; Hua, R. Research on conventional leaching process and leaching kinetics of a hard rock uranium mine. J. Radioanal. Nucl. Chem. 2023, 332, 4929–4942. [CrossRef]
- Zeng, S.; Li, J.; Tan, K.; Zhang, S. Fractal kinetic characteristics of hard-rock uranium leaching with sulfuric acid. R. Soc. Open Sci. 2018, 5, 180403. [CrossRef]
- Wang, J.; Sun, Z.; Li, G.; Liu, Y.; Zhou, Z.; Wang, X.; Zheng, Z.; Zhou, Y.; Zhao, K.; Xiang, L.; Wei, J. Geochemistry and acid hydrometallurgy accessibility of uraninite from Mianhuakeng granite-hosted uranium deposit, South China. Minerals 2020, 10, 747. [CrossRef]
- Wang, S.; Lian, M.; Ding, D.; He, G.; Fu, H. Evolution of pore structure and reactive transport parameters during acid leaching of sandstone uranium ore. Hydrometallurgy 2024, 226, 106301. [CrossRef]
- Qi, Z.; Li, J.; Zhong, F.; Wang, L.; Xue, Q. Synergistic control of particle size and fractal dimension of granite-hosted uranium ores for leaching efficiency optimization. Miner. Eng. 2026, 237, 109967. [CrossRef]
- Zeng, S.; Shen, Y.; Sun, B.; Zhang, N.; Zhang, S.; Feng, S. Pore structure evolution characteristics of sandstone uranium ore during acid leaching. Nucl. Eng. Technol. 2021, 53, 4033–4041. [CrossRef]
- Liu, X.F.; Liu, J.H.; He, T.; Yang, Y.H.; Xing, Y.G.; Wang, R.Y.; Liang, D.Y.; Yan, X.R.; Huang, J. Spatiotemporal evolution of ore-bearing aquifer permeability during acid in-situ uranium leaching. Nonferrous Met. Extr. Metall. 2025, 5, 78-88 (In Chinese). [CrossRef]
- Zhou, X.; Sun, J.; Li, Q.; Li, G.; Li, S.; Xiao, L.; Shu, H.; Fu, H.; Li, T.; Wang, Y.; Cui, Z.; Xie, G. Time-dependent citrate-mediated precipitation inhibition in uranium column leaching: Mechanistic insights into pore evolution and uranium migration. J. Hazard. Mater. 2026, 514, 142812. [CrossRef]
- Zhao, L.; Deng, J.; Xu, Y.; Zhang C. Mineral alteration and pore-plugging caused by acid in situ leaching: A case study of the Wuyier uranium deposit, Xinjiang, NW China. Arab. J. Geosci. 2018, 11, 707. [CrossRef]
- Liu, Y.; Liu, J.; Yang, Y.; Wang, J.; Zhou, Y.; Wei, M.; Zheng, W. Leaching and Kinetics Characteristics of Uranium from Hadatu Uranium Ore in Inner Mongolia by Acid Method. Nonferrous Met. Extr. Metall. 2025, 2, 217–228 (In Chinese). [CrossRef]
- Li, T.; Li, G.; Liu, X.; Sun, J.; Li, Q.; Cui, Z. Enhanced oxidative sulfuric acid leaching of granite-type uranium ore by oxygen nanobubbles: Kinetics and mechanism. Nucl. Eng. Technol. 2025, 57, 103608. [CrossRef]
- Ai, C.; Wang, S.; Liu, C.; Li, T. Experimental study on the influence of surfactants on ore surface wettability. ACS Omega. 2024, 9, 1056–1068. [CrossRef]
- Kang, S.; Jeong, H.Y. Sorption of a nonionic surfactant Tween 80 by minerals and soils. J. Hazard. Mater. 2015, 284, 143–150. [CrossRef]
- Ai, C.M.; Sun, P.P.; Wang, Y.M.; Liu, C. Research and application status on the surfactants in solution mining. Metal Mine 2019, 5, 9–13 (In Chinese). [CrossRef]
- Zeng, S.; Sun, J.; Sun, B.; Chen, S.; Zhao, J.; Yang, L. Experimental investigation on the influence of surfactant to the seepage characteristics of acid leaching solution during in-situ leaching of uranium. J. Radioanal. Nucl. Chem. 2023, 332, 3651–3660. [CrossRef]
- Feng, J.; Guo, J.; Tang, R.; Li, J.; Su, X.; Hua, R. The effect of surfactants on the efficiency and consumption reduction of acid stirred leaching of uranium ore. J. Radioanal. Nucl. Chem. 2024, 333, 1873–1881. [CrossRef]
- Li, J.; Feng, J.; Xue, J.; Huang, Y.; Zhang, Z.; Li, H.; Chen, Y.; Guo, J.; Su, X.; Hua, R. The influence of surfactants on the acid leaching process of a uranium mine in Inner Mongolia. J. Radioanal. Nucl. Chem. 2024, 333, 5845–5855. [CrossRef]
- Tan, K.; Li, C.; Liu, J.; Qu, H.; Xia, L.; Hu, Y.; Li, Y. A novel method using a complex surfactant for in-situ leaching of low permeable sandstone uranium deposits. Hydrometallurgy 2014, 150, 99–106. [CrossRef]
- Du, R.; Zhang, X.; Li, M.; Wu, X.; Liu, Y.; Jiang, T.; Chen, C.; Peng, Y. Leaching of low permeable sandstone uranium ore using auxiliary materials: Anionic surfactants. J. Radioanal. Nucl. Chem. 2019, 322, 839–846. [CrossRef]
- Cai, G.L.; Tan, K.X.; Wang, W.G. Effect of different surfactant on leaching of uranium in sandstone type ores with low permeability. Adv. Mater. Res. 2013, 634–638, 3335–3338. [CrossRef]
- Lv, Y.; Lv, J.W.; Zhou, J.L.; Shen, J. Surfactant accelerating leaching of uranium ores. Adv. Mater. Res. 2014, 1051, 166–170. [CrossRef]
- Hu, P.; Tan, K.X.; Li, C.G.; Xia, L.S. Selection of surfactants for in-situ leaching of low permeable sandstone uranium deposits. Modern Mining 2016, 32, 14–16, (In Chinese). [CrossRef]
- Lü, Y.; Lü, J.W.; Zhou, J.L.; Shen, J. Surfactant study on promoting leaching rate of uranium. Chin. J. Rare Met. 2016, 40, 182–187. (In Chinese). [CrossRef]
- Dickinson, C.F.; Heal, G.R. Solid-liquid diffusion controlled rate equations. Thermochim. Acta 1999, 340–341, 89–103. [CrossRef]
- Crundwell, F.K. The mechanism of dissolution of minerals in acidic and alkaline solutions: Part I—A new theory of electrochemical dissolution. Hydrometallurgy 2014, 149, 265–275. [CrossRef]
- Ho, Y.S.; McKay, G. Pseudo-second order model for sorption processes. Process Biochem. 1999, 34, 451–465. [CrossRef]
- Tran, H.N.; You, S.J.; Hosseini-Bandegharaei, A.; Chao, H.P. Mistakes and inconsistencies regarding adsorption of contaminants from aqueous solutions: A critical review. Water Res. 2017, 120, 88–116. [CrossRef]
- Saldaña, M.; Gálvez, E.; Robles, P.; Castillo, J.; Toro, N. Copper mineral leaching mathematical models—A review. Materials 2022, 15, 1757. [CrossRef]
- Ferrier, R.J.; Cai, L.; Lin, Q.; Gorman, G.J.; Neethling, S.J. Models for apparent reaction kinetics in heap leaching: A new semi-empirical approach and its comparison to shrinking core and other particle-scale models. Hydrometallurgy 2016, 166, 22–33. [CrossRef]
- Madakkaruppan, V.; Pius, A.; Sreenivas, T.; Sunilkumar, T.S. Behaviour of Si, Al, Fe and Mg during oxidative sulfuric acid leaching of low grade uranium ore: A kinetic approach. Journal of Environmental Chemical Engineering, 2019, 7: 103139. http://. [CrossRef]
- Bagus, P.S.; Ilton, E.S.; Nelin, C.J. Theoretical modeling of the uranium 4f XPS for U(VI) and U(IV) oxides. J. Chem. Phys. 2013, 139, 244704. [CrossRef]
- Schindler, M.; Hawthorne, F.C.; Freund, M.S; Burns P.C. XPS spectra of uranyl minerals and synthetic uranyl compounds I: The U 4f spectrum. Geochim. Cosmochim. Acta 2009, 73, 2471–2484. [CrossRef]
- Ilton, E. S.; Bagus, P. S. XPS determination of uranium oxidation states.Surface and Interface Analysis, 2011, 43, 1549–1560. [CrossRef]
Figure 1.
Schematic diagram of the up-flow column leaching apparatus.
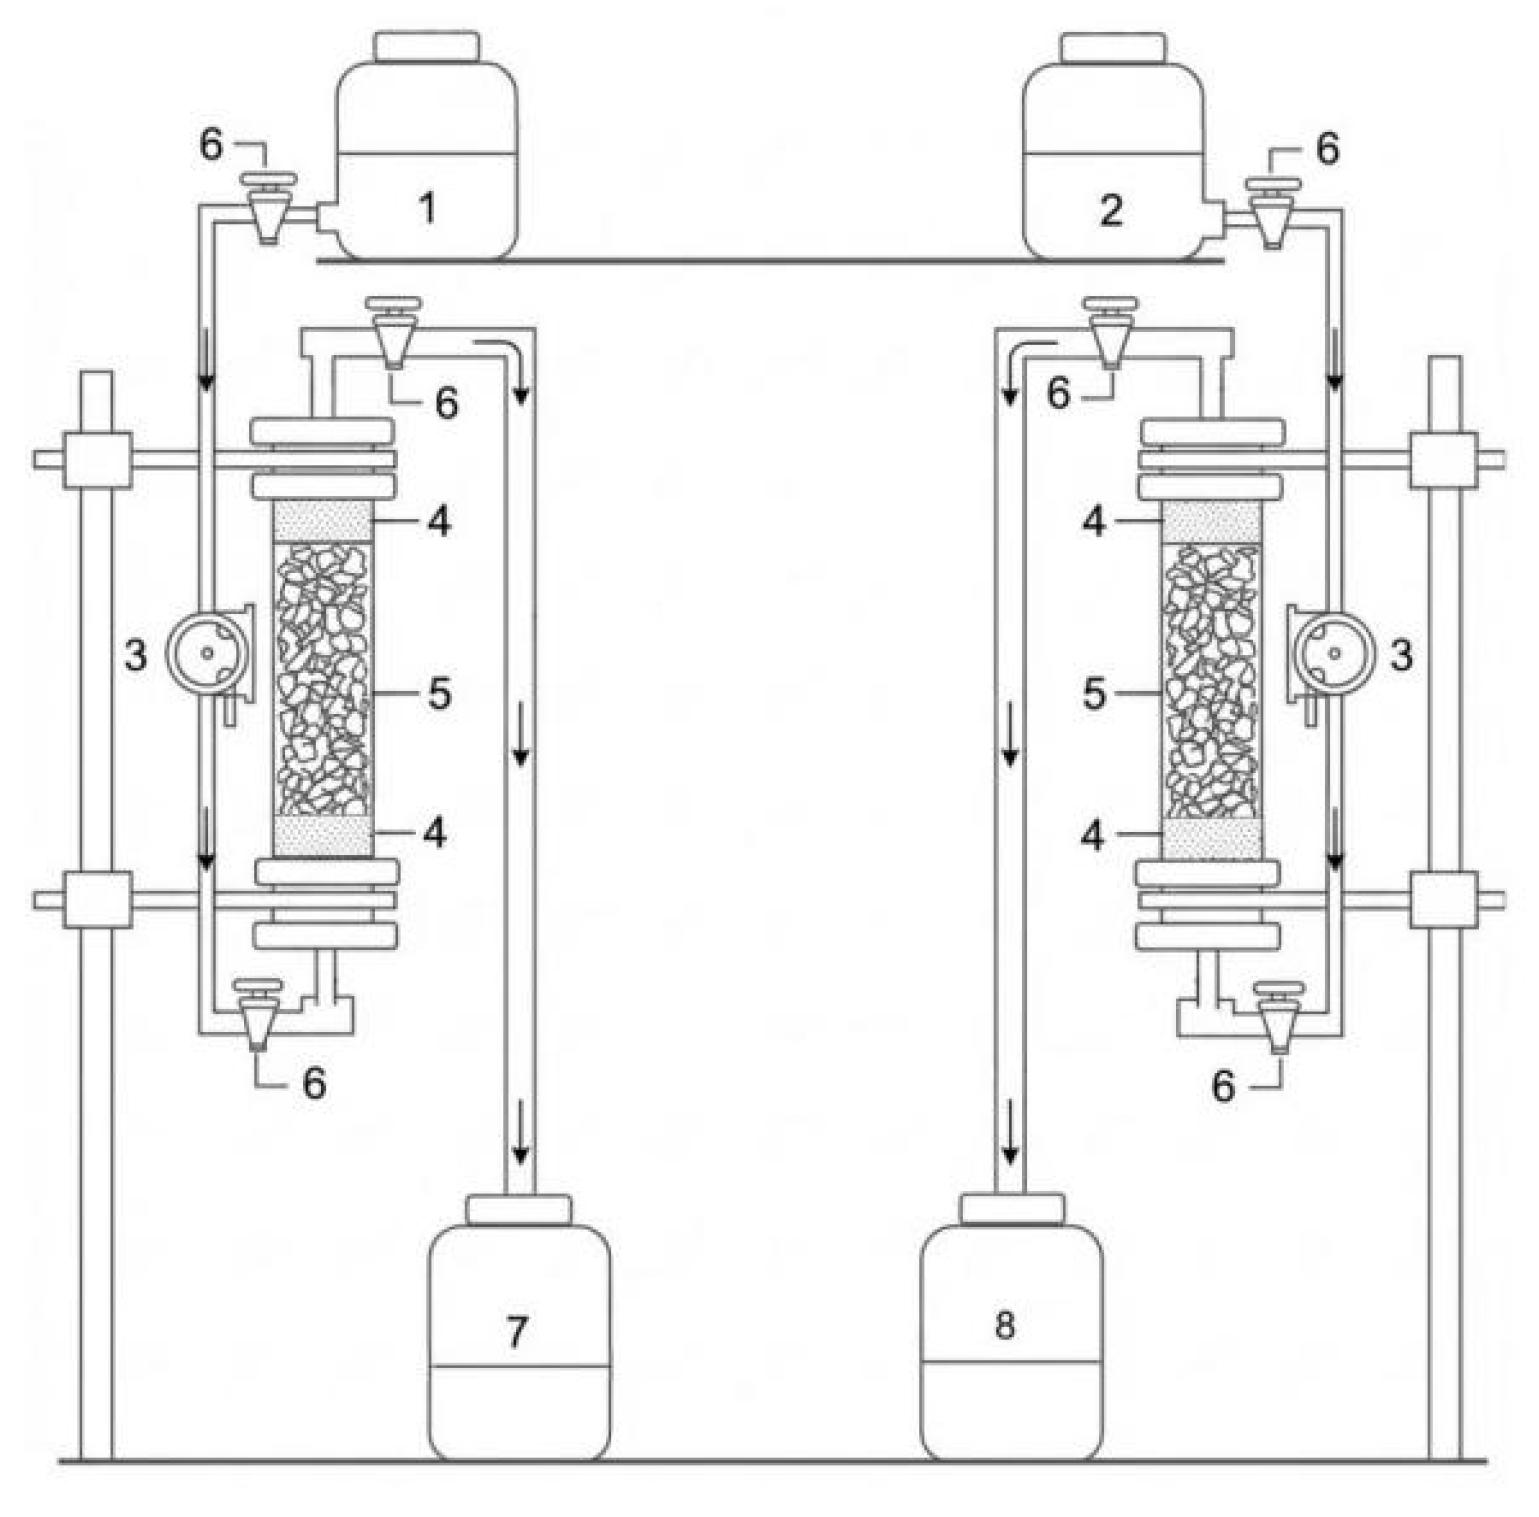
Figure 3.
XPS spectra of the raw ore and uranium ore residues obtained under different leaching conditions: O 1s spectrum of the raw ore; (b) O 1s spectrum of the residue after sulfuric acid stirring leaching; (c) O 1s spectrum of the residue after sulfuric acid + mixed surfactants (OP-10 /Tween 80) stirring leaching; (d) C 1s spectrum of the raw ore; (e) C 1s spectrum of the residue after sulfuric acid stirring leaching; (f) C 1s spectrum of the residue after sulfuric acid + mixed surfactants (OP-10/Tween 80)stirring leaching; (h) U 4f spectrum of the raw ore; (i) U 4f spectrum of the residue after sulfuric acid stirring leaching; (j) U 4f spectrum of the residue after sulfuric acid + mixed surfactants (OP-10/Tween 80) stirring leaching; (k) Survey spectrum of the raw ore; (l) Survey spectrum of the residue after sulfuric acid stirring leaching; (m) Survey spectrum of the residue after sulfuric acid + mixed surfactants (OP-10/Tween 80) stirring leaching.
Figure 3.
XPS spectra of the raw ore and uranium ore residues obtained under different leaching conditions: O 1s spectrum of the raw ore; (b) O 1s spectrum of the residue after sulfuric acid stirring leaching; (c) O 1s spectrum of the residue after sulfuric acid + mixed surfactants (OP-10 /Tween 80) stirring leaching; (d) C 1s spectrum of the raw ore; (e) C 1s spectrum of the residue after sulfuric acid stirring leaching; (f) C 1s spectrum of the residue after sulfuric acid + mixed surfactants (OP-10/Tween 80)stirring leaching; (h) U 4f spectrum of the raw ore; (i) U 4f spectrum of the residue after sulfuric acid stirring leaching; (j) U 4f spectrum of the residue after sulfuric acid + mixed surfactants (OP-10/Tween 80) stirring leaching; (k) Survey spectrum of the raw ore; (l) Survey spectrum of the residue after sulfuric acid stirring leaching; (m) Survey spectrum of the residue after sulfuric acid + mixed surfactants (OP-10/Tween 80) stirring leaching.
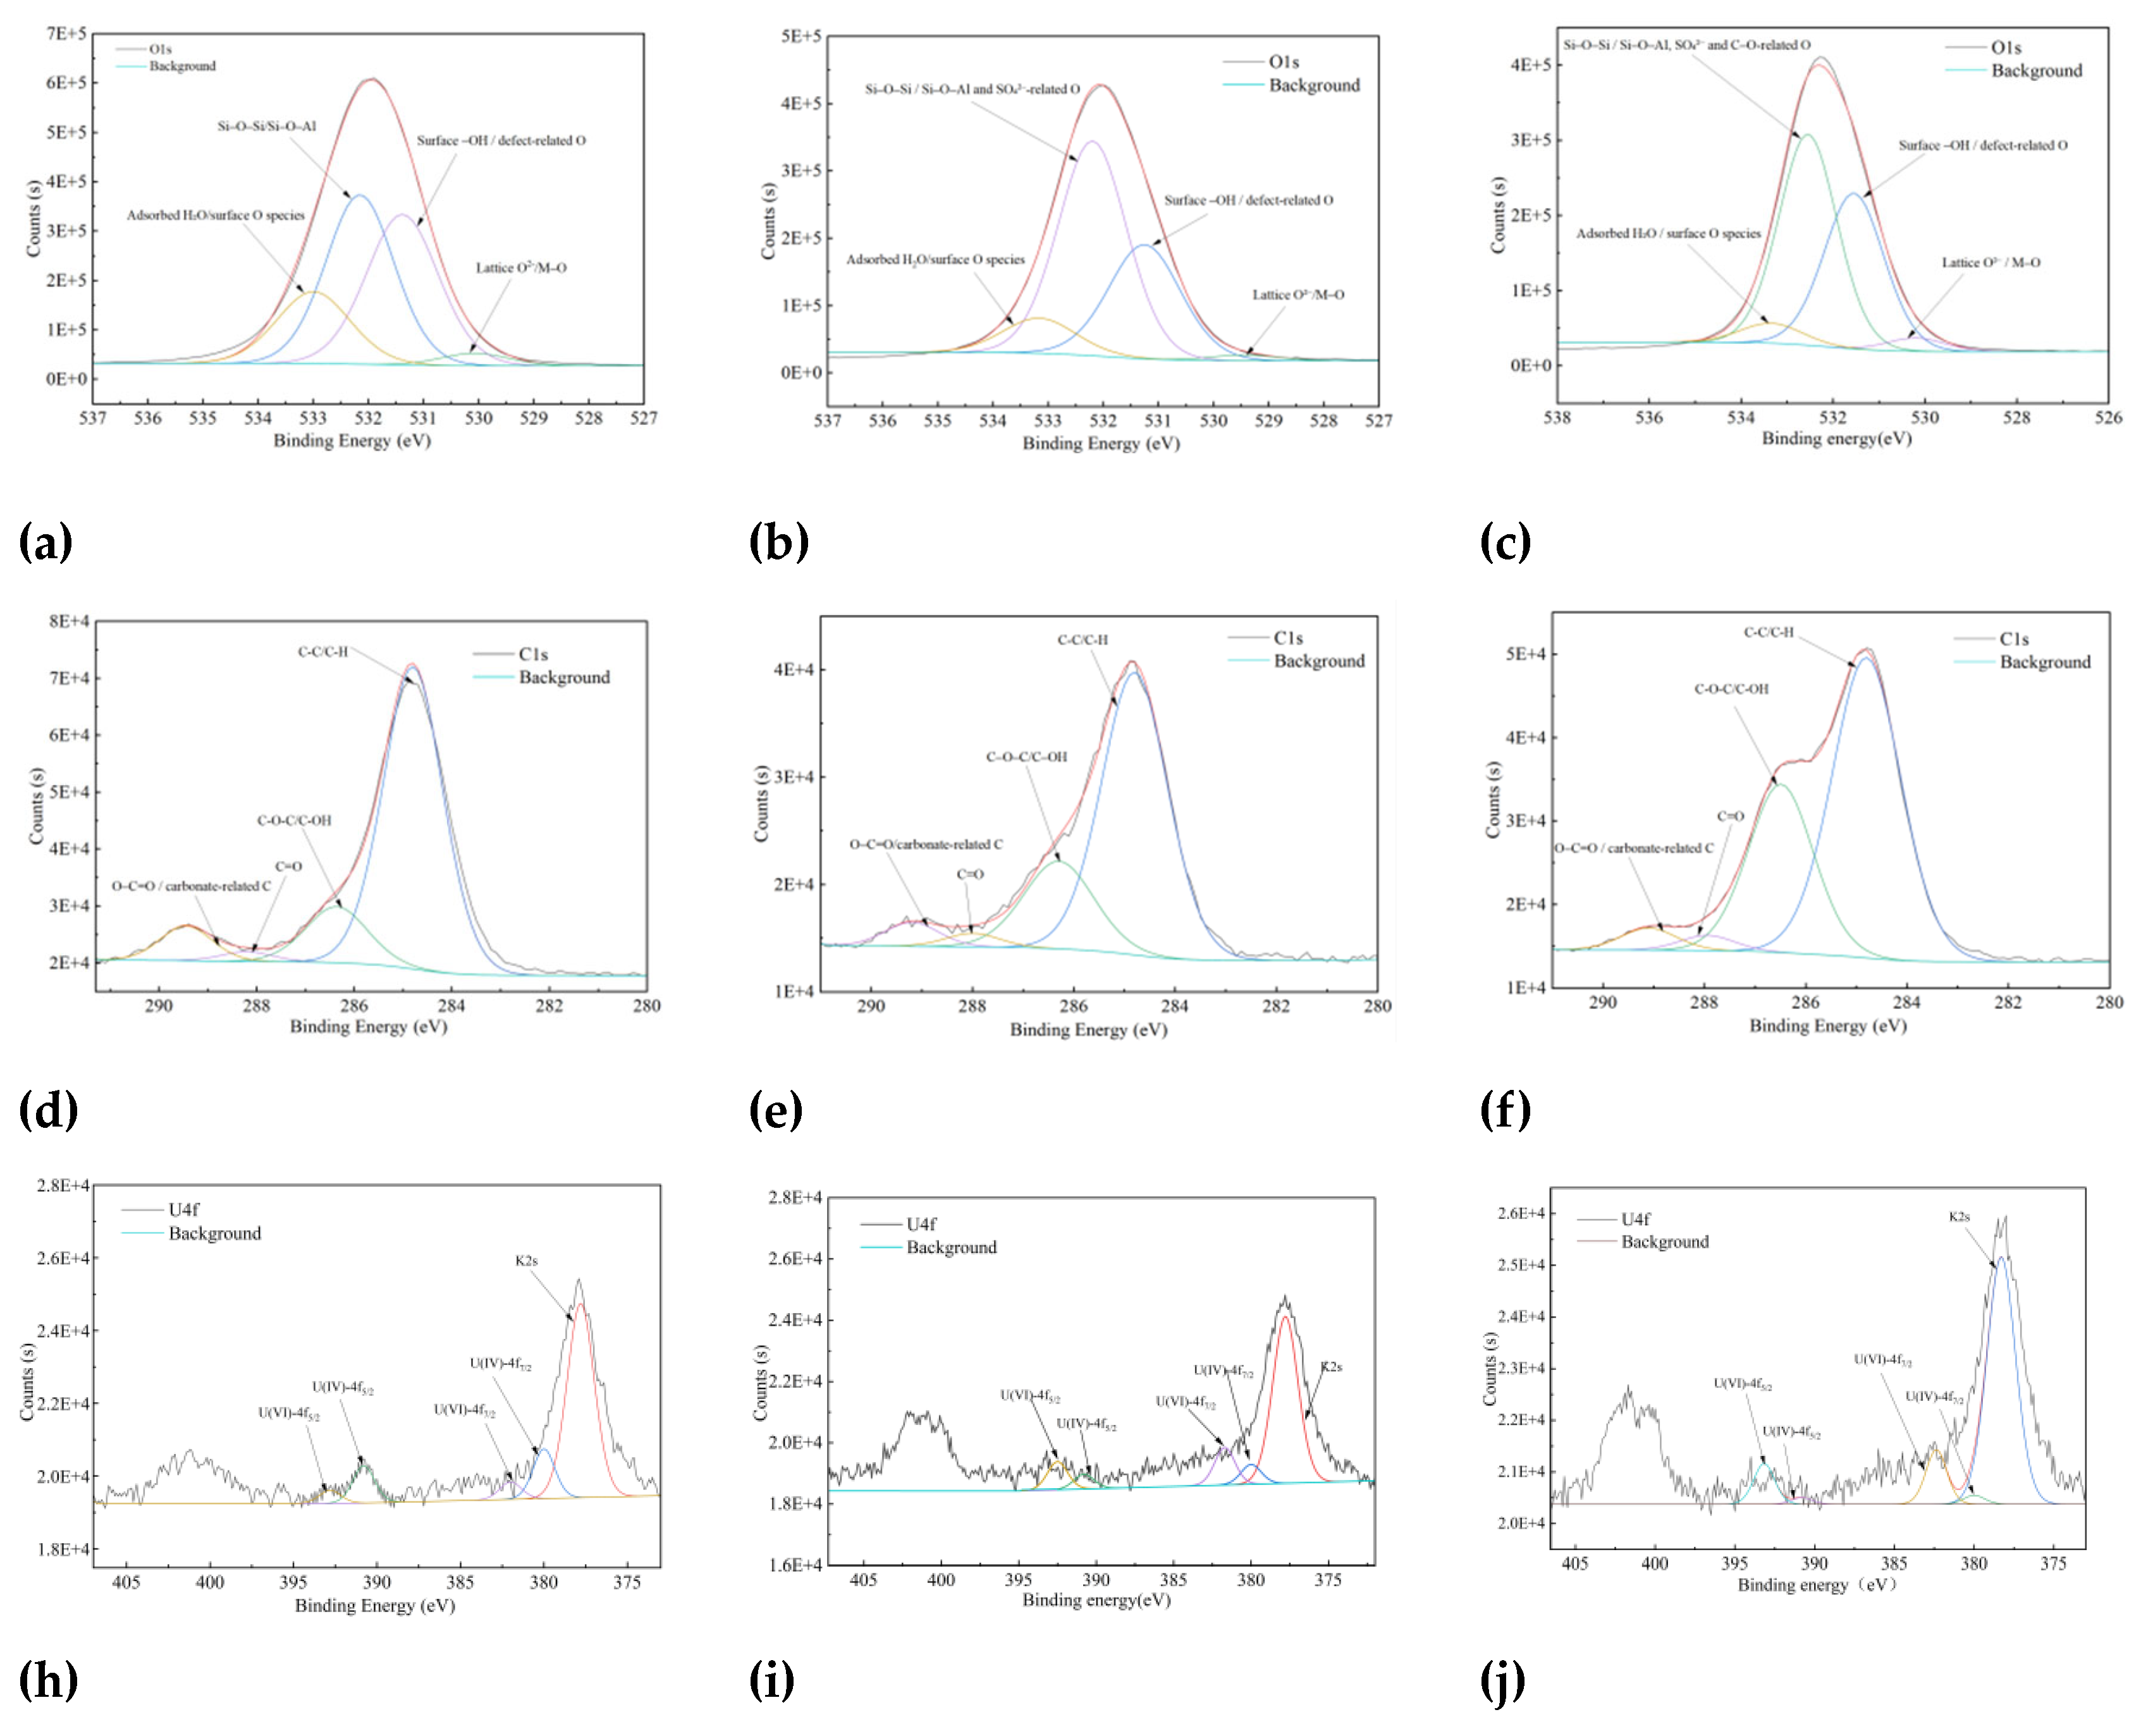
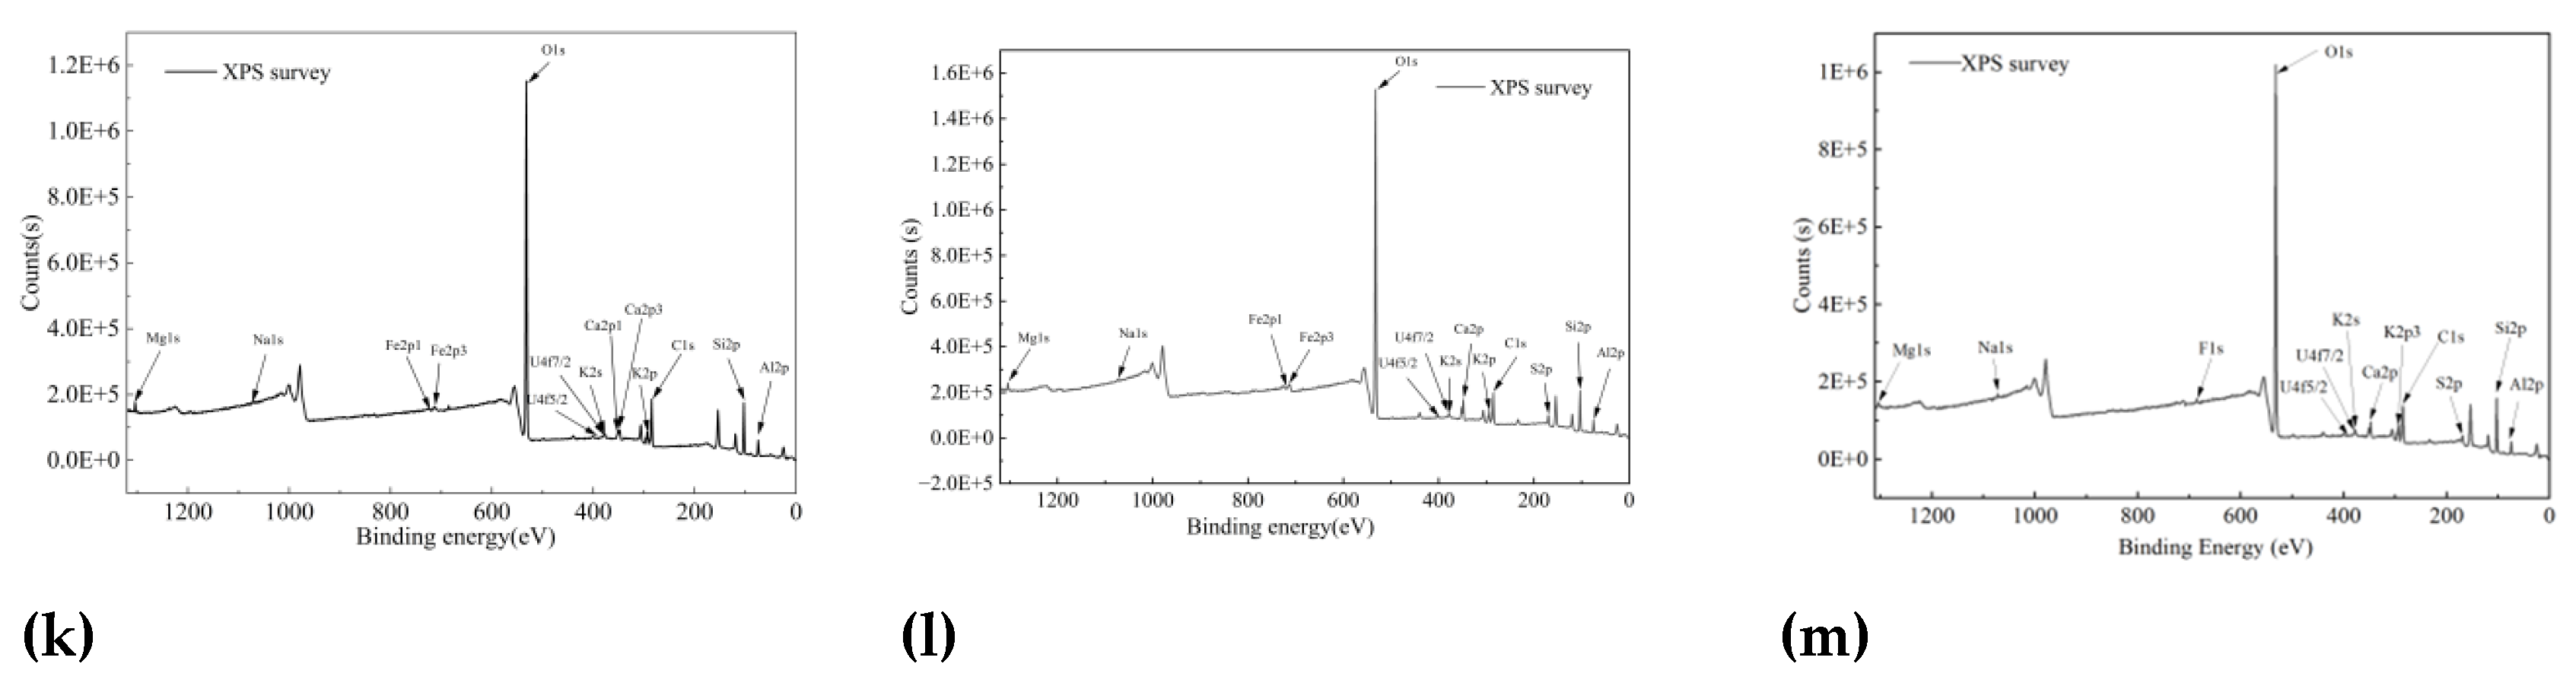
Figure 6.
N₂ adsorption–desorption isotherm of the granite-hosted uranium ore sample at 77.3 K.
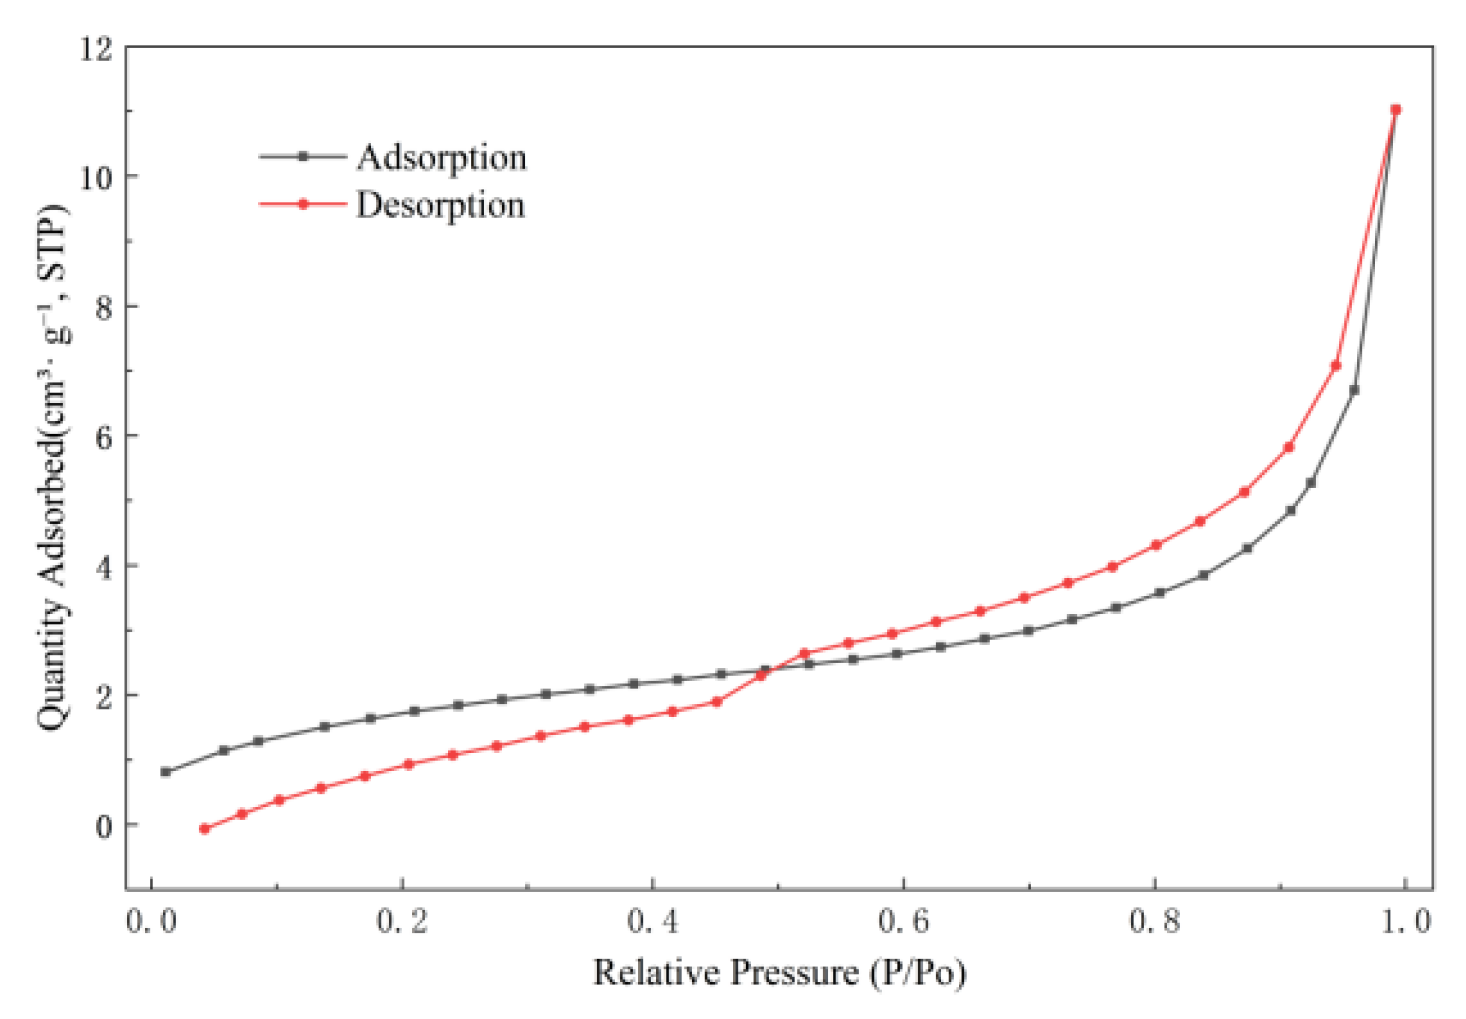
Figure 9.
Comparative Fourier-transform infrared spectroscopy (FTIR) spectra of raw ore versus leached slag under different conditions.
Figure 9.
Comparative Fourier-transform infrared spectroscopy (FTIR) spectra of raw ore versus leached slag under different conditions.
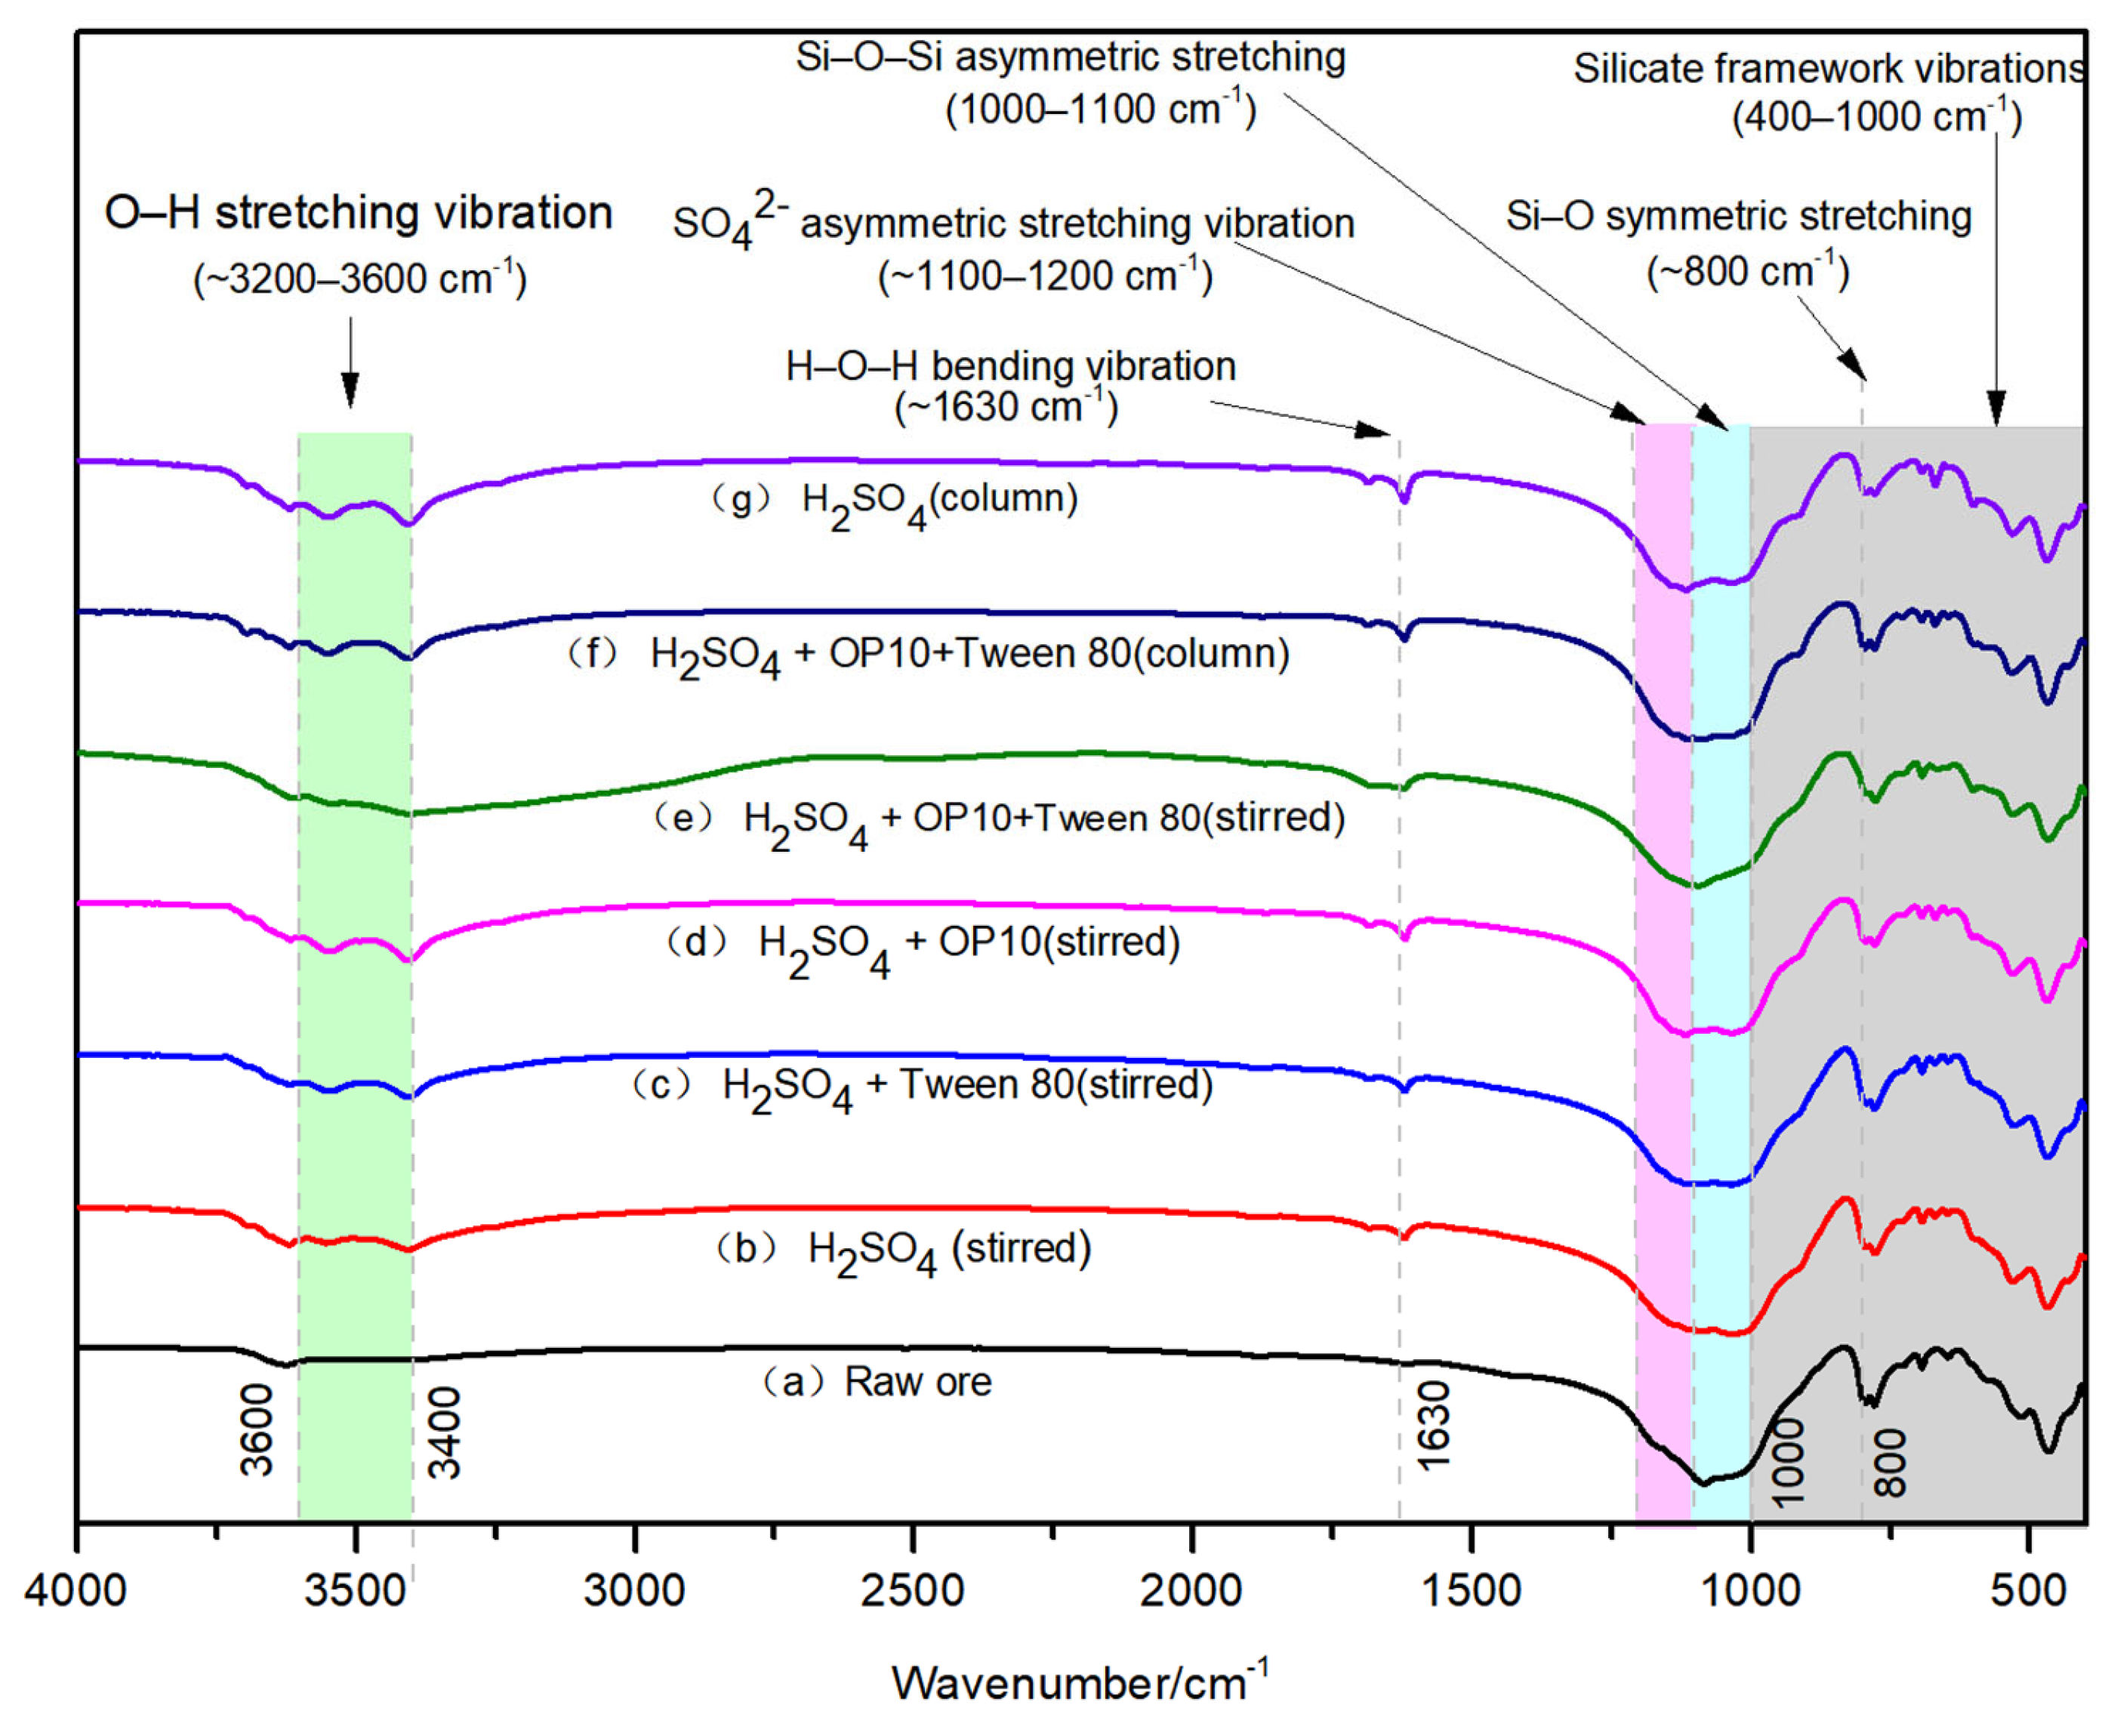
Figure 11.
Effect of sulfuric acid mass concentration on uranium recovery under three different systems (temperature: 30°C; leaching time: 4 h).
Figure 11.
Effect of sulfuric acid mass concentration on uranium recovery under three different systems (temperature: 30°C; leaching time: 4 h).
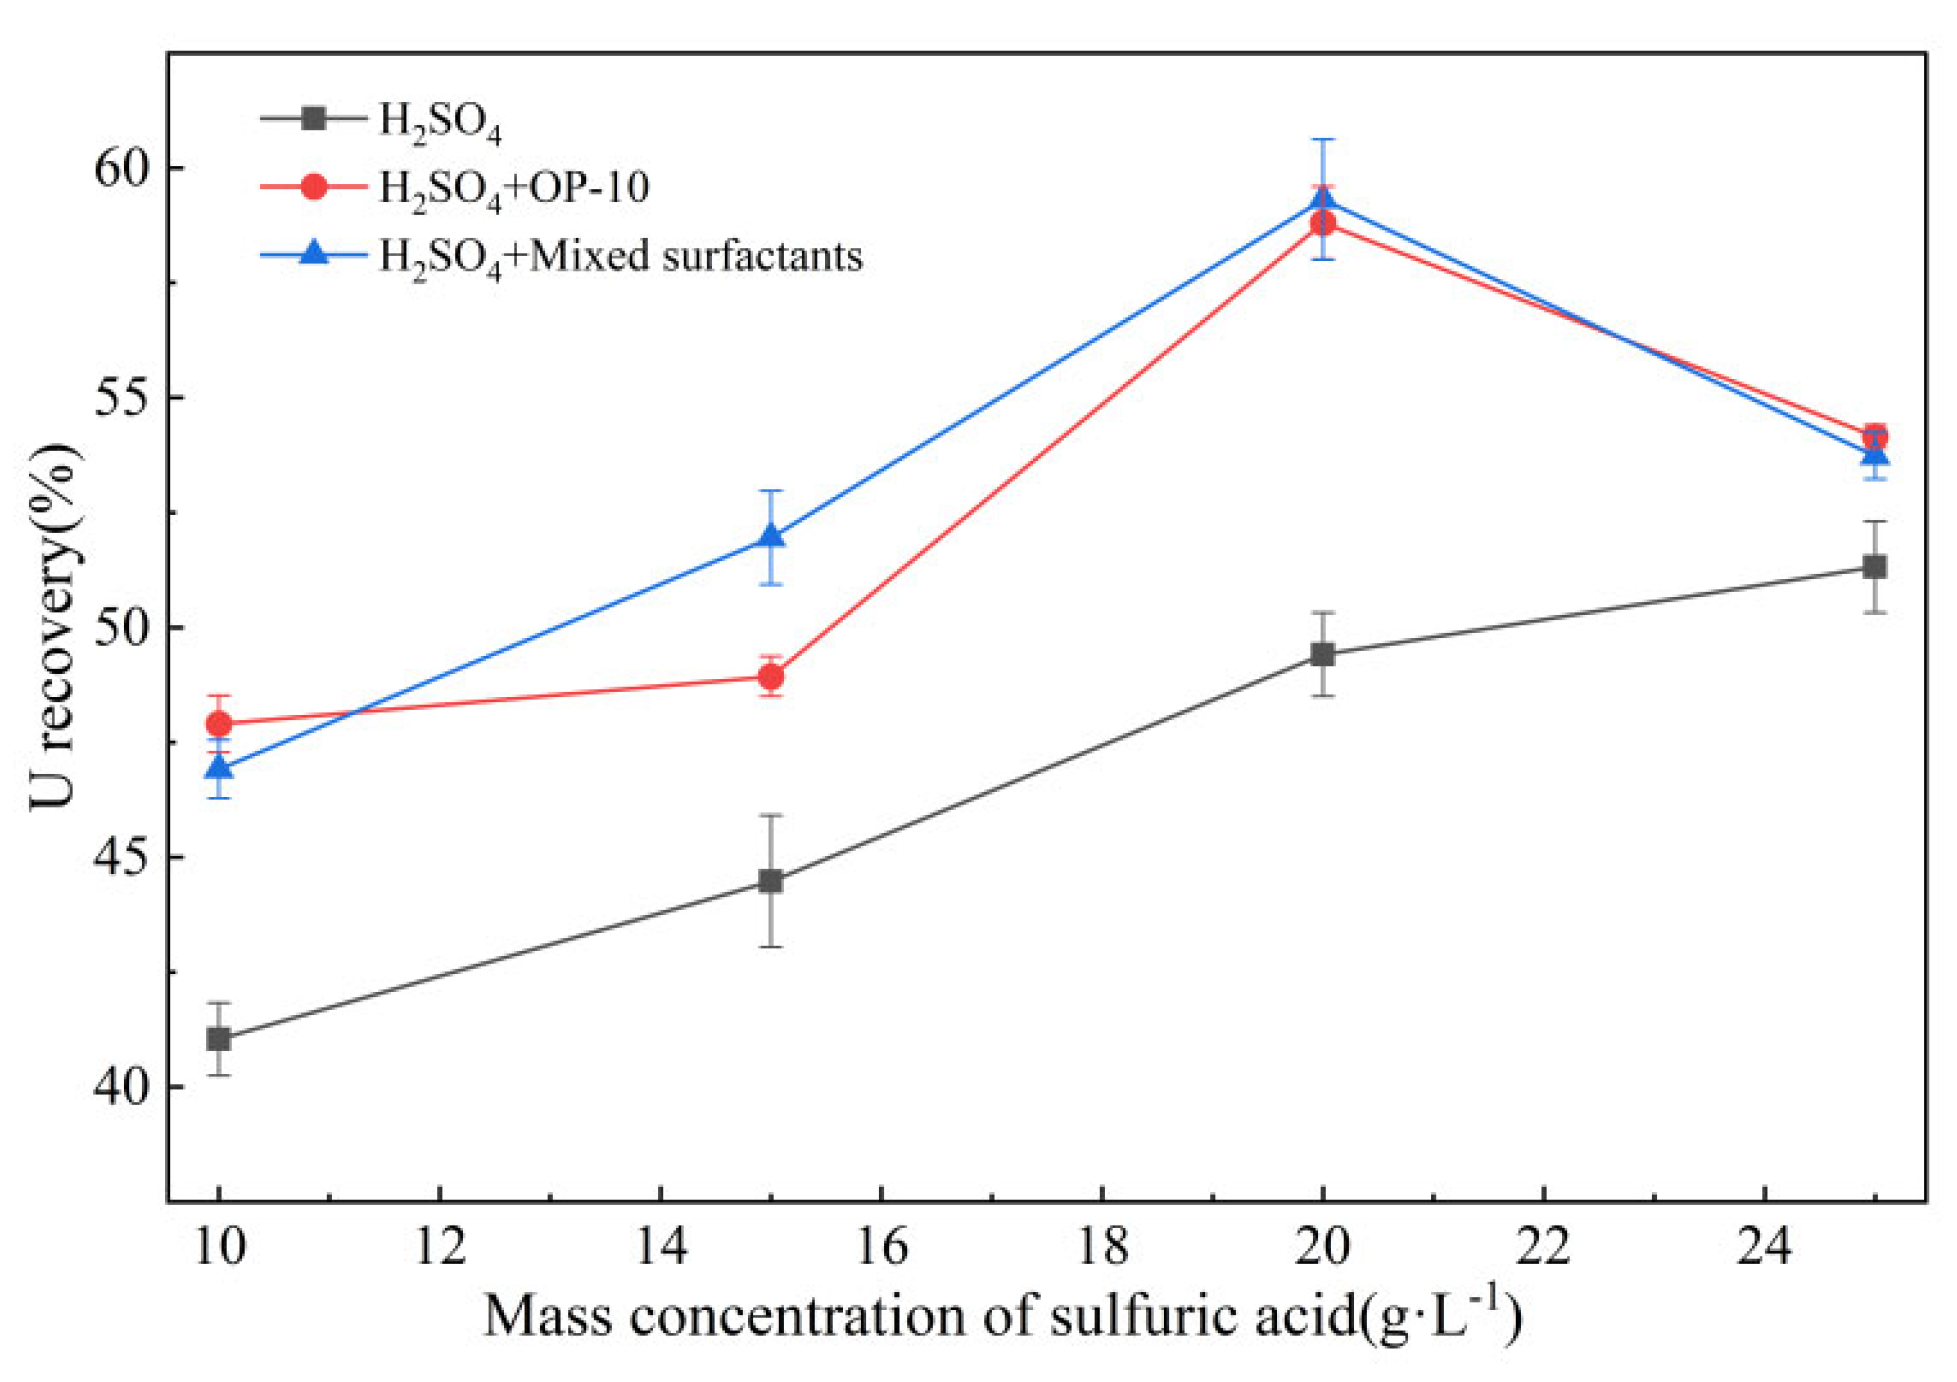
Figure 12.
Effect of temperature on uranium recovery in the three leaching systems (H₂SO₄ concentration: 20 g·L⁻¹; leaching time: 4 h).
Figure 12.
Effect of temperature on uranium recovery in the three leaching systems (H₂SO₄ concentration: 20 g·L⁻¹; leaching time: 4 h).
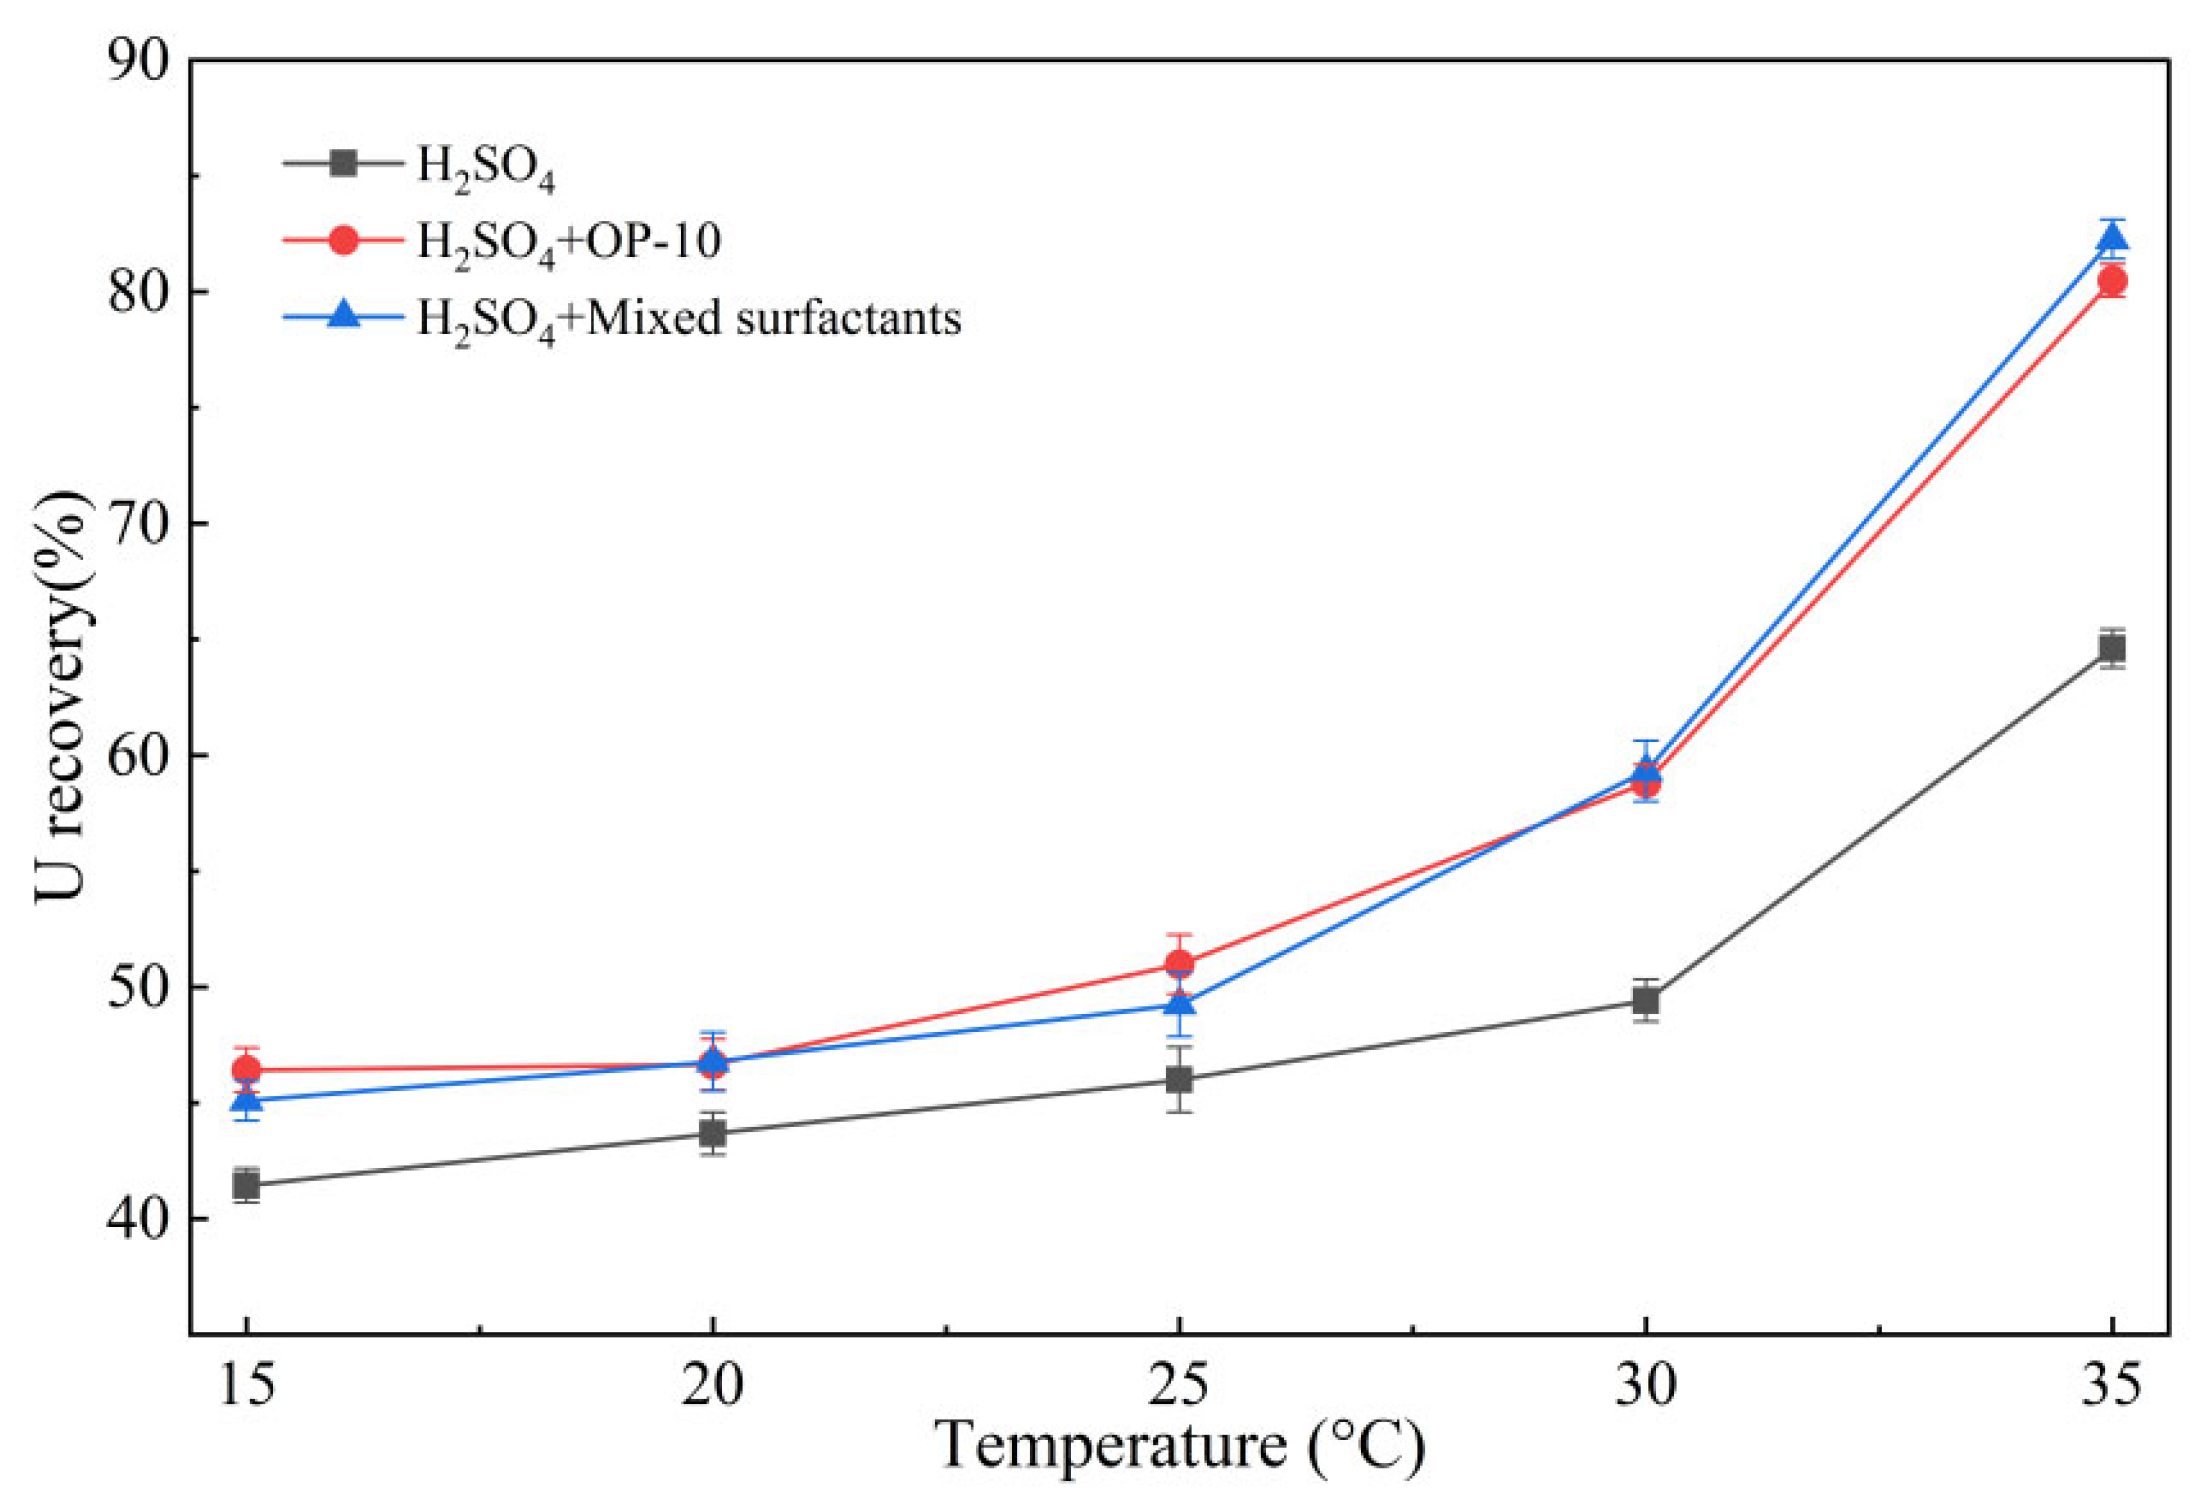
Figure 13.
Effect of leaching time on uranium recovery under three different systems (sulfuric acid mass concentration: 20 g·L⁻¹; temperature: 30 °C).
Figure 13.
Effect of leaching time on uranium recovery under three different systems (sulfuric acid mass concentration: 20 g·L⁻¹; temperature: 30 °C).
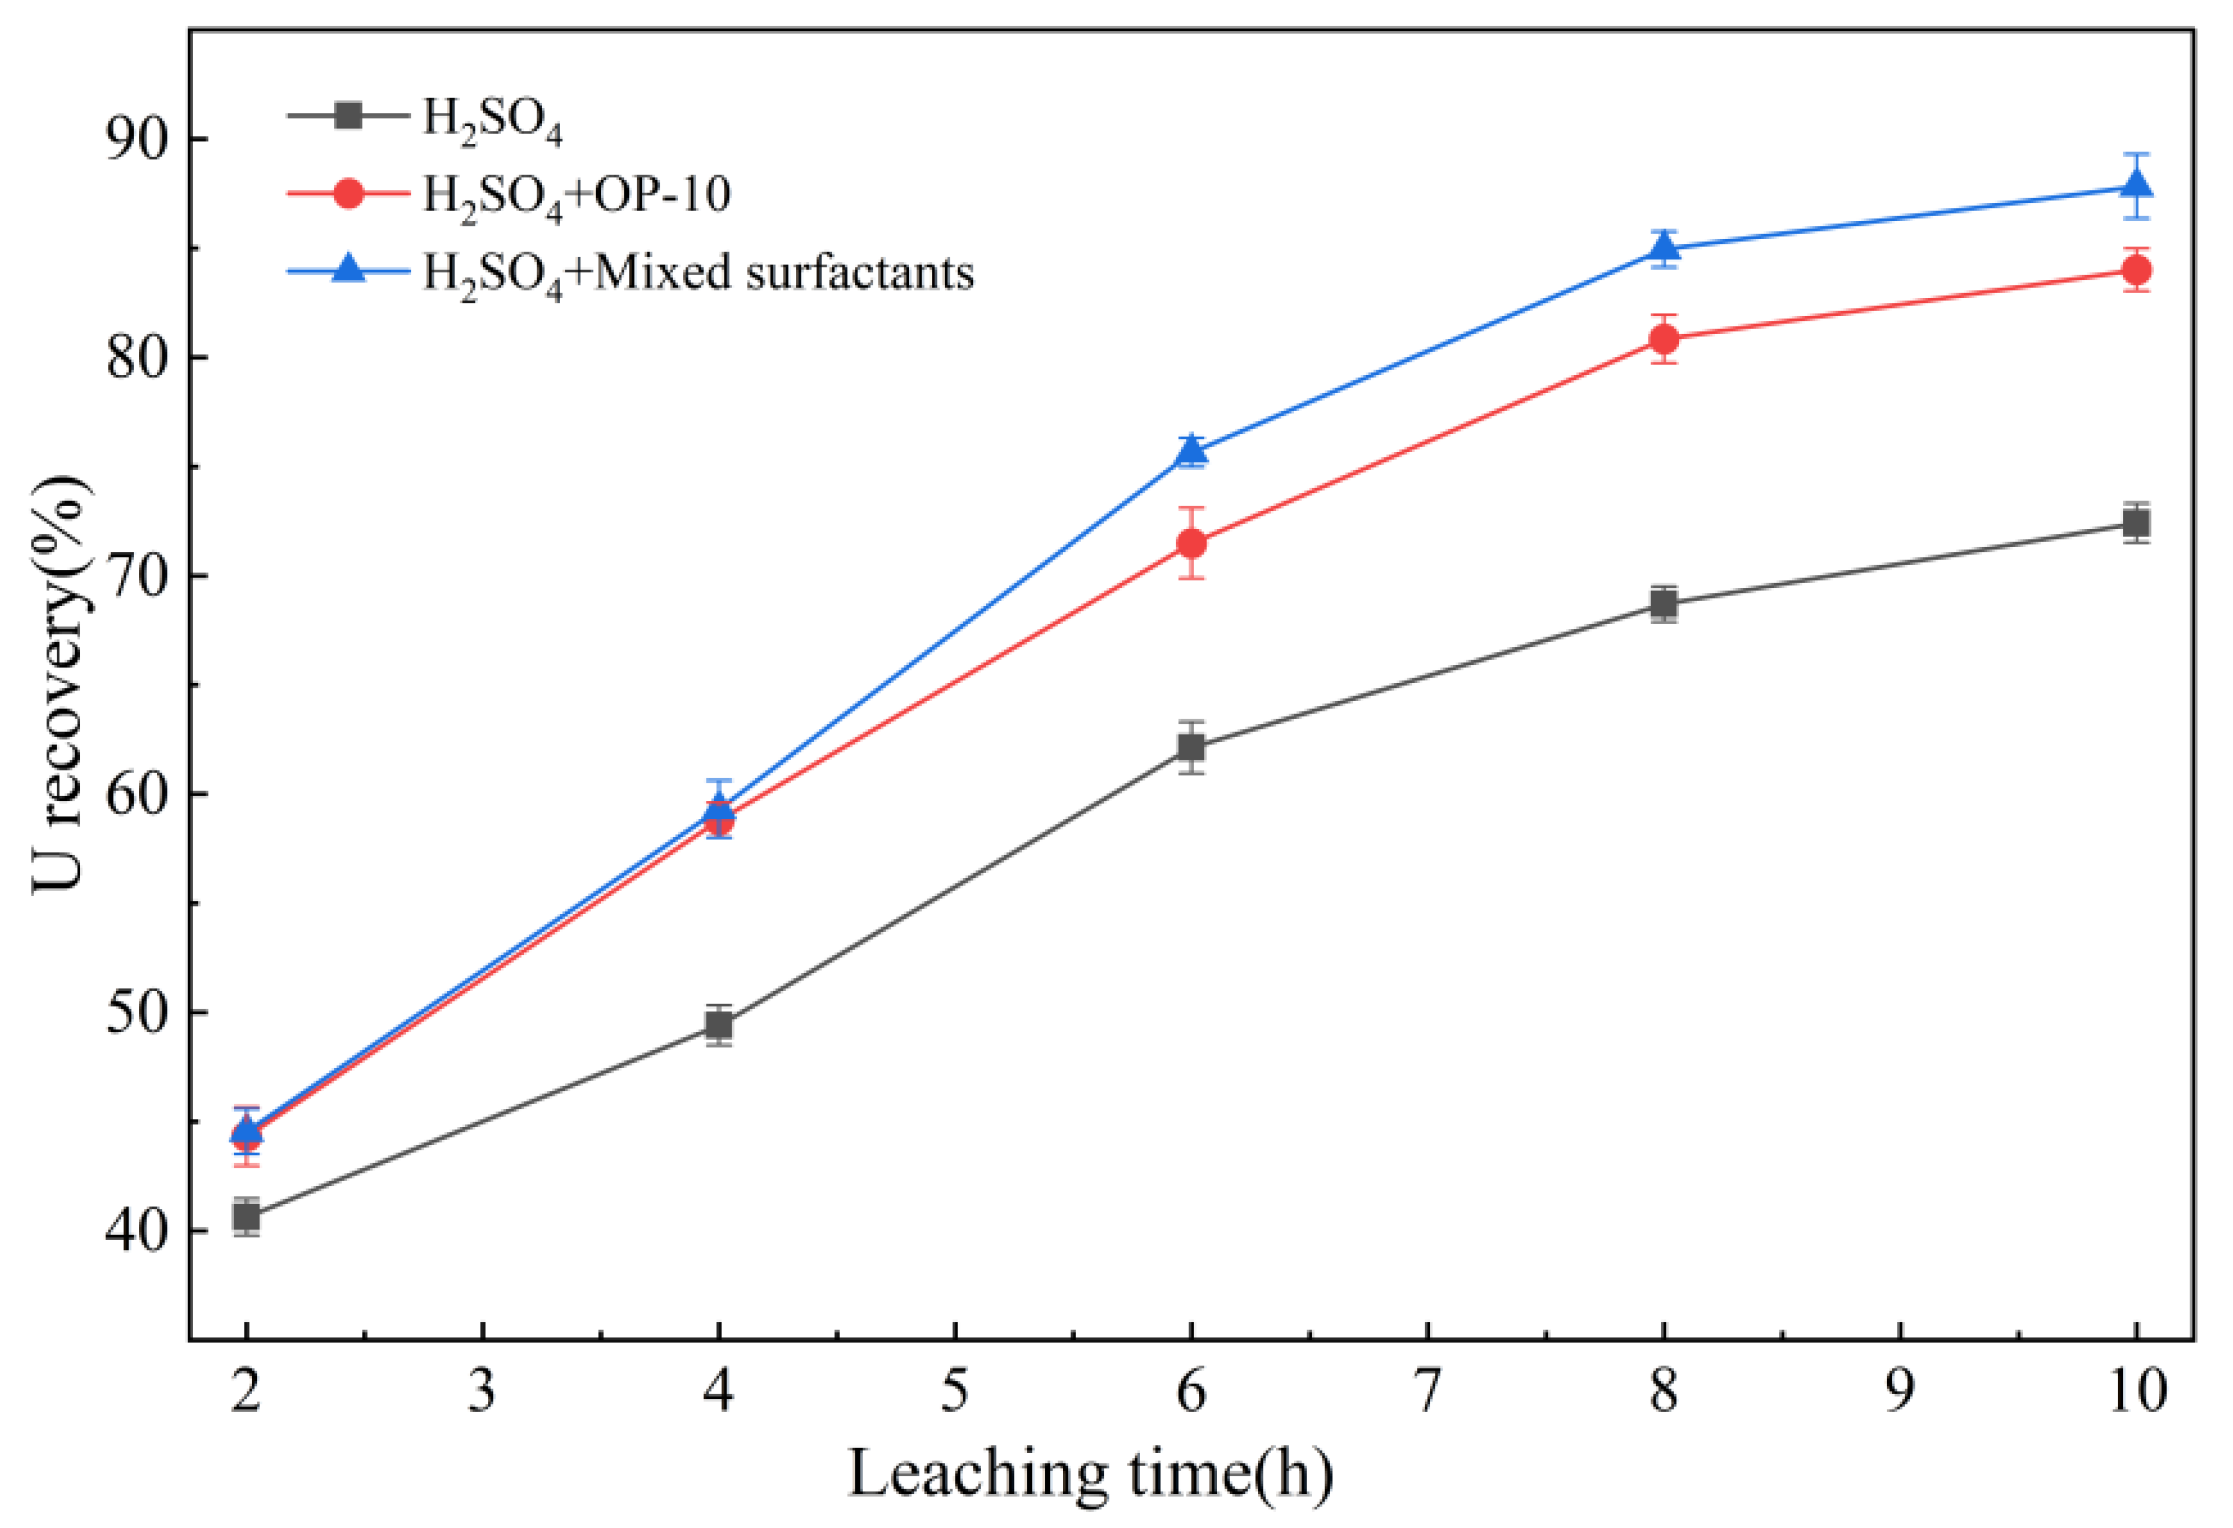
Figure 14.
Variation in daily uranium concentration with time during column leaching.
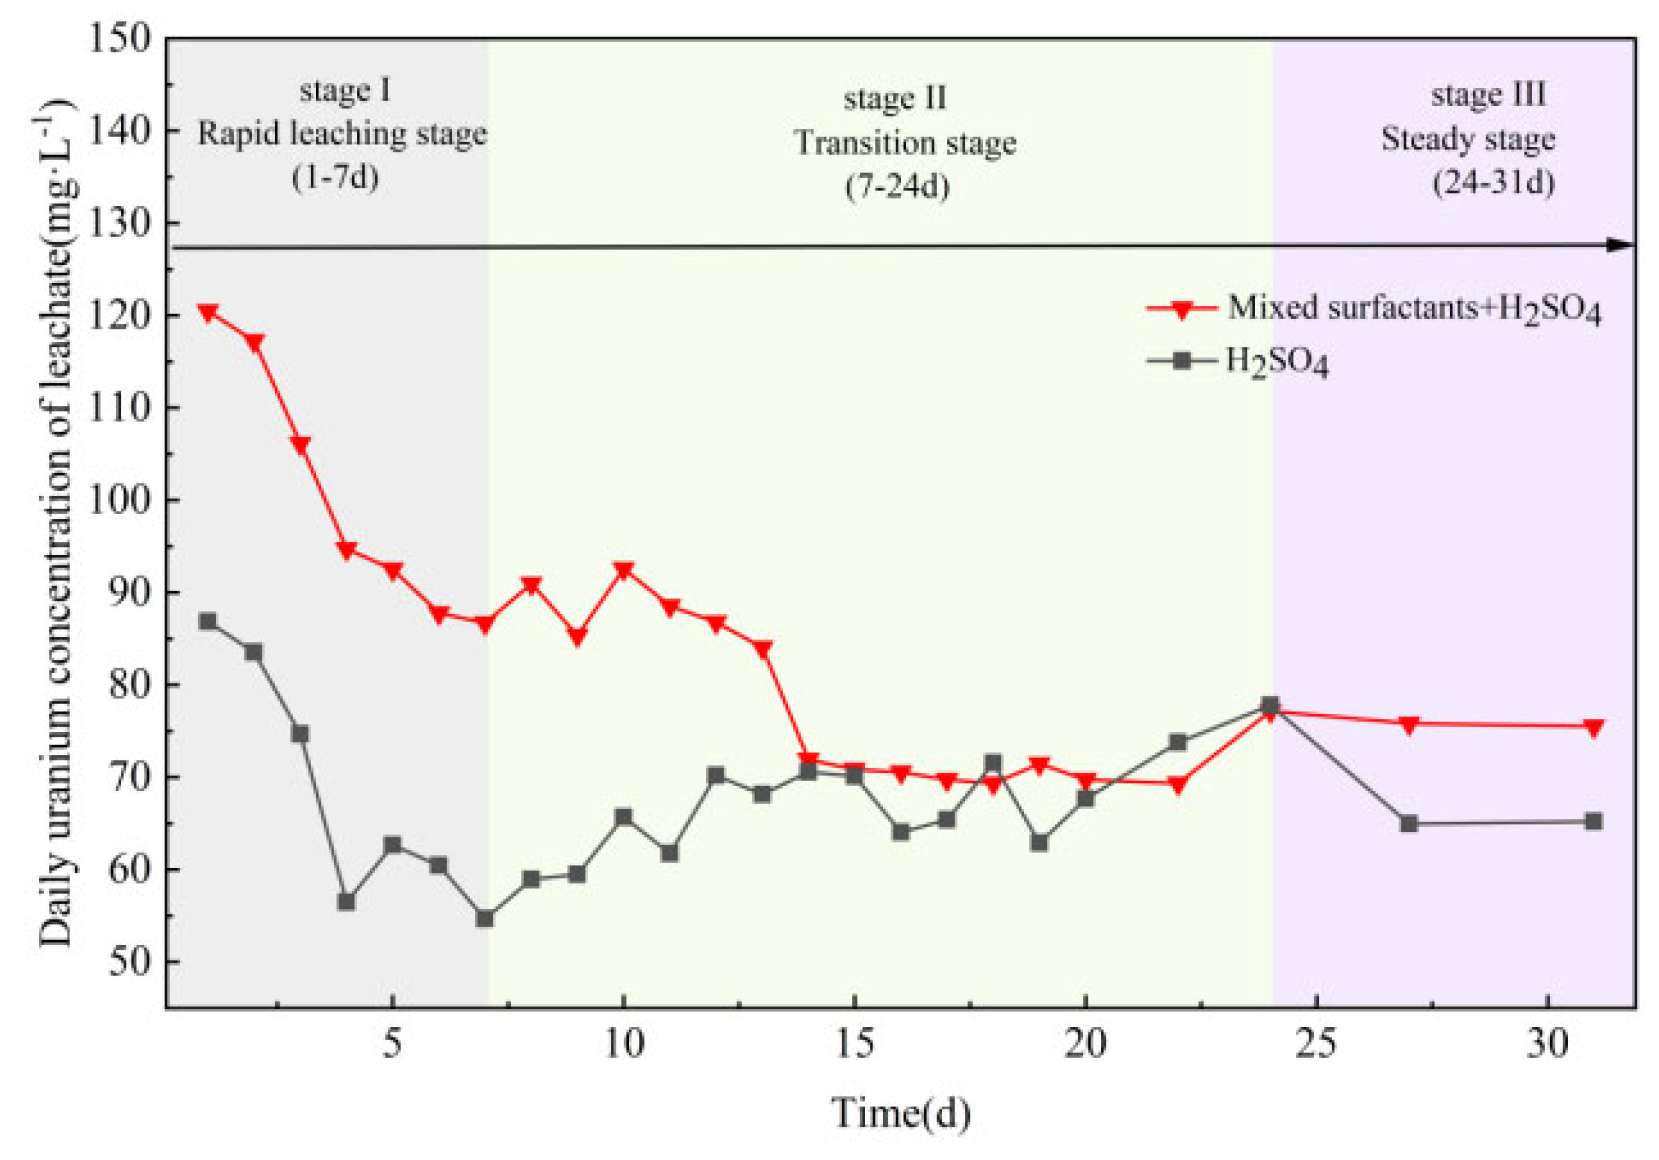
Figure 15.
Variation in cumulative uranium recovery with time during column leaching.
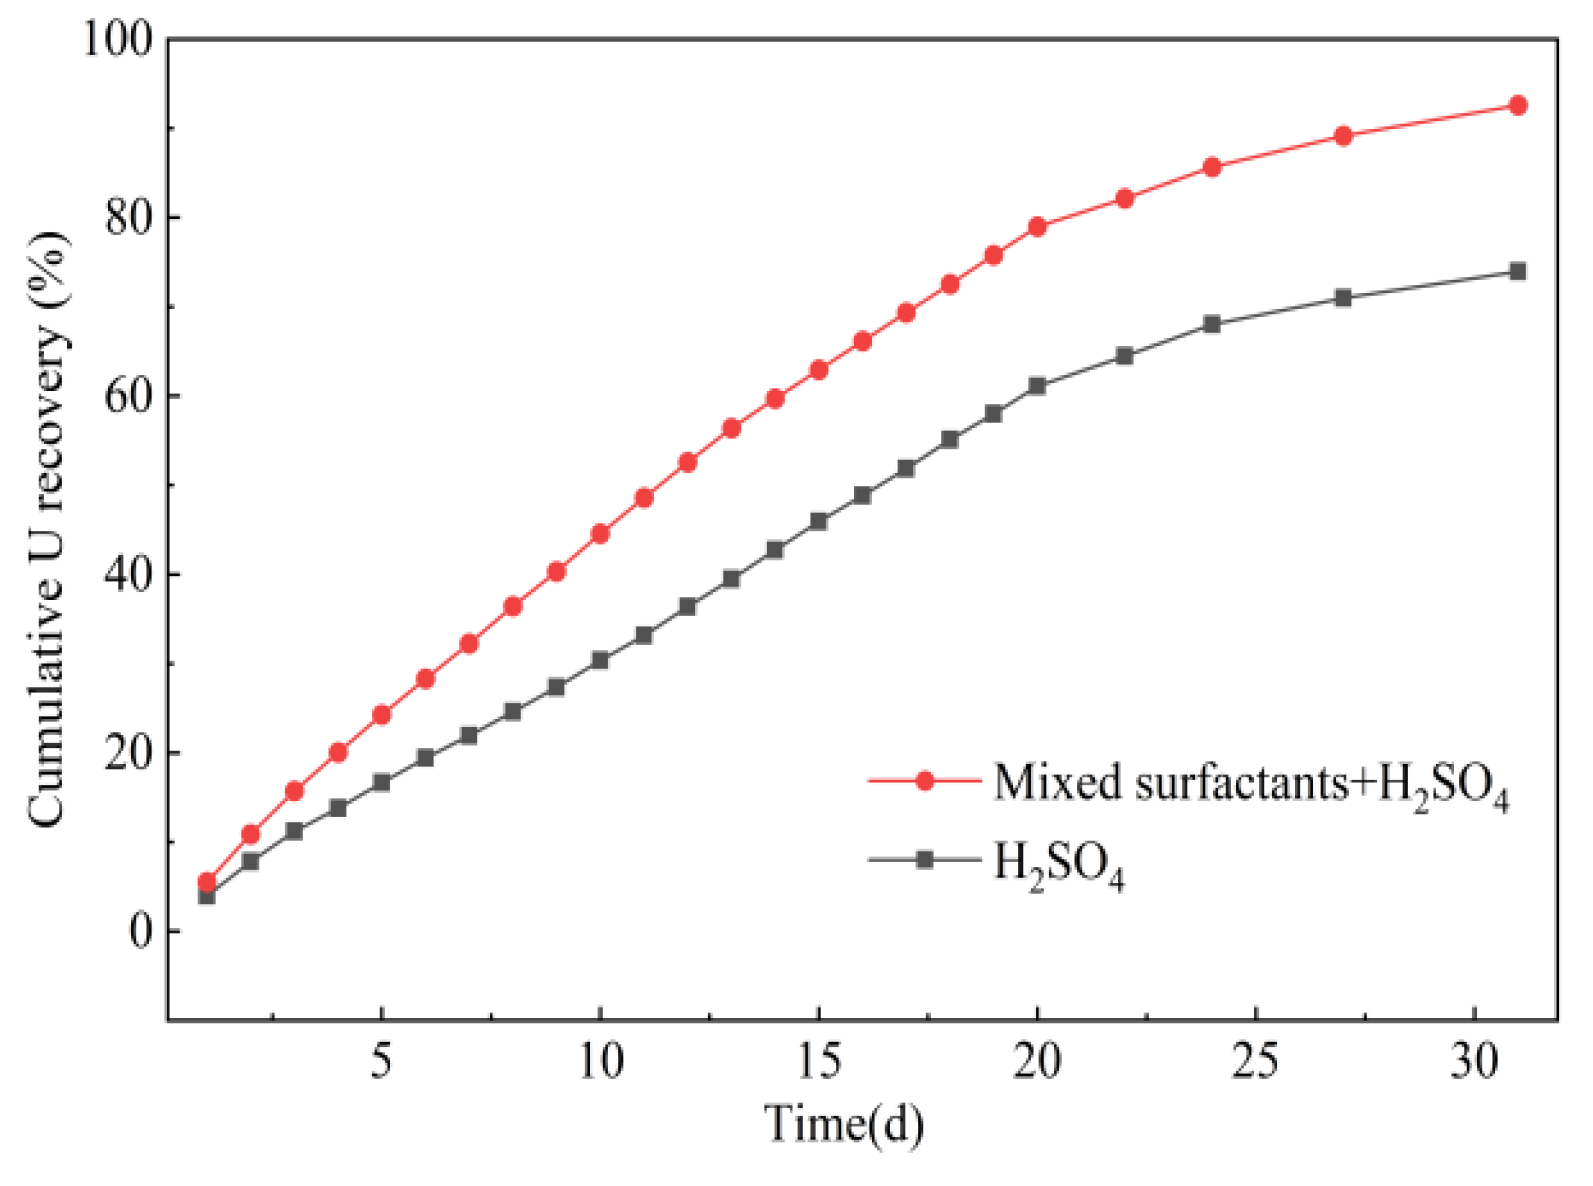
Figure 16.
Relationship between uranium leaching rate and leaching time under four different conditions.
Figure 16.
Relationship between uranium leaching rate and leaching time under four different conditions.
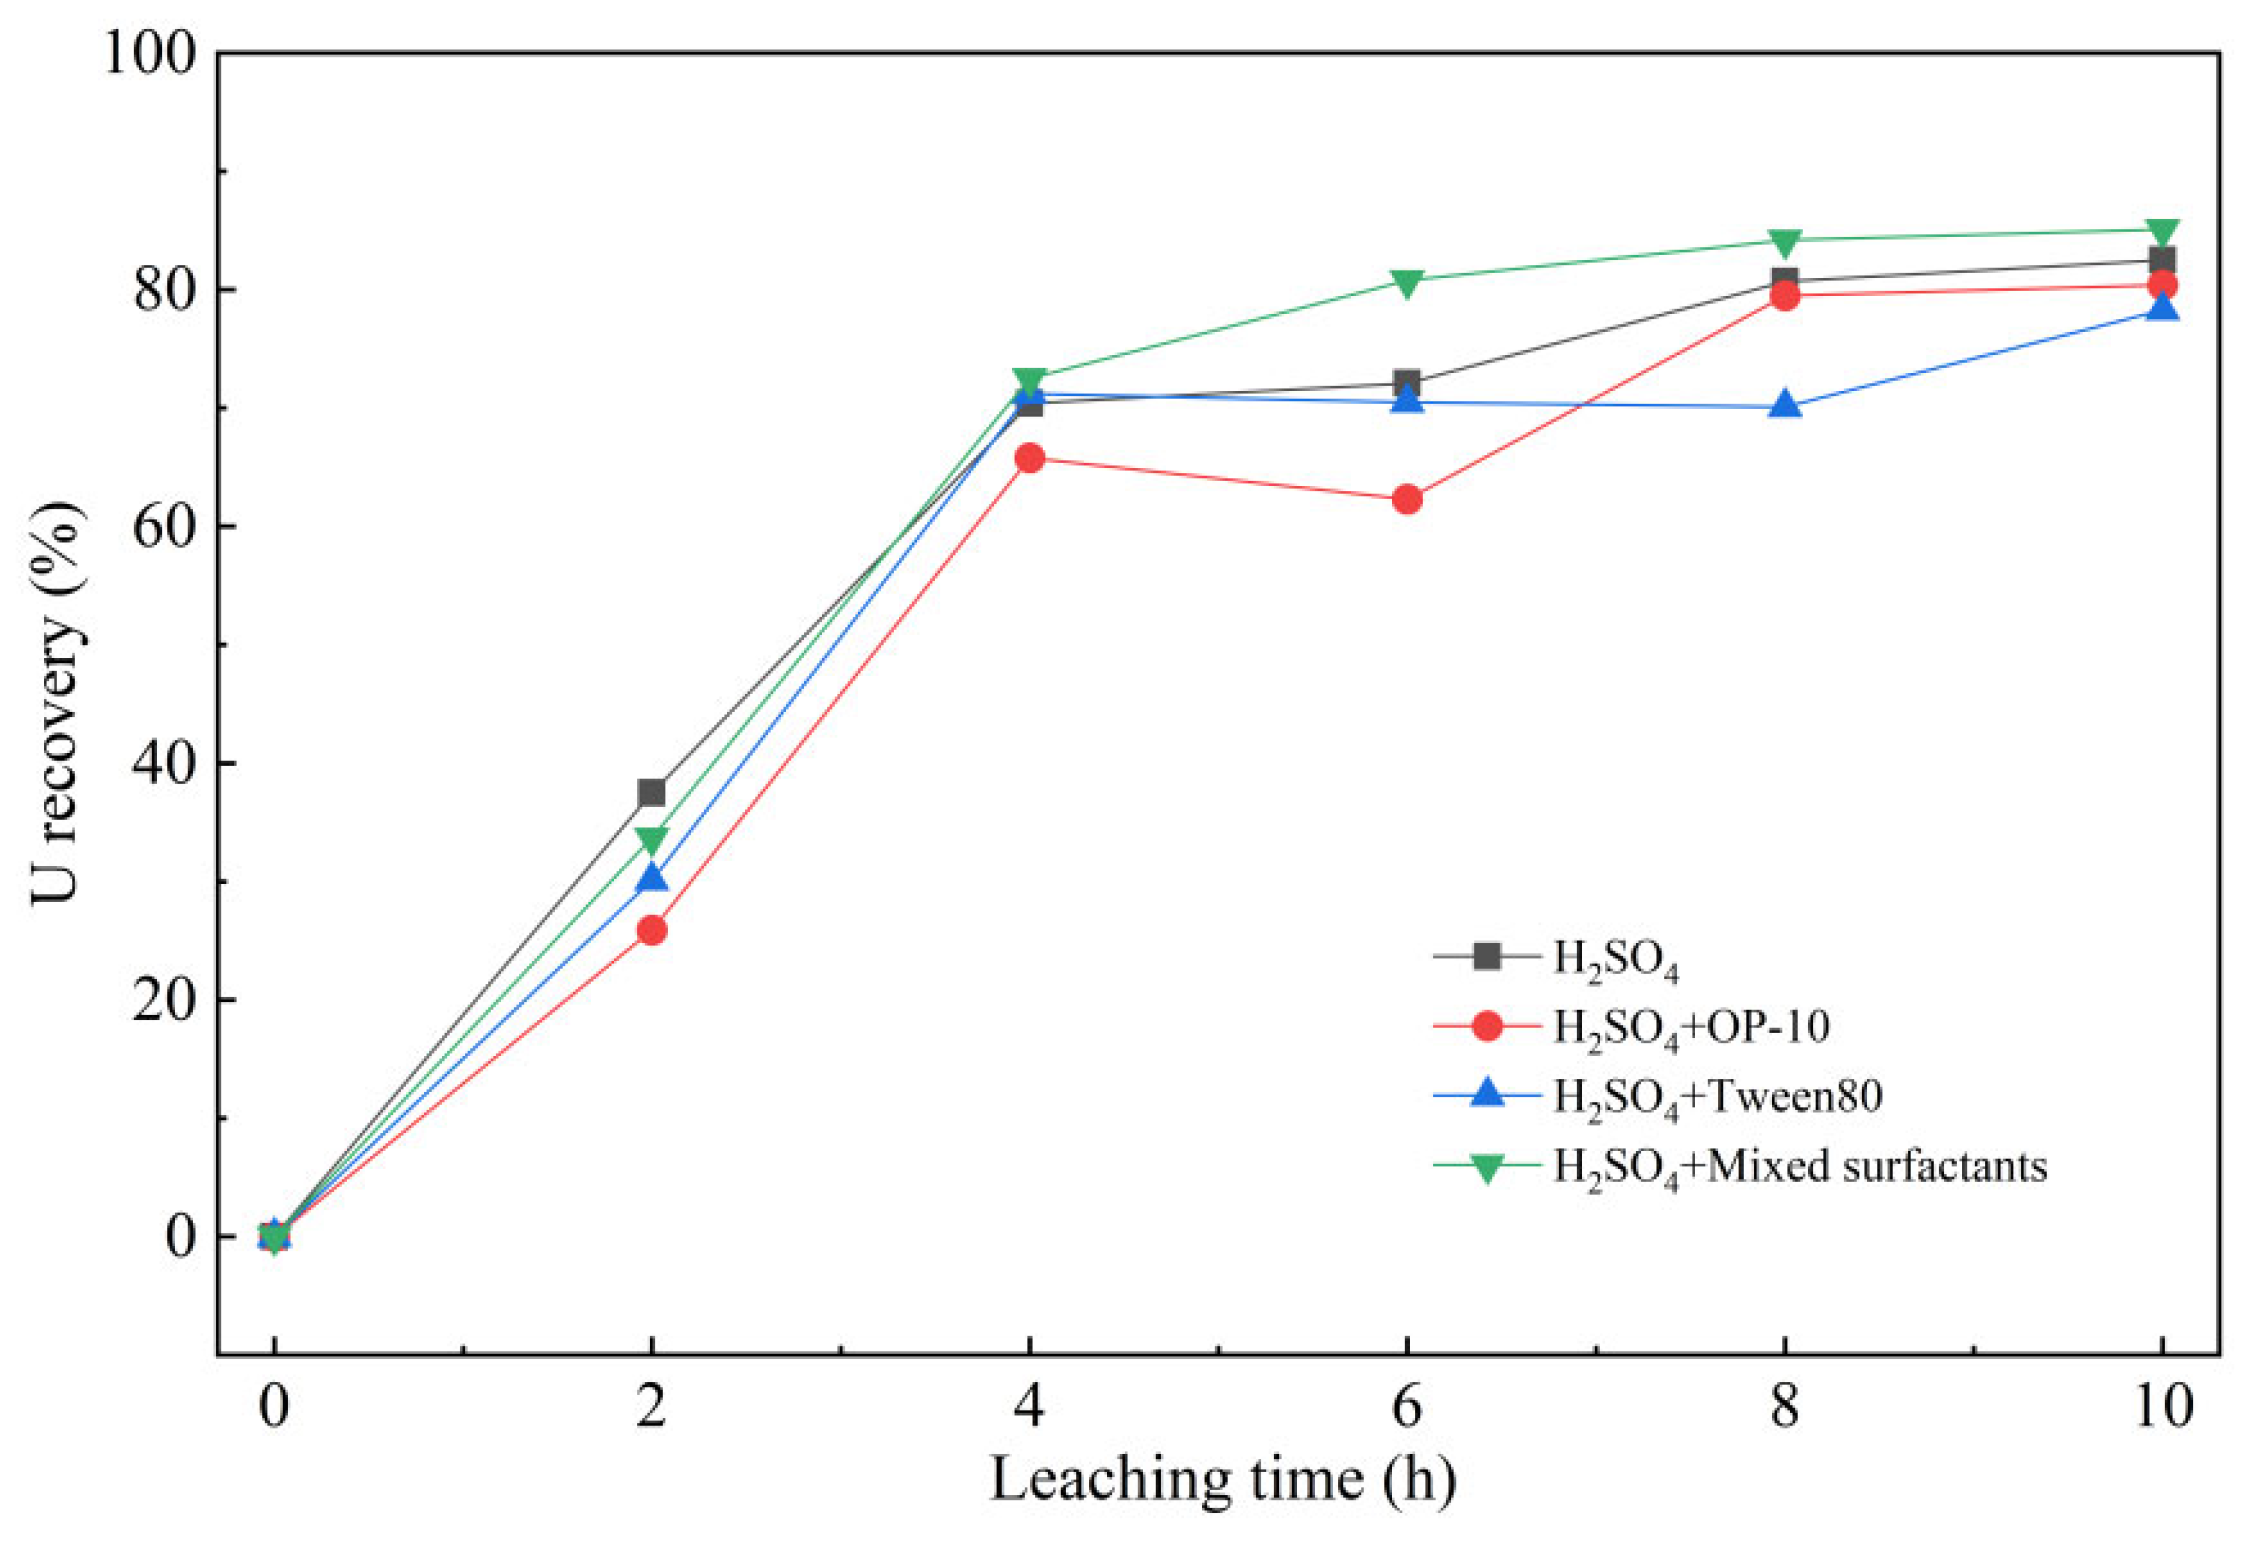
Figure 17.
Fitting of external diffusion control model for uranium leaching under different leaching conditions.
Figure 17.
Fitting of external diffusion control model for uranium leaching under different leaching conditions.
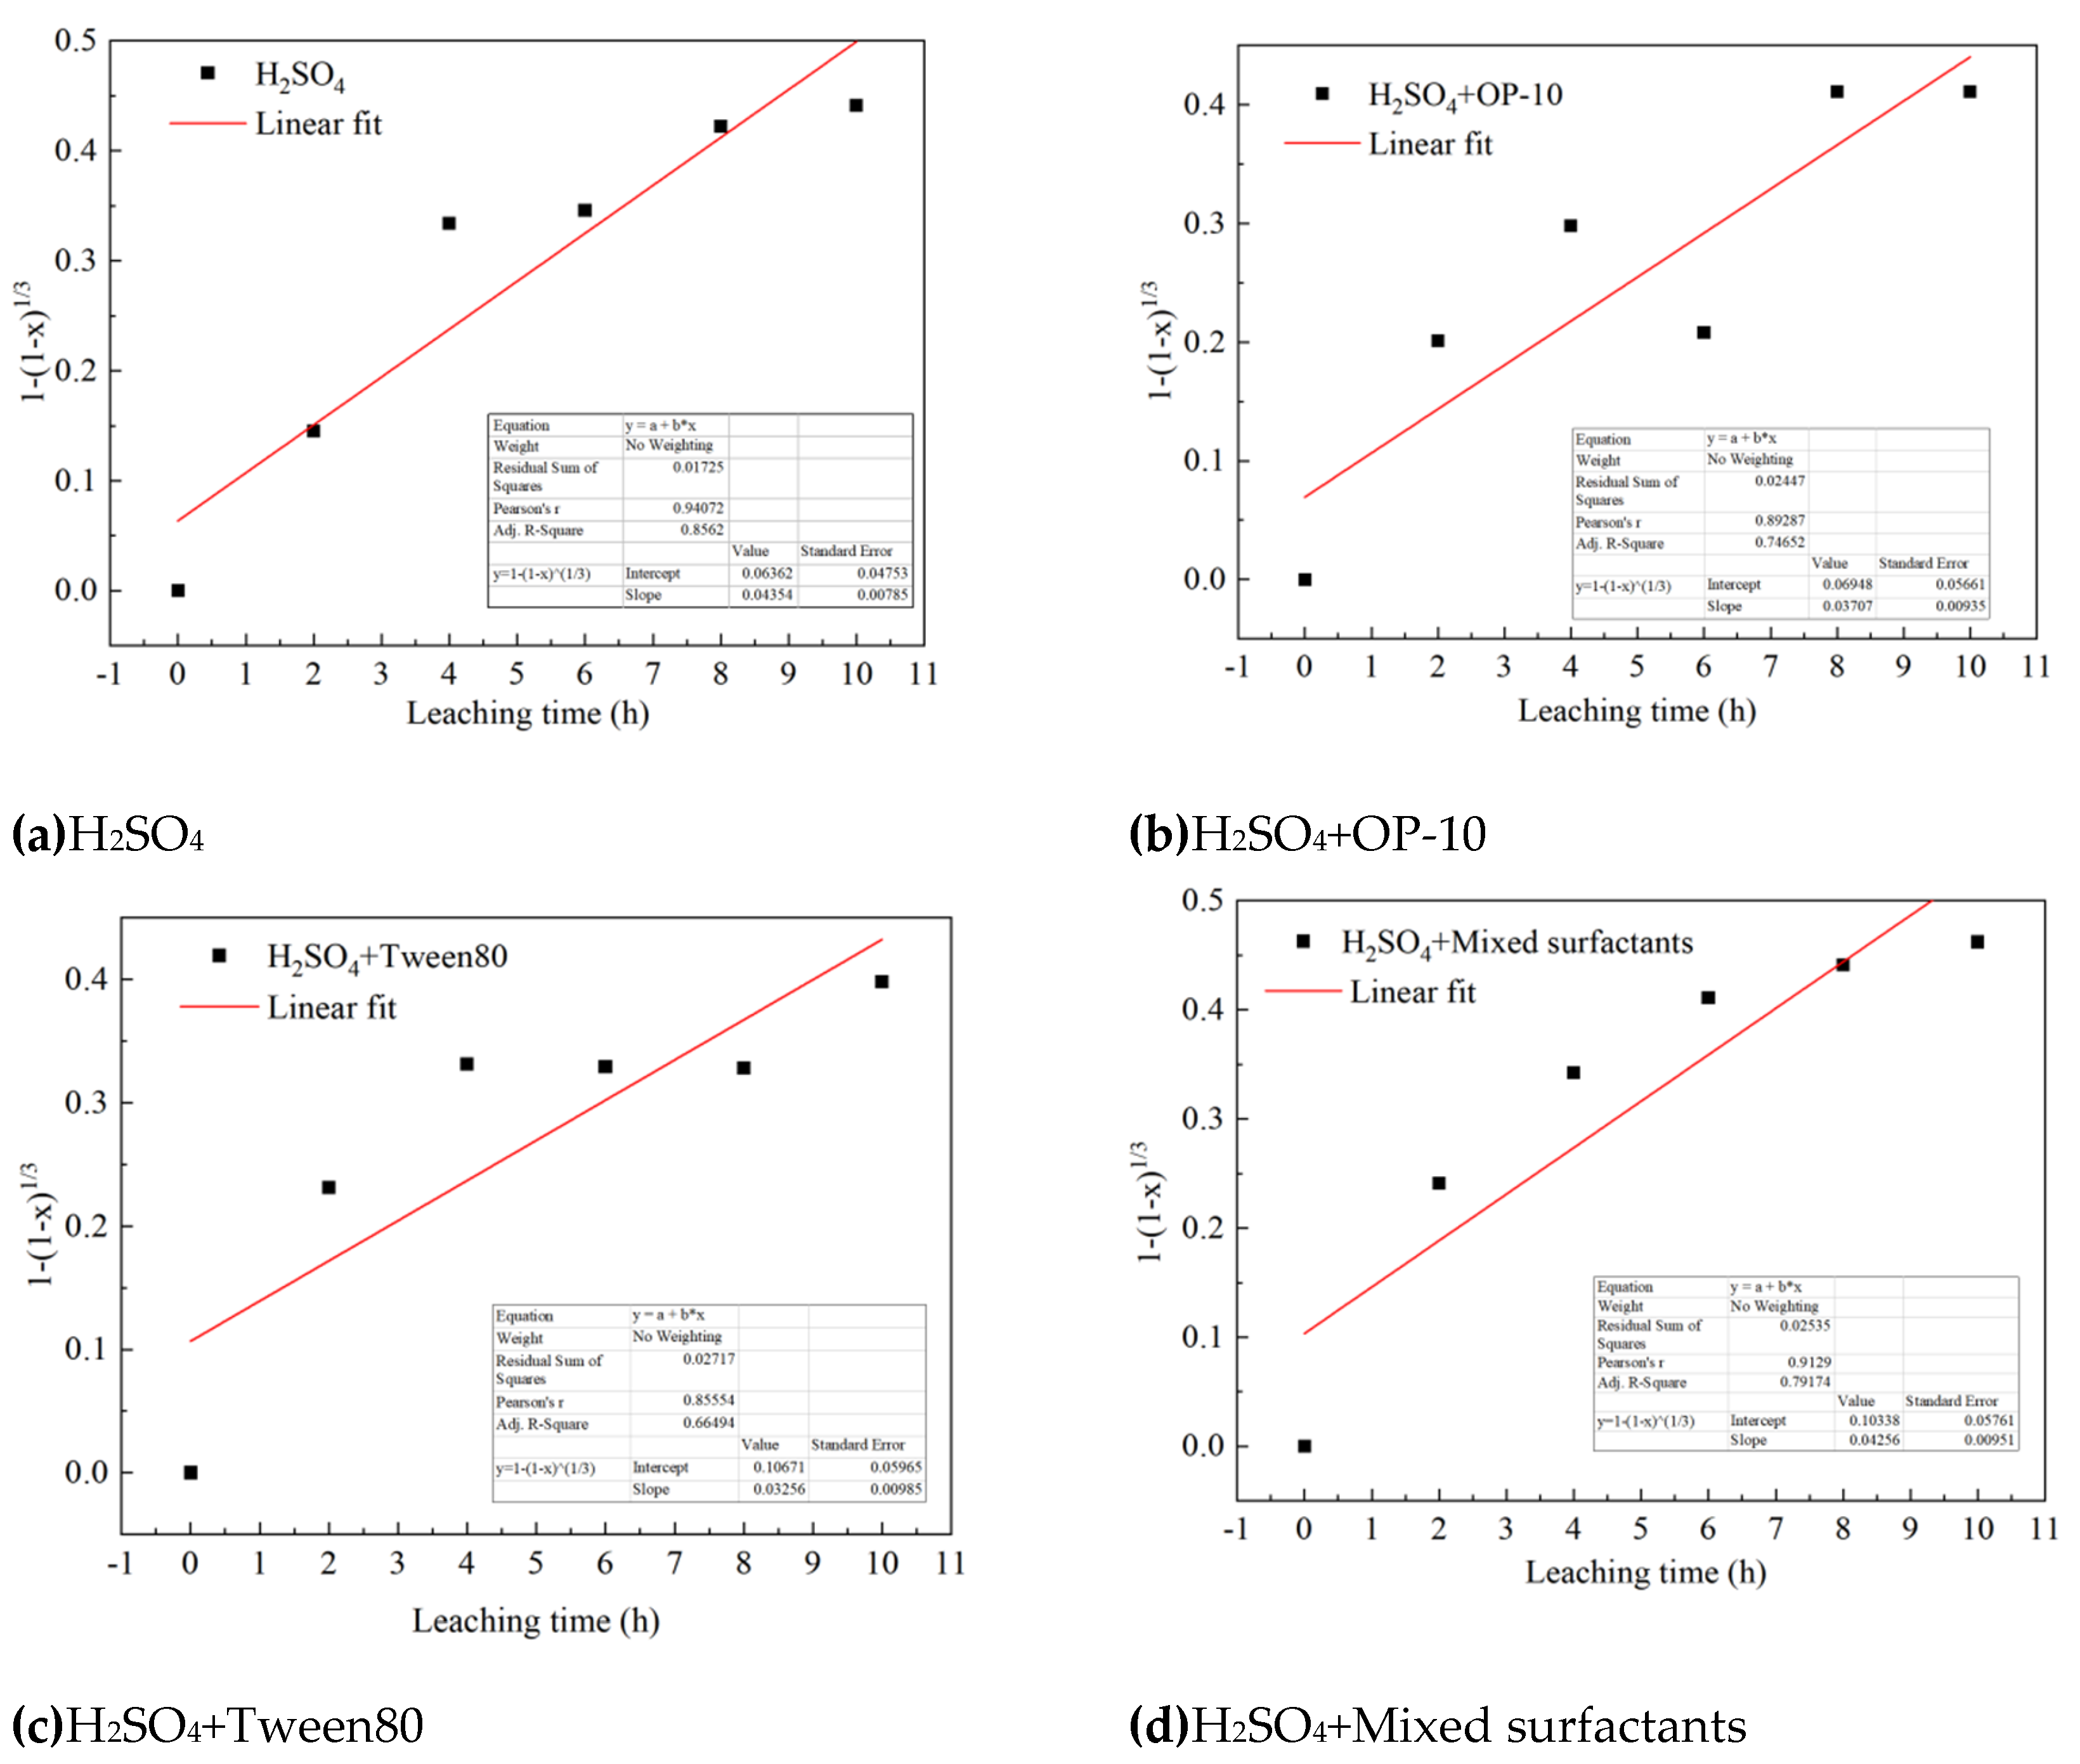
Figure 18.
Fitting of the internal diffusion control model for uranium leaching under different leaching conditions.
Figure 18.
Fitting of the internal diffusion control model for uranium leaching under different leaching conditions.
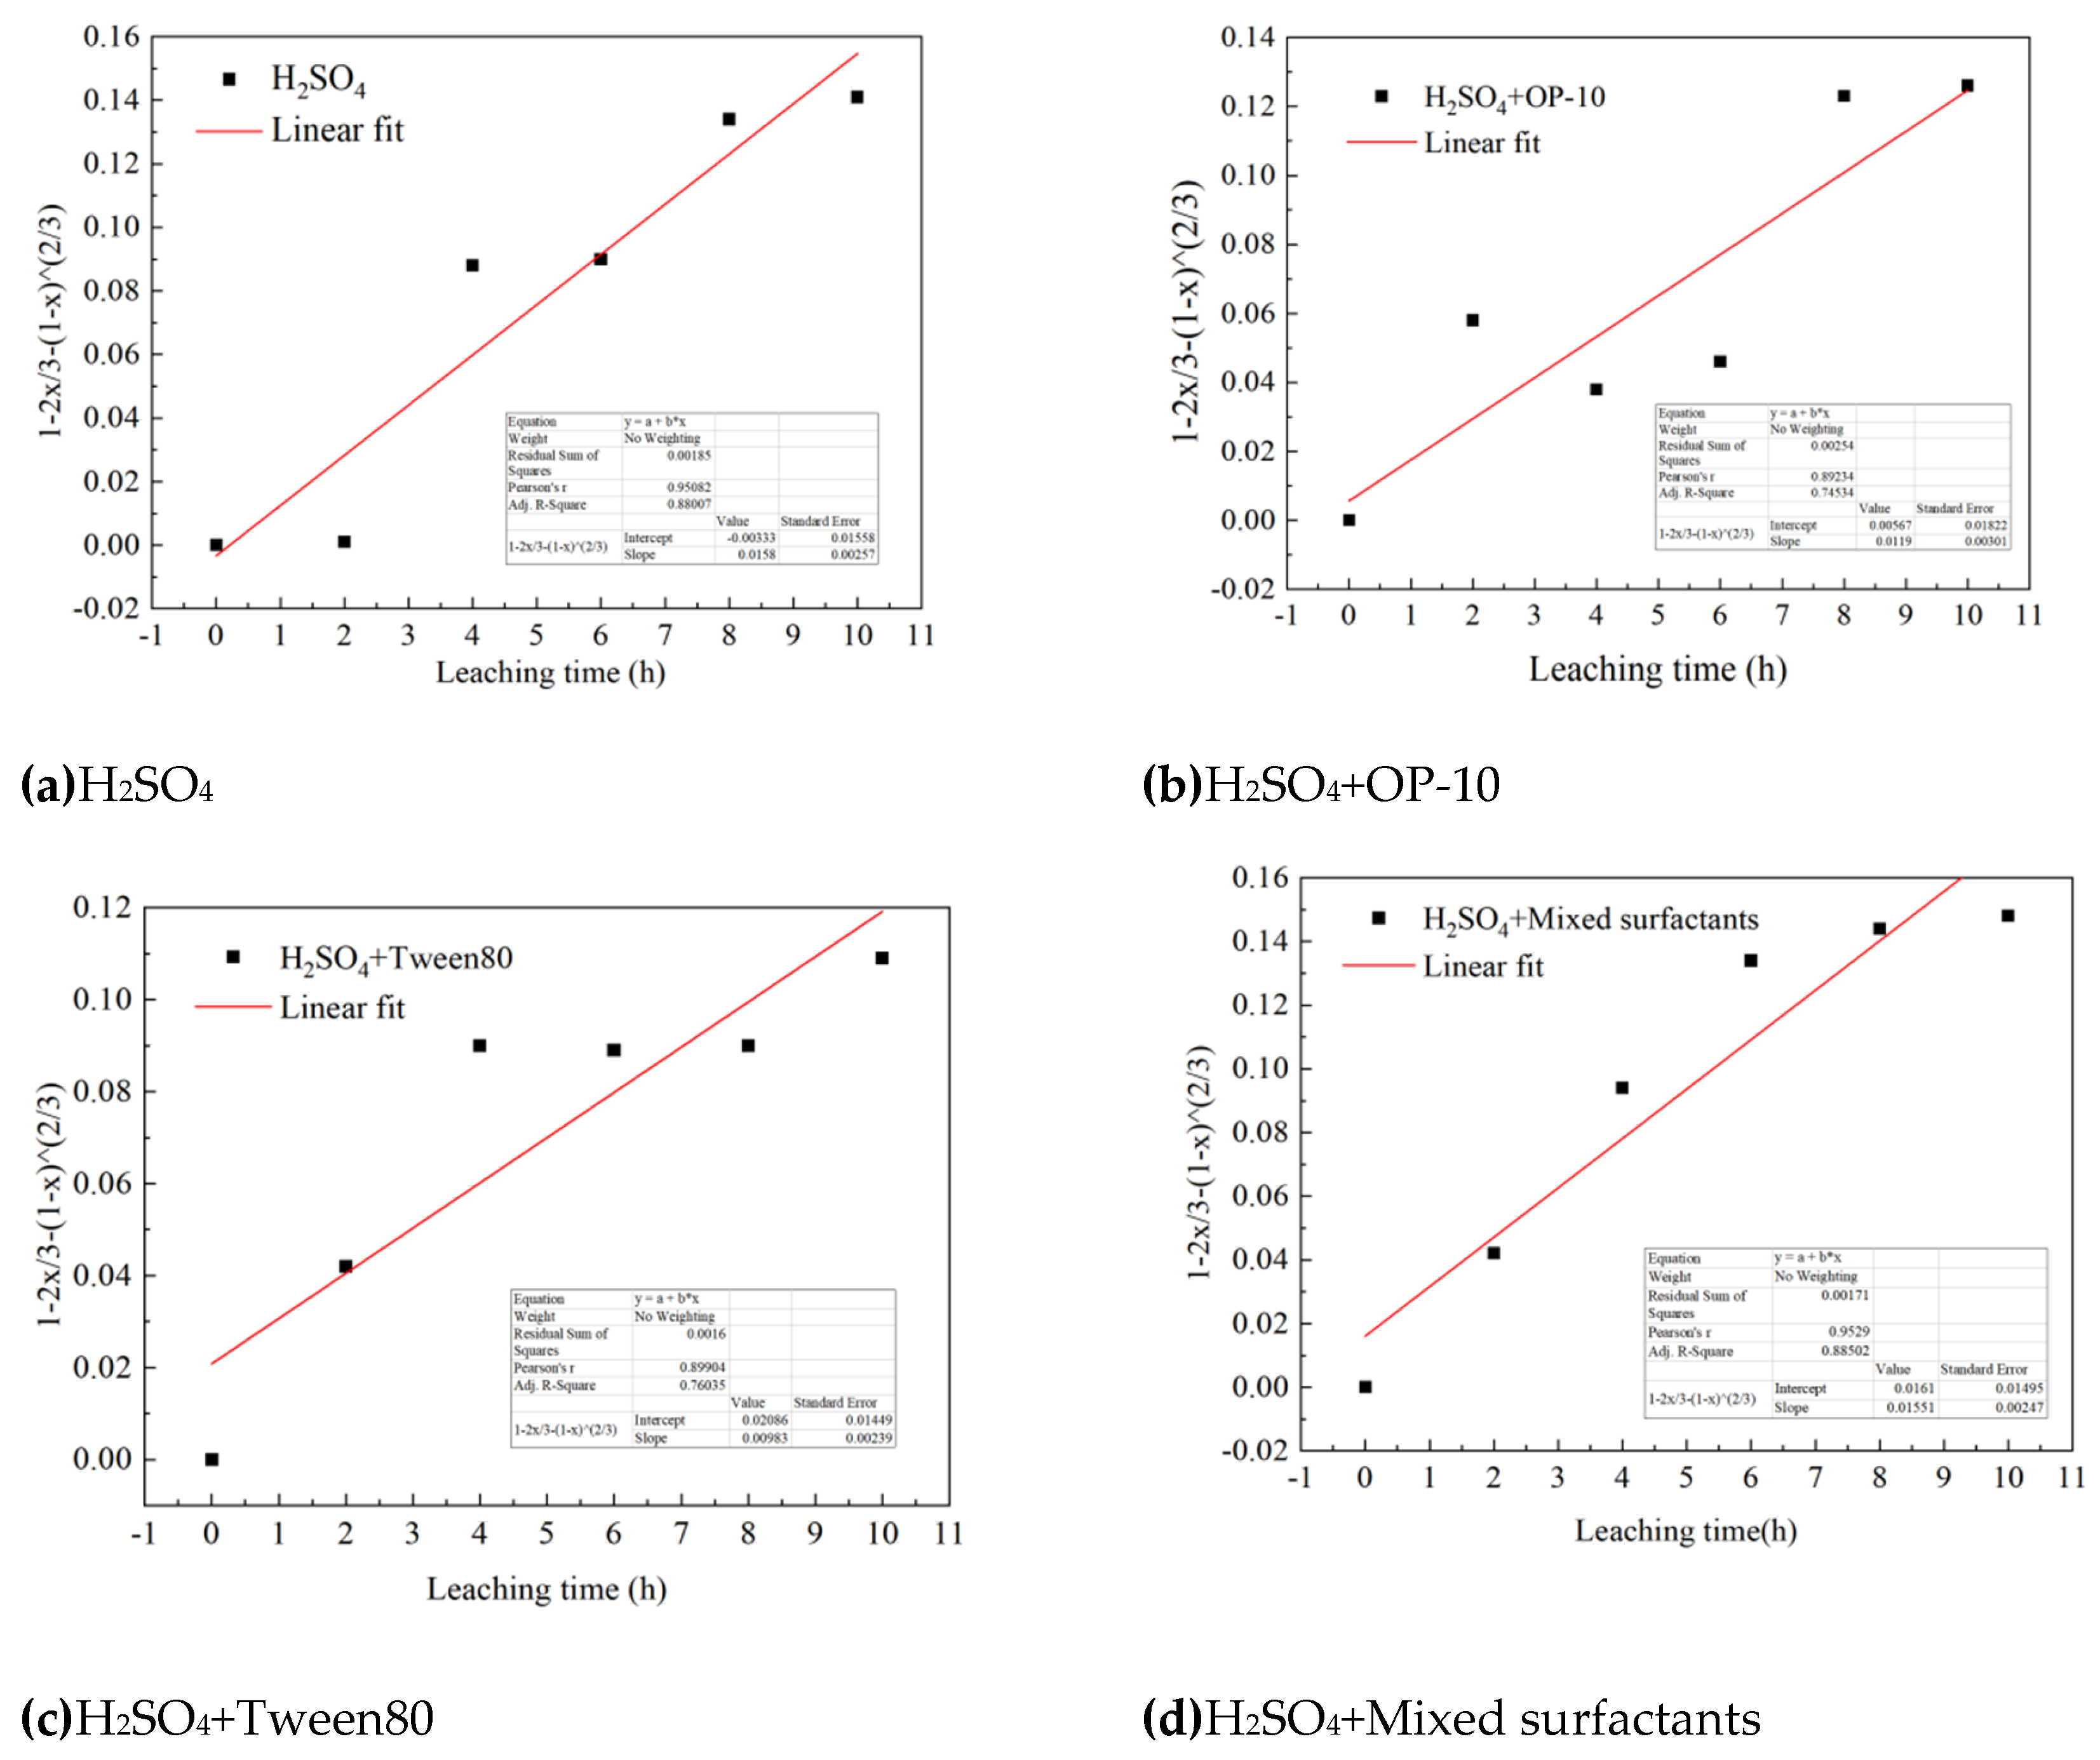
Figure 19.
Fitting of the chemical reaction control model for uranium leaching under different leaching conditions.
Figure 19.
Fitting of the chemical reaction control model for uranium leaching under different leaching conditions.
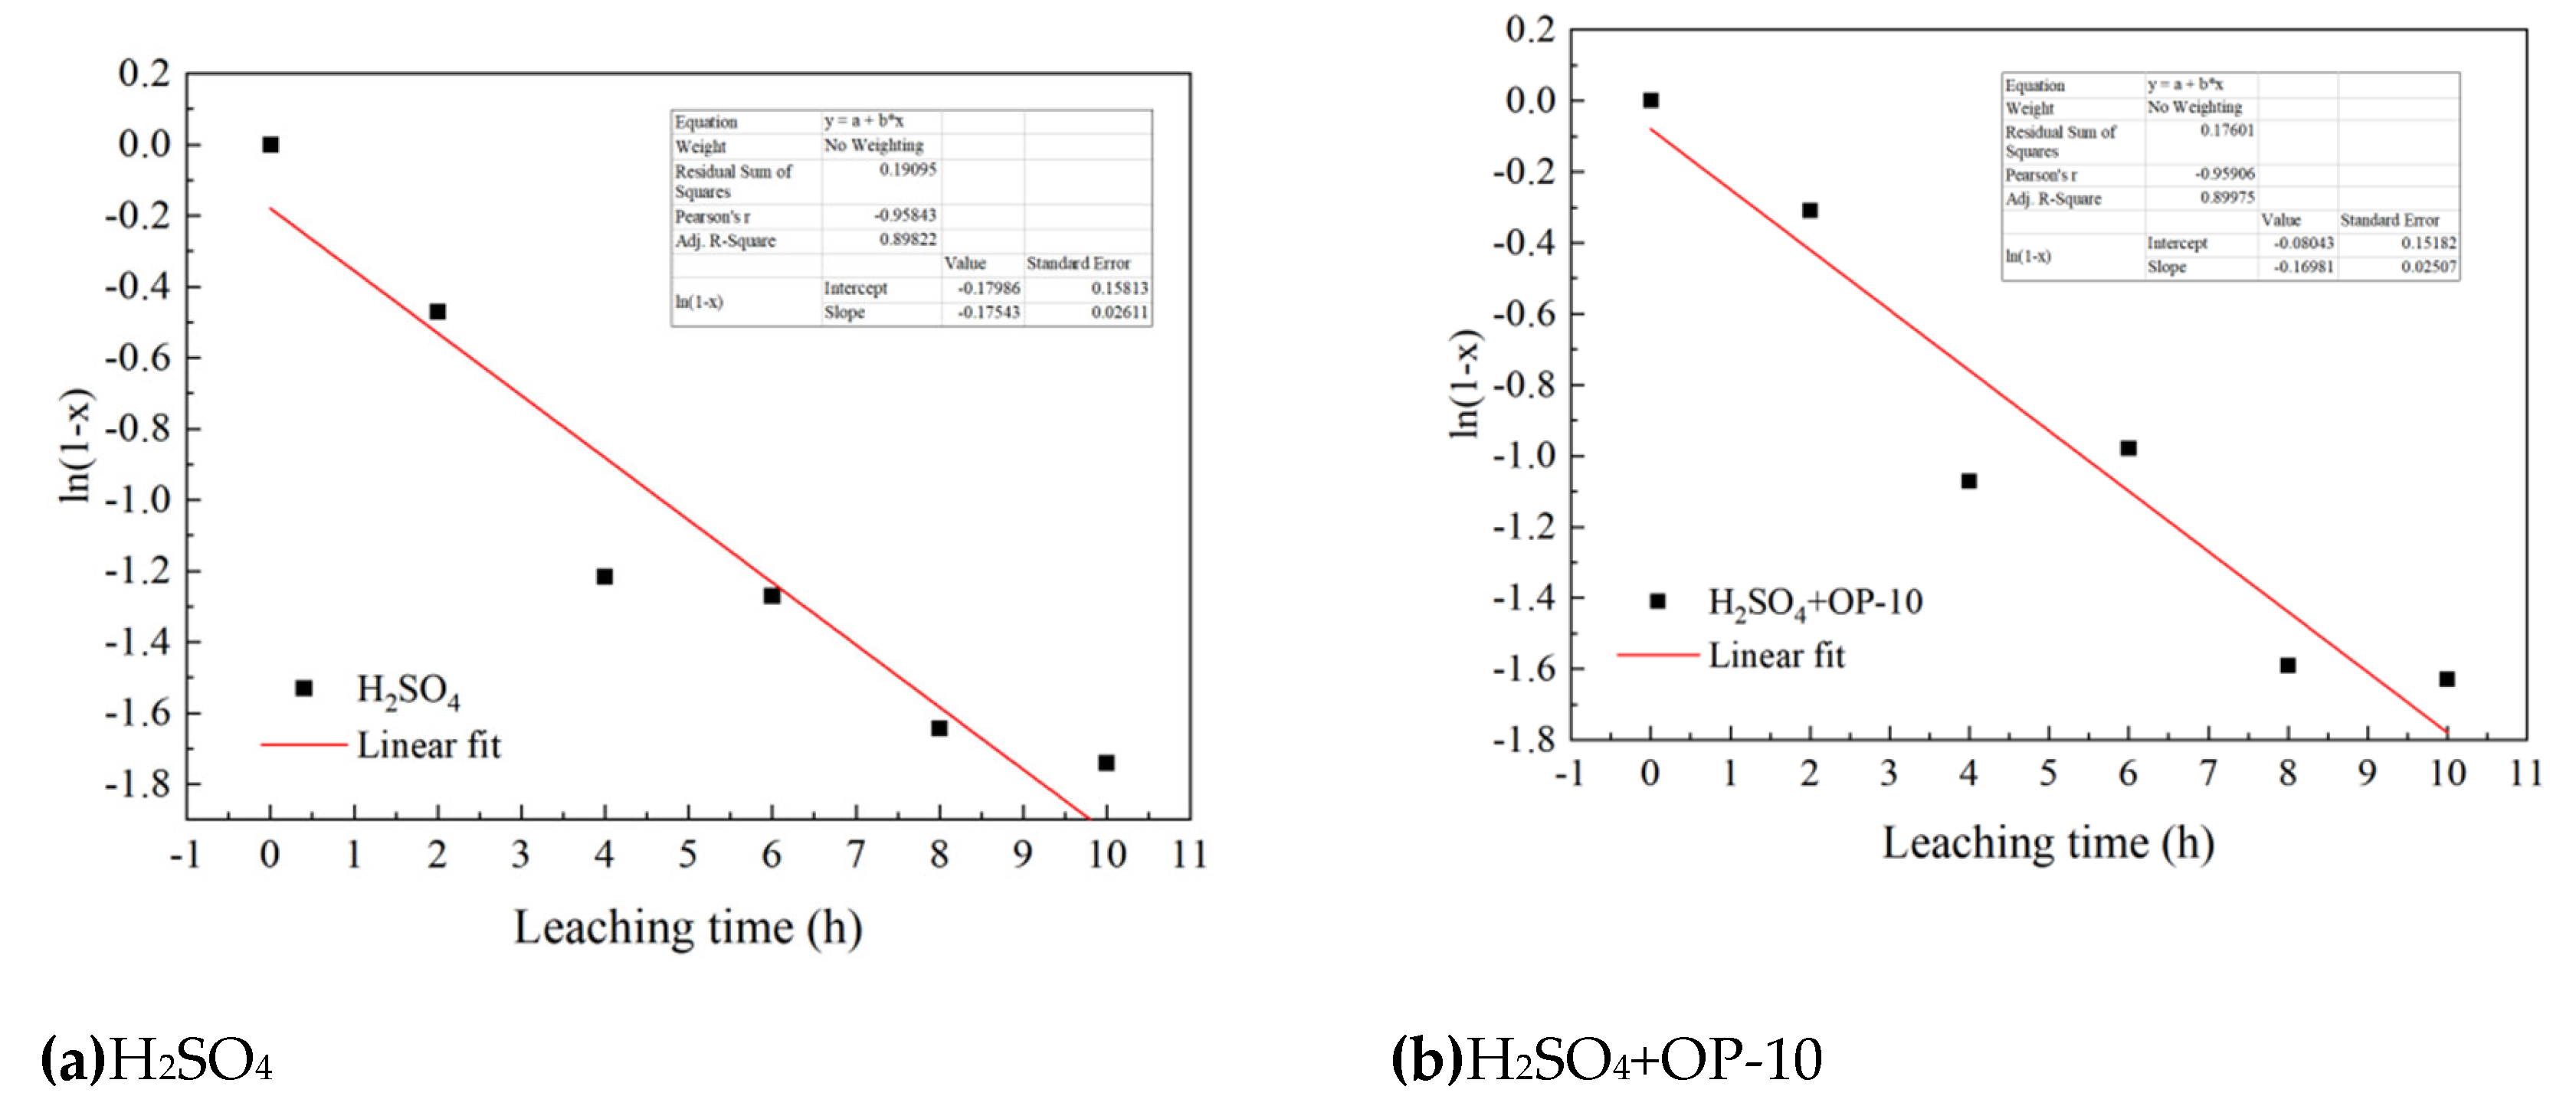
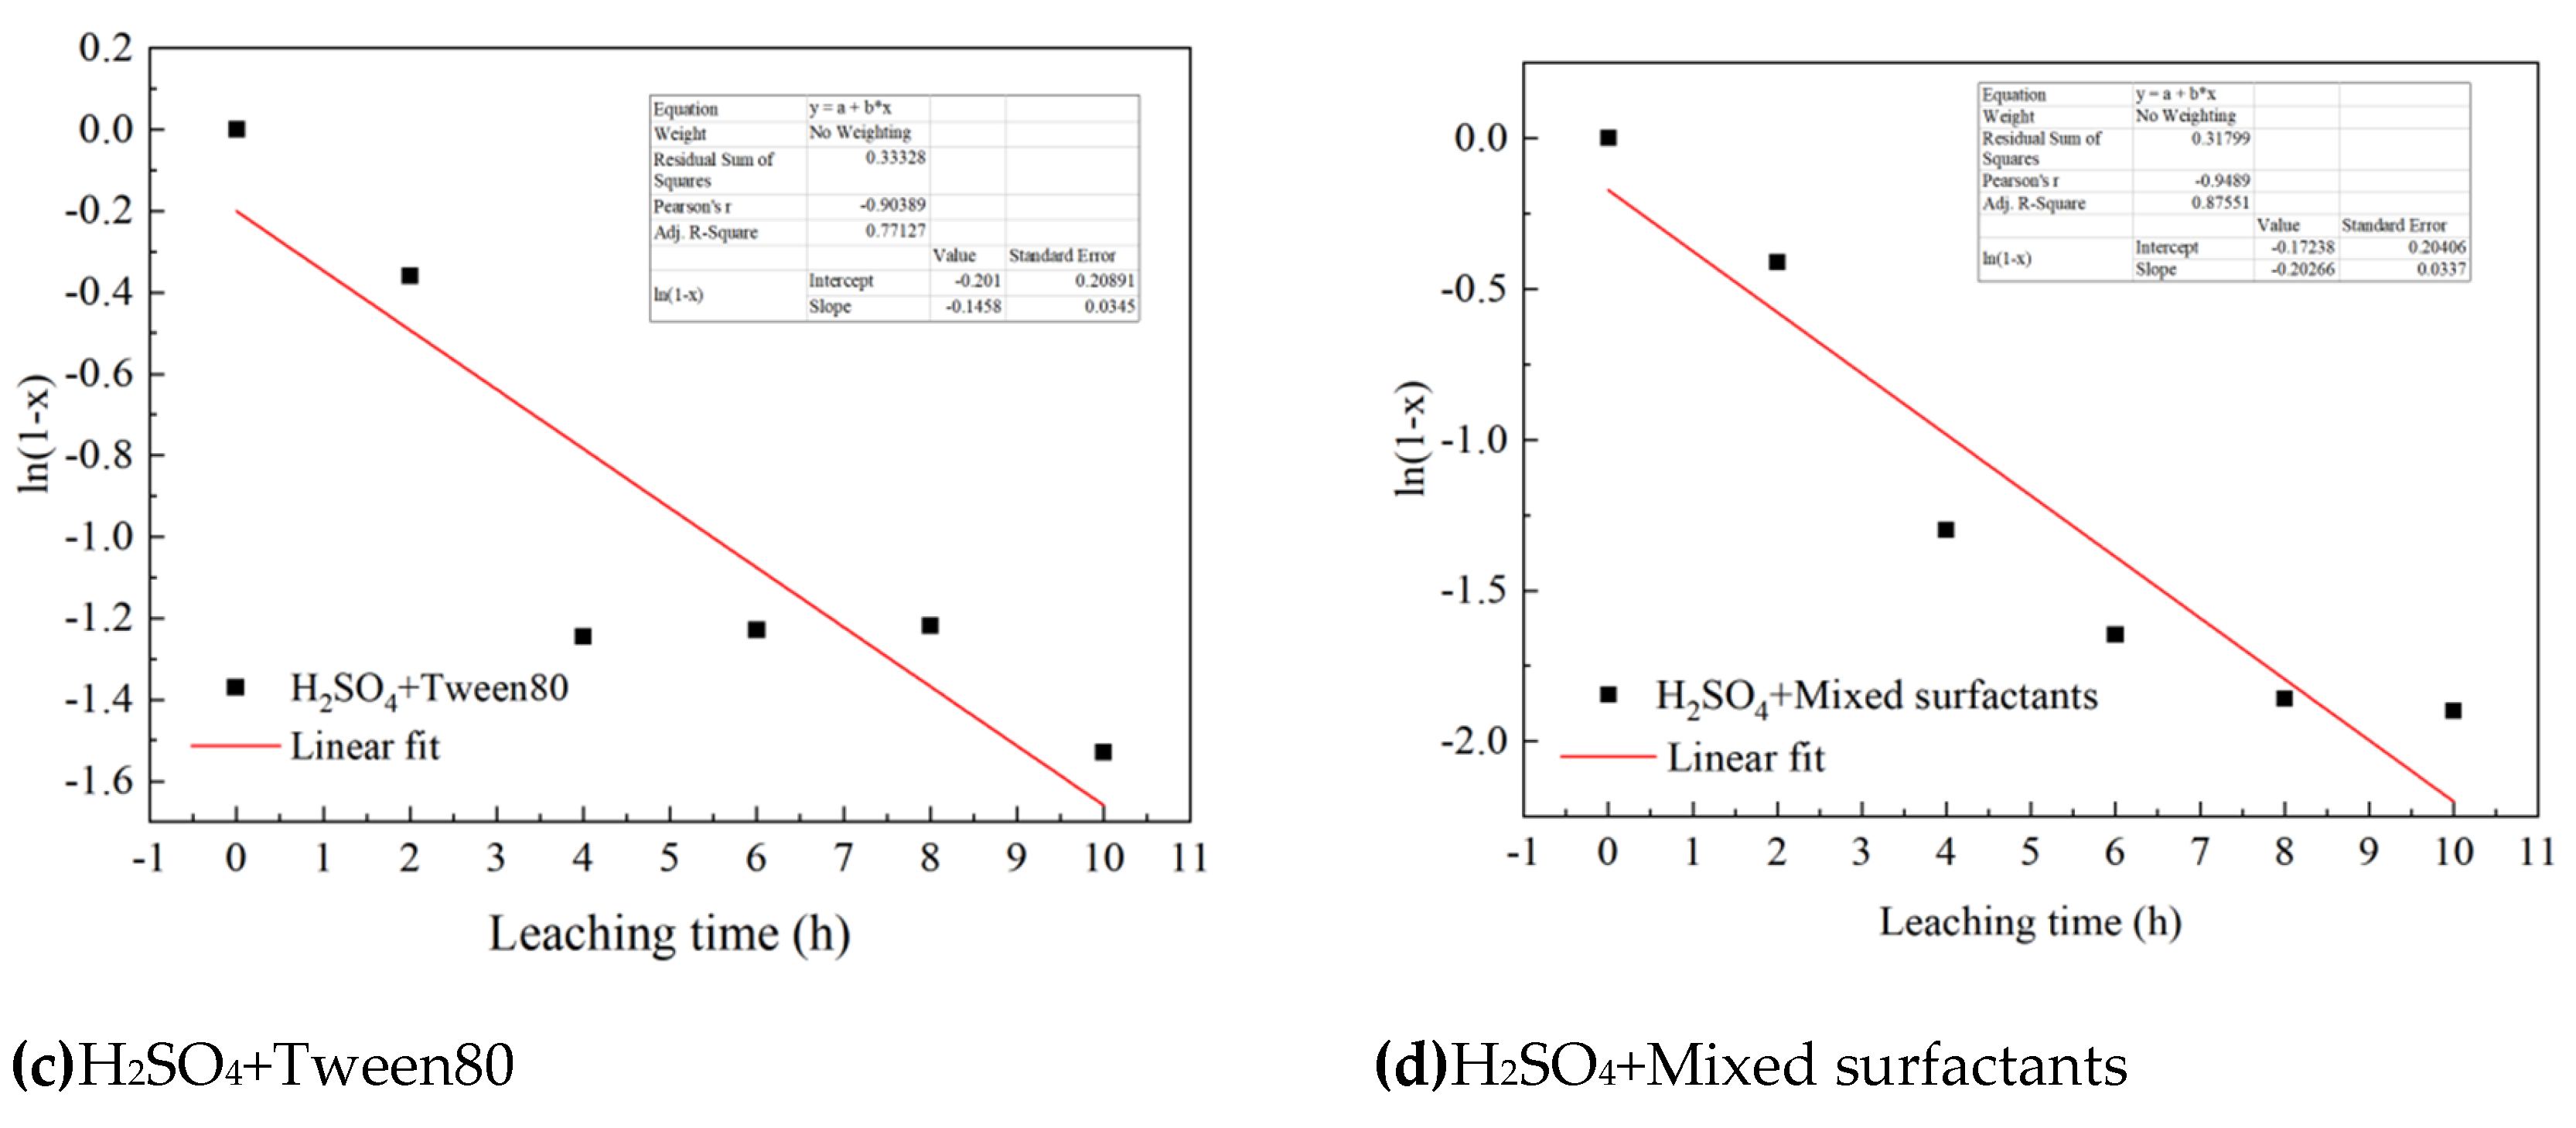
Table 3.
Textural properties of the granite-hosted uranium ore sample determined by N₂ adsorption–desorption analysis.
Table 3.
Textural properties of the granite-hosted uranium ore sample determined by N₂ adsorption–desorption analysis.
| Parameter | Value |
| BET specific surface area | 5.4240 m²/g |
| Total pore volume | 0.0171 cm³/g |
| t-plot micropore volume | 0.000829 cm³/g |
| t-plot micropore area | 0.979 m²/g |
| External surface area | 4.445 m²/g |
| BJH adsorption average pore diameter | 11.956 nm |
Table 4.
Kinetic fitting parameters for the external diffusion-controlled model under different leaching conditions.
Table 4.
Kinetic fitting parameters for the external diffusion-controlled model under different leaching conditions.
| Leaching conditions | Rate constant(h-1) | |
| H2SO4 | 0.04354 | 0.8850 |
| H2SO4+OP-10 | 0.03707 | 0.7972 |
| H2SO4+Tween 80 | 0.03256 | 0.7320 |
| H2SO4+Mixed surfactants | 0.04256 | 0.8334 |
Table 5.
Kinetic fitting parameters for the internal diffusion-controlled model under different leaching conditions.
Table 5.
Kinetic fitting parameters for the internal diffusion-controlled model under different leaching conditions.
| Leaching conditions | Rate constant k(h-1) | |
| H2SO4 | 0.0158 | 0.9041 |
| H2SO4+OP-10 | 0.0119 | 0.7963 |
| H2SO4+Tween 80 | 0.00983 | 0.8083 |
| H2SO4+Mixed surfactants | 0.01551 | 0.9080 |
Table 6.
Kinetic fitting parameters for the chemical reaction control model under different leaching conditions.
Table 6.
Kinetic fitting parameters for the chemical reaction control model under different leaching conditions.
| Leaching conditions | Rate constantk(h-1)(Absolute slope value) | |
| H2SO4 | 0.17543 | 0.9186 |
| H2SO4+OP-10 | 0.16981 | 0.9198 |
| H2SO4+Tween 80 | 0.14580 | 0.8170 |
| H2SO4+Mixed surfactants | 0.20266 | 0.9004 |
Disclaimer/Publisher’s Note: The statements, opinions and data contained in all publications are solely those of the individual author(s) and contributor(s) and not of MDPI and/or the editor(s). MDPI and/or the editor(s) disclaim responsibility for any injury to people or property resulting from any ideas, methods, instructions or products referred to in the content. |
© 2026 by the authors. Licensee MDPI, Basel, Switzerland. This article is an open access article distributed under the terms and conditions of the Creative Commons Attribution (CC BY) license (http://creativecommons.org/licenses/by/4.0/).
Copyright: This open access article is published under a Creative Commons CC BY 4.0 license, which permit the free download, distribution, and reuse, provided that the author and preprint are cited in any reuse.