

Submitted:
13 September 2026
Posted:
15 September 2026
You are already at the latest version
Abstract
The critical current (Ic) of a Josephson junction (JJ) is a significant physical parameter that plays a crucial role in the design of subsequent devices and circuits, as well as in the preparation of manufacturing processes. To ensure accurate measurement values, it is necessary to conduct tests in an ideal shielding room. However, due to limitations in laboratory conditions, the actual tests are often conducted in unshielded environments, which are inevitably influenced by various environmental noises. This introduces significant uncertainty in the measurement results of the critical current of the JJ and thus impacts the design of superconducting circuits that follow. We examines the impact of conductive, radiated, and flux noise on the repeatability of the Ic value in an unshielded environment, and setup an empirical formula for predicting Ic values in shielded environments from unshielded environment data.The deviation of empirical value of Ic and the experimentally measured value is less than 1%, verifying the effectiveness of the empirical formula.This approach offers a relatively accurate and cost-effective method for testing the critical current (Ic) of Josephson junctions (JJ) under unshielded conditions.
Keywords:
unshunted Josephson junctions
; measurement
; critical current
; formula
; uncertainty
1. Introduction
Superconducting electronic circuit technology has the characteristics of high clock frequency [1] and the lowest bit manipulation energy dissipation [2,3], making it an important candidate for future high-performance superconducting computers MIT Lincoln Laboratory (MIT LL) has made a series of advancements in the manufacturing technology of superconducting rapid single flux quantum (RSFQ) circuits [4,5,6,7], designed for high-performance superconducting multi bit processors with clock frequencies ranging from 10 GHz to 20 GHz for high-performance computing [8]. The conventional process often uses shunted JJ (implemented in parallel with unshunted JJ resistors) as the basic unit to form the circuit. Although these JJs can achieve good noise resistance and thus circuit stability, it occupies a large area, which limited the JJ process integration density to be generally lower than 106 JJs/cm2 [9]. To increase the integrated scale of SFQ circuits to over 106 JJs/cm2, it is necessary to reduce the area occupied by JJs and shunt resistors. The unshunted JJ is beneficial for significantly reducing the unit area. Therefore, unshunted JJ has become a potential candidate for high integration density, high current density, and high clock frequency superconducting Josephson circuits [9].
Compared to conventional unshunted JJ, shunted JJ is more sensitive to electromagnetic and magnetic noise from circuits, spaces, and other sources. As one of the important physical parameters of JJ, critical current (Ic) is crucial for the later device, circuit design, process preparation [10]. The accuracy of Ic measurement is directly related to the margin of various electrical parameters of subsequent circuits. In order to obtain accurate measurement values, the test should be carried out in a suitable shielding room [11]. However, due to the limitations of laboratory conditions, the actual test is usually carried out in unshielded environment. This inevitably introduces various environmental noises to JJ, and brings great uncertainty to the measurement results of JJ current. Also, the future superconductor computer will work under noisy environment, comparing to the environment of traditional computer, to obtain the application competitive with semiconductor computer. Therefore, it is necessary to carry out the accurate measurement research of unshunted JJ current under the unshielded environment, and evaluate the filtering technics applicable to the unshielded environment.
According to Ambegaokar-Baratoff theory [12], the theoretical value Ic0 can be calculated by formula: Ic0=Ig * π/4. Ig is defined as the current at which the junction goes into a normal state and Vg as gap voltage of Josephson junction. The actually measured Ic value is usually smaller than the theoretical value Ic0 due to the effect of the complex noise effect, which seriously affects the circuit performance of superconducting Josephson devices. Yasushi Ishikawa et al. analyzed the influence of magnetic noise on the characteristics of superconductor/normal-metal/superconductor (SNS) JJ Ic , and found that the dependence of Josephson currents on the magnetic field are sensitive to the width of the normal metal [13]. Ohkubo et al. [14] have studied the standard measurement method of Ic in the over-damped regime, but such a study for under-damped Nb/Al-AlOx/Nb junctions under unshielded conditions is lacking.
In this paper, the influence of electromagnetic, magnetic and flux noises on the accurate measurement of JJ Ic is experimentally studied based on the unshunted JJ under unshielded environment. This study provides reference for avoiding or reducing the impact of test environment and magnetic flux noise on Ic under actual experimental conditions, and has guiding significance and application value for the subsequent research and application of RSFQ circuits and superconducting large-scale digital integrated circuits.
2. Results and Discussion
2.1. JJ Fabrication Process and Ic Test Equipment
Comprehensive and efficient process control monitors (PCMs) are essential to keep the physical parameter of JJ stable. Here, we carry out the measurement based on the unshunted Nb/Al-AlOx/Nb JJ sample fabricated following the standard fabrication process [15,16], which is named as SIMIT Nb03, for RSFQ integrated circuits. Considering that the quality of junctions is influenced by the stress of Nb film [16,17], junctions on a SiO2 flat field and on a via to a Mo resistor are both designed. In our PCM, two kinds of JJs are included, the unshunted junctions on SiO2 fields (labeled as juf) and those on Mo resistors (labeled as jur). The thickness of Mo film is 40 nm, and the thickness of SiO2 is 100 nm. Nb is patterned and etched by inductively coupled plasma reactive ion etching (ICP-RIE) equipment with endpoint detector. SiO2 is deposited by plasma enhanced chemical vapor deposition (PECVD) equipment and etched by reactive ion etching (RIE) equipment [18].
The JJ device test circuit diagram is shown in Figure 1. The JJ is put 10 cm below the liquid level of liquid Helium to assure the JJ in superconducting state during the process of I-V curve test. Four π-type lower-pass filter (LPF) units are integrated in the circuit to filter the environmental EM noise out of the test circuit. In the actual test environment, the test space is often full of electromagnetic noise at various frequencies, including power frequency (50 Hz) and RF signals (30 kHz-30 GHz). These spatial noises will couple into the circuit to form conductive noise, which will affect the JJ current test results. Therefore, it is necessary to filter these noises by filtering circuit.
The setup of Ic measurement is shown in Figure 2. Keithley6221 current source and Keithley2182A voltmeter are used for testing I-V curve, and Ic value can be obtained automatically from the curve. The tested PCM cell is connected to the PCB by wire bonding. The Al foils (10 layers) are wrapped around the Nb cylinder for shielding magnetic noise. Just after the sample temperature is cooled down to ~4.3 K, the amplitude of the supply current has to be adjusted to twice the estimated maximum value of Ic and the I-V curve can be scanned and recorded in computer. The maximum value of Ic is usually known from the preceding measurement of a current–voltage characteristic. The whole experiment is controlled by a PC computer. During testing, the sample must be located below 10cm of the liquid helium level. The de-fluxing mentioned in this paper refers to the following process: 1) Raising the test rod to increase the sample temperature; 2) Rotate the test rod 90o, the rotation may help to increase the Ic value, which may be caused by the difference of magnetic field in certain direction; 3) Keep the sample above 15 K for 5 minutes. Based on our experimental knowledge, in the different maximum temperature (e.g, heating the sample to 10 K, 11 K, 12 K, 15 K, each for 10 s, respectively) , the 15 K is the suitable temperature to get the highest Ic value; 4) then lower the test rod to the original position for testing.
The relationship of measured and simulated normalized output amplitude from filter with the frequency in Figure 3a and the photo of the filter PCB board is shown in Figure 3b. The equivalent circuit diagram of the low-pass filter is shown in the illustration of Figure 3b. The simulated curve is the transfer function of a first order Butterworth type filter. Determination of the cut-off frequency is illustrated in Figure 3a, where the value of this function is 0.707. Comparing Gfilter (fc=50 Hz) experiment and simulation data, it is found that when the frequency is less than 90 Hz, the experiment and simulation data are in good agreement. However, when the frequency is greater than 90 Hz, the experimental data is gradually higher than the simulation value. Also in the Ffilter (fc=2 kHz) test, it is found that when the frequency is higher than 4 kHz, the experimental data is gradually higher than the simulation data. This may be due to frequency related noise interference above the cut-off frequency. To assure the filtering effect, a filter with fc (R=5.1 kHz, C=10 F) of 5 Hz is used in the paper.
2.2. The Definition of Physics Parameters Related to the Measurement of Ic
The sketch map of I-V curve is shown in Figure 4. The reciprocal of slope of L1, L2 and L3 correspond to normal state resistance RN, semi-superconducting state resistance Rs, and sub-gap resistance Rsg. Ig is determined as vertical coordinate value of intersection (point N) of L1 and L2. IM (=VM/Rs) is determined as vertical coordinate value of intersection (point M) of L2 and L3. Vg of JJ is defined as 2Δ/e. Here, e is the electron charge, and Δ is the superconducting energy gap [19]. L2 has the same slope with the I-V curve (RsIM<V<RNIg). RN is the differential value of V to I when V >IgRN. In this paper, Rsg is the differential value of V to I when V<2 mV. Vg is calculated by the formula Vg=0.5*(VN+VS) in the line L2, where I equals to about 0.5 Ig.
In an ideal environment, the measured Ic value inclines to the ideal critical current Ic0 and the zero-voltage hysteresis current Ir inclines to be zero when temperature is 0 K. When Ic increase from 0 to Ic0, the voltage is zero, when I >=Ic0, V increases rapidly to Vg. when I >Ig (quasi-particle current), JJ enters normal state, with resistance RN. In a practical test, the magnetic and EM noise may move some fluxes into the JJ sample, and thus decrease the Ic value to a lower value and increase Ir to a higher value.
3. Discussion
3.1. The Effect of Low-Pass Filter with Cut-Off Frequency fc on Ic
The Ic measurements, repeated 30 times for sample s0506-juf3.1 for each filtering configuration, outside the magnetic shield room, are shown Figure 5. It is obvious that average Ic without filter (upward triangle) is much lower than that with filters, which means that filter is a necessary tool to filter conductive noise along with the cables to assure higher Ic value. The bulge in Ic curve of no filter may be caused by sudden disappearance of surrounding noise, which induces Ic to increase. The Ic values without filter after 22 times measurement seems almost constant compared to the values before 21 times measurement, which may be due to flux trapping under unshielded environment.
The histograms of Ic for sample s0506-juf3.1 using different filters with different cut-off frequencies are shown in Figure 6, it is not difficult to find that the average Ic is almost the same (~520 μA) by comparing the two curves with different filter cut frequency fc of 50 Hz (Gfilter Figure 6b and 2 kHz (Ffilter, Figure 6a. Ic obtained through filter with lower cut-off frequency (fc=50 Hz) shows better Ic uncertainty than that with higher fc (2 kHz), which indicates that in order to obtain good uncertainty and higher average Ic, filter with lower cut-off frequency is better than that with higher one. Electromagnetic (such as power frequency) noise can be filtered out by filter with a cut-off frequency lower than 50 Hz, thus improve the measured value of Ic and reducing the uncertainty.
3.2. The Effect of Nb Cylinder and Multi-Layer Al Foils on the Measured Ic Value
Magnetic field, flux vortex and electromagnetic field can penetrate superconducting films and devices in many ways, resulting in Ic measurement uncertainty and ultimately affecting the operation of circuits. Therefore, it is necessary to prevent or reduce these effects through shielding in measurements.
The Ic measurements, repeated 41 times for sample s0506-juf3.1 with or without Al cover are shown Figure 7a. The probability of Ic with and without Al foils are shown in Figure 7b. The shielding structure consists of an Nb cylinder and 10 layers of Al foils surrounding. The average Ic and uncertainty with cover is 349 μA and ±11% , respectively,and those without cover is 299 μA and ±11% , respectively.
3.3. Influence of Multiple de-Fluxing on Ic with and Without Spatial EM and Magnetic Noise
The Ic repeatability for different de-flux times is shown in Figure 8a. Histogram of the same data is shown in Figure 8b. It is not hard to find that different de-fluxing time corresponds to different average Ic. The uncertainty and average value of Ic of no de-flux, de-flux 1st , 2nd , 3rd , 4th outside magnetic shield room, and in magnetic shield room(full shield) are reported in table I. The average Ic after the 2nd de-fluxing cycle is the lowest (102 μA), corresponding to largest uncertainty. The deviation of Ic from the average Ic of corresponding de-fluxing time (U=10.27-76.47%) outside magnetic shield room is caused by environmental EM noise, which may introduce some fluxes into sample and reduce Ic. In contrast to the measurement outside magnetic room, the highest average Ic (560.13 μA) and lower uncertainty (0.71%) are obtained in magnetic shield room. The theoretical Ic (=Ig π/4) is calculated to be 668.82 μA.

Table I.
The uncertainty and average value of Ic with no de-fluxing, after 1st, 2nd, 3rd, 4th de-fluxing outside magnetic shielding room, in shielding room and the theoretical Ic.
Table I.
The uncertainty and average value of Ic with no de-fluxing, after 1st, 2nd, 3rd, 4th de-fluxing outside magnetic shielding room, in shielding room and the theoretical Ic.
| item | No de-flux | de-flux1 | de-flux2 | de-flux3 | de-flux4 | full shield | ideal |
| U(%) | 15.39 | 10.27 | 76.47 | 35.82 | 28.43 | 0.71 | 0 |
| Ic(μA) | 523.07 | 526.05 | 102 | 469.02 | 495.95 | 560.1 | 668.8 |
3.4. Flux Noise Impact and Its Removal or Reduction
The Ic distribution for no-de-flux, de-flux1, de-flux2, de-flux3 and de-flux4 are shown in Figure 8b. The peak position of Ic stands for the most often measured value of Ic. Different times of de-fluxing shows different Ic peak value and distribution, and the 1st de-fluxing shows maximum Ic in Figure 8a, which means that Ic value is not positively correlated with the de-fluxing number. Based on this method, the obtained test Ic value under EM and magnetic noise environment can reach 526.05 μA, which reaches 93.9% of the value (560.13 μA) tested in magnetic shielding room.
It is easy to find that the uncertainty U of the sample varies with the de-fluxing times in the Table I, and the uncertainty in fully shielded environment is smaller than all of the other tested data under the unshielded environment. The data tested under the unshielded environment also varies greatly with the de-fluxing times, but the uncertainty does not show a positive or negative correlation with the number of de-fluxing times. This may be explained as that the spatial magnetic field and EM noise may randomly affect the flux trapping mechanism in the tested sample under unshielded environment, thus cause the uncertainty of Ic to change. Therefore, it is necessary to de-flux the sample under magnetic shielded environment to reduce the uncertainty value if the test condition allow.
3.5. Magnetic Noise Impact and Its Removal or Reduction
This study shows that magnetic shielding can reduce the influence of magnetic noise on the measurement of junction critical current Ic by wrapping 10 layers of Al foils on the Nb cylinder outside the sample. General principles of magnetic and EM shielding are treated by textbooks [20,21,22], which include design and calculations of shielding enclosures and their effectiveness. Y. Iwashita et al. proposed a passive magnetic shielding method based on niobium/aluminum structure. Theoretically, it is proved that this structure(with high permeability material and superconducting material) can not only break through the limit of the shielding ability by the critical field (about 170 mT of niobium), and thus improve the shielding effect, but also optimize the temperature gradient of the radial thermal conductive layer, thus further enhancing magnetic flux exclusion effect in sample [23]. But no experimental report has been found in the author’s paper. Based on the test data of Nb/Al-AlOx/Nb samples, it is found that the average Ic of sample in the Nb cylinder wrapped with Al foils is 16.7% higher than that without Al foils (Figure 7). It is experimentally confirmed that wrapping Al foils outside Nb cylinder can help reduce magnetic leakage and improve the probability of magnetic flux exclusion out of the superconducting layer, which is consistent with Iwashita’s theoretical prediction.
3.6. An Empirical Formula for Predicting Ic Values in Shielded Environments from Unshielded Environment Data
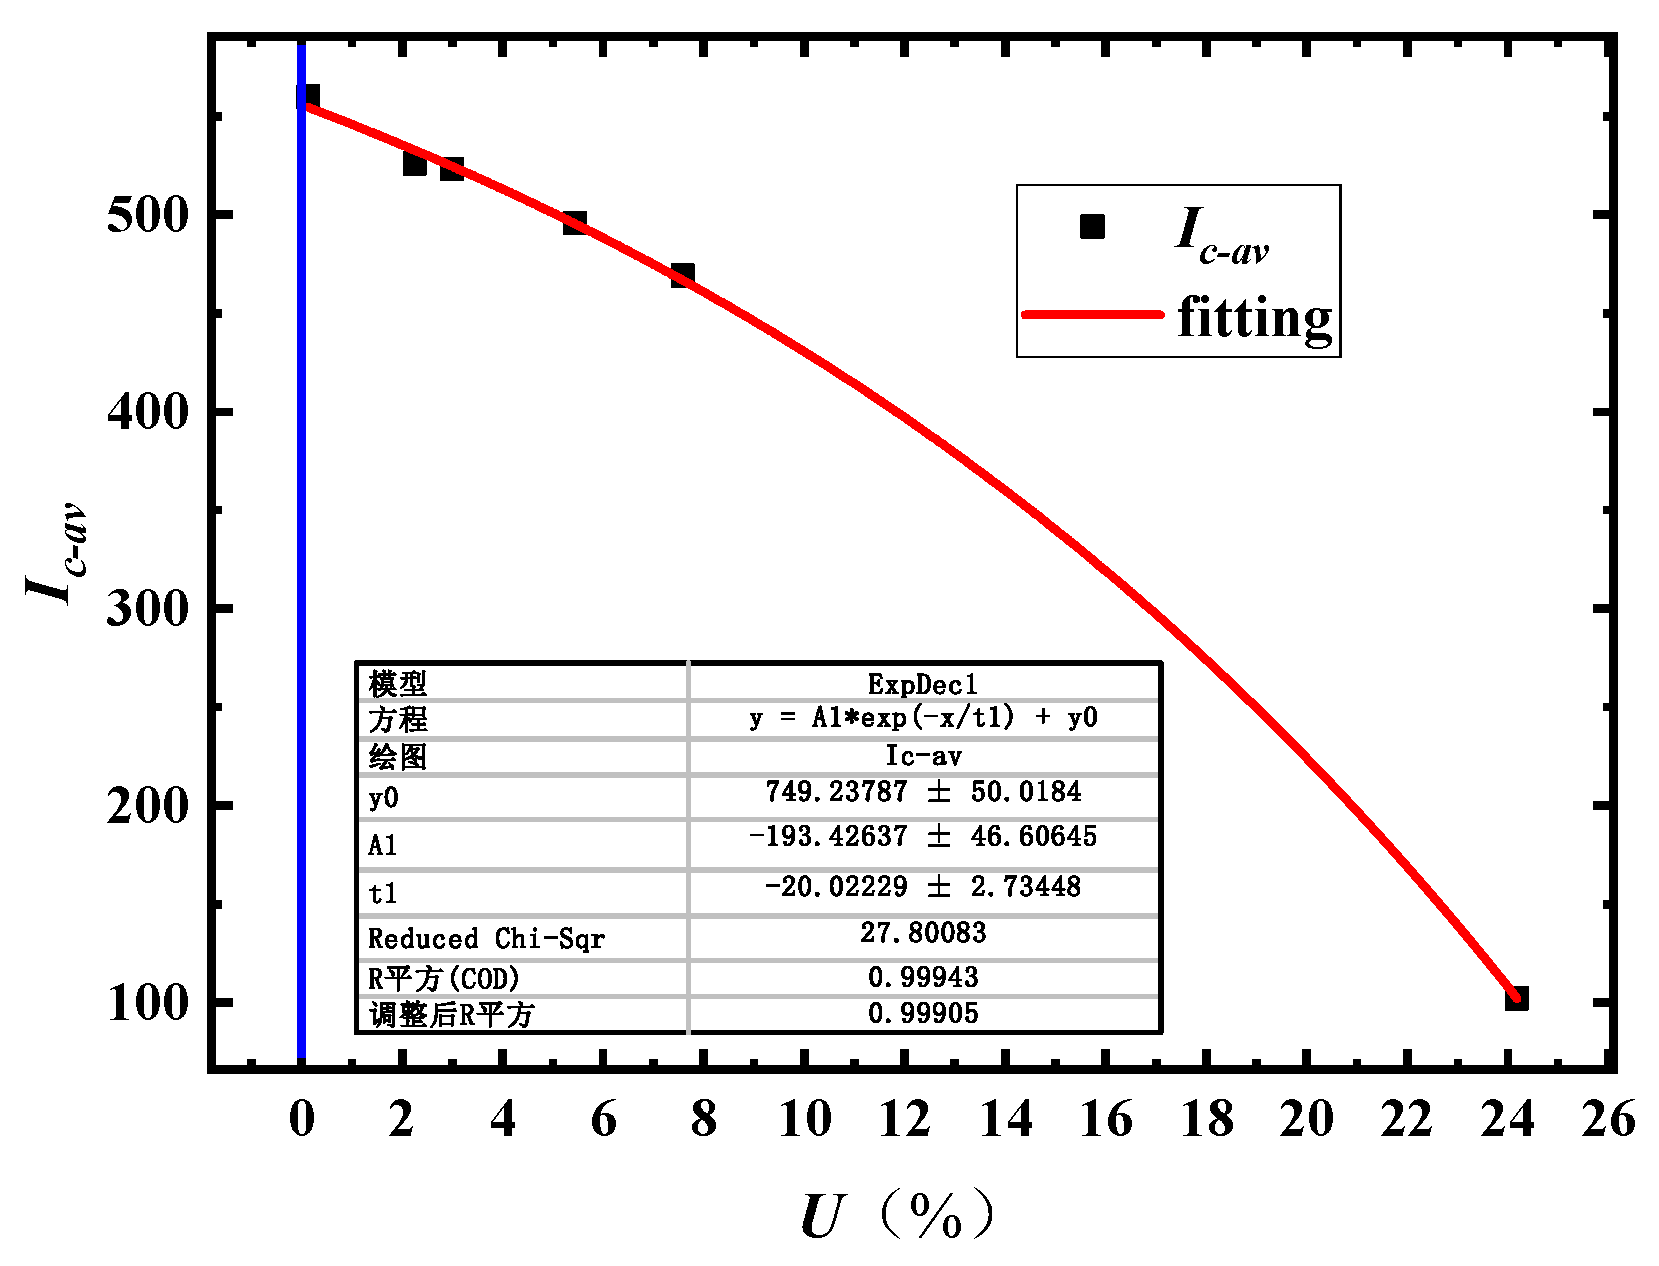
Figure 9 shows the relationship of average JJ current Ic-av with uncertainty U of Ic data of sample s0506-juf3.1 from repeatability study. Based on an test procedure, we propose a formula for predicting measured Ic value under magnetic shielded environment.
The procedure is as following: 1) Place the sample at the bottom of the testing rack; 2) Insert the test rod into the liquid helium Dewar and keep the sample 10 cm below the liquid helium level during the testing process; 3) Connect all devices; 4) Wait for the temperature of sample under test to be below 4.3 K; 5) Measure Icij (i=1:n; j=1:m). Firstly, measure Icij m times, if j<m, then, j=j+1 and measure Ic; if j=m, obtain the average value Ici-av and uncertainty Ui, then heat the sample to de-flux; 6) carry out N times of measurements of Ici-av, if i<n, then i=i+1; if i=n, end, output Ici-av and Ui; 7) setup the relationship between Ici-av and Ui,in formula (1);
By fitting the data in Figure 9, it is not difficult to give out: A=749 μA, B=-193 μA, and C=20. Based on the Ici-av and Ui relationship, the average Ici can be extrapolated to the point where U=0 and Ic = 556 μA, which is the empirical value of Ic under the condition of no shielded room. The experimentally measured Ic under shielding room was 560 μA. The deviation is less than 1%. which verifies the effectiveness of the empirical formula for predicting Ic values of sample s0506-juf3.1 in shielded environments using data from unshielded environments.
4. Conclusions
The influence of magnetic and electromagnetic noise on the accurate measurement of junction critical current Ic is investigated with unshunted Nb/Al-AlOx/Nb JJ samples. The accumulation of magnetic flux inside the junction is the main reason for the decrease of JJ Ic ; EM noise as an external cause is the main reason for the increase of junction Ic uncertainty and the decrease of Ic value. The results is as following:
We have experimentally demonstrated that magnetic flux pinning in the SIS junction is one of the reasons for the decrease in measured JJ current. Multiple de-fluxing (changing the direction of rotation of the test rod before each de-fluxing ) is beneficial for obtaining higher JJ measurement Ic. The measured Ic value can be as high as possible by repeatedly de-fluxing (more than 5 times) and selecting the optimum Ic value (526.05 μA) reaches, in a batch of 41 cycles, 93.9% of that (560.13 μA) tested in shielding room;
The structure of Nb cylinder wrapped with multi-layer aluminum foil can reduce magnetic interference. The structure can increase JJ Ic value by 16.7%.
We setup an empirical formula for predicting Ic values in shielded environments from un-shielded environment data.The deviation of empirical value of Ic and the experimentally measured value is less than 1%, verifying the effectiveness of the empirical formula.
This paper provides a relatively accurate and low cost test idea of JJ Ic under unshielded conditions, which provides guidance for the fine test of Ic under conventional laboratory conditions without expensive magnetic shielding equipment, and has important practical value for speeding up the design and manufacturing process of RSFQ devices and the development of large-scale superconducting computer integrated circuit chips.
5. Patents
A low temperature superconducting Josephson junction current testing method without magnetic shielding environment and parallel resistance, by Zhou Jian, Wang Juan, Wang Yongliang, and Peng Wei. Invention patent, application number: 202311206205.0, application date: 2023.9.19 Accepted. Authorization number: ZL202311206205.0, authorization date: August 4, 2026.
Supplementary Materials
The following supporting information can be downloaded at the website of this paper posted on Preprints.org, Figure 1: JJ device test circuit diagram; Figure 2: the setup of Ic measurement: (a) test bar in Dewar; (b) current source and voltmeter; (c) test bench; (d) Al foils; Figure 3 (a) the relationship of measured (hexagon dots: 2 kHz; square dots: 50 Hz) and simulated (solid line: 50Hz; dotted line: 2 KHz) normalized output amplitude from filter with the frequency. (b) The photo of the filter PCB board for test; Figure 4: The sketch of I-V curve; Figure 5: Ic data of sample s0506-juf3.1 from repeatability study. Gfilter: fc=50 Hz; Wfilter: fc=2 kHz; Figure 6: Histogram of Ic data of sample s0506-juf3.1 from repeatability study. Filter and cut-off frequencies are given respectively: (a) Wfilter: fc=2 kHz; (b) Gfilter: fc=50 Hz ; (c) No filter; Figure 7: (a) Ic data of sample s0506-juf3.1 from repeatability study, with (blank square) or without (full circle) Al foil; (b) Histogram of the same data with (black diagonal bar) and without (blue blank bar) Al foil.; Figure 8 (a) Ic data of sample s0506-juf3.1 from repeatability study, after several de-fluxing cycles; (b) Histogram of the same data; Figure 9 The relationship of average JJ current Ic-av with uncertainty U of Ic data of sample s0506-juf3.1 from repeatability study. Table I :The uncertainty and average value of Ic with no de-fluxing, after 1st, 2nd, 3rd, 4th de-fluxing outside magnetic shielding room, in shielding room and the theoretical Ic.
Author Contributions
Conceptualization, Jian Zhou; investigation, Jian Zhou; resources, Yewen Yao and Juan Wang; writing—original draft preparation, Jian Zhou; writing—review and editing, Yongliang Wang.; supervision, Wei Peng and Man Wang. All authors have read and agreed to the published version of the manuscript.” Please turn to the CRediT taxonomy for the term explanation. Authorship must be limited to those who have contributed substantially to the work reported.
Funding
This research received no external funding.
Data Availability Statement
All the experimental data presented in this study are included in the article. Additional inquiries can be directed to the corresponding author.
Conflicts of Interest
The authors declare no conflicts of interest.
Abbreviations
The following abbreviations are used in this manuscript:
| JJ | Josephson junction |
| RSFQ | Superconducting rapid single flux quantum |
| PCMs | Process control monitors |
| PECVD | Plasma enhanced chemical vapor deposition |
References
- Chen, W.; Rylyakov, A. V.; Patel, V.; Lukens, J. E.; Likharev, K. K. Superconductor digital frequency divider operating up to 750 GHz. Appl. Phys. Lett. 1998, vol. 73, 2817–2819. [Google Scholar] [CrossRef]
- Ren, J.; Semenov, V. K. Progress with physically and logically reversible superconducting digital circuits. IEEE Trans. Appl. Supercond. 2011, vol. 21, 780–786. [Google Scholar] [CrossRef]
- Tolpygo, S. K. Superconductor digital electronics: Scalability and energy efficiency issues (Review Article). Low. Temp. Phys. 2016, vol. 42(no. 5), 361–379. [Google Scholar] [CrossRef]
- Tolpygo, S. K.; Bolkhovsky, V.; Weir, T. J.; Johnson, L. M.; Gouker, M. A.; Oliver, W. D. Fabrication process and properties of fully-planarized deep-submicron Nb/Al-AlOx/Nb Josephson junctions for VLSI circuits. IEEE Trans. Appl. Supercond. 2015, vol. 25(no. 3), Art. no. 1101312. [Google Scholar] [CrossRef]
- Tolpygo, S. K.; et al. Advanced fabrication processes for superconducting very large scale integrated circuits. IEEE Trans. Appl. Supercond. 2016, vol. 26(no. 3), Art. no. 1100110. [Google Scholar] [CrossRef]
- LI, F.; PENG, W. Research status and prospects of cryogenic storage for superconductor digital computing[J]. J. Funct. Mater. Devices. [CrossRef]
- YANG, S.C.; CHEN, M.F.; REN, J. Time scaling methodology for superconducting dual-active-layer integrated circuits[J]. J. Funct. Mater. Devices 2026, 32(3), 032205. [Google Scholar] [CrossRef]
- Manheimer, M. A. Cryogenic computing complexity program: Phase I Introduction. IEEE Trans. Appl. Supercond. 2015, vol. 25(no. 3), Art. no. 1301704. [Google Scholar] [CrossRef]
- Tolpygo, S. K.; Bolkhovsky, V.; Zarr, S.; Weir, T. J.; et al. Properties of Unshunted and Resistively Shunted Nb/AlOx -Al/Nb Josephson Junctions With Critical Current Densities From 0.1 to 1 mA/ µm 2. IEEE Trans. Appl. Supercond. 2017, vol. 27(no. 4), Art. no.2667403. [Google Scholar]
- West, J. T.; Kurlej, A.; AWynn; et al. Wafer-Scale Characterization of a Superconductor Intergrated Circuit Fabrication Process, Using a Cryogenic Wafer Prober. IEEE Trans. Appl. Supercond. 2022, vol. 32 no., Art. no.3172660. [Google Scholar] [CrossRef]
- Zhou, J.; Wang, J.; Yao, Y.W.; Wang, Y.L.; Wang, M.; Peng, W. A Measurement Method of Critical Current of unshunted Josephson Junctions. IEEE Trans. Appl. Supercond. 2023, 33(8), 1–6. [Google Scholar] [CrossRef]
- Ambegaokar, V.; Baratoff, A. tunneling between superconductors. Phys. Rev. Lett. 1963, 10(11), 486–489. [Google Scholar] [CrossRef]
- Ishikawa, Yasushi; Fukuyama, Hidetoshi. Effects of Magnetic Field on Josephson Current in SNS System. J. Phys. Soc. Jpn. 1999, 68(3), 954–963. [Google Scholar] [CrossRef]
- Ohkubo, M.; Uehara, G.; Beyer, J.; Mimura, M.; Tanaka, H.; Ehara, K.; Tanaka, S.; Noguchi, T.; Mitchell, E. E.; Foley, C. P.; Fagaly, R. L. Standard measurement method for normal state resistance and critical current of resistively shunted Josephson junction. Supercond. Sci. Technol. 2022, 35(4), 045002-1-19. [Google Scholar] [CrossRef]
- Zhang, X.; et al. Process control monitoring for fabrication technology of superconducting integrated circuits. IEEE Trans. Appl. Supercond. 2021, 31(5), 1–6. [Google Scholar] [CrossRef]
- Ying, L. L.; et al. Development of multi-layer fabrication process for SFQ large scale integrated digital circuits. IEEE Trans. Appl. Supercond. 2021, vol. 31(no. 5), 3065277-1-6. [Google Scholar] [CrossRef]
- Satoh, T.; et al. Fabrication process of planarized multi-Layer Nb integrated circuit. IEEE Trans. Appl. Supercond. 2005, 15(2), 78–81. [Google Scholar] [CrossRef]
- Wu, Y.; et al. Film stress influence on Nb/Al-AlOx/Nb josephson junctions. IEEE Trans. Appl. Supercond. 2019, 29(5), Art. no. 1102105. [Google Scholar] [CrossRef]
- Alam, S.; Jahangir, M.A.; Aziz, A. A compact Model for Superconductor-Insulator-Superconductor (SIS) Josephson Junctions. IEEE Elect. Lett. 2020, 41(8), 1249–1252. [Google Scholar] [CrossRef]
- Rikitake, T. Magnetic and Electromagnetic Shielding; Springer Science & Business Media, Kluwer, 1987; ISBN -13: 978-9027724069, ISBN-10: 9027724067. [Google Scholar]
- Celozzi, S.; Araneo, R.; Lovat, G. Electromagnetic Shielding; IEEE Press and Wiley Interscience (Wiley), 2008; ISBN 978-0-470- 05536-6. [Google Scholar]
- Alex I. Braginski, Superconductor Electronics: Status and Outlook. J. Supercond. Nov. Magn. 2019, 32, 23–44.
- Iwashita, Y.; Kuriyama, Y.; Tongu, H.; Fuwa, Y. Magnetic Field Shielding With Superconductors. IEEE Trans. Appl. Supercond. 2022, 32(6), 3500404-1-4. [Google Scholar] [CrossRef]
Figure 1.
JJ device test circuit diagram.
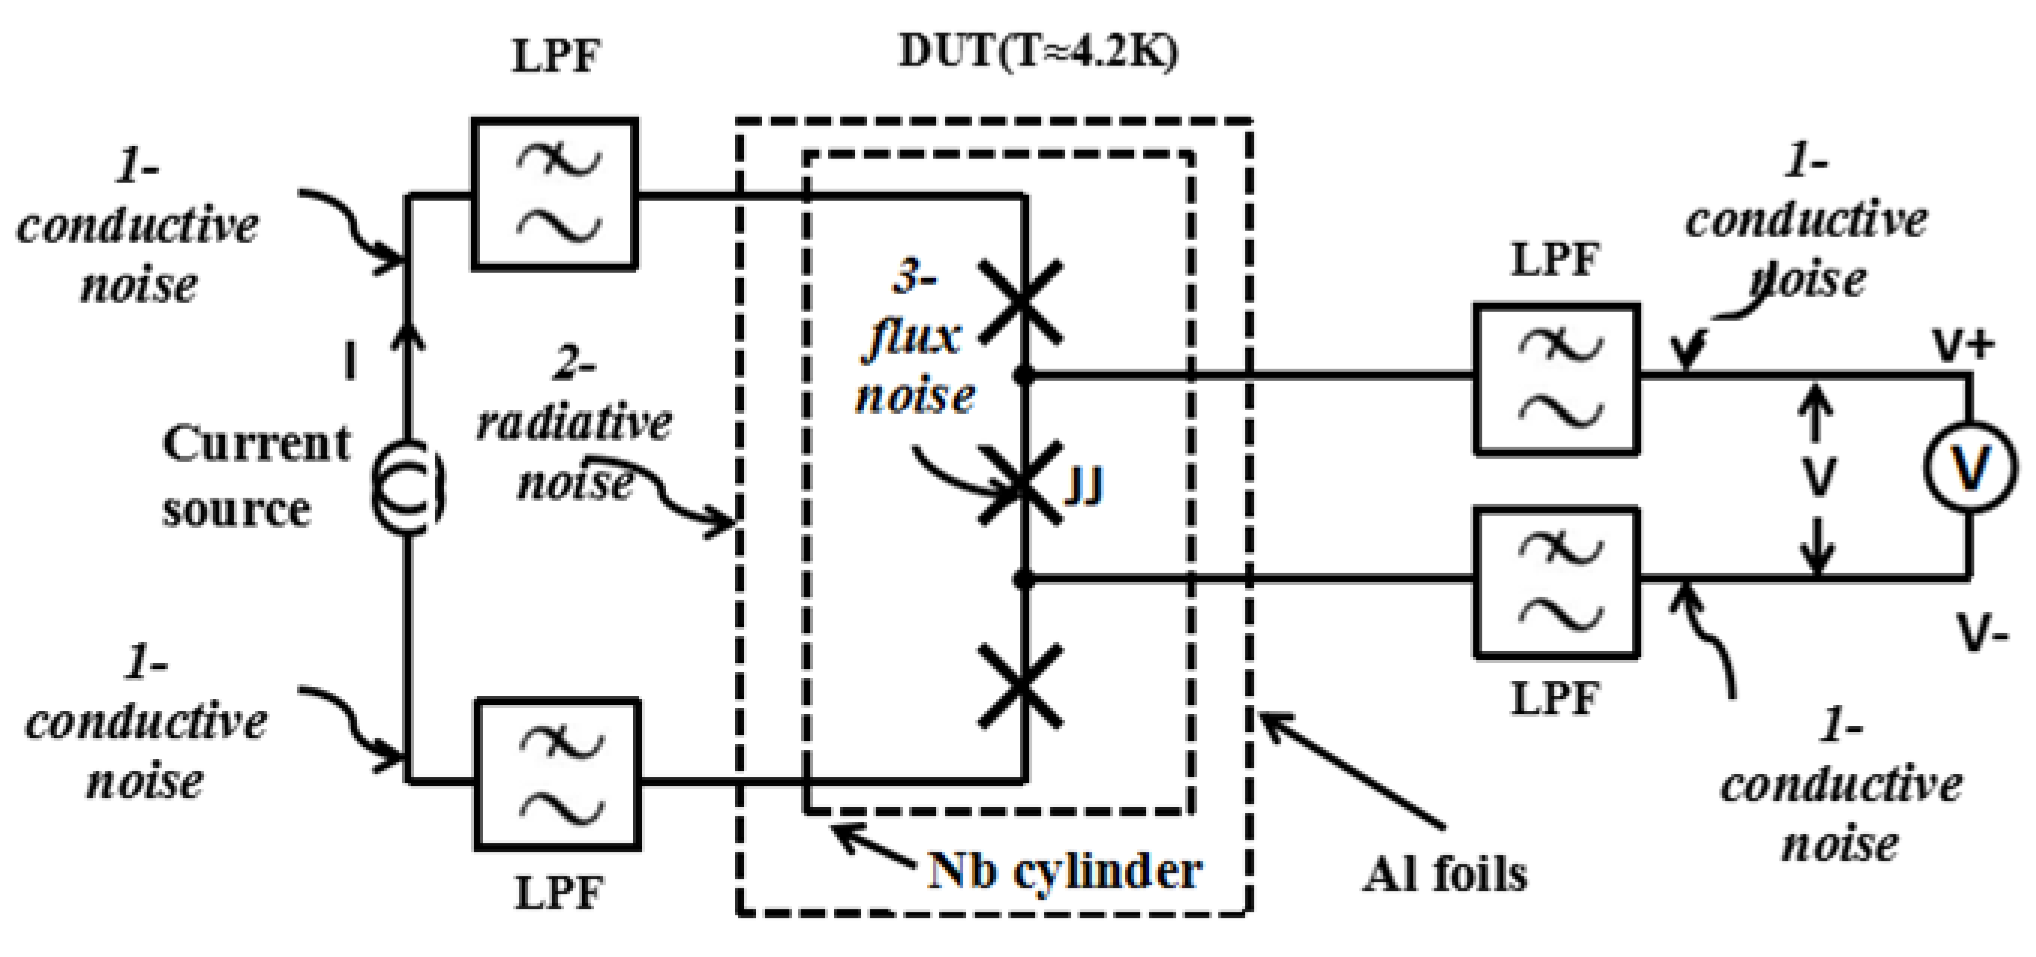
Figure 2.
the setup of Ic measurement: (a) test bar in Dewar; (b) current source and voltmeter; (c) test bench; (d) Al foils.
Figure 2.
the setup of Ic measurement: (a) test bar in Dewar; (b) current source and voltmeter; (c) test bench; (d) Al foils.
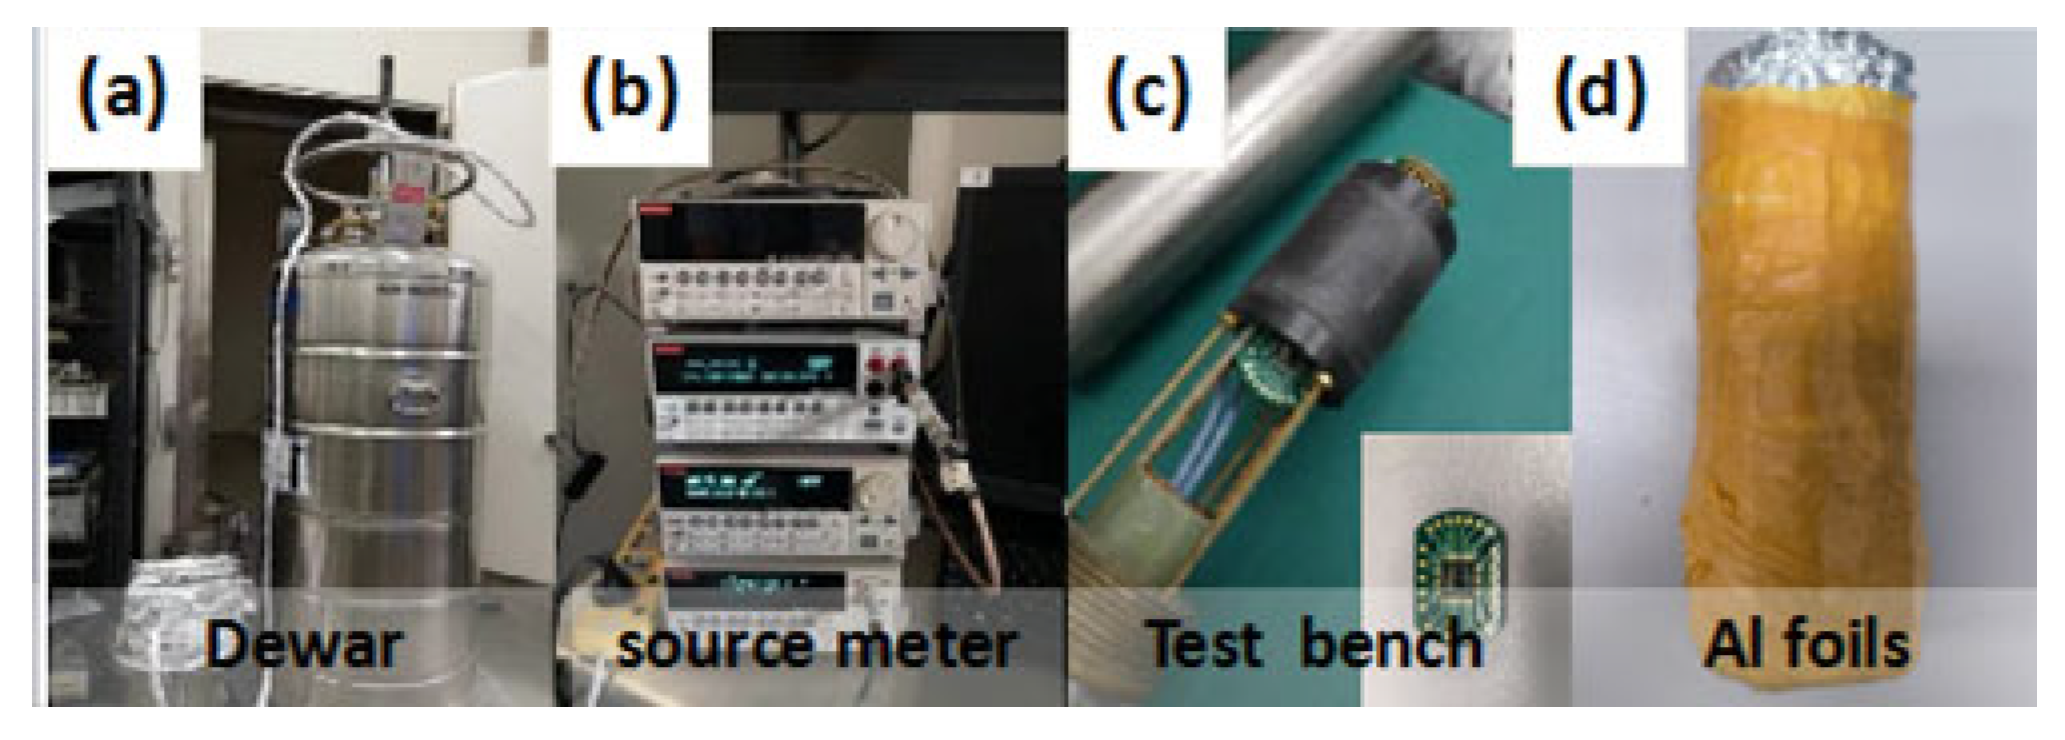
Figure 3.
(a) the relationship of measured (hexagon dots: 2 kHz; square dots: 50 Hz) and simulated (solid line: 50Hz; dotted line: 2 KHz) normalized output amplitude from filter with the frequency. (b) The photo of the filter PCB board for test. The illustration: equivalent circuit diagram of the low-pass filter.
Figure 3.
(a) the relationship of measured (hexagon dots: 2 kHz; square dots: 50 Hz) and simulated (solid line: 50Hz; dotted line: 2 KHz) normalized output amplitude from filter with the frequency. (b) The photo of the filter PCB board for test. The illustration: equivalent circuit diagram of the low-pass filter.
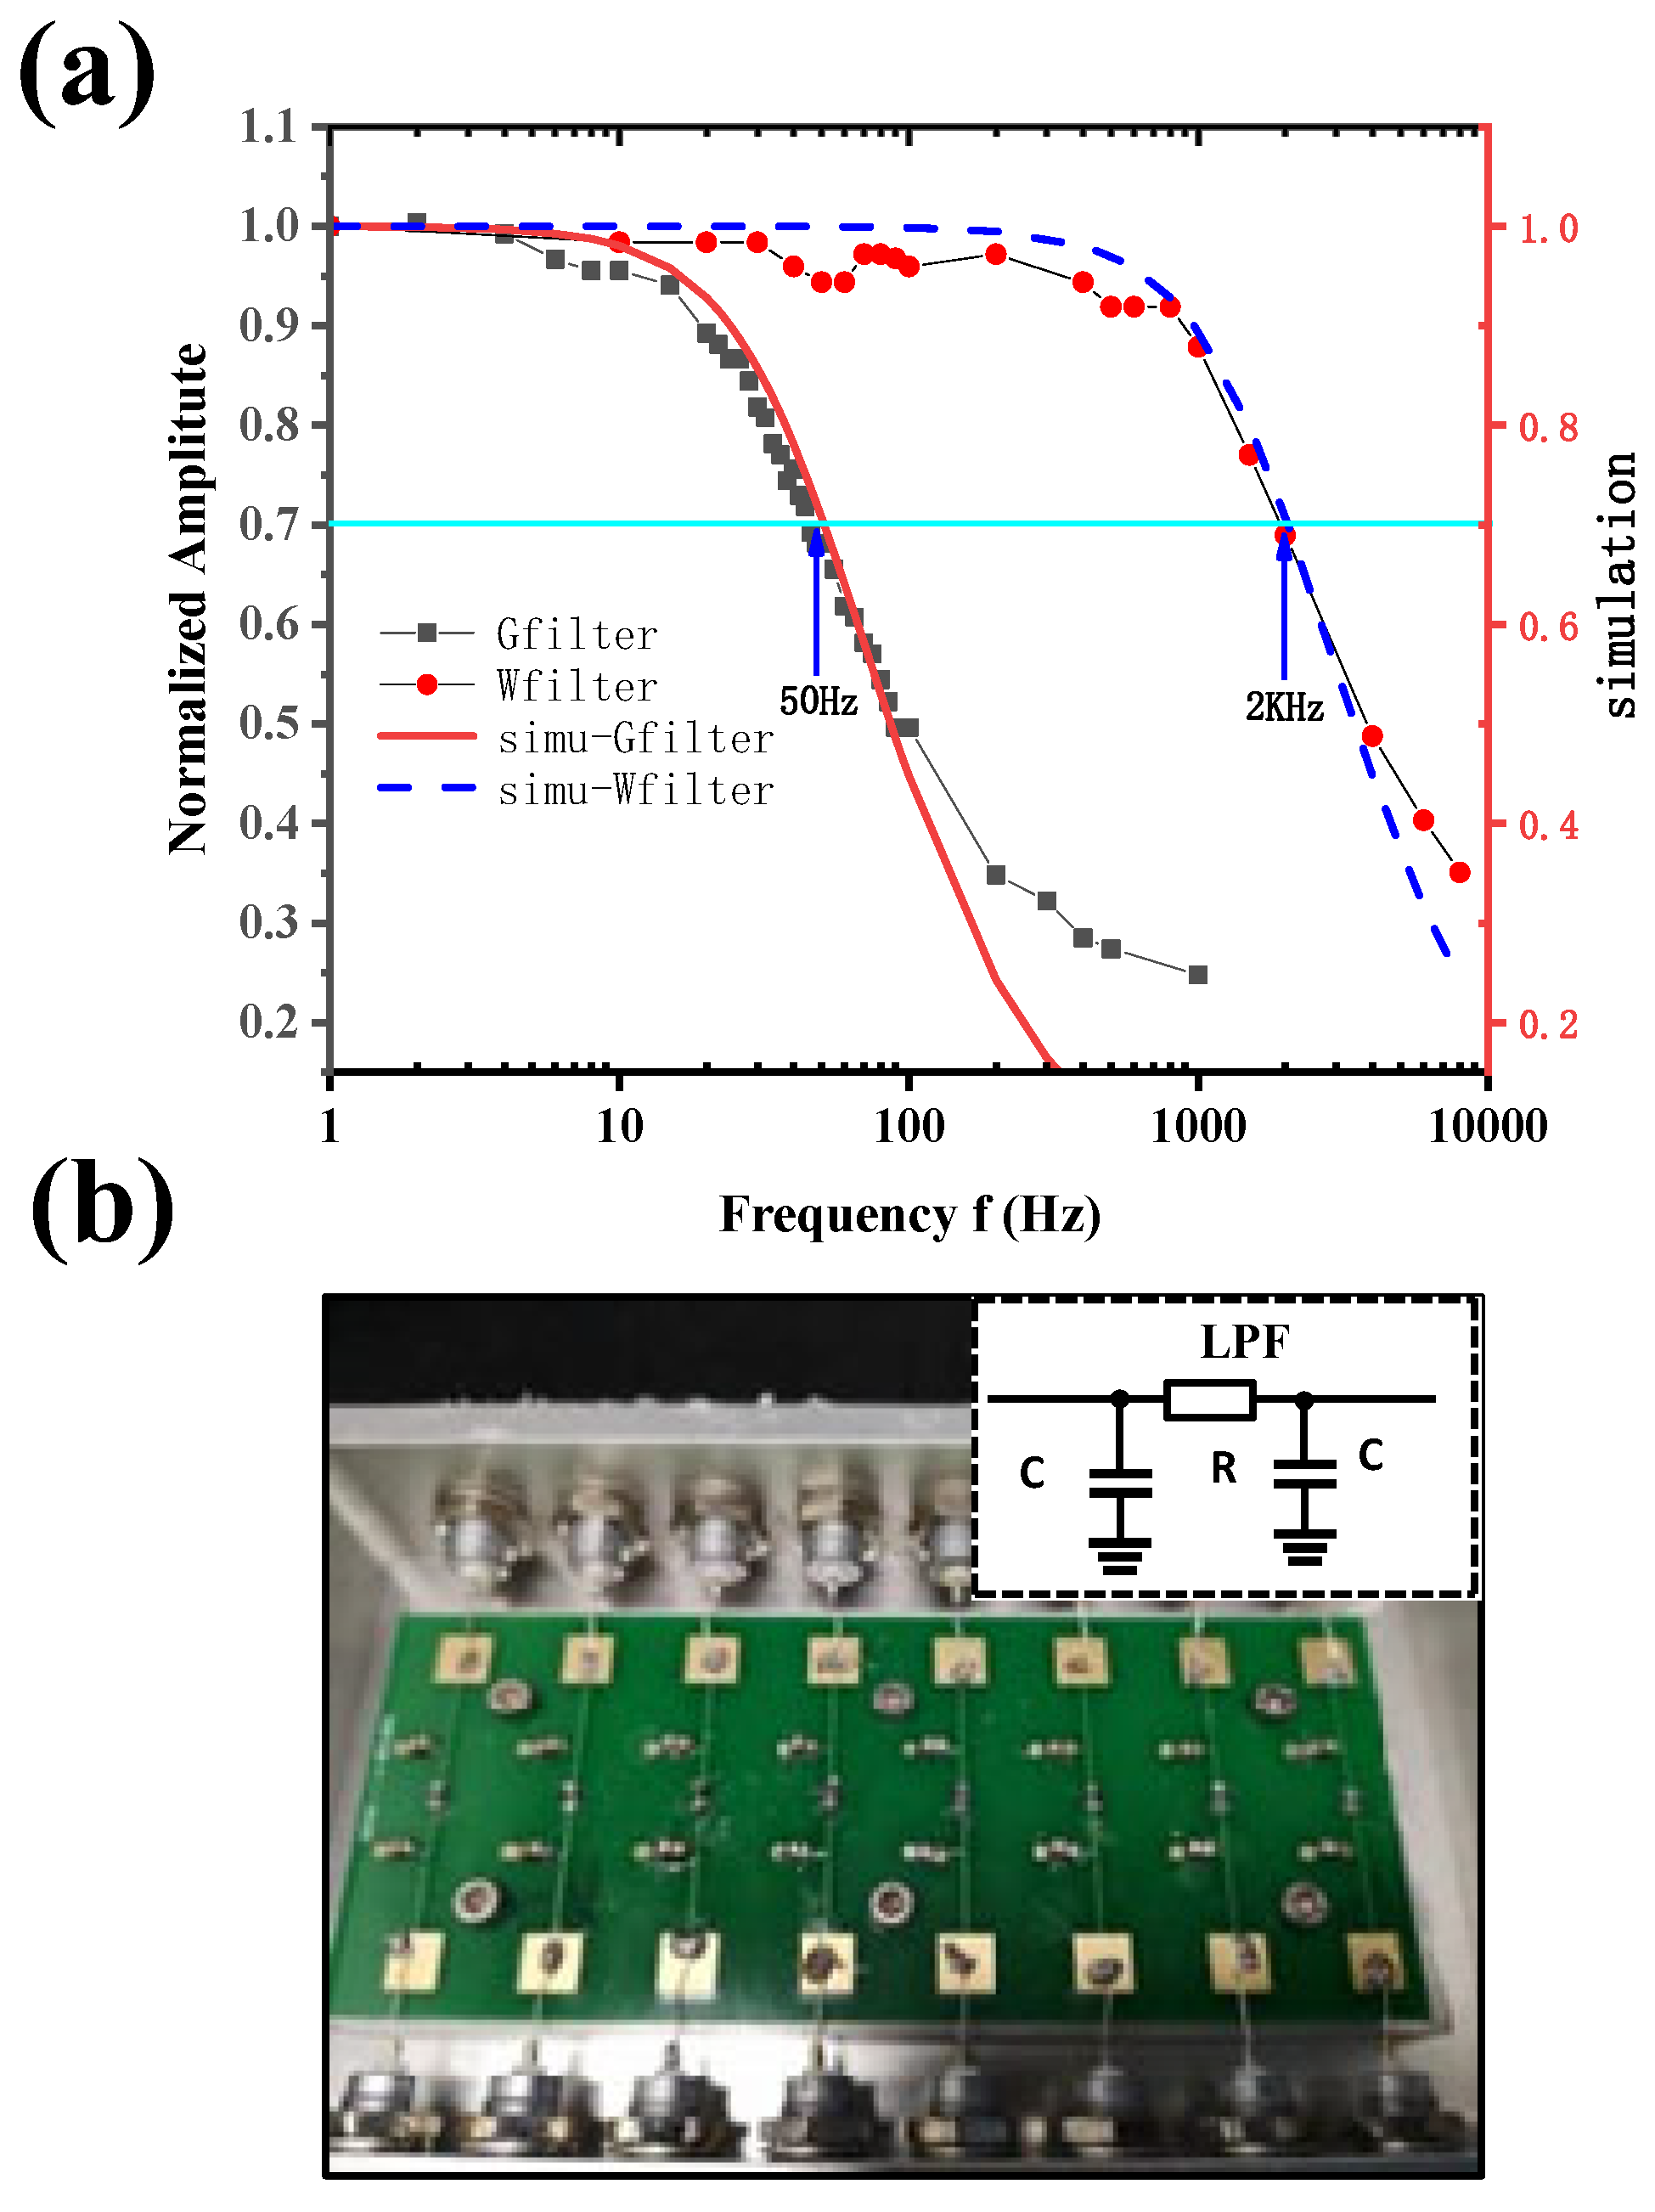
Figure 4.
The sketch of I-V curve.
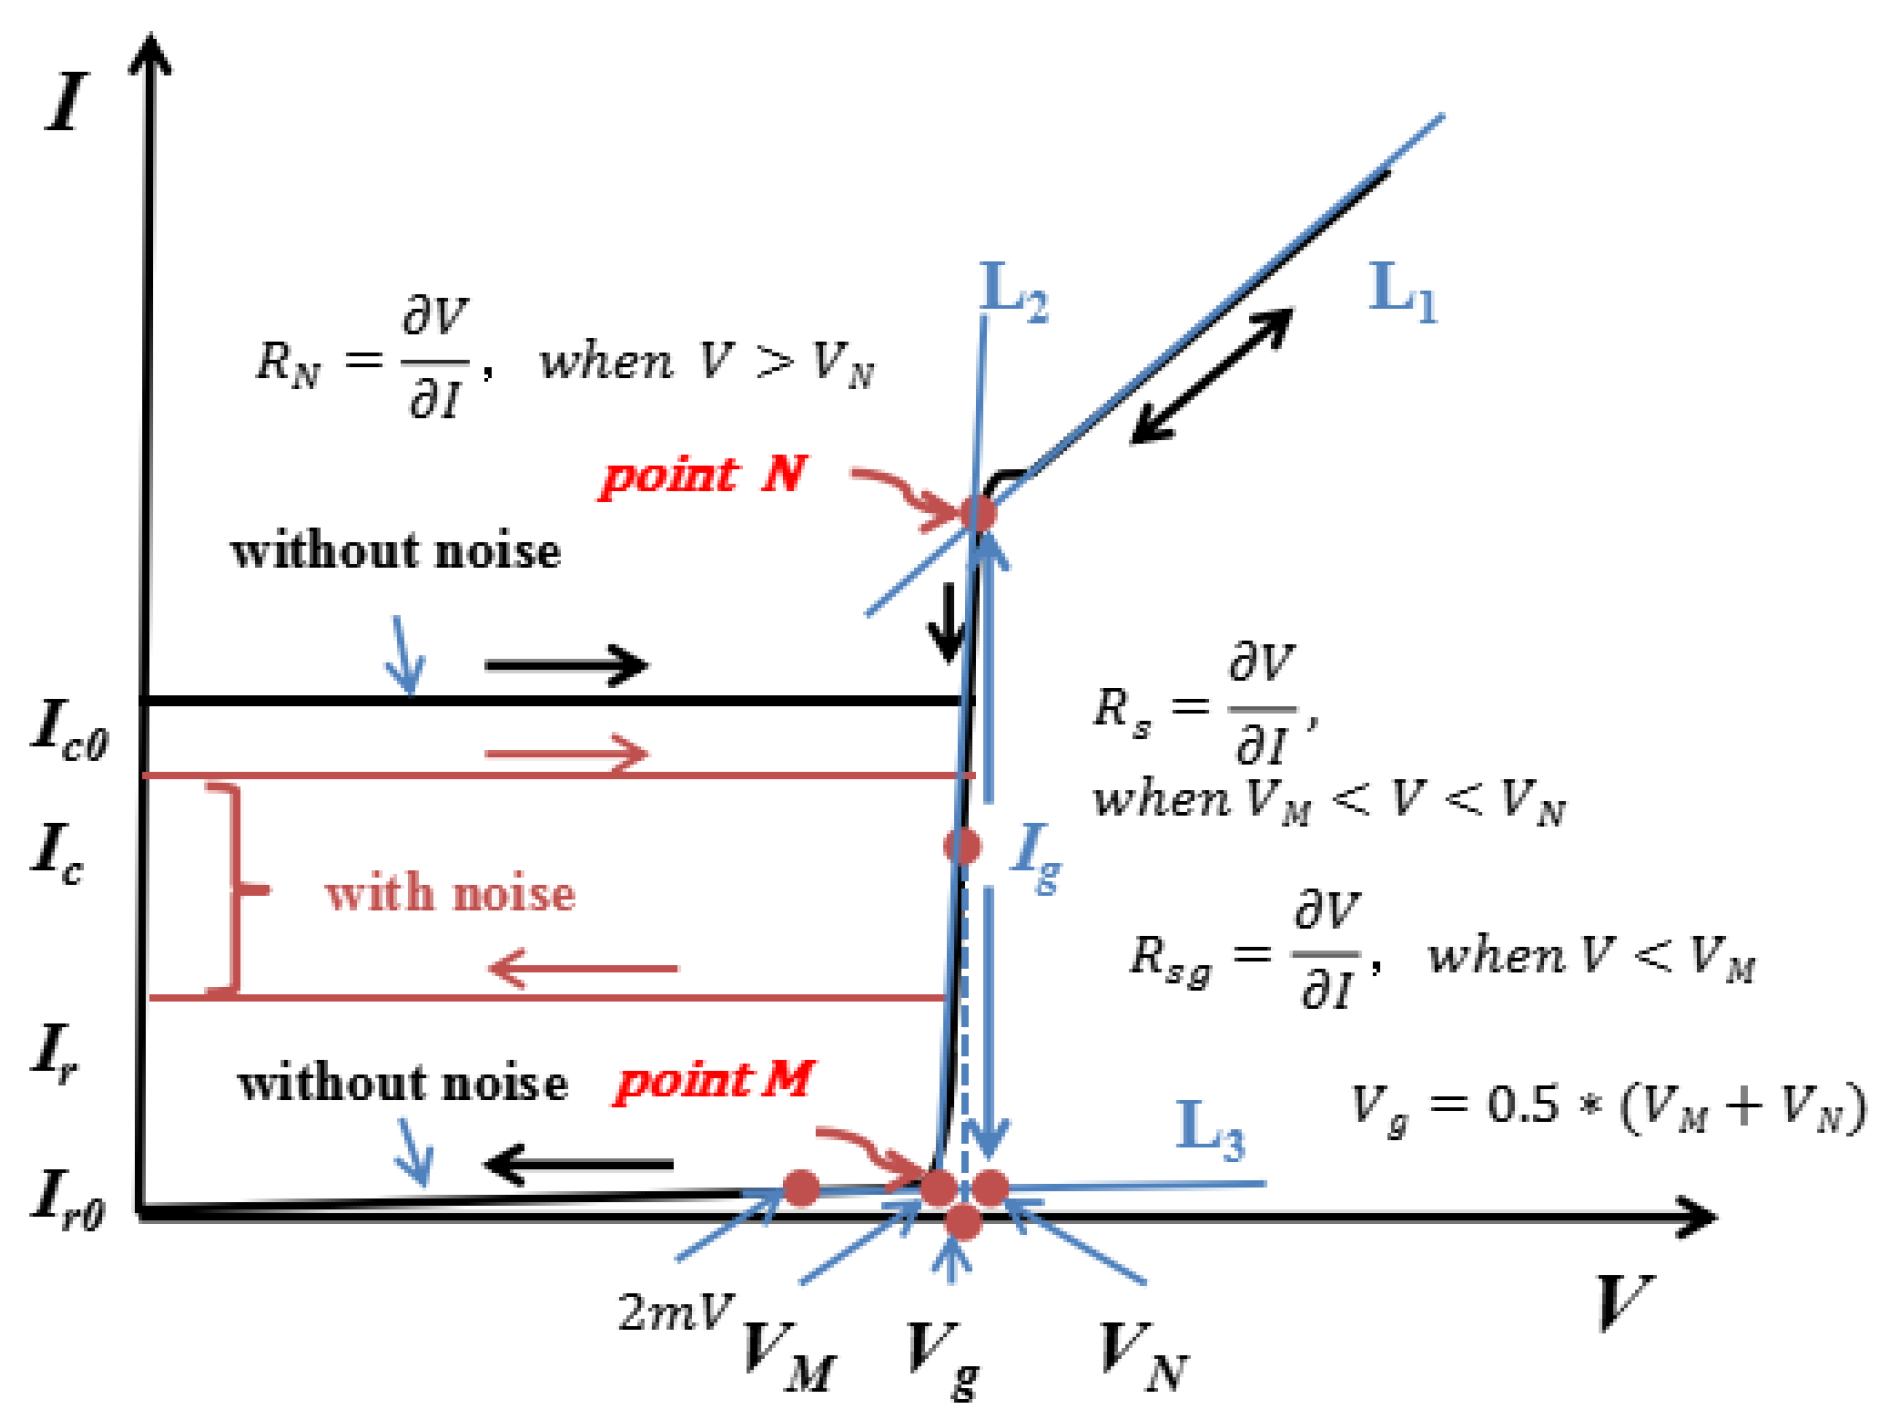
Figure 5.
Ic data of sample s0506-juf3.1 from repeatability study. Gfilter: fc=50 Hz; Wfilter: fc=2 kHz.
Figure 5.
Ic data of sample s0506-juf3.1 from repeatability study. Gfilter: fc=50 Hz; Wfilter: fc=2 kHz.
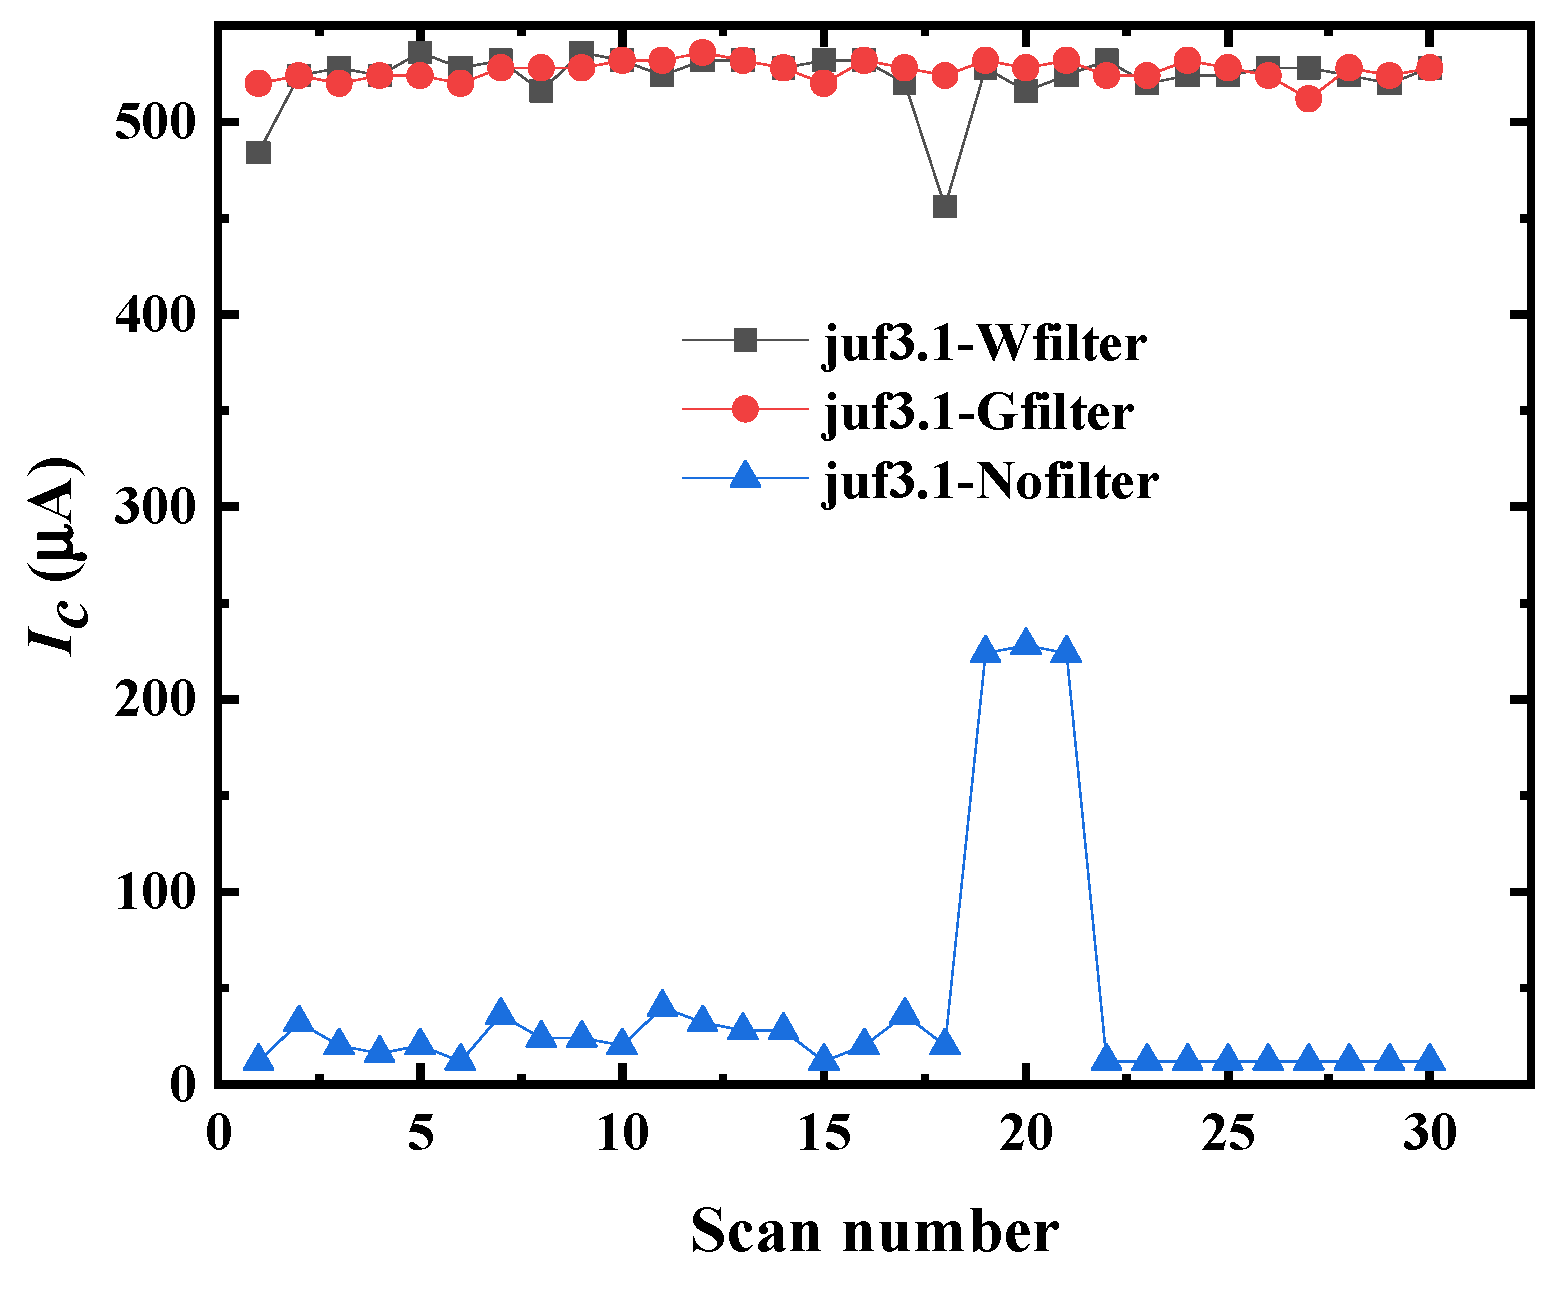
Figure 6.
Histogram of Ic data of sample s0506-juf3.1 from repeatability study. Filter and cut-off frequencies are given respectively: (a) Wfilter: fc=2 kHz; (b) Gfilter: fc=50 Hz ; (c) No filter.
Figure 6.
Histogram of Ic data of sample s0506-juf3.1 from repeatability study. Filter and cut-off frequencies are given respectively: (a) Wfilter: fc=2 kHz; (b) Gfilter: fc=50 Hz ; (c) No filter.
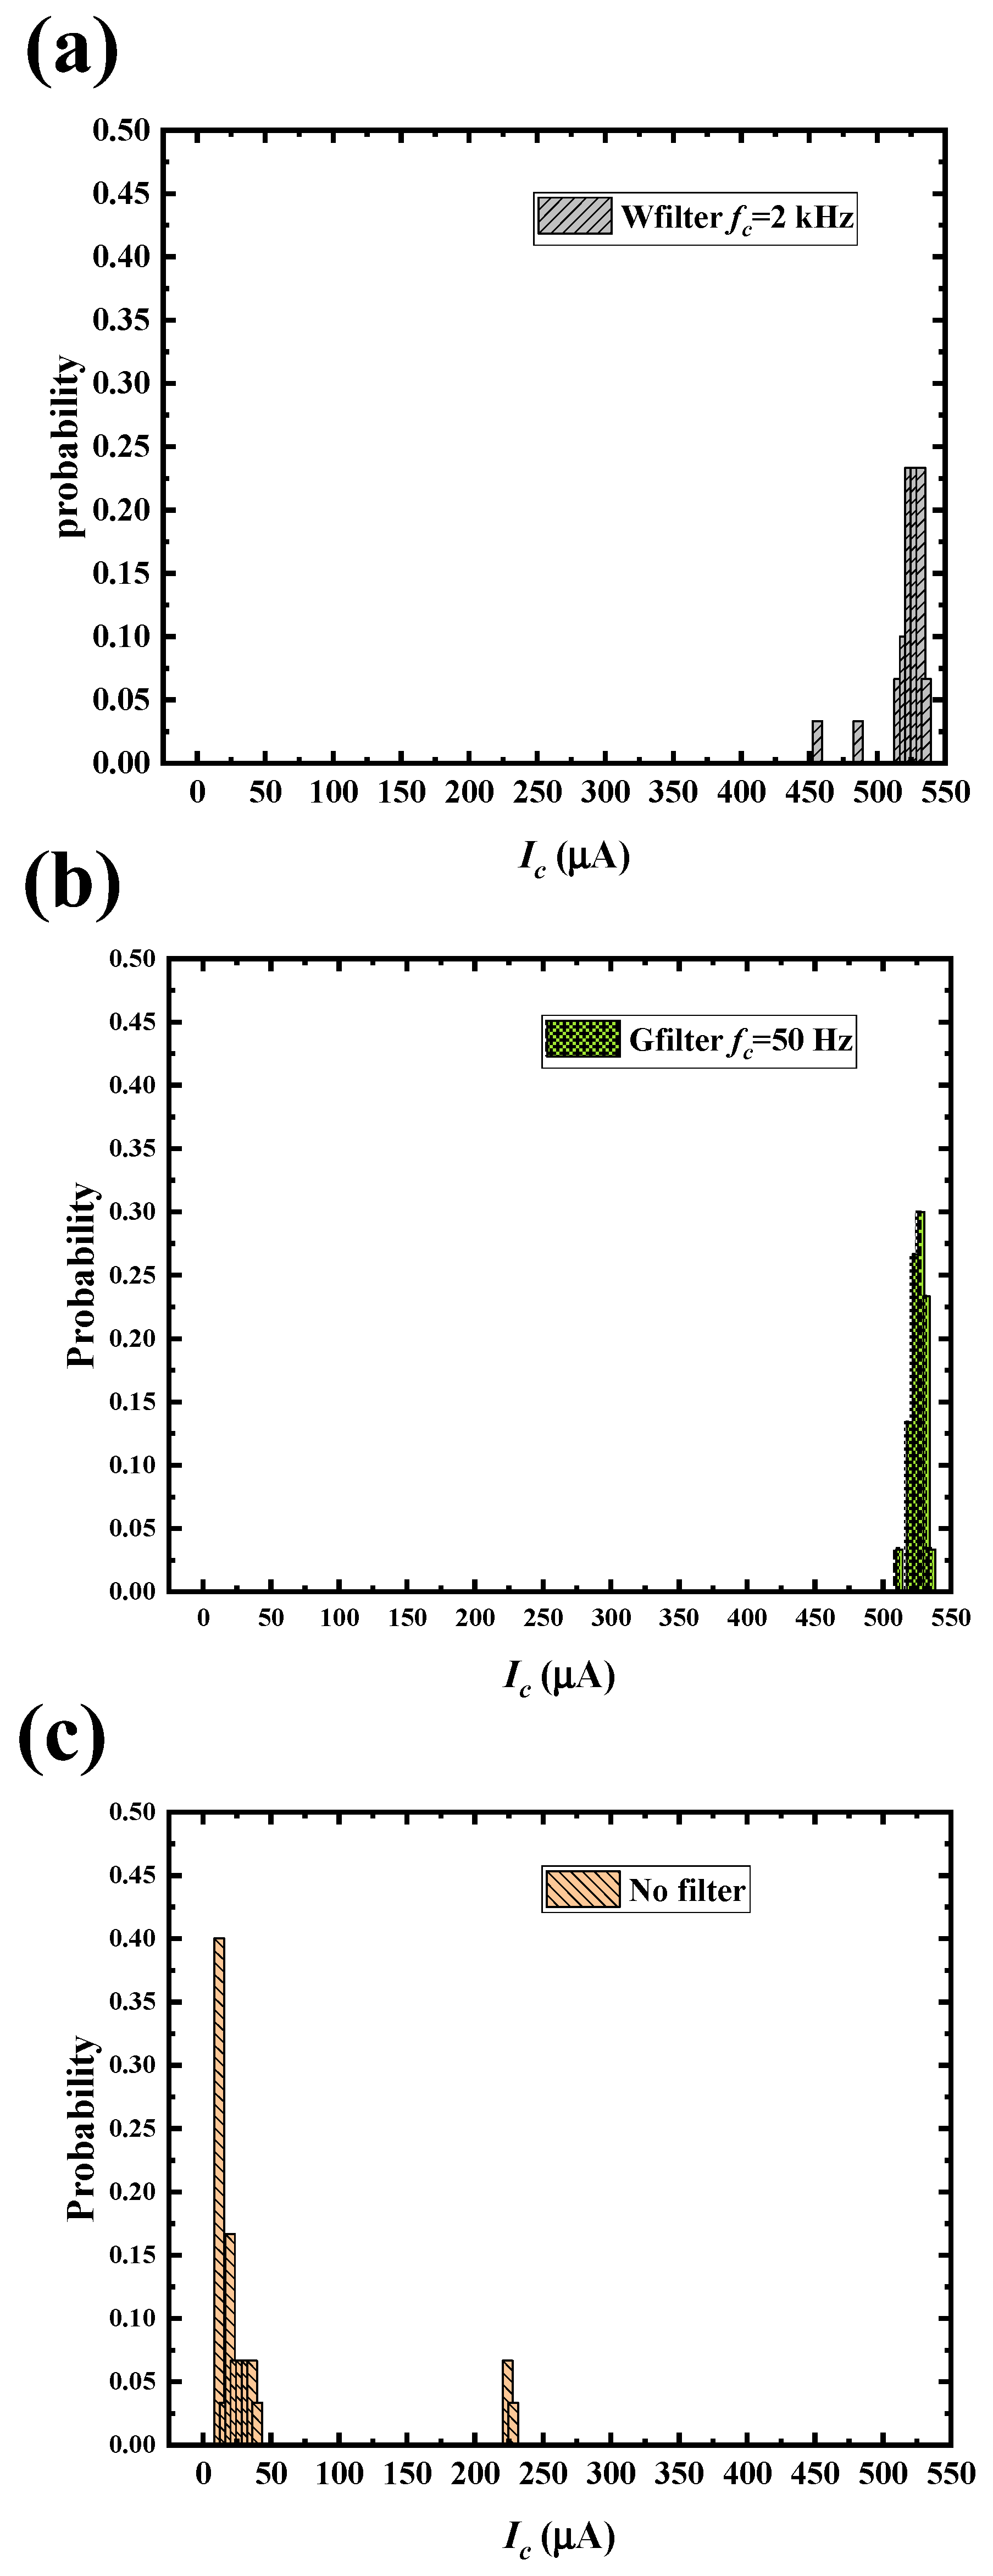
Figure 7.
(a) Ic data of sample s0506-juf3.1 from repeatability study, with (blank square) or without (full circle) Al foil; (b) Histogram of the same data with (black diagonal bar) and without (blue blank bar) Al foil.
Figure 7.
(a) Ic data of sample s0506-juf3.1 from repeatability study, with (blank square) or without (full circle) Al foil; (b) Histogram of the same data with (black diagonal bar) and without (blue blank bar) Al foil.
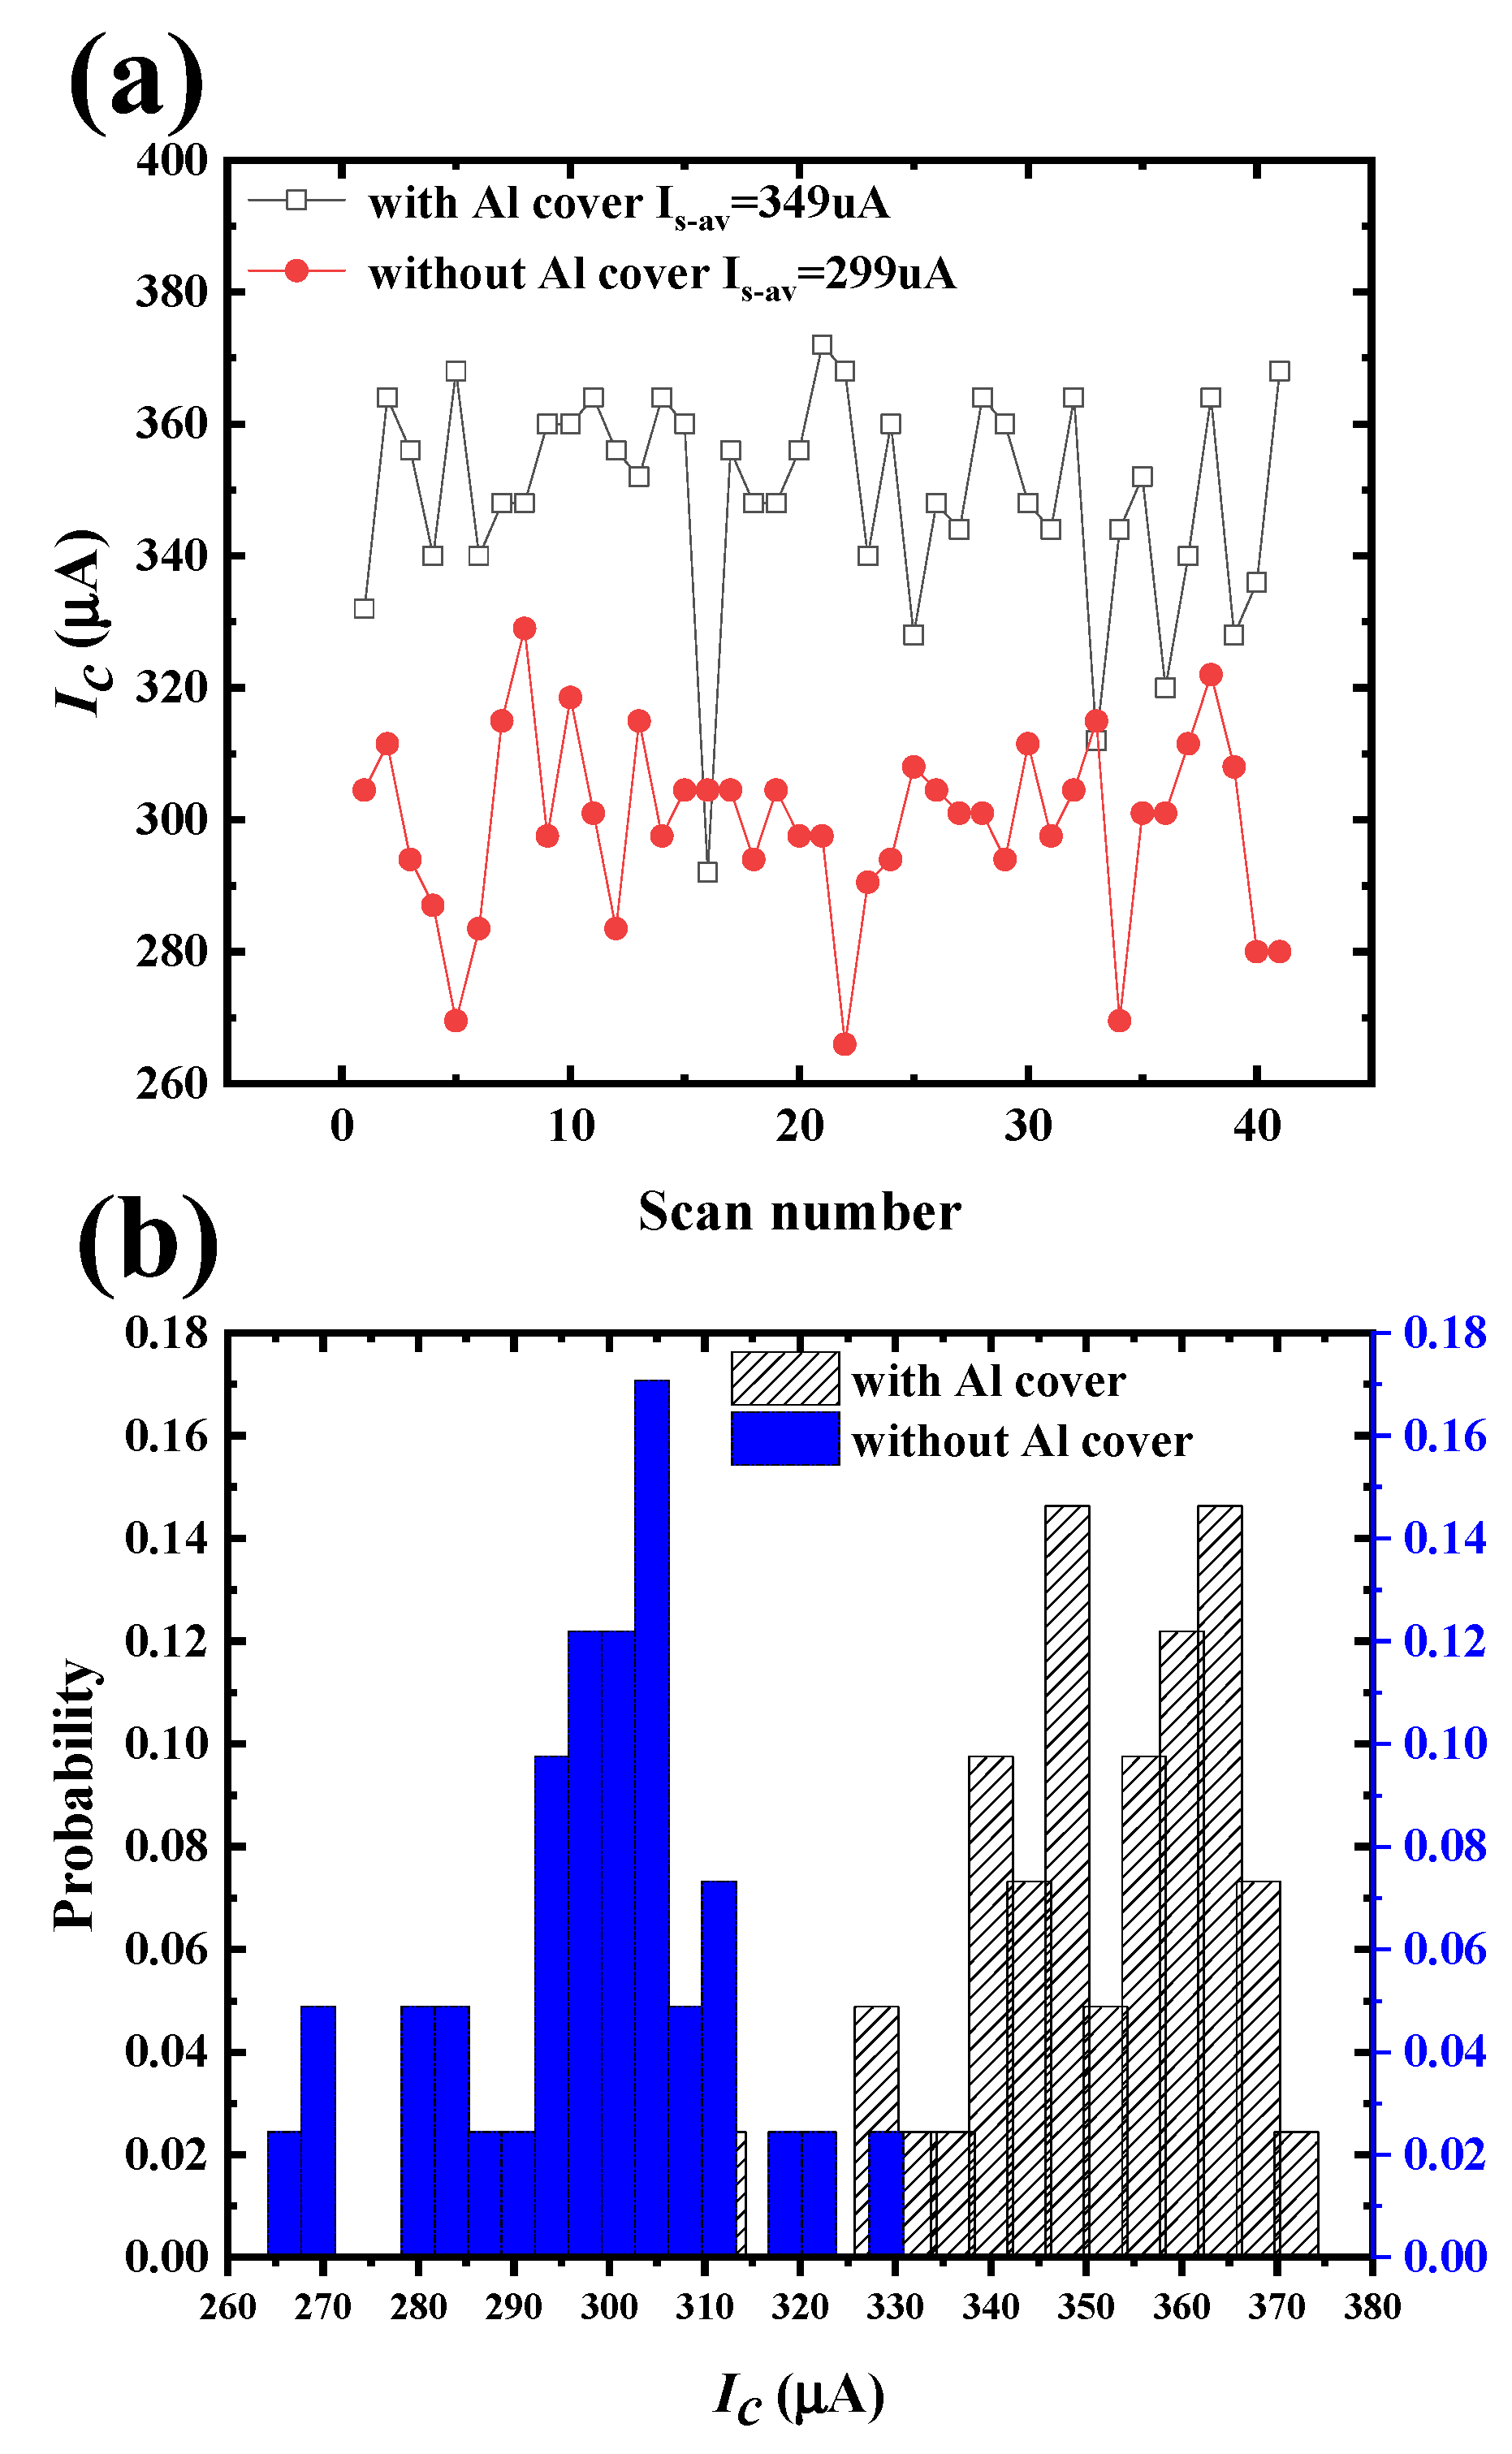
Figure 8.
(a) Ic data of sample s0506-juf3.1 from repeatability study, after several de-fluxing cycles; (b) Histogram of the same data. Insets associate the curves to each different de-fluxing cycle: theoretical data, data in full shield, with no de-fluxing, after the first, second, third , and fourth de-fluxing.
Figure 8.
(a) Ic data of sample s0506-juf3.1 from repeatability study, after several de-fluxing cycles; (b) Histogram of the same data. Insets associate the curves to each different de-fluxing cycle: theoretical data, data in full shield, with no de-fluxing, after the first, second, third , and fourth de-fluxing.
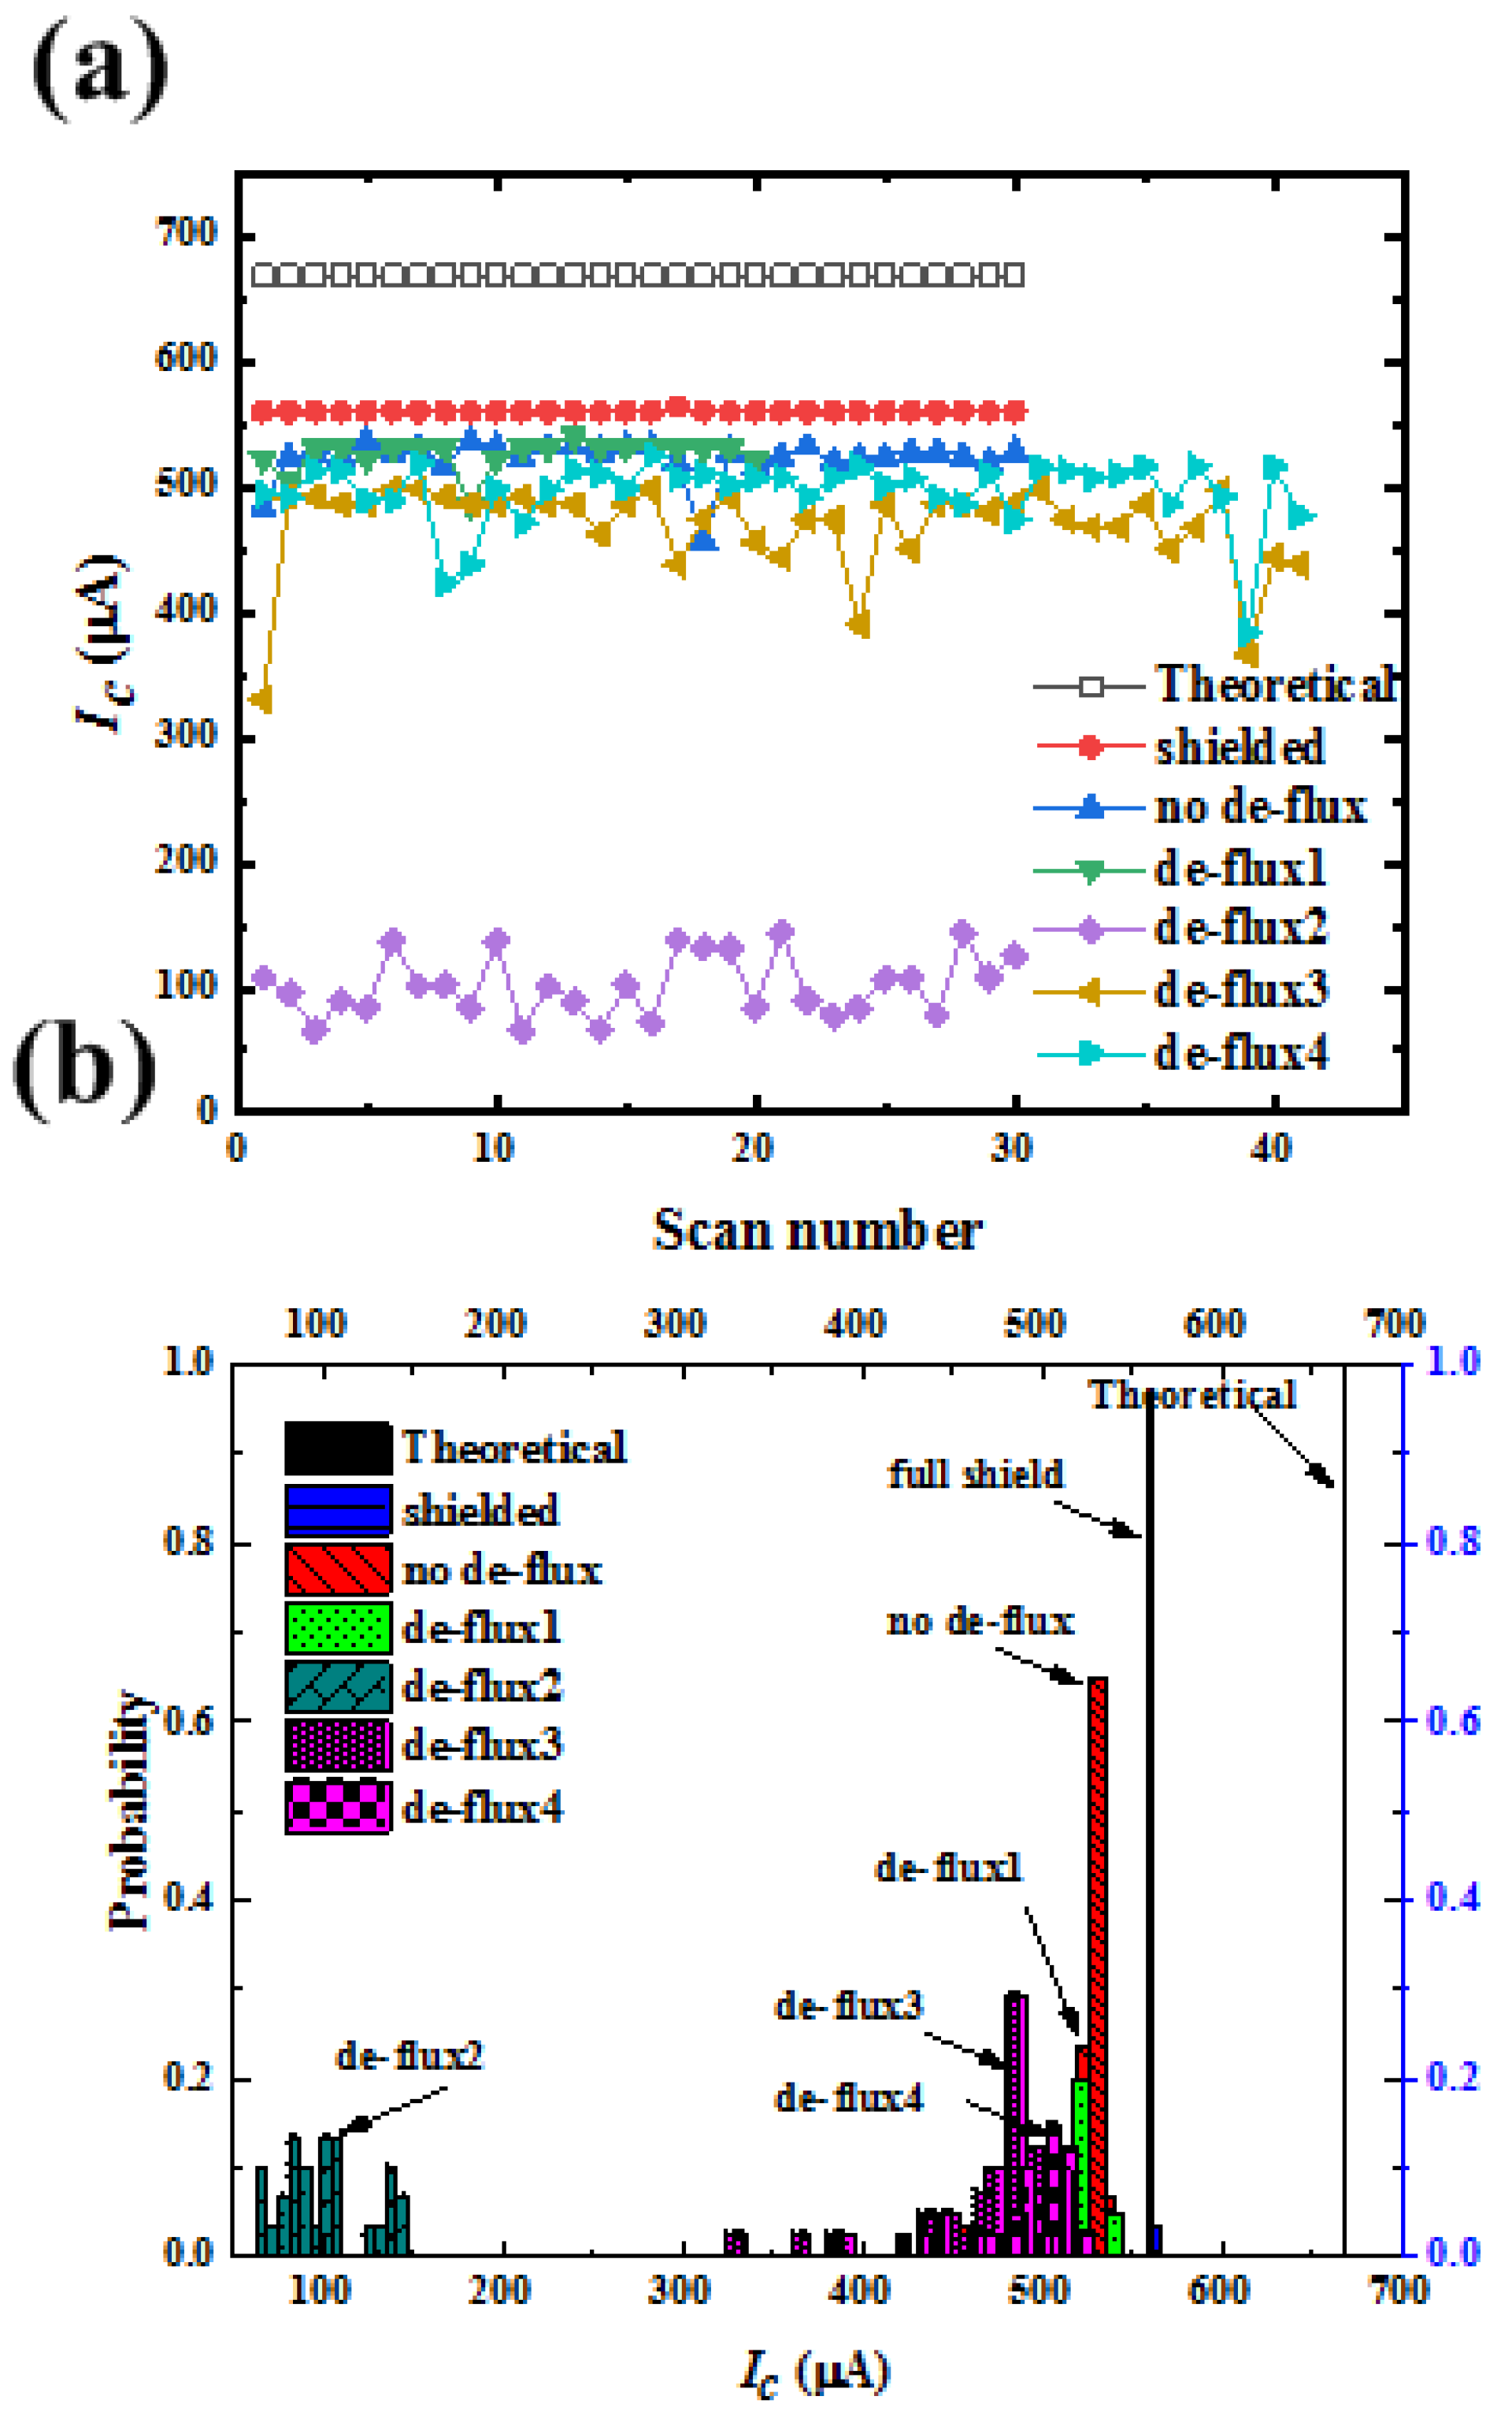
Figure 9.
The relationship of average JJ current Ic-av with uncertainty U of Ic data of sample s0506-juf3.1 from repeatability study. The red line is the fitting line, the real square stands for experimental data, and the blue vertical line stands for the condition where the U equals to 0.
Figure 9.
The relationship of average JJ current Ic-av with uncertainty U of Ic data of sample s0506-juf3.1 from repeatability study. The red line is the fitting line, the real square stands for experimental data, and the blue vertical line stands for the condition where the U equals to 0.
Disclaimer/Publisher’s Note: The statements, opinions and data contained in all publications are solely those of the individual author(s) and contributor(s) and not of MDPI and/or the editor(s). MDPI and/or the editor(s) disclaim responsibility for any injury to people or property resulting from any ideas, methods, instructions or products referred to in the content. |
© 2026 by the authors. Licensee MDPI, Basel, Switzerland. This article is an open access article distributed under the terms and conditions of the Creative Commons Attribution (CC BY) license (http://creativecommons.org/licenses/by/4.0/).
Copyright: This open access article is published under a Creative Commons CC BY 4.0 license, which permit the free download, distribution, and reuse, provided that the author and preprint are cited in any reuse.