

Submitted:
11 September 2026
Posted:
15 September 2026
You are already at the latest version
Abstract
The rapid development of renewable energy sources is steadily increasing the share of photovoltaics, wind power and hydropower in national electricity systems. The aim of this study was to analyse energy curtailment, defined as the difference between the energy that could be produced (estimated with mathematical models) and the energy actually injected into the grid, for photovoltaic (PV), wind (WE) and hydro (HE) installations in 2020–2025. The results show that total positive energy curtailment was approximately 3,146.3 GWh, of which 96.0% was attributable to large installations above 500 kW. The unused potential was most concentrated in large wind sources. This volume of energy could supply about 1,239,320 electric vehicles for one year, assuming an annual demand of 2,550 kWh per vehicle.
Keywords:
renewable energy sources
; photovoltaics
; wind energy
; hydropower
; electromobility
; energy curtailment
; data analysis
1. Introduction
The energy transition of recent years has rapidly increased the share of weather-dependent renewables, especially photovoltaic and wind installations. Flexibility, storage, sector coupling and supply–demand balancing have therefore become central [1,2,3,4]. Variability of output, meteorological dependence and network constraints mean that part of the technically producible energy is not accepted by the system—generation curtailment, or energy curtailment between producible output and energy injected into the grid [1,2,3,4].
Electromobility can use some of that unused energy. Electric vehicles are not only an extra load but also flexible demand, particularly with smart charging, local control of charging power and vehicle-to-grid, which can raise renewable utilisation and reduce the mismatch between generation and demand [5,6,7,8].
Bird et al. [1] reviewed experience from eleven countries and identified network constraints, market rules and insufficient demand flexibility as the main causes of wind and solar curtailment. Li et al. [2] showed that in China curtailment can reach tens of percent of annual generation. O’Shaughnessy et al. [3] documented a growing global trend of PV curtailment. Lund and Mathiesen [4] stressed sector coupling and storage in 100% renewable systems. Laimon [9] argues that managed curtailment can signal the need for flexibility [9,10]. Denholm and Hand [11] showed that very high shares of variable renewables require more flexibility and storage. Victoria et al. [12] and Brown et al. [13] confirmed the role of storage and transmission reinforcement in Europe. Papaefthymiou and Dragoon [14] treated “uncapping” flexibility as a condition for 100% renewables.
A parallel strand models generation by technology. Deterministic PV models based on installed capacity, irradiance profiles, module geometry and the performance ratio dominate [15,16,17,18,19]. Huld and Amillo [15] and De Soto et al. [16] provided foundations for yield estimation. Fahim et al. [17] reviewed PV module models. Sobik [18] analysed photovoltaics against peak demand in the Polish system. Rajesh and Mabel [19] surveyed PV systems.
Wind studies commonly use the capacity factor and regional seasonal profiles [20,21,22,23,24,25]. Carta et al. [20], Murthy and Rahi [21] and Saint-Drenan et al. [23] emphasise regional wind characteristics. Lydia et al. [22] and Bilendo et al. [24] reviewed turbine power-curve models. Igliński et al. [25] described the status of wind energy in Poland.
In hydropower, flow, head, efficiency and hydrological seasonality are central [26,27,28,29,30,31,32]. Yüksel [26], Hamududu and Killingtveit [27] and Zarfl et al. [28] addressed global development. Tahseen and Karney [29] reviewed sustainability assessments. Klein and Fox [31] and Wasti et al. [30] treated small hydropower and climate change. Turner et al. [32] examined climate impacts on hydropower investment.
A third strand treats electromobility in high-renewable systems. EVs are increasingly viewed as flexible demand through smart charging and vehicle-to-grid (V2G) [5,6,7,8,33,34,35,36]. Richardson [5] and Mwasilu et al. [6] reviewed EV–grid modelling. Lund and Kempton [7] and Kempton and Tomić [8] showed the balancing potential of V2G. Tan et al. [35], Sovacool et al. [36] and İnci et al. [34] reviewed V2G. Sadeghian et al. [33] and Barman et al. [37] synthesised smart charging with renewables.
Coordinated charging can reduce curtailment. Szinai et al. [38] showed for California that EV charge management lowers system costs and renewable curtailment. Dixon et al. [39] found that coordinated charging can absorb surplus wind. Saadatmandi et al. [40] reached analogous conclusions for photovoltaics. Blumberg et al. [41] linked higher EV flexibility with lower curtailment. IRENA [42] and the U.S. Department of Energy [43] indicate that smart charging and V2G can cut renewable curtailment towards 2030–2040.
Despite this literature, curtailment, PV/WE/HE generation modelling and electromobility as flexible demand are usually developed separately [1,2,3,4,5,6,7,8,9,10,11,12,13,14,15,16,17,18,19,20,21,22,23,24,25,26,27,28,29,30,31,32,33,34,35,36,37,38,39,40,41,42,43]. Quantitative studies that at once (i) quantify energy curtailment (modelled energy minus energy injected into the grid) for three technologies, (ii) decompose it by capacity class (micro-installations up to 50 kW, small 51–500 kW, large above 500 kW) and (iii) convert the volume into EV supply potential are lacking.
Curtailment analyses typically use operator data or hourly simulations and rarely combine deterministic models with multi-year operational data by technology and scale. Generation-modelling papers focus on yield or validation, not unused potential by capacity class. Smart-charging and V2G studies show absorption mechanisms but seldom start from a measured multi-year, three-technology curtailment volume.
The aim was to identify and quantify energy curtailment between modelled producible energy and energy injected into the grid for PV, WE and HE installations in 2020–2025. Curtailment was determined by technology, utilisation rates were compared, the effect of technology and capacity class was assessed, and unused energy was expressed as an electromobility potential (EVs at 2,550 kWh/year). Results cover micro-installations ≤50 kW, small installations of 51–500 kW and large installations >500 kW.
The novelty is to combine, in one quantitative procedure, three strands usually treated apart: modelling of PV/WE/HE potential, a balance-based curtailment indicator (not directly measured operator curtailment) and conversion of that volume into smart-charging and EV metrics. The empirical split by installation scale shows where curtailment concentrates. The applied step reports full battery charges and numbers of EVs, without assuming that vehicles can absorb the entire volume at once.
2. Materials and Methods
2.1. Nature of the Study and Organisation of Input Data
The empirical material used in the study came from one Polish distribution system operator (DSO). Because of the confidential nature of the operational data, the operator’s name, regional and territorial identifiers and plant identifiers were anonymised. Spatial data were replaced with neutral codes that still allowed records to be assigned correctly to profiles and models, without disclosing the operating area, installation locations or the data provider. Results are presented only in aggregated form by technology, capacity class and analysis period. This anonymisation defines the scope for generalising the findings: the results should be interpreted as an in-depth case study of one operator, not as a full characterisation of all DSOs in Poland.
The analysed material covered photovoltaic installations, hydropower plants and wind plants connected to the grid at different voltage levels. Depending on capacity, sources were divided into micro-installations up to 50 kW, small installations of 51–500 kW and large installations above 500 kW. The estimated number of installations analysed exceeded 1,539. The generation analysis covered the years 2020–2025. Semi-annual periods were used for installations up to 50 kW and annual periods for installations from 51 kW. The study was quantitative, comparative and model-balance in nature. The subject of the analysis was the difference between the energy that could be produced, estimated with the authors’ mathematical models, and the energy actually injected into the grid. Calculations were performed separately for PV, WE and HE. This approach is consistent with analyses of balancing systems with a high share of variable renewables [12,13,44,45].
The analysis used data on installed capacity, source technology, capacity class, location, operating parameters, energy actually injected into the grid and modelled energy. Results were aggregated by technology, year and capacity class. The reporting unit was GWh. Modelled data were not treated as a simple extrapolation of actual generation. Each technology was described by a separate model. The final procedure was common: comparison of the modelled and actual values, determination of energy curtailment, isolation of the positive component and aggregation of the results. Similar comparative procedures are used in studies of renewable generation reduction, storage requirements and the ability of the system to absorb variable production [46,47,48].
2.2. Mathematical Models of Photovoltaic Energy Production
A deterministic monthly model was applied to photovoltaic installations, comprising a forecasting variant and a calibrated variant. Installation location was identified by a key covering the DSO area and the municipality. The calculations used rated capacity, a monthly solar-irradiance profile, a module-geometry correction factor and a system performance ratio. The model structure follows widely used PV yield models [15,16,17,18].
In the forecasting variant, monthly PV energy was determined from the following relationship:
where EPV,i,m is the modelled monthly energy of installation i, Pi is the rated capacity, Hm is monthly irradiance or irradiance productivity referred to 1 kW/m², Kgeo,i is the geometry correction factor and PRsys,i is the system performance ratio.
EPV,i,m = Pi · Hm · Kgeo,i · PRsys,i
The geometry factor accounted for module tilt and azimuth; a lower bound of Kgeo = 0.50 was adopted. The system performance ratio aggregated installation losses [19,49,50,51]. Annual modelled energy was the sum of twelve monthly values. In the calibrated variant, the annual performance ratio was determined from known annual energy, capacity and the annual sum of the irradiance profile, after which the energy was allocated to months in proportion to the monthly share of irradiance. The resulting values should be interpreted as a monthly reconstruction consistent with the annual balance, not as an independent hourly or monthly measurement [15,16,17,18].
2.3. Mathematical Model of Wind Energy Production
A deterministic balance-and-profile model with a monthly time step was applied to wind plants. The model did not reconstruct the aerodynamic operation of the turbine from instantaneous wind speed, air density, rotor area and the power curve. The annual generation level was determined from installed capacity and the capacity factor (CF), while the seasonal distribution of energy was reconstructed from regional wind-resource profiles. This simplification is justified in balance analyses whose aim is to assess aggregated potential rather than to reconstruct the operation of a specific turbine [20,21,22,52].
Capacity and CF were selected with priority given to a user-specified value and, if none was provided, to a baseline or default value. The technical annual maximum was calculated as the product of capacity and the number of hours in the year, and the yield was then adjusted by the CF [20,21,23,24]. A standard 8,760-hour year was assumed. Annual energy was allocated to months using weights equal to the product of the number of hours in the month and a regional wind-profile coefficient. The same allocation procedure was applied to actual annual energy in order to obtain a comparable monthly series.
2.4. Mathematical Model of Hydropower Production
A monthly model for 2020–2025 was applied to hydropower plants, comprising two branches: a physical model for sites with individual technical parameters and a scenario model for the remaining catalogue records. The physical model used monthly flows, a location scaling factor, environmental flow, installed discharge, the number and type of generating units, reference head, efficiency, technical availability and own consumption. Flows from IMGW-PIB gauging stations and regional profiles were used. This approach is consistent with the literature on hydropower production modelling [26,27,28,29].
The year was treated in the hydrological-year convention. Flow at the plant location was obtained by scaling the flow from a reference gauging station, after which usable flow was calculated allowing for environmental flow. The model accounted for seasonal regulation, the number of active units, operating flow, the share of operating time, net head and active efficiency. Net monthly energy was then determined from operating time, availability and own consumption. For sites without complete technical data, a scenario model based on catalogue capacity, an annual CF and a regional hydrological profile was used; the results were interpreted as scenario values rather than full hydraulic calculations of a specific plant [26,30,31,32].
2.5. Determination of Energy Curtailment
After the modelled energy had been determined and compared with the energy actually injected into the grid, energy curtailment was calculated as
ΔE = Emodel − Eactual.
The difference defined in this way is a balance indicator and allows the technical potential of the source to be compared with the energy actually accepted by the system [1,2,3,4]. Positive values denote a potentially unused energy volume. Positive energy curtailment was calculated as max(ΔE, 0), which separated the potentially unused volume from cases in which the model underestimated actual generation. Aggregated values were expressed in GWh.
2.6. Degree of Potential Utilisation and Auxiliary Indicators
The degree of potential utilisation was calculated as the ratio of energy actually injected into the grid to modelled energy. For the electromobility analysis, positive energy curtailment was converted into the potential number of electric vehicles that could be supplied for one year. Annual consumption of 2,550 kWh per vehicle was assumed (mileage of 15,000 km/year and consumption of 17 kWh/100 km). Converting an energy volume into an EV charging potential is used in studies of electromobility integration, smart charging and V2G [5,6,7,8].
2.7. Methodological Limitations
The models are deterministic and are intended for potential analysis and comparison of the scale of energy curtailment. They do not replace full hourly simulations or SCADA data. This limitation is typical of model-balance studies based on aggregated data [11,12,13,47]. The PV model does not treat module temperature, instantaneous cloud cover, shading or inverter limits in detail. The WE model is not an aerodynamic turbine model. The HE scenario branch does not reconstruct the full hydraulics of a specific plant. The results should be treated as an assessment of potential and of the scale of energy curtailment, not as an accurate forecast of the operation of every installation in every hour of the year.
3. Results
3.1. Results by Capacity Class and Technology
The results are presented so that the effect of renewable technology can be distinguished from the effect of plant scale. Three capacity classes were used: micro-installations up to 50 kW, small installations of 51–500 kW and large installations above 500 kW. Positive energy curtailment denotes that part of the difference between modelled and actual energy which can be treated as a potentially unused energy volume. Aggregate summaries are given in Table 1, Table 2 and Table 3, and the annual profile and technology–capacity structure in Figure 1, Figure 2, Figure 3, Figure 4, Figure 5, Figure 6, Figure 7, Figure 8 and Figure 9.
Large installations above 500 kW dominate positive energy curtailment. Combined positive curtailment in this class was about 3,020 GWh, corresponding to 96.0% of the total. About 113 GWh was recorded for small installations of 51–500 kW and about 13.3 GWh for micro-installations up to 50 kW (Table 1; Figure 10).
In technological terms, wind sources account for the largest share of unused potential, especially large installations above 500 kW. Positive curtailment in this group was about 2,880 GWh. By comparison, about 90.5 GWh was recorded for large hydro installations and about 49.8 GWh for large PV installations (Table 2; Figure 11, Figure 12 and Figure 13).
3.2. Monthly Modelled and Actual Energy in 2025
A monthly analysis was also performed for 2025. For photovoltaic sources the sum of modelled energy was 51.32 GWh and actual generation injected into the grid was 20.93 GWh (a difference of 30.40 GWh; actual generation equalled 40.8% of the modelled value). Curtailment is strongly seasonal—the largest differences are concentrated in the months with the highest solar potential (May–August) (Table 4; Figure 14 and Figure 15).
For wind sources the sum of modelled energy was 1,046.89 GWh and actual generation was 502.04 GWh (a difference of 544.85 GWh; 48.0% of the modelled value). In absolute terms this is the largest curtailment among the three technologies. The largest monthly differences occurred in January and December (Table 5; Figure 16 and Figure 17).
For hydro sources the sum of modelled energy was 112.24 GWh and actual generation was 60.85 GWh (a difference of 51.39 GWh; 54.2% of the modelled value). Seasonality is linked to hydrological conditions—the largest differences fall in the autumn and winter months (Table 6; Figure 18 and Figure 19).
The 2025 compilation confirms that energy curtailment is systematic. The highest volume occurs in wind power (about 544.85 GWh), followed by hydropower (about 51.39 GWh) and photovoltaics (about 30.40 GWh). The character of the phenomenon differs by technology: PV is concentrated in the summer months, WE in winter and autumn, and HE reflects hydrological seasonality.
4. Potential Use of Energy Curtailment in Electromobility
One possible use of positive energy curtailment is the charging of electric vehicles. The number of full charges was calculated as the ratio of positive curtailment expressed in kWh to battery capacity. Annual demand per vehicle was assumed at 2,550 kWh/year. The literature stresses that electromobility can support renewable integration when charging is controlled in time, location and price, and, in more advanced variants, also bidirectionally [5,6,7,8]. The results are summarised in Table 7 and Figure 20, Figure 21 and Figure 22.
The values obtained show that, even under a conservative interpretation, positive energy curtailment can be highly relevant to electromobility. Depending on the capacity class of the sources and on battery capacity, the number of full charges ranges from about 159,000 to 124,000. In terms of annual demand this corresponds to supplying about 5,220 EVs from micro-installations, 44,100 EVs from small installations and 1,190 EVs from large installations. The results should be interpreted as a technical-energy potential whose practical use depends on charging infrastructure, parking profiles, the location of charging points and demand-control rules [6,33,53,54].
5. Discussion
The analysis showed that positive energy curtailment between the energy that could be produced and the energy actually injected into the grid occurs for all of the renewable technologies examined. This result should be interpreted as a model-balance indicator describing the difference between the generation potential of the sources and the volume of energy actually accepted by the system, not as a simple technical measure.
The principal finding is that the magnitude of positive energy curtailment is not determined by generation technology alone. Installation capacity class is an equally important factor. Total positive curtailment was about 3,146.3 GWh, of which 96.0% was attributable to large installations above 500 kW. Unused renewable potential is therefore not evenly distributed across all sources but is strongly concentrated in selected technology–capacity segments.
The largest volume was identified in large wind installations (about 2,880 GWh). Measures to reduce curtailment should not be designed uniformly for all technologies and capacity classes. From the standpoint of the balancing effect, large wind sources and other large renewable installations have priority. Expanding renewable capacity without a parallel increase in demand flexibility, network infrastructure and storage may maintain or deepen energy curtailment.
The research contribution is the operationalisation of positive energy curtailment as a comparative indicator that enables a parallel assessment of three renewable technologies in a technology–capacity class–year framework. The procedure allows decomposition by the matrix of technology, capacity class and year, and identification of the segments in which curtailment reaches the largest absolute volume.
Relative to the existing literature, the paper complements three separate strands: analyses of renewable generation curtailment, system flexibility and storage [1,2,3,4,11,14,46,47,48]; modelling of PV, WE and HE production [15,16,17,18,19,20,21,22,23,24,25,26,27,28,29,30,31,32,49,50,51,52,55]; and electromobility, smart charging and V2G [5,6,7,8,33,34,35,36,53,54]. The present study combines them in a single quantitative procedure: it determines positive energy curtailment, decomposes it by technology and capacity class, and then converts the volume into potential EV demand.
The novelty does not consist merely in stating that renewables require greater system flexibility—that conclusion is already well established. The novelty lies in quantifying where positive energy curtailment is actually concentrated and how large it is relative to the potential demand generated by electromobility.
Interpretative limitations must be stressed. Positive energy curtailment is not identical to energy that has been directly measured as forcibly reduced by the operator. It is a model-balance difference that may reflect network constraints, insufficient demand flexibility, local operating conditions, technical limits, model characteristics and the structure of the data. The results should be interpreted as a quantitative assessment of a potentially unused energy volume.
The main problem is not the mere occurrence of curtailment but its concentration. If 96.0% of the positive value is attributable to large installations above 500 kW, dispersed measures applied uniformly to all renewable sources will have limited system effectiveness. Selective measures are required: a local increase in offtake capability, storage at large plants, coordination with flexible consumers, EV charging infrastructure near generation areas, and market mechanisms that reward shifting demand to periods of high renewable supply.
Electromobility is a potential but conditional mechanism for absorbing part of the positive energy curtailment. With appropriate control, vehicles can act as a distributed flexible-demand resource. The results connect here with the literature [38,39,40]. Szinai et al. [38] show that EV charge management can reduce system costs and curtailment. Dixon et al. [39] demonstrate absorption of surplus wind generation. Saadatmandi et al. [40] develop the same direction for photovoltaics. These references do not confirm that the entire identified volume can be technically taken up by electromobility; rather, they indicate the mechanisms (control of charging time, coordination of profiles, price signals and infrastructure integration) through which part of the curtailment can be used.
The conversions indicate that positive energy curtailment corresponds potentially to the annual supply of about 1,239,320 electric vehicles (at 2,550 kWh/year per vehicle). This figure is a balance indicator and does not mean that the system in its present configuration would be able to supply that number of vehicles directly. It does mean that the volume is large enough for electromobility to be analysed as an important sector for the potential use of this energy.
The monthly analysis for 2025 shows that energy curtailment is seasonal and technology-dependent: PV is concentrated in periods of high irradiance, WE in winter and late autumn, and HE under autumn–winter hydrological conditions. Designing absorption mechanisms on the basis of annual data alone is insufficient; monthly and then hourly analyses are required.
From a practical perspective, increasing installed renewable capacity without a parallel increase in the system’s ability to absorb variable generation will limit the effective use of renewable potential. Key measures include network expansion and modernisation, local balancing, energy storage, controlled EV charging, dynamic tariffs, flexibility aggregation, energy clusters and vehicle-to-grid solutions—with particular emphasis on areas in which large installations generate the greatest volume of positive energy curtailment.
6. Conclusions
The analysis confirmed the occurrence of positive energy curtailment for all of the renewable technologies examined—photovoltaics, wind power and hydropower. The magnitude of the phenomenon depends not only on generation technology but equally on installation capacity class, so an analysis by technology alone is insufficient to identify the true concentration. Total positive energy curtailment in 2020–2025 was about 3,146.3 GWh, of which 96.0% was attributable to large installations above 500 kW, and the largest volume (about 2,880 GWh) was identified in large wind sources. Micro-installations showed the highest degree of potential utilisation, whereas small installations showed the lowest.
Energy curtailment should be treated as a model-balance indicator and should not be automatically equated with directly measured operator curtailment; it does, however, indicate the scale of potentially unused energy and the need to increase system flexibility. Measures to reduce curtailment should be designed selectively, with priority for the segments with the largest volume, rather than as uniform interventions for all renewable sources.
Electromobility can be one mechanism for using part of the positive energy curtailment, but only with controlled charging, local coordination of demand with renewable generation, dynamic tariffs, flexibility aggregation and charging infrastructure located in line with network constraints. The literature [38,39,40] confirms the technical rationale for smart charging in reducing wind and photovoltaic curtailment, but it does not remove the need for a local, hourly and infrastructure-level analysis of absorption capability. The conversion to about 1,239,320 electric vehicles (at 2,550 kWh/year per vehicle) is a balance potential, not a direct operational capability of the system.
Further research should cover hourly generation and demand profiles, the location of sources and charging points, network constraints, storage operation, dynamic tariffs, EV-user behaviour and optimisation models of smart charging and vehicle-to-grid, as well as determine what share of positive energy curtailment can be used technically and economically by energy storage, clusters, fleet charging systems, fast-charging infrastructure and flexibility services provided by aggregators.
Author Contributions
Conceptualization, A.K. and T.K.; methodology, T.K.; software, T.K.; validation, A.K., T.K. and K.K.; formal analysis, T.K.; investigation, A.K.; resources, T.K.; data curation, T.K.; writing—original draft preparation, T.K. and A.K.; writing—review and editing, T.K., A.K. and K.K.; visualization, T.K.; supervision, K.K.; project administration, A.K.; funding acquisition, K.K. All authors have read and agreed to the published version of the manuscript.
Funding
This research received no external funding.
Data Availability Statement
The data presented in this study are available on request from the corresponding author. The data are not publicly available due to confidentiality agreements with the distribution system operator.
Conflicts of Interest
The authors declare no conflicts of interest.
Abbreviations
| Abbreviation | Meaning |
| CF | capacity factor |
| EV | electric vehicle |
| DSO | distribution system operator |
| RSE | renewable energy sources |
| PR | performance ratio |
| PV | photovoltaic inst. |
| SCADA | supervisory control and data acquisition |
| V2G | vehicle-to-grid |
| HE | hydropower plants |
| WE | wind power plants |
References
- Bird, L.; Lew, D.; Milligan, M.; Carlini, E.M.; Estanqueiro, A.; Flynn, D.; Gomez-Lazaro, E.; Holttinen, H.; Menemenlis, N.; Orths, A.; et al. Wind and solar energy curtailment: A review of international experience. Renew. Sustain. Energy Rev. 2016, 65, 577–586. [Google Scholar] [CrossRef]
- Li, C.; Shi, H.; Cao, Y.; Wang, J.; Kuang, Y.; Tan, Y.; Wei, J. Comprehensive review of renewable energy curtailment and avoidance: A specific example in China. Renew. Sustain. Energy Rev. 2015, 41, 1067–1079. [Google Scholar] [CrossRef]
- O’Shaughnessy, E.; Cruce, J.; Xu, K. Too much of a good thing? Global trends in the curtailment of solar PV. Sol. Energy 2020, 208, 1068–1077. [Google Scholar] [CrossRef] [PubMed]
- Lund, H.; Mathiesen, B.V. Energy system analysis of 100% renewable energy systems—The case of Denmark in years 2030 and 2050. Energy 2009, 34, 524–531. [Google Scholar] [CrossRef]
- Richardson, D.B. Electric vehicles and the electric grid: A review of modeling approaches, impacts, and renewable energy integration. Renew. Sustain. Energy Rev. 2013, 19, 247–254. [Google Scholar] [CrossRef]
- Mwasilu, F.; Justo, J.J.; Kim, E.K.; Do, T.D.; Jung, J.W. Electric vehicles and smart grid interaction: A review on vehicle to grid and renewable energy sources integration. Renew. Sustain. Energy Rev. 2014, 34, 501–516. [Google Scholar] [CrossRef]
- Lund, H.; Kempton, W. Integration of renewable energy into the transport and electricity sectors through V2G. Energy Policy 2008, 36, 3578–3587. [Google Scholar] [CrossRef]
- Kempton, W.; Tomić, J. Vehicle-to-grid power fundamentals: Calculating capacity and net revenue. J. Power Sources 2005, 144, 268–279. [Google Scholar] [CrossRef]
- Laimon, M. Renewable energy curtailment: A problem or an opportunity? Results Eng. 2025, 26, 104925. [Google Scholar] [CrossRef]
- Soto-Valle, R.; Usuba, J. Wind Energy Curtailment: Historical Case Study. Energies 2026, 19, 334. [Google Scholar] [CrossRef]
- Denholm, P.; Hand, M. Grid flexibility and storage required to achieve very high penetration of variable renewable electricity. Energy Policy 2011, 39, 1817–1830. [Google Scholar] [CrossRef]
- Victoria, M.; Zhu, K.; Brown, T.; Andresen, G.B.; Greiner, M. The role of storage technologies throughout the decarbonisation of the sector-coupled European energy system. Energy Convers. Manag. 2019, 201, 111977. [Google Scholar] [CrossRef]
- Brown, T.; Schlachtberger, D.; Kies, A.; Schramm, S.; Greiner, M. Synergies of sector coupling and transmission reinforcement in a cost-optimised, highly renewable European energy system. Energy 2018, 160, 720–739. [Google Scholar] [CrossRef]
- Papaefthymiou, G.; Dragoon, K. Towards 100% renewable energy systems: Uncapping power system flexibility. Energy Policy 2016, 92, 69–82. [Google Scholar] [CrossRef]
- Huld, T.; Amillo, A.M.G. Estimating PV module performance over large geographical regions: The role of irradiance, air temperature, wind speed and solar spectrum. Energies 2015, 8, 5159–5181. [Google Scholar] [CrossRef]
- De Soto, W.; Klein, S.A.; Beckman, W.A. Improvement and validation of a model for photovoltaic array performance. Sol. Energy 2006, 80, 78–88. [Google Scholar] [CrossRef]
- Fahim, S.R.; Hasanien, H.M.; Turky, R.A.; Abdel Aleem, S.H.E.; Ćalasan, M. A comprehensive review of photovoltaic modules models and algorithms used in parameter extraction. Energies 2022, 15, 8941. [Google Scholar] [CrossRef]
- Sobik, B. Wykorzystanie fotowoltaiki jako źródła pokrywającego zapotrzebowanie szczytowe w okresie letnim w Krajowym Systemie Elektroenergetycznym. Zesz. Nauk. Inst. Gospod. Surowcami Miner. Energią PAN 2019, 109, 123–136. [Google Scholar] [CrossRef]
- Rajesh, R.; Mabel, M.C. A comprehensive review of photovoltaic systems. Renew. Sustain. Energy Rev. 2015, 51, 231–248. [Google Scholar] [CrossRef]
- Carta, J.A.; Ramírez, P.; Velázquez, S. A review of wind speed probability distributions used in wind energy analysis: Case studies in the Canary Islands. Renew. Sustain. Energy Rev. 2009, 13, 933–955. [Google Scholar] [CrossRef]
- Murthy, K.S.R.; Rahi, O.P. A comprehensive review of wind resource assessment. Renew. Sustain. Energy Rev. 2017, 72, 1320–1342. [Google Scholar] [CrossRef]
- Lydia, M.; Suresh Kumar, S.; Selvakumar, A.I.; Prem Kumar, G.E. A comprehensive review on wind turbine power curve modeling techniques. Renew. Sustain. Energy Rev. 2014, 30, 452–460. [Google Scholar] [CrossRef]
- Saint-Drenan, Y.M.; Besseau, R.; Jansen, M.; Staffell, I.; Troccoli, A.; Dubus, L.; Schmidt, J.; Gruber, K.; Simões, S.G.; Heier, S. A parametric model for wind turbine power curves incorporating environmental conditions. Renew. Energy 2020, 157, 754–768. [Google Scholar] [CrossRef]
- Bilendo, F.; Meyer, A.; Badihi, H.; Lu, N.; Cambron, P.; Jiang, B. Applications and Modeling Techniques of Wind Turbine Power Curve for Wind Farms—A Review. Energies 2023, 16, 180. [Google Scholar] [CrossRef]
- Igliński, B.; Iglińska, A.; Koziński, G.; Skrzatek, M.; Buczkowski, R. Wind energy in Poland – History, current state, surveys, Renewable Energy Sources Act, SWOT analysis. Renew. Sustain. Energy Rev. 2016, 64, 19–33. [Google Scholar] [CrossRef]
- Yüksel, I. Hydropower for sustainable water and energy development. Renew. Sustain. Energy Rev. 2010, 14, 462–469. [Google Scholar] [CrossRef]
- Hamududu, B.; Killingtveit, A. Assessing climate change impacts on global hydropower. Energies 2012, 5, 305–322. [Google Scholar] [CrossRef]
- Zarfl, C.; Lumsdon, A.E.; Berlekamp, J.; Tydecks, L.; Tockner, K. A global boom in hydropower dam construction. Aquat. Sci. 2015, 77, 161–170. [Google Scholar] [CrossRef]
- Tahseen, S.; Karney, B.W. Reviewing and critiquing published approaches to the sustainability assessment of hydropower. Renew. Sustain. Energy Rev. 2017, 67, 225–234. [Google Scholar] [CrossRef]
- Wasti, A.; Ray, P.; Wi, S.; Folch, C.; Ubierna, M.; Karki, P. Climate change and the hydropower sector: A global review. WIREs Clim. Change 2022, 13, e757. [Google Scholar] [CrossRef]
- Klein, S.J.W.; Fox, E.L.B. A review of small hydropower performance and cost. Renew. Sustain. Energy Rev. 2022, 169, 112898. [Google Scholar] [CrossRef]
- Turner, S.W.D.; Hejazi, M.; Kim, S.H.; Clarke, L.; Edmonds, J. Climate impacts on hydropower and consequences for global electricity supply investment needs. Energy 2017, 141, 2081–2090. [Google Scholar] [CrossRef]
- Sadeghian, O.; Oshnoei, A.; Mohammadi-Ivatloo, B.; Vahidinasab, V.; Anvari-Moghaddam, A. A comprehensive review on electric vehicles smart charging: Solutions, strategies, technologies, and challenges. J. Energy Storage 2022, 54, 105241. [Google Scholar] [CrossRef]
- İnci, M.; Çelik, Ö.; Lashab, A.; Bayındır, K.Ç.; Vasquez, J.C.; Guerrero, J.M. Power System Integration of Electric Vehicles: A Review on Impacts and Contributions to the Smart Grid. Appl. Sci. 2024, 14, 2246. [Google Scholar] [CrossRef]
- Tan, K.M.; Ramachandaramurthy, V.K.; Yong, J.Y. Integration of electric vehicles in smart grid: A review on vehicle to grid technologies and optimization techniques. Renew. Sustain. Energy Rev. 2016, 53, 720–732. [Google Scholar] [CrossRef]
- Sovacool, B.K.; Axsen, J.; Kempton, W. The future promise of vehicle-to-grid (V2G) integration: A sociotechnical review and research agenda. Annu. Rev. Environ. Resour. 2017, 42, 377–406. [Google Scholar] [CrossRef]
- Barman, P.; Dutta, L.; Bordoloi, S.; Kalita, A.; Buragohain, P.; Bharali, S.; Azzopardi, B. Renewable energy integration with electric vehicle technology: A review of the existing smart charging approaches. Renew. Sustain. Energy Rev. 2023, 183, 113518. [Google Scholar] [CrossRef]
- Szinai, J.K.; Sheppard, C.J.R.; Abhyankar, N.; Gopal, A.R. Reduced grid operating costs and renewable energy curtailment with electric vehicle charge management. Energy Policy 2020, 136, 111051. [Google Scholar] [CrossRef]
- Dixon, J.; Bukhsh, W.; Edmunds, C.; Bell, K. Scheduling electric vehicle charging to minimise carbon emissions and wind curtailment. Renew. Energy 2020, 161, 1072–1091. [Google Scholar] [CrossRef]
- Saadatmandi, S.; Chicco, G.; Favenza, A.; Mozzato, A.; Giordano, F.; Arnone, M. Smart electric vehicle charging for reducing photovoltaic energy curtailment. Electr. Power Syst. Res. 2024, 230, 110181. [Google Scholar] [CrossRef]
- Blumberg, G.; Broll, R.; Weber, C. The impact of electric vehicles on the future European electricity system – A scenario analysis. Energy Policy 2022, 161, 112751. [Google Scholar] [CrossRef]
- IRENA. Innovation Outlook: Smart Charging for Electric Vehicles; International Renewable Energy Agency: Abu Dhabi, United Arab Emirates, 2019. [Google Scholar]
- U.S. Department of Energy. Vehicles-to-Grid Integration Assessment Report; DOE: Washington, DC, USA, 2025. [Google Scholar]
- Zappa, W.; Junginger, M.; van den Broek, M. Is a 100% renewable European power system feasible by 2050? Appl. Energy 2019, 233–234, 1027–1050. [Google Scholar] [CrossRef]
- Rasmussen, M.G.; Andresen, G.B.; Greiner, M. Storage and balancing synergies in a fully or highly renewable pan-European power system. Energy Policy 2012, 51, 642–651. [Google Scholar] [CrossRef]
- Heide, D.; Greiner, M.; von Bremen, L.; Hoffmann, C. Reduced storage and balancing needs in a fully renewable European power system with excess wind and solar power generation. Renew. Energy 2011, 36, 2515–2523. [Google Scholar] [CrossRef]
- Lund, P.D.; Lindgren, J.; Mikkola, J.; Salpakari, J. Review of energy system flexibility measures to enable high levels of variable renewable electricity. Renew. Sustain. Energy Rev. 2015, 45, 785–807. [Google Scholar] [CrossRef]
- Peker, M.; Kocaman, A.S.; Kara, B.Y. Benefits of transmission switching and energy storage in power systems with high renewable energy penetration. Appl. Energy 2018, 228, 1182–1197. [Google Scholar] [CrossRef]
- Jordan, D.C.; Kurtz, S.R. Photovoltaic degradation rates—An analytical review. Prog. Photovolt. Res. Appl. 2013, 21, 12–29. [Google Scholar] [CrossRef]
- Skoplaki, E.; Palyvos, J.A. Operating temperature of photovoltaic modules: A survey of pertinent correlations. Renew. Energy 2009, 34, 23–29. [Google Scholar] [CrossRef]
- Skoplaki, E.; Boudouvis, A.G.; Palyvos, J.A. A simple correlation for the operating temperature of photovoltaic modules of arbitrary mounting. Sol. Energy Mater. Sol. Cells 2008, 92, 1393–1402. [Google Scholar] [CrossRef]
- Pryor, S.C.; Barthelmie, R.J. Climate change impacts on wind energy: A review. Renew. Sustain. Energy Rev. 2010, 14, 430–437. [Google Scholar] [CrossRef]
- Das, H.S.; Rahman, M.M.; Li, S.; Tan, C.W. Electric vehicles standards, charging infrastructure, and impact on grid integration: A technological review. Renew. Sustain. Energy Rev. 2020, 120, 109618. [Google Scholar] [CrossRef]
- Flasza, J.; Matuszczyk, P. Elektromobilność w Polsce a systemy OZE. Prz. Elektrotech. 2018, 94, 33–36. [Google Scholar] [CrossRef]
- Kasperek, R. Perspektywy rozwoju energetyki wodnej w Polsce. Pol. J. Sustain. Dev. 2020, 24, 29–38. [Google Scholar] [CrossRef]
Figure 1.
Annual positive energy curtailment for PV—micro-inst. ≤50 kW.
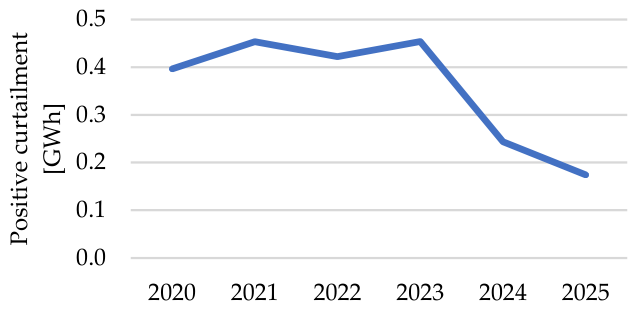
Figure 2.
Annual positive energy curtailment for WE—micro-inst. ≤50 kW.
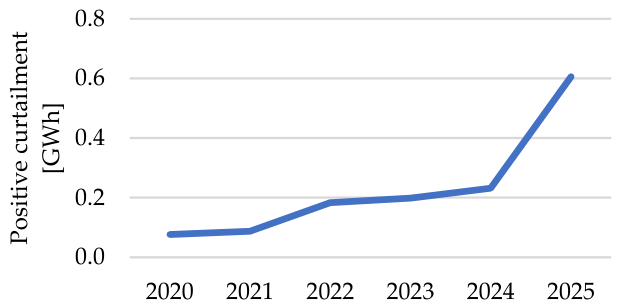
Figure 3.
Annual positive energy curtailment for HE—micro-inst. ≤50 kW.
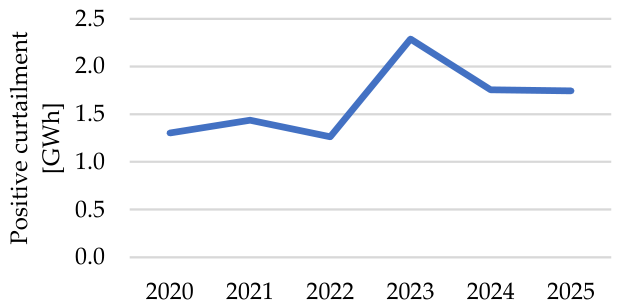
Figure 4.
Annual positive energy curtailment for PV—small inst. 51–500 kW.
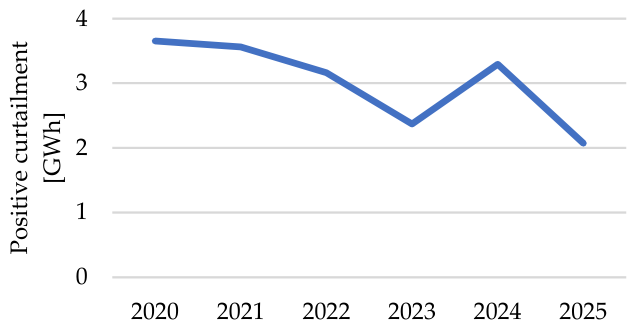
Figure 5.
Annual positive energy curtailment for WE—small inst. 51–500 kW.
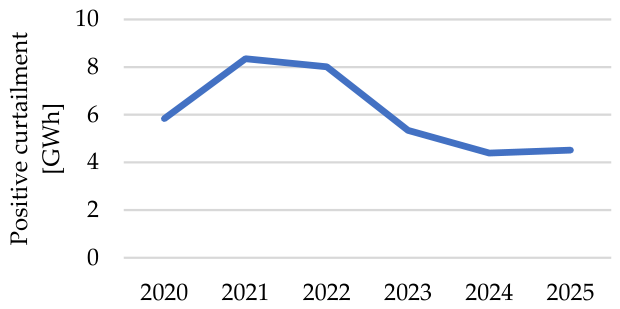
Figure 6.
Annual positive energy curtailment for HE—small inst. 51–500 kW.
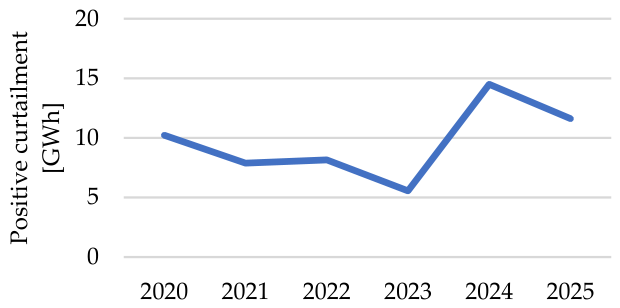
Figure 7.
Annual positive energy curtailment for PV—large inst. >500 kW.
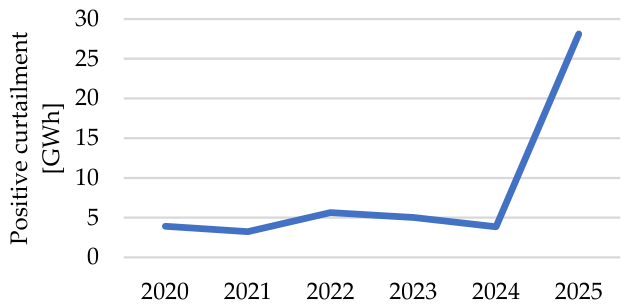
Figure 8.
Annual positive energy curtailment for WE—large inst. >500 kW.
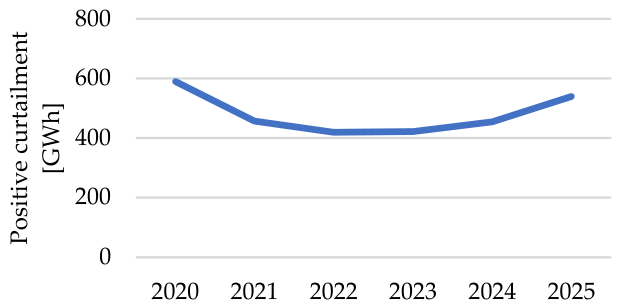
Figure 9.
Annual positive energy curtailment for HE—large inst. >500 kW.
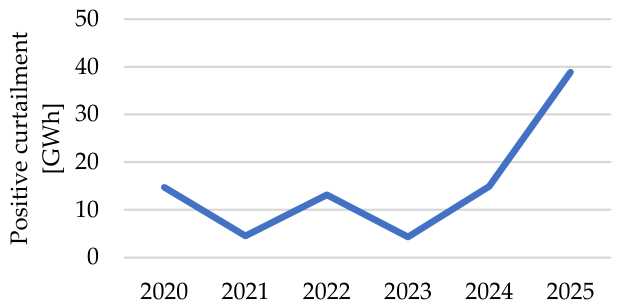
Figure 10.
Positive energy curtailment by inst. capacity class.
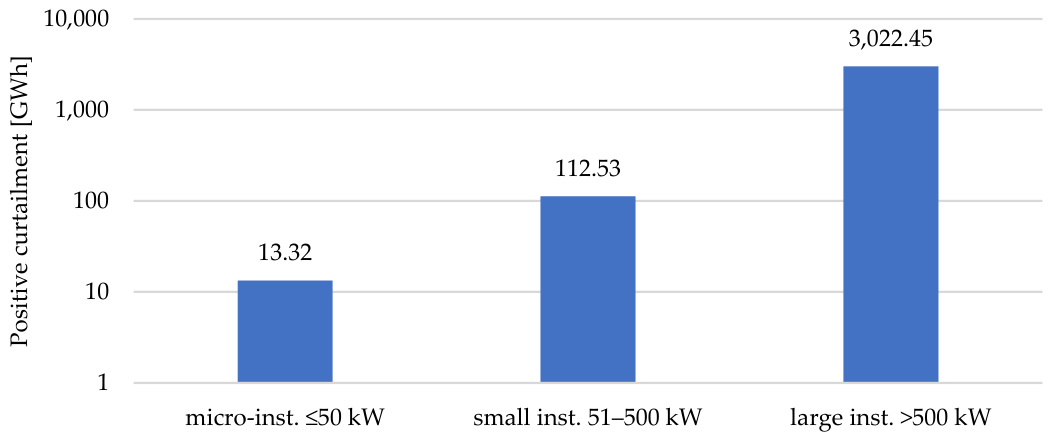
Figure 11.
Positive curtailment by technology—micro-inst. ≤50 kW.
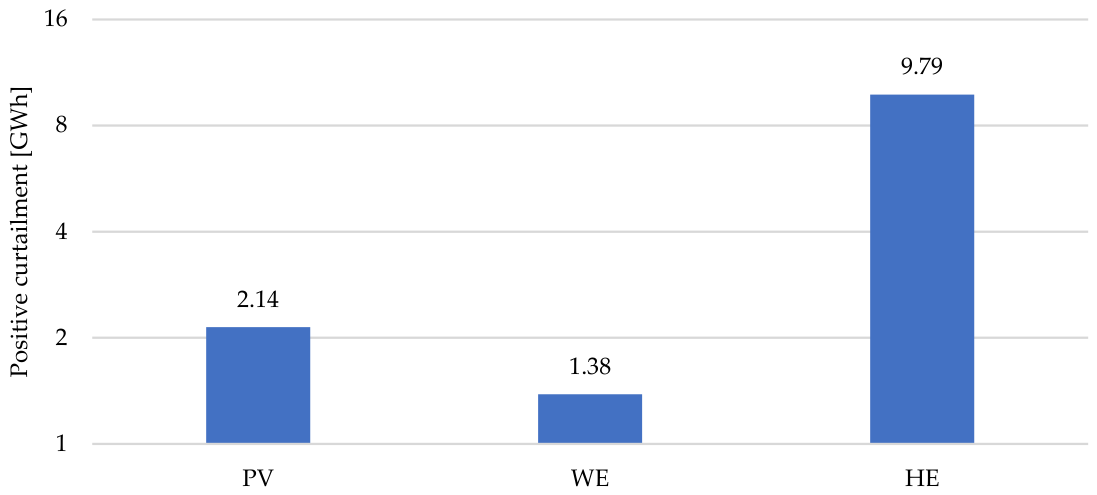
Figure 12.
Positive curtailment by technology—small inst. 51–500 kW.
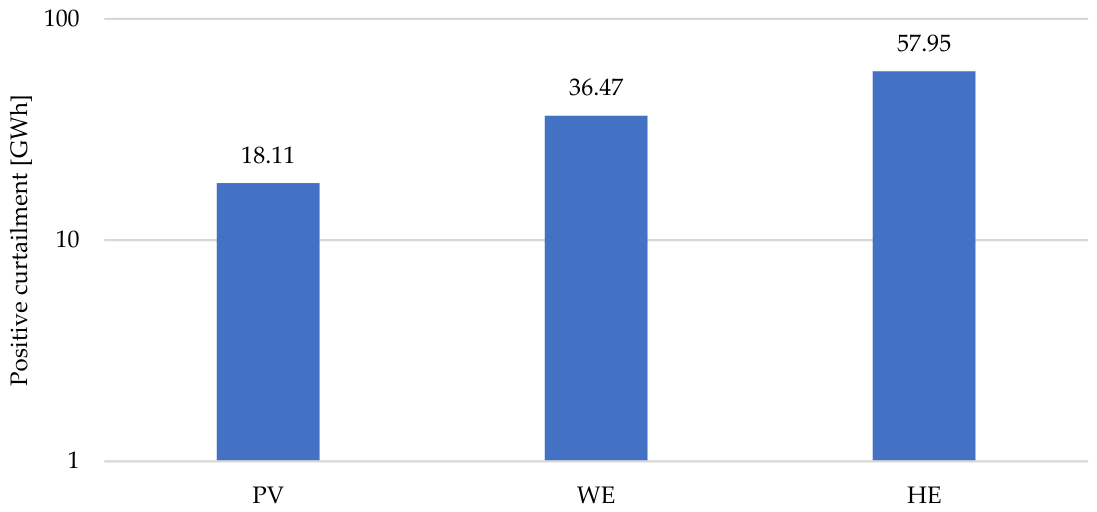
Figure 13.
Positive curtailment by technology—large inst. >500 kW.
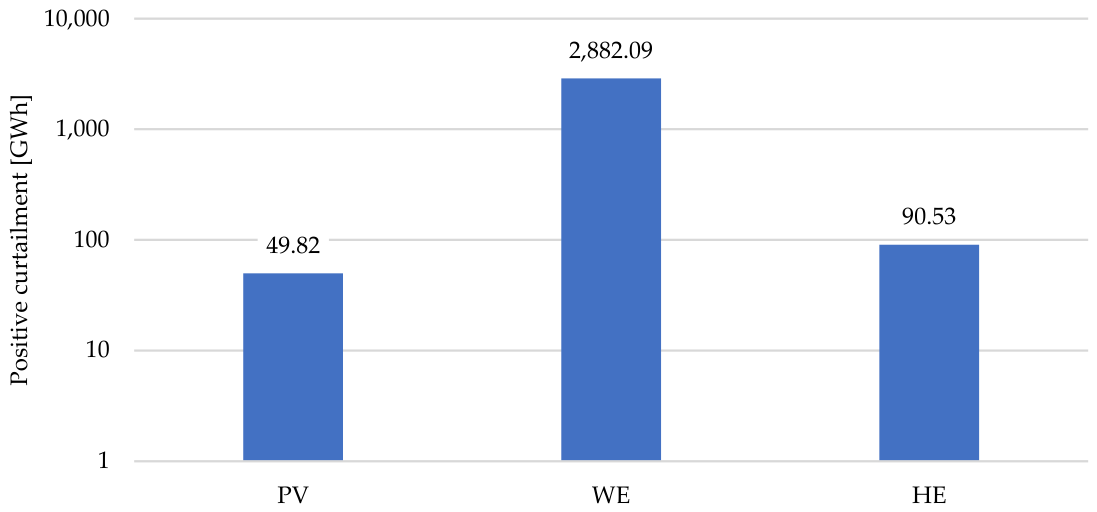
Figure 14.
PV in 2025—monthly modelled and actual energy.
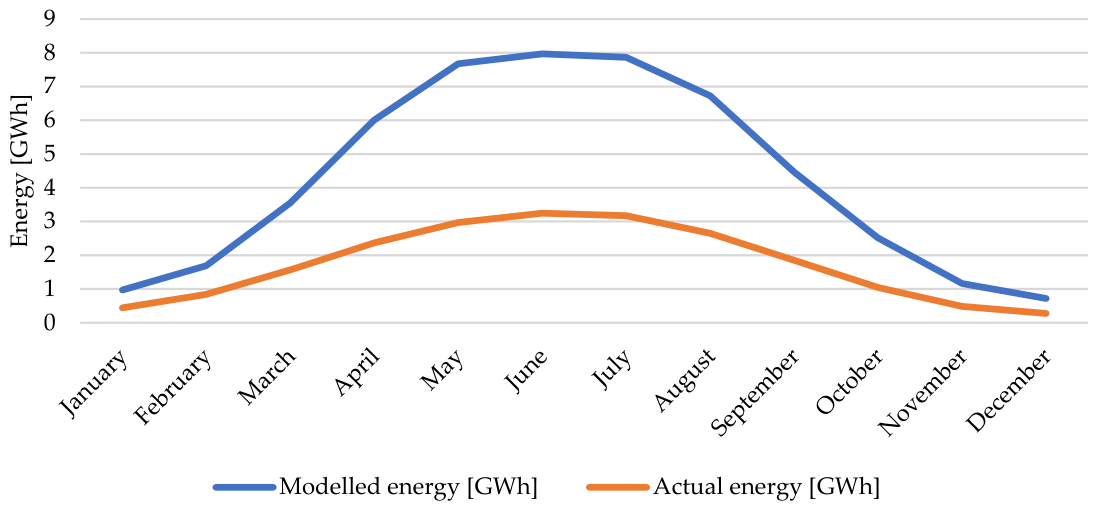
Figure 15.
PV in 2025—monthly energy curtailment.
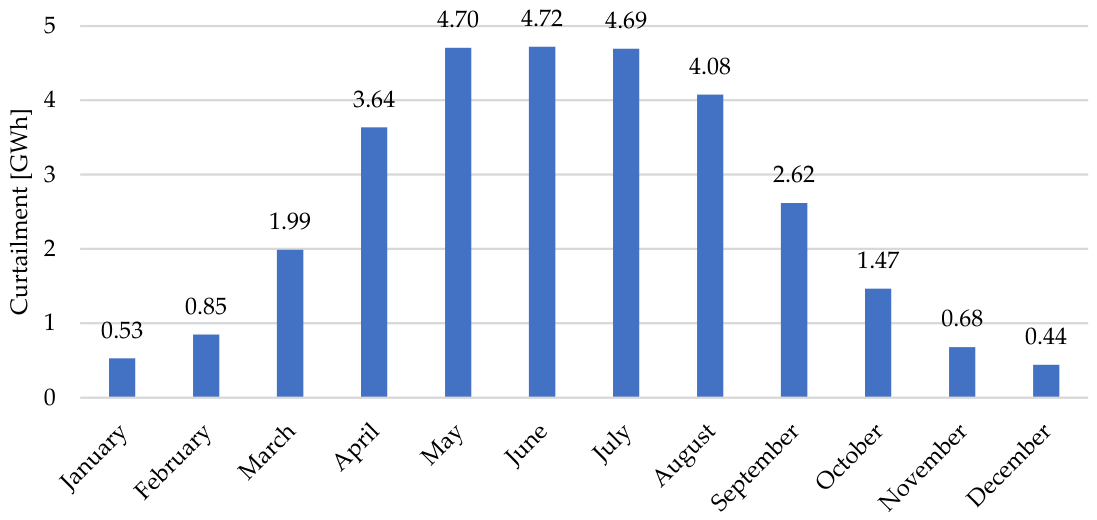
Figure 16.
WE in 2025—monthly modelled and actual energy.
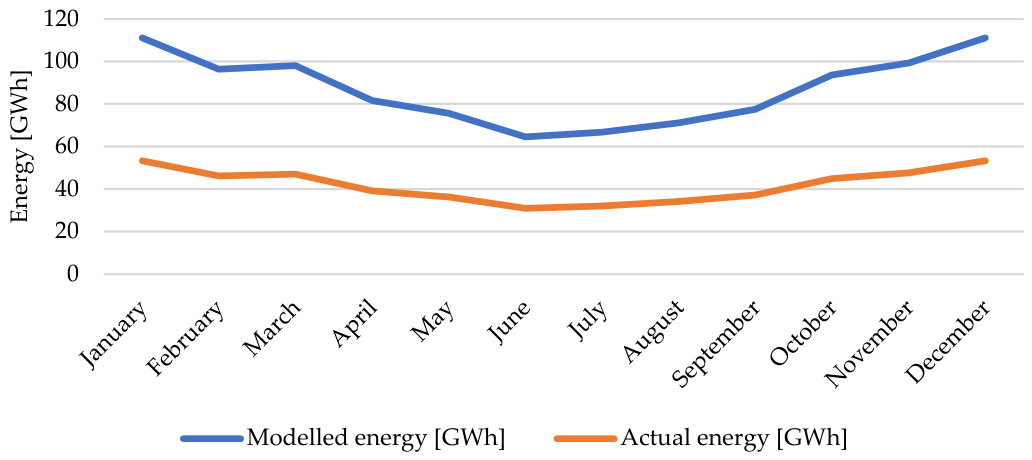
Figure 17.
WE in 2025—monthly energy curtailment.
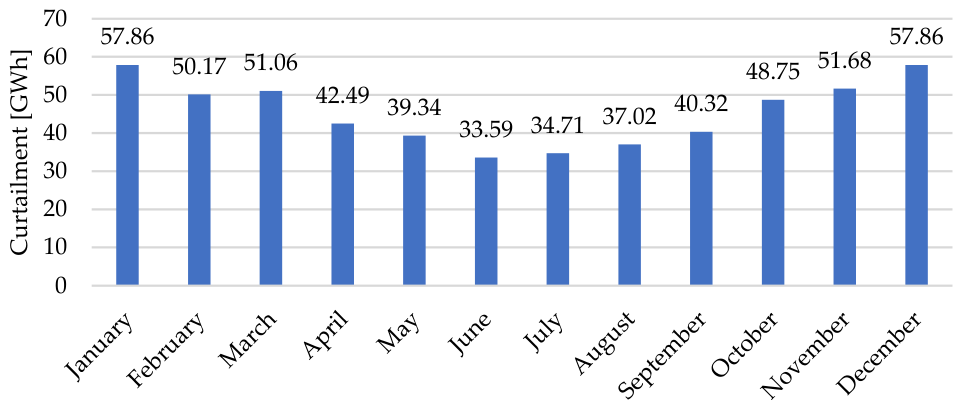
Figure 18.
HE in 2025—monthly modelled and actual energy.
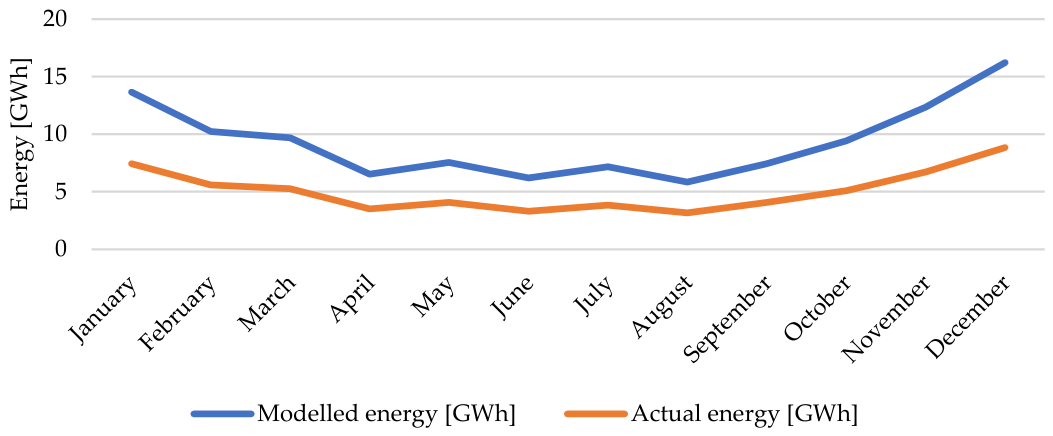
Figure 19.
HE in 2025—monthly energy curtailment.
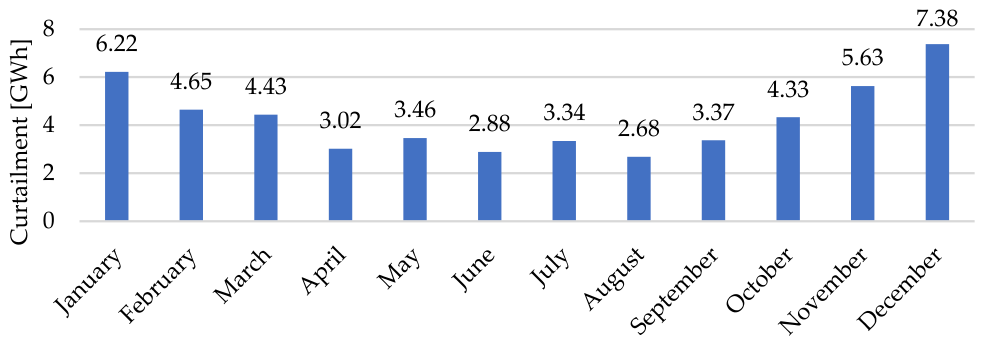
Figure 20.
Number of full EV charges—micro-inst. ≤50 kW.
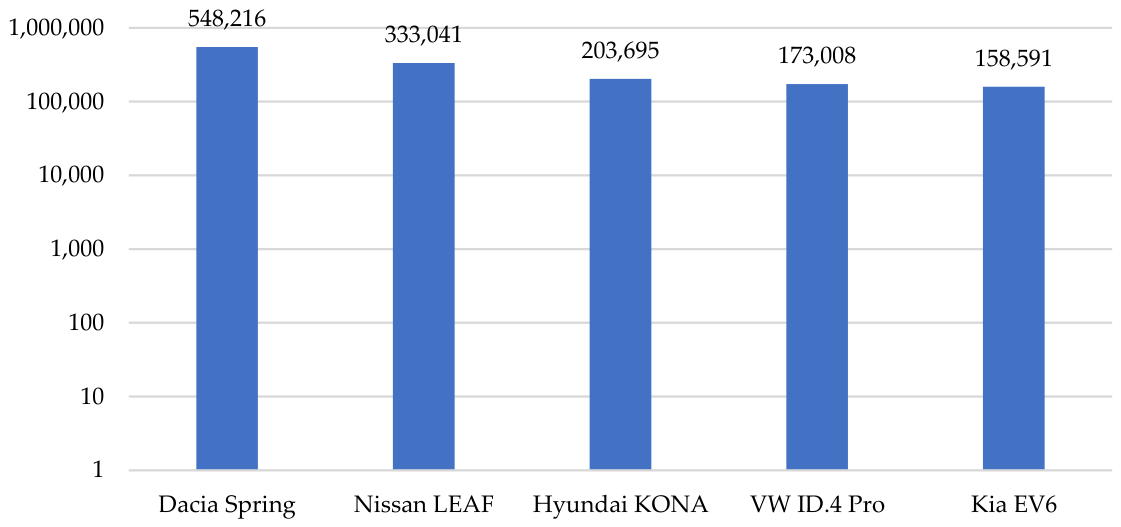
Figure 21.
Number of full EV charges—small inst. 51–500 kW.
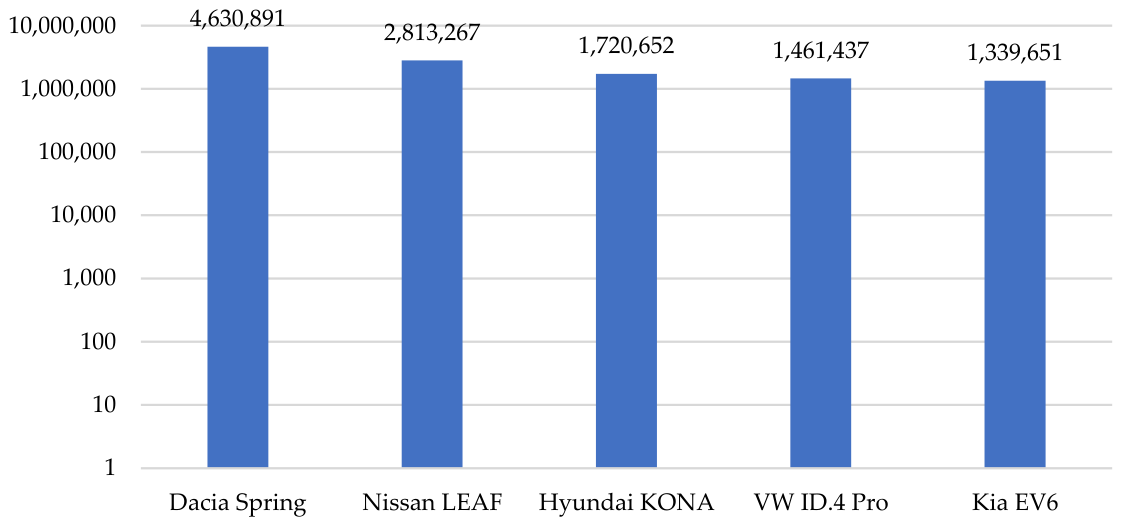
Figure 22.
Number of full EV charges—large inst. >500 kW.
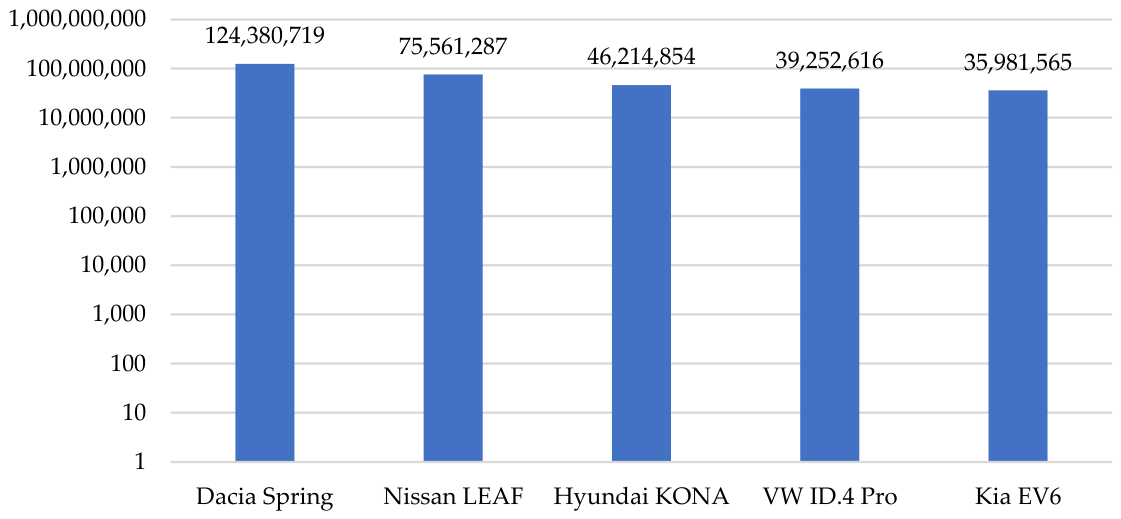

Table 1.
Summary of results by inst. capacity class.
| Capacity class | n | Capacity [MW] | Actual energy [GWh] | Modelled energy [GWh] | Curtailment [GWh] | Positive curtailment [GWh] | Utilisation | EVs/year | Share of curtailment |
|---|---|---|---|---|---|---|---|---|---|
| Micro-inst. ≤50 kW | 883 | 14.9 | 26.3 | 32.7 | 6.40 | 13.3 | 80.4% | 5 220 | 0.4% |
| Small inst. 51–500 kW | 358 | 73.2 | 42.7 | 155 | 112 | 113 | 27.5% | 44 100 | 3.6% |
| Large inst. >500 kW | 298 | 2 980 | 3 200 | 6 230 | 3 020 | 3 020 | 51.5% | 1 190 000 | 96.0% |
Table 2.
Summary of results by technology and capacity class.
| Tech. | Capacity class | n | Capacity [MW] | Actual energy [GWh] | Modelled energy [GWh] | Curtailment [GWh] | Positive curtailment [GWh] | Utilisation | EVs/year |
|---|---|---|---|---|---|---|---|---|---|
| PV | Micro-inst. ≤50 kW | 461 | 4.97 | 2.60 | 4.61 | 2.01 | 2.14 | 56.4% | 841 |
| PV | Small inst. 51–500 kW | 137 | 26.0 | 6.22 | 24.3 | 18.1 | 18.1 | 25.6% | 7 100 |
| PV | Large inst. >500 kW | 62 | 102 | 43.3 | 93.1 | 49.8 | 49.8 | 46.5% | 19 500 |
| WE | Micro-inst. ≤50 kW | 81 | 0.730 | 0.158 | 1.53 | 1.38 | 1.38 | 10.3% | 542 |
| WE | Small inst. 51–500 kW | 62 | 19.9 | 5.34 | 41.8 | 36.5 | 36.5 | 12.8% | 14 300 |
| WE | Large inst. >500 kW | 204 | 2 810 | 3 030 | 5 910 | 2 880 | 2 880 | 51.2% | 1 130 000 |
| HE | Micro-inst. ≤50 kW | 341 | 9.18 | 23.5 | 26.5 | 3.01 | 9.79 | 88.6% | 3 840 |
| HE | Small inst. 51–500 kW | 159 | 27.3 | 31.1 | 89.0 | 57.8 | 57.9 | 35.0% | 22 700 |
| HE | Large inst. >500 kW | 32 | 64.7 | 133 | 224 | 90.5 | 90.5 | 59.5% | 35 500 |
Table 3.
Annual positive energy curtailment by capacity class and technology.
| Year | Capacity class | PV [GWh] | WE [GWh] | HE [GWh] | Total [GWh] |
|---|---|---|---|---|---|
| 2020 | Micro-inst. ≤50 kW | 0.397 | 0.0768 | 1.30 | 1.78 |
| 2021 | Micro-inst. ≤50 kW | 0.454 | 0.0872 | 1.44 | 1.98 |
| 2022 | Micro-inst. ≤50 kW | 0.422 | 0.183 | 1.26 | 1.87 |
| 2023 | Micro-inst. ≤50 kW | 0.454 | 0.198 | 2.29 | 2.94 |
| 2024 | Micro-inst. ≤50 kW | 0.244 | 0.232 | 1.76 | 2.23 |
| 2025 | Micro-inst. ≤50 kW | 0.174 | 0.606 | 1.74 | 2.52 |
| 2020 | Small inst. 51–500 kW | 3.65 | 5.84 | 10.2 | 19.7 |
| 2021 | Small inst. 51–500 kW | 3.56 | 8.36 | 7.89 | 19.8 |
| 2022 | Small inst. 51–500 kW | 3.16 | 8.01 | 8.15 | 19.3 |
| 2023 | Small inst. 51–500 kW | 2.37 | 5.35 | 5.56 | 13.3 |
| 2024 | Small inst. 51–500 kW | 3.29 | 4.40 | 14.5 | 22.2 |
| 2025 | Small inst. 51–500 kW | 2.07 | 4.51 | 11.6 | 18.2 |
| 2020 | Large inst. >500 kW | 3.92 | 590 | 14.7 | 608 |
| 2021 | Large inst. >500 kW | 3.25 | 457 | 4.54 | 465 |
| 2022 | Large inst. >500 kW | 5.63 | 420 | 13.1 | 438 |
| 2023 | Large inst. >500 kW | 5.03 | 422 | 4.31 | 431 |
| 2024 | Large inst. >500 kW | 3.85 | 454 | 14.9 | 473 |
| 2025 | Large inst. >500 kW | 28.2 | 540 | 38.9 | 607 |
Table 4.
PV in 2025—modelled and actual energy and monthly curtailment.
| Month | Modelled energy [GWh] | Actual energy [GWh] | Curtailment [GWh] |
|---|---|---|---|
| January | 0.970 | 0.442 | 0.528 |
| February | 1.692 | 0.843 | 0.849 |
| March | 3.554 | 1.566 | 1.987 |
| April | 6.005 | 2.370 | 3.636 |
| May | 7.677 | 2.972 | 4.705 |
| June | 7.972 | 3.253 | 4.719 |
| July | 7.867 | 3.173 | 4.694 |
| August | 6.728 | 2.651 | 4.076 |
| September | 4.466 | 1.848 | 2.618 |
| October | 2.510 | 1.044 | 1.466 |
| November | 1.160 | 0.482 | 0.678 |
| December | 0.722 | 0.281 | 0.442 |
Table 5.
WE in 2025—modelled and actual energy and monthly curtailment.
| Month | Modelled energy [GWh] | Actual energy [GWh] | Curtailment [GWh] |
|---|---|---|---|
| January | 111.144 | 53.287 | 57.857 |
| February | 96.367 | 46.196 | 50.171 |
| March | 98.110 | 47.047 | 51.063 |
| April | 81.647 | 39.159 | 42.488 |
| May | 75.617 | 36.275 | 39.341 |
| June | 64.555 | 30.961 | 33.594 |
| July | 66.707 | 31.993 | 34.714 |
| August | 71.159 | 34.134 | 37.025 |
| September | 77.493 | 37.178 | 40.316 |
| October | 93.652 | 44.905 | 48.747 |
| November | 99.298 | 47.619 | 51.680 |
| December | 111.144 | 53.287 | 57.857 |
Table 6.
HE in 2025—modelled and actual energy and monthly curtailment.
| Month | Modelled energy [GWh] | Actual energy [GWh] | Curtailment [GWh] |
|---|---|---|---|
| January | 13.660 | 7.439 | 6.221 |
| February | 10.230 | 5.583 | 4.647 |
| March | 9.687 | 5.253 | 4.434 |
| April | 6.523 | 3.508 | 3.016 |
| May | 7.533 | 4.074 | 3.459 |
| June | 6.189 | 3.305 | 2.884 |
| July | 7.172 | 3.832 | 3.340 |
| August | 5.844 | 3.164 | 2.680 |
| September | 7.433 | 4.061 | 3.372 |
| October | 9.411 | 5.083 | 4.329 |
| November | 12.338 | 6.707 | 5.631 |
| December | 16.221 | 8.846 | 7.376 |
Table 7.
Potential use of positive curtailment to charge selected EV models.
| Capacity class | Positive curtailment [GWh] | EV model | Battery capacity [kWh] | Number of full charges | EVs supplied per year |
|---|---|---|---|---|---|
| Micro-inst. ≤50 kW | 13.3 | Dacia Spring | 24.3 | 548 000 | 5 220 |
| Micro-inst. ≤50 kW | 13.3 | Nissan LEAF 40 kWh | 40.0 | 333 000 | 5 220 |
| Micro-inst. ≤50 kW | 13.3 | Hyundai KONA Electric Long Range | 65.4 | 204 000 | 5 220 |
| Micro-inst. ≤50 kW | 13.3 | Volkswagen ID.4 Pro | 77.0 | 173 000 | 5 220 |
| Micro-inst. ≤50 kW | 13.3 | Kia EV6 | 84.0 | 159 000 | 5 220 |
| Small inst. 51–500 kW | 113 | Dacia Spring | 24.3 | 4 630 000 | 44 100 |
| Small inst. 51–500 kW | 113 | Nissan LEAF 40 kWh | 40.0 | 2 810 000 | 44 100 |
| Small inst. 51–500 kW | 113 | Hyundai KONA Electric Long Range | 65.4 | 1 720 000 | 44 100 |
| Small inst. 51–500 kW | 113 | Volkswagen ID.4 Pro | 77.0 | 1 460 000 | 44 100 |
| Small inst. 51–500 kW | 113 | Kia EV6 | 84.0 | 1 340 000 | 44 100 |
| Large inst. >500 kW | 3 020 | Dacia Spring | 24.3 | 124 000 000 | 1 190 000 |
| Large inst. >500 kW | 3 020 | Nissan LEAF 40 kWh | 40.0 | 75 600 000 | 1 190 000 |
| Large inst. >500 kW | 3 020 | Hyundai KONA Electric Long Range | 65.4 | 46 200 000 | 1 190 000 |
| Large inst. >500 kW | 3 020 | Volkswagen ID.4 Pro | 77.0 | 39 300 000 | 1 190 000 |
| Large inst. >500 kW | 3 020 | Kia EV6 | 84.0 | 36 000 000 | 1 190 000 |
Disclaimer/Publisher’s Note: The statements, opinions and data contained in all publications are solely those of the individual author(s) and contributor(s) and not of MDPI and/or the editor(s). MDPI and/or the editor(s) disclaim responsibility for any injury to people or property resulting from any ideas, methods, instructions or products referred to in the content. |
© 2026 by the authors. Licensee MDPI, Basel, Switzerland. This article is an open access article distributed under the terms and conditions of the Creative Commons Attribution (CC BY) license (http://creativecommons.org/licenses/by/4.0/).
Copyright: This open access article is published under a Creative Commons CC BY 4.0 license, which permit the free download, distribution, and reuse, provided that the author and preprint are cited in any reuse.