

Submitted:
12 September 2026
Posted:
15 September 2026
You are already at the latest version
Abstract
Magnetic measurements acquired by UAVs are affected by onboard propulsion, power, control, and electronic systems. This study evaluates sensor placement effects on UAV-induced magnetic disturbance using three RM3100 magnetometers installed at two wing locations and one tail location on a puller fixed-wing UAV. UAV OFF/ON, throttle, servo, heading, sensor-position crossover, reference, and flight-validation tests were performed using common calibration, filtering, and statistical procedures. Throttle produced the largest disturbances, reaching 430, 485, and 185 nT for RM3100-A, RM3100-B, and RM3100-C, respectively. RM3100-C generally showed the lowest disturbance, and crossover results indicated that installation position strongly influenced the observed response. These results show that calibration alone is insufficient and that sensor placement, wiring, servo proximity, electrical loading, and installation geometry should be considered jointly.
Keywords:
fixed-wing UAV
; RM3100 magnetometer
; UAV-induced magnetic interference
; sensor placement
; magnetometer calibration
; throttle-dependent disturbance
; distributed magnetic sensing
; airborne magnetic measurement
1. Introduction
UAV-based magnetic sensing provides a flexible approach for low-altitude magnetic surveying, but measurement quality can be strongly affected by magnetic disturbances generated by the aircraft itself. These disturbances depend not only on the propulsion and electronic systems but also on sensor location, calibration, wiring configuration, and UAV operating state. Accordingly, this section establishes the context of UAV-based magnetometry, summarizes the principal sources of platform-induced magnetic interference, identifies the relevant research gap, and defines the objective and contributions of the present study.
1.1. Problem Context
UAV-based magnetic measurement has become an increasingly important approach for low-altitude airborne sensing because unmanned aerial vehicles (UAVs) offer flexible operation, relatively low deployment costs, and access to areas that may be difficult or unsafe for conventional manned surveys [1]. UAV magnetometry has been applied to geophysical and mineral exploration [1], unexploded ordnance detection [2], and magnetic anomaly-based navigation [3].
The development of compact and lightweight magnetic sensors has further enabled their integration into small UAV platforms [4]. In particular, compact vector magnetometers such as the RM3100 have been investigated for UAV-based magnetic surveying [5]. Their small form factor also enables multiple sensors to be deployed at different airframe locations, allowing spatial differences in platform-induced magnetic disturbance to be evaluated directly.
Measurement performance also depends strongly on UAV configuration. Fixed-wing, multirotor, and VTOL/hybrid platforms differ in endurance, maneuverability, propulsion architecture, power distribution, and available sensor-placement options [6]. Fixed-wing UAVs are generally well suited to extended survey coverage and stable cruise operation, whereas multirotor platforms provide greater maneuverability for localized low-altitude surveys. VTOL/hybrid configurations combine elements of both architectures but introduce additional propulsion and control components that can increase the complexity of the onboard magnetic environment [6].
1.2. Main Technical Challenge
Despite these operational advantages, reliable UAV-mounted magnetic measurement remains challenging because the aircraft itself is a source of magnetic and electromagnetic disturbance. Propulsion, power-distribution, control, electronic, and structural subsystems can modify the magnetic field measured by an onboard magnetometer [7]. The resulting disturbance depends on component operating state, sensor-to-source separation and orientation, electrical current, and the geometry of nearby wiring and structural elements.
The propulsion motor and electronic speed controller (ESC) can generate static and time-varying magnetic fields, while batteries and high-current power cables produce current-dependent disturbances. Servo actuators can introduce localized transient variations during control-surface motion, and onboard computers, navigation electronics, telemetry systems, converters, and associated wiring may generate additional electromagnetic interference [7]. Consequently, changes in throttle, heading, servo activity, and electrical load can alter the magnetic signature of the UAV during operation.
Sensor placement is therefore an important physical strategy for reducing platform-induced magnetic contamination. Increasing the separation between a magnetometer and dominant onboard interference sources generally reduces their influence [8]. Depending on airframe configuration, magnetometers may be installed at wing, wingtip, nose-boom, tail-boom, suspended, or gradiometer locations. For a puller fixed-wing UAV, where propulsion-related components and high-current wiring are concentrated toward the nose, sufficiently separated wing and tail regions represent particularly relevant candidate locations [8].
Sensor placement alone, however, cannot eliminate intrinsic magnetometer errors. Calibration is required to reduce hard-iron bias, soft-iron distortion, scale-factor mismatch, and other axis-related errors [9]. Geometric and ellipsoid-based calibration approaches have been developed to estimate and compensate for these effects [10,11], while inertial-assisted methods can improve calibration robustness under dynamic conditions [12]. For airborne magnetic systems, Tolles–Lawson-type compensation models additionally address permanent, induced, and eddy-current magnetic effects associated with aircraft orientation and motion [13]. Reliable UAV magnetometry therefore requires sensor-level calibration to be considered together with platform configuration, sensor placement, and operating-state-dependent interference.
1.3. Research Gap
Previous studies have addressed UAV magnetic surveying, magnetometer calibration, platform selection, and airborne magnetic interference suppression; however, comparatively fewer investigations have directly compared multiple compact magnetometers installed at different locations on the same fixed-wing UAV under identical operating conditions [6]. This limitation is important because sensors exposed to the same ambient magnetic environment may experience different levels of platform-induced disturbance depending on their proximity to propulsion components, power wiring, servos, onboard electronics, and structural elements [7].
Furthermore, many existing investigations emphasize either a single sensor location or a specific calibration or compensation technique. A direct multi-location comparison that combines powered and unpowered states, throttle variation, heading changes, and servo actuation is therefore useful for distinguishing location-dependent effects from intrinsic sensor errors. In particular, a controlled comparison of distributed RM3100 magnetometers at wing and tail locations can provide practical evidence for sensor-placement decisions on puller fixed-wing UAVs.
1.4. Objective and Contributions
The objective of this study is to experimentally characterize UAV-induced magnetic disturbance and evaluate the influence of sensor placement on a single-motor puller fixed-wing UAV equipped with three distributed RM3100 three-axis magnetometers. Two sensors are installed at wing locations and one near the tail, enabling both wing-to-wing and wing-to-tail comparisons under common platform and operating conditions.
The experimental evaluation includes sensor calibration and filtering, UAV OFF/ON states, throttle-dependent propulsion activity, heading variation, and servo actuation. Magnetic responses are compared using consistent stability and disturbance metrics to determine how each installation location responds to the principal UAV operating conditions.
The main contributions of this study are:
- An experimental comparison of three distributed RM3100 magnetometers installed at two wing locations and one tail location on the same puller fixed-wing UAV;
- A systematic evaluation of location-dependent magnetic disturbance under UAV OFF/ON, throttle, heading, and servo-actuation conditions using consistent calibration, filtering, and comparison procedures; and
- An assessment of the relationship between sensor location, separation from onboard interference sources, and measurement stability to identify the optimal sensor position based on magnetic stability metrics for the investigated UAV configuration.
The results provide a practical basis for interference-aware magnetometer placement and the development of more reliable UAV-based magnetic measurement systems.
2. Background and Related Work
UAV-based magnetometry is influenced by the interaction among platform architecture, onboard interference sources, sensor placement, and calibration or compensation strategy. These factors are closely coupled because the propulsion and power configuration determines the spatial distribution of magnetic disturbance, while the available airframe geometry constrains how far a magnetometer can be separated from dominant sources. This section reviews these considerations with emphasis on their relevance to distributed magnetic sensing on fixed-wing UAVs.
2.1. UAV Platforms for Airborne Magnetic Measurements
UAVs provide a flexible alternative to conventional manned platforms for low-altitude magnetic surveying and have been applied to geophysical exploration and magnetic anomaly sensing [1,3]. Their relatively low deployment cost and ability to operate close to the terrain make them particularly useful for localized or difficult-to-access survey areas [6].
Platform configuration directly affects both survey capability and the onboard magnetic environment. Fixed-wing, multirotor, and VTOL/hybrid UAVs differ in propulsion architecture, endurance, maneuverability, power distribution, and available sensor locations [6]. These differences influence the magnitude and spatial distribution of platform-induced interference and, consequently, the feasibility of locating a magnetometer sufficiently far from dominant magnetic sources.
2.1.1. Fixed-Wing UAVs
Fixed-wing UAVs are well suited to large-area magnetic surveys because of their relatively long endurance, efficient coverage, and stable cruise conditions [6]. Their elongated airframes also provide spatially separated regions in which magnetometers can be installed, making wing, tail, and boom locations practical candidates for interference reduction and distributed sensing.
The magnetic environment of a fixed-wing UAV depends strongly on its propulsion configuration. Motors, electronic speed controllers (ESCs), batteries, high-current wiring, servos, onboard electronics, and metallic components can all contribute to the measured disturbance [7]. In a pusher configuration, the propulsion system is located toward the rear of the aircraft, making forward or nose-boom installations potentially advantageous. Conversely, in a puller configuration, the motor and associated high-current components are concentrated near the nose; consequently, wing and tail locations can provide greater separation from the dominant propulsion-related sources [8].
This spatial separation is particularly relevant to the present study because multiple sensors can be installed on the same airframe and exposed to essentially the same ambient magnetic environment while experiencing different levels of UAV-induced disturbance. A fixed-wing platform therefore provides a useful configuration for directly comparing wing-to-wing and wing-to-tail magnetometer performance.
2.1.2. Multirotor UAVs
Multirotor UAVs are advantageous for localized, low-altitude magnetic surveys because they can hover, fly at low speeds, and closely follow terrain [6]. However, their multiple motors and ESCs, central power-distribution systems, and continuously varying motor currents can produce a spatially distributed and time-varying magnetic environment [7].
To reduce this interference, multirotor magnetic systems commonly use suspended sensors, non-magnetic booms, or gradiometer configurations that increase the separation between the magnetometer and propulsion system [8]. Suspended configurations can provide substantial magnetic separation but may introduce pendulum motion and sensor-position uncertainty, whereas rigid boom installations provide greater positional stability at the cost of additional structural constraints. Magnetometer integration on multirotor platforms therefore requires a compromise between magnetic separation, mechanical stability, positioning accuracy, and flight performance.
2.1.3. VTOL and Hybrid UAVs
VTOL and hybrid UAVs combine vertical takeoff and landing capability with the endurance and cruise efficiency of fixed-wing aircraft [6]. This configuration is useful where runway-independent operation and extended survey coverage are both required, but the integration of lift motors, cruise propulsion, multiple ESCs, servos, batteries, and power-distribution wiring creates a more complex onboard magnetic environment.
The magnetic signature of VTOL/hybrid platforms may change substantially between takeoff, hover, transition, cruise, and landing because different propulsion and control components become active during each flight phase [6]. Consequently, steady fixed-wing cruise generally provides a more favorable operating state for magnetic acquisition than transition or hover. Practical sensor locations depend on the specific propulsion layout but may include wingtip, nose-boom, and tail-boom configurations [8].
Overall, the three platform classes involve different trade-offs between survey performance and magnetic cleanliness. Fixed-wing UAVs provide efficient coverage and spatially separated sensor locations, multirotors offer maneuverability but contain multiple distributed propulsion sources, and VTOL/hybrid platforms provide operational flexibility at the cost of greater system complexity [6]. Platform selection should therefore consider not only flight requirements but also whether a mechanically stable, low-interference magnetometer location can be achieved.
The principal operational and magnetic characteristics of these platform configurations are summarized in Table 1, including their dominant interference sources, preferred survey modes, practical sensor locations, and major advantages and limitations.
As summarized in Table 1, increasing propulsion and power-system complexity generally produces a more distributed and time-varying onboard magnetic environment. Fixed-wing platforms provide favorable endurance and spatially separated mounting regions, whereas multirotor and VTOL/hybrid platforms often require greater sensor separation from multiple propulsion and power sources. These differences provide the platform-selection context for the puller fixed-wing configuration investigated in this study.
2.2. UAV-Induced Magnetic Interference
UAV-mounted magnetometers are affected by magnetic and electromagnetic disturbances generated by propulsion, power, control, electronic, and structural subsystems [7]. The magnitude and temporal behavior of these disturbances depend on component type, operating state, current demand, wiring geometry, and distance from the sensor.
Propulsion-related components are typically among the dominant operational interference sources. Brushless motors contain permanent magnets and generate time-varying fields during rotation, while electronic speed controllers (ESCs) introduce switching-related electromagnetic disturbances that vary with motor loading and throttle [7]. Batteries and high-current power cables contribute additional current-dependent fields whose magnitude depends on current flow, conductor geometry, loop area, and sensor separation. Consequently, changes in propulsion demand can directly alter the magnetic environment surrounding an onboard magnetometer.
Servo actuators and onboard electronics introduce additional localized disturbances. Servos contain electric motors and magnetic and metallic components, and their actuation can produce transient magnetic variations, particularly when the sensor is installed near a control surface [7]. Autopilots, onboard computers, telemetry modules, converters, and associated wiring may also contribute localized electromagnetic interference. Although individual electronic sources may be weaker than the propulsion system, their combined influence can become significant when several components are concentrated near the sensor.
Structural components can further produce location-dependent effects. Metallic fasteners, hinges, connectors, and control linkages may introduce local hard-iron bias, while conductive materials can alter the electromagnetic environment near electrical subsystems. These effects reinforce the importance of evaluating the complete installed configuration rather than considering individual electronic components in isolation.
The UAV magnetic signature also varies with operating state. Throttle changes modify propulsion current, servo motion produces transient disturbances, and changes in heading and attitude alter the relationship among the sensor, the ambient geomagnetic field, and aircraft-related magnetic sources [7]. Such operational effects cannot generally be removed by static sensor calibration alone. Interference assessment should therefore account for both the spatial distribution of onboard sources and the operating conditions under which measurements are acquired.
2.3. Magnetometer Placement Strategies Across UAV Types
Physical separation from dominant onboard sources is one of the most effective strategies for reducing UAV-induced magnetic interference [8]. The preferred installation location depends on propulsion architecture, power distribution, servo placement, wiring, and airframe geometry; however, magnetic separation must be balanced against mechanical rigidity, vibration, positioning accuracy, and repeatable sensor orientation.
For fixed-wing UAVs, practical configurations include wingtip, nose-boom, tail-boom, and distributed wing installations [8]. Wing locations increase separation from electronics and power components concentrated in the fuselage, whereas tail locations can provide substantial separation from a nose-mounted propulsion system. Propulsion layout is therefore important: a forward sensor location may be advantageous for a pusher aircraft, whereas wing or tail locations are generally more favorable candidates for a puller configuration in which the motor, ESC, and associated high-current wiring are concentrated toward the nose.
Multirotor platforms present different placement constraints because several motors and ESCs are distributed around the airframe. Suspended magnetometers and non-magnetic booms are commonly used to increase separation from these sources [8]. Suspended systems can reduce platform contamination but introduce sensor motion and position uncertainty, while rigid booms improve positional stability but require sufficient stiffness and vibration control. VTOL/hybrid aircraft combine these constraints with additional lift propulsion and transition systems, making component layout and flight phase particularly important when selecting a sensor location [6].
Distributed sensing provides a complementary approach for evaluating placement quality. Simultaneous measurements at multiple airframe locations allow location-dependent disturbances to be compared under similar ambient and operating conditions. Such configurations can reveal asymmetric wiring effects, servo-related contamination, and differences between wing and tail installations that cannot be identified from a single onboard magnetometer. This principle directly motivates the multi-location configuration evaluated in the present study.
2.4. Magnetometer Calibration and Compensation
Magnetometer calibration is required to reduce intrinsic errors including hard-iron bias, soft-iron distortion, scale-factor mismatch, axis misalignment, and sensor non-orthogonality [9]. Hard-iron effects primarily translate the measured magnetic-field distribution, whereas soft-iron and axis-related effects distort its shape and orientation. If uncorrected, these errors can cause the measured field magnitude to vary with sensor orientation.
Established three-axis calibration approaches include geometric and ellipsoid-based methods that estimate bias and transformation parameters from measurements acquired over multiple orientations [10,14]. More precise calibration procedures can further account for triaxial sensor imperfections [11], while inertial-assisted methods incorporate attitude information to improve calibration robustness under dynamic conditions [12].
UAV-specific magnetometer calibration has also been investigated using cooperative flight data [15], nonlinear optimization and compensation methods [16], and dynamic least-squares estimation for multirotor platforms [17]. These approaches extend conventional static calibration toward operating conditions more representative of installed UAV systems.
Calibration addresses sensor-level errors but does not necessarily remove disturbances generated by the installed aircraft. Tolles–Lawson-type models represent permanent, induced, and eddy-current magnetic contributions associated with aircraft orientation and motion [13]. Other studies have incorporated interference compensation into magnetic calibration systems [18], developed small-signal compensation methods for UAV-borne vector magnetometers [19], and proposed advanced aeromagnetic compensation strategies for large UAV platforms [20,21].
For UAV applications, calibration and platform-interference mitigation should therefore be treated as complementary rather than interchangeable procedures. Motor operation, ESC switching, high-current wiring, servo actuation, and changes in electrical load can produce dynamic disturbances that are not represented by a static hard-iron/soft-iron calibration model [7]. Calibration effectiveness should consequently be assessed after installation and under representative UAV operating states. Comparisons between UAV OFF and ON conditions, together with throttle, heading, and servo-actuation tests, provide a practical means of distinguishing intrinsic sensor errors from location- and operation-dependent platform effects.
2.5. Research Gap and Study Contributions
Previous studies have demonstrated the feasibility of UAV-based magnetic surveying and developed methods for sensor calibration, interference analysis, and airborne magnetic compensation. However, these topics have often been investigated separately, with comparatively limited emphasis on direct multi-location evaluation of compact magnetometers installed on the same fixed-wing UAV [6]. This is particularly relevant for distributed RM3100 configurations because compact RM3100 magnetometers have been investigated for UAV magnetic surveys [5], while different installation locations may experience different levels of platform-induced disturbance [7].
The present study addresses this gap by comparing three RM3100 magnetometers installed at two wing locations and one tail location on a single-motor puller fixed-wing UAV. Using consistent calibration and processing procedures, the sensors are evaluated under UAV OFF/ON, throttle, heading, and servo-actuation conditions. This approach enables direct assessment of location-dependent disturbance and supports identification of the most favorable sensor position among the three tested locations.
Table 2 summarizes the relationship between the main limitations identified in previous research and the specific contributions of the present study.
As summarized in Table 2, the present study integrates platform-induced interference, sensor placement, and calibration considerations through a distributed RM3100 configuration, enabling direct comparison of two wing-mounted locations and one tail-mounted location under common UAV operating conditions.
3. Experimental Platform and Sensor Configuration
The experimental configuration was designed to evaluate how sensor location affects UAV-induced magnetic disturbance under a common platform and operating environment. The investigated system consists of a single-motor puller fixed-wing UAV, three distributed RM3100 magnetometers, onboard propulsion and electronic subsystems, and a synchronized data-acquisition architecture. Particular attention is given to the spatial relationship between the sensors and the principal onboard interference sources because this geometry forms the basis for the subsequent wing-to-wing and wing-to-tail comparisons.
3.1. Rationale for Selecting the Puller Fixed-Wing Testbed
Fixed-wing UAVs are well suited to large-area magnetic measurement because of their relatively long endurance, efficient survey coverage, and stable cruise conditions [6]. Their elongated geometry also provides spatially separated regions in which magnetometers can be installed at different distances from propulsion, power-distribution, and electronic subsystems.
Propulsion layout is an important factor in selecting magnetometer locations on a fixed-wing UAV [8]. In a puller configuration, the propulsion motor, electronic speed controller (ESC), and associated high-current wiring are concentrated near the nose, while separation from these components generally increases toward the wing and tail. In contrast, pusher configurations place the primary propulsion source toward the rear, whereas multi-motor configurations distribute propulsion-related sources across several airframe regions.
The principal fixed-wing propulsion configurations relevant to magnetometer placement are illustrated in Figure 1.
The single-motor puller configuration was selected because it provides a comparatively concentrated propulsion-related interference region near the nose and progressively greater separation toward the wing and tail. This arrangement enables magnetometers at multiple locations to be compared under the same platform and operating conditions while reducing the interpretive complexity associated with multiple distributed propulsion units.
Table 3 compares puller, pusher, and multi-motor fixed-wing configurations from the perspective of propulsion location, expected interference distribution, practical sensor-placement regions, and suitability for the present investigation.
As summarized in Table 3, the puller configuration provides a suitable experimental geometry for evaluating location-dependent magnetic disturbance because its principal propulsion sources are concentrated toward the forward airframe while the wing and tail provide progressively separated candidate sensor locations. This selection does not imply that puller configurations are universally less magnetically disturbed than pusher or multi-motor aircraft; rather, the investigated platform provides a controlled testbed for comparing practical wing- and tail-mounted magnetometer installations.
3.2. Airframe and Propulsion Configuration
The experimental platform is a composite fixed-wing UAV equipped with a nose-mounted electric propulsion system. The aircraft has a wingspan of 4.60 m and a fuselage length of 2.14 m. The distance from the nose to the wing center is approximately 505 mm, while the distance from the wing center to the tail section is approximately 1635 mm. This elongated geometry provides substantial spatial separation between the forward propulsion region and the candidate wing and tail magnetometer locations.
The overall geometry of the experimental platform is shown in Figure 2 through front and top views of the investigated fixed-wing UAV.
The propulsion system consists of a nose-mounted brushless electric motor controlled by an electronic speed controller (ESC). The motor, ESC, battery, and associated high-current wiring form the principal propulsion and power subsystem. Because these components are concentrated mainly in the forward fuselage, the nose region is expected to experience stronger propulsion- and current-related magnetic disturbance than more distant parts of the airframe.
To evaluate the effect of spatial separation, two RM3100 sensors were installed in the wing regions and a third near the tail. This arrangement enables direct comparison of the three sensor–mount–location configurations positioned at different distances from the motor, ESC, battery, and central power-distribution region under the same operating conditions.
The composite construction of the airframe reduces the presence of large ferromagnetic structural elements compared with an entirely metallic structure. Nevertheless, localized metallic components, including screws, connectors, hinges, control linkages, servo mechanisms, and structural fittings, may still introduce local hard-iron or installation-dependent magnetic effects [9].
The principal geometric, propulsion, power, control, processing, and magnetic-sensing characteristics of the experimental UAV are summarized in Table 4.
The dimensions and component arrangement summarized in Table 4 provide the spatial basis for comparing the wing-mounted and tail-mounted magnetometer configurations.
3.3. Onboard Subsystems and Wiring Layout
In addition to the propulsion motor and ESC, the experimental UAV contains a 12S7P lithium battery pack, power-distribution components, high-current power cables, an autopilot, an onboard processing and logging unit, GNSS and telemetry equipment, communication modules, and wing and tail servos. These subsystems are distributed non-uniformly across the airframe and therefore create different local magnetic environments.
The battery, power-distribution components, autopilot, onboard processor, and associated wiring are located primarily along the fuselage. The motor and ESC form the dominant forward interference region, while the battery and current-carrying power paths introduce additional disturbance along the central fuselage. Magnetic interference associated with these conductors depends on both current magnitude and cable geometry [7]; consequently, sensor proximity to the complete wiring path is relevant in addition to its distance from individual electrical components.
The autopilot, processor, GNSS receiver, telemetry equipment, voltage-conversion components, and communication wiring may introduce additional localized electromagnetic effects. Although the contribution of an individual electronic module may be smaller than that of the propulsion subsystem, the combined influence of several components can become significant when they are concentrated near a sensor location.
Servo actuators are distributed across the wing and tail regions. Because servos contain electric motors, permanent magnets, metallic components, and current-carrying wiring, their actuation may produce localized transient magnetic variations [7]. The distance between each RM3100 sensor and its nearest servo was therefore considered separately from its separation from the propulsion and power subsystems.
The main onboard subsystems and their functional roles are summarized in Table 5.
The spatial arrangement of the principal onboard components and the three RM3100 installation locations is illustrated in Figure 3.
This component distribution creates distinct spatial relationships between the principal interference sources and the three magnetometers, providing the physical basis for the subsequent wing-to-wing and wing-to-tail comparisons.
3.4. Distributed RM3100 Sensor Layout
Magnetic measurements were acquired using three distributed RM3100 three-axis magnetometers, designated RM3100-A, RM3100-B, and RM3100-C. RM3100-A and RM3100-B were installed at two wing-mounted locations, while RM3100-C was installed near the tail section. Each sensor measured the magnetic-field components along its X, Y, and Z axes.
The three-sensor configuration was selected to enable both wing-to-wing and wing-to-tail comparisons within the same synchronized experiment. A two-sensor configuration would provide only one spatial comparison, whereas additional sensors would increase payload, wiring, synchronization, and data-acquisition complexity without being necessary for the primary objective of the study.
The two wing-mounted sensors were positioned at nominally comparable distances from the forward propulsion system but could still experience different local conditions associated with wiring paths, servos, connectors, structural fittings, and sensor mounting. Their comparison therefore enabled evaluation of magnetic asymmetry between the two wing regions.
RM3100-C was installed near the tail to represent a location with greater separation from the nose-mounted motor, ESC, battery, and central electronic systems. However, the tail location could still be influenced by nearby tail servos, control linkages, sensor wiring, and localized structural components. The tail-mounted sensor was therefore not assumed to be free from UAV-induced disturbance.
The wing–wing–tail arrangement was intended for comparative placement assessment rather than complete three-dimensional reconstruction of the magnetic field surrounding the UAV. The principal characteristics of the distributed RM3100 configuration and synchronized acquisition system are summarized in Table 6.
The configuration enabled simultaneous comparison of the three sensor locations under common operating and environmental conditions. The exact RM3100 cycle-count (CCC) register setting used during the experimental campaign was not preserved in the retained experimental documentation and therefore cannot be reconstructed reliably. The reported 50 Hz sampling frequency refers to the synchronized acquisition rate used for the comparative measurements and should not be interpreted as sufficient information to infer the internal RM3100 cycle-count configuration. Consequently, no cycle-count-dependent sensitivity or noise specification is assumed or reconstructed in this study.
3.5. Sensor-to-Source Separation Distances
Approximate separation distances between the three RM3100 magnetometers and the principal onboard interference sources were obtained from the physical UAV layout. These distances were used to support interpretation of the measured disturbances and were not used as direct inputs to the magnetic-disturbance calculations.
RM3100-A and RM3100-B were installed at comparable wing locations. Each sensor was positioned approximately 1.45 m from the propulsion motor, 1.25 m from the ESC, 1.05 m from the battery, 0.85 m from the central power-distribution or wiring region, and 0.35 m from the nearest wing servo.
The tail-mounted RM3100-C had greater separation from the principal forward and central interference sources. Its approximate distances were 2.05 m from the motor, 1.75 m from the ESC, 1.45 m from the battery, 1.15 m from the power-distribution or wiring region, and 0.45 m from the nearest tail servo.
These separation distances are summarized in Table 7.
As shown in Table 7, RM3100-C had the greatest separation from the motor, ESC, battery, and central power-distribution region among the three tested positions. However, the measured magnetic response cannot be attributed to distance alone, because local cable geometry, servo activity, structural components, sensor orientation, and individual installation conditions may also affect the recorded field.
3.6. Data Acquisition and Synchronization System
A Jetson-based onboard logging architecture was used to acquire synchronized measurements from the three RM3100 magnetometers at a sampling frequency of 50 Hz. A common acquisition system was used to ensure direct sensor-to-sensor comparison under the same experimental conditions.
In addition to the magnetic measurements, propulsion current and battery voltage were acquired using the UAV onboard electrical monitoring system and synchronized with the magnetic measurements through the common experimental timeline. These electrical measurements were used primarily to characterize relative changes in propulsion loading across the tested throttle conditions. These measurements were acquired using the same time reference as the three RM3100 magnetometers to ensure temporal alignment between propulsion loading and magnetic response. The synchronized electrical and magnetic datasets were subsequently used to characterize the relationship between propulsion demand, measured electrical loading, and UAV-induced magnetic disturbance.
An independent GSMP-35U magnetometer (GEM Systems, Canada) was used to monitor ambient magnetic-field variations during the multi-level throttle experiments. The reference magnetometer was installed at a fixed stationary location approximately 40 m from the UAV in an open test area without known nearby magnetic-interference sources. Its position and orientation remained unchanged throughout the measurements. Reference measurements were acquired concurrently with the onboard RM3100 measurements and were time-aligned with the common experimental timeline. The reference measurements were used to characterize temporal variations in the ambient magnetic field and to support separation of UAV-induced magnetic disturbance from broader environmental magnetic-field variation. Because the reference magnetometer remained stationary throughout the experiment, it was used to characterize temporal ambient-field variation rather than heading-dependent effects.
In addition to the three-axis magnetic measurements, relevant UAV operating information was considered during data segmentation and interpretation. These parameters included UAV power state, propulsion activity, throttle condition, aircraft heading, and servo activity. Associating these operating states with the magnetic measurements enabled evaluation of the three sensor locations under defined UAV OFF/ON, throttle, heading, and servo-actuation conditions.
Synchronized acquisition was essential because the objective of the distributed configuration was to compare sensor locations under equivalent environmental and operational conditions. Time-aligned measurements reduce the possibility that apparent sensor-to-sensor differences result from unrelated temporal variations in the surrounding magnetic environment.
All comparative experiments were repeated under the same defined operating conditions to evaluate measurement variability and ensure consistent comparison among the three sensor locations. The number of repetitions for each test condition is reported with the corresponding statistical results.
The acquired datasets were subsequently used for calibration assessment, baseline-stability evaluation, UAV operating-state comparison, throttle-dependent disturbance analysis, servo-response analysis, heading-dependent evaluation, and overall sensor-location ranking. The corresponding experimental procedures, signal-processing methods, and comparison metrics are described in the following sections.
3.7. Statistical Analysis
Statistical analysis was performed to characterize the magnitude, variability, and relative differences of the magnetic disturbances measured by the three distributed RM3100 magnetometers. Because the sensors were operated simultaneously under the same experimental conditions, their responses were compared using identical acquisition, interval-selection, calibration, and filtering procedures.
Descriptive statistics, including the mean, standard deviation (SD), and peak-to-peak variation, were calculated for the principal experimental conditions. Repeated trials were used to quantify within-condition variability and measurement repeatability. The UAV OFF/ON, servo-actuation, heading, and flight-validation experiments were interpreted primarily using these descriptive measures and the relative response patterns observed among the three sensor configurations.
For the multi-level throttle experiment, each throttle level was independently repeated five times (n=5), and the retained condition-level results were expressed as mean ± SD. Pairwise comparisons among RM3100-A, RM3100-B, and RM3100-C were recalculated from these retained summary statistics using Welch’s two-sample t-test, which does not assume equal variances between the compared configurations. Although the three sensors were acquired synchronously, trial-level covariance was not used in this summary-statistic analysis; therefore, the original paired comparisons were not reconstructed.
At each throttle level, three pairwise comparisons were evaluated: RM3100-A versus RM3100-B, RM3100-A versus RM3100-C, and RM3100-B versus RM3100-C. To account for multiple comparisons within each throttle condition, Bonferroni correction was applied across the three pairwise tests. Statistical significance was assessed using two-sided tests at an overall significance level of (α = 0.05). Two-sided 95% confidence intervals were calculated for the corresponding differences in mean magnetic disturbance.
Because the study represents a controlled engineering characterization of a single fixed-wing UAV platform, the statistical results are interpreted within the investigated platform, sensor-installation geometry, and tested operating conditions rather than as population-level inference across UAV systems.
4. Theoretical Basis of Magnetic Interference Mechanisms
UAV-mounted magnetometers may be affected by static, dynamic, transient, and current-dependent disturbances generated by propulsion, power-distribution, control, electronic, and structural subsystems [7]. The magnitude of these effects depends on source characteristics, operating state, sensor-to-source distance and orientation, and the geometry of nearby wiring and structural components [7,8]. Because several subsystems operate simultaneously and often share common electrical paths, the measured disturbance generally represents a coupled platform response rather than the contribution of a single isolated source.
This section summarizes the physical mechanisms most relevant to the investigated fixed-wing UAV and establishes the theoretical basis for interpreting the OFF/ON, throttle, servo-actuation, and heading-dependent tests used in the experimental evaluation.
4.1. Propulsion Motor and ESC Interference
The propulsion motor and electronic speed controller (ESC) are major operational sources of magnetic and electromagnetic disturbance in electrically powered UAVs [7]. A brushless motor contains permanent magnets, current-carrying windings, and ferromagnetic components that can produce both static and time-varying magnetic fields. During operation, the magnitude and temporal characteristics of these fields vary with motor loading, rotational state, and electrical current.
The ESC regulates motor speed through rapid switching of the supplied electrical power. This switching generates time-varying currents and electromagnetic emissions whose magnitude depends on throttle level, motor loading, cable geometry, and sensor location [7]. Increasing throttle therefore affects not only the motor but also the ESC, battery, and high-current wiring, and the resulting magnetic response should be interpreted as a combined propulsion- and power-system effect rather than as an isolated motor contribution.
Spatial separation remains an important means of reducing propulsion-related contamination [8]. However, sensor-to-source distance alone does not determine the measured response because wiring routes, current-loop geometry, sensor orientation, structural materials, and nearby electronic components can also contribute [7].
4.2. Battery, Power Cables, and PDB Interference
The battery, power-distribution system, connectors, and high-current cables generate magnetic fields because they carry the current required by the propulsion and onboard systems [7]. These fields are inherently operating-state dependent and vary with propulsion demand and electrical load.
For a first-order approximation, the magnetic field generated by a current-carrying conductor increases with conductor current and decreases with increasing sensor-to-conductor separation. However, the actual magnetic disturbance also depends strongly on cable routing, conductor geometry, and the configuration of the supply and return current paths.
Magnetic contamination depends on current magnitude and cable geometry. Larger current loops can increase interference, while closely routed or twisted conductors can reduce it through partial field cancellation [7].
Power-system interference is also coupled to propulsion operation. Increasing throttle changes the current drawn from the battery and carried through the power-distribution network, making it difficult to separate motor-, ESC-, battery-, and wiring-related contributions using magnetometer measurements alone. Because such fields vary with operating condition, conventional static hard-iron and soft-iron calibration cannot fully remove them.
4.3. Servo-Induced Magnetic Disturbance
Servo actuators are localized magnetic sources because they contain electric motors, permanent magnets, current-carrying windings, gears, and metallic components [7]. Their influence is particularly relevant when a magnetometer is installed near a wing or tail control actuator.
Even when inactive, a servo may contribute a local static magnetic offset. During actuation, current flow and motor rotation can produce transient variations whose magnitude depends on sensor proximity, servo orientation, wiring, mechanical loading, and movement amplitude. In a fixed-wing UAV, this creates localized disturbance regions near the aileron, elevator, and rudder servos.
Servo effects are therefore best evaluated relative to a no-actuation baseline. Comparing wing-servo, tail-servo, and combined-actuation conditions enables the localized response of wing- and tail-mounted magnetometers to be assessed without assuming that servo disturbance is spatially uniform across the airframe.
4.4. Onboard Electronics Interference
Onboard electronic systems, including the autopilot, onboard processor, GNSS receiver, telemetry equipment, communication modules, voltage regulators, converters, and associated wiring, may generate localized electromagnetic disturbances [7]. Their operation involves current-carrying conductors, switching regulators, processors, oscillators, and digital communication circuits.
Low-power electronic modules may cause limited individual magnetic disturbances, but their combined effects can become significant. Switching power converters are particularly relevant due to their operating and installation-dependent emissions.
The influence of these systems can change simply by powering the UAV while leaving the propulsion motor inactive. Accordingly, comparison of UAV OFF and UAV ON conditions provides a practical means of evaluating the combined contribution of powered electronics, converters, and internal wiring before propulsion-related effects are introduced.
4.5. Structural and Ferromagnetic Effects
Structural and installation components can influence magnetic measurements even when they carry no electrical current. Metallic screws, hinges, connectors, control linkages, brackets, servo mechanisms, and other ferromagnetic components may introduce localized hard-iron effects [9]. Magnetically susceptible materials can also distort the ambient field and produce soft-iron effects, including scale changes, axis coupling, and orientation-dependent measurement errors [10].
Hard-iron contributions are approximately fixed in the sensor frame when the geometry of the installation remains unchanged. Consequently, their interaction with changes in UAV orientation can contribute to heading-dependent variation. Soft-iron effects similarly depend on the surrounding material configuration and are commonly reduced through three-axis calibration [9,10].
Small installation components can also affect magnetic measurements. Despite the composite airframe, local metallic parts, conductive materials, cable supports, and control linkages may introduce residual magnetic effects, while deformation or vibration can cause small time-varying variations.
4.6. Summary of Expected Interference Mechanisms
The main UAV magnetic interference sources are the motor and ESC, battery and power wiring, servos, onboard electronics, and structural components, each producing different current-dependent, transient, cumulative, or installation-related magnetic effects.
These sources are not independent. Motor operation changes battery and cable current, ESC activity is coupled to motor demand, servos draw current through the shared electrical system, and electronic modules operate through common power-distribution paths. The recorded disturbance should therefore be interpreted as the combined response of the installed UAV system.
Their temporal signatures also differ. Structural effects are predominantly static in the UAV frame, powered electronics may generate state-dependent offsets, propulsion and power systems produce throttle-dependent variations, servo actuation introduces transient responses, and changes in aircraft orientation can reveal residual heading-dependent effects.
The principal onboard components, their expected relative magnetic effects, dominant interference mechanisms, and corresponding placement considerations are summarized in Table 8. The qualitative effect levels in Table 8 represent theoretical expectations and should not be interpreted as direct measurements from the investigated UAV.
The qualitative impact levels presented in Table 8 represent expected relative contributions based on component type and physical proximity. They are not direct measurements of magnetic-field disturbance and are provided only for interpretation of possible interference sources.
As summarized in Table 8, the propulsion motor, ESC, battery, and high-current wiring are expected to produce the strongest operational magnetic disturbances, whereas servo actuators, onboard electronics, and structural components generally produce more localized, transient, or installation-dependent effects. Because these sources are electrically and physically coupled, the measured UAV-induced magnetic disturbance should be interpreted as a combined platform response rather than as independent contributions from individual subsystems.
These theoretical considerations provide the basis for the experimental tests adopted in this study. UAV OFF/ON comparisons are used to assess the influence of powered onboard electronics, throttle tests evaluate the combined propulsion- and current-dependent response, servo-actuation tests characterize localized transient disturbance, and heading tests examine orientation-dependent behavior. The corresponding experimental procedures, signal-processing methods, and evaluation metrics are described in the following section.
5. Experimental Procedures and Data Analysis
This section describes the experimental procedures and data-analysis methods used to evaluate UAV-induced magnetic disturbance and the influence of magnetometer placement. The methodology includes off-airframe sensor calibration, installed UAV OFF/ON testing, propulsion and throttle testing, servo-actuation testing, heading-dependent evaluation, and comparative assessment of the three distributed RM3100 magnetometers.
The RM3100 magnetometers were calibrated before installation on the UAV platform using off-airframe measurements. The calibration procedure was applied to compensate for sensor bias and scale-related errors before evaluating UAV-induced magnetic disturbances. The same calibration procedure was applied to all three sensors to ensure consistent comparison among the tested installation configurations.
All three sensors were processed using identical calibration, filtering, interval-selection, and statistical-analysis procedures, enabling direct comparison of the two wing-mounted sensors and the tail-mounted sensor under equivalent operating conditions. The purpose of each experimental scenario is summarized in Table 9.
The filtering procedure was applied consistently to all RM3100 datasets before statistical evaluation. The same filtering parameters were used for RM3100-A, RM3100-B, and RM3100-C to preserve comparability among the three sensor-location configurations.
The scenarios listed in Table 9 were evaluated using synchronized RM3100 measurements and consistent processing procedures. During the multi-level throttle experiments, propulsion electrical parameters, including current, voltage, and power, were recorded synchronously with the magnetic measurements. Throttle command was therefore used to define the operating condition, while the measured propulsion current was used to quantify the corresponding electrical loading and to evaluate its relationship with the magnetic disturbance.
5.1. Measurement Model
The magnetic vector recorded by an installed UAV magnetometer can be represented as the combination of the Earth’s magnetic field, the sensor orientation relative to that field, UAV-induced disturbance, residual sensor- and platform-related bias, and measurement noise. The measured magnetic vector can therefore be expressed as
where is the measured magnetic-field vector, is the attitude-dependent rotation matrix, is the Earth magnetic-field vector, is the UAV-induced magnetic disturbance expressed in the sensor frame, is the residual sensor- and platform-related bias, and η(t) represents measurement noise.
Equation (1) is used as a measurement decomposition and does not impose a linear physical model on . The UAV-induced disturbance term represents the aggregate contribution of the propulsion motor, ESC, battery and power wiring, servo actuators, onboard electronics, structural components, and their interactions. It may therefore include nonlinear, transient, switching-related, and eddy-current contributions in addition to approximately current-dependent effects. The linear current–magnetic regression used later in this study is an empirical characterization of the tested quasi-steady throttle conditions and is not intended as a complete physical model of UAV-induced magnetic interference.
The calibrated magnetic-field magnitude was used as the principal comparison variable. This reduces dependence on an individual sensor axis while retaining variations associated with calibration residuals, UAV operating state, sensor location, and orientation-dependent platform effects.
5.2. Sensor Calibration and Signal Processing
calibrated individually away from the UAV. The purpose of this procedure was to reduce sensor bias, scale-factor mismatch, axis-related errors, and magnetic distortions present during the calibration procedure before evaluating the additional disturbances introduced after integration with the UAV. The calibration included hard-iron bias correction, soft-iron compensation, and three-axis ellipsoid fitting [9,11].
The calibrated magnetic-field vector was obtained from
where is the raw magnetometer vector, is the hard-iron bias vector, A is the correction matrix representing soft-iron, scale-factor, axis-misalignment, and non-orthogonality effects, and is the calibrated magnetic-field vector.
Ellipsoid fitting was used to estimate the calibration parameters by modeling the raw three-axis measurements as
where x is the raw magnetic-measurement vector, Q is a symmetric matrix defining the ellipsoid shape and orientation, p represents the translation term, and c is a scalar constant [10,11].
Because this calibration was performed away from the UAV, it was not assumed to compensate completely for magnetic effects introduced after final installation on the airframe. Local structural materials, mounting hardware, wiring, nearby electronic components, sensor-to-airframe alignment, and other installation-dependent effects may introduce additional hard-iron- or soft-iron-like distortions after mounting. These residual effects were therefore treated as part of the installed sensor–airframe response and were evaluated through the subsequent UAV OFF/ON, throttle, servo-actuation, heading-dependent, and sensor-position experiments.
Residual off-axis sensitivity, axis misalignment, and non-orthogonality were not independently quantified after calibration. Any remaining contribution from these effects was consequently included in the residual response of the complete installed configuration rather than interpreted as an independently isolated interference component.
After calibration, the magnetic-field magnitude at sample i was calculated as
where , and are the calibrated magnetic-field components at sample i. The resulting magnitude was used for baseline-stability assessment and subsequent UAV operating-state comparisons.
Short-duration fluctuations were reduced using a moving-average filter,
where is the filtered magnetic-field magnitude and M is the moving-window length.
The moving-average window length was evaluated using M=1, 5, 10, and 20 samples. The principal disturbance trends and relative ordering of the three sensor configurations remained consistent across the evaluated window lengths. A window length of M=10 samples, corresponding to 0.20 s at the 50 Hz sampling frequency, was retained for the main analysis.
The same calibration and filtering procedure was applied to RM3100-A, RM3100-B, and RM3100-C to preserve comparability among the three installation configurations. The moving-average filter was used to reduce short-duration measurement fluctuations and improve the consistency of stability assessment; it was not intended to remove persistent or operating-state-dependent UAV magnetic disturbances.
Unless otherwise specified, the subsequent comparative disturbance metrics were evaluated using the calibrated magnetic-field magnitude after application of the common M=10 moving-average processing procedure. This included mean responses, standard deviations, peak-to-peak variations, and the retained disturbance metrics associated with UAV OFF/ON, throttle, heading, and servo-actuation tests. Accordingly, transient servo-related responses reported later in the study represent disturbances within the common processed-data framework rather than unfiltered instantaneous signal extrema.
5.3. UAV OFF and UAV ON Tests
UAV OFF and UAV ON tests were performed to quantify the magnetic change caused by powering the onboard electrical and electronic systems while keeping the propulsion motor inactive.
In the UAV OFF condition, the installed UAV and magnetometers were present but the onboard electrical systems were unpowered. This condition represented the background associated with the ambient environment, airframe structure, sensor installation, and unpowered components. In the UAV ON condition, the autopilot, onboard processor and logging system, communication equipment, converters, and associated electronics were powered while the propulsion motor remained inactive.
The OFF–ON response was calculated as
where and are the mean calibrated magnetic-field magnitudes measured under UAV ON and UAV OFF conditions, respectively.
Each condition was repeated three times. For every repetition, a stable 10 s interval was selected after the target state had been reached, corresponding to approximately 500 samples per sensor at 50 Hz. The same interval-selection and processing procedures were applied to all three magnetometers.
5.4. Motor and Throttle Tests
Throttle tests were conducted to evaluate the magnetic response associated with propulsion activity and increasing power demand. The nose-mounted propulsion system was operated at six throttle-command levels: 15%, 30%, 50%, 70%, 85%, and 100%. At each throttle level, synchronized magnetic measurements were recorded simultaneously from the three RM3100 magnetometers together with the available propulsion electrical parameters. Each throttle condition was maintained for 10 s, and a stable analysis interval was selected after the target operating state had been reached. Identical time intervals and processing procedures were applied to all three RM3100 datasets to ensure direct comparison among the sensor configurations.
Each throttle level was independently repeated (n = 5) times, and the reported throttle-dependent responses represent the mean ± standard deviation across these repeated trials.
The measured response represents the combined contribution of the motor, ESC, battery current, power-distribution components, and high-current wiring. Because these sources are physically and electrically coupled, the response was not attributed exclusively to the motor or ESC.
Synchronized propulsion-current measurements were acquired during the multi-level throttle experiments together with the RM3100 magnetic measurements. Accordingly, throttle command was used to define the propulsion operating state, while measured current provided a direct indicator of the corresponding electrical loading. The current measurements were subsequently used to evaluate the relationship between propulsion loading and magnetic disturbance. However, because the motor, ESC, battery, power-distribution system, and high-current wiring are physically and electrically coupled, the measured magnetic response should be interpreted as the combined response of the propulsion and power system rather than as the isolated magnetic contribution of motor current alone.
Lower magnetic variation at a given throttle condition was interpreted as lower sensitivity of the corresponding sensor location to propulsion- and power-related interference.
5.5. Servo-Actuation Tests
Servo-actuation tests were performed to characterize transient magnetic disturbance associated with control-surface movement. Four operating conditions were evaluated: no-servo activity, wing-servo actuation, tail-servo actuation, and combined wing-and-tail servo actuation.
The no-servo condition served as the baseline. Wing-servo tests primarily evaluated the response of the wing-mounted magnetometers to nearby actuator activity, whereas tail-servo tests assessed the sensitivity of RM3100-C to tail-control actuation. The combined condition represented simultaneous or collective servo activity.
Each condition was repeated five times using synchronized acquisition from the three sensors. Servo-induced disturbance was quantified as the maximum absolute deviation from the pre-actuation baseline,
where is the calibrated magnetic-field magnitude during servo actuation and is the mean magnetic-field magnitude before actuation. The absolute form accounts for both positive and negative transient responses relative to the baseline.
This metric captures both positive and negative transient excursions and enables direct comparison of servo sensitivity among the three installation locations.
5.6. Heading-Dependent Tests
Heading-dependent tests were conducted to characterize residual orientation-related magnetic variation of the installed sensor–airframe system. The UAV was evaluated at eight discrete heading orientations from 0° to 315° in 45° increments while synchronized three-axis magnetic measurements were recorded from the three RM3100 magnetometers.
At each heading, the UAV was held approximately stationary for 5 s, after which the mean calibrated magnetic-field magnitude was calculated over the corresponding stable interval. The same heading sequence, acquisition procedure, filtering parameters, and stable-interval selection were applied to all three sensors to preserve comparability among the installation configurations.
effects, sensor-axis imperfections, sensor-to-airframe alignment, local installation asymmetry, cable routing, structural materials, and interactions between the Earth’s magnetic field and magnetic sources fixed within the UAV frame [9,10]. Such effects may remain measurable after off-airframe calibration because installation on the UAV introduces additional platform-dependent magnetic influences.
Heading-dependent variation was quantified using the peak-to-peak range,
where ψ is the UAV heading angle and is the mean calibrated magnetic-field magnitude during the stable interval at heading ψ. The heading associated with the maximum baseline-subtracted response was also recorded for each sensor configuration.
A lower was interpreted as lower residual orientation-dependent variability of the corresponding installed configuration. However, this metric represents the combined response of the sensor, mount, local airframe environment, and platform-fixed magnetic sources and therefore does not isolate a single interference mechanism.
Because the analysis was based primarily on calibrated magnetic-field magnitude, rather than on a complete vector magnetic-compensation model, the heading test was used to characterize residual angular sensitivity rather than to identify individual vector-interference coefficients. In addition, the three sensors occupied spatially separated positions on the airframe; therefore, a contribution from local spatial non-uniformity of the ambient magnetic field during UAV rotation cannot be completely excluded.
The heading-dependent results are consequently interpreted as the residual orientation response of the tested installed sensor–airframe configurations under the experimental conditions, rather than as a purely intrinsic property of the RM3100 sensors or as the effect of a single onboard interference source.
5.7. Comparative Disturbance Metrics
The three RM3100 installation configurations were compared using statistical and disturbance-related metrics calculated from the calibrated magnetic-field magnitude. The principal metrics included mean magnetic-field magnitude, standard deviation, peak-to-peak range, UAV OFF–ON response, throttle-dependent variation, servo-induced disturbance, and heading-dependent variation.
The mean magnetic-field magnitude was calculated as
where is the calibrated magnetic-field magnitude at sample i, N is the total number of samples, and B̄ is the mean calibrated magnetic-field magnitude.
Measurement stability was quantified using the sample standard deviation,
where is the standard deviation of the calibrated magnetic-field magnitude. A lower indicates lower variation around the interval mean and therefore greater measurement stability.
The peak-to-peak range was calculated as
where Bmax and Bmin are the maximum and minimum calibrated magnetic-field magnitudes within the selected interval, respectively. This metric retains large transient or operating-state-dependent variations that may not be fully represented by the standard deviation alone.
Calibration and filtering performance was quantified using the percentage reduction in standard deviation,
where is the stability improvement percentage, is the standard deviation of the raw measurements, and is the residual standard deviation after calibration or filtering. For the improvement values reported in Table 12, corresponds to the standard deviation after filtering.
The three RM3100 configurations were compared directly using the measured disturbance metrics in their original physical units. Standard deviation, peak-to-peak variation, UAV OFF–ON response, throttle-dependent disturbance, servo-induced disturbance, and heading-dependent variation were evaluated independently. No normalization-based composite index or weighted disturbance score was used to determine the final relative ranking.
For the independent-reference validation, the temporally aligned GSMP-35U measurements were used to characterize and remove the common time-varying component of the ambient magnetic field from each onboard magnetometer record. Because the absolute magnetic-field magnitude measured by the stationary reference differed from that measured by the onboard sensors, only the reference variation relative to its own mean was removed.
The reference-corrected magnetic-field magnitude for onboard sensor i was calculated as
where is the reference-corrected magnetic-field magnitude for onboard sensor i, is the measured magnetic-field magnitude of the corresponding onboard RM3100 sensor, is the temporally aligned magnetic-field magnitude measured by the stationary GSMP-35U reference magnetometer, and is the mean reference-field magnitude over the corresponding analysis interval.
This procedure removes the common time-varying environmental component while preserving the mean magnetic-field level of each onboard sensor. Reference correction was used only as an independent environmental validation procedure and was not used to redefine the primary UAV-induced disturbance metrics.
A complete sensor–position crossover test was also performed to distinguish sensor-unit-specific behavior from installation-position effects. RM3100-A, RM3100-B, and RM3100-C were each evaluated at the two wing positions and the tail position under the same principal disturbance categories used in the original installed comparison. The resulting measurements were compared to determine whether the relative disturbance pattern followed the individual RM3100 unit or remained associated with the physical installation position.
The study was designed as a controlled engineering characterization of a single UAV platform rather than as a population-level experiment. Repeated measurements were used primarily to characterize within-condition variability and repeatability under the tested operating states. The resulting disturbance comparisons are therefore interpreted within the investigated UAV platform, installation geometry, and experimental conditions.
5.8. Experimental Workflow and Verification Checklist
The experimental workflow was designed to progressively distinguish intrinsic sensor-related effects from magnetic disturbances introduced after integration with the UAV. The three RM3100 magnetometers were first calibrated individually away from the airframe and were subsequently installed at two wing locations and one tail location. Installation geometry, nearby electronic and electromechanical components, cable routing, servo proximity, and approximate sensor-to-source separation distances were documented before the installed measurements.
Following installation, the three sensor configurations were evaluated under a common sequence of controlled operating conditions, including UAV OFF/ON states, multi-level throttle operation, servo actuation, and heading variation. During the throttle experiments, propulsion current, voltage, and magnetic measurements were acquired synchronously. The three RM3100 datasets were processed using the same calibration framework, filtering parameters, interval-selection criteria, and disturbance metrics to preserve consistency among the tested configurations.
A complete 3×3 sensor–position crossover experiment was subsequently conducted to separate sensor-unit-specific behavior from installation-position effects. RM3100-A, RM3100-B, and RM3100-C were each evaluated at P1 (Wing 1), P2 (Wing 2), and P3 (Tail), yielding nine sensor–position combinations. The same principal disturbance categories used in the original installed comparison were considered during the crossover evaluation, including filtered baseline variability, UAV OFF–ON response, throttle-dependent response, heading-dependent variation, and servo-induced disturbance.
The crossover design was used to determine whether the relative magnetic-disturbance pattern followed the individual RM3100 unit or remained associated with the physical installation position. Because small differences associated with remounting, local sensor orientation, structural surroundings, and wiring geometry cannot be completely excluded during physical sensor exchange, the crossover results were interpreted as controlled evidence of placement dependence rather than as an exact isolation of position from all mounting-related factors.
The measured disturbance metrics were then used to compare wing-to-wing and wing-to-tail performance and to establish the relative magnetic-disturbance level of the tested installation configurations. The study was therefore structured as a controlled engineering characterization of the investigated UAV platform rather than as a population-level comparison across UAV systems.

Table 10.
Summary of the experimental campaign and corresponding evaluation objectives.
| Test | Objective | Experimental condition |
| calibration | Baseline characterization | Offset and variability |
| UAV OFF/ON | Electronics assessment | OFF–ON variation |
| Throttle test | Propulsion assessment | Response vs throttle |
| Current correlation | Load assessment | Current–magnetic relation |
| Heading test | Orientation assessment | Heading sensitivity |
| Servo test Sensor swap Flight test |
Actuator assessment Placement validation Airborne validation |
Transient response Sensor vs position Repeat-line stability |
Table 11 distinguishes the procedures completed in the present study from additional validation steps recommended for a broader operational airborne magnetic-survey workflow.
The repeat-line flight test provided the airborne stability and repeatability results reported in Section 6.9, while the independent stationary reference magnetometer provided an additional check on ambient temporal magnetic-field variation during the controlled throttle experiments. Ground-run/taxi testing and broader operational flight validation across additional airspeeds, altitudes, headings, propulsion loads, and environmental conditions are retained as recommended extensions for future work.
The complete experimental campaign therefore combined sensor-level calibration, installed operating-state characterization, distributed multi-location comparison, sensor–position crossover validation, synchronized electrical measurements, independent environmental reference monitoring, and repeat-line airborne evaluation. The corresponding results are presented in Section 6.
5.9. Descriptive Metrics and Uncertainty Interpretation
The statistical framework used in this study is described in Section 3.7. The purpose of the present section is therefore limited to clarifying how the retained descriptive metrics were interpreted when comparing the three installed RM3100 configurations.
For each evaluated operating condition, magnetic responses were characterized primarily using the mean, standard deviation, and peak-to-peak range of the processed magnetic-field magnitude. The mean was used to describe the central response of a sensor configuration, the standard deviation was used to characterize within-condition variability, and the peak-to-peak range was used to retain the total observed disturbance excursion within the corresponding analysis interval.
For repeated experimental conditions, reported mean ± SD values represent the variability among the retained repeated measurements for that condition unless otherwise stated. These values are interpreted as experimental repeatability summaries and not as estimates of instrument-manufacturer accuracy or absolute measurement uncertainty.
Inferential statistical comparisons were not applied uniformly to all experimental datasets. As described in Section 3.7, the multi-level throttle experiment was subjected to pairwise Welch’s two-sample t-tests using the retained condition-level summary statistics, with Bonferroni adjustment for the three pairwise comparisons at each throttle level. The corresponding two-sided 95% confidence intervals describe uncertainty in the estimated differences between the compared condition means.
The UAV OFF/ON, servo-actuation, heading-dependent, crossover, reference-validation, and flight-validation results were interpreted primarily using retained descriptive statistics and relative response patterns. No unsupported inferential statistics were reconstructed for datasets for which the required trial- or sample-level records were unavailable.
Because the experiments were conducted on a single fixed-wing UAV platform with a specific sensor-installation geometry, the reported variability and statistical comparisons characterize the investigated configuration and tested operating conditions. They should not be interpreted as population-level uncertainty bounds applicable to RM3100 sensors or UAV platforms in general
Table 12.
Statistical and descriptive metrics used in the comparative analysis.
| Metric | Definition | Purpose |
| Mean Standard deviation (SD) Peak-to-peak range Mean ± SD 95% confidence interval |
Central response Measurement variability Total observed excursion Repeated-condition summary Uncertainty of pairwise mean difference |
Condition-level comparison Stability and repeatability Disturbance magnitude Trial-to-trial variability Throttle comparisons only |
5. Flight Validation and Repeat-Line Analysis
Following the controlled ground-based experiments, the three installed RM3100 configurations were evaluated during airborne operation using repeated outbound and reciprocal flight passes. The purpose of this flight-validation stage was to determine whether the relative stability ranking observed during the controlled ground experiments remained evident under dynamic airborne conditions.
Magnetic measurements acquired during the flight-validation campaign were processed using the same calibration and filtering framework applied to the ground-based measurements. Airborne magnetic variability was characterized descriptively using the standard deviation and peak-to-peak range of the calibrated magnetic-field magnitude for each sensor configuration.
Repeat-line consistency was additionally evaluated using retained root-mean-square error (RMSE) summaries derived from the repeated flight-line measurements. Lower RMSE values were interpreted as greater repeat-line consistency among the evaluated configurations.
Because the detailed sample-level spatial co-registration records used for the original repeat-line calculation are no longer available, the retained RMSE values are interpreted as descriptive engineering repeatability metrics rather than as precisely reconstructed spatially co-registered survey errors. No new sample-level RMSE analysis was reconstructed for the present revision.
Similarly, detailed per-pass flight parameters such as exact altitude, airspeed, trajectory deviation, and propulsion loading were not available in the retained summary records. The airborne results are therefore used as a limited validation of the relative behavior of the three installation configurations under the tested flight campaign, rather than as a controlled assessment of the independent effects of individual flight parameters.
6. Results
This section presents the measured magnetic responses of the three distributed RM3100 configurations. The numerical results were obtained from the calibration and installed UAV OFF/ON tests, multi-level throttle and synchronized electrical-loading experiments, servo-actuation and heading-dependent tests, sensor-swap validation, independent-reference measurements, and repeat-line flight validation. Consistent processing procedures were applied to the synchronized datasets as described in Section 5.
The results are organized from platform-level spatial interpretation and baseline stability to operating-state-dependent disturbance and overall sensor-location comparison.
6.1. Experimental UAV Configuration and RM3100 Sensor Locations
The investigated puller fixed-wing UAV contained a nose-mounted propulsion motor and ESC, a battery and power-distribution region along the fuselage, centrally located onboard electronics, and servo actuators distributed across the wing and tail sections. This layout produced different spatial relationships between the principal onboard interference sources and the three magnetometers.
RM3100-A and RM3100-B were installed at two wing-mounted locations, whereas RM3100-C was installed near the tail. The two wing sensors had comparable nominal separation from the forward propulsion system but differed in local wiring, servo proximity, structural fittings, and installation conditions. RM3100-C had greater separation from the motor, ESC, battery, and central power-distribution region but remained exposed to nearby tail-control components.
This arrangement enabled direct wing-to-wing comparison between RM3100-A and RM3100-B and wing-to-tail comparison with RM3100-C. The annotated platform layout provides the spatial context required for interpreting the measured responses presented below.
6.2. Graphical Interpretation of Interference Sources on the Experimental UAV
The physical layout of the UAV indicates that the nose and central fuselage contain the principal propulsion-, power-, and electronics-related interference sources. The nose-mounted motor and ESC form the dominant forward interference region, as illustrated qualitatively in Figure 4.
The propulsion-related disturbance is expected to decrease with increasing separation from the nose, although the actual response also depends on wiring geometry, structural components, and local installation conditions.
A second interference region is associated with the battery and high-current power paths distributed along the forward and central fuselage, as illustrated in Figure 5.
Unlike a localized motor source, power-related magnetic effects may extend along the current-carrying paths and depend on current magnitude, cable routing, loop geometry, and sensor-to-wire separation.
The concentration of processing, control, communication, and power-conversion electronics within the central fuselage creates an additional composite interference region, illustrated in Figure 6.
Localized interference regions are also associated with the wing and tail servos, as illustrated in Figure 7.
These sources are relevant because RM3100-A and RM3100-B are installed near wing-control regions, while RM3100-C is positioned near tail-control components.
The combined spatial relationship among the propulsion, power, electronic, and servo-related sources and the three magnetometers is summarized in Figure 8.
The overlays in Figure 4, Figure 5, Figure 6, Figure 7 and Figure 8 are qualitative representations based on component layout and experimental response patterns; they are not direct continuous magnetic-field maps of the airframe. Quantitative evidence for location-dependent disturbance is provided by the measurements in Section 6.3, Section 6.4, Section 6.5, Section 6.6, Section 6.7 and Section 6.8.
6.3. Calibration and Baseline Stability Results
Baseline stability was evaluated before comparing the sensors under different UAV operating conditions. The raw standard deviations were 342 nT for RM3100-A, 365 nT for RM3100-B, and 156 nT for RM3100-C.
After individual hard-iron, soft-iron, and ellipsoid-based calibration, the standard deviations decreased to 82, 94, and 41 nT, respectively. Application of the common moving-average filter further reduced the residual standard deviations to 58 nT for RM3100-A, 64 nT for RM3100-B, and 29 nT for RM3100-C. These values correspond to reductions of 83.0%, 82.5%, and 81.4% relative to the raw measurements.
The resulting baseline stability metrics are summarized in Table 13.
Values represent standard deviation calculated over the selected stable measurement interval after applying the same processing procedure for all sensors.
Calibration and filtering substantially reduced measurement variation for all three sensors. RM3100-C retained the lowest absolute standard deviation at each processing stage, whereas RM3100-B exhibited the highest residual variation. Because each sensor remained fixed to one installation location, these results represent the combined sensor–mount–location configurations rather than location effects alone.
The reduced standard deviation values indicate improved measurement stability after calibration and filtering; however, the remaining variability reflects the combined effect of sensor characteristics, installation conditions, and residual platform-related disturbances.
6.4. UAV OFF–ON Magnetic Response
Powering the onboard electrical and electronic systems while keeping the propulsion motor inactive produced measurable magnetic shifts at all three sensor locations.
The mean UAV OFF–ON variations were 46 nT for RM3100-A, 58 nT for RM3100-B, and 24 nT for RM3100-C. The corresponding comparison is shown in Figure 9.
The repeated measurements showed consistent responses across the three trials, with the lowest variability observed for RM3100-C.
RM3100-C showed the lowest response, while RM3100-B exhibited the largest shift, indicating that similar wing locations were not magnetically equivalent due to local wiring, electronics, servo proximity, or mounting effects. OFF–ON variations were smaller than throttle-induced responses, showing that onboard electronics contributed to magnetic disturbance but were not the dominant factor.
6.4.1. Quantitative Evaluation of OFF–ON Magnetic Response
The UAV OFF–ON experiment was conducted to quantify the magnetic response associated with activation of the onboard electrical and electronic systems while the propulsion motor remained inactive. Each operating state was repeated three times using the same acquisition, interval-selection, calibration, and filtering procedures.
The mean OFF–ON magnetic variations were 46 nT for RM3100-A, 58 nT for RM3100-B, and 24 nT for RM3100-C. These measurements showed a consistent ordering among the three tested configurations: RM3100-B exhibited the largest response, RM3100-A showed an intermediate response, and RM3100-C exhibited the smallest variation.
The observed changes indicate that activation of the onboard avionics, processing unit, communication equipment, converters, and associated power-distribution circuitry introduced measurable magnetic disturbances at all three sensor locations. The lower response observed for RM3100-C is consistent with reduced sensitivity of the tail-mounted configuration to the powered onboard subsystems under the investigated installation geometry. However, the differences among the three configurations should not be attributed to sensor-to-source distance alone, because local wiring geometry, electronic-component proximity, servo location, structural components, and mounting conditions may also contribute to the measured response.
The OFF–ON variations were substantially smaller than those observed during propulsion operation. At maximum throttle, the measured magnetic disturbances reached 430 nT for RM3100-A, 485 nT for RM3100-B, and 185 nT for RM3100-C, compared with the corresponding OFF–ON variations of 46, 58, and 24 nT. This difference indicates that activation of the onboard electronics contributed to the overall magnetic environment, while the combined propulsion and power system produced a substantially larger operational disturbance under the tested configuration.
The quantitative OFF–ON results are summarized in Table 14.
The statistical results indicate that onboard electrical and electronic activation caused measurable changes in the magnetic field at all three sensor locations. Among the evaluated locations, RM3100-B exhibited the largest response, while RM3100-C showed the smallest variation.
The higher response observed at RM3100-B compared with RM3100-A suggests that nominally similar wing locations were not magnetically equivalent, likely due to local installation effects such as wiring arrangement, electronic component proximity, servo position, and mounting asymmetry.
Compared with the throttle-dependent disturbances, the OFF–ON variations remained smaller, confirming that propulsion-related effects represent the dominant operational contribution to UAV-induced magnetic interference.
6.5. Throttle-Dependent Magnetic Response
To further characterize the relationship between propulsion demand and magnetic disturbance, the UAV was tested at six throttle levels: 15%, 30%, 50%, 70%, 85%, and 100%. For each throttle condition, repeated measurements were obtained from all three RM3100 sensors. The reported values represent the mean response across repeated trials, while the associated variability was quantified using the standard deviation.
All three sensor configurations exhibited an approximately monotonic increase in magnetic disturbance with increasing throttle. RM3100-B showed the largest response over the tested throttle range, followed by RM3100-A, whereas RM3100-C consistently exhibited the lowest disturbance. This progressive response demonstrates that propulsion-related magnetic interference was not limited to maximum-throttle operation but increased continuously with propulsion demand.
ontent-type="color:white">The quantitative results confirm the ordering observed in Figure 10. RM3100-B exhibited the highest disturbance, RM3100-A showed intermediate behavior, and RM3100-C remained the least affected configuration across all tested throttle levels.
RM3100-B exhibited the highest magnetic response across the tested throttle range, RM3100-A showed intermediate behavior, and RM3100-C consistently retained the lowest disturbance. The throttle-dependent variations were also substantially larger than the UAV OFF–ON shifts for all three sensor configurations.
Synchronized current measurements enabled direct evaluation of electrical loading and magnetic disturbance. Because the propulsion and power components operate as a coupled system, the lower RM3100-C response indicates reduced sensitivity of the tail-mounted configuration to combined propulsion- and power-related interference under the tested conditions.
6.5.1. Statistical Evaluation of Throttle-Dependent Disturbance
Statistical evaluation of the throttle-dependent measurements was performed using the retained condition-level summary statistics reported in Table 15. Each throttle condition consisted of five repeated trials (n = 5), and the responses of RM3100-A, RM3100-B, and RM3100-C were compared using Welch’s two-sample t-test. Three pairwise comparisons were evaluated independently at each throttle level, and Bonferroni correction was applied to the corresponding p-values to control the family-wise error rate within each throttle condition.
The re-analysis showed statistically significant differences among all three RM3100 configurations across the tested throttle range after Bonferroni correction. The strongest separation was consistently observed between the tail-mounted RM3100-C and the two wing-mounted configurations. The mean difference between RM3100-B and RM3100-C increased from 84 nT at 15% throttle to 300 nT at 100% throttle, while the corresponding RM3100-A–RM3100-C difference increased from 60 nT to 245 nT.
Differences between RM3100-A and RM3100-B were smaller than the corresponding wing-to-tail differences but remained statistically significant at all six throttle levels. These results are consistent with the descriptive ordering reported in Table 15, in which RM3100-B exhibited the largest throttle-dependent magnetic response, RM3100-A showed an intermediate response, and RM3100-C consistently exhibited the lowest response.
The lower throttle-dependent response observed at the tail position is consistent with reduced sensitivity to the combined propulsion- and power-system magnetic disturbance under the investigated installation geometry. However, because the three mounting locations also differed in local wiring, servo proximity, structural components, and installation geometry, the observed differences should not be attributed to sensor-to-source distance alone.
The corresponding pairwise statistical results are summarized in Table 16.
The statistical analysis further supports systematic differences among the three installation configurations during throttle-dependent operation. The largest differences were observed between RM3100-C and the two wing-mounted configurations, particularly at higher throttle levels. The lower response of RM3100-C is consistent with its greater separation from the principal propulsion and power-related sources, although local wiring, servo proximity, structural components, and mounting geometry may also have contributed.
The comparison between RM3100-A and RM3100-B showed comparatively smaller differences, suggesting that the two wing locations were affected by similar interference sources, while local installation factors such as wiring arrangement, servo proximity, and mounting conditions contributed to the observed asymmetry.
Overall, the statistical results support the experimental findings that propulsion loading and sensor placement are coupled factors influencing UAV magnetic measurement stability.
The throttle-dependent results presented in this section constitute the primary operating-state comparison. Additional analyses based on the same multi-level throttle experiment are presented in Section 6.10 and Section 6.11. Section 6.10 evaluates the synchronized independent environmental reference, whereas Section 6.11 examines the relationship between measured propulsion electrical loading and the corresponding magnetic disturbance.
6.6. Servo-Induced Magnetic Disturbance Analysis
Servo-related disturbance was evaluated under no-servo, wing-servo, tail-servo, and combined-servo conditions. The no-servo state served as the baseline for identifying transient magnetic variations associated with actuator movement.
Wing-servo actuation caused maximum variations of 58 nT (RM3100-A) and 52 nT (RM3100-B), while tail-servo actuation produced 44 nT at RM3100-C, indicating sensitivity to nearby control components.
The four servo conditions are compared in Figure 11.
The results demonstrate the localized nature of servo-induced interference: the wing-mounted sensors were more responsive to wing-servo activity, whereas RM3100-C exhibited a distinct response to tail-servo actuation. Servo-induced variations were smaller than the maximum throttle-related disturbances but remain relevant during repeated control-surface activity. The lower standard deviation observed for RM3100-C also indicates more consistent responses during repeated tail-servo actuation compared with the wing-mounted configurations.
6.7. Heading-Dependent Disturbance Evaluation
All three RM3100 configurations exhibited measurable orientation-dependent magnetic variation across the tested UAV headings. The peak-to-peak heading responses were 145 nT for RM3100-A, 118 nT for RM3100-B, and 62 nT for RM3100-C.
RM3100-A and RM3100-B exhibited their maximum baseline-subtracted responses at approximately 135°, whereas RM3100-C reached its maximum response at approximately 180°. The complete baseline-subtracted heading-dependent response across the evaluated orientations is presented later in Section 6.12 and Figure 23.
For comparison with the propulsion-related response of the three original installation configurations, Figure 12 presents the retained magnetic disturbances measured at the lowest and highest evaluated throttle levels.
Among the three original installed configurations, RM3100-A exhibited the largest heading-dependent variation, RM3100-B showed an intermediate response, and RM3100-C exhibited the lowest peak-to-peak heading variation. The lower angular variation observed for RM3100-C indicates greater orientation-dependent stability under the tested configuration.
The throttle comparison shown in Figure 12 provides additional operating-state context for the heading results. The magnetic responses at 100% throttle were substantially larger than the corresponding heading-dependent peak-to-peak variations for all three configurations, indicating that propulsion-related operation produced a larger disturbance magnitude under the tested conditions.
The observed heading dependence should not, however, be attributed to sensor orientation alone. Residual hard-iron and soft-iron effects, sensor-to-airframe alignment, local installation asymmetry, cable routing, structural materials, and interactions between platform-fixed magnetic sources and the Earth’s magnetic field may all contribute to the measured response [9,10]. Because the three sensors were installed at spatially separated locations, a contribution from local spatial non-uniformity of the ambient magnetic field during UAV rotation also cannot be completely excluded.
Accordingly, the heading-dependent measurements are interpreted as the residual angular response of the complete installed sensor–mount–airframe configurations rather than as an intrinsic heading sensitivity of the RM3100 units themselves or as the effect of a single interference source.
The heading-dependent peak-to-peak responses and maximum servo-related variations are summarized in Table 17.
RM3100-C therefore exhibited the lowest heading-dependent variation among the three original installed configurations. Nevertheless, its measurable servo-induced response shows that the tail location was not free from local magnetic interference, particularly from nearby actuator activity. The results indicate that heading-dependent and servo-induced disturbances represent distinct but installation-dependent components of the overall magnetic response.
6.8. Sensor-Swap Validation of Placement Effect
To distinguish installation-position effects from sensor-unit-specific behavior, a complete sensor–position crossover experiment was performed. The three RM3100 magnetometers (A, B, and C) were each evaluated at all three installation positions: P1 (Wing 1), P2 (Wing 2), and P3 (Tail), resulting in a complete 3×3 sensor–position matrix.
The crossover measurements were evaluated using the same principal disturbance metrics considered in the original installed configuration, including filtered baseline variability, UAV OFF–ON response, low- and maximum-throttle response, heading-dependent variation, and servo-induced disturbance. This design enabled assessment of whether the measured disturbance pattern followed the individual RM3100 unit or remained associated with the installation position.
Figure 13.
Crossover/sensor-swap validation of RM3100-A, RM3100-B, and RM3100-C across the three
installation positions. The panels show, from left to right, filtered baseline standard deviation, UAV OFF–ON
response, and 100% throttle response in the top row, followed by heading-dependent peak-to-peak variation
and maximum servo-induced disturbance in the bottom row. Error bars represent the retained variability
summaries associated with the corresponding measurements.
Figure 13.
Crossover/sensor-swap validation of RM3100-A, RM3100-B, and RM3100-C across the three
installation positions. The panels show, from left to right, filtered baseline standard deviation, UAV OFF–ON
response, and 100% throttle response in the top row, followed by heading-dependent peak-to-peak variation
and maximum servo-induced disturbance in the bottom row. Error bars represent the retained variability
summaries associated with the corresponding measurements.
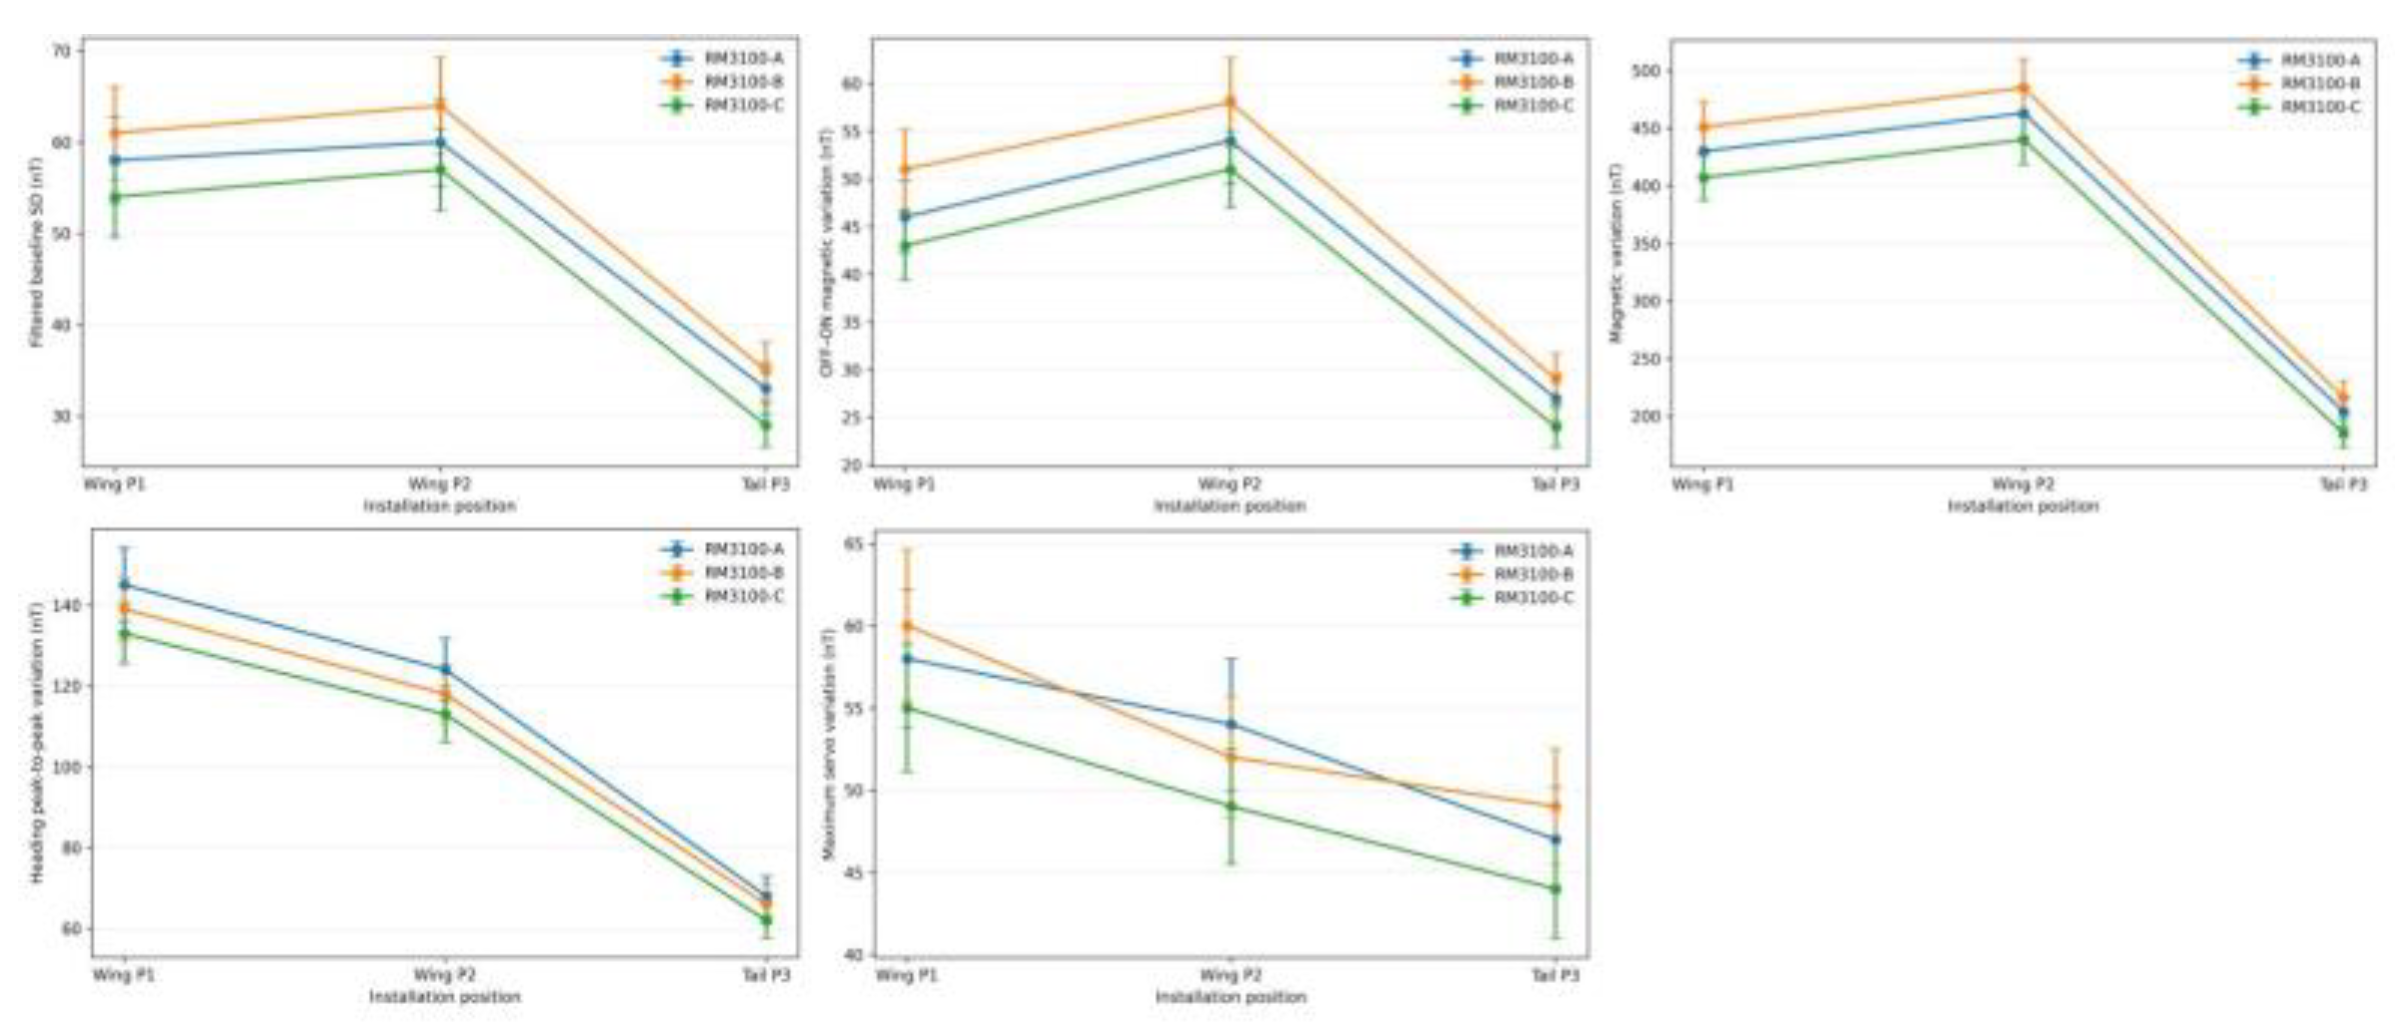
The crossover results showed a consistent position-dependent pattern across the five retained disturbance metrics: filtered baseline variability, UAV OFF–ON response, 100% throttle response, heading-dependent peak-to-peak variation, and maximum servo-induced disturbance. Regardless of which RM3100 unit was installed at P3 (Tail), the measured disturbances were generally lower than those obtained at P1 and P2. Although differences remained among individual sensor units and remounting conditions, the overall disturbance pattern remained more strongly associated with installation position than with sensor identity.
Table 18.
Crossover sensor–position results for the three RM3100 magnetometers evaluated at the three installation positions. Values are reported as mean ± SD where repeated measurements were available.
Table 18.
Crossover sensor–position results for the three RM3100 magnetometers evaluated at the three installation positions. Values are reported as mean ± SD where repeated measurements were available.
| Installation Position | RM3100 | Filtered Baseline SD (nT) | OFF-ON ΔB (nT) | 15% Throttle ΔB (nT) | 100% Throttle ΔB (nT) | Heading P-P (nT) | Max Servo ΔB (nT) | |
| P1 – Wing 1 P1 – Wing 1 P1 – Wing 1 P2 – Wing 2 P2 – Wing 2 P2 – Wing 2 P3 – Tail P3 – Tail P3 – Tail |
A B C A B C A B C |
58 ± 4.7 61 ± 5.1 54 ± 4.4 60 ± 4.8 64 ± 5.3 57 ± 4.5 33 ± 2.8 35 ± 3.1 29 ± 2.4 |
46 ± 3.8 51 ± 4.2 43 ± 3.6 54 ± 4.5 58 ± 4.7 51 ± 4.0 27 ± 2.5 29 ± 2.7 24 ± 2.1 |
112 ± 7.6 121 ± 8.4 105 ± 7.1 129 ± 8.9 136 ± 9.8 120 ± 8.1 59 ± 4.8 63 ± 5.1 52 ± 4.2 |
430 ± 20.9 451 ± 22.5 407 ± 19.6 463 ± 23.4 485 ± 24.7 440 ± 21.6 204 ± 13.5 216 ± 14.4 185 ± 12.1 |
145 ± 9.1 139 ± 8.0 133 ± 7.5 124 ± 7.8 118 ± 7.2 113 ± 6.9 68 ± 4.9 66 ± 4.7 62 ± 4.3 |
58 ± 4.2 60 ± 4.6 55 ± 3.9 54 ± 4.0 52 ± 3.7 49 ± 3. 547 ± 3.2 49 ± 3. 544 ± 3.0 |
|
The position-dependent behavior is particularly evident in the throttle results. At 100% throttle, RM3100-A decreased from 430 nT at P1 and 463 nT at P2 to 204 nT at P3. RM3100-B decreased from 451 and 485 nT at the two wing positions to 216 nT at the tail, while RM3100-C decreased from 407 and 440 nT to 185 nT. Thus, the lower throttle-dependent response at the tail persisted regardless of which physical RM3100 unit occupied that position.
A similar position-dependent pattern was observed across the other retained disturbance metrics. The tail position exhibited lower filtered baseline variability, UAV OFF–ON response, heading-dependent variation, and maximum servo-induced disturbance than the two wing positions across the three RM3100 units. These results provide strong experimental evidence that installation position was a major contributor to the measured magnetic disturbance within the investigated UAV configuration.
The crossover experiment also reduced the possibility that the favorable response originally observed for the tail-mounted RM3100-C resulted solely from intrinsic characteristics of that particular sensor unit. However, the experiment does not completely isolate physical position from all installation-related factors. Small differences associated with remounting, sensor orientation, local wiring geometry, structural surroundings, and nearby components may remain. The crossover findings are therefore interpreted as strong evidence of placement-dependent behavior within the investigated UAV rather than as proof that installation position alone determines magnetic disturbance.
For the original installed configuration, the retained overall standard deviations were 74 nT for RM3100-A, 82 nT for RM3100-B, and 36 nT for RM3100-C. The corresponding overall peak-to-peak variations were 455, 510, and 205 nT, respectively.
RM3100-C exhibited the lowest overall standard deviation and peak-to-peak variation, whereas RM3100-B exhibited the highest values. A similar ordering was observed in the UAV OFF–ON and throttle-dependent tests. In the heading-dependent evaluation, however, RM3100-A exhibited the largest response, indicating that the relative behavior of the two wing-mounted configurations depended on the disturbance mechanism.
A summary of the retained ground-based stability metrics and relative behavior of the three original installation configurations is provided in Table 19.
Within the retained ground-based measurements, RM3100-C exhibited the lowest overall variability, RM3100-A showed intermediate values, and RM3100-B exhibited the highest values. No weighted composite score was used to derive this relative ranking.
Accordingly, the tail-mounted RM3100-C represented the lowest-variability configuration within the controlled ground-based experiments. Together with the 3×3 crossover results, this finding supports the interpretation that the tail position was associated with lower UAV-induced magnetic disturbance under the investigated airframe geometry and operating conditions. This ground-based ranking was subsequently evaluated using airborne measurements, independent-reference correction, and synchronized electrical-loading analysis rather than being treated as a final platform-wide conclusion at this stage.
6.9. Flight Validation and Repeat-Line Magnetic Stability
Ground-based measurements provided a controlled characterization of platform-induced magnetic disturbance; however, airborne operation introduced additional variability associated with aircraft motion, vibration, attitude changes, propulsion loading, and environmental conditions. The three original RM3100 installation configurations were therefore further evaluated during repeated airborne flight passes to determine whether the relative stability observed during the controlled ground experiments remained evident under flight conditions.
The ground-to-flight comparison is presented in Figure 14.
Airborne measurements exhibited greater magnetic variability than the corresponding ground-based measurements for all three configurations. The retained airborne standard-deviation summaries were 93.0 ± 4.2 nT for RM3100-A, 107.2 ± 6.0 nT for RM3100-B, and 48.4 ± 3.2 nT for RM3100-C, compared with corresponding ground values of 74, 82, and 36 nT.
Although the absolute variability increased during airborne operation, the relative ordering observed during the controlled ground experiments remained unchanged. RM3100-C exhibited the lowest airborne variability, RM3100-B the highest, and RM3100-A an intermediate response.
Repeated outbound and reciprocal flight passes were additionally evaluated to characterize flight-line repeatability. The corresponding pass-level standard-deviation summaries are shown in Figure 15.
The outbound standard deviations were 89.8, 102.4, and 46.0 nT for RM3100-A, RM3100-B, and RM3100-C, respectively. The corresponding reciprocal-pass values were 96.2, 112.0, and 50.8 nT. The absolute differences between the outbound and reciprocal standard-deviation summaries were therefore 6.4, 9.6, and 4.8 nT, respectively.
RM3100-C exhibited the lowest variability in both flight directions and the smallest outbound-to-reciprocal difference, whereas RM3100-B showed the highest values.
Repeat-line consistency was also characterized using the retained root-mean-square error (RMSE) summaries presented in Figure 16.
The retained repeat-line RMSE values were 72.1 ± 5.0 nT for RM3100-A, 83.4 ± 6.4 nT for RM3100-B, and 34.7 ± 3.7 nT for RM3100-C. RM3100-C therefore exhibited the lowest repeat-line RMSE among the three configurations, consistent with its lower airborne standard deviation and peak-to-peak variation.
Because the sample-level spatial co-registration records used in the original repeat-line analysis are no longer available, these retained RMSE values are interpreted as descriptive engineering repeatability metrics. They are not used to make claims regarding precisely reconstructed point-by-point spatial survey error.
The consolidated flight-validation results are summarized in Table 20.
Values containing ± represent retained variability summaries from the original flight analysis and were not recomputed from sample-level data during the present revision. Direction Difference represents the absolute difference between the reciprocal and outbound standard-deviation summaries.
The flight-validation results preserved the same relative stability ordering observed during the ground experiments. RM3100-C exhibited the lowest airborne standard deviation, peak-to-peak variation, repeat-line RMSE, and directional difference among the three tested configurations. RM3100-B generally exhibited the highest airborne variability, while RM3100-A showed intermediate performance.
These results provide supporting evidence that the lower-disturbance behavior of the tail-mounted configuration persisted during the investigated flight campaign. However, the airborne validation represents a limited engineering evaluation on a single UAV platform. Detailed per-pass altitude, airspeed, trajectory deviation, propulsion loading, and sample-level spatial registration information are not available in the retained records. The flight results should therefore be interpreted as a comparative validation of the three tested installation configurations rather than as a controlled assessment of the independent effects of individual flight parameters.
6.9.1. Statistical Evaluation of Flight Measurements
Statistical evaluation of the flight-validation measurements was performed using the retained descriptive summaries of the airborne datasets. Because the flight measurements were obtained under dynamic operating conditions involving simultaneous variation in aircraft motion, attitude, propulsion loading, and environmental conditions, the analysis focused on measurement variability and repeatability rather than inferential comparison of fixed experimental states.
The principal statistical descriptors used for the flight evaluation were standard deviation, peak-to-peak variation, repeat-line RMSE, and outbound-to-reciprocal variability. These metrics were evaluated consistently for RM3100-A, RM3100-B, and RM3100-C to compare the relative stability of the three original installation configurations.
Across the retained flight-validation metrics, RM3100-C exhibited the lowest variability, RM3100-B generally exhibited the highest variability, and RM3100-A showed intermediate behavior. This ordering was consistent with the overall pattern observed during the controlled ground-based experiments.
The flight results are interpreted descriptively within the investigated UAV platform and flight campaign. No new inferential statistics or confidence intervals were reconstructed from the flight data during the present revision because the sample-level flight records required for such re-analysis are not available.
6.10. Independent Reference Validation
An independent stationary GSMP-35U magnetometer was used during the multi-level throttle experiment to assess whether the magnetic variations observed by the onboard RM3100 configurations were accompanied by common temporal variations in the ambient magnetic field. The reference measurements were acquired concurrently with the onboard measurements and were time-aligned with the common experimental timeline.
The synchronized magnetic responses of the three onboard RM3100 configurations and the independent reference are presented in Figure 17.
Across the evaluated throttle sequence, the onboard RM3100 configurations exhibited clear step-like increases in magnetic response as propulsion demand increased. In contrast, the independent reference record did not exhibit the same throttle-correlated stepwise pattern. This difference provides supporting evidence that the dominant throttle-dependent variations observed by the onboard sensors were associated with the UAV operating state rather than with a common temporal variation in the ambient magnetic field.
The effect of reference-based correction on the overall magnetic variability of each onboard configuration was evaluated by removing the synchronized time-varying component measured by the independent reference. The resulting standard deviations before and after correction are compared in Figure 18.
Reference correction produced modest reductions in the overall standard deviation of all three configurations. RM3100-C retained the lowest residual variability after correction, and the relative ordering of the three original installation configurations remained unchanged.
The relationship between throttle-dependent onboard magnetic response and the independent environmental reference is further illustrated in Figure 19.
The onboard configurations showed progressively increasing magnetic disturbance with increasing throttle, whereas the independent reference did not show a corresponding throttle-dependent increase. The reference measurement therefore supports the interpretation that the dominant stepwise responses observed onboard were primarily associated with changes in UAV propulsion and electrical operating state under the tested conditions.
The quantitative effect of independent-reference correction is summarized in Table 21.
Reference correction reduced the retained overall standard deviation by 4.2%, 3.9%, and 8.9% for RM3100-A, RM3100-B, and RM3100-C, respectively. These relatively modest reductions show that removal of the common time-varying reference component did not substantially alter the relative disturbance pattern among the three onboard configurations. RM3100-C remained the lowest-variability configuration after reference correction.
Because no separate standalone stability characterization of the GSMP-35U was performed within the present experimental campaign, the independent reference is interpreted here as a synchronized environmental monitor rather than as an independently quantified noise or stability standard. Accordingly, the reference-validation results are used as supporting evidence for distinguishing common temporal environmental variation from UAV operating-state-dependent magnetic changes.
6.11. Current–Magnetic Correlation and Electrical Loading Effects
As an additional analysis of the multi-level throttle experiment presented in Section 6.5, synchronized electrical measurements were evaluated to characterize the relationship between propulsion loading and magnetic disturbance. Because throttle command alone does not directly quantify electrical loading, measured current and voltage were used to characterize the corresponding propulsion demand. The measured current, voltage, power, motor speed, and magnetic responses are summarized in Table 22.
Motor current increased substantially with throttle, reaching approximately 108 A at 100% throttle, while battery voltage decreased with increasing electrical load. The magnetic response increased concurrently with propulsion demand, providing experimental evidence of a strong association between electrical loading and UAV-induced magnetic disturbance.
The synchronized electrical response of the propulsion system across the tested throttle levels is shown in Figure 20.
Propulsion current increased progressively with throttle, whereas battery voltage decreased as the electrical load increased. This behavior confirms that throttle command was strongly associated with the actual propulsion electrical demand during the experiment.
To directly evaluate the relationship between propulsion electrical loading and magnetic disturbance, the measured propulsion current was compared with the magnetic response of each RM3100 configuration, as shown in Figure 21.
Linear regression was performed using six condition-level mean points corresponding to the six tested throttle levels. Each regression point consisted of the mean measured propulsion current and the corresponding mean magnetic response for that throttle condition. The five repeated trials at each throttle level were used to calculate the condition mean and standard deviation and were not treated as independent regression observations.
A strong approximately linear relationship was observed between propulsion current and magnetic disturbance for all three configurations. The fitted slopes were 3.334 nT/A for RM3100-A, 3.668 nT/A for RM3100-B, and 1.389 nT/A for RM3100-C, with coefficients of determination of 0.997, 0.994, and 0.994, respectively. These coefficients of determination describe the linearity of the condition-level mean responses across the tested quasi-steady throttle range and should not be interpreted as trial-level or sample-level predictive performance. The lower slope of RM3100-C indicates substantially lower sensitivity to propulsion-current-induced magnetic disturbance.
Table 23.
Linear regression parameters describing the relationship between measured propulsion current and magnetic disturbance for the three RM3100 configurations.
Table 23.
Linear regression parameters describing the relationship between measured propulsion current and magnetic disturbance for the three RM3100 configurations.
| Configuration | Slope | |
| RM3100-A RM3100-B RM3100-C |
3.334 nT/A 3.668 nT/A 1.389 nT/A |
0.997 0.994 0.994 |
The temporal correspondence between propulsion current and the magnetic responses is shown in Figure 22.
To illustrate the temporal correspondence between propulsion loading and magnetic response, Figure 22 presents a representative synchronized time series processed using the same moving-average procedure applied in the main analysis.
The magnetic responses increased synchronously with the stepwise increases in propulsion current. The temporal agreement between electrical loading and magnetic disturbance further supports the interpretation that propulsion-current-related effects were a major source of the observed operating-state-dependent magnetic variation.
6.12. Combined Interpretation of Heading and Servo Effects
The heading-dependent results summarized in Section 6.7 are presented here in greater numerical detail. The UAV was evaluated at 45° intervals from 0° to 315°, and the corresponding baseline-subtracted magnetic responses are shown in Figure 23.
Figure 23.
Detailed heading-dependent magnetic response of the three original RM3100 installation configurations. Points represent the retained mean baseline-subtracted responses, and error bars indicate ±1 SD.
Figure 23.
Detailed heading-dependent magnetic response of the three original RM3100 installation configurations. Points represent the retained mean baseline-subtracted responses, and error bars indicate ±1 SD.
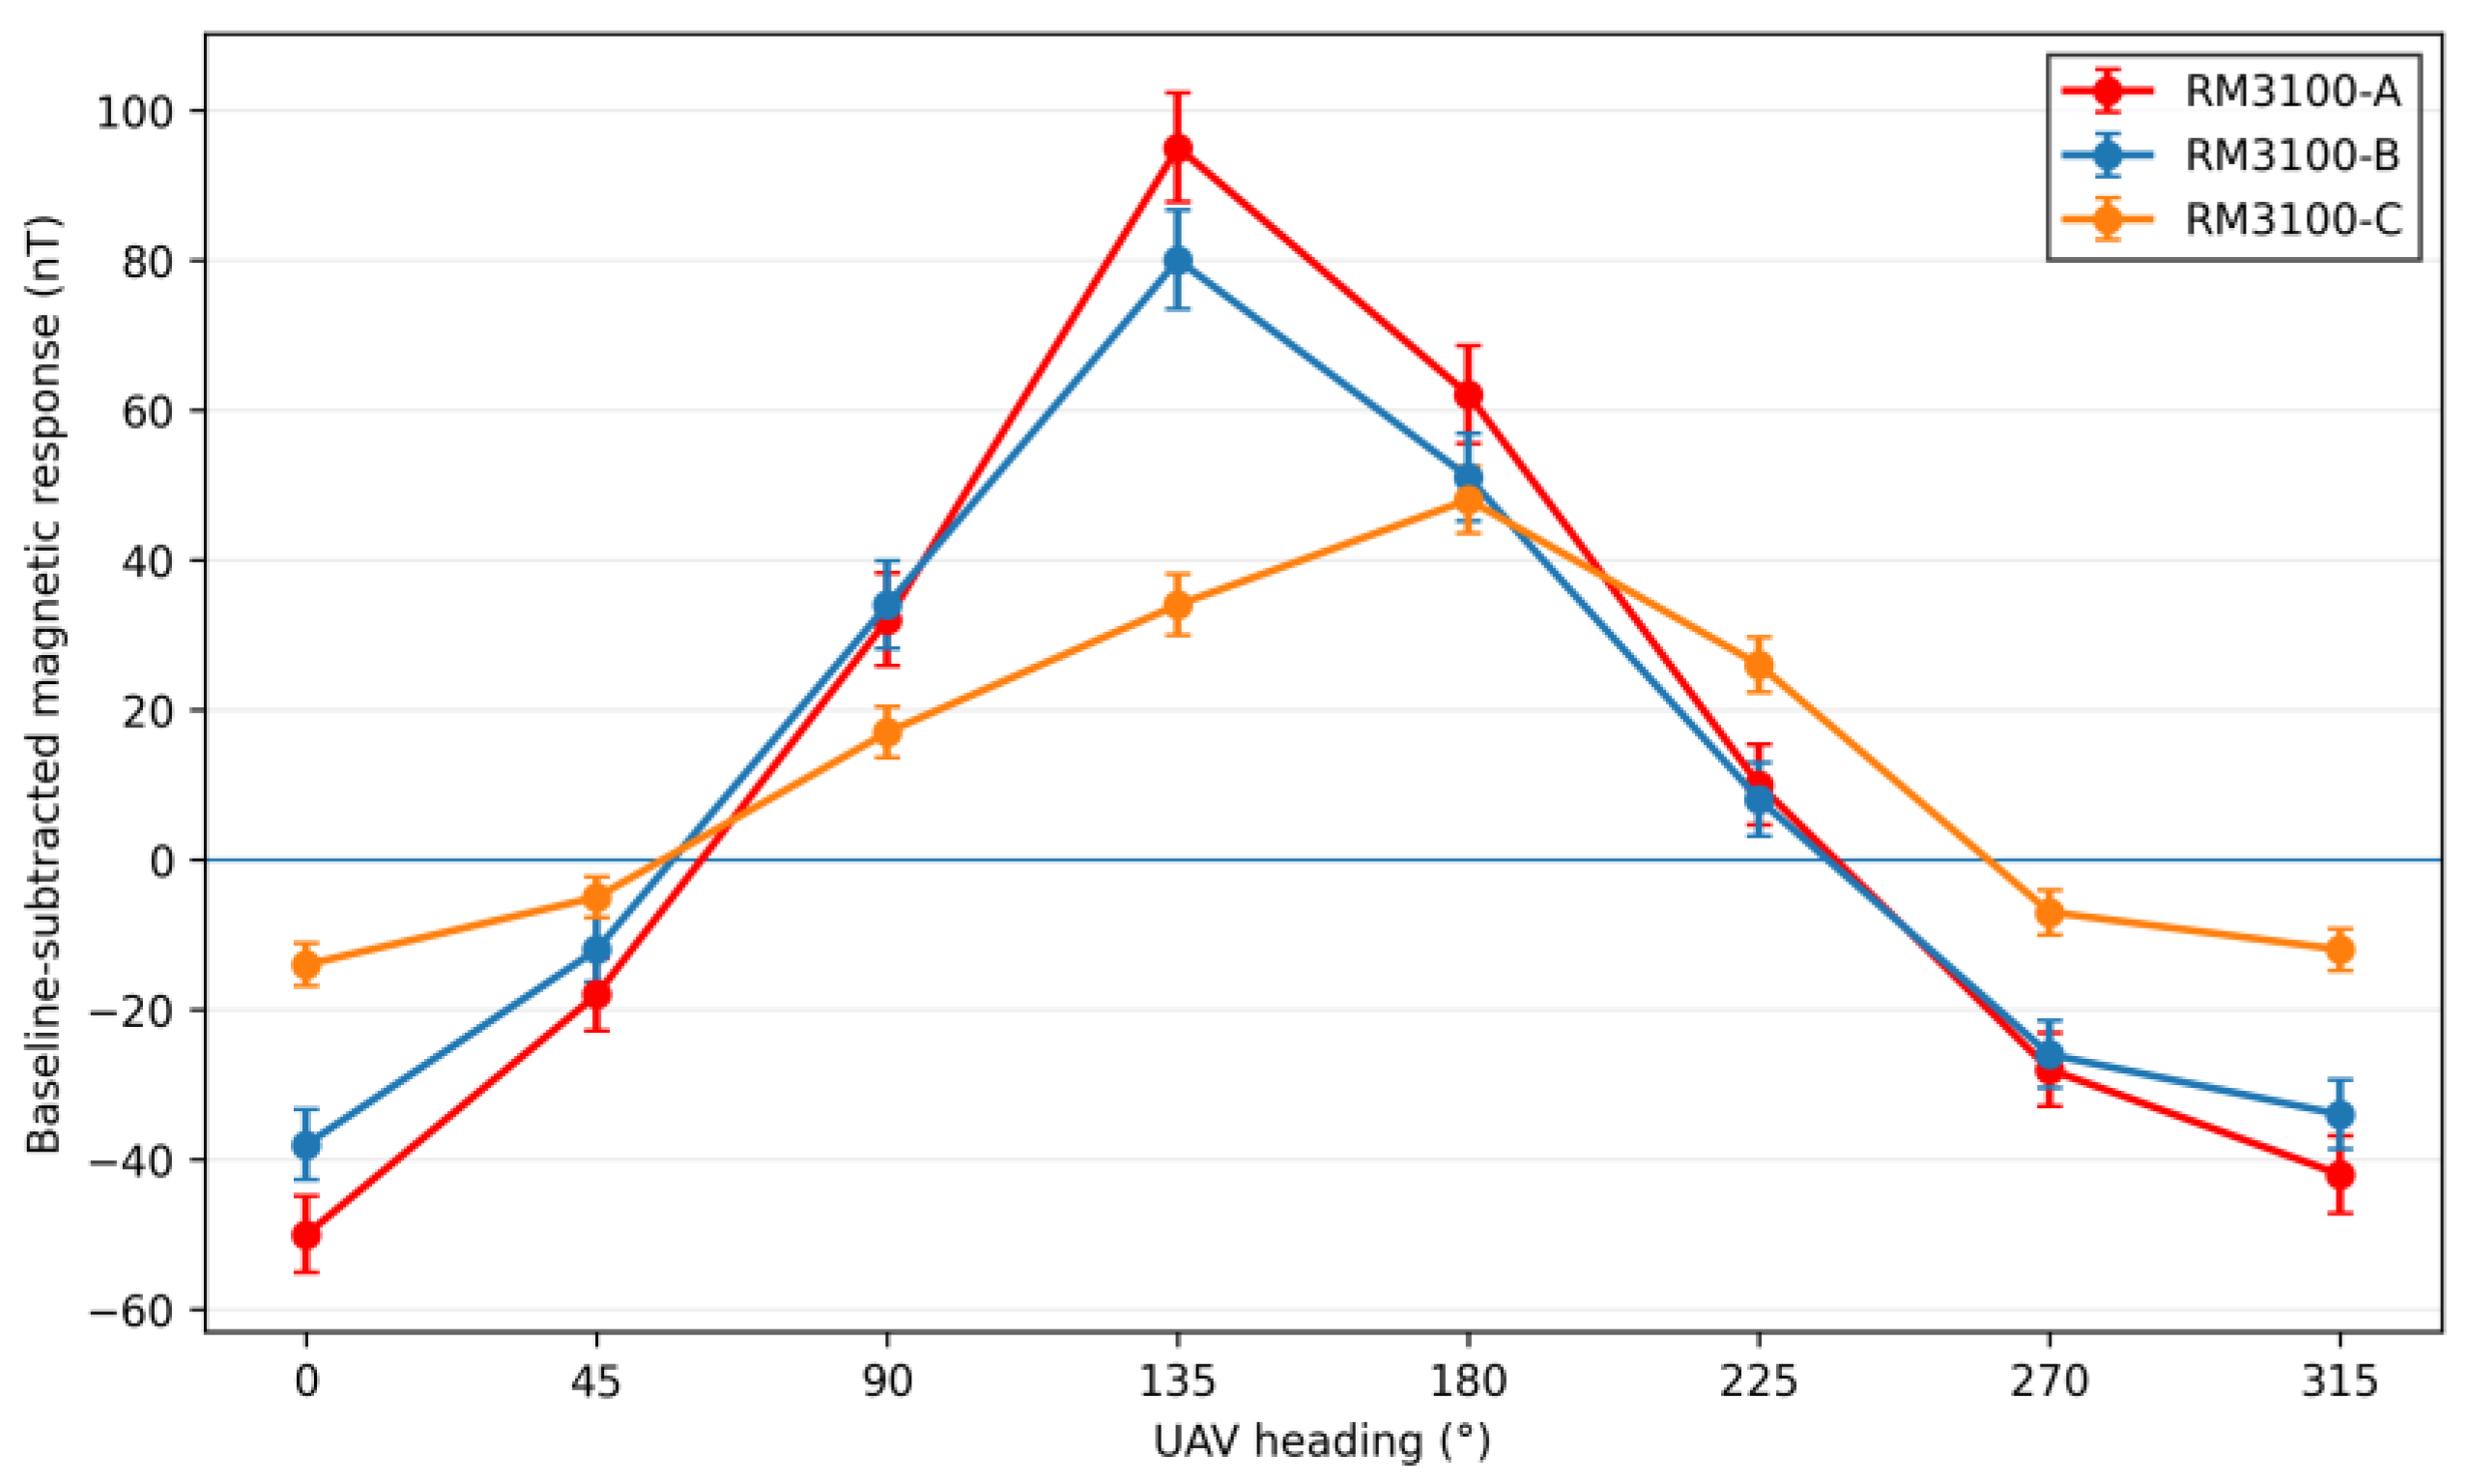
The detailed heading results were consistent with the peak-to-peak comparison reported in Section 6.7. RM3100-A exhibited the largest angular variation, followed by RM3100-B, whereas RM3100-C showed the lowest overall heading-dependent variation. RM3100-A and RM3100-B exhibited their maximum baseline-subtracted responses near 135°, while the maximum response of RM3100-C occurred near 180°.
The numerical heading-dependent responses obtained at each tested orientation are summarized in Table 24.
The heading response was not uniform among the three installed configurations. Based on the retained mean responses in Table 24, the corresponding peak-to-peak ranges were 145 nT for RM3100-A, 118 nT for RM3100-B, and 62 nT for RM3100-C, consistent with the summary results reported in Section 6.7.
These differences represent the residual angular response of the complete installed sensor–mount–airframe configurations and should not be interpreted as intrinsic heading sensitivity of the RM3100 units alone. Residual calibration effects, installation geometry, wiring, local magnetic materials, and interaction between platform-fixed magnetic sources and the Earth’s magnetic field may all contribute to the observed angular response.
The servo-actuation results summarized in Section 6.6 are likewise presented here in greater detail. Four operating conditions were considered: no-servo activity, wing-servo actuation, tail-servo actuation, and combined wing-and-tail servo actuation. The corresponding magnetic responses are presented in Figure 24.
Wing-servo actuation produced the largest responses at the two wing-mounted configurations, with magnetic deviations of 58 nT for RM3100-A and 52 nT for RM3100-B. RM3100-C exhibited a considerably smaller response of 18 nT under the same condition.
During tail-servo actuation, RM3100-C exhibited the largest response, reaching 44 nT, whereas RM3100-A and RM3100-B showed lower responses of 21 and 19 nT, respectively. The opposite spatial response observed during wing- and tail-servo actuation is consistent with the localized influence of the corresponding control-surface actuators.
Under combined-servo actuation, the measured responses were 55 nT for RM3100-A, 49 nT for RM3100-B, and 41 nT for RM3100-C. These responses remained substantially above the corresponding no-servo values, although combined actuation did not necessarily produce the maximum disturbance for every sensor configuration.
The detailed servo-actuation results are summarized in Table 25.
The results indicate a clear location-dependent actuator response. The wing-mounted configurations were most sensitive to wing-servo activity, whereas the tail-mounted configuration exhibited its strongest response during tail-servo actuation. This behavior supports the interpretation that servo-induced magnetic interference was spatially localized within the investigated installation geometry.
To further illustrate the temporal behavior observed during servo actuation, representative processed magnetic-response profiles are presented in Figure 25.
The representative profiles show transient magnetic variations during the servo-actuation intervals, followed by a return toward the baseline level. The relative behavior is consistent with the localized sensitivity observed in the controlled servo tests. These profiles are interpreted qualitatively and are not used to infer precise command-to-response timing.
7. Discussion
The experimental results show that magnetic measurement performance depended on both UAV operating state and sensor installation configuration. Although identical calibration, filtering, and analysis procedures were applied to all three RM3100 magnetometers, their responses differed under baseline, UAV OFF/ON, throttle, servo-actuation, and heading-dependent conditions.
Overall, the tail-mounted RM3100-C exhibited the lowest disturbance across most evaluated metrics, whereas the two wing-mounted sensors showed greater sensitivity to propulsion and power activity, local actuator effects, and orientation-dependent variation. The following subsections interpret these differences in relation to sensor separation, component distribution, installation asymmetry, and previous UAV magnetometry studies.
7.1. Why Did the Tail-Mounted Sensor Perform Better?
The improved performance of RM3100-C is primarily consistent with its greater separation from the main forward and central interference sources. In the investigated puller configuration, the propulsion motor and ESC were concentrated near the nose, while the battery, power-distribution components, high-current wiring, and onboard electronics were located mainly along the fuselage.
As reported in Section 3.5, RM3100-C was farther from the motor, ESC, battery, and central power-distribution region than RM3100-A and RM3100-B. Increased separation from localized onboard magnetic sources is a well-established physical strategy for reducing platform-induced interference [8,22,23].
The operating-state measurements support this interpretation. RM3100-C showed the smallest UAV OFF–ON shift, indicating lower sensitivity to powered onboard electronics and internal wiring. It also exhibited the lowest magnetic disturbance across the complete tested throttle range from 15% to 100%, indicating consistently lower sensitivity to increasing propulsion loading than the two wing-mounted configurations.
The synchronized electrical measurements further supported the relationship between propulsion loading and magnetic disturbance. Magnetic variation increased approximately linearly with measured propulsion current for all three configurations, with RM3100-C exhibiting a substantially lower current–magnetic response slope than the two wing-mounted configurations. This finding is consistent with the reduced sensitivity of the tail-mounted configuration to propulsion- and power-related magnetic interference. However, the relationship should not be interpreted as the isolated magnetic effect of motor current, because changes in propulsion current occur simultaneously with changes in motor operation, ESC activity, battery loading, and current flow through the power-distribution system and high-current wiring. The throttle- and current-dependent measurements therefore represent the coupled response of the propulsion and power subsystem. Their substantially larger magnitude compared with the UAV OFF–ON shifts indicates that propulsion- and power-related effects were the dominant operating-state-dependent disturbance among the tested conditions.
RM3100-C also exhibited the lowest heading-dependent peak-to-peak variation. Greater separation from platform-fixed magnetic sources may have reduced orientation-dependent interaction between the UAV magnetic environment and the Earth’s field.
The tail location was not free from local interference. Tail-servo actuation produced a measurable response because RM3100-C remained near the tail-control components. Nevertheless, this localized effect did not alter the overall lower-disturbance pattern observed for the tail-mounted configuration under the tested conditions.
These results should not be interpreted as evidence that tail mounting is universally optimal. Tail-servo location, wiring, metallic control linkages, structural materials, and exact mounting geometry remain important and must be evaluated for each airframe.
7.2. Interpretation of Wing-to-Wing Differences
RM3100-A and RM3100-B were installed at nominally comparable wing locations and had similar approximate separation from the main propulsion and power components. Despite this similarity, their magnetic responses were not identical.
RM3100-B exhibited higher UAV OFF–ON, throttle-dependent, overall standard-deviation, and overall peak-to-peak values than RM3100-A. In contrast, RM3100-A showed the larger heading-dependent variation. This result demonstrates that nominal sensor-to-source distance alone is insufficient to describe the magnetic behavior of an installed sensor.
Local wiring asymmetry is one plausible contributor. Current-induced magnetic disturbance depends not only on separation but also on cable routing, loop area, connector geometry, and the relative position of current-carrying conductors [7,24]. Differences in servo position, control linkages, metallic fittings, or sensor mounting may also have contributed to the observed wing-to-wing asymmetry.
Residual installation-related orientation effects may further explain the different heading responses. Slight differences in sensor alignment, local soft-iron distortion, or the relationship between the sensor and UAV coordinate frames can produce non-identical heading-dependent behavior even after off-airframe calibration [9,10].
The contrasting behavior of RM3100-A and RM3100-B indicates that different interference mechanisms affected the two wing locations differently. RM3100-B appeared more sensitive to powered and propulsion-related states, whereas RM3100-A exhibited stronger orientation-dependent variation.
This comparison demonstrates the value of distributed sensing, because measurements from a single wing location would not reveal whether the opposite wing behaved similarly. In the primary installed comparison, each RM3100 was initially associated with a specific sensor–mount–location configuration. The subsequent crossover/sensor-swap experiment provided additional evidence that the observed disturbance pattern was more strongly associated with installation position than with individual RM3100 sensor identity. Nevertheless, residual sensor-specific, mounting, orientation, and local installation effects cannot be completely excluded. The results should therefore be interpreted as strong evidence for a placement-dependent effect within the investigated airframe rather than as proof that sensor position alone determines the measured disturbance.
7.3. Recommended Placement for the Investigated Puller Fixed-Wing UAV
Among the three tested configurations, RM3100-C provided the most favorable overall magnetic stability performance. It exhibited the lowest residual baseline variation, UAV OFF–ON shift, low- and maximum-throttle responses, heading-dependent variation, overall standard deviation, and overall peak-to-peak range.
The recommendation is therefore based on a consistent pattern across multiple complementary disturbance metrics rather than on a single test. For the investigated puller fixed-wing UAV, the tail-mounted RM3100-C configuration exhibited the lowest magnetic disturbance among the three evaluated configurations.
This conclusion is strictly limited to the investigated airframe, propulsion layout, wiring arrangement, servo locations, sensor mounts, and tested operating conditions. The two wing-mounted locations may still be useful for distributed measurements, gradient estimation, or redundancy, but they require more careful assessment of local wiring, servo proximity, mounting orientation, and heading-dependent effects.
Other configurations, including nose-boom, true wingtip, extended tail-boom, or suspended installations, were not experimentally evaluated and should not be ranked using the present dataset.
7.4. Design Implications for Similar Puller Fixed-Wing UAVs
For puller fixed-wing UAVs with layouts similar to the investigated platform, locations farther from the nose-mounted propulsion system and central power-distribution region are reasonable initial candidates for magnetometer installation [6,8,25]. However, geometric separation alone should not determine the final placement.
High-current supply and return conductors should be routed close together and, where practical, twisted to reduce current-loop area and external magnetic fields [7]. Power wiring should also be kept away from the selected magnetometer location, and unnecessary cable loops or asymmetric current paths should be avoided.
Servo proximity should be assessed separately from propulsion-system separation. A location distant from the motor and ESC may still experience transient disturbance if it lies close to an active control-surface actuator. Installed servo tests should therefore be included before operational magnetic measurements.
The results also show that conventional hard-iron and soft-iron calibration is insufficient as a standalone placement-verification procedure. Calibration reduces intrinsic sensor distortion but does not remove disturbances that change with throttle, electrical load, servo activity, electronics state, or aircraft orientation [7]. Installed OFF/ON, throttle, servo, and heading tests should therefore complement sensor-level calibration.
Distributed magnetometers can be particularly useful during platform development because candidate locations can be compared simultaneously under common environmental and operating conditions. After identifying the lowest-disturbance location, the final configuration may use a single selected sensor or retain multiple sensors depending on the measurement objective.
These implications should be transferred cautiously to other aircraft because changes in propulsion architecture, battery position, wiring, airframe materials, actuator arrangement, and payload integration can substantially alter the onboard magnetic environment.
7.5. Comparison with Previous Studies
The present findings are consistent with previous studies emphasizing physical separation and sensor placement as important strategies for reducing UAV-induced magnetic disturbance [6,8,26,27]. The lower overall disturbance observed at RM3100-C supports the general principle that increasing separation from concentrated propulsion and power sources can improve measurement stability.
The strong throttle-dependent response is also consistent with previous work identifying motors, ESCs, batteries, and current-carrying wiring as important operational interference sources [7]. In the present experiments, throttle operation produced substantially larger magnetic variations than powering the onboard electronics alone, supporting the importance of propulsion- and current-dependent effects.
The measured servo and heading responses further show that the UAV magnetic response is operating-state and orientation dependent. Static calibration improved baseline stability but did not eliminate transient actuator effects or heading-dependent variation, reinforcing the need for installed testing in addition to off-airframe calibration [7,16,28].
The three-sensor distributed configuration extends conventional single-location evaluation by enabling direct wing-to-wing and wing-to-tail comparison. This made it possible to identify both the lower overall disturbance at the tail location and the non-identical behavior of the two wing locations.
The principal contribution of the present work is therefore not a new magnetic-compensation algorithm, but an experimental framework for interference-aware sensor-placement assessment on a puller fixed-wing UAV. Direct quantitative comparison with other studies remains limited because platform geometry, sensor type, sensor-to-source distance, operating conditions, processing methods, and reported metrics vary substantially across the literature.
8. Limitations and Future Work
This study provides a controlled comparison of three RM3100 installation configurations on a single puller fixed-wing UAV. Therefore, the quantitative disturbance levels and relative performance of the tested configurations should not be generalized to other UAV platforms without platform-specific validation.
First, only one UAV platform was evaluated. The investigated aircraft had a specific nose-mounted propulsion system, airframe geometry, battery position, wiring layout, servo arrangement, and structural configuration. Other fixed-wing, pusher, multirotor, or VTOL platforms may therefore exhibit different absolute disturbance levels and different preferred sensor locations.
Second, only three installation locations were tested: two wing positions and one tail position. The results identify the most favorable location only among these three configurations. True wingtip, nose-boom, extended tail-boom, and other external mounting arrangements were not evaluated.
Third, although the crossover/sensor-swap experiment provided additional evidence that the observed disturbance pattern was associated with installation location, the number of tested positions remained limited to the two wing locations and one tail location. The crossover results reduce, but do not completely eliminate, the possibility of residual sensor-specific differences. Future work should therefore extend the sensor-swapping approach to additional mounting positions such as true wingtip, nose-boom, and extended tail-boom configurations.
Fourth, synchronized propulsion-current measurements were incorporated in the extended experiments, allowing the relationship between electrical loading and magnetic disturbance to be evaluated directly. The absolute measurement uncertainty of the onboard current and voltage monitoring channels was not independently characterized; consequently, these measurements were interpreted primarily as indicators of relative electrical loading rather than as precision electrical metrology. However, additional propulsion parameters such as detailed ESC telemetry, phase-current measurements, and detailed battery-current measurements were not simultaneously characterized. Future work should integrate these parameters with synchronized magnetometer, attitude, and servo-command data to develop more detailed interference models.
Fifth, airborne validation was performed using repeated flight-line measurements; however, the flight dataset remained more limited than the controlled ground-test dataset. In addition, servo-induced disturbance was characterized under controlled ground-based conditions and was not independently isolated during flight. Therefore, the reported servo-response magnitudes should not be interpreted as a quantitative in-flight servo-interference budget. Additional airborne experiments under different speeds, altitudes, headings, propulsion loads, and environmental magnetic conditions are required to determine whether the observed placement ranking remains stable during realistic survey operation.
Future flight testing should include repeat and reciprocal survey lines under comparable altitude, speed, and heading conditions, together with synchronized position, attitude, throttle, current, and servo-command measurements.
Sixth, the analysis focused on platform-induced disturbance and relative measurement stability rather than complete geophysical anomaly reconstruction. Future field studies should evaluate whether the preferred sensor location improves anomaly repeatability, spatial consistency, and detection performance. The present work included an independent stationary reference magnetometer to distinguish UAV-induced disturbance from broader temporal variations in the ambient magnetic field. However, the reference measurements were used primarily for controlled environmental validation during the throttle experiments. Future field studies should extend this approach through longer-duration reference monitoring during airborne survey operations and should evaluate complete anomaly-map reconstruction, spatial anomaly repeatability, and navigation-performance validation.
Seventh, the study used conventional hard-iron, soft-iron, ellipsoid-based calibration, and time-domain filtering. More advanced residual compensation methods, including attitude-dependent correction, current-based regression, adaptive filtering, and Tolles–Lawson-type approaches, were not fully evaluated [13,19,21]. These techniques should be investigated after physical sensor-placement optimization rather than used as a substitute for appropriate installation.
Overall, future work should extend the present sensor-swapping approach to additional mounting positions, particularly true wingtip, nose-boom, and extended tail-boom configurations, and should incorporate more detailed synchronized electrical and ESC telemetry, expanded controlled flight-line validation, environmental reference measurements, and residual compensation modeling. These extensions would further separate sensor-specific, mounting-specific, and location-specific effects and determine the robustness of the observed placement ranking under a broader range of operational airborne conditions.
9. Conclusions
This study investigated the influence of sensor placement on UAV-induced magnetic disturbances using three RM3100 magnetometers installed at different locations on a single-motor puller fixed-wing UAV. A combination of controlled ground experiments and flight validation tests demonstrated that the measured magnetic response was strongly affected by sensor location, propulsion loading, and local installation conditions.
The results showed that throttle-dependent operation produced the largest magnetic disturbances, indicating that propulsion-related effects were the dominant operating-state-dependent source under the tested conditions. In contrast, onboard electronic activation without motor operation produced smaller but measurable magnetic variations. The statistical and descriptive analyses showed systematic differences among the three installation configurations, with the tail-mounted RM3100-C generally exhibiting lower disturbance levels and variability than the wing-mounted configurations.
Although RM3100-A and RM3100-B were installed at similar wing locations, measurable differences were observed between their responses. These differences highlight the influence of local installation factors, including wiring arrangement, servo proximity, electronic component distribution, and mounting geometry. Therefore, calibration alone is not sufficient to eliminate UAV-induced magnetic interference, and sensor placement should be considered together with the UAV electrical and structural configuration.
The flight validation results supported the trends observed during ground experiments, demonstrating that optimized sensor placement can improve the stability and repeatability of UAV-based magnetic measurements. However, this study was conducted using a single UAV platform and a specific sensor installation configuration; therefore, the observed disturbance characteristics should be interpreted as configuration-dependent rather than universally applicable to all UAV systems. Future investigations should evaluate additional UAV architectures, sensor mounting strategies, and operating environments to develop more general guidelines for UAV magnetic sensing applications.
Author Contributions
Conceptualization, F.S.; Methodology, M.A.F. and F.S.; Investigation, M.A.F. and F.S.; Data analysis, M.A.F.; Writing—original draft preparation, M.A.F. and F.S.; Writing—review and editing, M.A.F. and F.S.
Funding
This research received no external funding.
Institutional Review Board Statement
Not applicable.
Data Availability Statement
The raw datasets generated during this study are no longer available. The retained summary data supporting the analyses and reported results are included within the article.
Conflicts of Interest
The authors declare no conflict of interest.
References
- Malehmir, A.; Dynesius, L.; Paulusson, K.; Paulusson, A.; Johansson, H.; Bastani, M.; Wedmark, M.; Marsden, P. The potential of rotary-wing UAV-based magnetic surveys for mineral exploration: A case study from central Sweden. Lead. Edge 2017, 36, 552–557. [Google Scholar] [CrossRef]
- Ugarte-Goicuría, I.; Guerrero-Sevilla, D.; Carrasco-Garcia, P.; Carrasco-Garcia, J.; Gonzalez-Aguilera, D. Aerial drone magnetometry for the detection of subsurface unexploded ordnance (UXO) in the San Gregorio experimental site (Zaragoza, Spain). Drones 2026, 10, 88. [Google Scholar] [CrossRef]
- Canciani, A.J.; Raquet, J.F. Airborne magnetic anomaly navigation. IEEE Trans. Aerosp. Electron. Syst. 2017, 53, 67–80. [Google Scholar] [CrossRef]
- Lenz, J.; Edelstein, A.S. Magnetic sensors and their applications. IEEE Sens. J. 2006, 6, 631–649. [Google Scholar] [CrossRef]
- Koryagin, V.N.; Aleshin, I.M.; Aleshina, G.N.; Minaev, P.A.; Kholodkov, K.I. Drotek RM3100 compact magnetometer calibration and fitting for UAV surveys. Seism. Instrum. 2025, 61, 5–13. [Google Scholar]
- Zheng, Y.; Li, S.; Xing, K.; Zhang, X. Unmanned aerial vehicles for magnetic surveys: A review on platform selection and interference suppression. Drones 2021, 5, 93. [Google Scholar] [CrossRef]
- Chen, B.; Huang, L.; Zhang, K.; Hu, J.; Zhu, W. Magnetic interference analysis and compensation method of airborne electronic equipment in an unmanned aerial vehicle. Appl. Sci. 2023, 13, 7455. [Google Scholar] [CrossRef]
- Cherkasov, S.; Kapshtan, D. Unmanned aerial systems for magnetic survey. In Drones—Applications; Dekoulis, G., Ed.; IntechOpen: London, UK, 2018; pp. 135–148. [Google Scholar]
- Merayo, C.J.; Brauer, P.; Primdahl, F.; Petersen, J.R.; Nielsen, O.V. Scalar calibration of vector magnetometers. Meas. Sci. Technol. 2000, 11, 120–132. [Google Scholar] [CrossRef]
- Vasconcelos, J.F.; Elkaim, G.; Silvestre, C.; Oliveira, P.; Cardeira, B. Geometric approach to strapdown magnetometer calibration in sensor frame. IEEE Trans. Aerosp. Electron. Syst. 2011, 47, 1293–1306. [Google Scholar] [CrossRef]
- Zikmund, A.; Janošek, M.; Ulvr, M.; Kupec, J. Precise calibration method for triaxial magnetometers not requiring Earth’s field compensation. IEEE Trans. Instrum. Meas. 2015, 64, 1250–1255. [Google Scholar] [CrossRef]
- Kok, M.; Schön, T.B. Magnetometer calibration using inertial sensors. IEEE Sens. J. 2016, 16, 5679–5689. [Google Scholar] [CrossRef]
- Gnadt, A.R.; Wollaber, A.B.; Nielsen, A.P. Derivation and extensions of the Tolles–Lawson model for aeromagnetic compensation. arXiv 2022, arXiv:2212.09899. [Google Scholar]
- Crassidis, J.L.; Lai, K.; Harman, R. Real-time attitude-independent three-axis magnetometer calibration. J. Guid. Control Dyn. 2005, 28, 115–120. [Google Scholar] [CrossRef]
- Opromolla, R. Magnetometer calibration for small unmanned aerial vehicles using cooperative flight data. Sensors 2020, 20, 538. [Google Scholar] [CrossRef] [PubMed]
- Wu, H.; Pei, X.; Li, J.; Gao, H.; Bai, Y. An improved magnetometer calibration and compensation method based on Levenberg–Marquardt algorithm for multi-rotor UAV. Meas. Control 2020, 53, 276–286. [Google Scholar] [CrossRef]
- Wang, M.; Su, C.; Zhu, W.; Cai, Z.; Ren, K.; Chen, Y.; Xu, S. A dynamic calibration of multi-rotor UAV magnetometer based on least square method. J. Guangdong Univ. Technol. 2019, 36, 42–45, 69. [Google Scholar]
- Janošek, M.; Dressler, M.; Petrucha, V.; Chirtsov, A. Magnetic Calibration System with Interference Compensation. IEEE Trans. Magn. 2019, 55, 6000104. [Google Scholar] [CrossRef]
- Mu, Y.; Chen, L.; Xiao, Y. Small signal magnetic compensation method for UAV-borne vector magnetometer system. IEEE Trans. Instrum. Meas. 2023, 72, 1–7. [Google Scholar] [CrossRef]
- Ye, L.; Yu, Z.; Zhang, Y.; Chi, C.; Cheng, P.; Chen, J. An aeromagnetic compensation strategy for large UAVs. Sensors 2024, 24, 3775. [Google Scholar] [CrossRef] [PubMed]
- Yu, Z.; Ye, L.; Ding, C.; Chi, C.; Liu, C.; Cheng, P. Dynamic parameterization and optimized flight paths for enhanced aeromagnetic compensation in large unmanned aerial vehicles. Sensors 2025, 25, 2954. [Google Scholar] [CrossRef] [PubMed]
- Tuck, L.; Samson, C.; Laliberté, J.; Wells, M.; Bélanger, F. Magnetic interference testing method for an electric fixed-wing unmanned aircraft system (UAS). J. Unmanned Veh. Syst. 2018, 6, 177–194. [Google Scholar] [CrossRef]
- Jirigalatu; Krishna, V.; Lima Simões da Silva, E.; Døssing, A. Experiments on magnetic interference for a portable airborne magnetometry system using a hybrid unmanned aerial vehicle (UAV). Geosci. Instrum. Method. Data Syst. 2021, 10, 25–34. [Google Scholar] [CrossRef]
- Tuck, L.E.; Samson, C.; Laliberté, J.; Cunningham, M. Magnetic interference mapping of four types of unmanned aircraft systems intended for aeromagnetic surveying. Geosci. Instrum. Method. Data Syst. 2021, 10, 101–112. [Google Scholar] [CrossRef]
- Ge, J.; Xiang, J.; Li, D. Integrated low electromagnetic interference design method for small, fixed-wing UAVs for magnetic anomaly detection. Drones 2024, 8, 347. [Google Scholar] [CrossRef]
- Accomando, F.; Vitale, A.; Bonfante, A.; Buonanno, M.; Florio, G. Performance of two different flight configurations for drone-borne magnetic data. Sensors 2021, 21, 5736. [Google Scholar] [CrossRef] [PubMed]
- Kaub, L.; Keller, G.; Bouligand, C.; Glen, J.M.G. Magnetic surveys with unmanned aerial systems: Software for assessing and comparing the accuracy of different sensor systems, suspension designs and compensation methods. Geochem. Geophys. Geosyst. 2021, 22, e2021GC009745. [Google Scholar] [CrossRef]
- Guo, H.; Huang, J.; Xu, J.; Li, J.; Li, W.; Luo, Q.; Yu, Q. Principle of dynamic noise compensation in UAV aeromagnetic gradiometer systems. Appl. Geophys. 2026, 23, 18–27. [Google Scholar] [CrossRef]
Figure 1.
Representative fixed-wing propulsion configurations relevant to UAV-mounted magnetometer placement: (a) puller, (b) pusher, and (c) multi-motor arrangements.
Figure 1.
Representative fixed-wing propulsion configurations relevant to UAV-mounted magnetometer placement: (a) puller, (b) pusher, and (c) multi-motor arrangements.
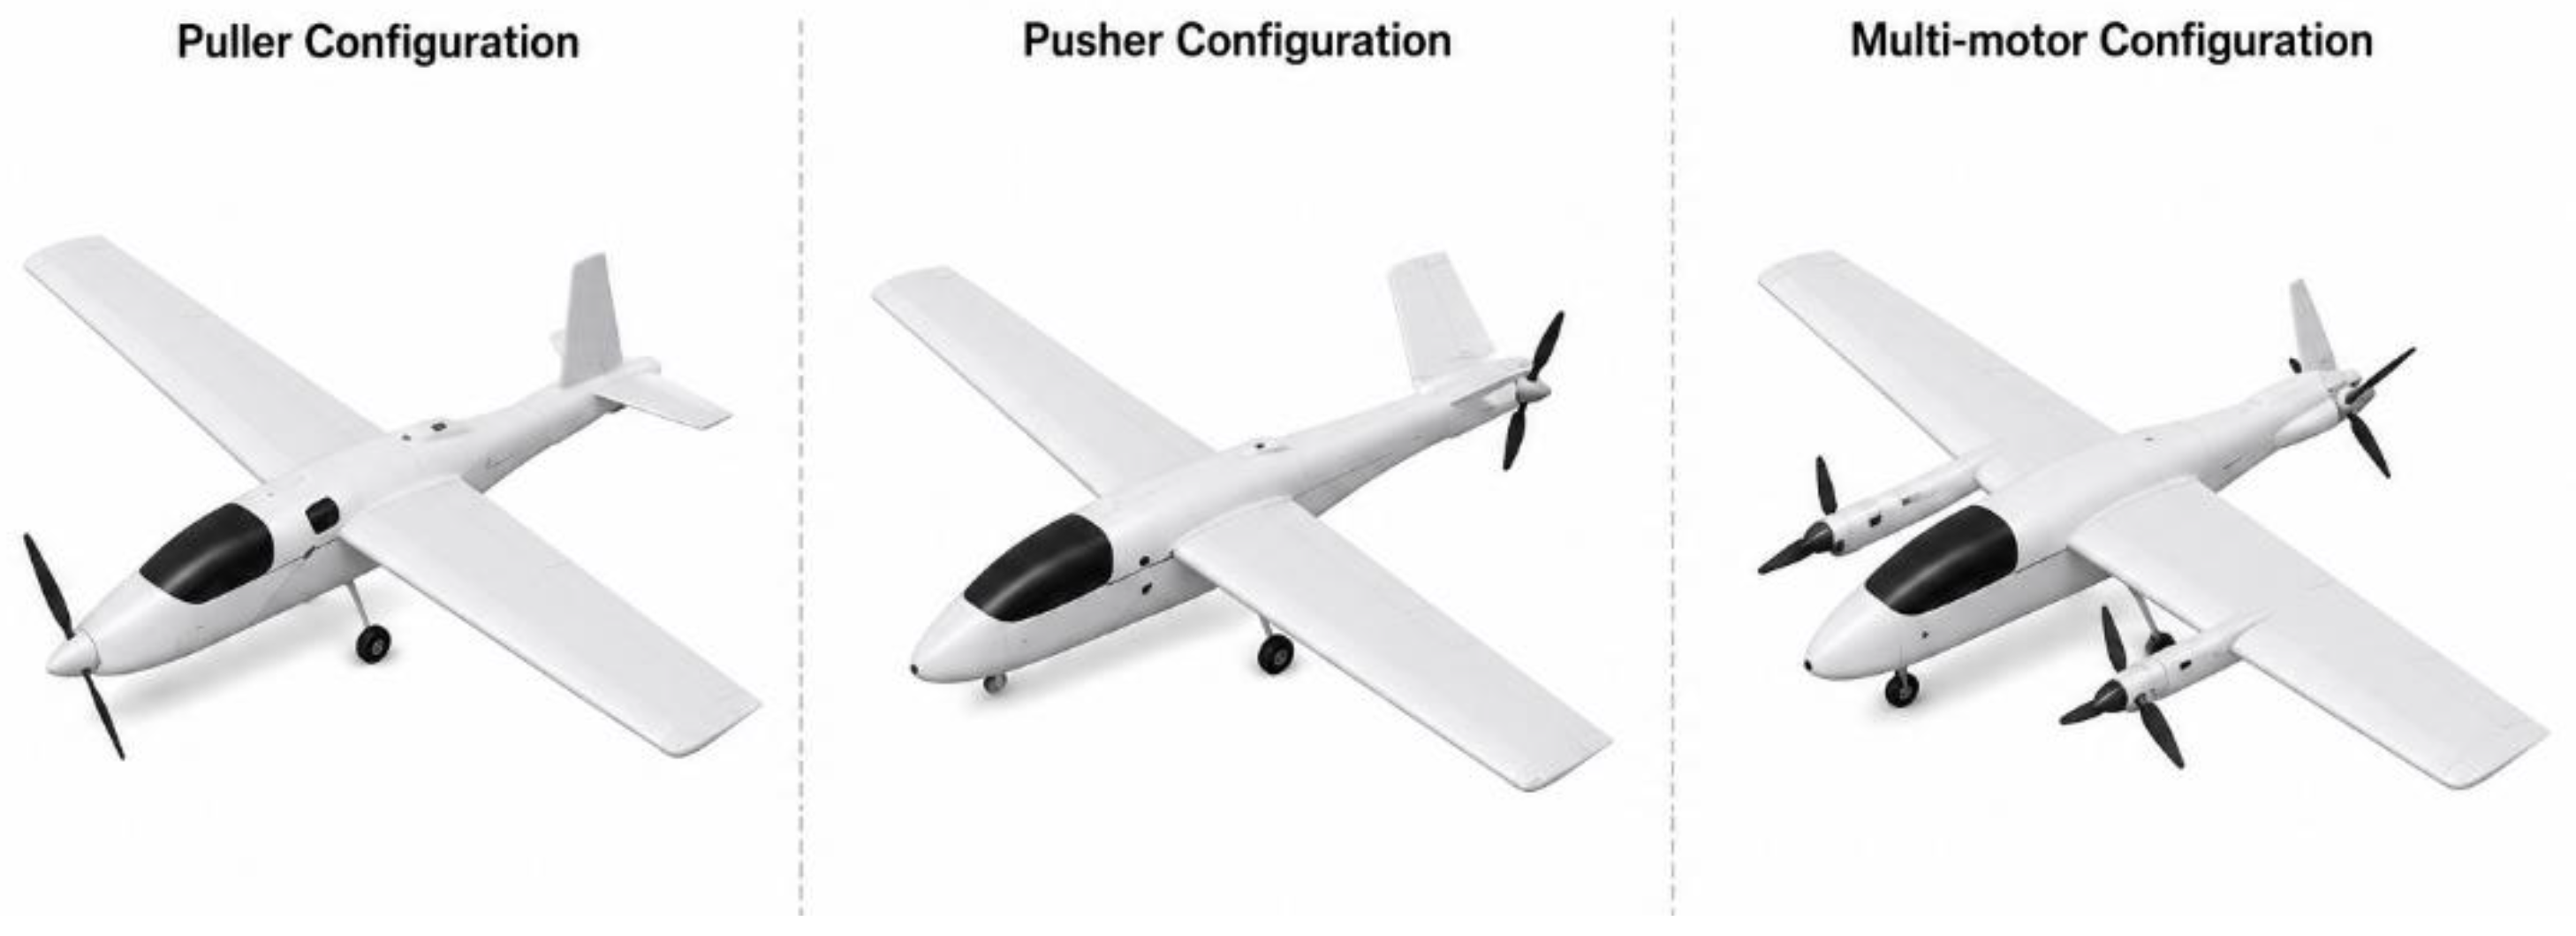
Figure 2.
Front and top views of the experimental single-motor puller fixed-wing UAV used for the distributed RM3100 magnetometer measurements.
Figure 2.
Front and top views of the experimental single-motor puller fixed-wing UAV used for the distributed RM3100 magnetometer measurements.
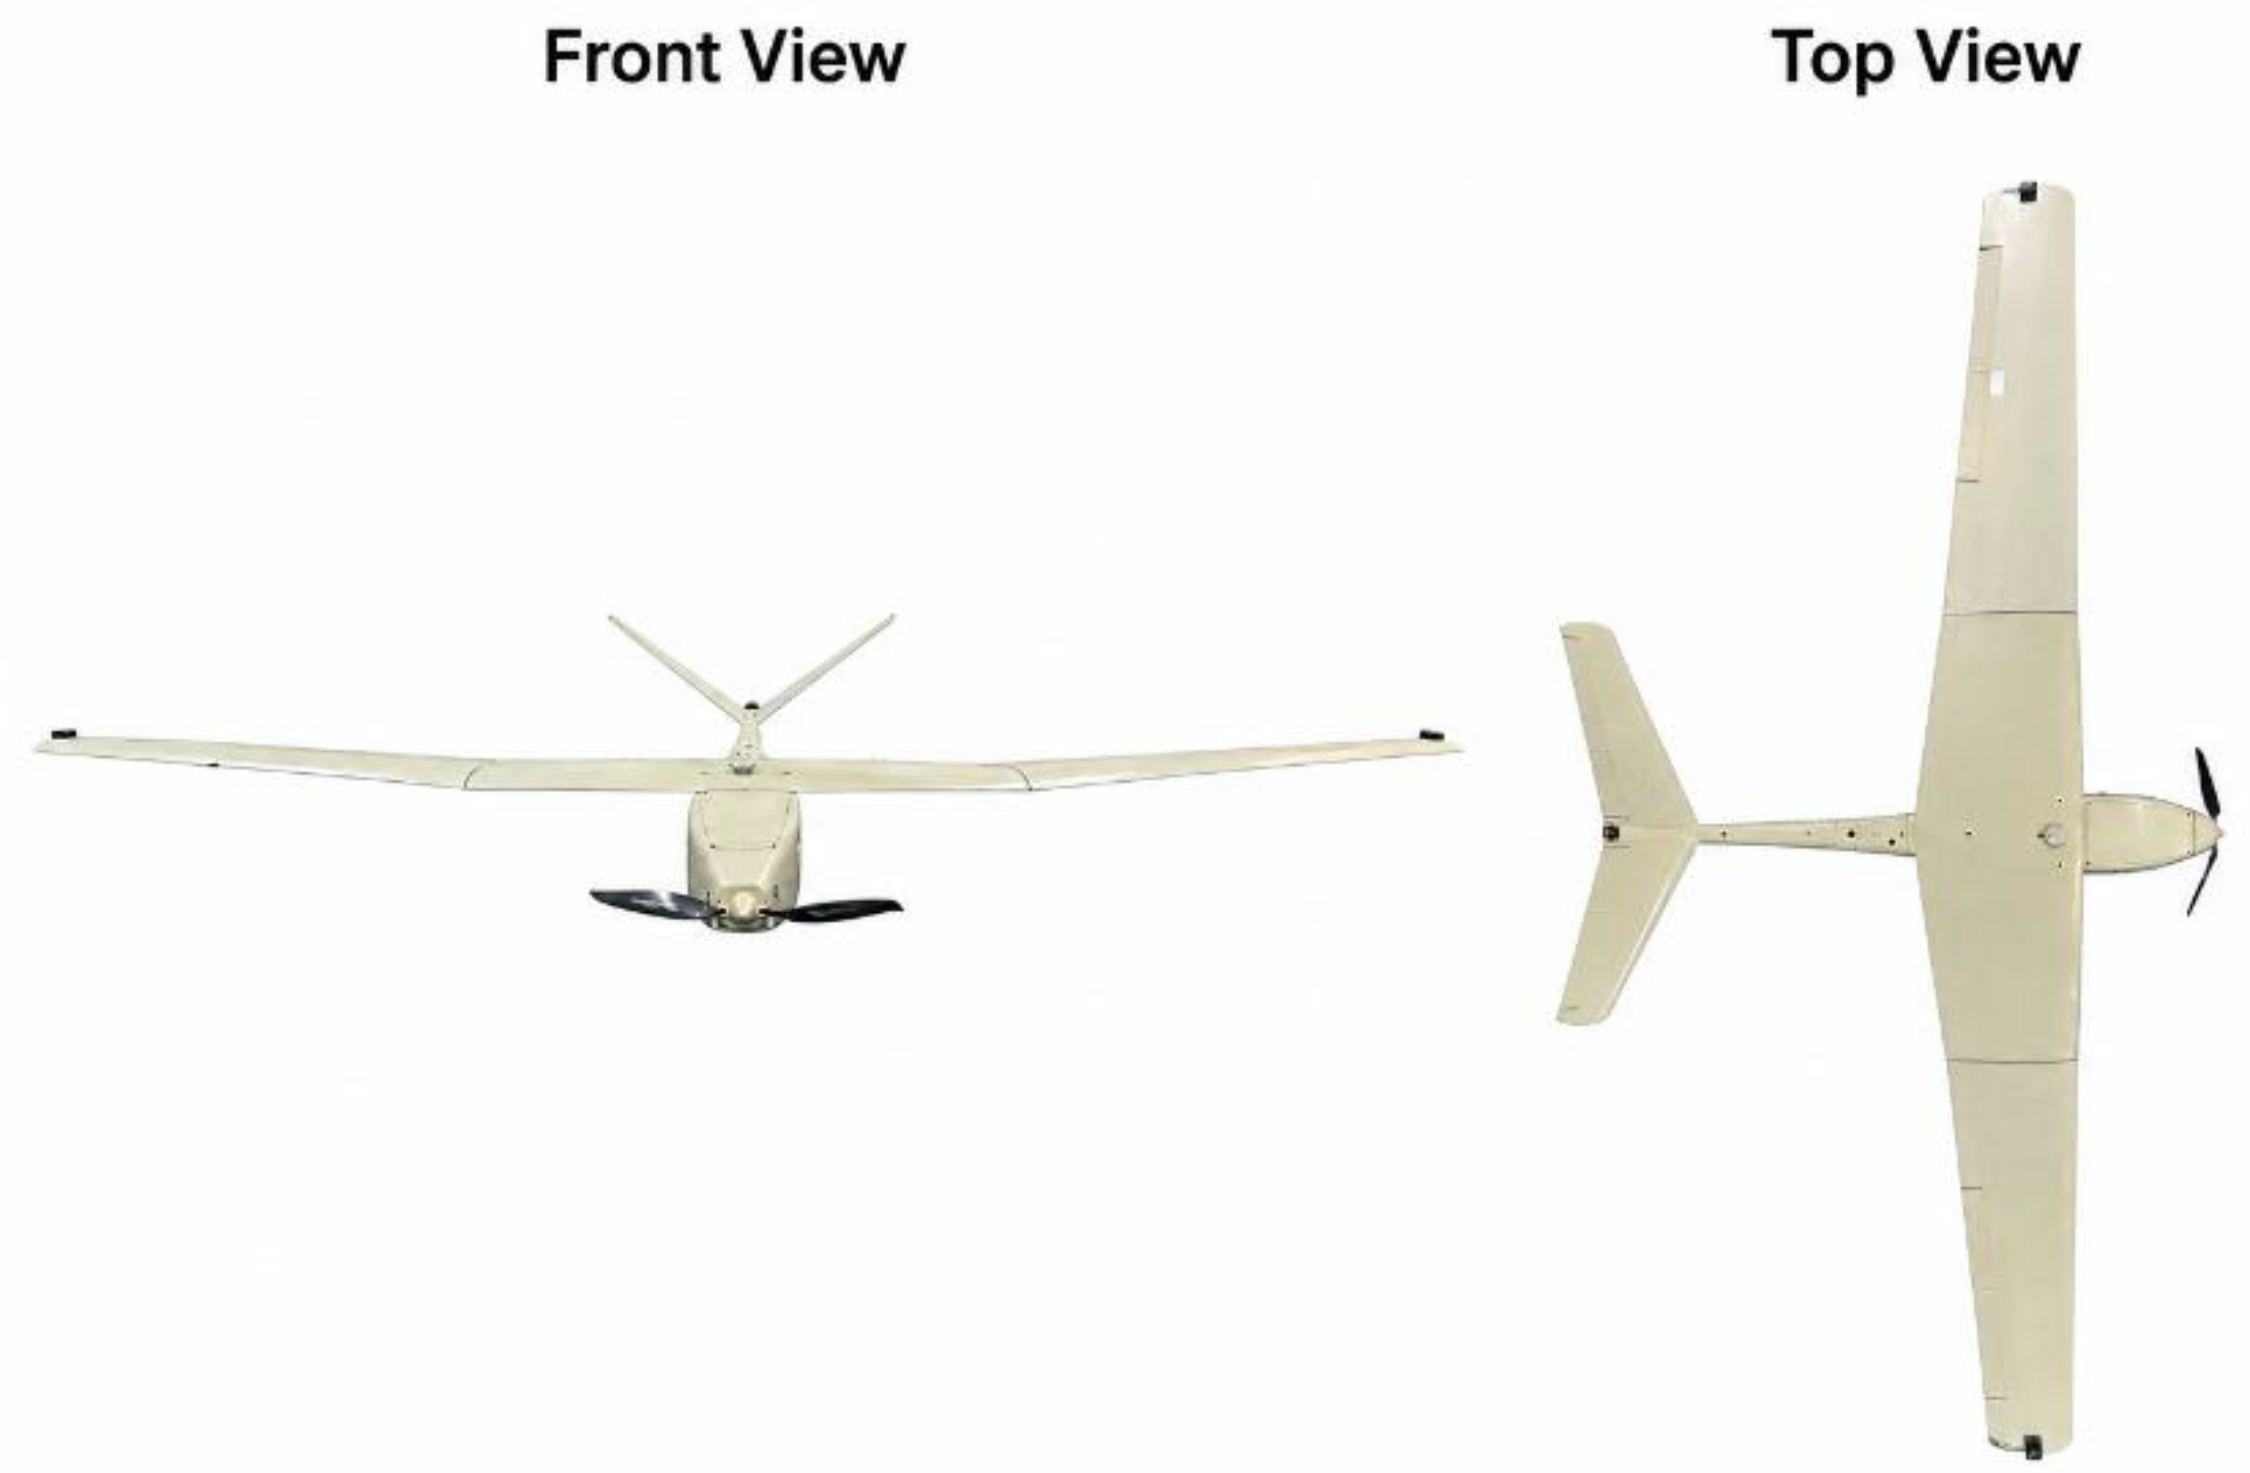
Figure 3.
Top-view layout of the principal onboard components and distributed magnetometer installation locations on the experimental puller fixed-wing UAV, including the propulsion motor, battery, onboard electronics, navigation system, and the three sensor positions.
Figure 3.
Top-view layout of the principal onboard components and distributed magnetometer installation locations on the experimental puller fixed-wing UAV, including the propulsion motor, battery, onboard electronics, navigation system, and the three sensor positions.
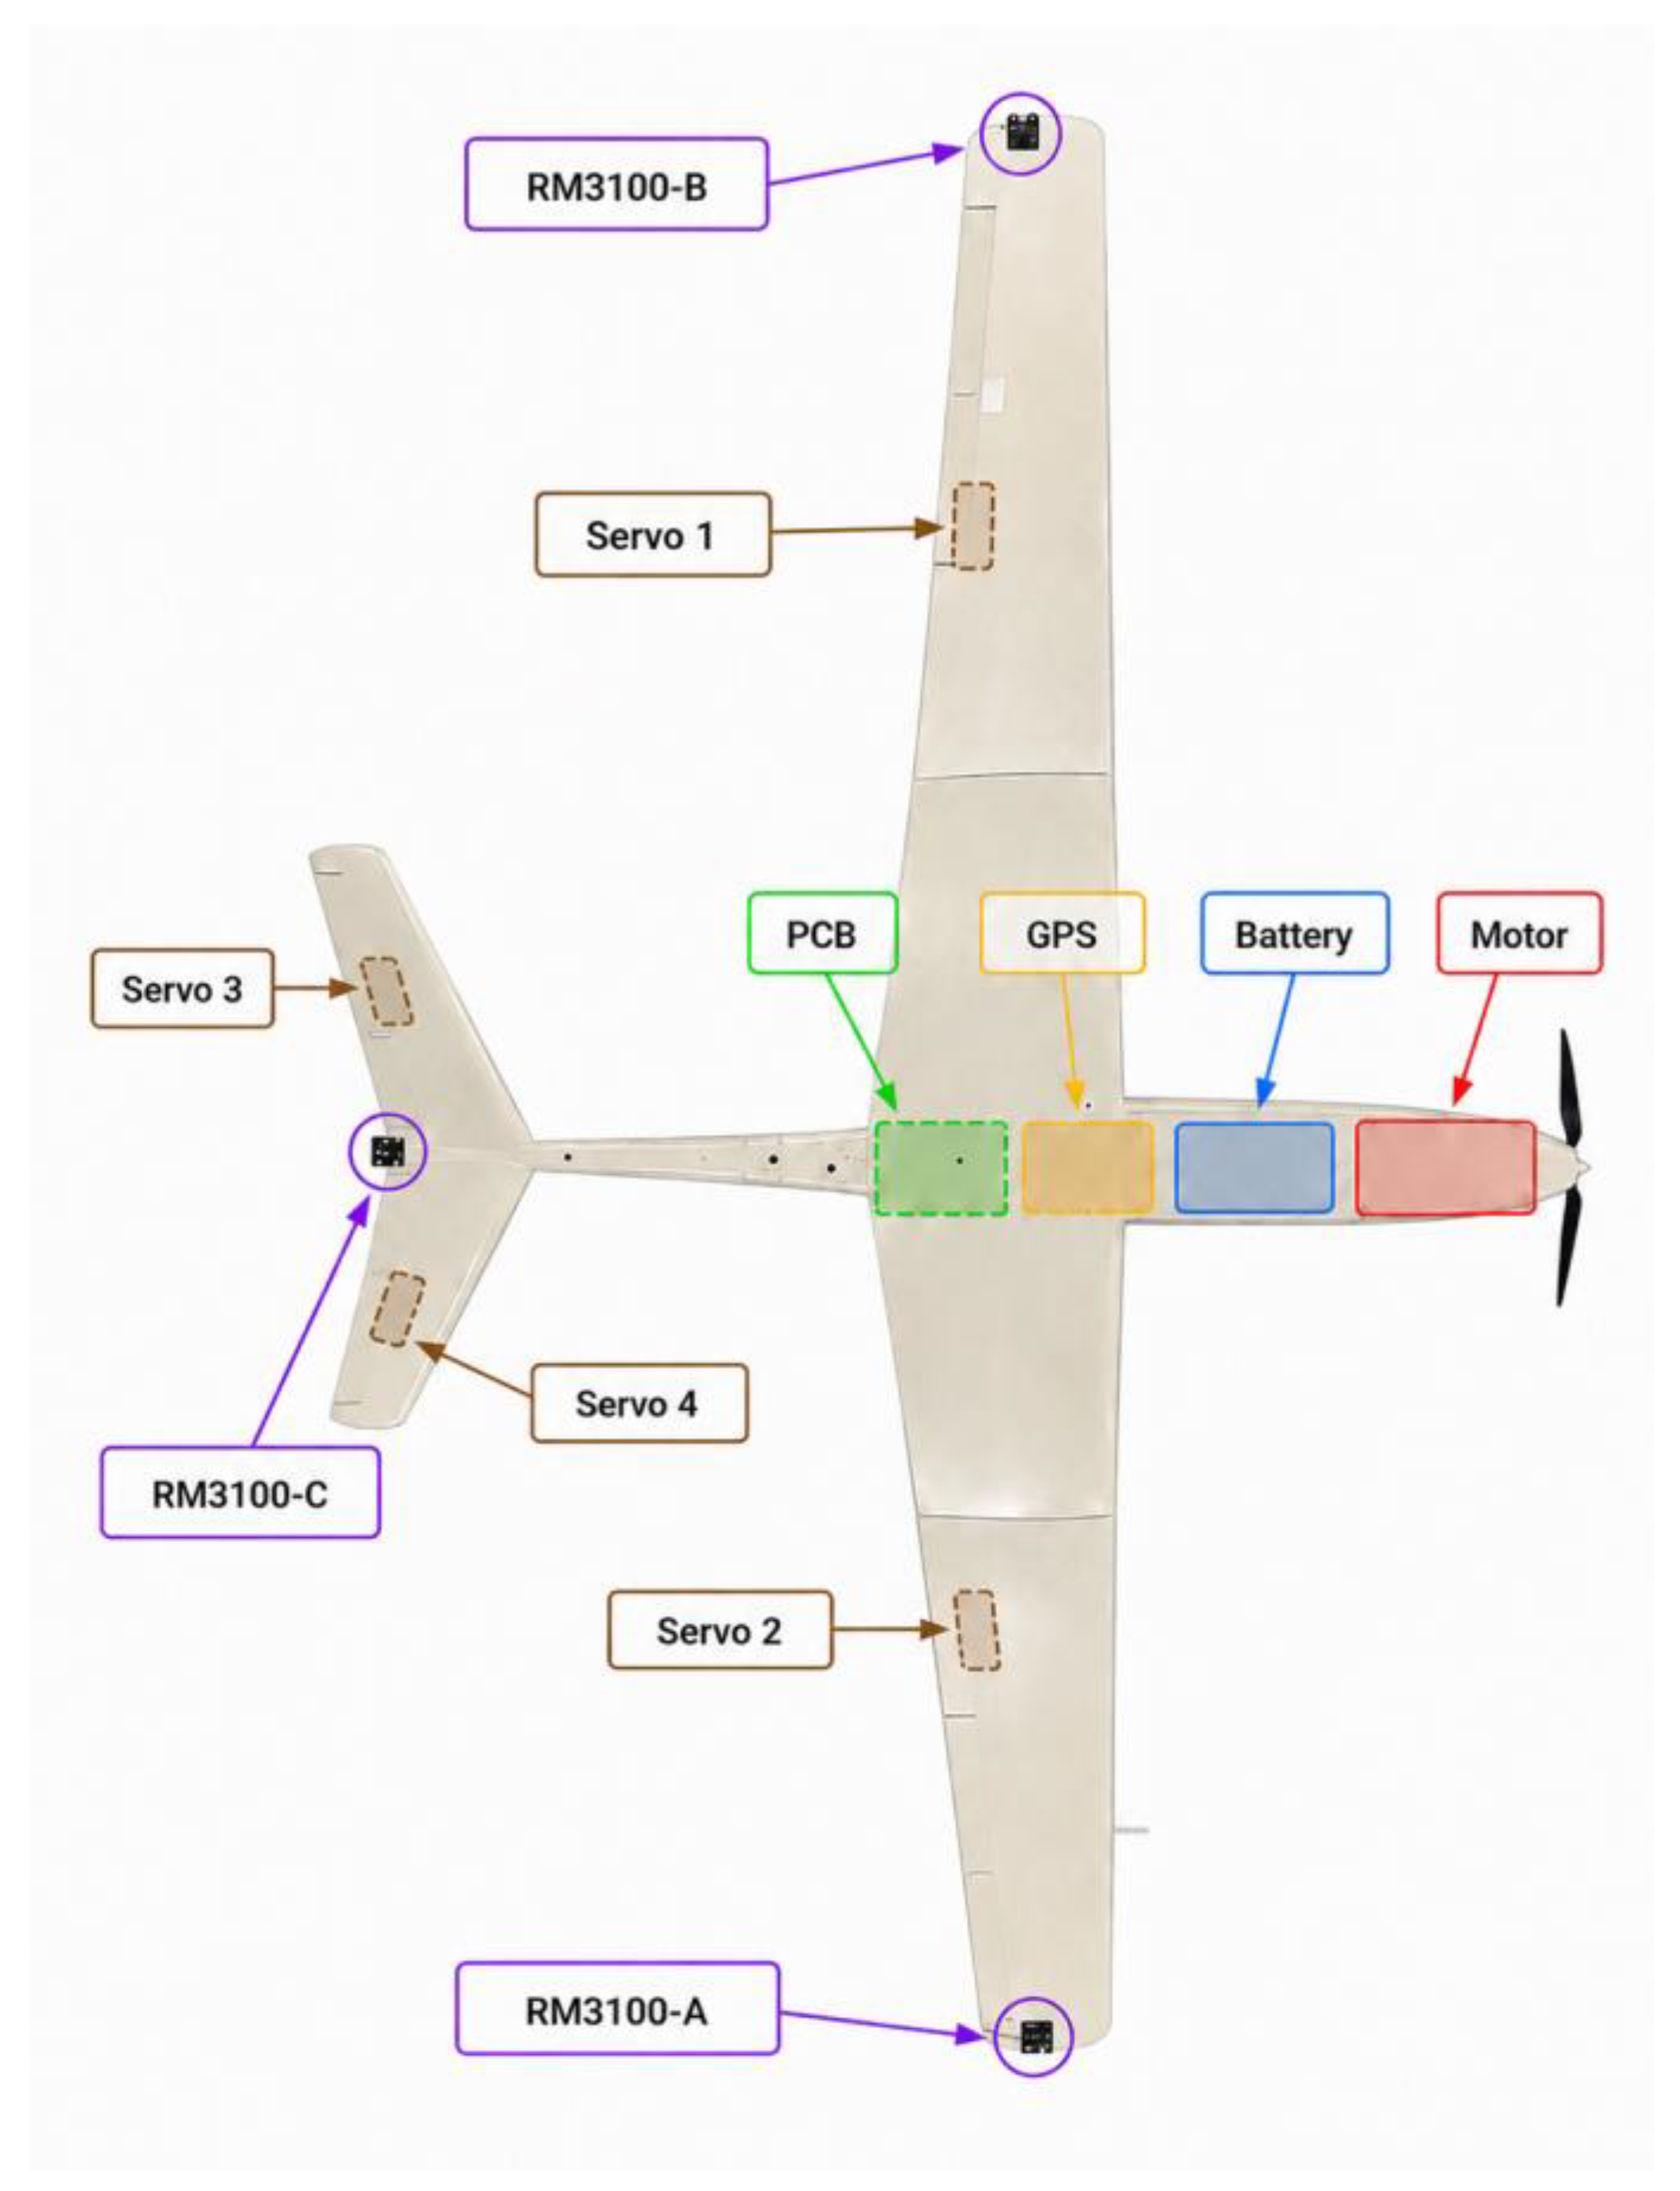
Figure 4.
Qualitative spatial representation of the expected motor- and ESC-related magnetic interference relative to the three RM3100 installation locations on the experimental UAV.
Figure 4.
Qualitative spatial representation of the expected motor- and ESC-related magnetic interference relative to the three RM3100 installation locations on the experimental UAV.
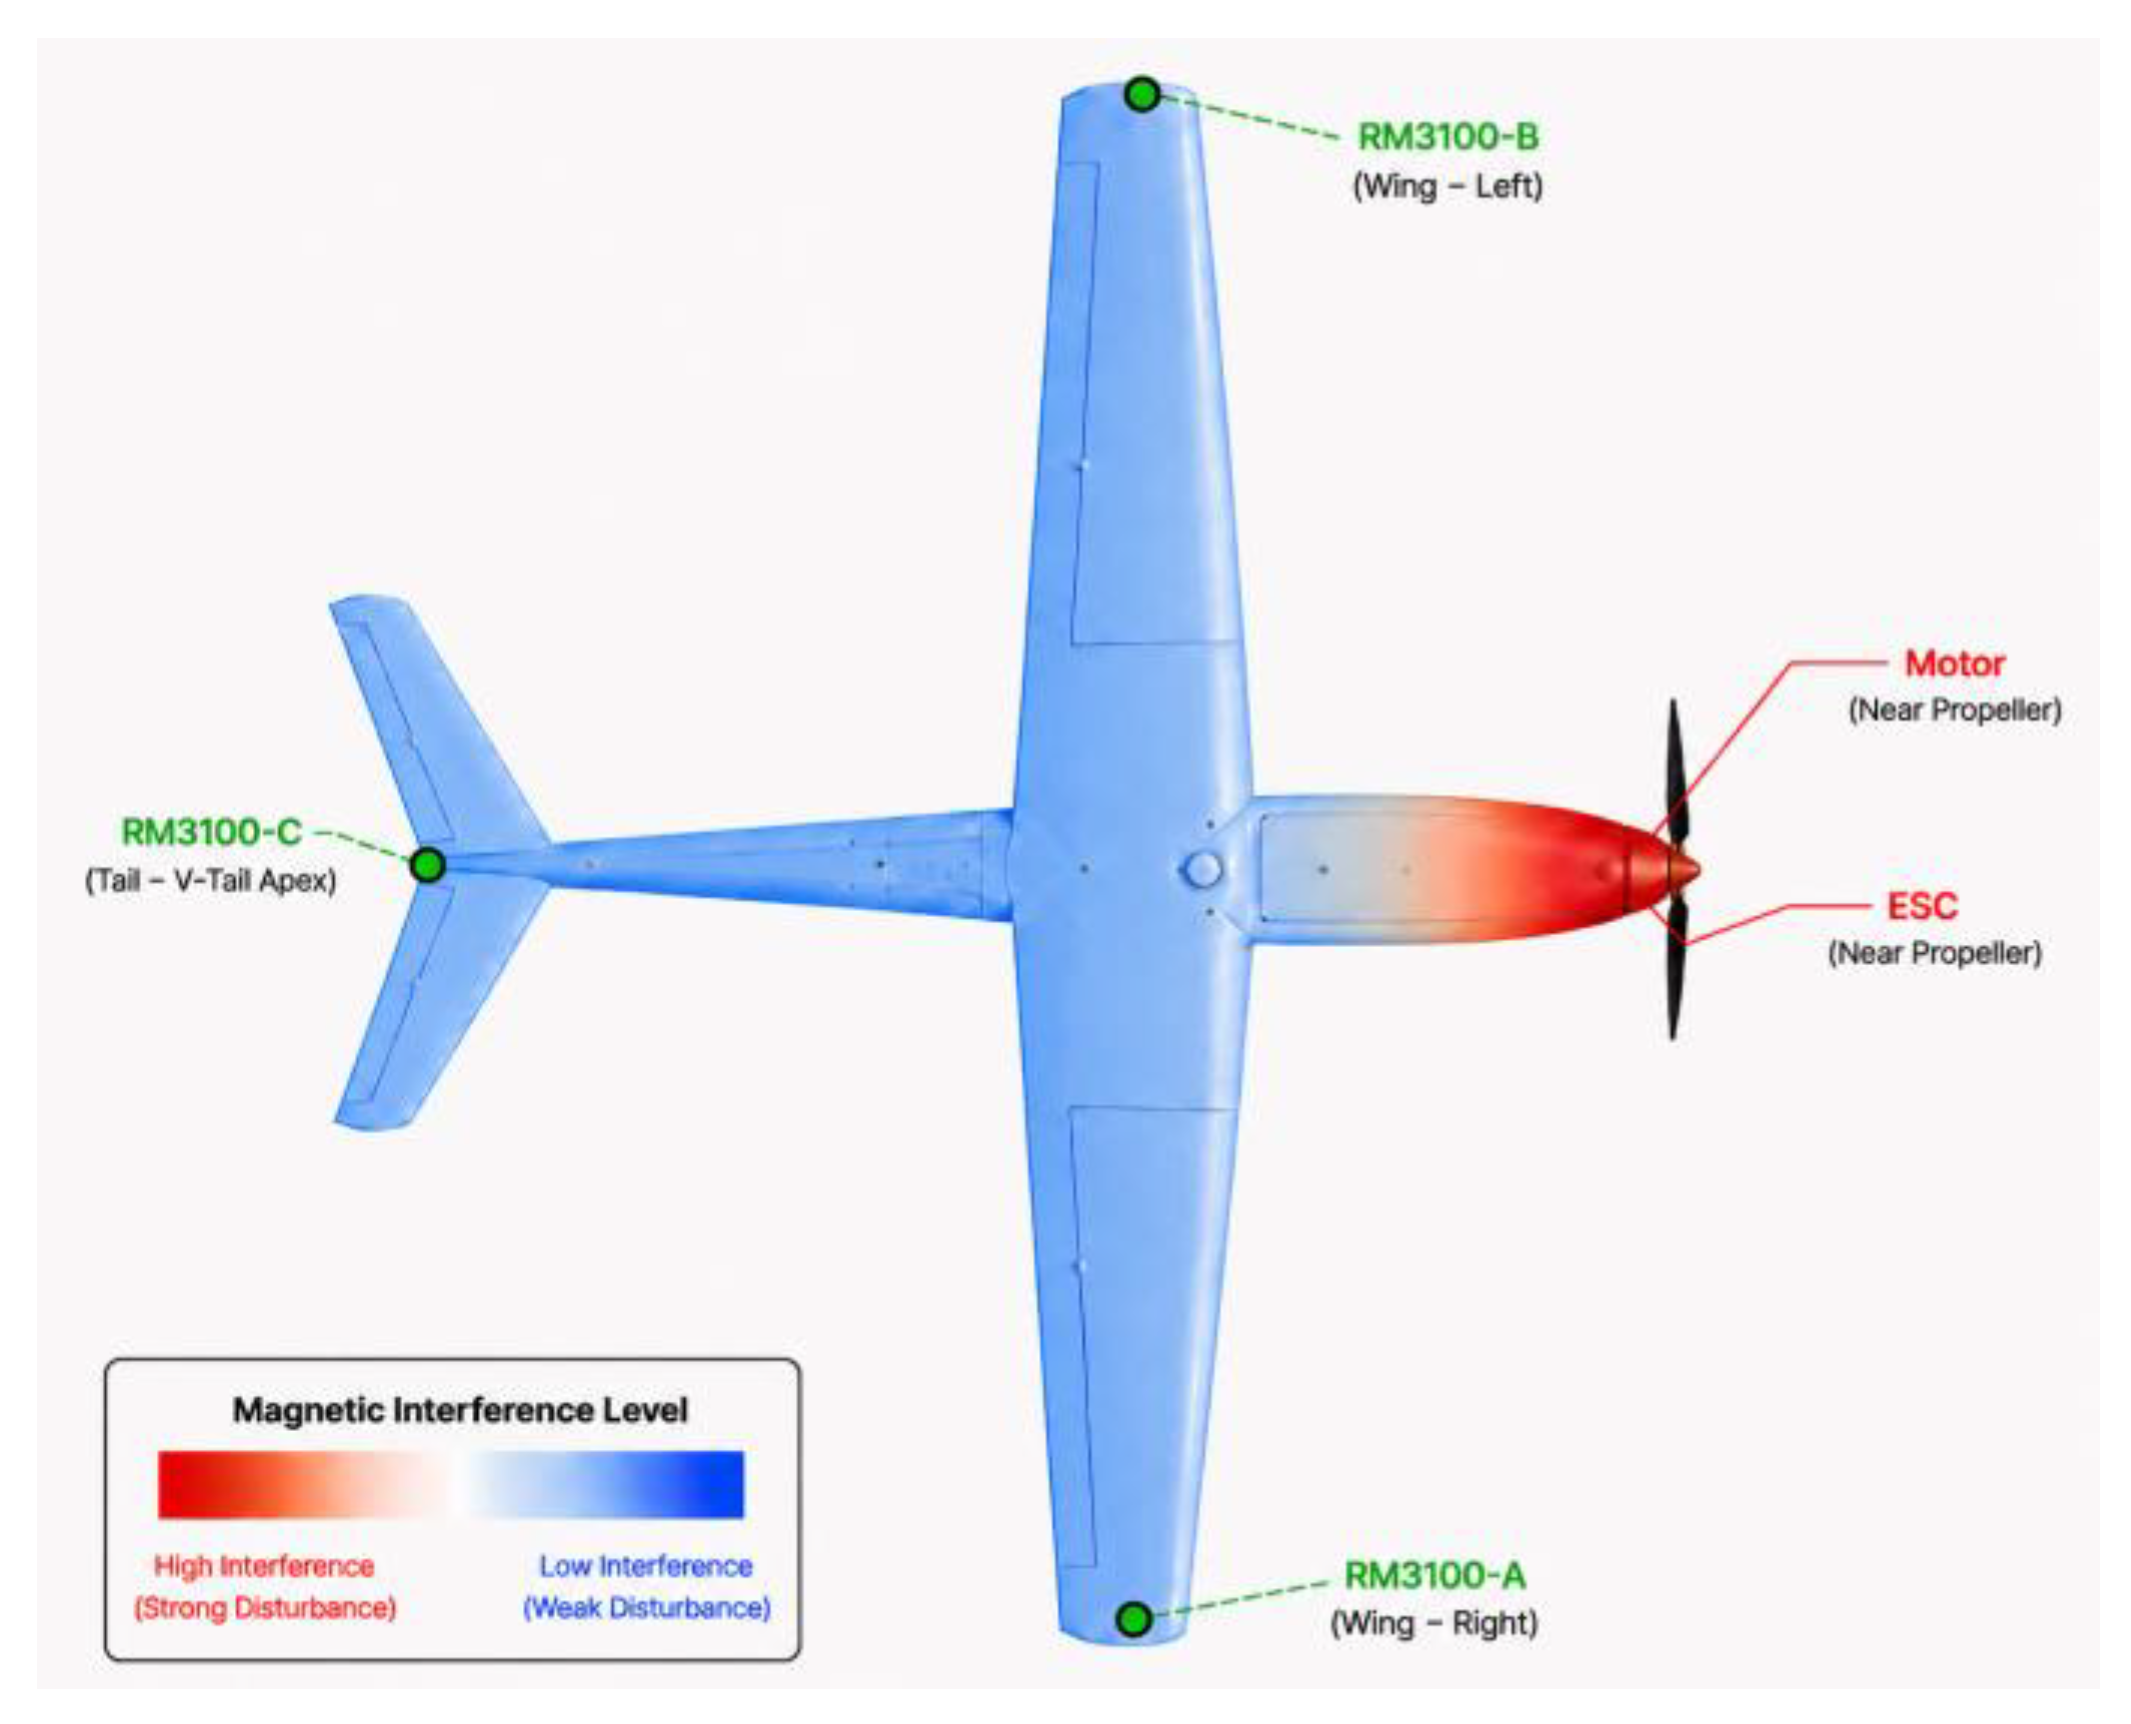
Figure 5.
Qualitative spatial representation of the expected magnetic interference associated with the battery and high-current power cables relative to the three RM3100 installation locations.
Figure 5.
Qualitative spatial representation of the expected magnetic interference associated with the battery and high-current power cables relative to the three RM3100 installation locations.
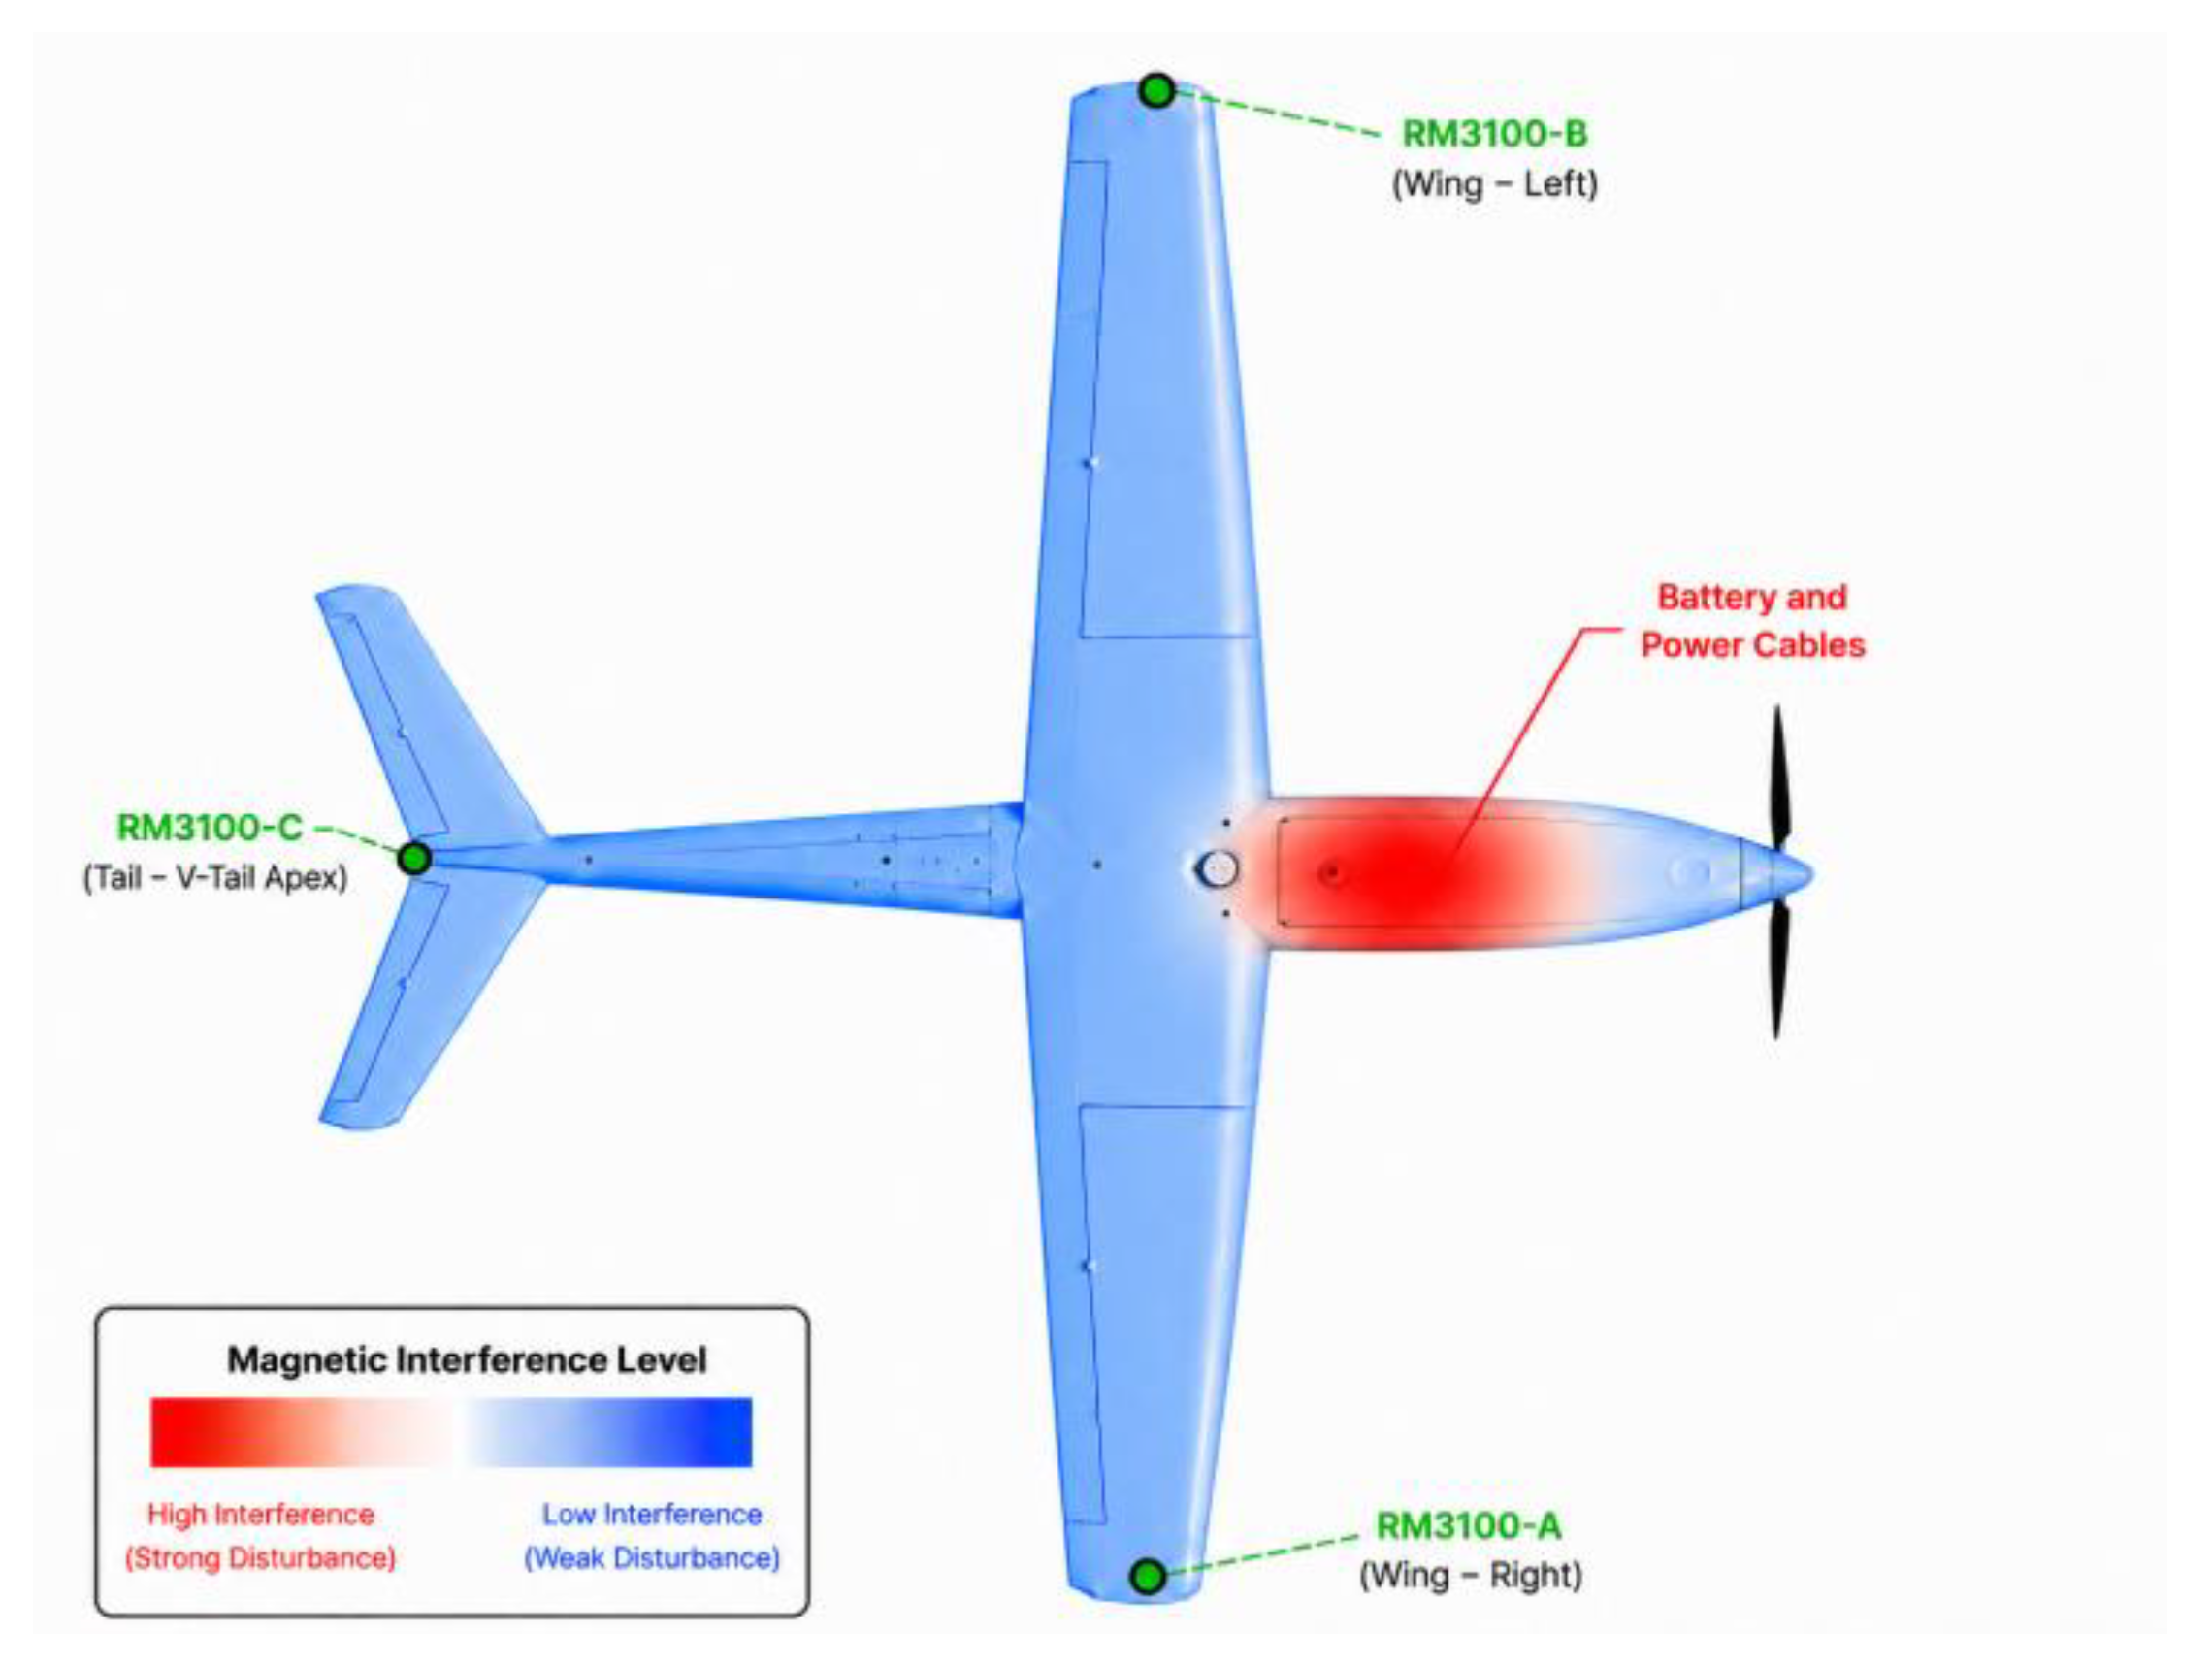
Figure 6.
Qualitative spatial representation of the expected magnetic and electromagnetic interference associated with the PCB and centrally located onboard electronic systems relative to the three RM3100 locations.
Figure 6.
Qualitative spatial representation of the expected magnetic and electromagnetic interference associated with the PCB and centrally located onboard electronic systems relative to the three RM3100 locations.
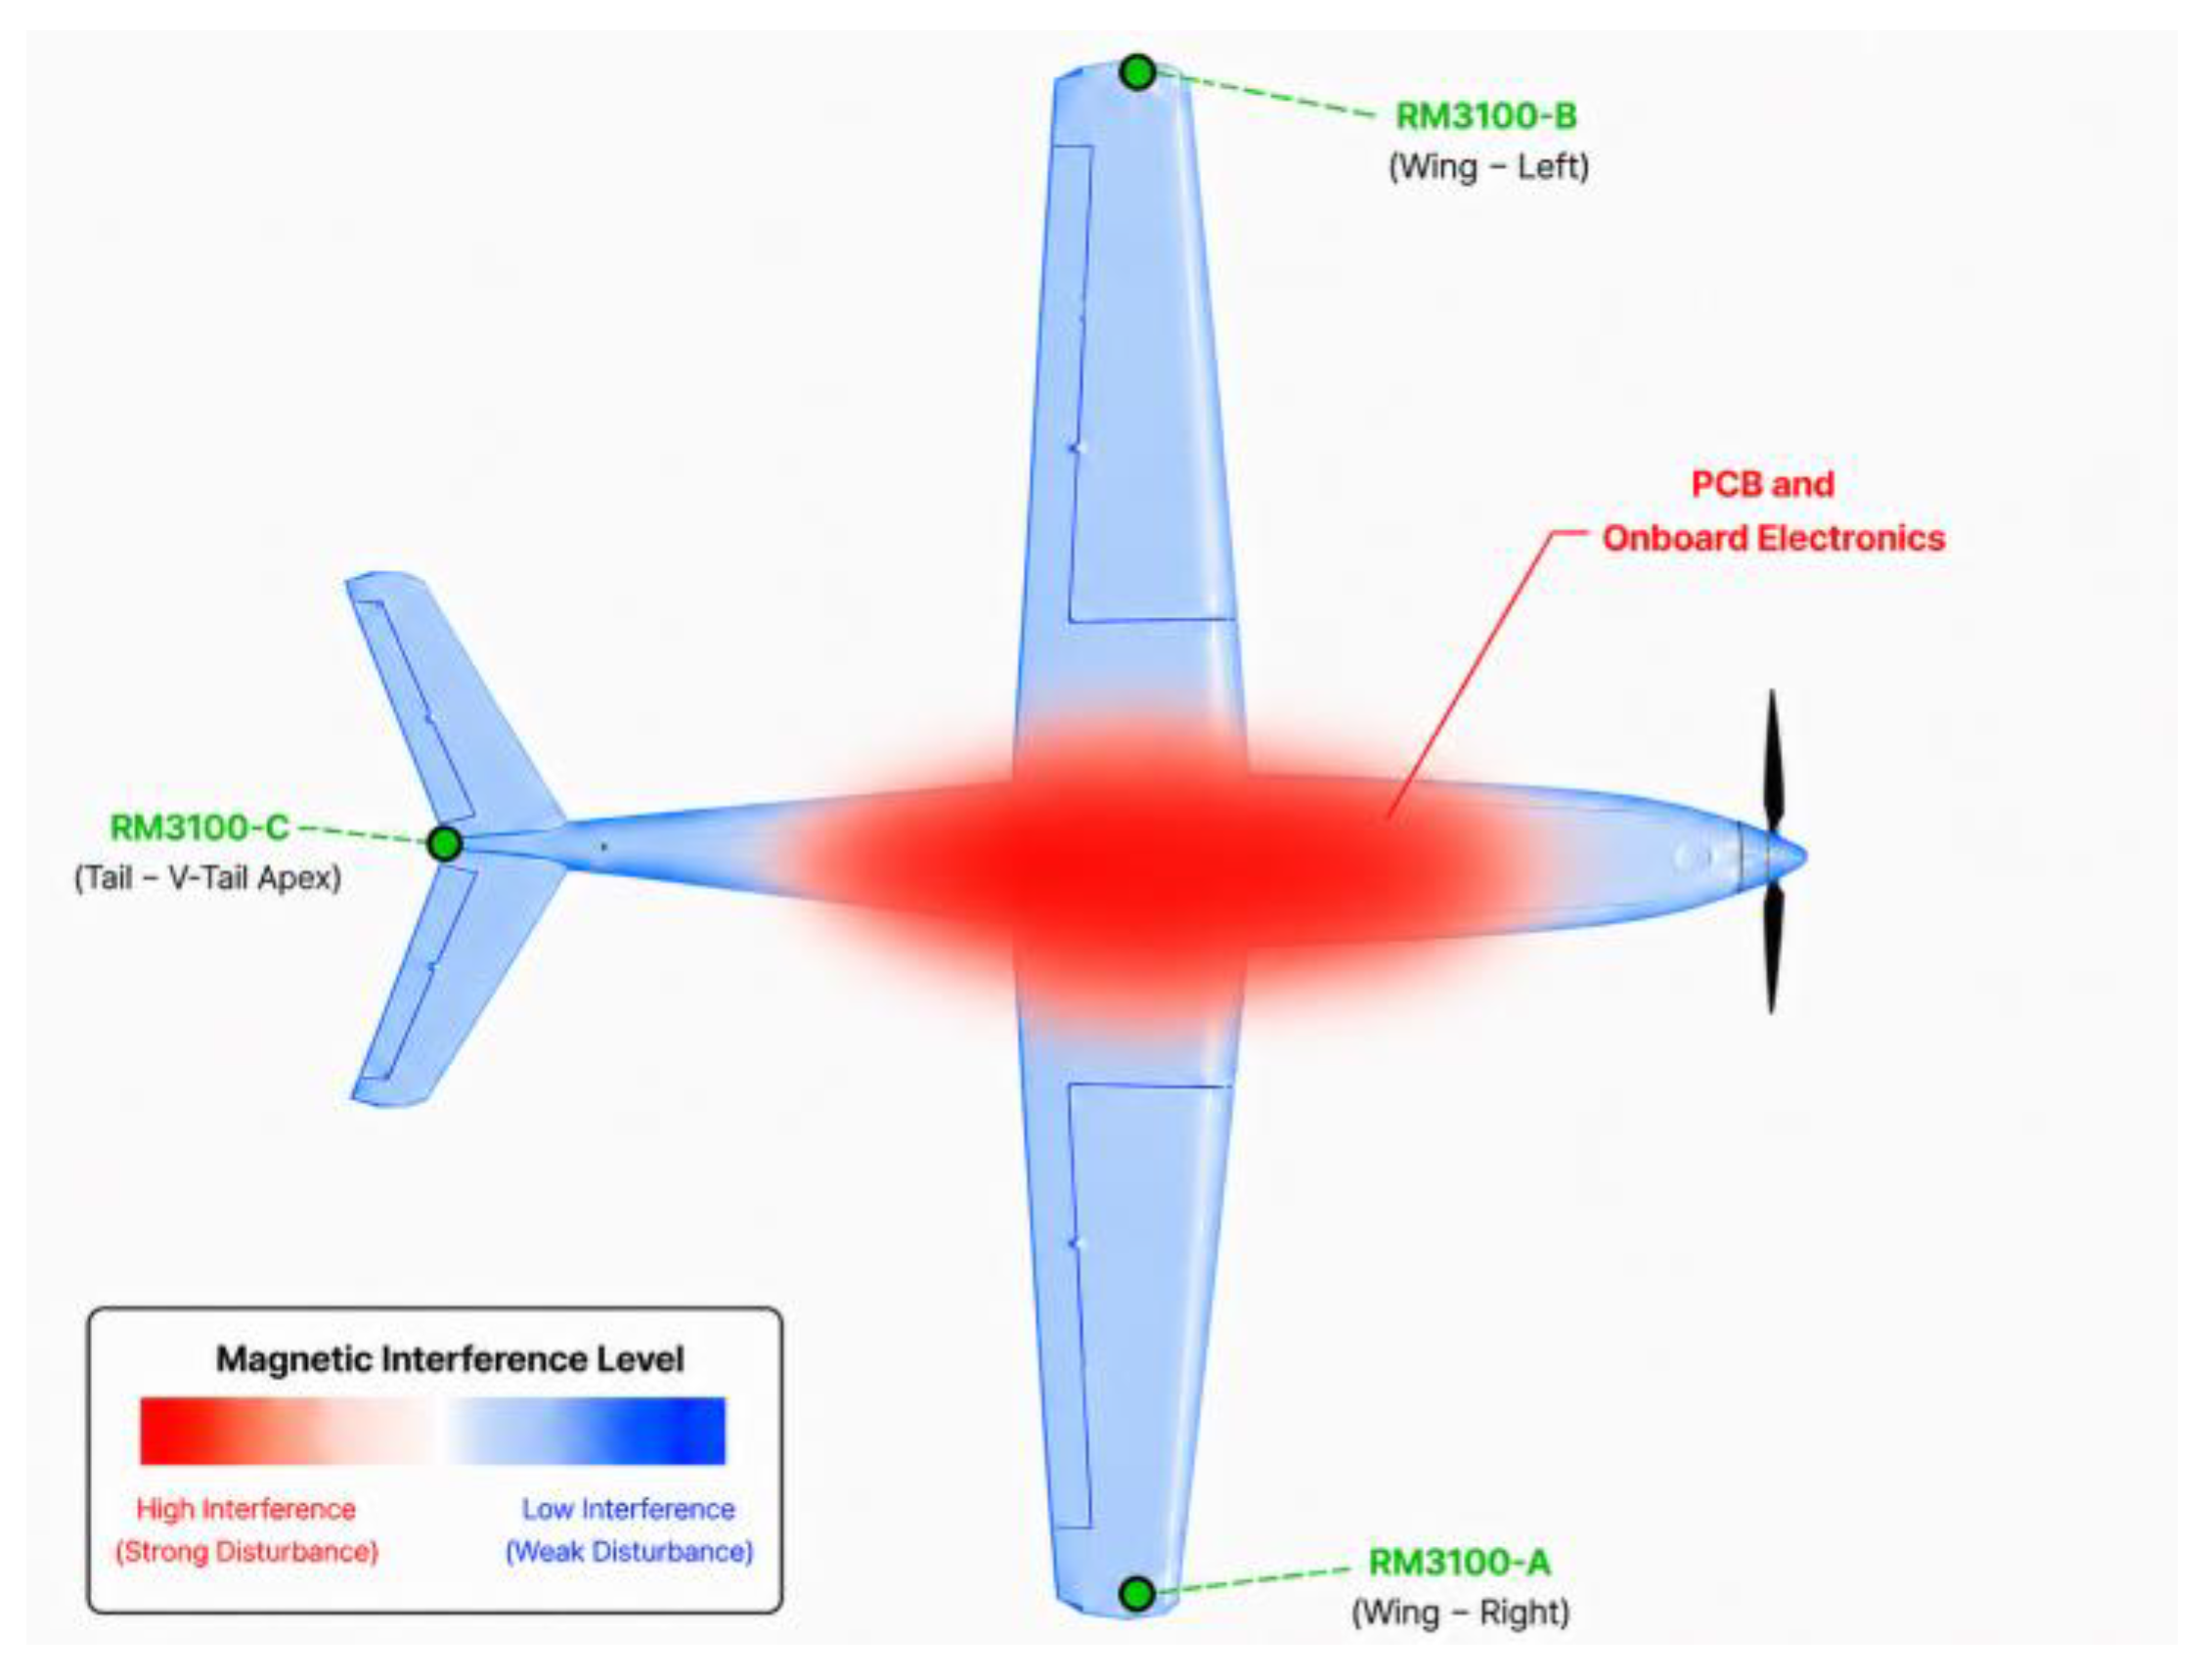
Figure 7.
Qualitative spatial representation of localized magnetic-interference regions associated with the wing and tail servo actuators and their spatial relationship with the three RM3100 sensors.
Figure 7.
Qualitative spatial representation of localized magnetic-interference regions associated with the wing and tail servo actuators and their spatial relationship with the three RM3100 sensors.
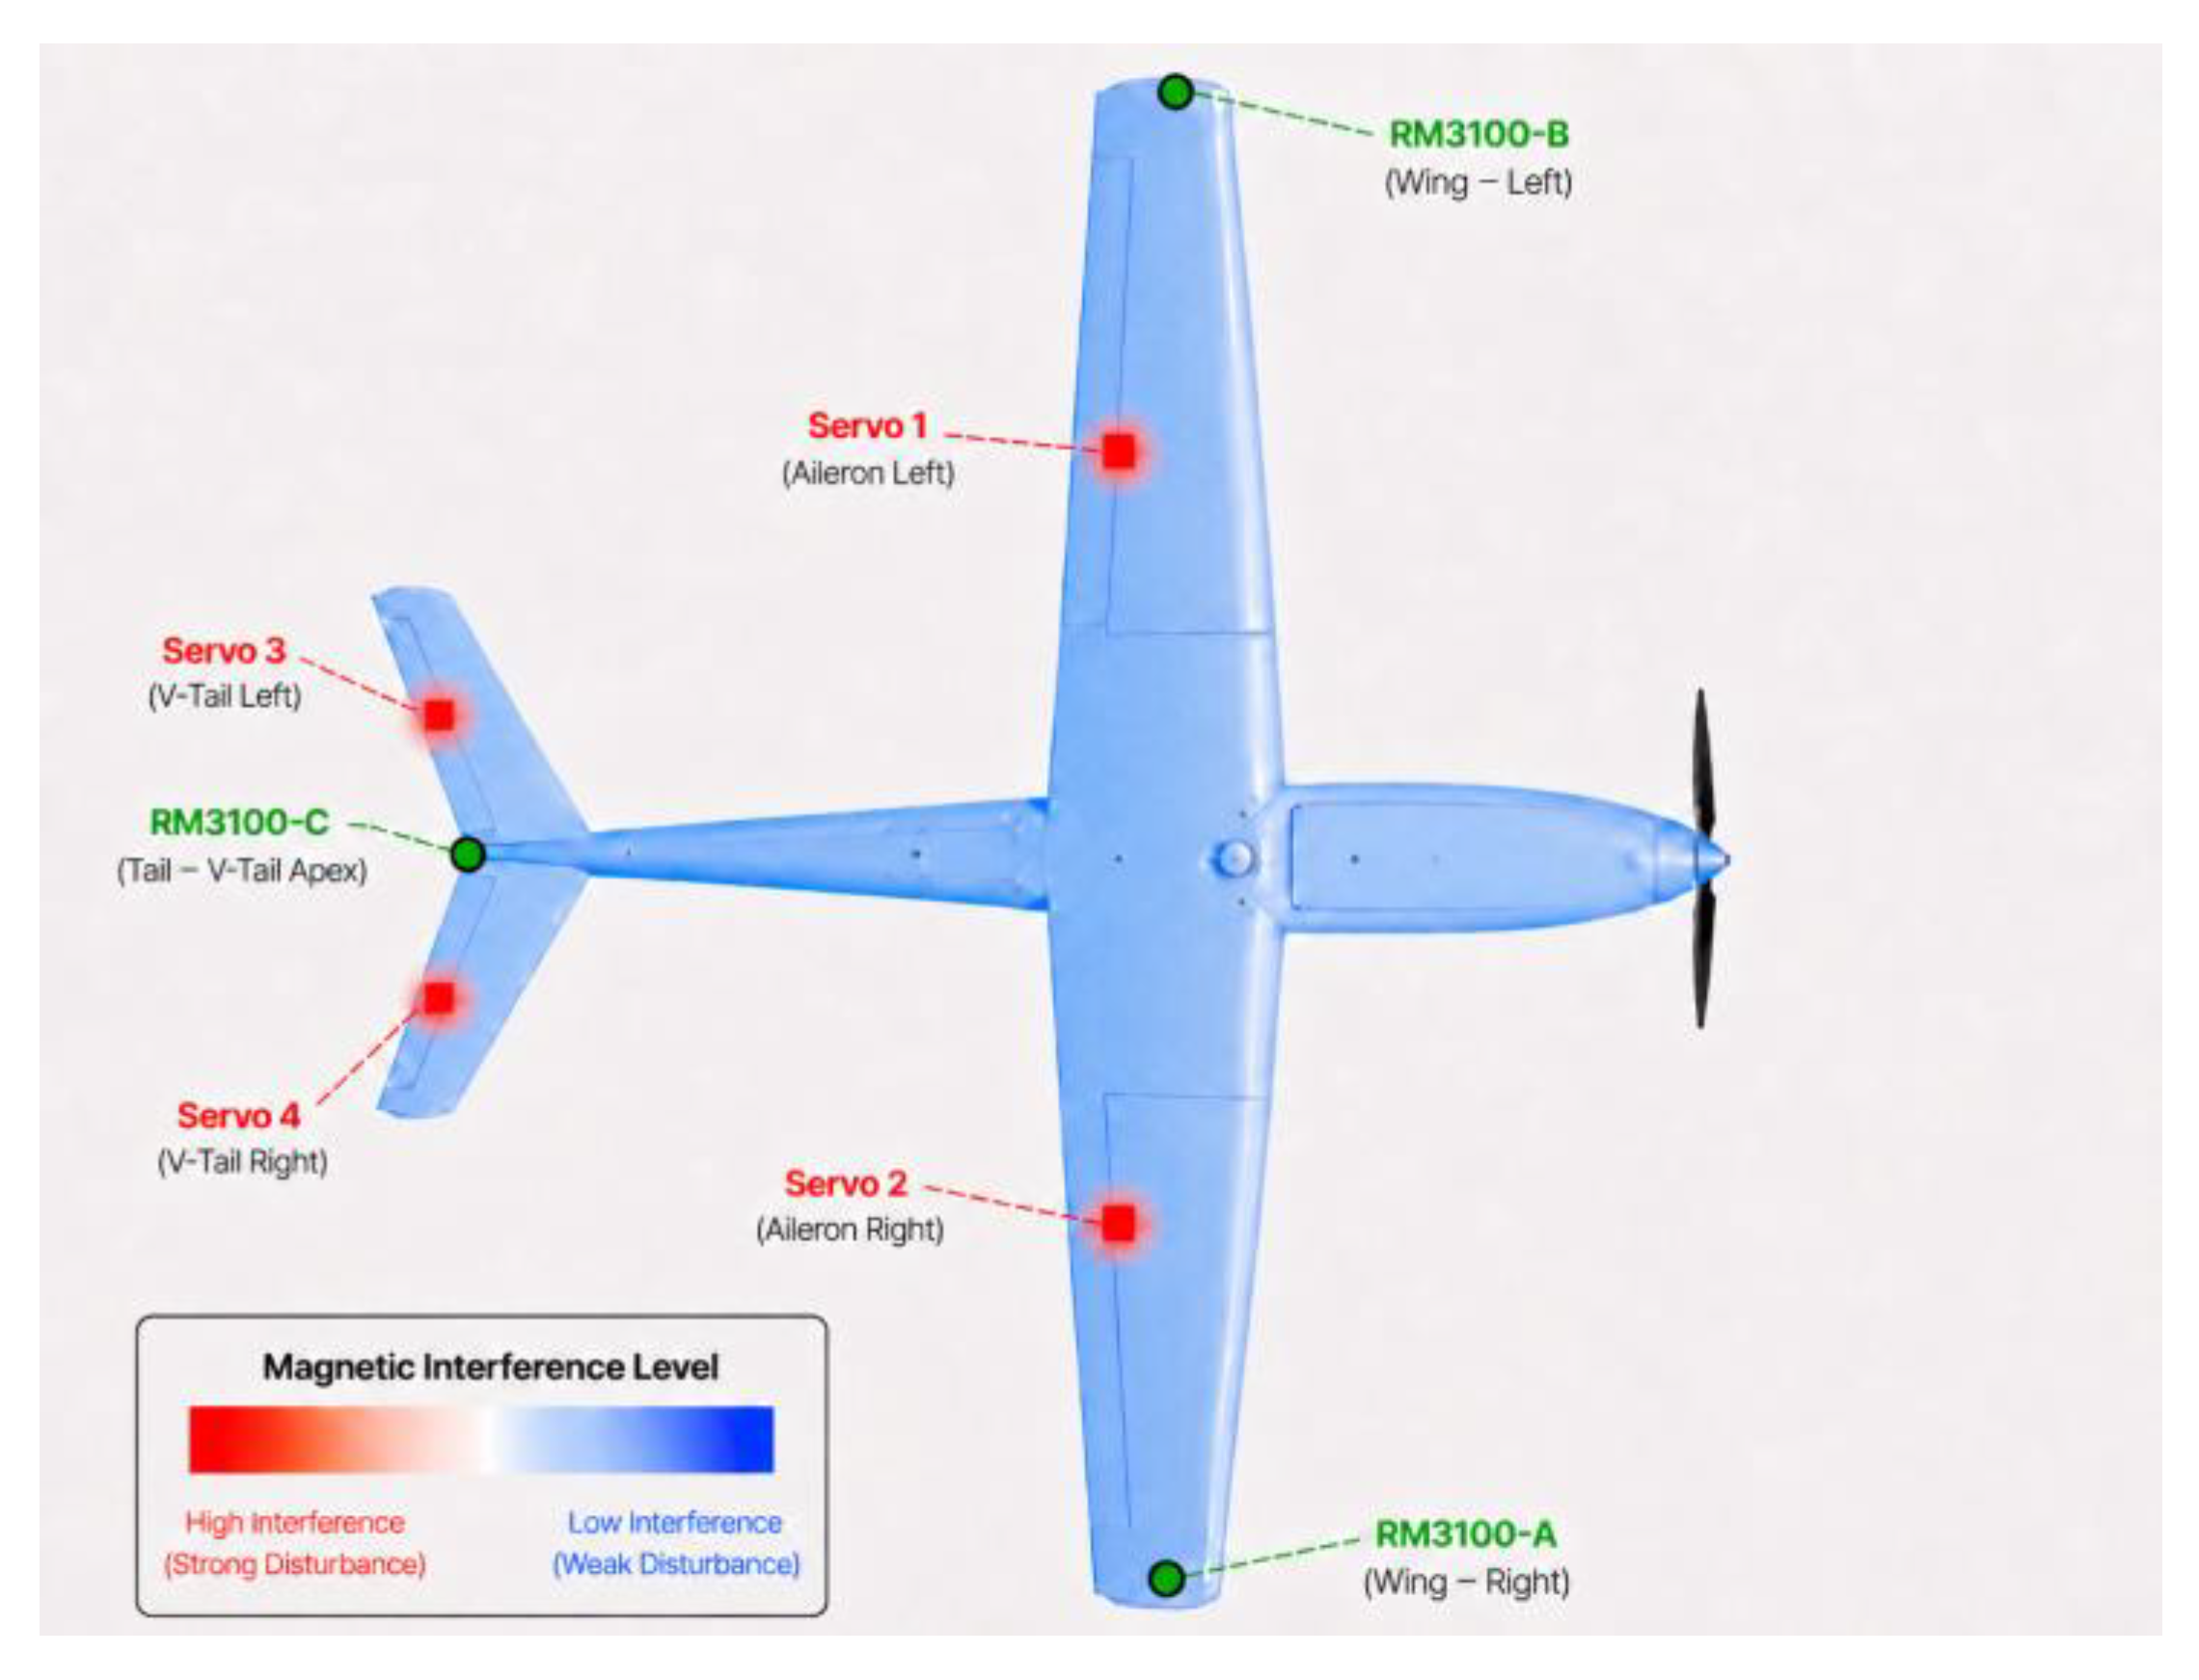
Figure 8.
Combined qualitative spatial representation of the principal propulsion-, power-, electronics-, and servo-related magnetic-interference regions relative to the three RM3100 sensor locations.
Figure 8.
Combined qualitative spatial representation of the principal propulsion-, power-, electronics-, and servo-related magnetic-interference regions relative to the three RM3100 sensor locations.
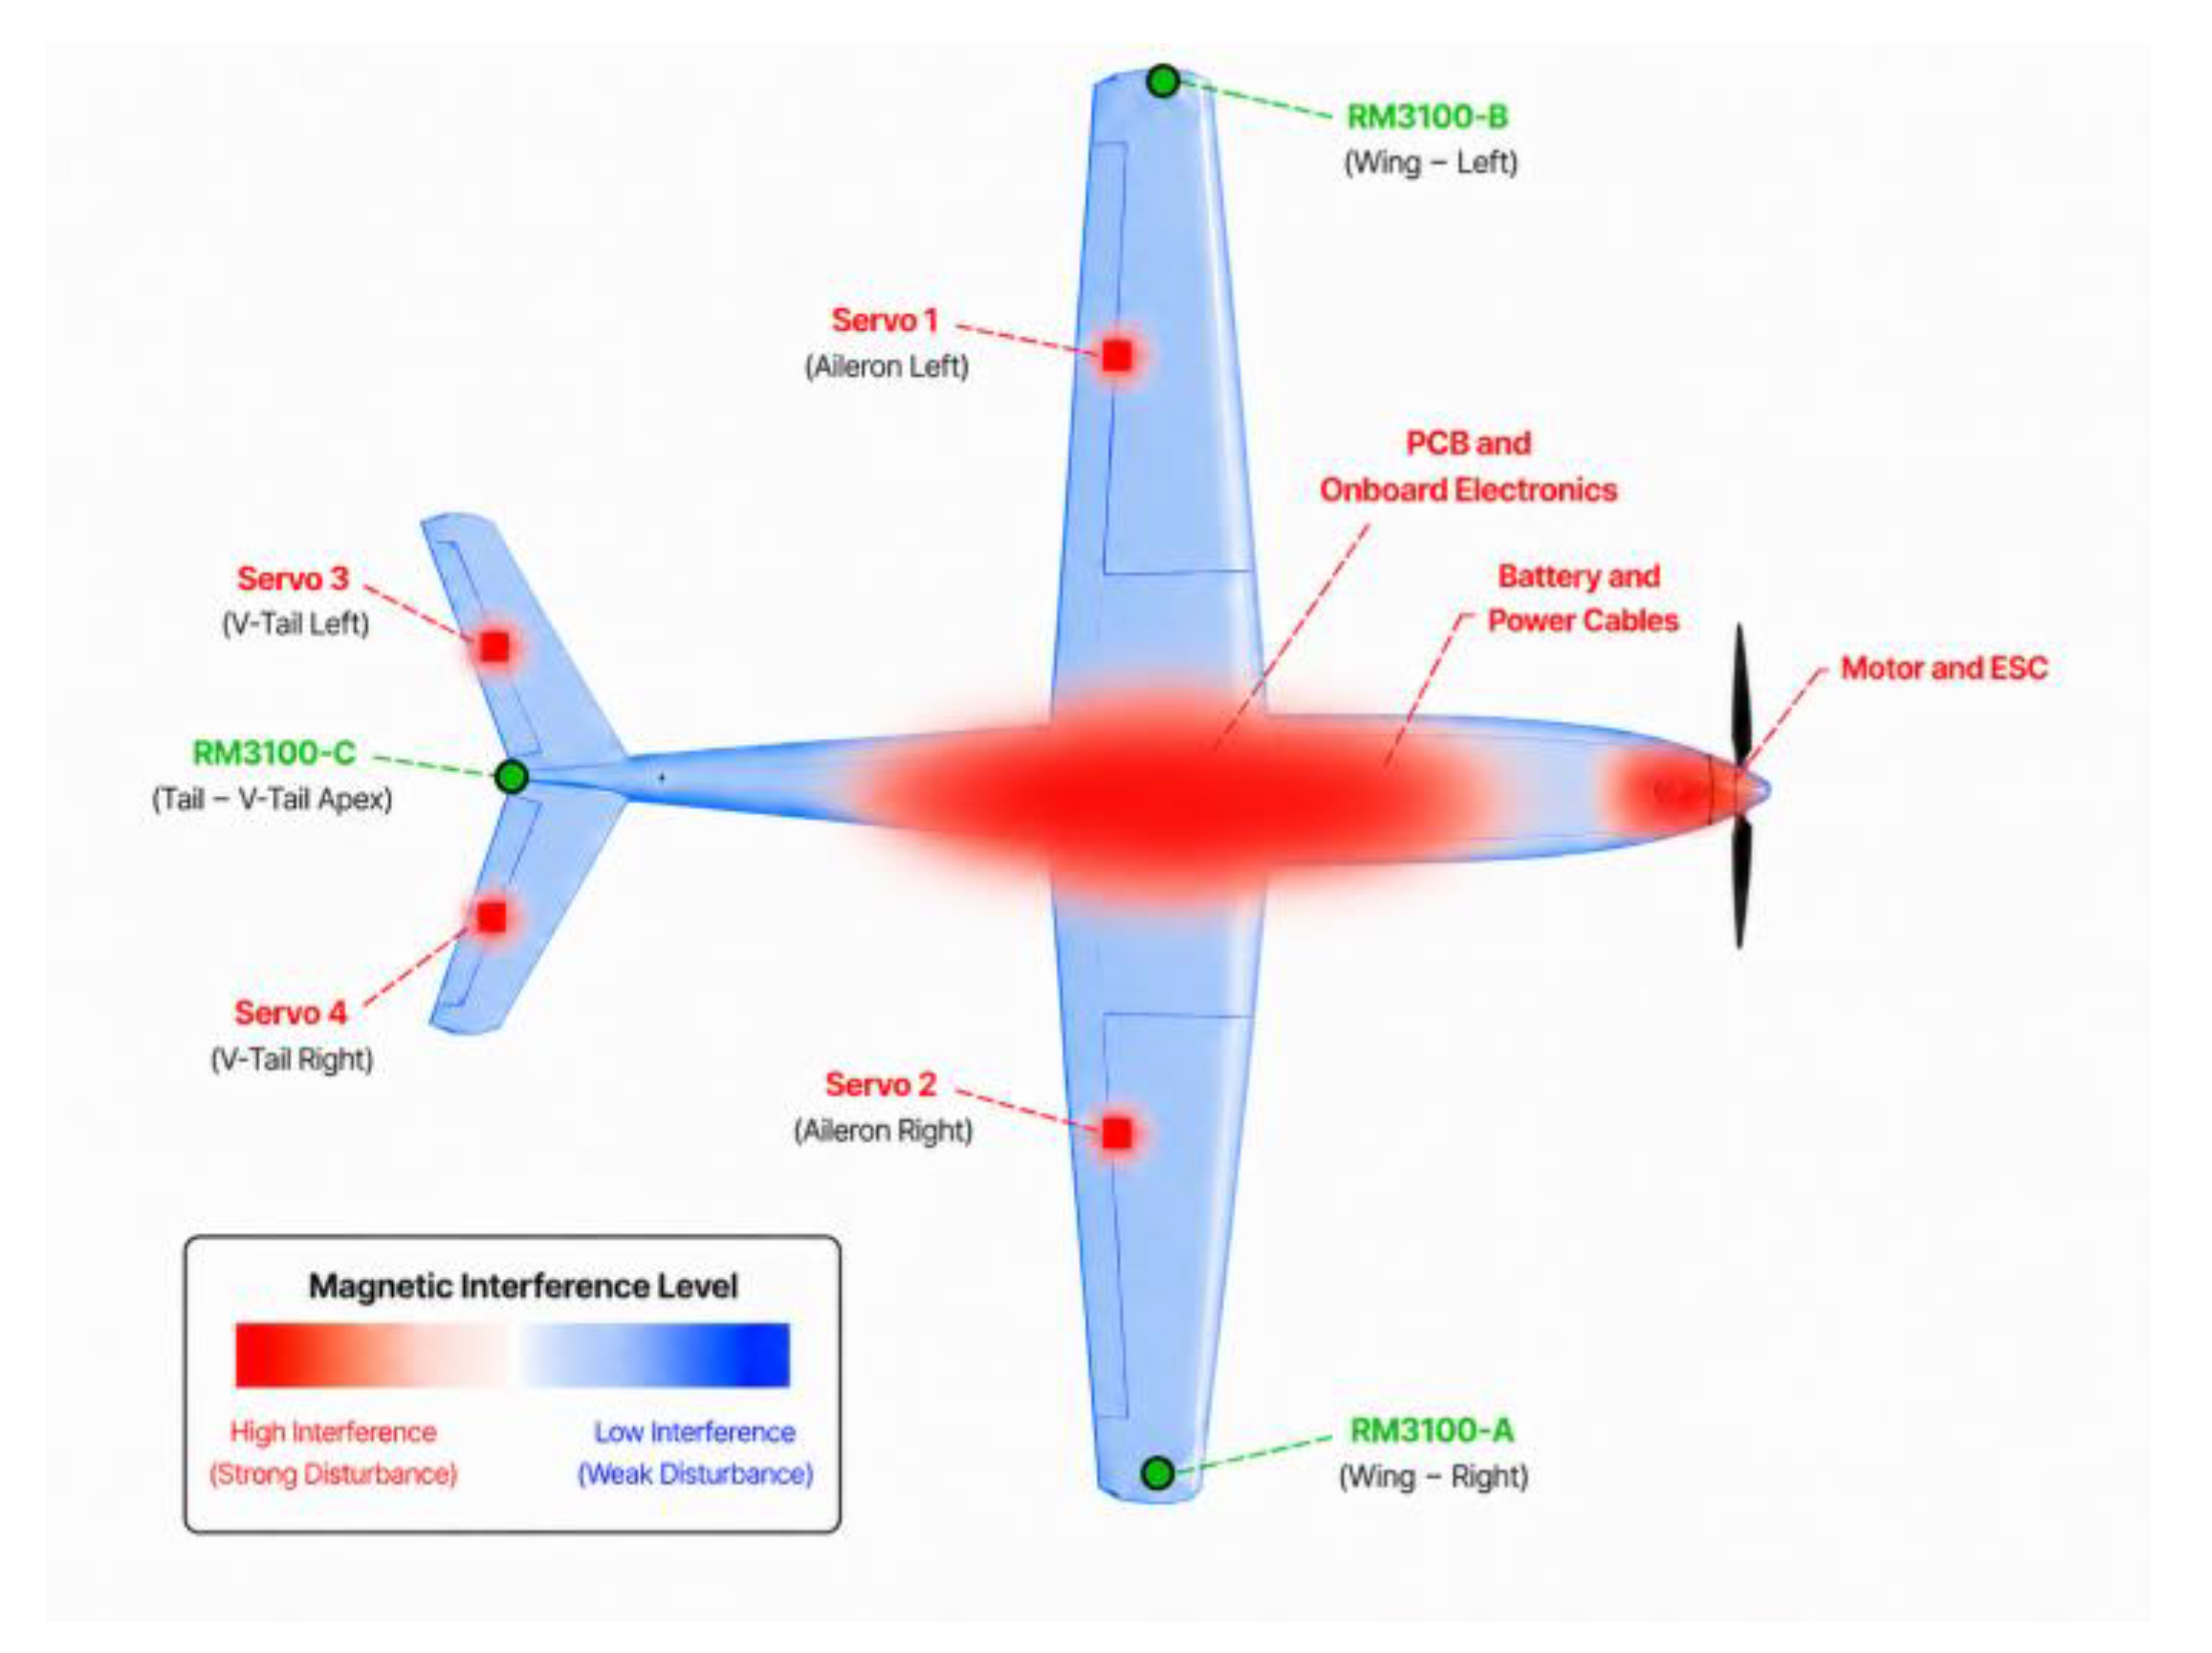
Figure 9.
UAV OFF–ON magnetic variation measured by RM3100-A, RM3100-B, and RM3100-C when the onboard electrical and electronic systems were powered while the propulsion motor remained inactive.
Figure 9.
UAV OFF–ON magnetic variation measured by RM3100-A, RM3100-B, and RM3100-C when the onboard electrical and electronic systems were powered while the propulsion motor remained inactive.
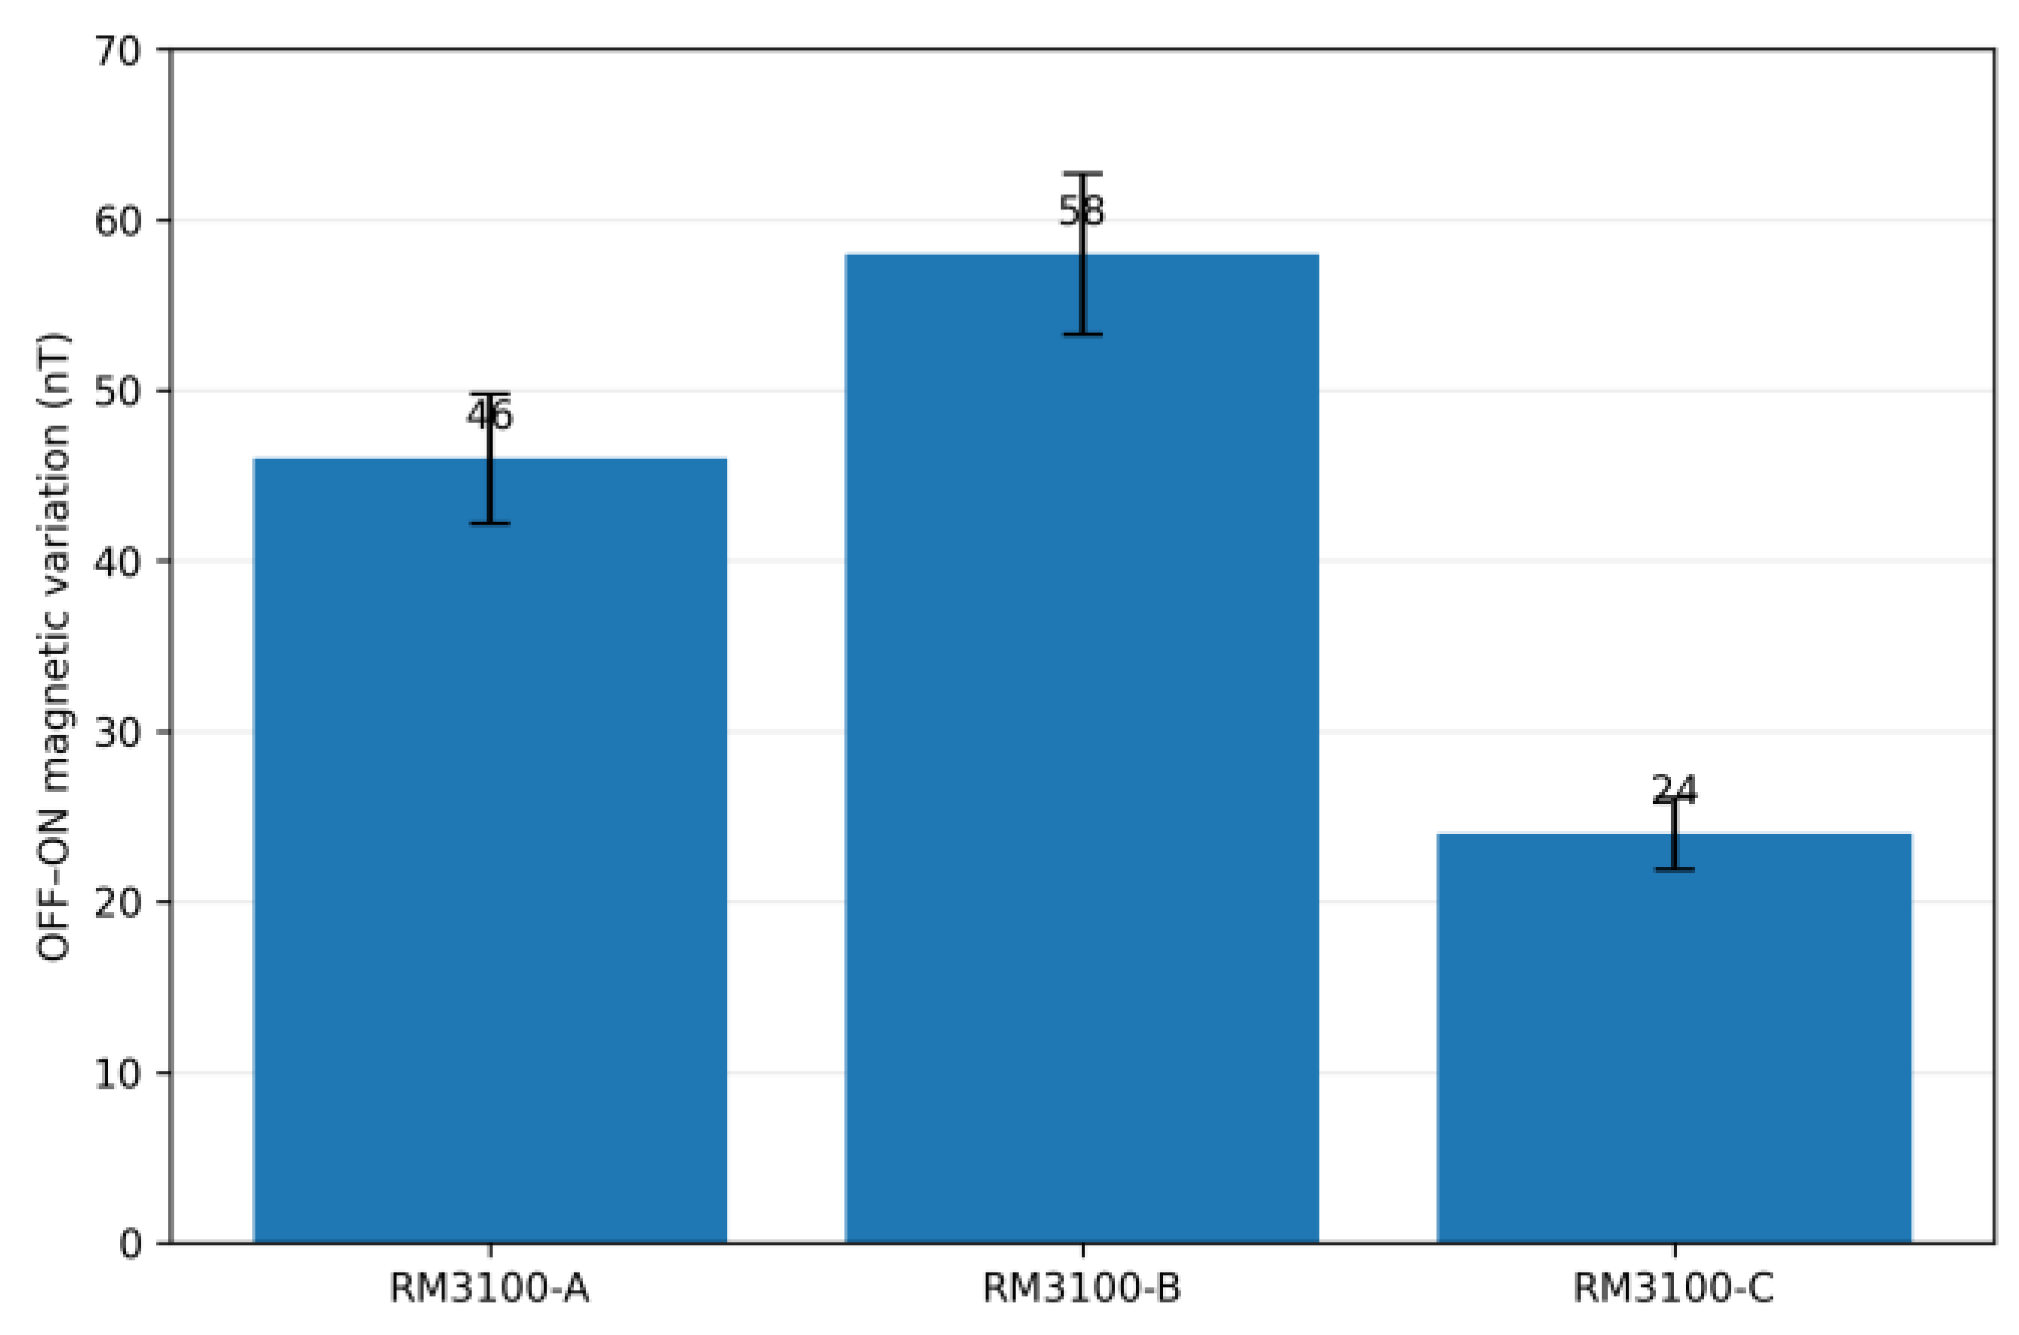
Figure 10.
Multi-level throttle-dependent magnetic response of RM3100-A, RM3100-B, and RM3100-C at throttle commands ranging from 15% to 100%. Points represent mean magnetic variation and error bars indicate ±1 SD across repeated trials.
Figure 10.
Multi-level throttle-dependent magnetic response of RM3100-A, RM3100-B, and RM3100-C at throttle commands ranging from 15% to 100%. Points represent mean magnetic variation and error bars indicate ±1 SD across repeated trials.
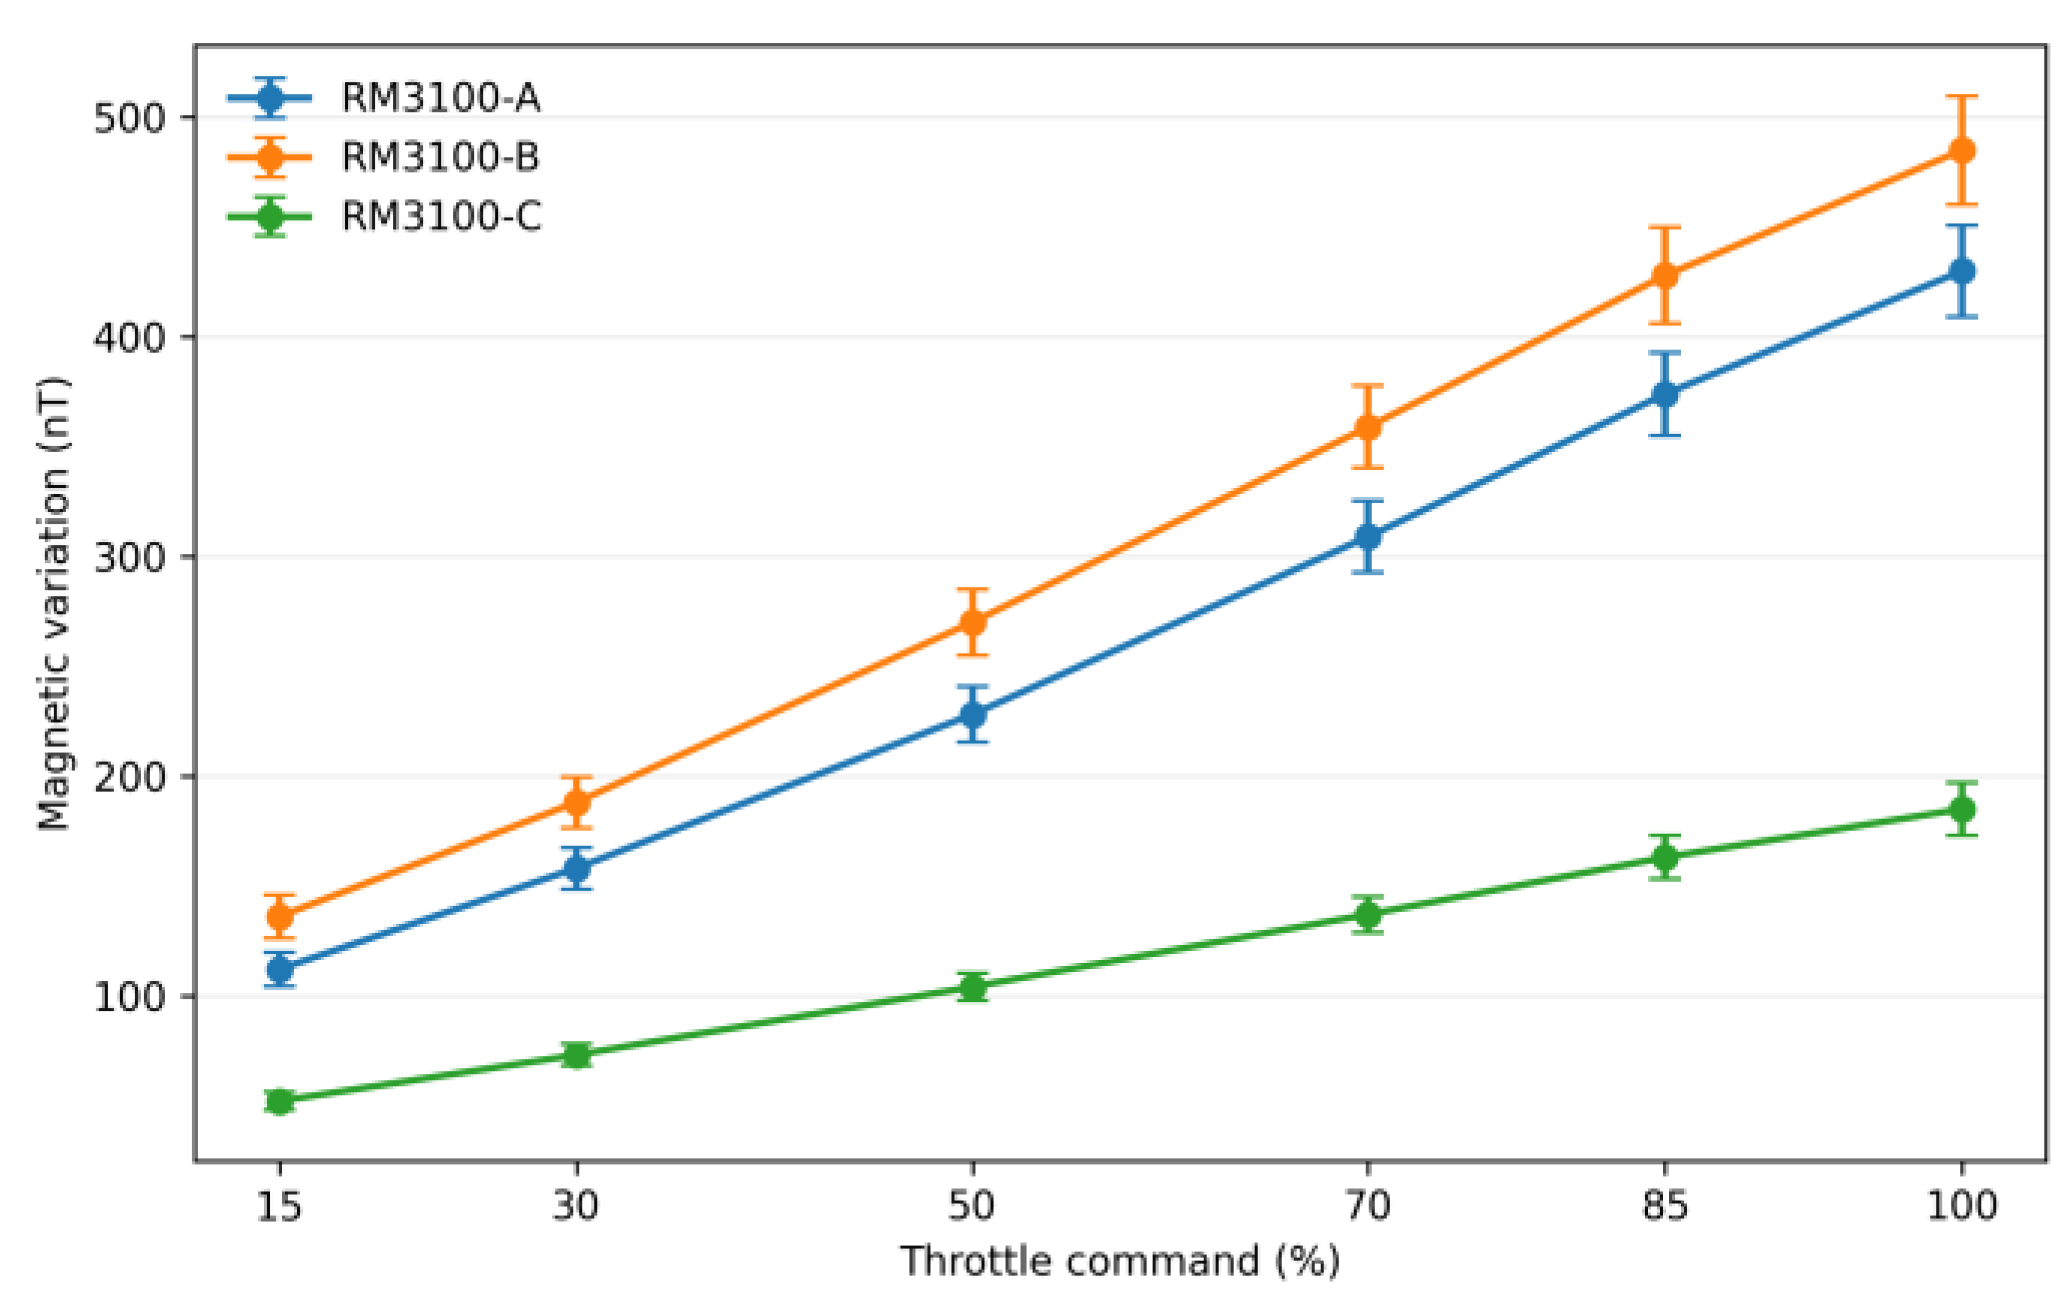
Figure 11.
Magnetic variation of RM3100-A, RM3100-B, and RM3100-C under no-servo, wing-servo, tail-servo,
and combined-servo actuation conditions.
Figure 11.
Magnetic variation of RM3100-A, RM3100-B, and RM3100-C under no-servo, wing-servo, tail-servo,
and combined-servo actuation conditions.
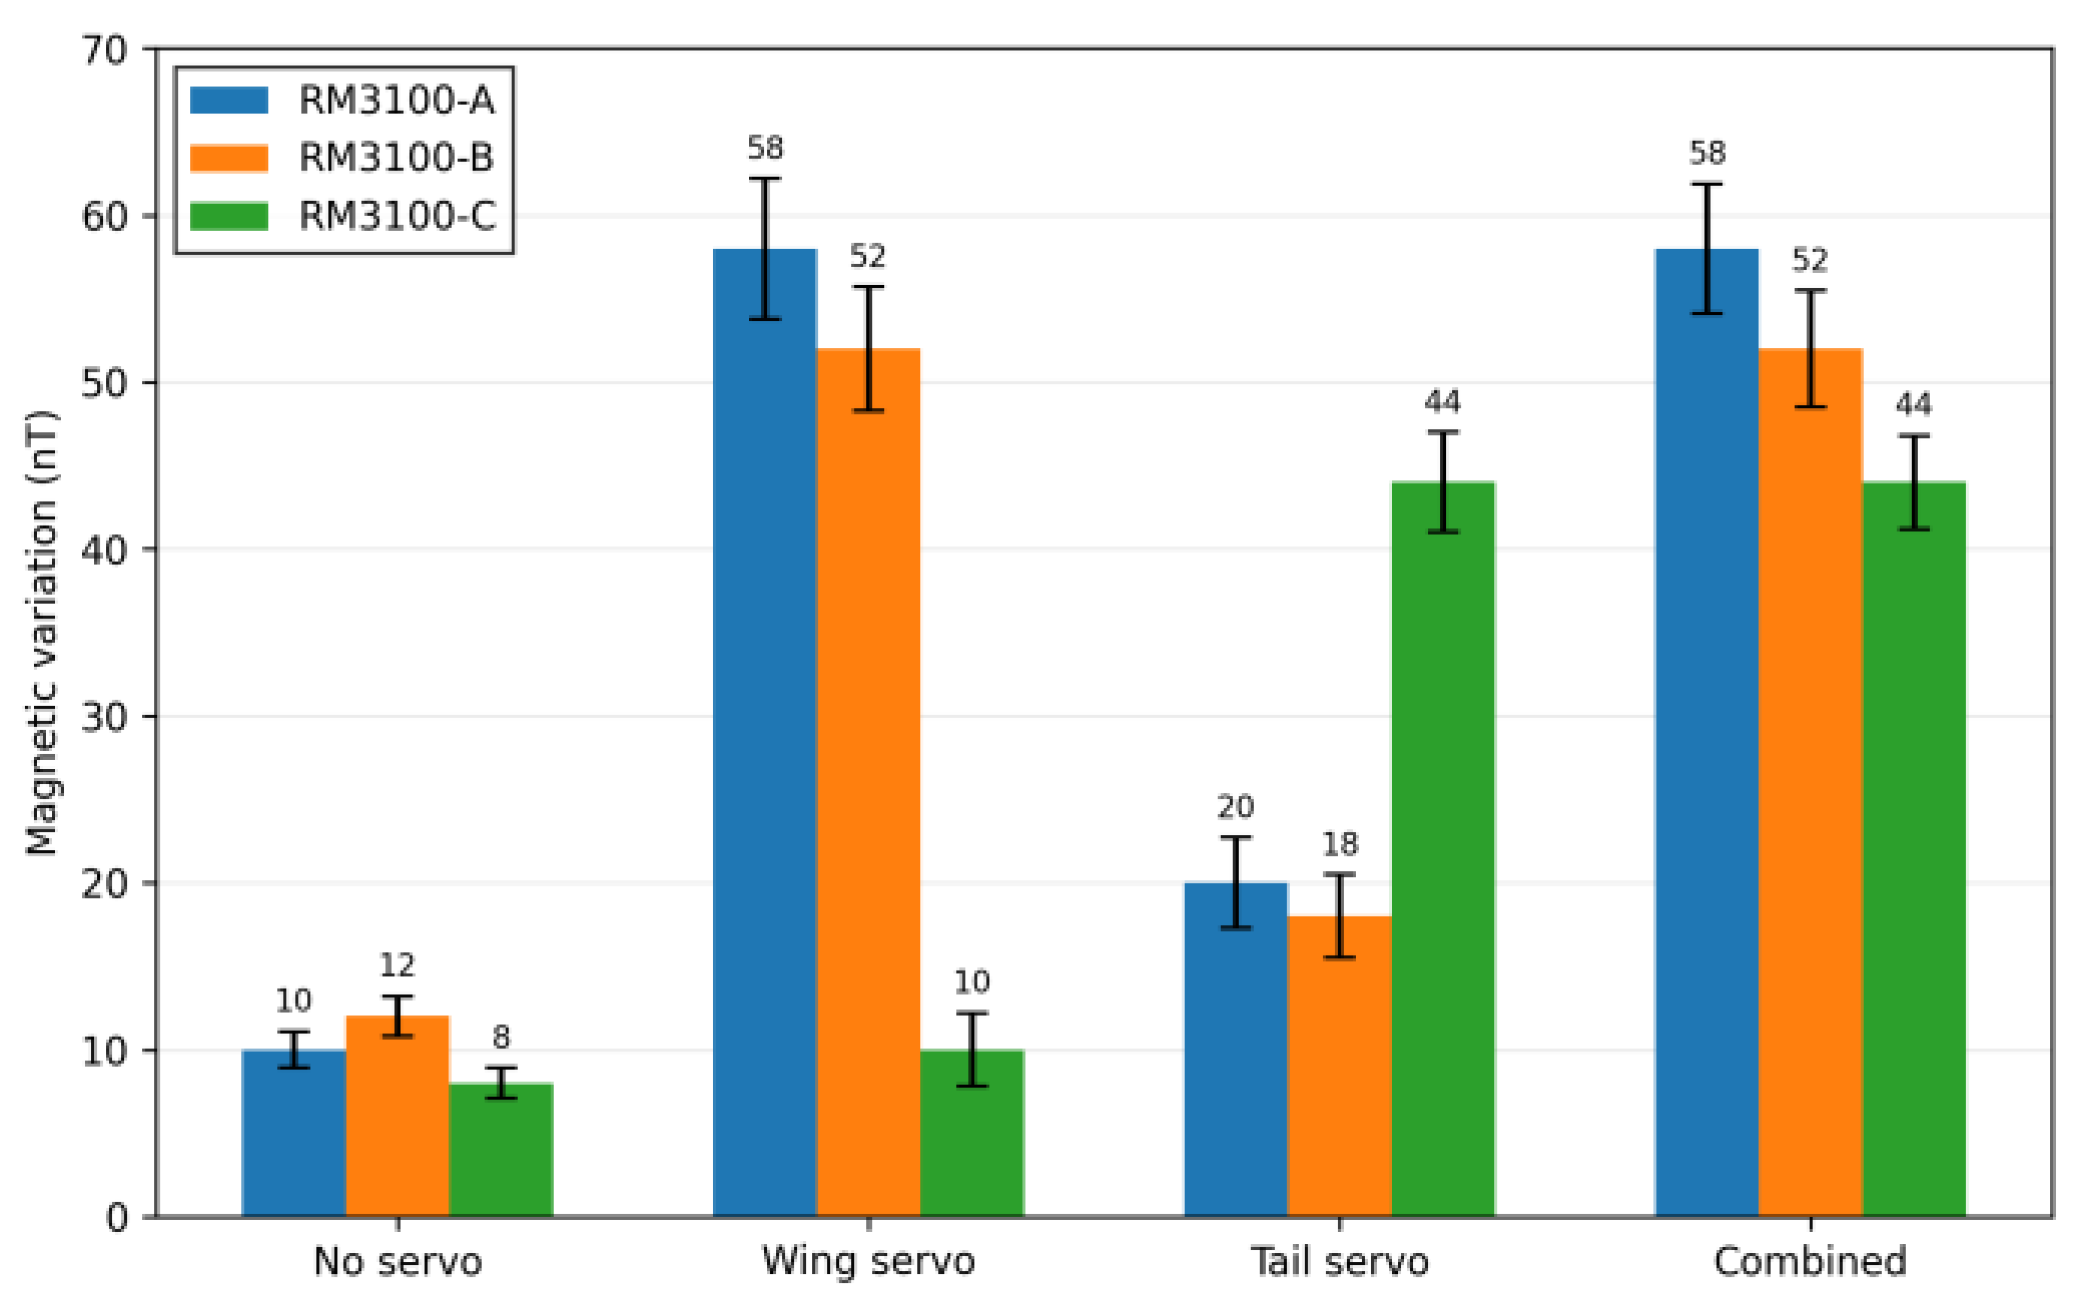
Figure 12.
Magnetic responses of RM3100-A, RM3100-B, and RM3100-C at 15% and 100% throttle for the three original installation configurations.
Figure 12.
Magnetic responses of RM3100-A, RM3100-B, and RM3100-C at 15% and 100% throttle for the three original installation configurations.
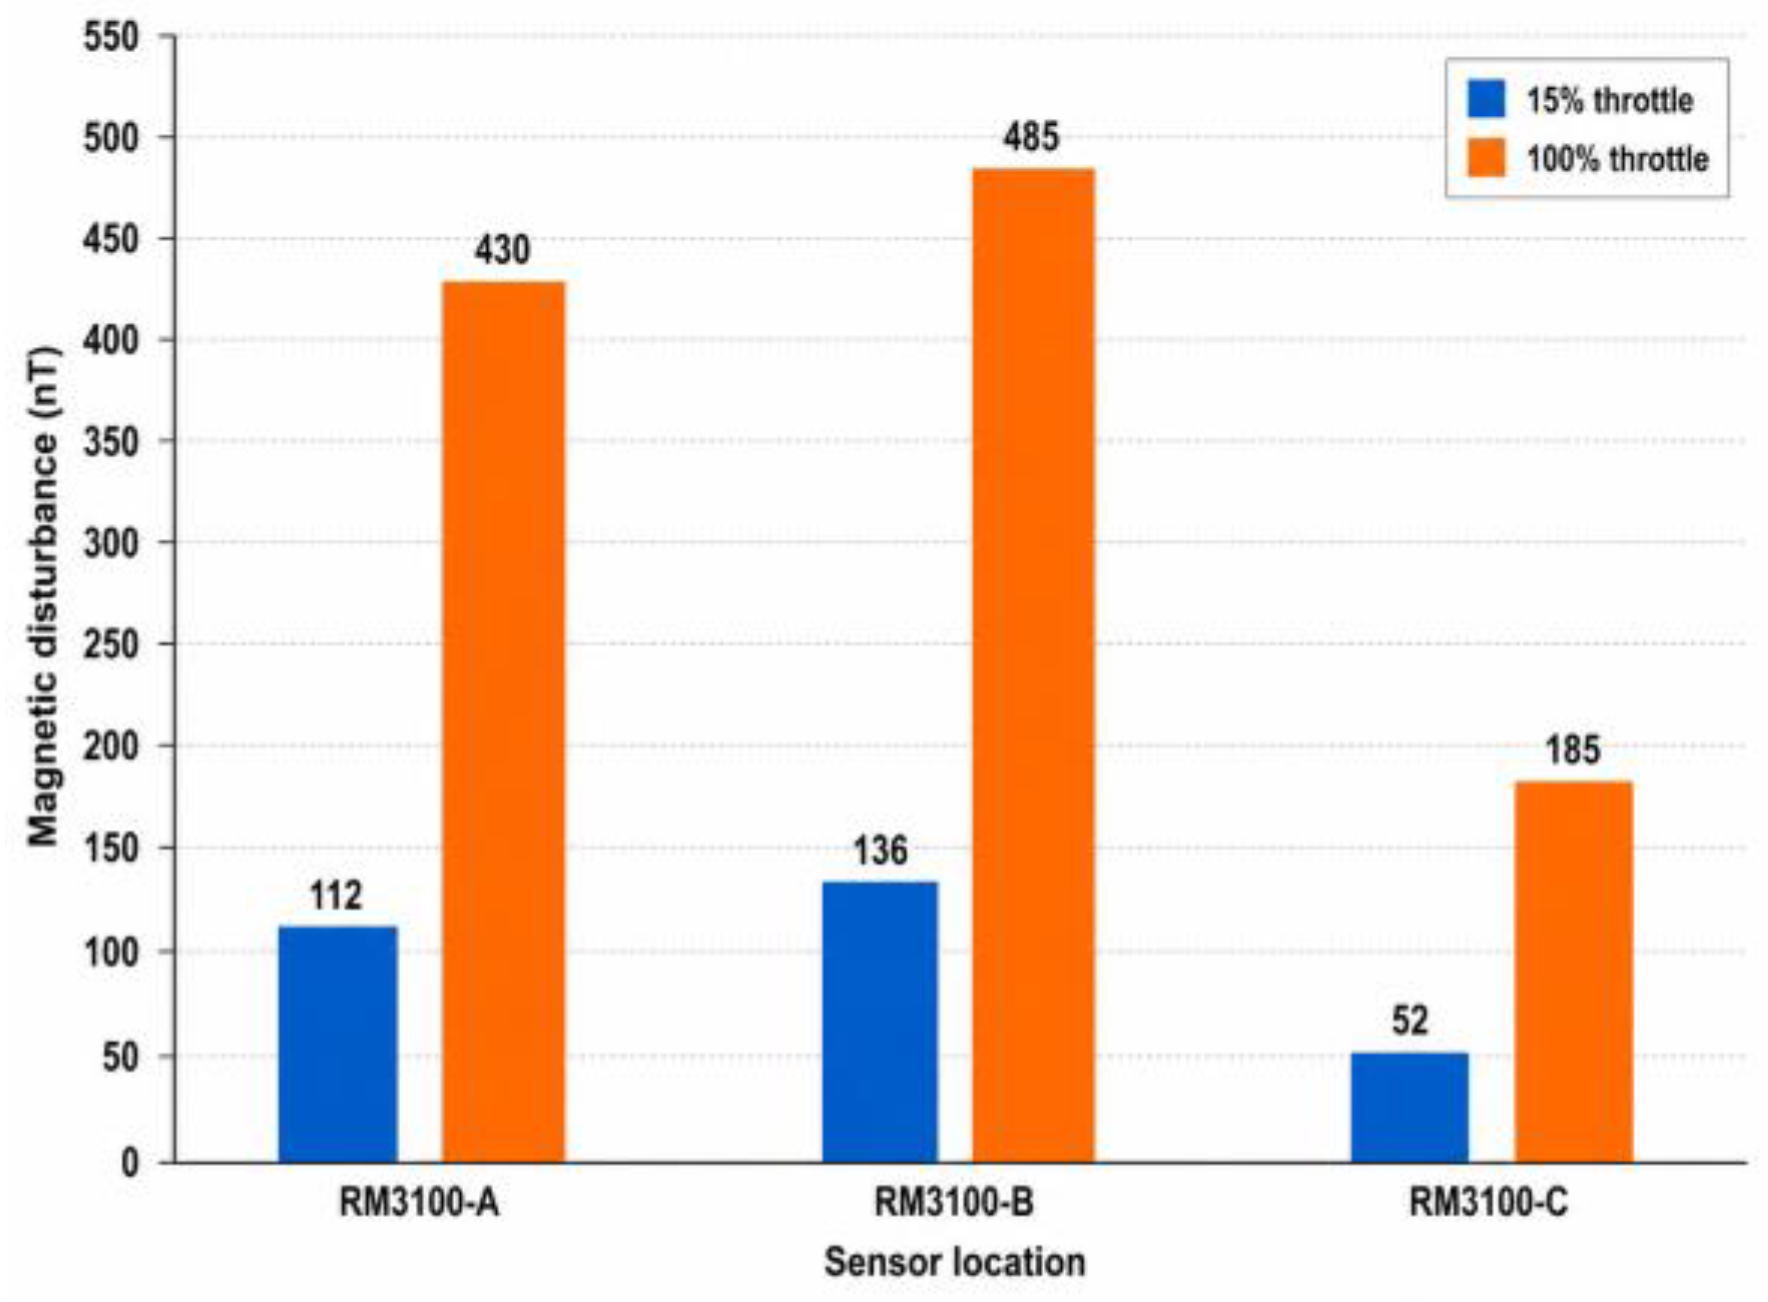
Figure 14.
Comparison of ground-based and airborne magnetic standard deviation for the three original RM3100 installation configurations.
Figure 14.
Comparison of ground-based and airborne magnetic standard deviation for the three original RM3100 installation configurations.
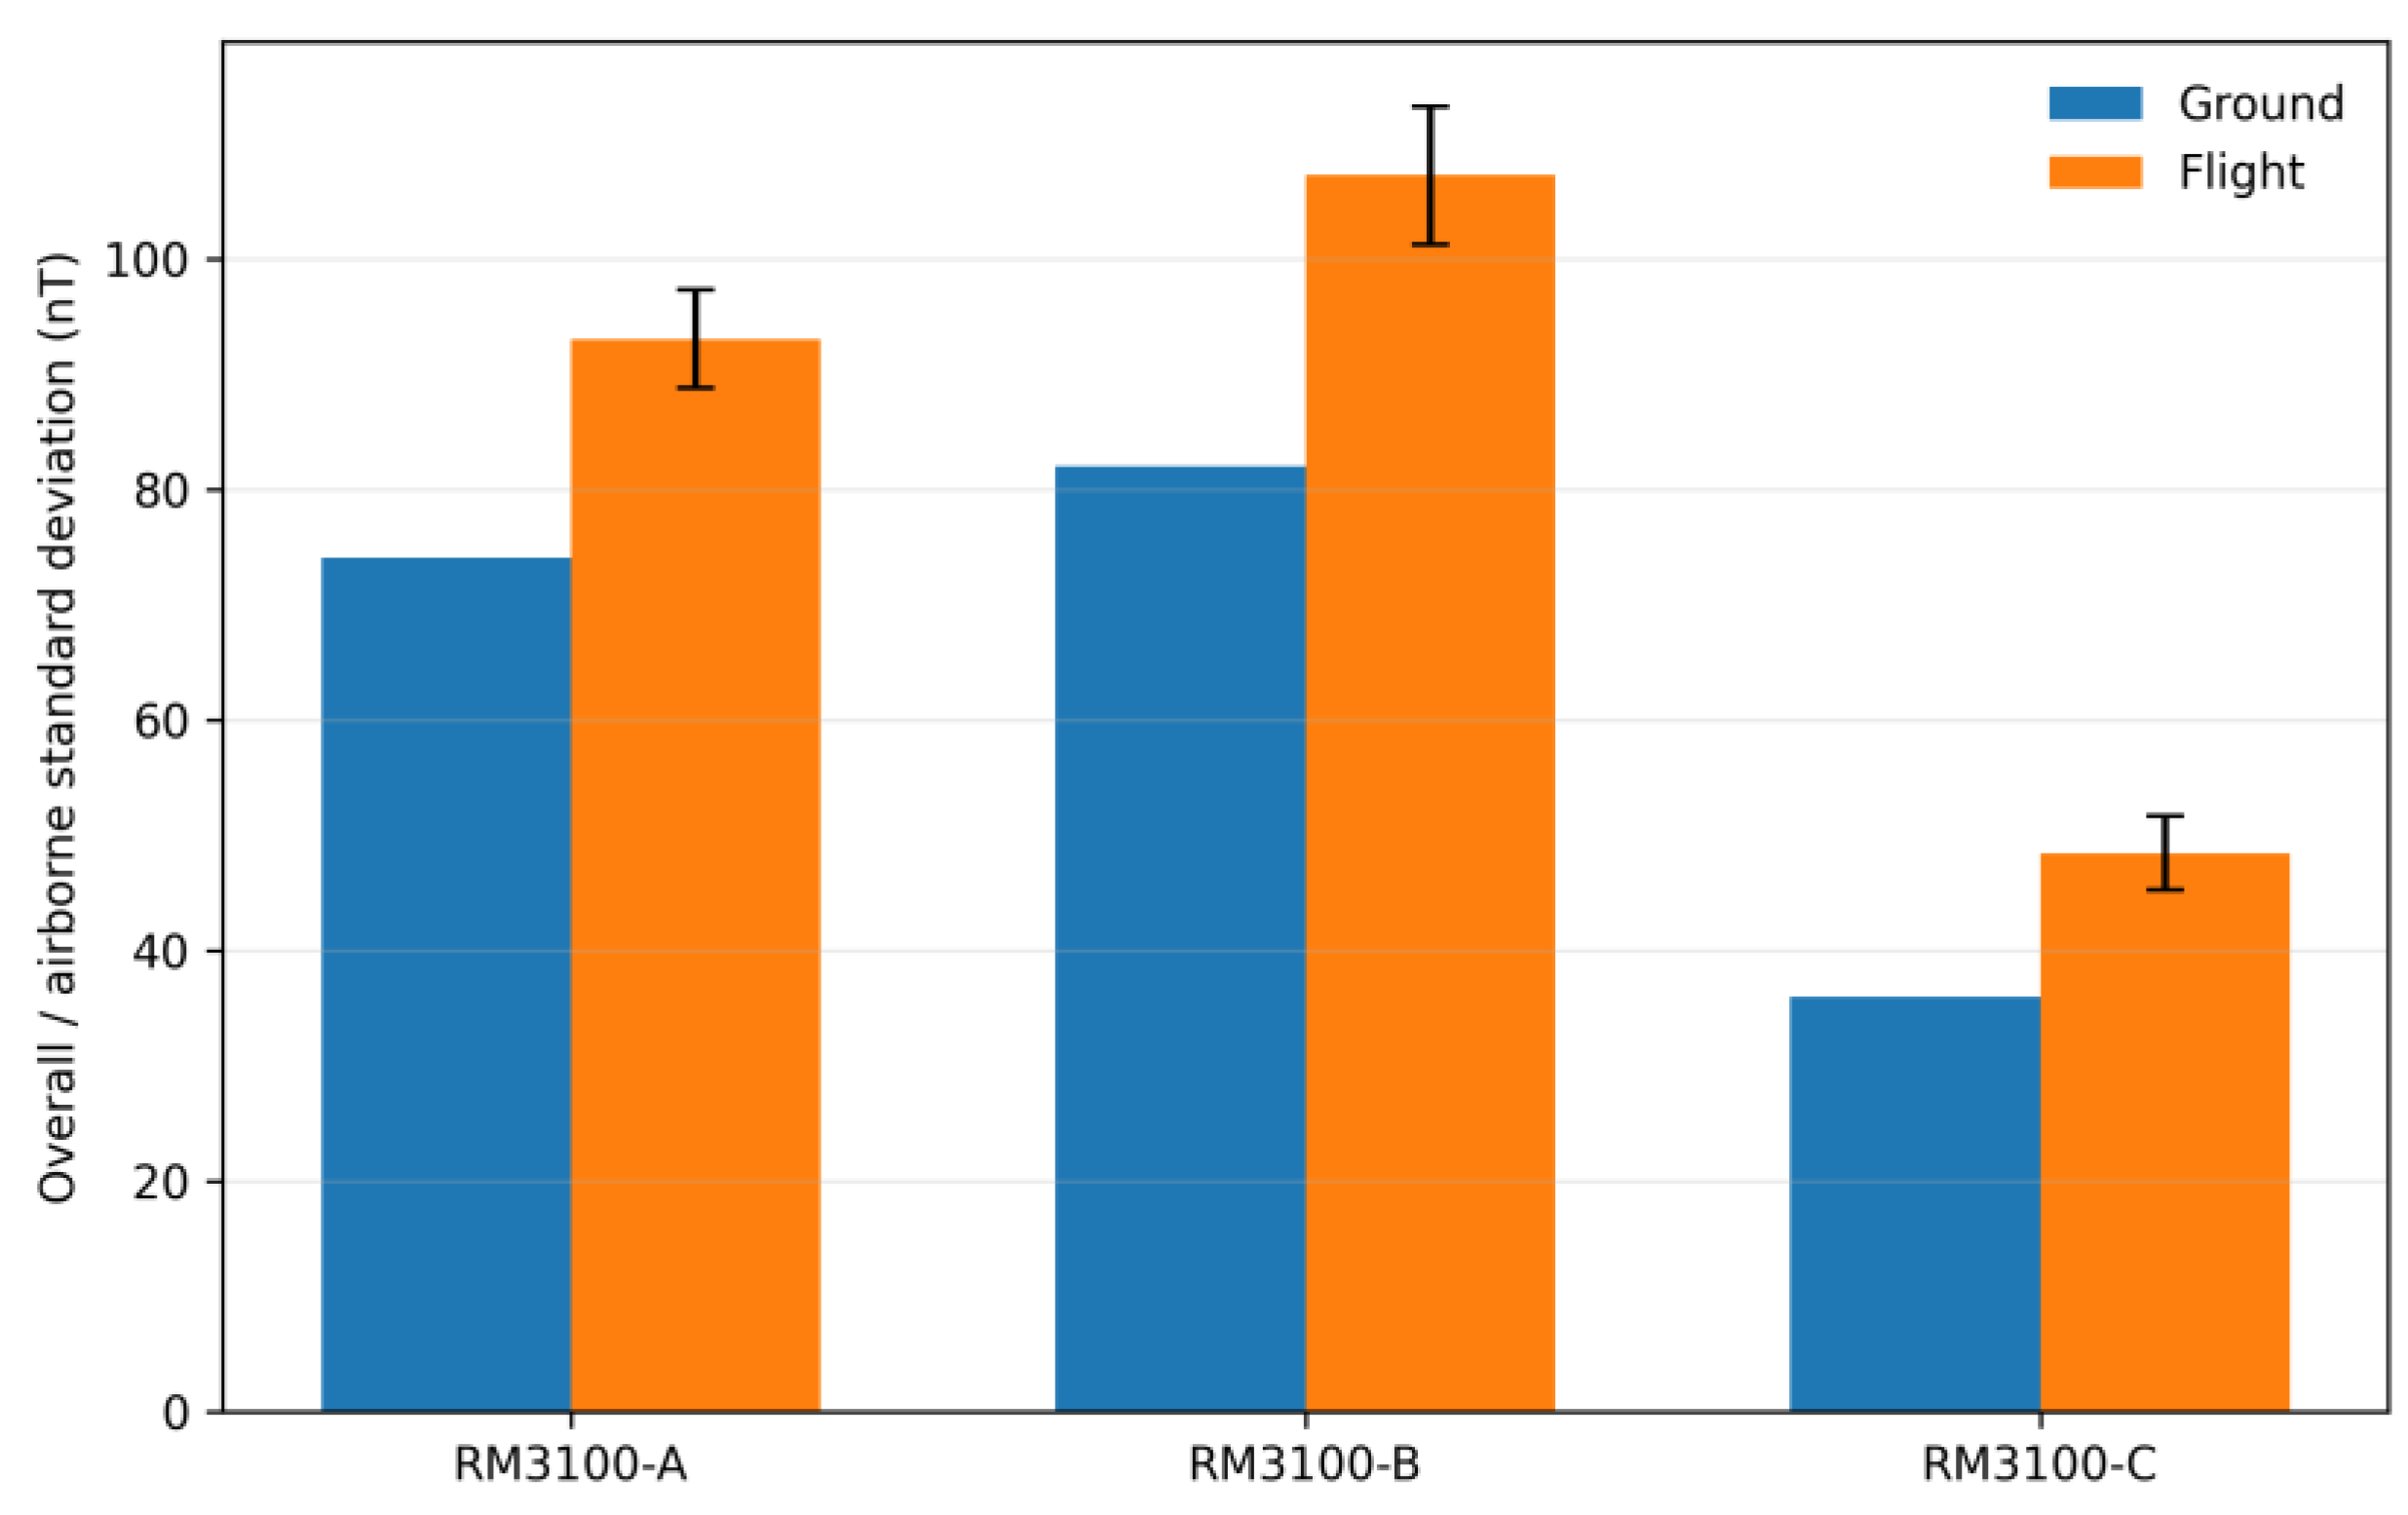
Figure 15.
Magnetic standard deviation obtained during repeated outbound and reciprocal flight passes for RM3100-A, RM3100-B, and RM3100-C.
Figure 15.
Magnetic standard deviation obtained during repeated outbound and reciprocal flight passes for RM3100-A, RM3100-B, and RM3100-C.
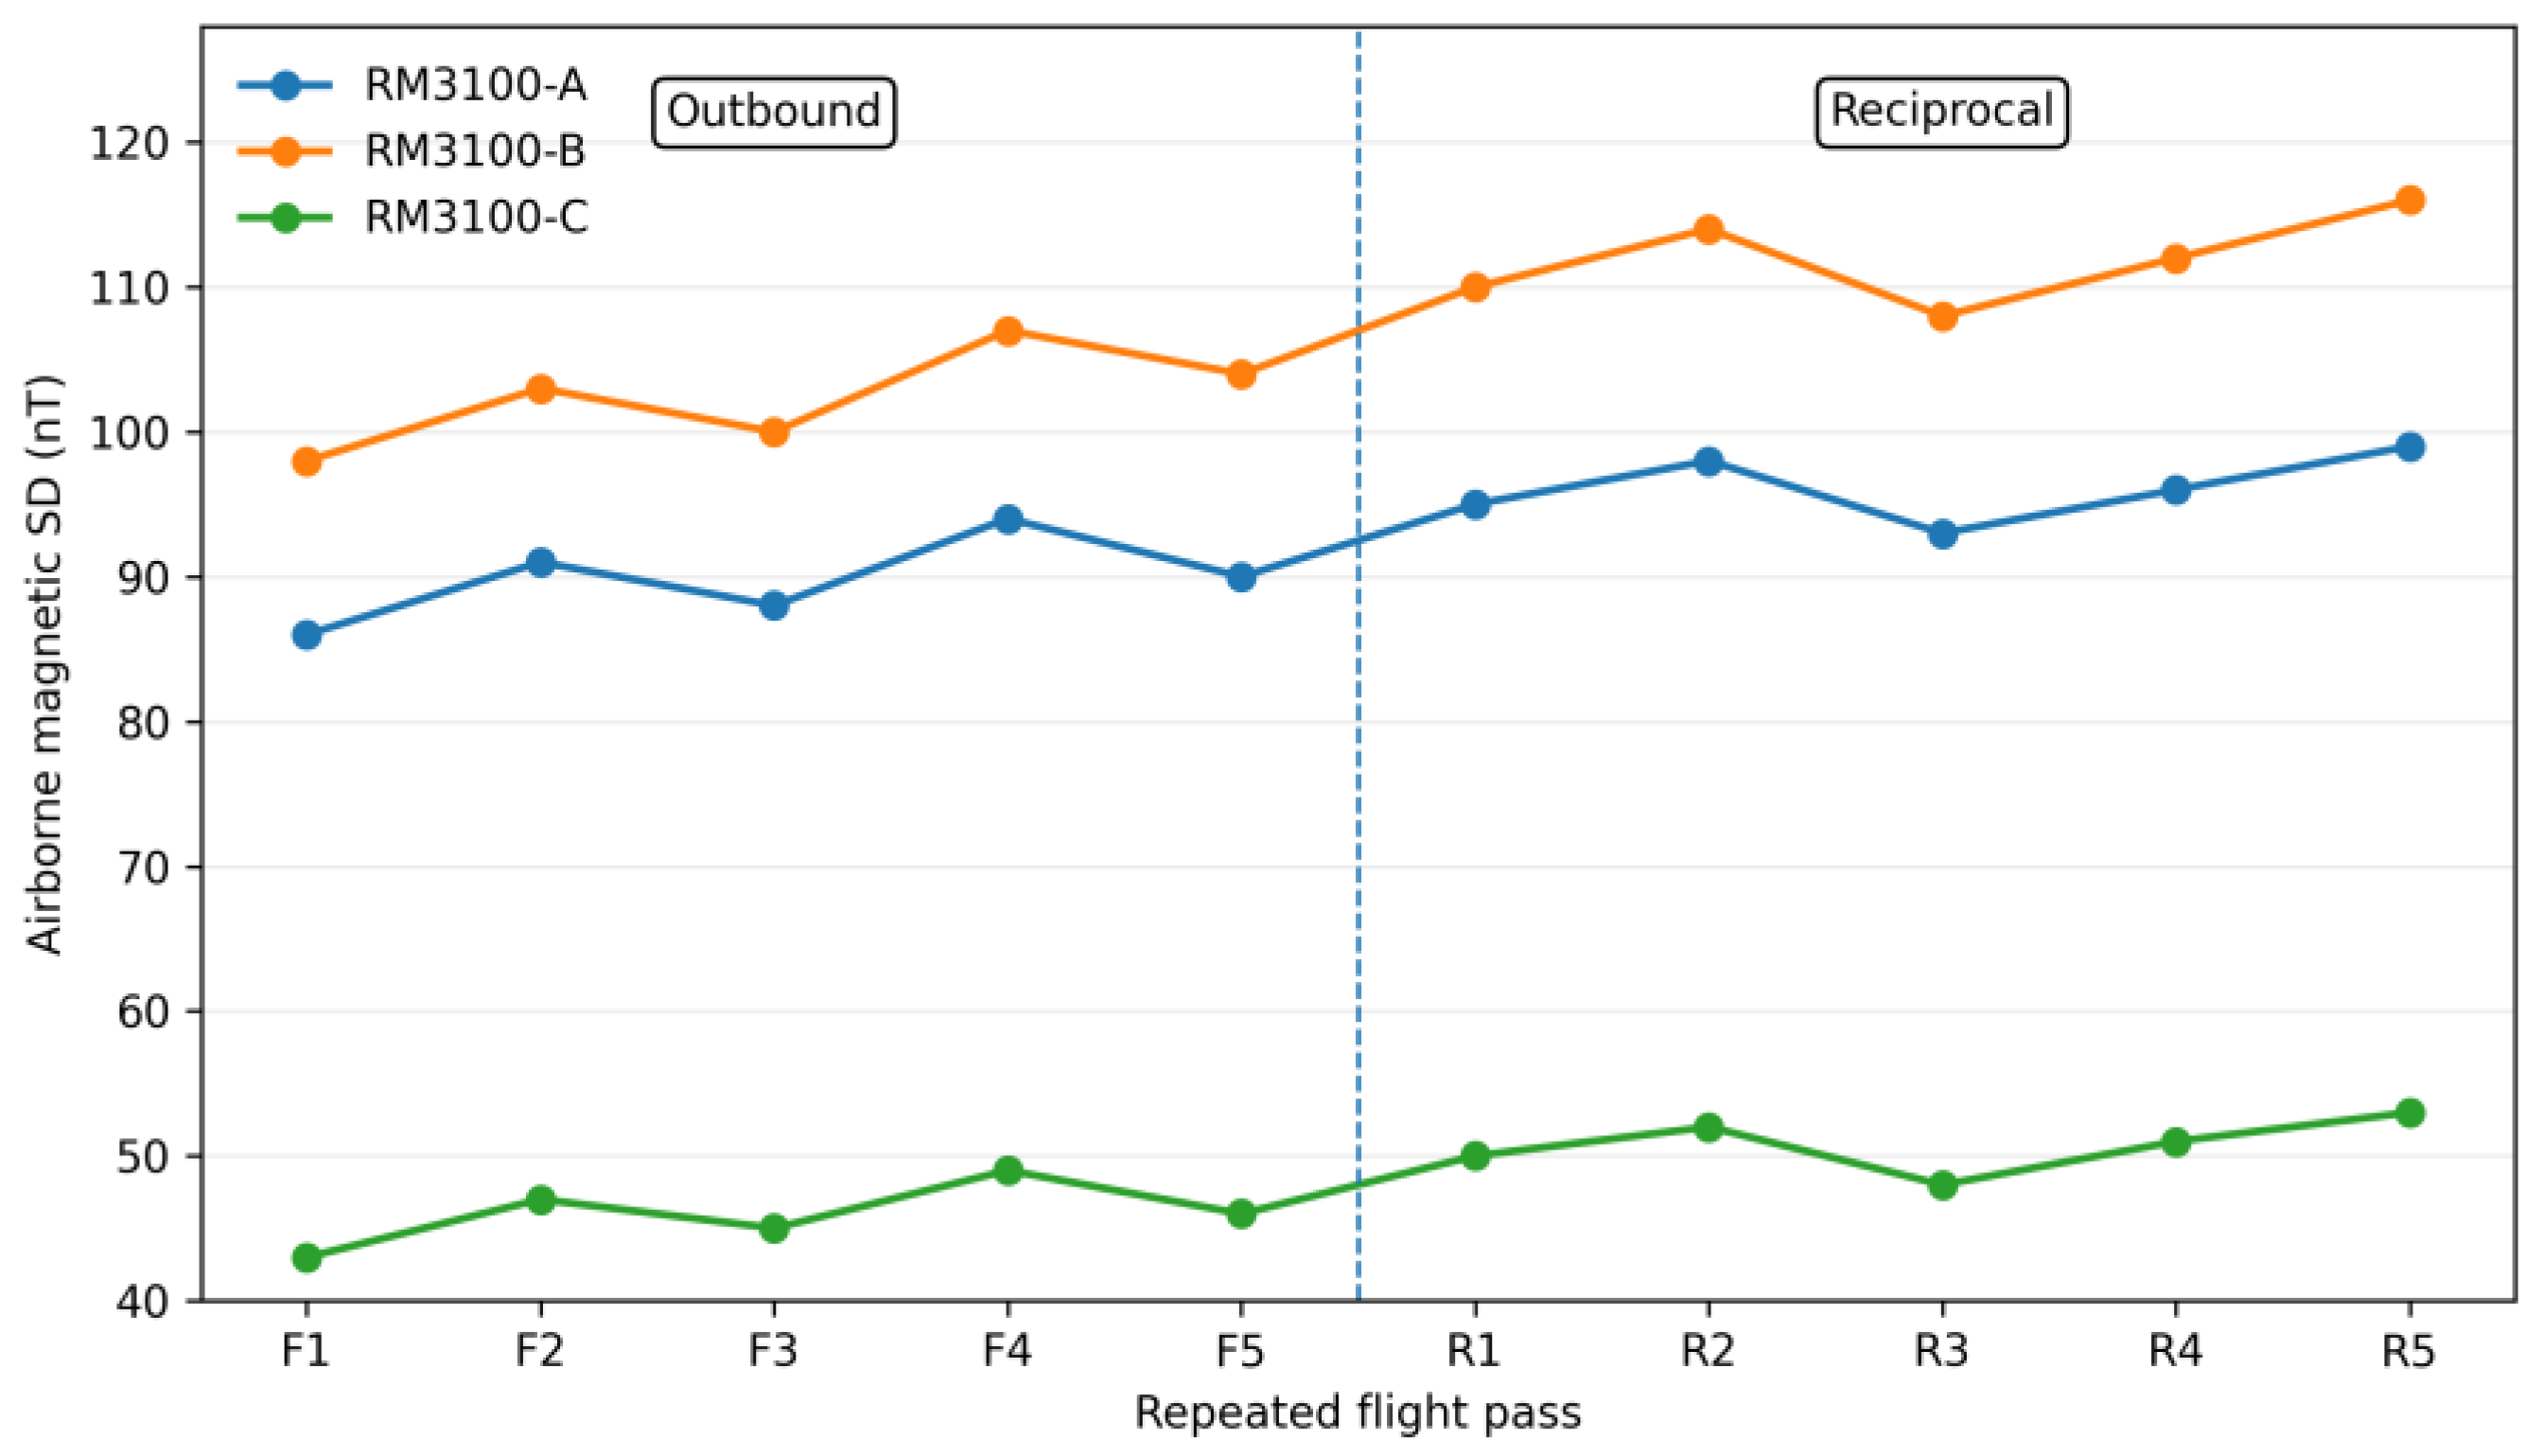
Figure 16.
Retained repeat-line RMSE summaries obtained from repeated airborne flight passes for the three RM3100 installation configurations. Lower values indicate greater repeat-line consistency.
Figure 16.
Retained repeat-line RMSE summaries obtained from repeated airborne flight passes for the three RM3100 installation configurations. Lower values indicate greater repeat-line consistency.
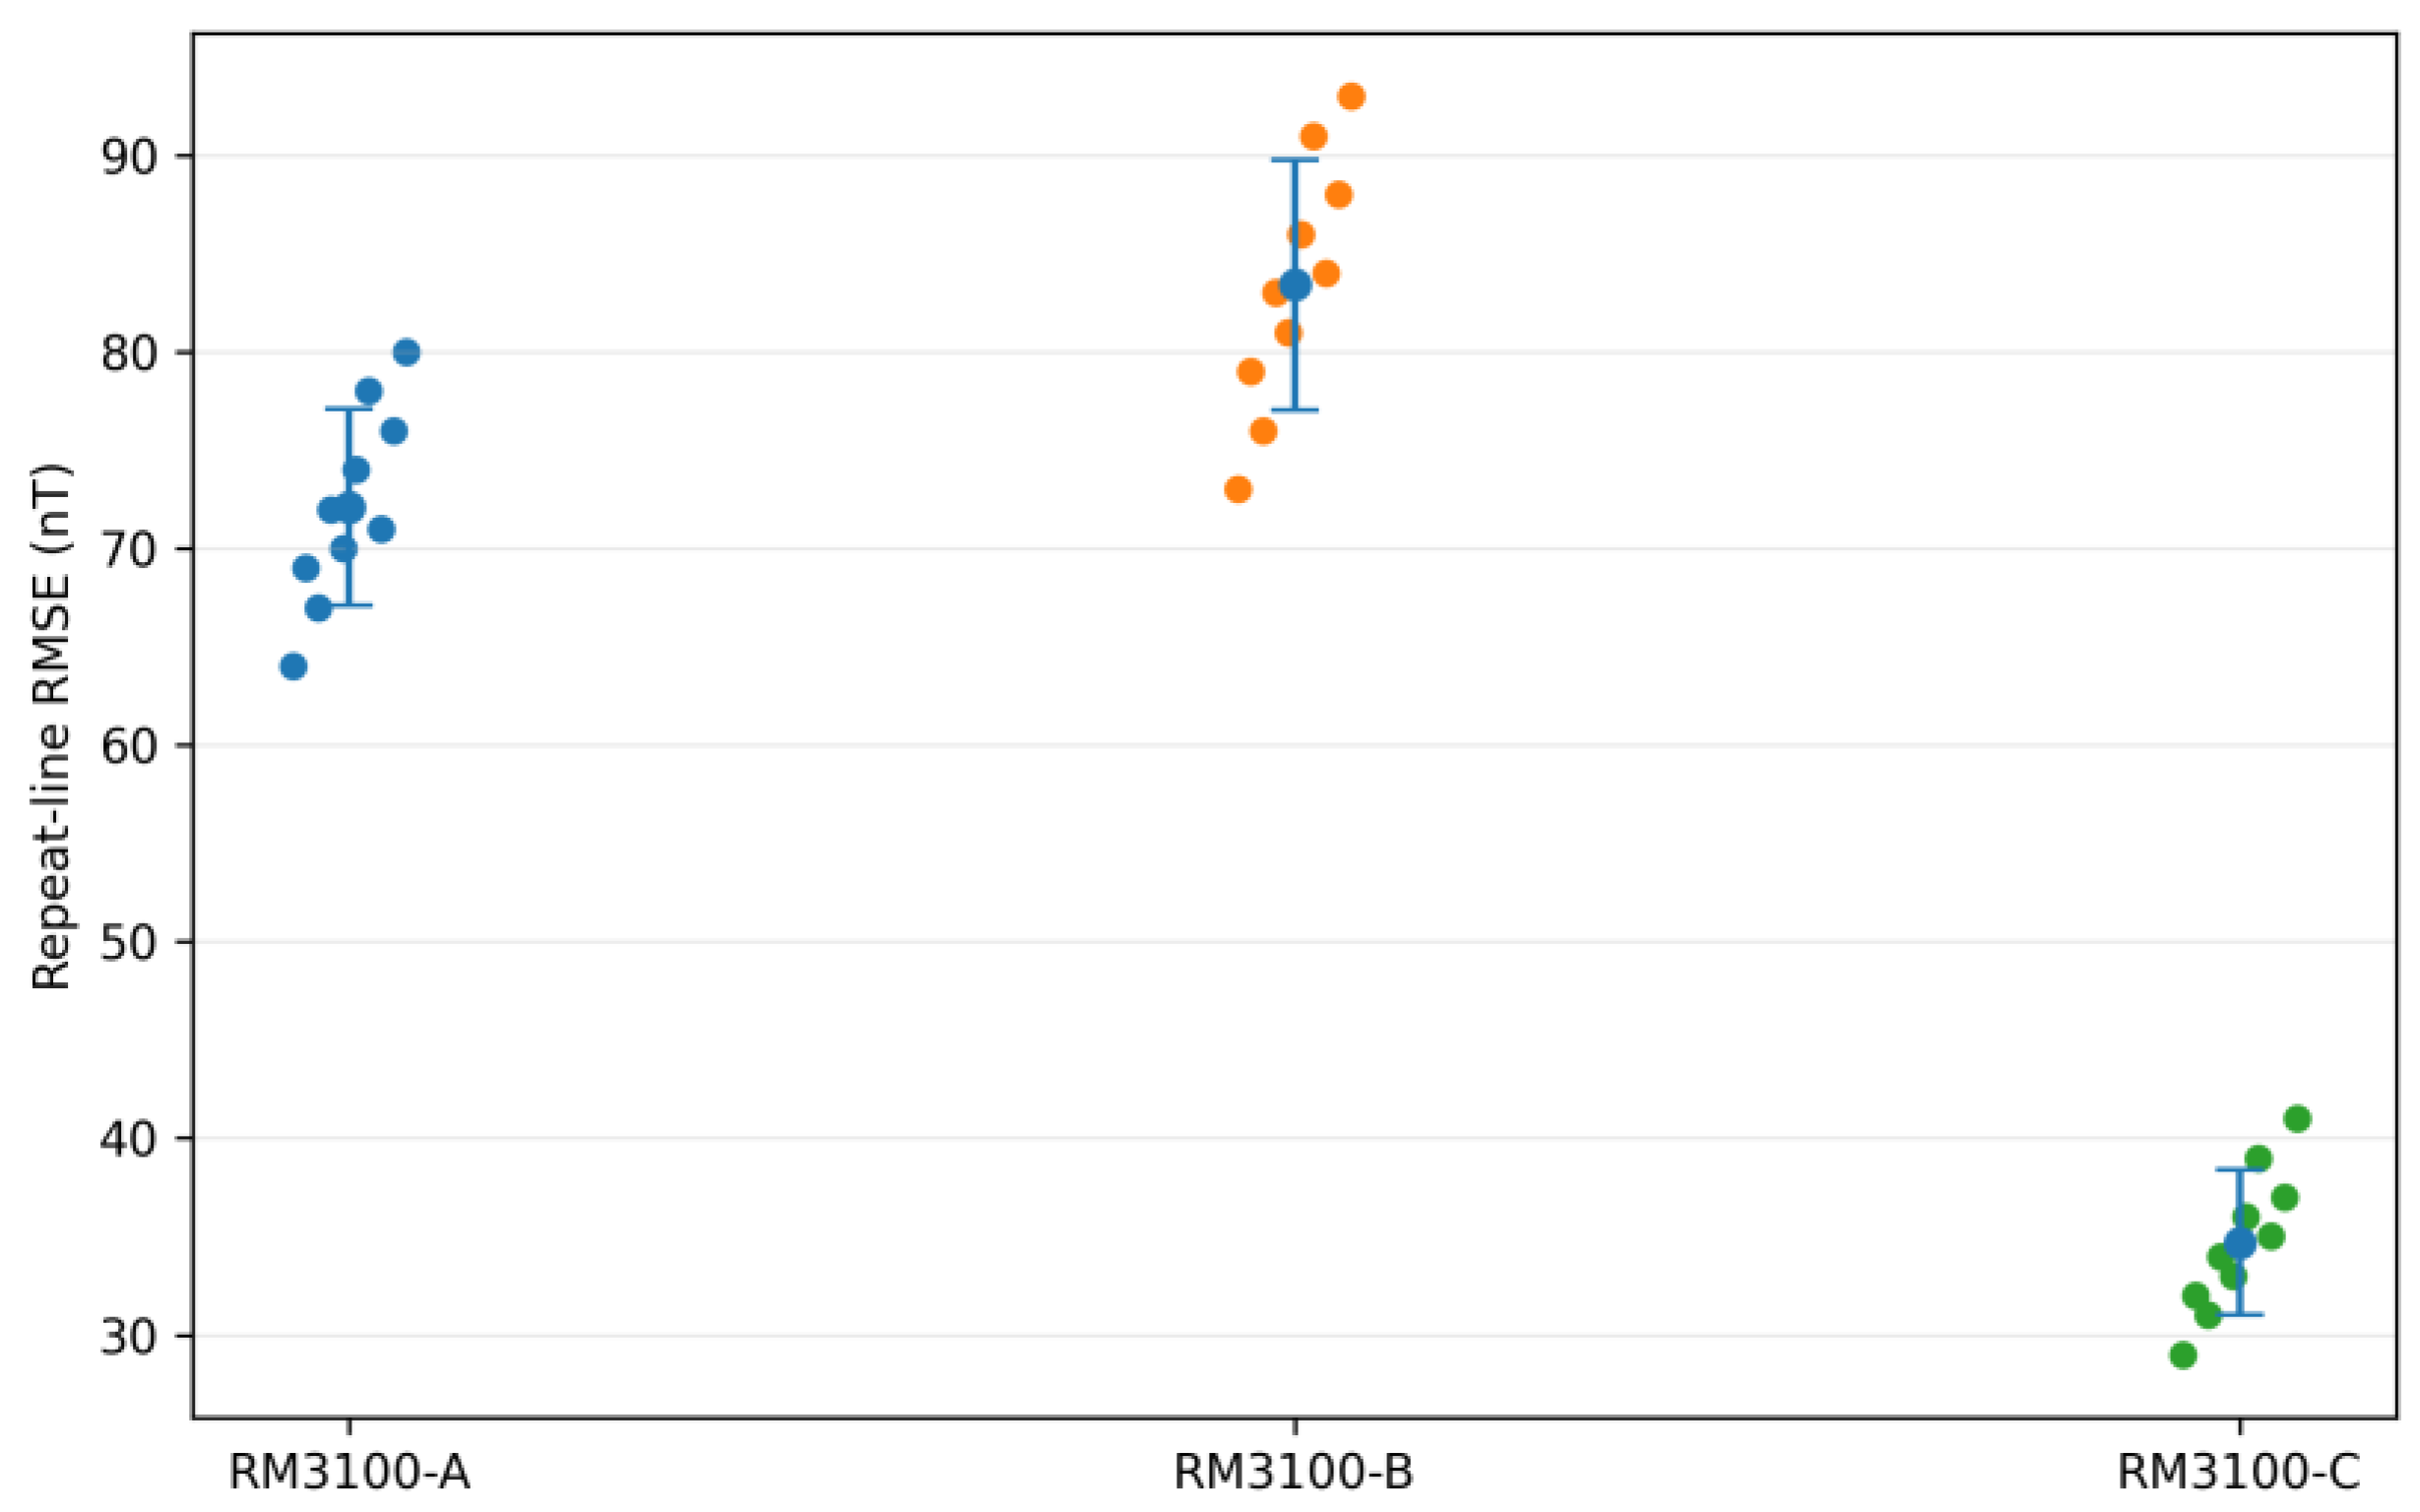
Figure 17.
Synchronized magnetic variations of the three RM3100 configurations and the independent stationary reference magnetometer during the multi-level throttle experiment.
Figure 17.
Synchronized magnetic variations of the three RM3100 configurations and the independent stationary reference magnetometer during the multi-level throttle experiment.
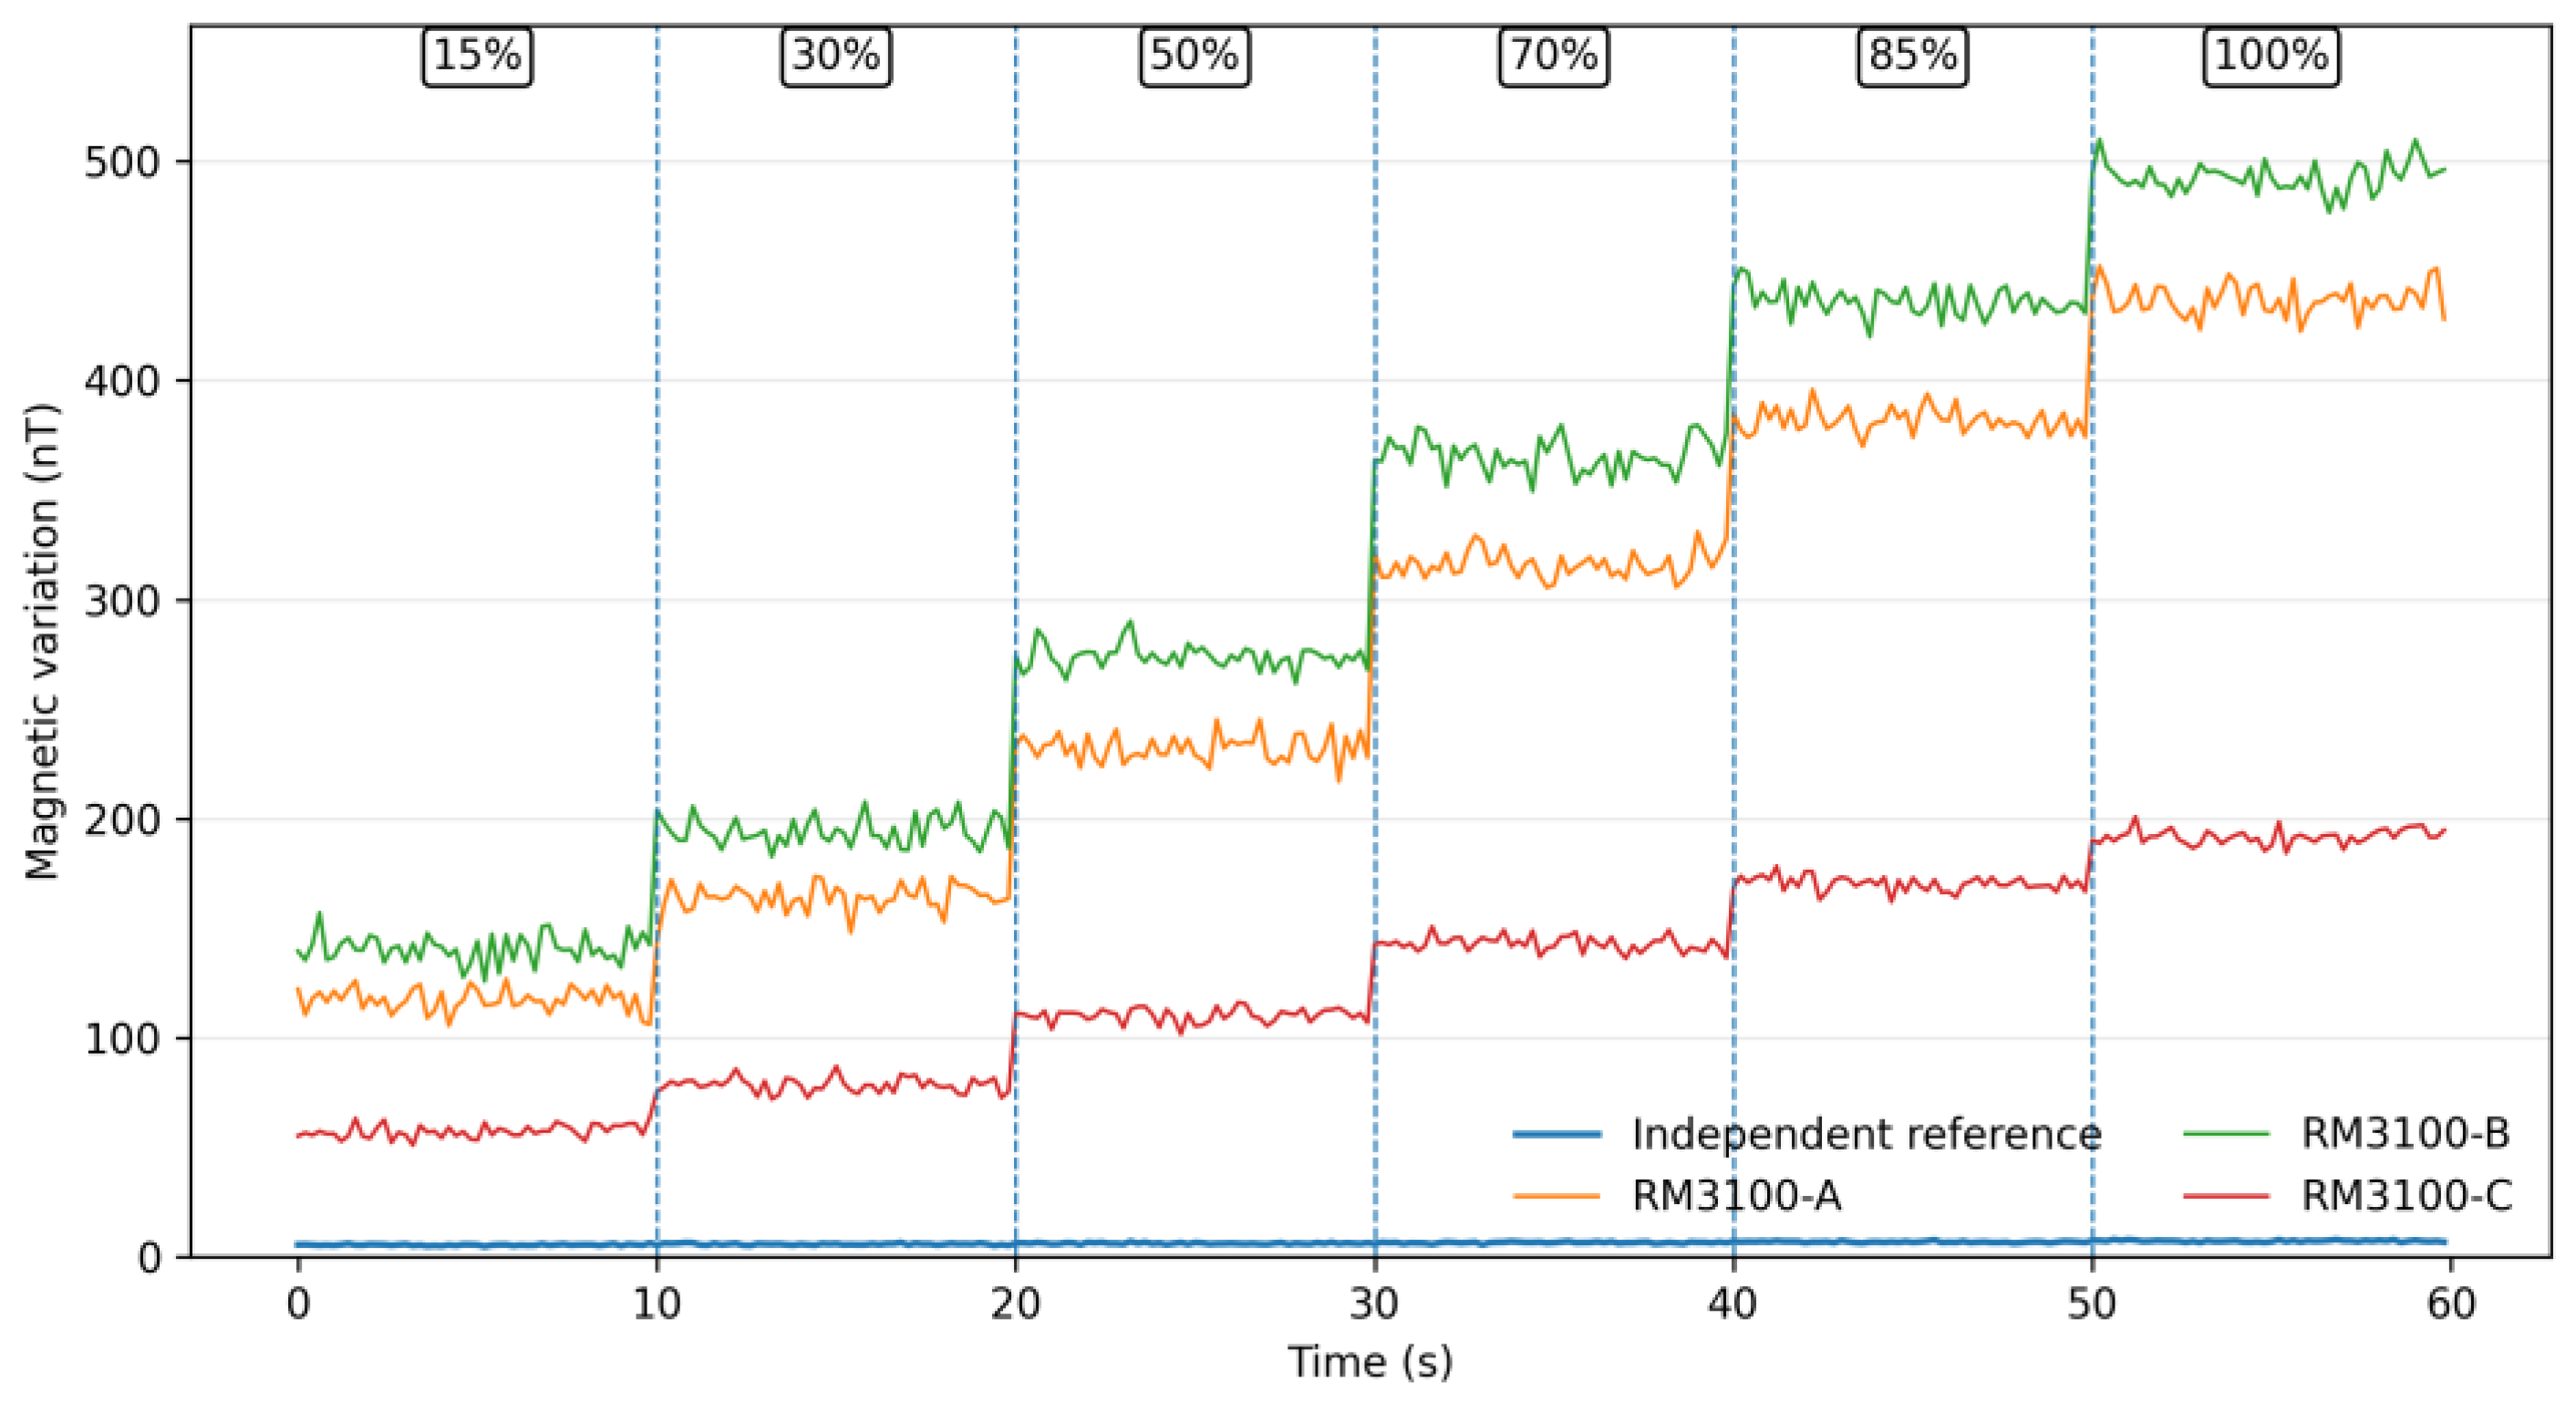
Figure 18.
Overall magnetic standard deviation of the three RM3100 configurations before and after correction using the synchronized independent reference measurement.
Figure 18.
Overall magnetic standard deviation of the three RM3100 configurations before and after correction using the synchronized independent reference measurement.
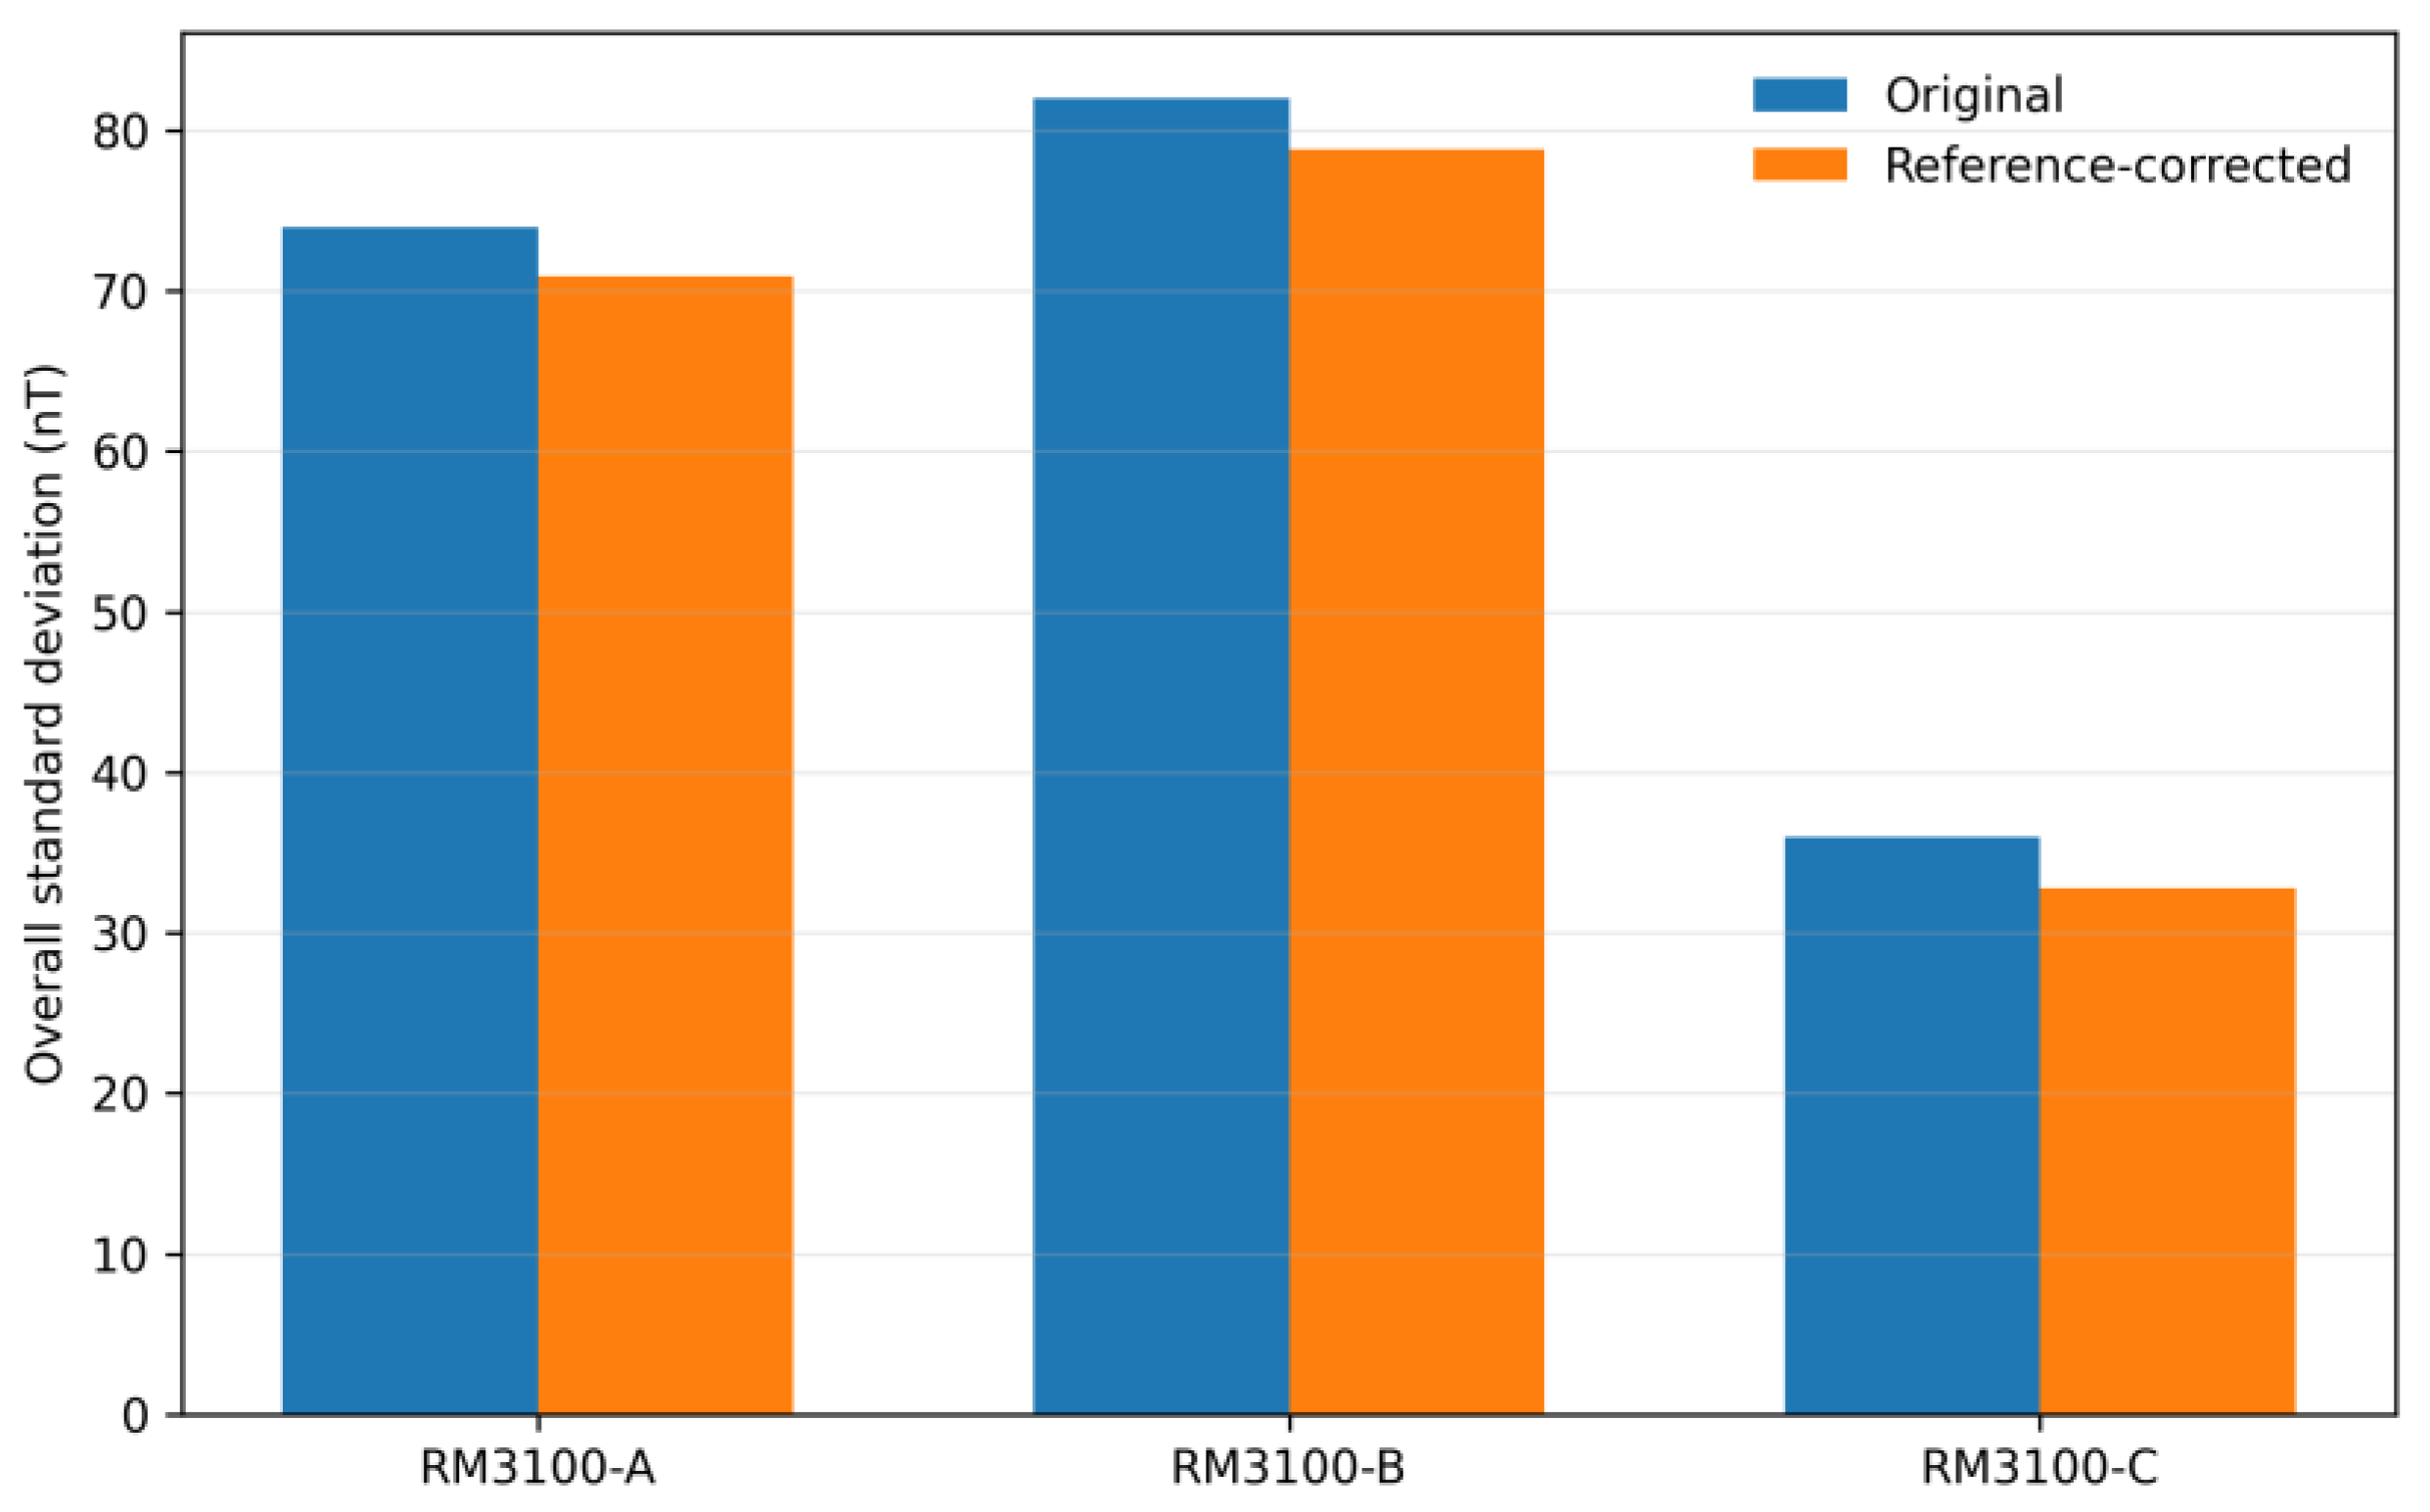
Figure 19.
Multi-level throttle-dependent magnetic response of the three RM3100 configurations compared with the synchronized independent reference magnetometer.
Figure 19.
Multi-level throttle-dependent magnetic response of the three RM3100 configurations compared with the synchronized independent reference magnetometer.
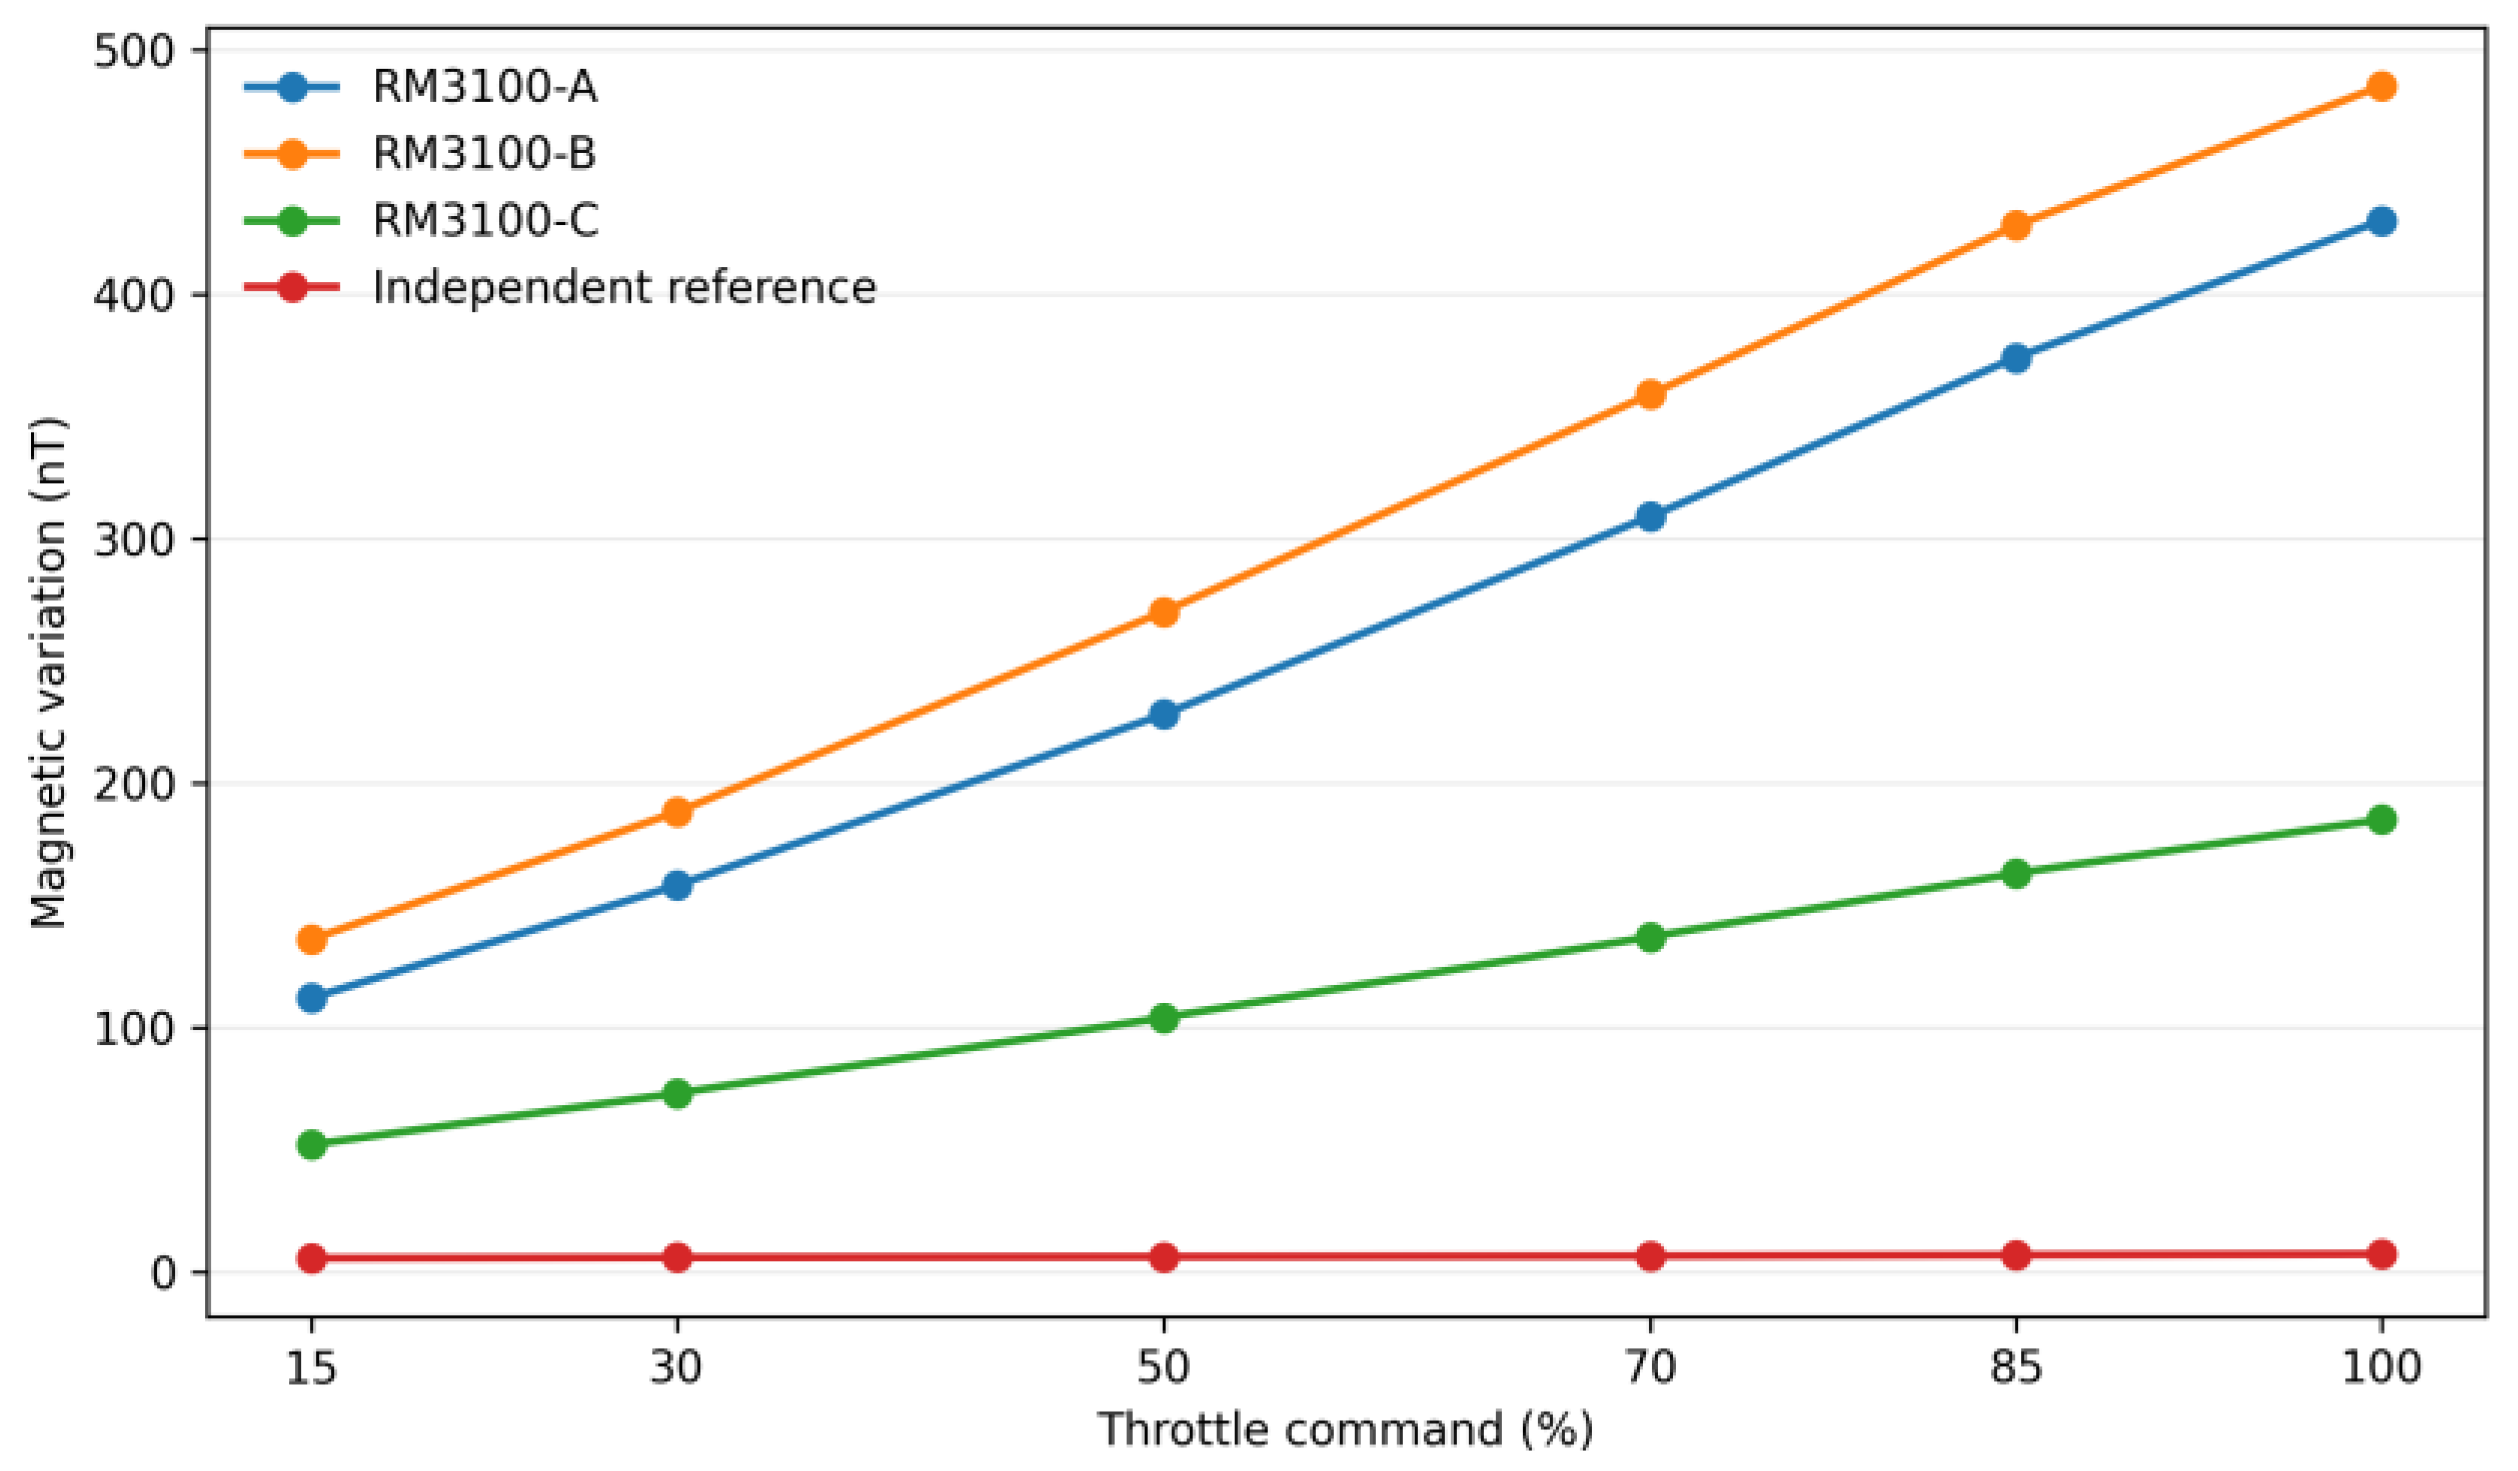
Figure 20.
Synchronized electrical response during the multi-level throttle experiment, showing measured propulsion current and battery voltage as functions of throttle command.
Figure 20.
Synchronized electrical response during the multi-level throttle experiment, showing measured propulsion current and battery voltage as functions of throttle command.
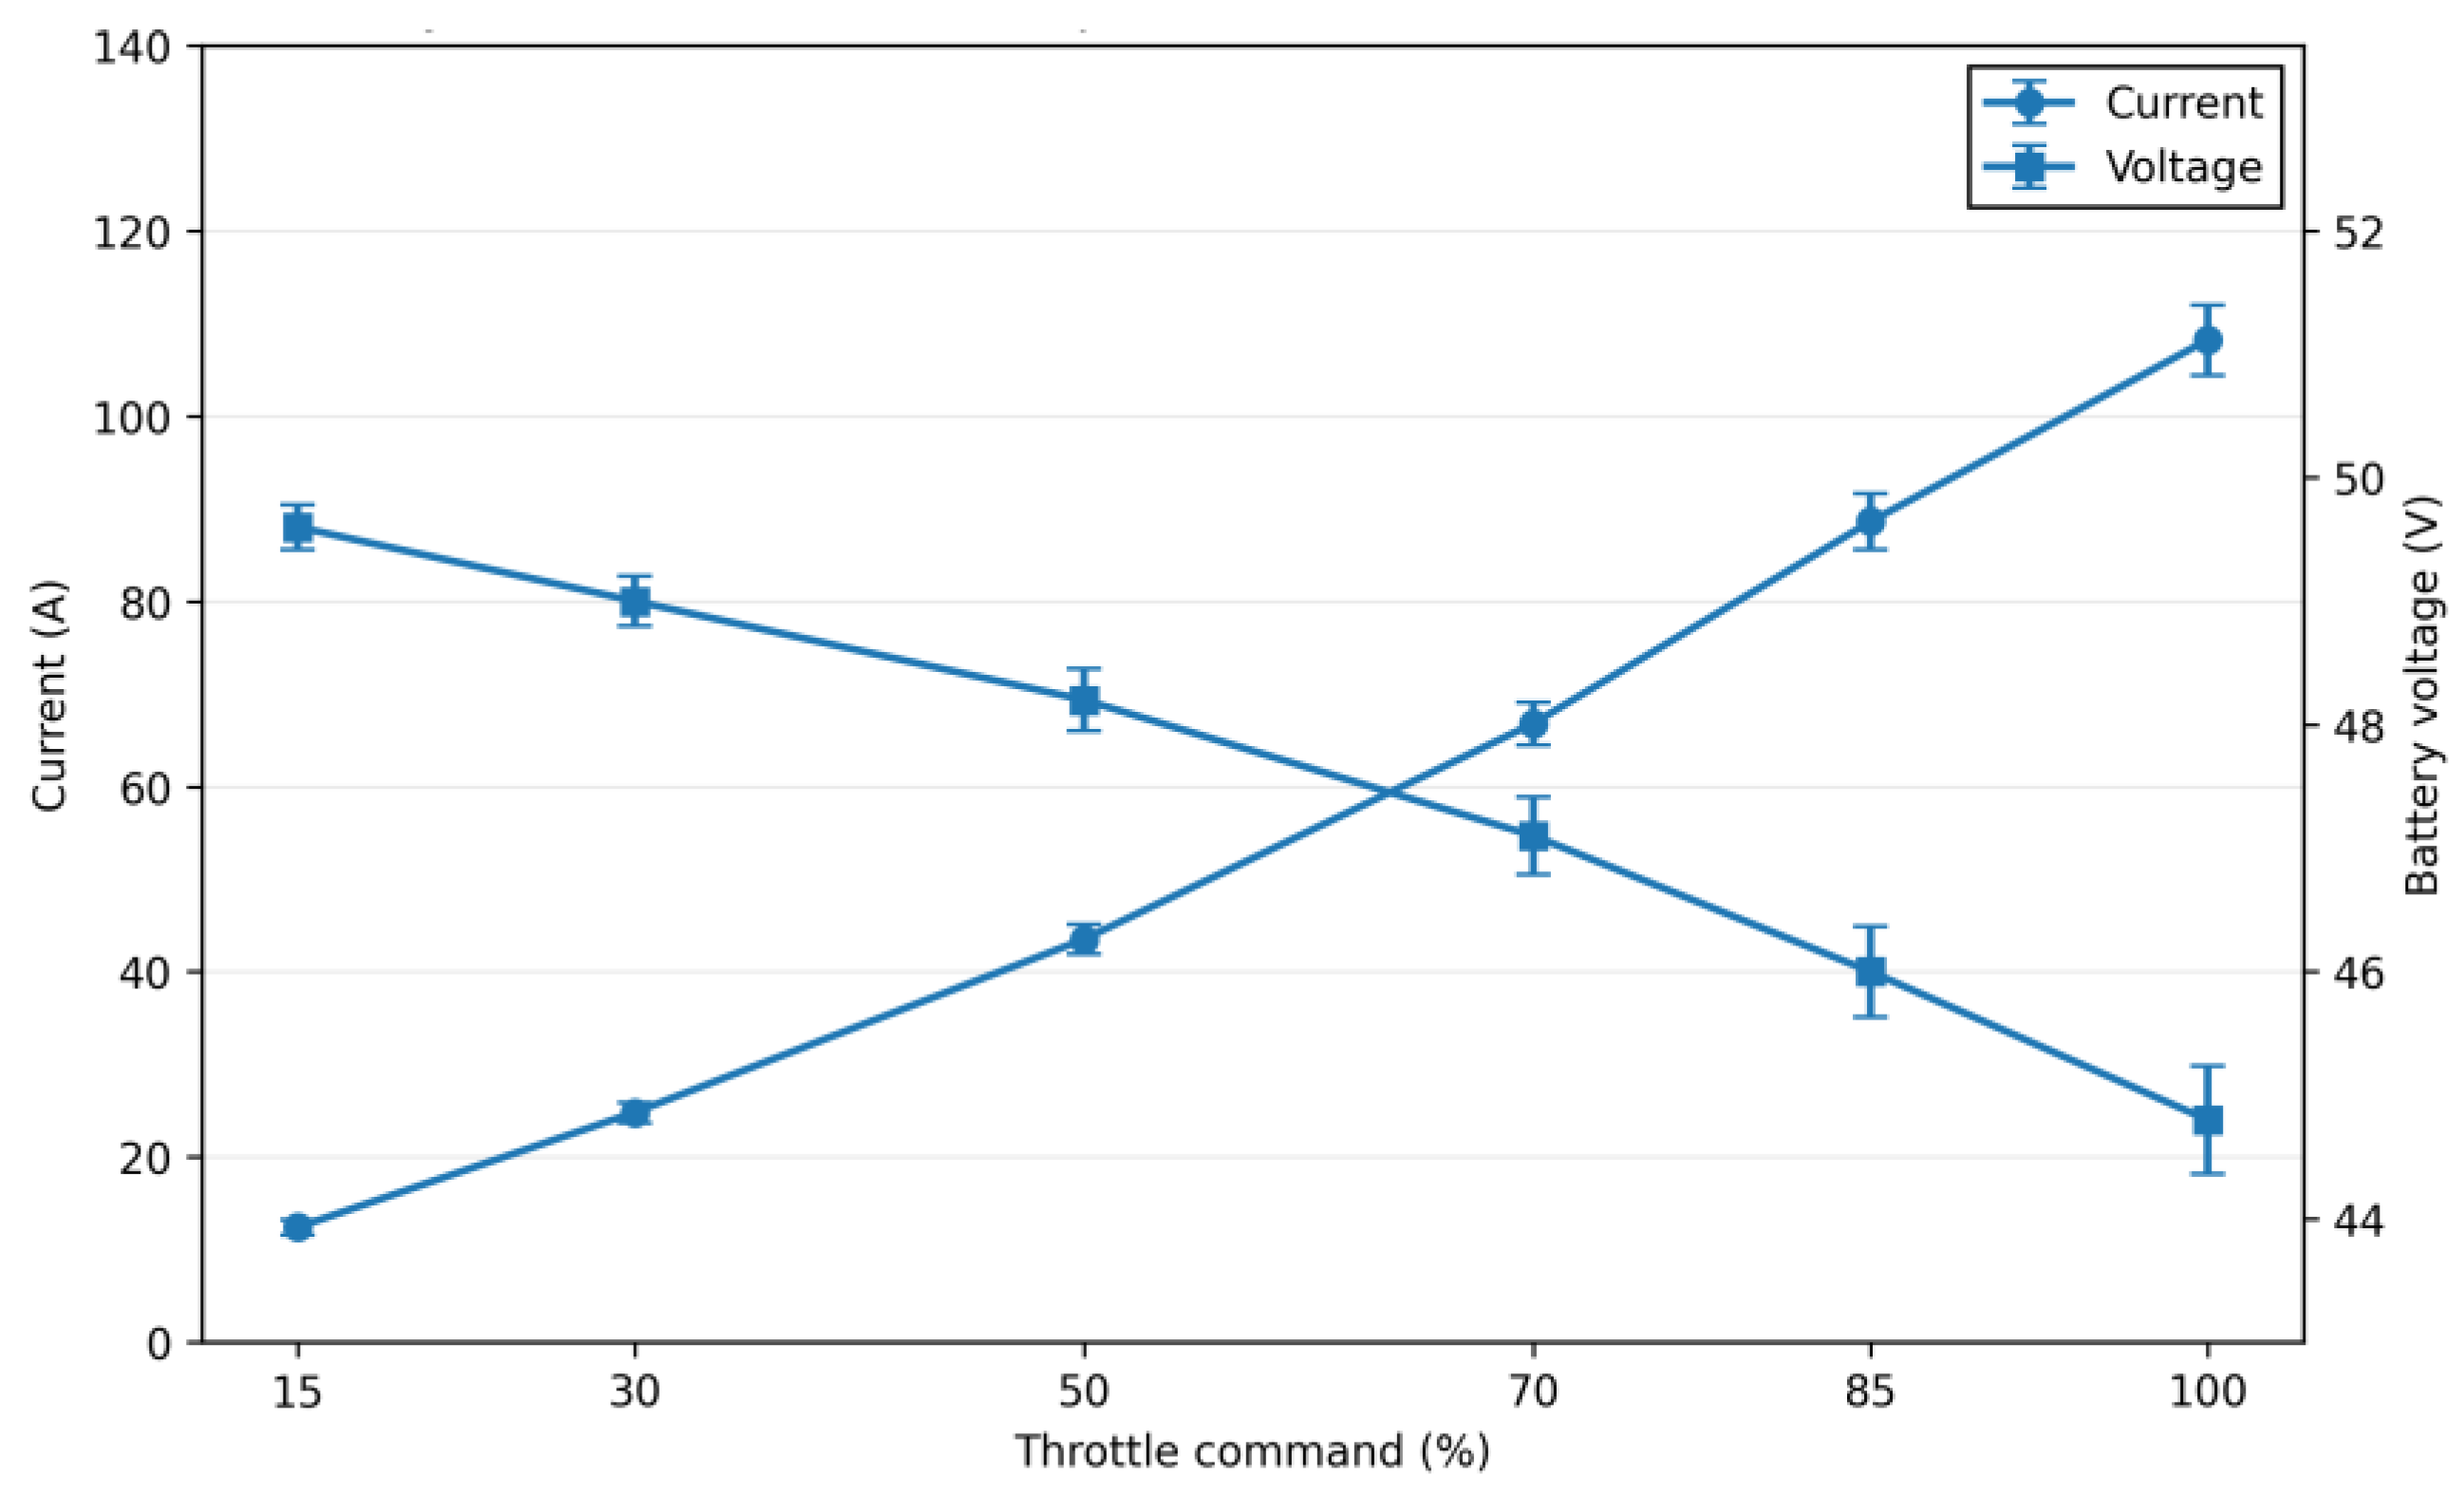
Figure 21.
Relationship between measured propulsion current and magnetic disturbance for the three RM3100 configurations. Solid lines represent linear regression fits.
Figure 21.
Relationship between measured propulsion current and magnetic disturbance for the three RM3100 configurations. Solid lines represent linear regression fits.
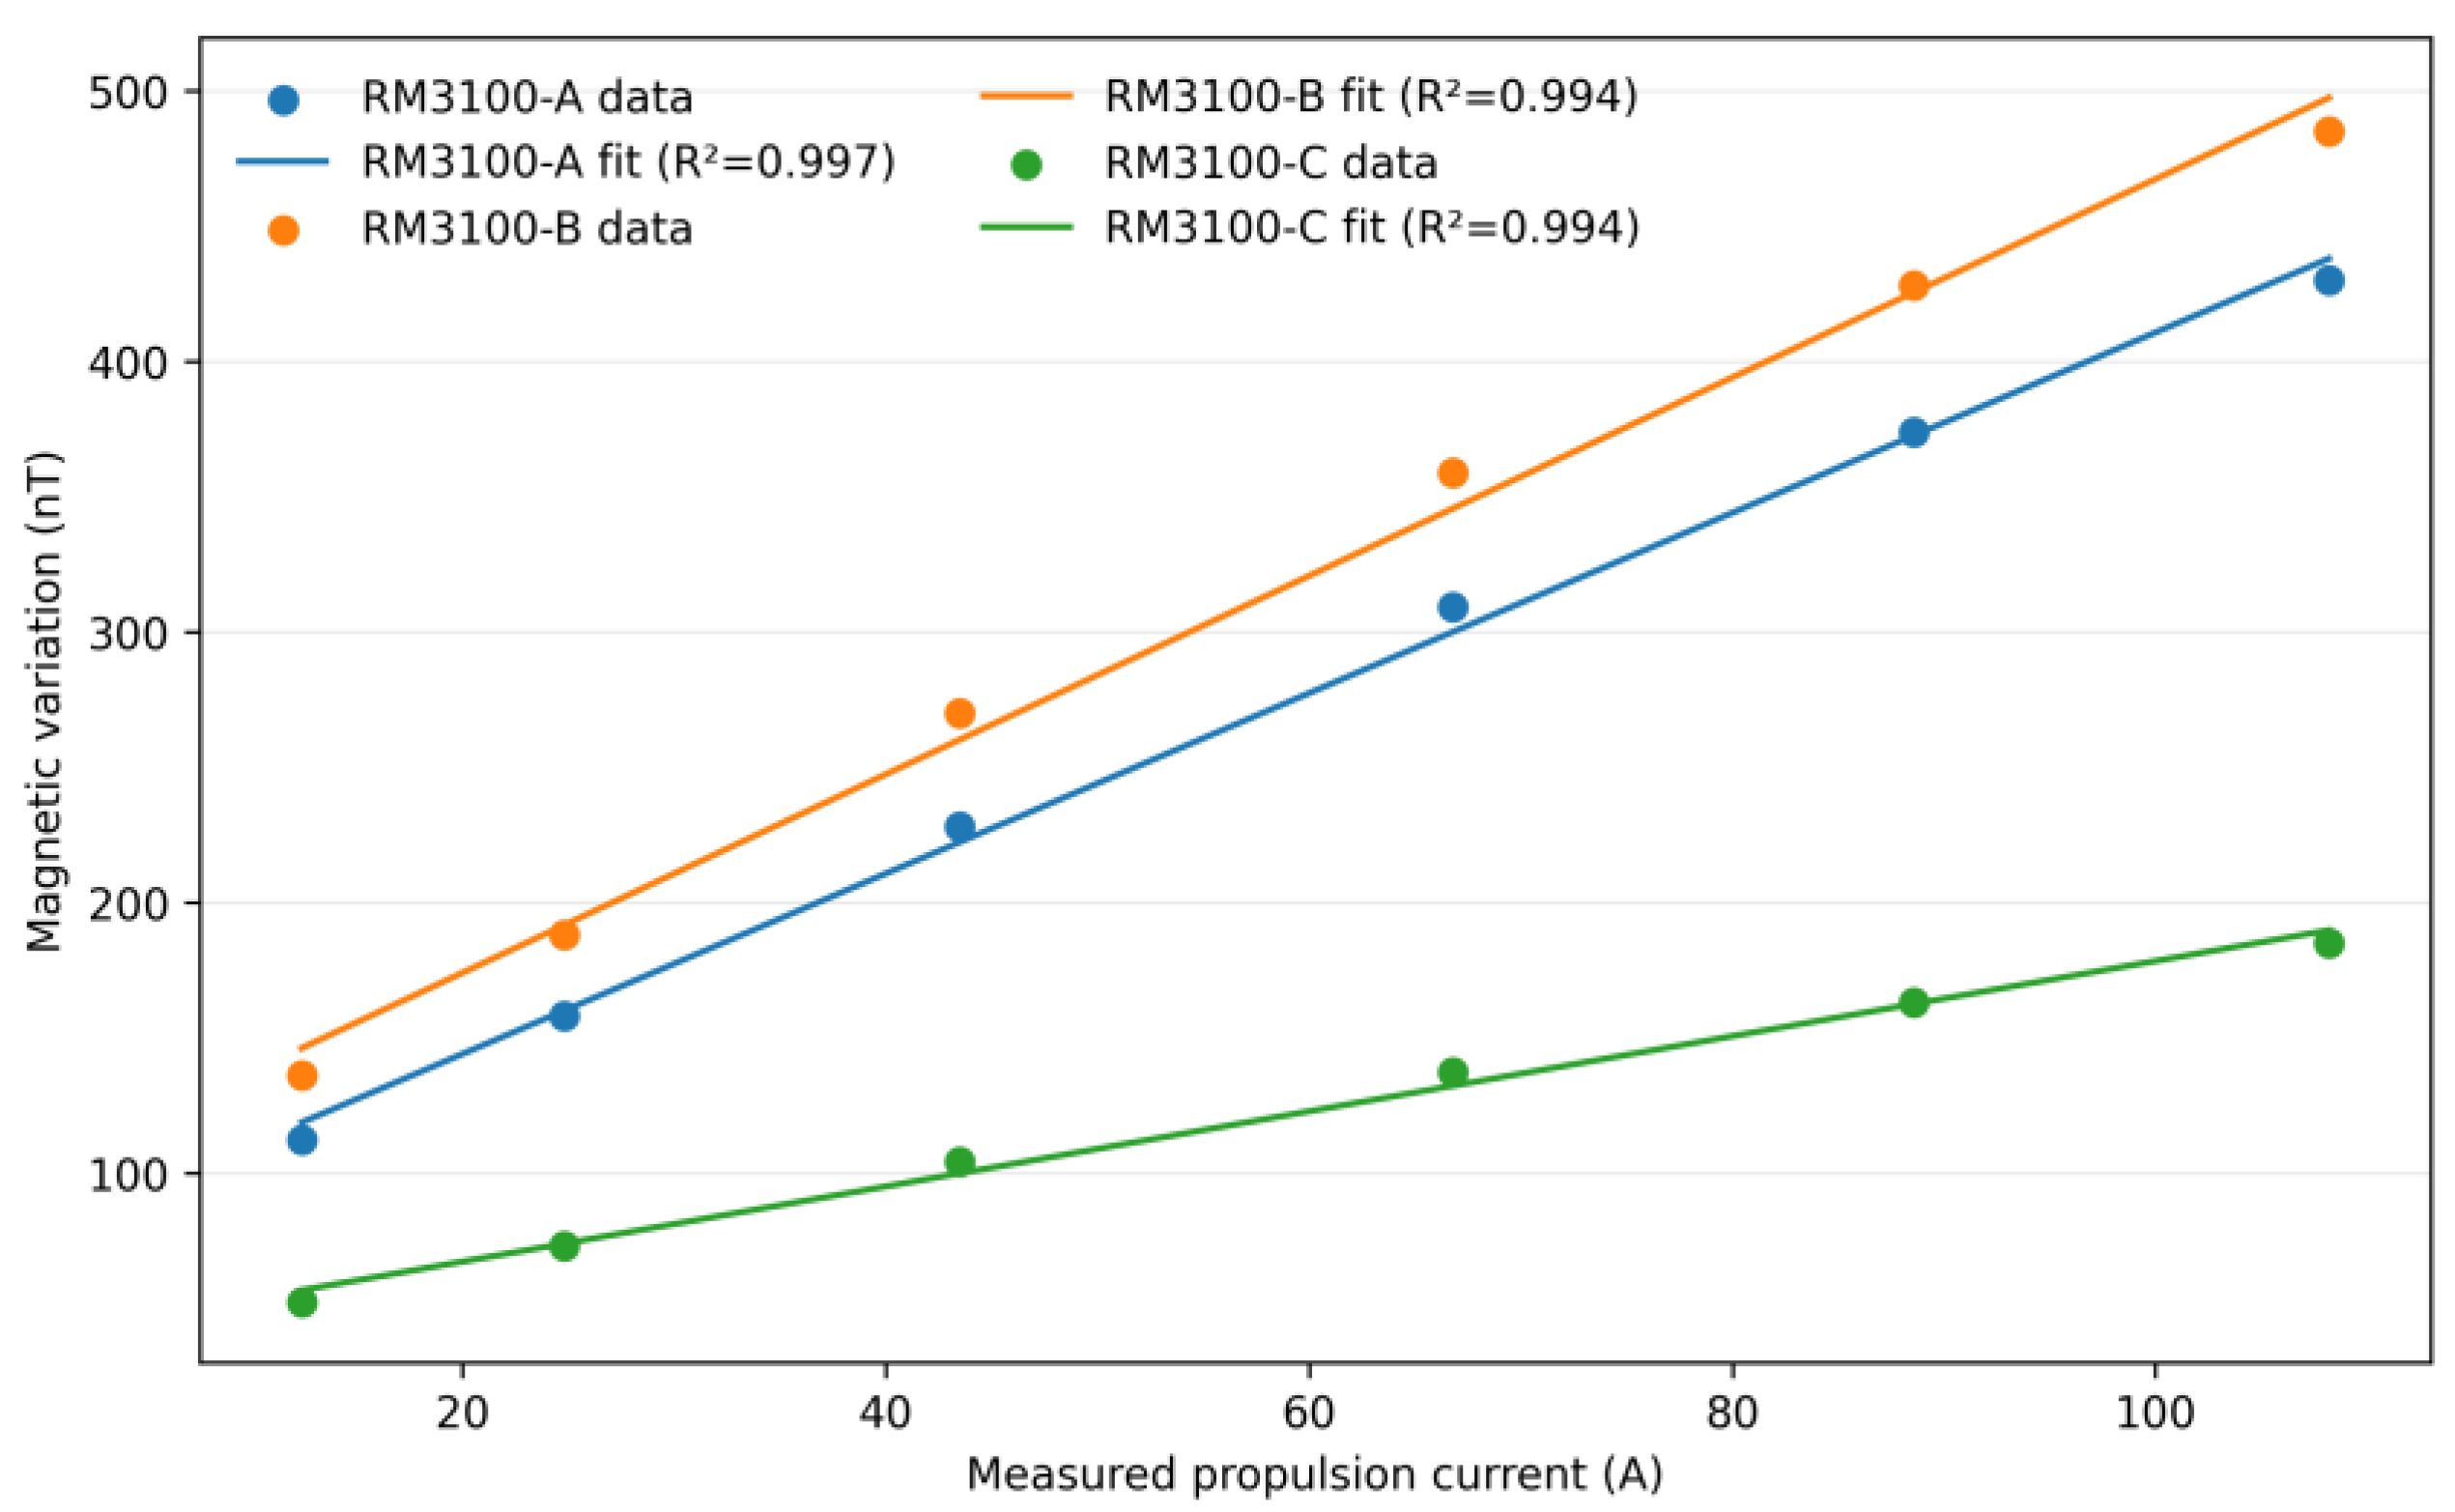
Figure 22.
Representative synchronized time series of propulsion current and magnetic responses during the multi-level throttle experiment after application of the common moving-average processing procedure, showing the stepwise response to increasing propulsion load.
Figure 22.
Representative synchronized time series of propulsion current and magnetic responses during the multi-level throttle experiment after application of the common moving-average processing procedure, showing the stepwise response to increasing propulsion load.
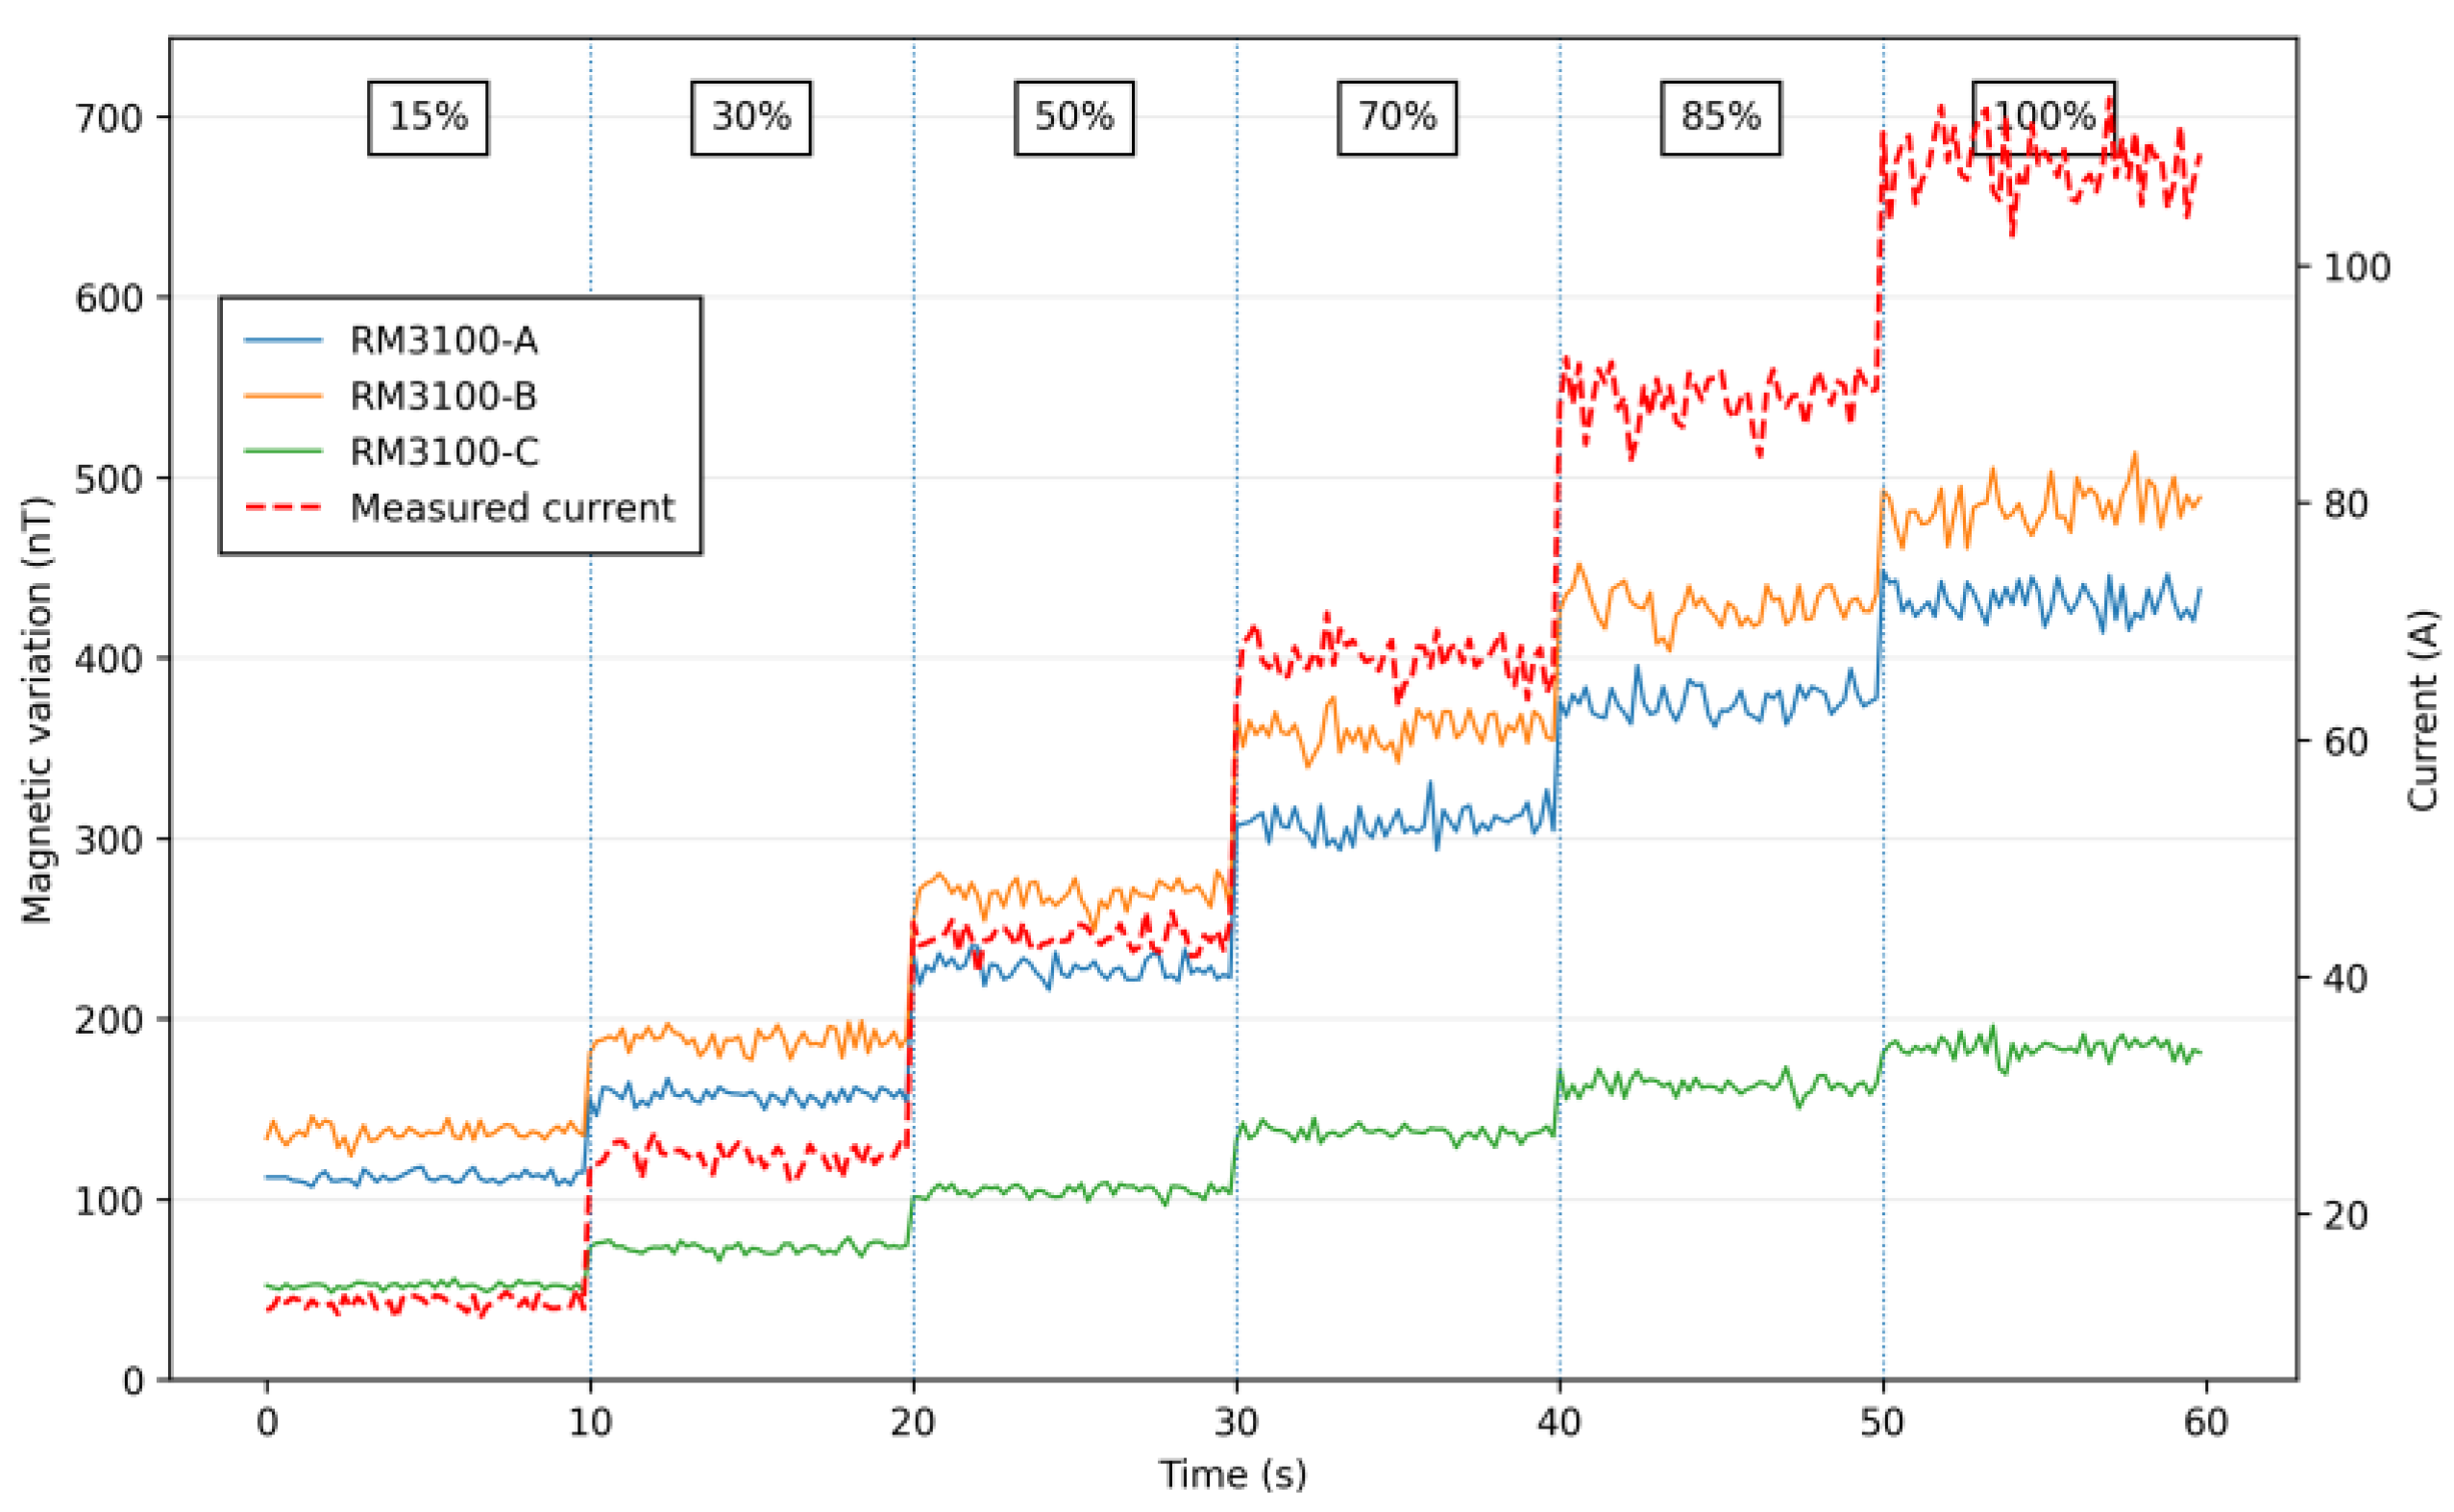
Figure 24.
Servo-induced magnetic response of the three original RM3100 installation configurations under no-servo, wing-servo, tail-servo, and combined-servo conditions. Error bars indicate the variability associated with the repeated measurements.
Figure 24.
Servo-induced magnetic response of the three original RM3100 installation configurations under no-servo, wing-servo, tail-servo, and combined-servo conditions. Error bars indicate the variability associated with the repeated measurements.
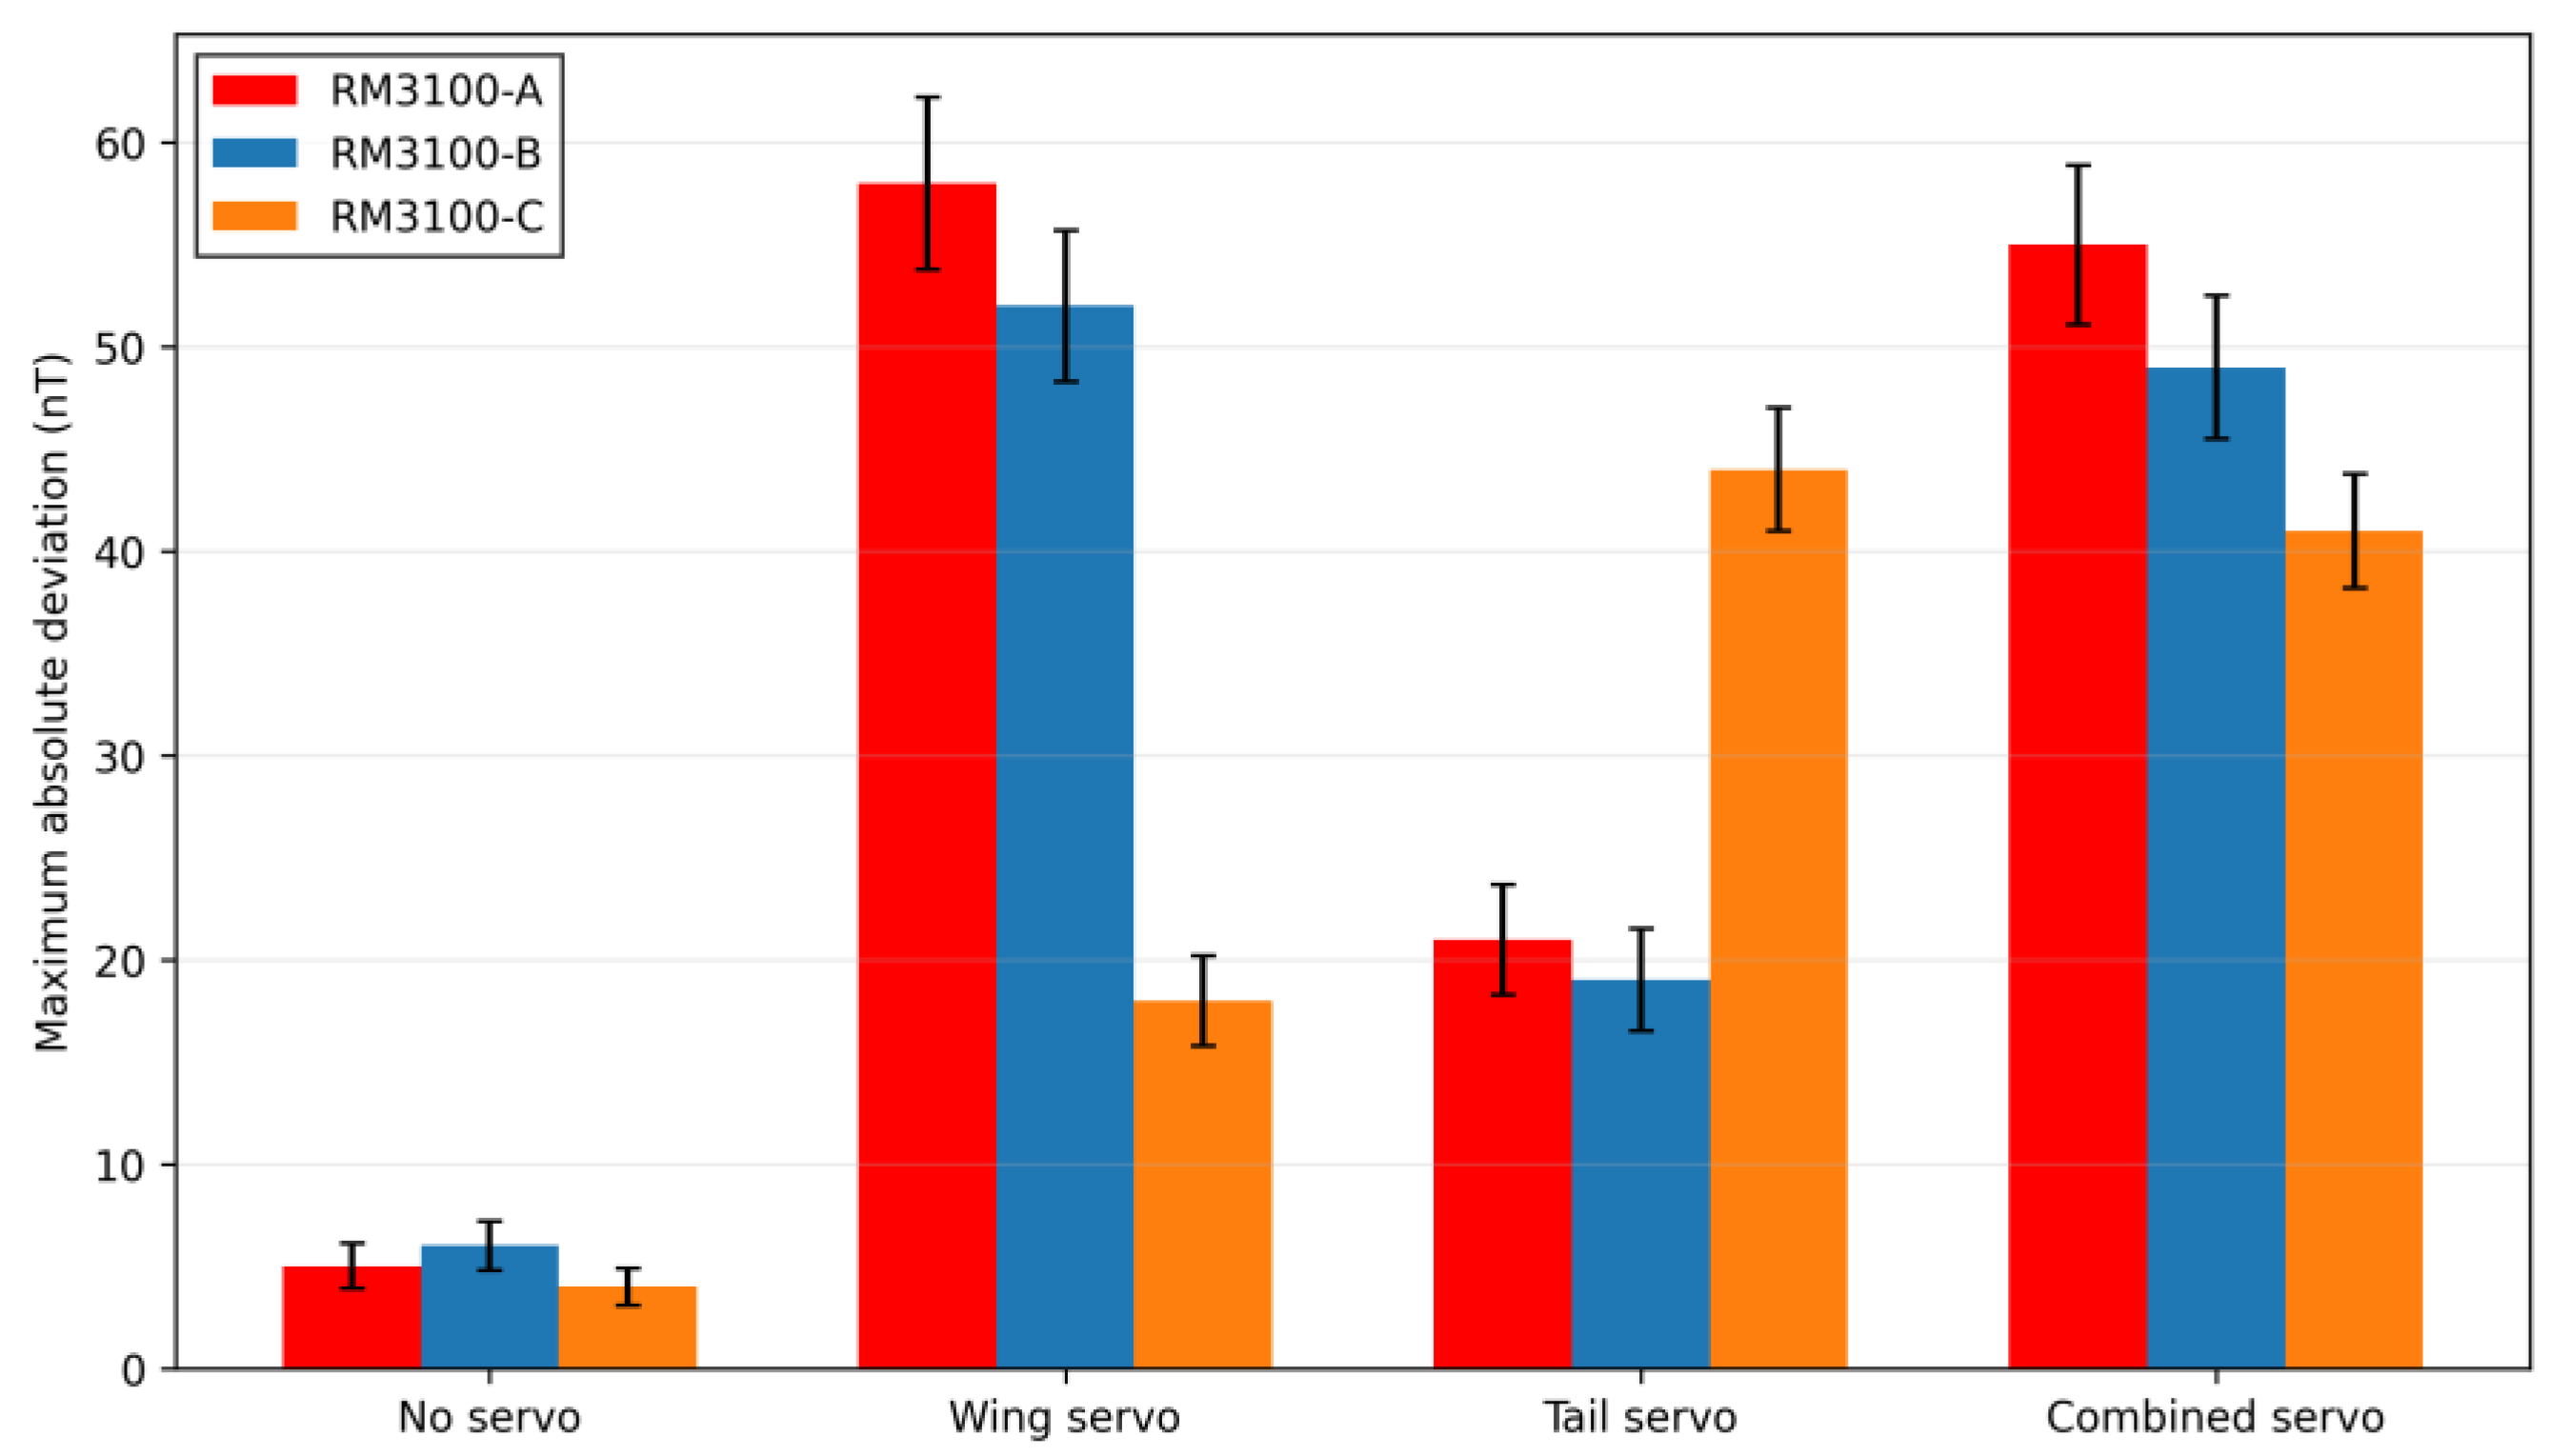
Figure 25.
Representative transient magnetic-response profiles observed during servo-actuation tests for the three RM3100 configurations.
Figure 25.
Representative transient magnetic-response profiles observed during servo-actuation tests for the three RM3100 configurations.
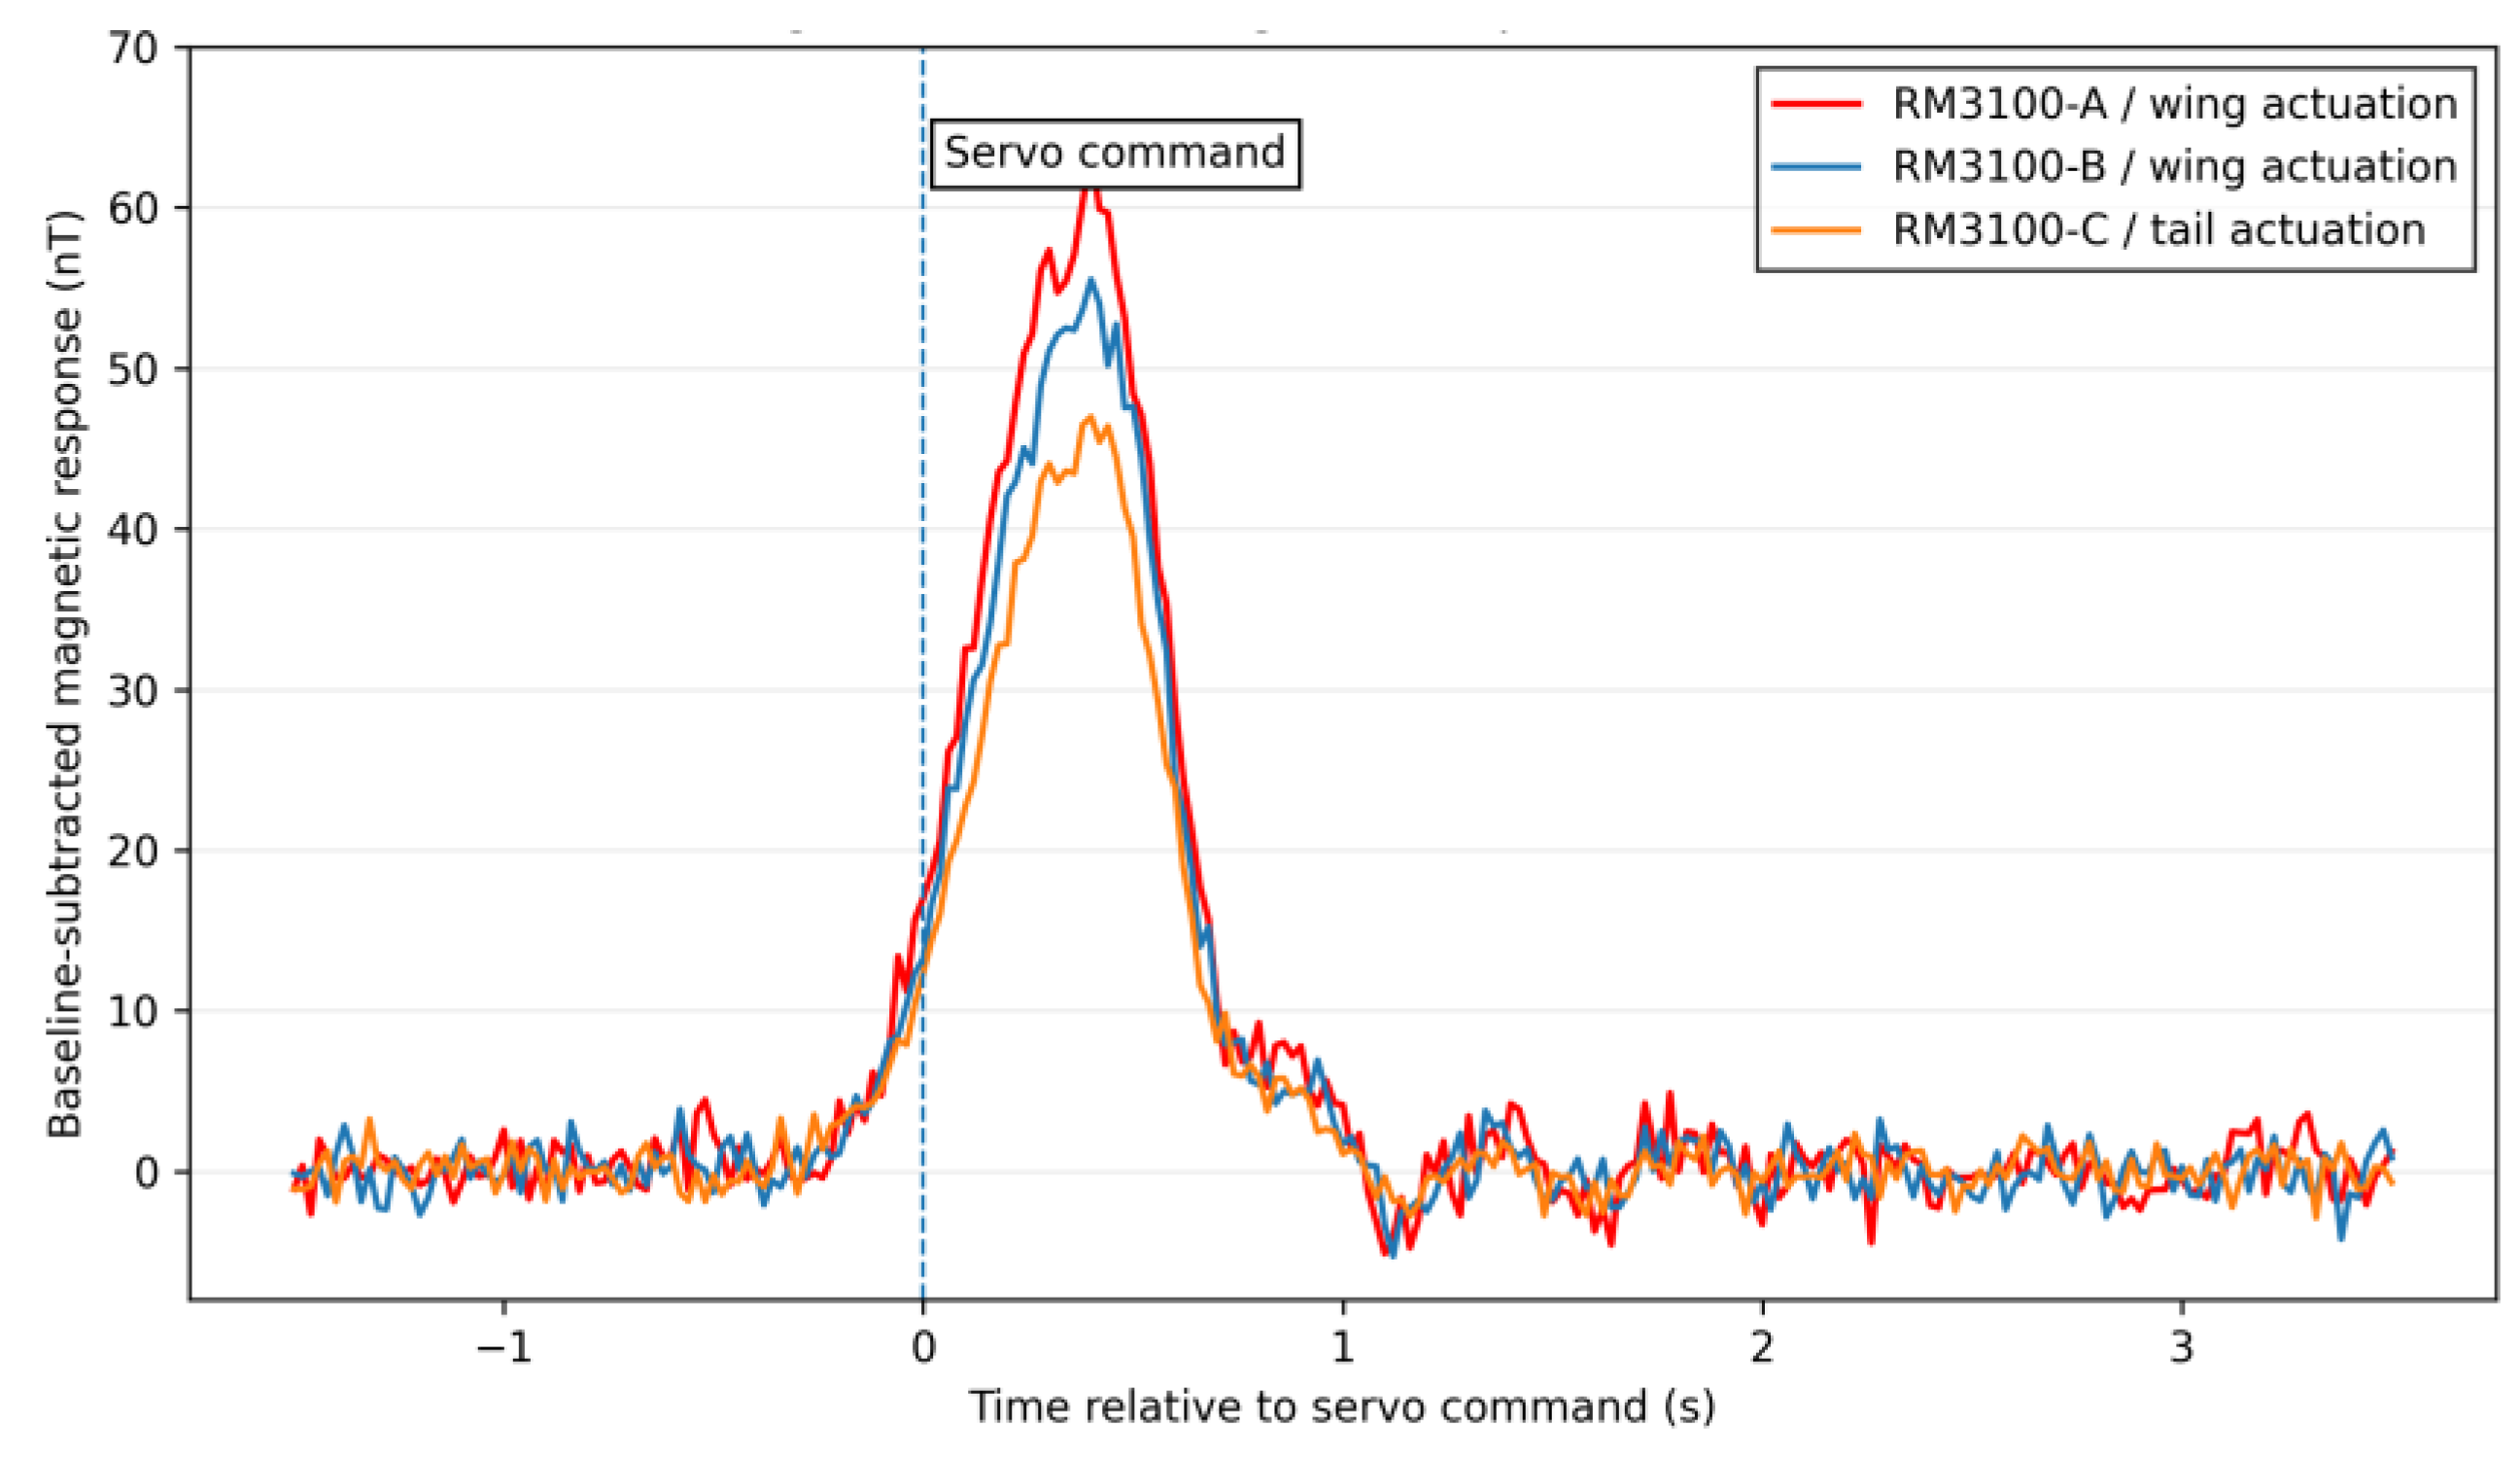
Table 1.
Comparative summary of UAV platforms for airborne magnetic measurements.
| Item | Fixed-Wing | Multirotor | VTOL / Hybrid |
| Interference level Main interference sources Preferred survey mode Potential sensor locations Main advantage Main limitation Typical application |
Low–moderate in cruise Motor, ESC, cables, servos Steady cruise Wingtip, tail boom Long endurance Needs launch/landing space Large-area survey |
High Multiple motors/ESCs, cables Low-altitude slow flight Suspended sensor, long boom Low-altitude operation High interference Small-area high-resolution survey |
High transition, low cruise Lift motors, cruise motor, servos Fixed-wing cruise Wingtip, nose/tail boom No runway + endurance Complex magnetic signature Remote-area survey |
Table 2.
Summary of research gaps related to UAV-mounted magnetic sensing, platform selection, magnetic interference, sensor placement, and calibration methods.
Table 2.
Summary of research gaps related to UAV-mounted magnetic sensing, platform selection, magnetic interference, sensor placement, and calibration methods.
| Category | Main Contributions | Limitations | This Work |
| UAV Magnetic Sensing UAV Platform Magnetic Interference Sensor Placement Magnetometer Calibration Fixed-Wing UAVs |
Airborne magnetic surveys Platform comparison Disturbance-source analysis General placement concepts Hard/soft-iron correction Magnetic measurements |
Application-focused studies Limited distributed sensing Limited multi-location tests General recommendations Mostly static sensor-level tests Limited placement studies |
RM3100 evaluation Interference-aware evaluation Multi-RM3100 evaluation Direct wing-to-tail comparison Dynamic evaluation Placement assessment |
Table 3.
Comparison of fixed-wing propulsion configurations for UAV-based magnetic measurements.
| Item | Puller configuration | Pusher configuration | Multi-motor configuration |
| Propulsion location Main interference region Potential sensor locations Magnetic advantage Main limitation Study suitability |
Nose section Nose and forward fuselage Wingtips and tail section Greater tail separation Strong forward interference High |
Rear fuselage Rear fuselage and tail Nose boom and wingtips Greater nose separation Strong rear interference Moderate |
Multiple airframe regions Multiple distributed regions Configuration-dependent Distributed-source analysis Complex magnetic signature Low |
Table 4.
Main specifications of the experimental fixed-wing UAV platform.
| Parameter | Specification |
| UAV Type | Fixed-Wing UAV |
| Airframe Configuration Wingspan Fuselage Length Nose to Wing Center Distance Wing Center to Tail Distance Propulsion Configuration Motor Model ESC model Autopilot System Battery Configuration Processing unit Magnetometer Sensors Sampling Rate |
Composite Airframe 4.60 m 2.14 m 505 mm 1635 mm Nose-Mounted Single Motor INNOVIA AT7215 KV220 DUAL SKY SUMMIT 130A Holybro Pixhawk 12S7P Lithium Battery NVIDIA Jetson 3 × RM3100 50 Hz |
Table 5.
Main onboard components of the fixed-wing UAV magnetic measurement platform.
| Component | Model / Description | Function |
| Propulsion motor | INNOVIA AT7215 KV220 | Main propulsion |
| ESC | DUAL SKY SUMMIT 130A | Motor speed control |
| Autopilot | Holybro Pixhawk | Flight control and telemetry |
| Processing unit | NVIDIA Jetson | Data processing and logging |
| Battery system | 12S7P lithium battery pack | Electrical power supply |
| Power-distribution system | PDB/wiring hub | Power distribution |
| Wing servos | KST FZ10 | Wing control surfaces |
| Tail servos GNSS/telemetry |
KST FZ10 Navigation modules |
Tail control surfaces Positioning and telemetry |
| Magnetometers | Three RM3100 sensors | Magnetic field measurements |
Table 6.
RM3100 magnetometer configuration and data acquisition parameters.
| Parameter | Value |
| Sensor Model Sensor Type Measurement Axes Number of Sensors Sensor identifiers Sensor Deployment Installation regions Sampling Frequency RM3100 Cycle-Count Setting Data Acquisition Main measurement variable Measurement Objective |
RM3100 Three-axis vector magnetometer X, Y, Z 3 RM3100-A, RM3100-B, and RM3100-C Distributed Configuration Two wing locations and one tail location 50 Hz Not available in retained records Synchronized onboard logging Calibrated magnetic-field magnitude UAV disturbance comparison |
Table 7.
Approximate separation distances between the RM3100 sensors and major onboard magnetic-interference sources.
Table 7.
Approximate separation distances between the RM3100 sensors and major onboard magnetic-interference sources.
| Sensor | Location | Motor distance (m) | ESC distance (m) | Battery distance (m) | PDB / wiring distance (m) | Nearest servo distance (m) |
| RM3100-A RM3100-B RM3100-C |
Wing section Wing section Tail section |
1.4 51.4 52.05 |
1.2 51.2 51.75 |
1.0 51.0 51.45 |
0.8 50.8 51.15 |
0.3 50.3 50.45 |
Table 8.
Qualitative summary of expected UAV components affecting magnetic measurements.
| Component | Expected effect | Main mechanism | Placement consideration |
| BLDC propulsion motor ESC Battery / power cables PDB/wiring hub Servo actuators Autopilot / IMU Onboard processor GNSS / telemetry Metallic fasteners Frame / structure |
Very high High Very high High Medium–high Medium Medium Low–medium High if close Low–medium |
Permanent magnets & current Switching electromagnetic noise High-current magnetic field Concentrated current paths Transient magnetic effects Electronic noise Regulators and electronics RF/electronic interference Hard-iron bias Material-dependent effects |
Keep sensor far from motor Avoid ESC proximity Twisted wiring Route away from sensor Avoid servo proximity Keep separated if possible Avoid close installation Maintain separation Use non-magnetic materials Test before final placement |
Table 9.
Summary of experimental test scenarios used for UAV magnetic-disturbance evaluation.
| Test scenario | Purpose | Main evaluated effect |
| Sensor calibration | Reduce sensor-level errors | Hard-iron and soft-iron effects |
| UAV OFF | Measure baseline condition | Static airframe/background field |
| UAV ON | Evaluate powered electronics | Autopilot, Jetson, wiring, electronics |
| Throttle-sweep test | Evaluate propulsion effect | Propulsion & throttle effects |
| Wing-servo actuation | Assess wing-servo effects | Wing-sensor disturbance |
| Tail-servo actuation Combined-servo actuation Heading test Sensor comparison |
Evaluate local tail actuator influence Assess combined servo activity |
Tail-sensor disturbance Combined localized servo effects |
| Evaluate orientation effect Rank sensor configurations |
Heading-dependent magnetic variation Wing–tail stability |
Table 11.
Experimental workflow and recommended verification checklist for the fixed-wing UAV magnetic measurement system.
Table 11.
Experimental workflow and recommended verification checklist for the fixed-wing UAV magnetic measurement system.
| Step | Procedure | Purpose | Status |
| 1 2 3 4 5 6 7 8 9 10 11 12 |
Off-airframe calibration Layout assessment UAV OFF test UAV ON test Throttle tests Servo tests Heading test Sensor-position crossover Reference monitoring Repeat-line flight test Ground-run/taxi test Expanded flight |
Reduce sensor errors Document installation Establish baseline Assess electronics Assess propulsion effects Assess actuator effects Assess orientation effects Validate placement effect Assess ambient variation Check airborne stability Extend ground validation Broader flight |
Completed Completed Completed Completed Completed Completed Completed Completed Completed Completed Recommended Recommended |
Table 13.
Calibration and baseline stability results for the distributed RM3100 sensors.
| Sensor | Location | Raw Std. (nT) | After calibration Std. (nT) | After filtering Std. (nT) | Improvement (%) |
| RM3100-A RM3100-B RM3100-C |
Wing section Wing section Tail section |
342 365 156 |
82 94 41 |
58 64 29 |
83.0 82.5 81.4 |
Table 14.
Quantitative comparison of UAV OFF–ON magnetic response for the three original RM3100 installation configurations. Values represent mean magnetic change with retained variability from the repeated measurements.
Table 14.
Quantitative comparison of UAV OFF–ON magnetic response for the three original RM3100 installation configurations. Values represent mean magnetic change with retained variability from the repeated measurements.
| Sensor | Location | Mean OFF–ON ΔB (nT) | SD (nT) | Relative Response |
| RM3100-A RM3100-B RM3100-C |
Wing section Wing section Tail section |
46 58 24 |
3.8 4.7 2.1 |
Intermediate Highest Lowest |
Note: The OFF–ON response represents the absolute difference between the mean calibrated magnetic-field magnitudes measured in the UAV ON and UAV OFF states. Each condition was repeated three times.
Table 15.
UAV operating-state and multi-level throttle-dependent magnetic variations of the distributed RM3100 sensors. Throttle responses are reported as mean ± SD.
Table 15.
UAV operating-state and multi-level throttle-dependent magnetic variations of the distributed RM3100 sensors. Throttle responses are reported as mean ± SD.
| Sensor | Location | OFF–ON (nT) | 15% Throttle (nT) | 30% Throttle (nT) | 50% Throttle (nT) | 70% Throttle (nT) | 85% Throttle (nT) | 100% Throttle (nT) | Relative disturbance level |
| RM3100-A RM3100-B RM3100-C |
Wing section Wing section Tail section |
46 58 24 |
112 ± 7.6 136 ± 9.8 52 ± 4.2 |
158 ± 9.4 188 ± 11.7 73 ± 4.9 |
228 ± 12.7 270 ± 14.9 104 ± 6.2 |
309 ± 16.2 359 ± 18.7 137 ± 8.1 |
374 ± 18.8 428 ± 21.8 163 ± 10.0 |
430 ± 20.9 485 ± 24.7 185 ± 12.1 |
Intermediate Highest Lowest |
Table 16.
Pairwise Welch’s t-test comparison of throttle-dependent magnetic disturbance among the three RM3100 configurations based on retained summary statistics. Bonferroni-adjusted p-values are reported for the three pairwise comparisons within each throttle level; confidence intervals represent unadjusted two-sided 95% CIs of the mean difference.
Table 16.
Pairwise Welch’s t-test comparison of throttle-dependent magnetic disturbance among the three RM3100 configurations based on retained summary statistics. Bonferroni-adjusted p-values are reported for the three pairwise comparisons within each throttle level; confidence intervals represent unadjusted two-sided 95% CIs of the mean difference.
| Throttle | Comparison | Mean Difference (nT) | 95% CI (nT) | Bonferroni-adjusted p |
| 15% | A vs B | -24 | -36.9 to -11.1 | 0.009 |
| 15% | A vs C | 60 | 50.6 to 69.4 | <0.001 |
| 15% | B vs C | 84 | 72.0 to 96.0 | <0.001 |
| 30% | A vs B | -30 | -45.6 to -14.4 | 0.007 |
| 30% | A vs C | 85 | 73.4 to 96.6 | <0.001 |
| 30% | B vs C | 115 | 100.7 to 129.3 | <0.001 |
| 50% | A vs B | -42 | -62.3 to -21.7 | 0.004 |
| 50% | A vs C | 124 | 108.4 to 139.6 | <0.001 |
| 50% | B vs C | 166 | 147.8 to 184.2 | <0.001 |
| 70% | A vs B | -50 | -75.6 to -24.4 | 0.006 |
| 70% | A vs C | 172 | 152.1 to 191.9 | <0.001 |
| 70% | B vs C | 222 | 199.1 to 244.9 | <0.001 |
| 85% | A vs B | -54 | -83.8 to -24.2 | 0.009 |
| 85% | A vs C | 211 | 187.8 to 234.2 | <0.001 |
| 85% | B vs C | 265 | 238.3 to 291.7 | <0.001 |
| 100% | A vs B | -55 | -88.5 to -21.5 | 0.016 |
| 100% | A vs C | 245 | 219.0 to 271.0 | <0.001 |
| 100% | B vs C | 300 | 269.7 to 330.3 | <0.001 |
Table 17.
Heading-dependent and maximum servo-induced magnetic variations of the three original RM3100 installation configurations.
Table 17.
Heading-dependent and maximum servo-induced magnetic variations of the three original RM3100 installation configurations.
| Sensor | Location | Heading P–P (nT) | Max heading |
Servo-induced variation, Mean ± SD (nT), n = 5 |
Main sensitivity |
| RM3100-A RM3100-B RM3100-C |
Wing section Wing section Tail section |
145 118 62 |
135° 135° 180° |
58 ± 4.2 52 ± 3.7 44 ± 3.0 |
Heading / wing servo Heading / wing servo Tail servo / low variation |
Table 19.
Ground-based summary of overall magnetic stability metrics and relative ranking of the three original RM3100 installation configurations.
Table 19.
Ground-based summary of overall magnetic stability metrics and relative ranking of the three original RM3100 installation configurations.
| Sensor | Location | Overall Std. (nT) | Overall P–P Variation (nT) | Relative Ranking |
| RM3100-A RM3100-B RM3100-C |
Wing section Wing section Tail section |
74 82 36 |
455 510 205 |
Intermediate Highest Lowest |
Table 20.
Ground and airborne magnetic stability and retained repeat-line validation metrics for the three original RM3100 installation configurations.
Table 20.
Ground and airborne magnetic stability and retained repeat-line validation metrics for the three original RM3100 installation configurations.
| Sensor Configuration | Ground Overall SD (nT) | Airborne SD (nT) | Ground P-P (nT) | Airborne P-P (nT) | Repeat-Line RMSE (nT) | Outbound SD (nT) | Reciprocal SD (nT) | Direction Difference (nT) |
| RM3100-A / Wing RM3100-B / Wing RM3100-C / Tail |
74 82 36 |
93.0 ± 4.2 107.2 ± 6.0 48.4 ± 3.2 |
455 510 205 |
535.9 ± 26.0 602.2 ± 31.7 245.4 ± 16.0 |
72.1 ± 5.0 83.4 ± 6.4 34.7 ± 3.7 |
89.8 102.4 46.0 |
96.2 112.0 50.8 |
6.4 9.6 4.8 |
Table 21.
Independent environmental-reference validation of the three installed RM3100 sensor configurations. Original values correspond to the retained onboard measurements, whereas reference-corrected values were obtained after removal of the synchronized time-varying reference component.
Table 21.
Independent environmental-reference validation of the three installed RM3100 sensor configurations. Original values correspond to the retained onboard measurements, whereas reference-corrected values were obtained after removal of the synchronized time-varying reference component.
| Configuration | Location | Original Overall SD (nT) | Reference-Corrected SD (nT) | SD Reduction (%) | Original Overall P-P (nT) | Reference-Corrected P-P (nT) | Baseline Correlation with Reference |
| RM3100-A RM3100-B RM3100-C |
Wing section Wing section Tail section |
74 82 36 |
70.9 78.8 32.8 |
4.2 3.9 8.9 |
455 510 205 |
449 503 198 |
0.81 0.78 0.88 |
Table 22.
Synchronized electrical, propulsion, and magnetic measurements obtained during the multi-level throttle experiment. Values reported with ± represent mean ± SD across the five repeated trials and indicate trial-to-trial variability rather than instrument measurement uncertainty.
Table 22.
Synchronized electrical, propulsion, and magnetic measurements obtained during the multi-level throttle experiment. Values reported with ± represent mean ± SD across the five repeated trials and indicate trial-to-trial variability rather than instrument measurement uncertainty.
| Throttle | Current (A) | Voltage (V) | Power (W) | Motor Speed (rpm) | RM3100-A ΔB (nT) | RM3100-B ΔB (nT) | RM3100-C ΔB (nT) |
| 15% 30% 50% 70% 85% 100% |
12.4 ± 0.8 24.8 ± 1.1 43.5 ± 1.6 66.8 ± 2.3 88.6 ± 3.0 108.2 ± 3.8 |
49.6 ± 0.18 49.0 ± 0.20 48.2 ± 0.25 47.1 ± 0.31 46.0 ± 0.37 44.8 ± 0.44 |
615 1215 2097 3146 4076 4847 |
1850 ± 75 3380 ± 95 5060 ± 120 6480 ± 150 7480 ± 175 8230 ± 195 |
112 ± 7.6 158 ± 9.4 228 ± 12.7 309 ± 16.2 374 ± 18.8 430 ± 20.9 |
136 ± 9.8 188 ± 11.7 270 ± 14.9 359 ± 18.7 428 ± 21.8 485 ± 24.7 |
52 ± 4.2 73 ± 4.9 104 ± 6.2 137 ± 8.1 163 ± 10.0 185 ± 12.1 |
Table 24.
Detailed heading-dependent magnetic response of the three original RM3100 installation configurations at 45° heading intervals. Values are reported as retained mean ± SD summaries.
Table 24.
Detailed heading-dependent magnetic response of the three original RM3100 installation configurations at 45° heading intervals. Values are reported as retained mean ± SD summaries.
| Heading | RM3100-A | RM3100-B | RM3100-C |
| 0 ° | -50 ± 5.1 | -38 ± 4.7 | -14 ± 2.9 |
| 45 ° | -18 ± 4.8 | -12 ± 4.3 | -5 ± 2.7 |
| 90 ° | 32 ± 6.2 | 34 ± 5.8 | 17 ± 3.4 |
| 135 ° | 95 ± 7.3 | 80 ± 6.6 | 34 ± 4.1 |
| 180 ° | 62 ± 6.5 | 51 ± 5.9 | 48 ± 4.5 |
| 225 ° | 10 ± 5.4 | 8 ± 4.9 | 26 ± 3.7 |
| 270 ° | -28 ± 4.9 | -26 ± 4.5 | -7 ± 3.0 |
| 315 ° | -42 ± 5.2 | -34 ± 4.6 | -12 ± 2.8 |
Table 25.
Servo-induced magnetic response of the three RM3100 configurations under the evaluated actuation conditions.
Table 25.
Servo-induced magnetic response of the three RM3100 configurations under the evaluated actuation conditions.
| Servo condition | RM3100-A | RM3100-B | RM3100-C |
| No servo | 5 | 6 | 4 |
| Wing servo Tail servo |
58 21 |
52 19 |
18 44 |
| Combined servo | 55 | 49 | 41 |
Disclaimer/Publisher’s Note: The statements, opinions and data contained in all publications are solely those of the individual author(s) and contributor(s) and not of MDPI and/or the editor(s). MDPI and/or the editor(s) disclaim responsibility for any injury to people or property resulting from any ideas, methods, instructions or products referred to in the content. |
© 2026 by the authors. Licensee MDPI, Basel, Switzerland. This article is an open access article distributed under the terms and conditions of the Creative Commons Attribution (CC BY) license (http://creativecommons.org/licenses/by/4.0/).
Copyright: This open access article is published under a Creative Commons CC BY 4.0 license, which permit the free download, distribution, and reuse, provided that the author and preprint are cited in any reuse.