

Submitted:
13 September 2026
Posted:
14 September 2026
You are already at the latest version
Abstract
Because of the increasing demand for lithium, interest has grown in developing highly efficient methods to separate lithium from non-conventional sources such as lithium clays. This study assesses electrodialysis (EDU) and capacitive deionization (CDI), as well as a combined EDU–CDI method, for recovering and purifying lithium from a chloride-containing leachate solution obtained from lithium clays. This study examined the initial stage of the EDU process. Under different conditions (voltage, treatment time, and flow rates), the removal and enrichment of lithium, as well as its recovery and selectivity, were investigated. CDI was examined as a polishing technique, with particular attention to lithium recovery and discrimination between Li⁺ and Na⁺ ions using modified carbon-based electrodes. The results show that the EDU technique can promote lithium transport and enrichment; however, Li/Na selectivity remains low because the monovalent ions are transported simultaneously. The CDI technique has demonstrated a greater degree of lithium enrichment compared to that of Na⁺ ions, which shows its potential as a selective separation step. When combined, the techniques show complementary effects: EDU performs bulk ion separation, while CDI improves the quality of the lithium-enriched solution. Furthermore, preliminary tests have indicated promising behavior of the LiMn₂O₄-based electrodes.
Keywords:
lithium recovery
; lithium-bearing clays
; hydrochloric acid leaching
; electrodialysis
; capacitive deionization
; Li/Na selectivity
; hybrid electrochemical separation
1. Introduction
The extensive use of electric cars, mobile phones, computers, and other battery-powered devices, as well as large stationary storage units, is increasing the demand for lithium [1,2].
Currently, commercial-scale lithium production mainly uses hard-rock ores and natural brines. These traditional methods are generally known for their high energy demand, large amounts of water consumption, lengthy processing times, and the use of substantial quantities of chemicals [1,2,3]. As a result, interest in unconventional lithium resources such as geothermal brines, produced waters, and lithium-containing clay deposits is growing [1,2].
Lithium-containing clays represent a resource of possible great importance; nevertheless, processing is difficult since lithium is found in complex mineral matrices [4,5]. Although acid leaching is effective in getting lithium into solution, it also causes large quantities of sodium, potassium, magnesium, calcium, aluminum, iron, and other impurities to be dissolved [4,5]. As a result, the leachates obtained have to go through a number of purification and concentration stages in order to produce high-purity lithium products. Traditional downstream processes, including precipitation, ion exchange, solvent extraction, evaporation, and crystallization, can in turn lead to greater chemical consumption, higher operating costs, and more secondary waste being generated [3,4].
Electrochemical separation methods offer a promising alternative for the downstream processing of lithium-rich leachates [6,7]. Electrodialysis (ED) makes use of ion-exchange membranes and an applied electric field in order to transport and concentrate the ionic species [8,9,10]. Although electrodialysis is capable of efficiently concentrating the dissolved salts, its selectivity for lithium is generally limited by the presence of chemically similar monovalent ions, in particular sodium [8,10]. Moreover, membrane scaling, concentration polarization, and the precipitation of divalent ions can all reduce the overall performance of the process [8,10].
Capacitive deionization (CDI) is an electrochemical method of separating ions from aqueous solutions by applying an electric potential across porous electrodes, which causes the ions to be adsorbed and stored in the electrodes [11,12]. Different from electrodialysis, in which ions are transferred through ion-exchange membranes, CDI provides an alternative means of achieving ion separation that can be controlled by the design of the electrodes, the voltage used, and the adsorption time [11,12]. When it comes to lithium purification, conventional carbon electrode materials are able to adsorb the dissolved ions, but they generally do not have the inherent ability to prefer Li⁺ over other monovalent ions such as Na⁺. Because of this, recent efforts have been directed towards the development of modified carbon electrodes and lithium-selective electrodes in order to improve the Li/Na discrimination factor and enable CDI to function as a polishing process for the selective extraction of lithium [11,13,14].
Materials that are selective for lithium and can undergo intercalation or ion sieving can improve the separation of lithium from other cations [15,16,17,18,19]. There is the possibility of combining the concentration efficiency of membrane-based separation with the ability of advanced electrode materials to capture specific ions by integrating electrodialysis and capacitive deionization [6,11,12].
The study looks at EDU, CDI, and a combined EDU–CDI hybrid process for the purpose of recovering lithium. It examines the influence of the applied voltage, the time taken, the flow rate, and other ions such as sodium on the transport and concentration of lithium. CDI is evaluated using both porous carbon-based materials and lithium-selective electrode materials, with special attention being given to ion capture, regeneration, and selectivity [11]. The main aim is to assess the technical feasibility and the main limitations of the hybrid process with regard to producing a lithium-enriched solution for further conversion into other lithium compounds [20].
2. Materials and Methods
2.1. Sample Preparation
The solution used in the electrodialysis experiments was obtained by leaching lithium-containing clay with hydrochloric acid. This leachate was then used as the starting feed solution when assessing lithium separation by electrodialysis.
In the capacitive deionization (CDI) experiments, a synthetic brine containing lithium and sodium as the principal cations was employed both during the first experimental campaign and in the later CDI tests. A synthetic solution was used in order to assess the effects of the key operating parameters on lithium recovery and on Li/Na selectivity under controlled conditions.
The same hydrochloric acid leachate which had been used in the electrodialysis experiments was used as the initial feed solution for the integrated electrodialysis–capacitive deionization (EDU–CDI) experiments. In this setup, the electrodialysis step served as the main separation stage, and the CDI step then acted as a further purification and selective recovery stage.
2.2. Sample Characterization
The chemical composition of both the feed and the product solutions was determined by means of Inductively Coupled Plasma–Optical Emission Spectroscopy (ICP-OES) or Atomic Absorption Spectroscopy (AAS), depending on which equipment was available and what type of analysis was required; the AAS was carried out with a Perkin Elmer PinAAcle 900F atomic absorption spectrometer, and the ICP-OES was performed using a separate ICP-OES instrument.
The elemental analysis showed that there were several dissolved compounds present in low concentrations, and among the cations identified in the leachate were lithium and sodium ions; the concentrations of these ions gave an initial Li/Na ratio of about 1, which meant that lithium separation would have to rely on good differentiation between Li⁺ and Na⁺; Li/Na selectivity therefore became a key evaluation criterion.
The original brine had a lithium concentration of 10.47 g/L and a sodium concentration of 12.39 g/L, which gave it a Li/Na concentration ratio of 0.84; moreover, other ions such as magnesium, calcium, and potassium were present but in much lower amounts. The initial pH of the solution was 6.46. The synthetic brine contained 7.00 g/L of lithium and 5.80 g/L of sodium, with an initial pH of 6.76.
Since hydrochloric acid was used to leach the clay containing lithium, chloride was expected to be the main anionic species in the feed solution. This high concentration of chloride is especially important in the context of electrochemical separation since oxidation of chloride at the anode could lead to chlorine evolution under adverse operating conditions [8]. In order to minimize the direct exposure of chloride to the anodic reaction environment and to reduce the likelihood of chlorine gas being formed [8,20], a bipolar-membrane-based electrodialysis setup was used.
2.3. Methodology and Calculations.
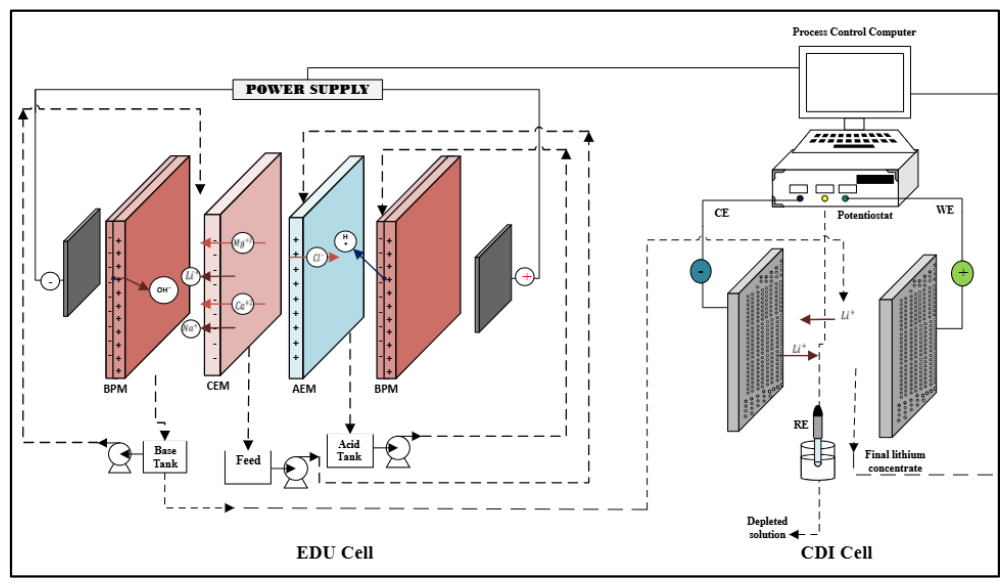
The experimental study was carried out in three successive stages: first, the evaluation and optimization of the bipolar membrane electrodialysis system; second, the evaluation of the capacitive deionization system; and third, the integration of both processes into a hybrid electrodialysis–capacitive deionization (EDU–CDI) system. Figure 1 presents a schematic diagram of the entire experimental system.
During the first stage, the bipolar membrane electrodialysis system was assessed with the use of Feed Solution 1. The influence of the key operating variables—namely the applied voltage, the treatment time, and the solution flow rate—was systematically examined in order to find operating conditions that improved lithium separation and recovery. For these experiments, a one-factor-at-a-time (OFAT) method was employed, consisting of varying one operating parameter at a time while keeping all the other experimental conditions constant. The individual effects of voltage, treatment time, and flow rate on the separation performance were then analyzed.
The capacitive deionization (CDI) system was individually assessed in the second stage, the applied voltage and the adsorption time being chosen as the main operating variables in order to study their effects on ion removal, lithium recovery, and Li/Na selectivity.
Stress was placed on the ability of the altered electrodes to separate lithium rather than sodium.
In the end, the two processes were combined to form a hybrid EDU–CDI system. The operating conditions used in the integrated experiments were chosen on the basis of the findings from the separate evaluation of each separation stage. As a result, the hybrid system was run under the conditions which had been found to be favorable for lithium recovery and for the separation of lithium from sodium in the earlier EDU and CDI experiments.
Figure 1.
Hybrid Electrochemical System Design.
To quantitatively compare the experimental results and identify favorable operating conditions, we calculated a series of performance indicators. We selected these parameters based on metrics commonly used to evaluate lithium recovery and electrochemical separation processes [11,12]. For simplicity and consistency throughout this study, we designated the performance indicators as R1, R2, R3, and R4.
The R1 metric represents the percentage of lithium removed from the dilute or feed solution during treatment and was used primarily to quantify the effectiveness of lithium transfer from the initial solution.
The R2 metric represents the lithium concentration factor and describes the extent to which lithium was concentrated in the product stream relative to its initial concentration in the feed solution. R1 and R2 were therefore particularly relevant for evaluating EDU stage performance.
The R3 metric describes the selectivity of the separation process toward lithium relative to sodium. This parameter was particularly important for evaluating the CDI stage because the modified electrode system was designed to improve the preferential recovery of Li⁺ over Na⁺. Since lithium and sodium were the predominant cations in the investigated solutions, Li/Na discrimination was considered a key criterion for assessing the performance of the secondary purification stage.
The R4 metric quantified lithium recovery based on the transfer of lithium from the initial feed solution to the corresponding product stream. This parameter considers the lithium mass present in the different process streams and therefore provides an additional measure of overall lithium-recovery efficiency. Although individual metrics were more relevant to specific stages of the process, R1–R4 were calculated, when applicable, for both EDU and CDI experiments to provide a consistent basis for comparison.
The performance metrics were calculated according to the following equations:
R1 – Lithium removal from the dilute
R2 – Lithium concentration factor
R3 – Li/Na selectivity
R4 – Lithium recovery
Where:
: concentration in the initial dilute (mg/L)
: concentration in the final dilute (mg/L)
: Concentration in recovered steam (product) (mg/L)
: concentration of Li in the initial recovered stream (product) (mg/L)
: concentration in the initial dilute stream (mg/L)
: Concentration in the final dilute stream (mg/L)
: Concentration in recovered steam (product) (mg/L)
: Final product volume (mL)
: Initial volume (mL)
In addition to the separation metrics, we determined the specific energy consumption (SEC) of the electrochemical processes. For the EDU experiments, energy consumption was calculated from the applied electrical conditions and the amount of lithium recovered using the corresponding energy-consumption equation [12,21]:
where the electrical energy consumption is expressed in kWh, (V) is the applied cell voltage, (I) is the measured current, and (t) is the operating time. When the current varied during an experiment, the energy consumption was determined by integrating the current response over the treatment period.
The lithium-specific energy consumption (SEC) was calculated by normalizing the electrical energy consumed by the net mass of lithium transferred to the corresponding enriched product stream [21]:
where SEC represents the electrical energy required per unit mass of lithium transferred or recovered.
The net mass of lithium transferred to the enriched stream was determined from the lithium mass balance:
Where: CLi, E,0 and CLi, E,f are the initial and final lithium concentrations in the EDU stream, while VE,0 and VE,f are the corresponding volumes.
This formulation accounts for changes in both lithium concentration and solution volume during operation and therefore provides a more representative measure of lithium accumulation than concentration changes alone.
The same methodology was applied to both the EDU and CDI stages. For each process, the electrical energy consumption was calculated from the corresponding voltage, current response, and operating time, while the lithium-specific energy consumption was normalized by the net lithium mass transferred to the enriched or product stream.
Each experimental system consisted of a single-cell unit. The electrodialysis cell had nominal dimensions of 12.5 × 7.6 cm, corresponding to a geometric area of 95 cm². The CDI cell had dimensions of 7 × 7 cm, corresponding to a geometric area of 49 cm². When calculating current density, ion flux, or other area-normalized parameters, we used the effective membrane or electrode area rather than the total geometric cell area.
Fumatech supplied the ion-exchange membranes used in the electrodialysis system, including cation-exchange membranes (CEMs), anion-exchange membranes (AEMs), and bipolar membranes (BPMs). Graphite current collectors and carbon-based electrodes used in the electrochemical systems were prepared and modified using materials obtained from commercial suppliers, including Fuel Cell Store and MSE Supplies. Detailed specifications of the membranes, electrode materials, compositions, and preparation procedures are provided in the corresponding experimental sections.
3. Results and Discussion
The experimental results for each stage of the lithium recovery process are set out and discussed in this section. The performance of the electrodialysis (EDU) system is assessed, with a special focus on the influence of various operating variables, including the applied voltage, treatment time, and flow rate, on lithium separation and concentration. The second stage looks at the performance of the capacitive deionization (CDI) system, mainly concentrating on the effect of the applied voltage and treatment time upon lithium recovery and Li/Na selectivity.
The EDU–CDI system's performance is then assessed by combining the operating conditions that were found to be favorable in the separate EDU and CDI experiments. The results obtained with the hybrid setup are analyzed in terms of lithium recovery, concentration, selectivity, and the overall performance of the process.
As a final point, alternative electrode materials and modifications to the electrode are suggested for use in the CDI stage as possible ways of further increasing lithium selectivity and improving the performance of the integrated lithium recovery process.
3.1. Bipolar Electrodialysis
The performance of the bipolar membrane electrodialysis system was evaluated as a function of applied voltage, treatment time, and solution flow rate. The primary performance metrics considered in this stage were R1, R2, R3, and R4, as defined previously.
In the course of bipolar membrane electrodialysis, three major process streams have been created: acid stream, dilute stream, and base stream. The acid chamber is responsible for acid production, while the dilute chamber was initially filled with lithium-containing feed solution. Under the action of an electric field, ions move across ion-exchange membranes, and lithium ions are depleted in the feed chamber. The base chamber is responsible for the main lithium-containing product stream, where Li⁺ ions accumulate during the run and are then analyzed to assess the level of lithium.
The membrane configuration used in the present system was Anode | BPM | AEM | CEM | BPM | Cathode
To ensure adequate ionic conductivity and to enable stable operation at the start of each experiment, dilute electrolyte solutions were first added to both the acid and base compartments. The acid compartment was filled with 0.01 M HCl while the base compartment had 0.01 M LiOH. Since the initial solution of LiOH had introduced a known quantity of lithium into the base compartment prior to the start of electrodialysis, this initial amount of lithium was specifically taken into account in the mass-balance calculations. As a result, the lithium build-up in the base stream was calculated on the basis of the net increase in lithium mass rather than simply relying on the final lithium concentration.
A 0.05 M solution of Na₂SO₄ was employed as the electrolyte used for rinsing the electrode. This electrode-rinse solution not only supplied ionic conductivity to the electrode chambers but also helped in separating the electrode reactions from the chloride-containing process streams. The reason for adopting this setup was to decrease the extent of direct chloride exposure at the anode and thus to minimize the possibility of chlorine being evolved during electrolysis [8].
The impact of the applied voltage, the treatment time, and the flow rate on lithium transport was then assessed by means of the concentration and selectivity criteria described above; the changes in lithium concentration in both the dilute and base streams, along with the corresponding changes in sodium concentration, were used to determine how each operating parameter affected lithium concentration and Li/Na separation.
3.1.1. Voltage Study
The impact of the applied voltage on the performance of bipolar electrodialysis was examined at four voltage levels: 1.5, 2.0, 2.5, and 3.0 V. Each experiment was carried out separately under potentiostatic conditions, with the chosen cell voltage kept constant for a period of 60 minutes. The resulting changes in lithium transport, concentration, and Li/Na selectivity were then compared in order to assess how the applied voltage affected process performance.
The effect of the applied voltage on the EDU performance metrics is shown in Figure 2. When the voltage was increased from 1.5 to 3.0 V, lithium transport improved, since R1 and R4 rose from about 63% to 78–79%. This result shows that a greater electrical driving force encourages ion migration through the ion-exchange membranes and thus increases the amount of lithium removed from the dilute solution and transferred to the product stream.
The lithium concentration factor (R2) increased gradually from about 1.02 at 1.5 V to 1.25 at 3.0 V, with the greatest improvement occurring between 2.5 and 3.0 V. Yet the Li/Na selectivity factor (R3) stayed near one (ranging from 1.01 to 1.04). This small variation shows that ion transport improved as the voltage increased, but it had no significant impact on the preferential transport of Li⁺ ions over Na⁺ ions.
Of all the conditions examined, 3.0 V gave the greatest lithium removal, recovery, and concentration factor. Yet the best separation performance does not mean that this is the most suitable operating condition, as a higher voltage may also lead to increased energy consumption and cause concentration polarization, non-selective ion transport, and water splitting [8,10,12]. It therefore follows that when choosing the operating voltage, separation performance should be taken into account together with Li/Na selectivity, specific energy consumption, and operational stability.
3.1.2. Time Study
The effect of treatment time on bipolar electrodialysis performance was evaluated at four operating times: 20, 40, 60, and 80 min. For these experiments, the applied voltage and flow rate were maintained constant, while the treatment time was varied independently. Changes in lithium removal, concentration, recovery, and Li/Na selectivity were evaluated using the R1–R4 performance metrics. This study was conducted to determine the influence of operating time on lithium transport and to identify the treatment duration beyond which further improvements in separation performance became limited.
Figure 3 shows the effect of operating time on EDU performance. Increasing the treatment time progressively improved lithium removal (R1) and lithium recovery (R4), reaching approximately 78–79% at the longest operating time evaluated. This trend reflects the cumulative migration of Li⁺ across the ion-exchange membranes under the applied electric field, resulting in progressive lithium depletion from the diluate and accumulation in the enriched stream.
The lithium concentration factor (R2) also increased from approximately 1.00 to 1.25 as operating time increased. The improvement was more pronounced during the early and intermediate stages of operation and became more gradual at longer treatment times. This behavior suggests diminishing incremental lithium transfer as the composition of the process streams changed during electrodialysis. As lithium is progressively depleted from the feed compartment, factors such as increasing electrical resistance, concentration polarization, back-diffusion, and changes in ionic composition may reduce the rate of further separation [8,10].
The Li/Na selectivity metric (R3) increased only slightly, from approximately 1.17 to 1.22. Although this trend indicates a slight improvement in Li/Na discrimination with increasing treatment time, the change remained limited compared with the improvements observed for lithium removal, concentration, and recovery. This behavior further indicates that the EDU system effectively promotes ion transport and lithium concentration but provides limited intrinsic selectivity between Li⁺ and Na⁺ because both species are monovalent cations that can migrate through conventional cation-exchange membranes [8,10,11].
Overall, the longest treatment time produced the highest R1–R4 values within the investigated range, and no clear performance plateau was observed. However, extending the operating time should not be considered advantageous based solely on separation performance, since longer treatment periods also increase electrical energy consumption. Therefore, selecting an appropriate operating time should consider the trade-off between lithium recovery, concentration, Li/Na selectivity, and specific energy consumption.
3.1.3. Flow Rate Study
The impact of the solution flow rate on the performance of bipolar electrodialysis was examined at four different flow rates: 4, 5, 6, and 8 mL min⁻¹. In these experiments, the applied voltage and the duration of treatment were kept constant whilst the flow rate was changed independently. The effect of the flow rate on lithium removal, concentration, recovery, and Li/Na selectivity was assessed by means of the R1 to R4 performance indicators. The aim of this study was to find out how solution residence time and the hydrodynamic conditions inside the cell influenced ion transport and the overall separation performance.
Figure 4 illustrates the effect of flow rate on EDU performance. At a flow rate of 6 mL min⁻¹, lithium removal (R1) and lithium recovery (R4) reached about 77%, as opposed to about 67.3% and 64.9%, respectively, at 4 mL min⁻¹. This indicates that an intermediate flow rate offered a favorable balance between hydrodynamic mass transfer and the solution residence time in the EDU cell.
At lower flow rates, the mixing of the solution may become weaker, and this can cause the thickness of the concentration boundary layer next to the membrane surface to increase, thus restricting ion transport [8,10]. Raising the flow rate can improve mixing and reduce concentration polarization, which in turn enhances mass transfer towards the membrane. However, when the flow rate was raised to 8 mL min⁻¹, R1 dropped sharply to about 61%, and R4 fell to about 69%. This decrease could be due to the shorter residence time of the solution in the cell, which reduces the time available for ion migration across the membranes [8,10].
The optimum value for the lithium concentration ratio (R2) was obtained when it was approximately 1.25, that is, at a flow rate of 6 mL min⁻¹, after which it fell at a flow rate of 8 mL min⁻¹. Nevertheless, the Li/Na selectivity parameter (R3) showed non-monotonic behavior; it meant that altering the flow rate had no effect on the lithium selectivity with respect to sodium in all cases. This is in agreement with the ion-exchange membranes having a poor intrinsic selectivity for Li⁺ and Na⁺ ions.
Of all the values examined, 6 mL min⁻¹ exhibited the most favorable characteristics, with the highest values for the parameters R1, R2, and R4. This indicates that the EDU process is one in which there is an equilibrium between hydrodynamics, concentration polarization, and residence time rather than being determined by the flow rate [8,10].
3.2. Capacitive Deionization
The CDI experiments were conducted using a synthetic brine and modified activated carbon cloth electrodes. We evaluated three electrode mass loadings (L1–L3) while maintaining the same solid composition. The electrode formulation consisted of 80 wt% hard carbon, 10 wt% conductive carbon black, and 10 wt% PTFE binder. The resulting slurry was uniformly applied to the activated carbon cloth, dried at 80 °C, and placed in direct contact with a graphite current collector.

Table 1.
Characteristics of the modified electrode.
| Solid Composition | Mass Loading |
|---|---|
| 80 wt % Hard Carbon | L1: 4 mg/cm2 |
| 10 wt% Conductive Carbon Black | L2: 6 mg/cm2 |
| 10 wt% PTFE binder | L3: 8 mg/cm2 |
After the desorption stage, deionized water was circulated through the cell for approximately 3–5 min to remove residual ions from the flow channels and electrode surfaces before the subsequent experimental cycle.
Because of the small dimensions of the CDI cell, flow rate was not included as an experimental variable. Instead, a constant flow rate was maintained throughout all CDI experiments to isolate the effects of applied voltage, adsorption time, and electrode mass loading.
3.2.1. Voltage Study
Figure 5 shows how lithium enrichment (R2) varies with the applied voltage, and the selectivity ratio (R3) was also investigated for the initial CDI electrode as well as for the L2 and L3 electrodes, which had higher loads (Figure 5). In each case, it was observed that R2 increased as the voltage increased, a result that may be attributed to the fact that greater electrode polarization led to improved electrosorption of lithium ions.
The selectivity response (R3) depended on the electrode configuration; with the preliminary CDI electrode, R3 increased as the voltage increased and then reached a plateau at high voltage, whereas with the L2 and L3 electrodes, R3 reached a maximum at an intermediate voltage level and then decreased at the highest voltage level.
On the other hand, the high amount of active material in L2 and L3 led to a high adsorption capacity and improved lithium enrichment. Yet, thick electrodes might increase the resistance to ion transport and prevent access to the internal adsorption sites [11,12,14,21]. Furthermore, at high voltage values, it causes a reduction in the selectivity of charge compensation [11,14].
In general, raising the applied voltage led to greater lithium enrichment for all the CDI electrodes, but the highest voltage did not result in the highest Li/Na selectivity for the electrodes with higher loading. It therefore follows that the voltage at which operation is preferred should be determined by balancing lithium enrichment, Li/Na selectivity, and energy consumption rather than by considering only maximum ion uptake.
3.2.2. Time Study
The influence of adsorption time on lithium enrichment (R2) and Li/Na selectivity (R3) was examined for the initial CDI electrode as well as for the L2 and L3 electrodes, which have a higher loading (see Figure 6). In each instance, an increase in adsorption time led to better lithium uptake, as shown by the rise in R2. The most significant changes took place during the early and middle stages of adsorption, since at that time there were more charge-storage sites readily accessible in the electrode structure.
When the adsorption times were longer, R2 reached a plateau or changed only slightly, which showed that the electrodes were approaching their effective adsorption capacity. This was because as the most accessible pores became more and more filled, further uptake of ions was increasingly hindered by the transport into the less accessible pores and by the competition between Li⁺ and Na⁺ for the available charge-storage sites [11,13,14].
The same thing was seen in the case of R3. Generally, the preference for lithium over sodium increased during the first and middle stages of adsorption, indicating that a sufficient contact time helped to promote the preferential uptake of lithium. However, at longer adsorption times, R3 either leveled off or decreased slightly, especially in some electrode setups. This indicates that extending the adsorption time gave only limited extra lithium selectivity and might have led to further co-adsorption of Na⁺ as the electrodes neared saturation [11,14].
The results show that lithium enrichment and the Li/Na selectivity improve when the adsorption time is extended, but only up to a particular point; beyond that time, the advantages of separation are negligible, and longer operation leads to a greater processing time and higher energy consumption. It therefore follows that the most favorable operating condition is an intermediate to long adsorption time, which corresponds to the onset of the R2 and R3 plateaus.
As shown in Figure 7, lithium recovery for the three CDI electrodes is influenced by both the adsorption time and the applied voltage; in each case, the recovery increases with these factors and then levels off at higher values, which shows that the electrode capacity and ion transport are becoming more limiting.
L1 had the worst performance, whereas L2 offered a more extensive favorable operating region. L3 achieved the highest lithium recovery, which is in agreement with its higher loading of active material. However, the plateau seen at high voltage and after a long adsorption time indicates that the diffusion resistance is increasing and that the extra active material is not being fully utilized [11,22].
L3 was chosen for the further CDI experiments and for inclusion in the hybrid EDU–CDI system since it gave the best recovery performance.
3.3. Hybrid System – Integrated Continuous EDU - CDI Run
The final operating conditions were chosen from the optimization of the individual EDU and CDI stages for use with the integrated EDU–CDI system. Table 2 gives a summary of these final operating conditions.
The first feed for the hybrid system was the hydrochloric-acid leachate obtained from the lithium-containing clay. The base stream generated in the EDU stage was then used as the feed solution for the CDI stage. Following each CDI cycle, deionized water was circulated for three minutes in order to rinse the electrodes and the flow channels.
The pH of the EDU base stream was about 9 to 10, whereas that of the final CDI product was about 9. On the other hand, the EDU acid stream stayed strongly acidic, its pH ranging from about 1.0 to 1.75.
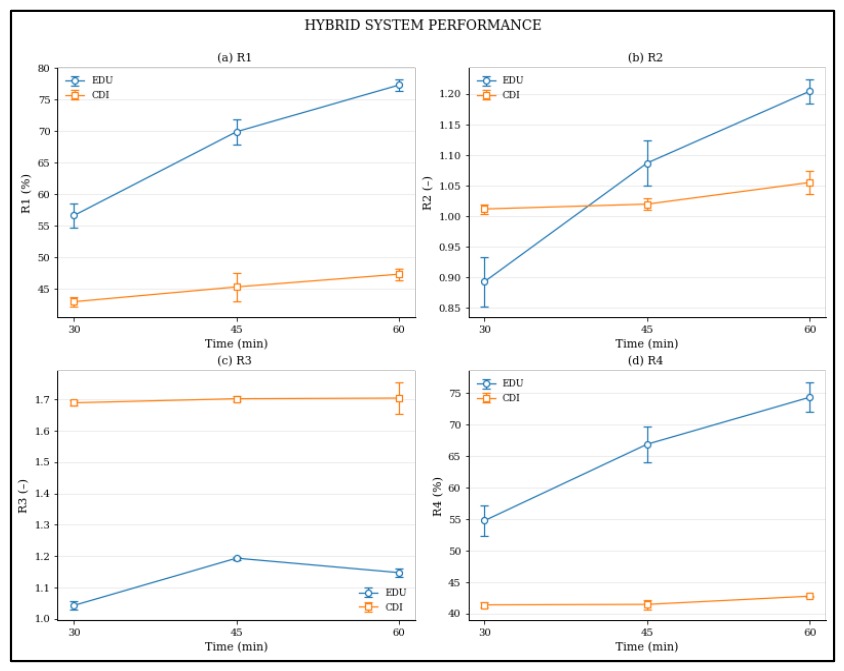
During the EDU stage, there was the greatest temporal variation: the values for R1 and R4 rising from about 55–56% at 30 minutes to 74–77% at 60 minutes, and R2 also increased from below unity to about 1.20, which shows that there was a progressive transfer and enrichment of lithium as the system neared more stable operating conditions.
During the EDU stage, R3 increased at first before decreasing slightly by 60 minutes, indicating that better lithium transport was associated with an increase in Na⁺ co-transport. By contrast, during the CDI stage, there were only minor changes in R1, R2, and R4, while R3 stayed almost constant at about 1.68 to 1.70.
The results show that there are complementary functions at work in the hybrid process: EDU was mainly responsible for the primary lithium transport and concentration, while CDI mainly served to maintain a higher Li/Na separation response.
Figure 8.
Time evolution of stage-specific performance metrics during the integrated continuous EDU→CDI run: (a) (R1), (b) (R2), (c) (R3), and (d) (R4). Results are shown for the EDU and CDI stages at 30, 45, and 60 min; error bars represent ± standard deviation.
Figure 8.
Time evolution of stage-specific performance metrics during the integrated continuous EDU→CDI run: (a) (R1), (b) (R2), (c) (R3), and (d) (R4). Results are shown for the EDU and CDI stages at 30, 45, and 60 min; error bars represent ± standard deviation.
The evolution of the Li and Na concentrations within the EDU compartments is shown in Figure 9. In the feed, both ions decreased continuously and tended to accumulate in the base stream, which confirms that there is a net transport of cations through the membrane system. The fact that both Li⁺ and Na⁺ are transported simultaneously shows that the ion-exchange membranes have only limited intrinsic selectivity, whereas the low concentrations found in the acid stream indicate that there is only limited cation crossover into this compartment.
The concentration profiles corresponding to the CDI stage are shown in Figure 10. Lithium increased in the concentrate stream while at the same time decreasing in both the feed and dilute streams. Sodium ion transport also took place, but its relative response was smaller, which shows that CDI gave an additional degree of Li/Na separation following EDU. The smaller change seen at longer times indicates that the electrode capacity and ion-transport limitations gradually prevented further enrichment.
3.4. CDI Purification and Selectivity Stage
LMO electrodes (LiMn₂O₄) were studied as a possible approach to increase Li selectivity during the CDI polishing step. The spinel LiMn₂O₄ is capable of reversible extraction and incorporation of Li⁺ ions [15,16,17,18,23].
Prior to lithium capture, the LMO electrode was electrochemically activated by partial delithiation to generate vacant lithium intercalation sites:
During the capture step, Li⁺ is reinserted into the vacant spinel sites:
The opposite reaction takes place in the process of regeneration, where the accumulated Li⁺ is released back into the regeneration solution. The fact that manganese dissolution may be the factor that affects the long-term stability of LMO cathodes makes monitoring necessary [16,17,18,23].
The composite electrode was prepared using LMO as the lithium-selective active material, conductive carbon as the electrical additive, and PTFE as the binder. The slurry was applied to activated carbon cloth, dried at 80 °C, and placed in direct contact with a graphite current collector. The selected electrode mass loading was 6 mg/cm².
Before lithium capture, the LMO electrode was activated in Li-free Na₂SO₄ to generate vacant intercalation sites. Lithium capture was then conducted at 1.0 V for 40 min at 5 mL min⁻¹. After a brief DI-water rinse, lithium was released by reversing the polarity to −1.0 V for 10 min.
3.4.1. LMO Performance
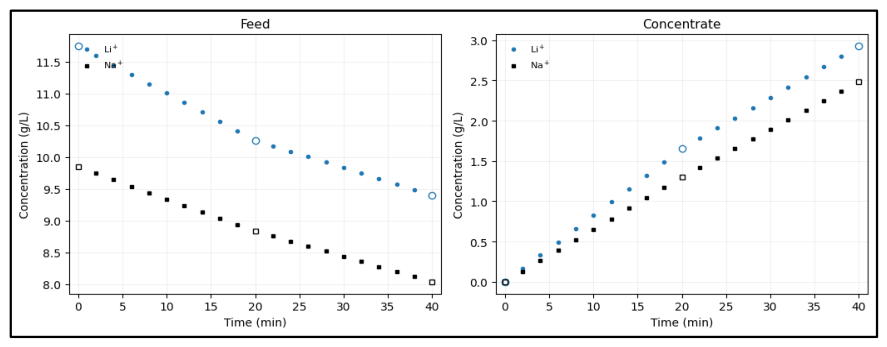
Initial experiments showed that both Li⁺ and Na⁺ were removed in a progressive manner as the adsorption time increased. Lithium removal rose from 12.6 percent after 20 minutes to 20.0 percent after 40 minutes, and sodium removal went from 10.2 percent to 18.3 percent.
After 40 minutes, the lithium recovery was about 62.3 percent; the concentration profiles showed that lithium had been transferred from the feed to the recovery stream, but it was also found that a considerable amount of sodium ions had been co-transported, which means that a high selectivity for lithium over sodium had not yet been obtained.
When the conditions were tested, there was a low level of magnesium transfer and only negligible manganese dissolution, which indicates that the LMO electrode has preliminary chemical stability.
Figure 11.
Li and Na concentration profiles during CDI operation using the LMO-based electrode.
The preliminary results as a whole show that it is feasible to include LMO in the CDI system for the purpose of lithium capture, but further optimization is still needed if the Li/Na selectivity is to be improved and long-term electrode stability is to be confirmed.
3.5. Specific Energy Consumption
The specific energy consumption (SEC) rose as the operating time increased since the electrical energy was accumulating faster than the lithium mass was being recovered. In the case of the 2.0 V condition, the SEC values were generally lower and increased more gradually, which shows that there was a more favorable balance between the energy input and lithium recovery.
When the voltage was 2.5 V, an increase in the applied potential led to higher power consumption, together with the additional lithium transfer.
The extent of the increase is not proportional to the rise in energy input; as a result, SEC increased more rapidly, possibly because of concentration polarization, higher cell resistance, competing-ion transport, and lower current efficiency.
Figure 12.
Time evolution of specific energy consumption (SEC) during EDU operation at 2.0 and 2.5 V. Two experimental datasets are shown for each applied voltage (EDU and EDU2).
Figure 12.
Time evolution of specific energy consumption (SEC) during EDU operation at 2.0 and 2.5 V. Two experimental datasets are shown for each applied voltage (EDU and EDU2).
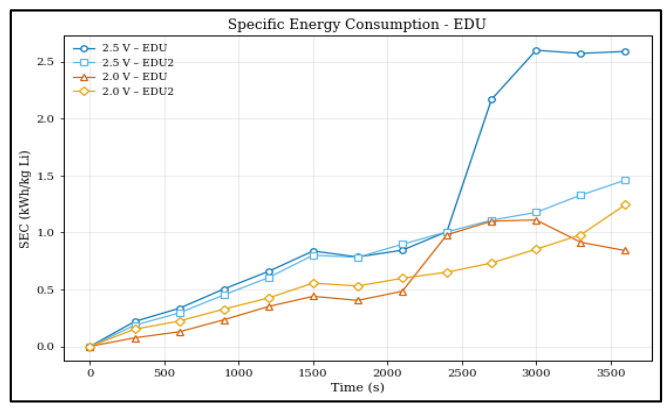
Overall, 2.0 V provided the most energy-efficient operating condition within the investigated range. Therefore, voltage selection should consider SEC, lithium recovery, Li/Na selectivity, and current efficiency rather than separation performance alone.
4. Conclusion
The experiments demonstrated the ability to combine EDU and CDI to extract and enrich lithium ions from lithium-containing solutions. EDU is mainly used for bulk extraction and concentration of lithium ions, whereas CDI serves as a polishing step to improve Li/Na separation. In EDU experiments, factors such as voltage, flow rate, and treatment time interacted and affected the process. Higher voltages tended to result in higher concentrations, extraction efficiency, and recovery rates of lithium ions, although the selectivity of Li/Na was low since the conventional ion exchange membranes could not discriminate between Li⁺ and Na⁺. Higher treatment times at a flow rate of 6 mL min⁻¹ favored mass transport and alleviated concentration polarization. In CDI experiments, voltage, adsorption time, and electrode mass loading increased lithium extraction efficiency, although a saturation trend emerged due to limitations in electrode capacity, Na⁺ adsorption, and regeneration.
The joint EDU and CDI experiments confirmed a complementary effect: EDU is responsible for transporting and concentrating lithium ions, whereas CDI aims to improve Li/Na selectivity. The optimum parameters of the hybrid method were 2.5 V, 6 mL min⁻¹, and 60 min for EDU, while for CDI the best parameters were 1.2 V, 20 min of adsorption, and 3 min of regeneration. Increasing the voltage value did not guarantee better energy efficiency because there was no correlation between the increase in the electrical energy usage and the recovery of lithium. Pilot tests with LiMn₂O₄ electrodes showed the potential of using a lithium-selective intercalation material in CDI, but further optimization of Li/Na selectivity and electrode stability is required.
Acknowledgments
I would like to express my sincere gratitude to my advisor, Dr. Corby Anderson, for his guidance and support throughout this research. I also thank the faculty, staff, and students at the Kroll Institute for Extractive Metallurgy, the Center for Resource Recovery and Recycling (CR3), and Elisa Foundation Education for their support and collaboration. This research was supported by San Cristóbal Mining, Bolivia.
References
- Balaram, V.; Santosh, M.; Satyanarayanan, M.; Srinivas, N.; Gupta, H. Lithium: A review of applications, occurrence, exploration, extraction, recycling, analysis, and environmental impact. Geoscience Frontiers 2024, 15, 101868. [CrossRef]
- Gu, J.; Liang, B.; Luo, X.; Zhang, X.; Yuan, W.; Xiao, B.; Tang, X. Recent advances and future prospects of lithium recovery from low-grade lithium resources: A review. Inorganics 2025, 13, 4. [CrossRef]
- Meshram, P.; Pandey, B.D.; Mankhand, T.R. Extraction of lithium from primary and secondary sources by pre-treatment, leaching and separation: A comprehensive review. Hydrometallurgy 2014, 150, 192–208. [CrossRef]
- Zhao, H.; Wang, Y.; Cheng, H. Recent advances in lithium extraction from lithium-bearing clay minerals. Hydrometallurgy 2023, 217, 106025. [CrossRef]
- Liu, J.; Xu, R.; Sun, W.; Wang, L.; Zhang, Y. Lithium extraction from lithium-bearing clay minerals by calcination–leaching method. Minerals 2024, 14, 248. [CrossRef]
- Yuan, H.; Li, M.; Cui, L.; Wang, L.; Cheng, F. Electrochemical extraction technologies of lithium: Development and challenges. Desalination 2025, 598, 118419. [CrossRef]
- Joo, H.; Kim, S.; Kim, S.; Choi, M.; Kim, S.; Yoon, J. Pilot-scale demonstration of an electrochemical system for lithium recovery from the desalination concentrate. Environmental Science: Water Research & Technology 2020, 6, 290–295. [CrossRef]
- Gmar, S.; Chagnes, A. Recent advances on electrodialysis for the recovery of lithium from primary and secondary resources. Hydrometallurgy 2019, 189, 105124. [CrossRef]
- Melnikov, S.; Sheldeshov, N.; Zabolotsky, V.; Loza, S.; Achoh, A. Pilot-scale complex electrodialysis technology for processing a solution of lithium chloride containing organic solvents. Separation and Purification Technology 2017, 189, 74–81. [CrossRef]
- Xu, T.; Huang, C. Electrodialysis-based separation technologies: A critical review. AIChE Journal 2008, 54, 3147–3159. [CrossRef]
- Jiang, D.; Xu, R.; Bai, L.; Wu, W.; Luo, D.; Li, Z.; Asahi, T.; Mai, Y.; Liu, Z.; Yamauchi, Y.; Xu, X. Insights into electrochemical paradigms for lithium extraction: Electrodialysis versus capacitive deionization. Coordination Chemistry Reviews 2024, 516, 215923. [CrossRef]
- Park, J.; Lee, J.; Shim, I.-T.; Kim, E.; Nam, S.-H.; Koo, J.-W.; Hwang, T.-M. Electrochemical direct lithium extraction: A review of electrodialysis and capacitive deionization technologies. Resources 2025, 14, 27. [CrossRef]
- Bryjak, M.; Siekierka, A.; Kujawski, J.; Smolińska-Kempisty, K.; Kujawski, W. Capacitive deionization for selective extraction of lithium from aqueous solutions. Journal of Membrane and Separation Technology 2015, 4, 110–115. [CrossRef]
- Huynh, V.P.; Khoi, T.M.; Kim, J.; Tran, N.A.T.; Lee, S.W.; Kim, Y.H.; Cho, Y. Selective lithium separation from Li/Co/Ni mixtures using optimized flow-electrode capacitive deionization. Desalination 2024, 592, 118112. [CrossRef]
- Lee, H.; Lim, J.; Lee, H.; Hong, S. Sustainable approach for selective lithium recovery: Capacitive deionization integrated with novel LMO flow-electrode. Desalination 2025, 593, 118224. [CrossRef]
- Li, J.; Han, L.; Wang, R.; Wang, T.; Pan, L.; Zhang, X.; Wang, C. Lithium extraction via capacitive deionization: AlF₃-coated LiMn₂O₄ spheres for enhanced performance. Desalination 2024, 591, 118035. [CrossRef]
- Ma, G.; Xu, Y.; Cai, A.; Mao, H.; Zhang, X.; Shin, D.-M.; Wang, L.; Zhou, H. Binder-free LiMn₂O₄ nanosheets on carbon cloth for selective lithium extraction from brine via capacitive deionization. Small 2024, 20, 2306530. [CrossRef]
- Xu, Y.; Wu, W.; Yi, Q.; Zhang, H.; Lu, Q.; Zhang, K.; Pang, T.; Song, J.; Zhang, D. LiMn₂O₄ nanoparticles in situ embedded in carbon networks for lithium extraction from brine via hybrid capacitive deionization. ACS Applied Materials & Interfaces 2025, 17, 4821–4831. [CrossRef]
- Ma, G.; Zhang, X.; Cai, A.; Liu, F.; Wang, L.; Zhou, H. Lithium extraction from salt lake brine by four-stage ion-distillation of flow electrode capacitive deionization. Chemical Engineering Journal 2024, 493, 152519. [CrossRef]
- Zhao, Y.; Wang, H.; Li, Y.; Wang, M.; Xiang, X. An integrated membrane process for preparation of lithium hydroxide from high Mg/Li ratio salt lake brine. Desalination 2020, 493, 114620. [CrossRef]
- Yoon, H.; Jeon, S.; Min, T.; Lee, C.K.; Lee, G. Pilot-scale capacitive deionization for water softening: Performance, energy consumption, and ion selectivity. Journal of Environmental Chemical Engineering 2024, 12, 114259. [CrossRef]
- Zhu, W.; Xu, W.; Liu, D.; He, L.; Liu, X.; Zhao, Z. Ionic transport kinetics of selective electrochemical lithium extraction from brines. Electrochimica Acta 2024, 475, 143519. [CrossRef]
- Shang, X.; Liu, J.; Hu, B.; Nie, P.; Yang, J.; Zhang, B.; Wang, Y.; Zhan, F.; Qiu, J. CNT-strung LiMn₂O₄ for lithium extraction with high selectivity and stability. Small Methods 2022, 6, 2200508. [CrossRef]
Figure 2.
Effect of applied voltage on EDU performance metrics: (a) and ; and (b) and .
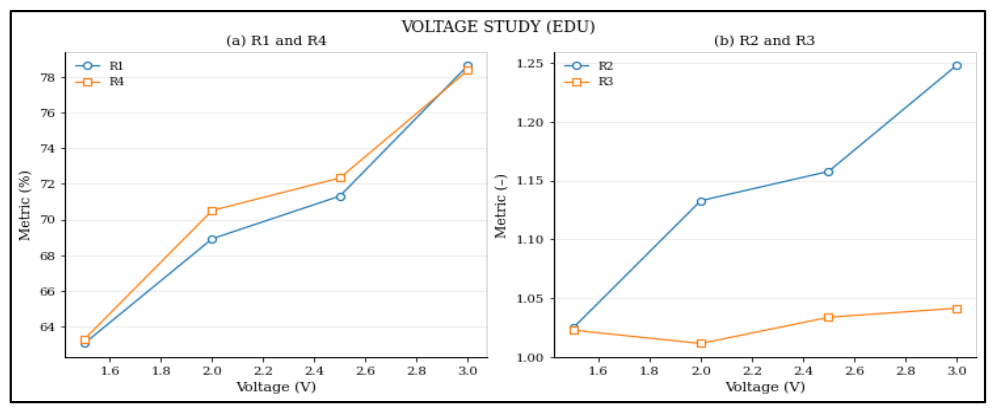
Figure 3.
Effect of operating time on EDU performance metrics: (a) R1and R4; and (b) R2and R3.
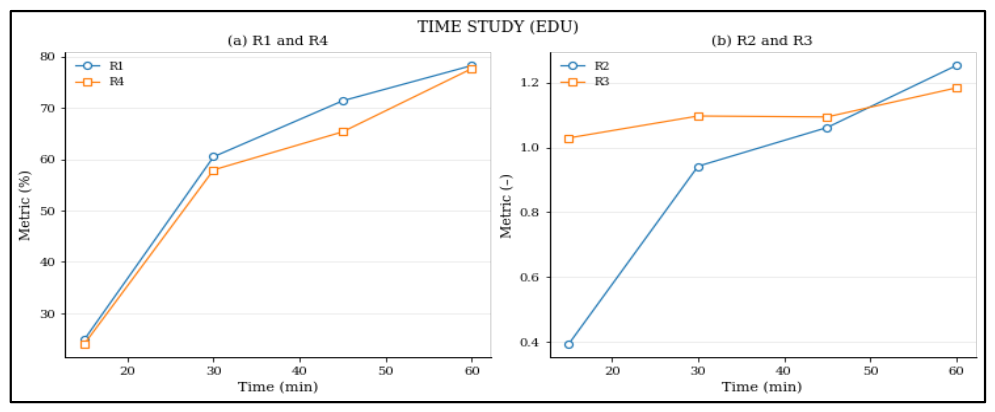
Figure 4.
Effect of flow rate on EDU performance metrics: (a) R1and R4; and (b) R2and R3.
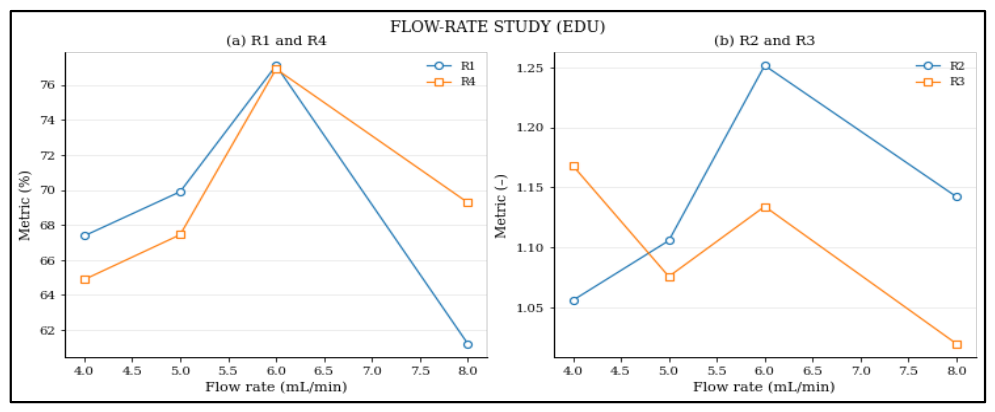
Figure 5.
Effect of applied cell voltage on lithium enrichment (R2) and Li/Na selectivity (R3) for the evaluated CDI electrodes: (a) preliminary CDI electrode, (b) L2 electrode with higher active-material mass loading, and (c) L3 electrode with the highest active-material mass loading.
Figure 5.
Effect of applied cell voltage on lithium enrichment (R2) and Li/Na selectivity (R3) for the evaluated CDI electrodes: (a) preliminary CDI electrode, (b) L2 electrode with higher active-material mass loading, and (c) L3 electrode with the highest active-material mass loading.
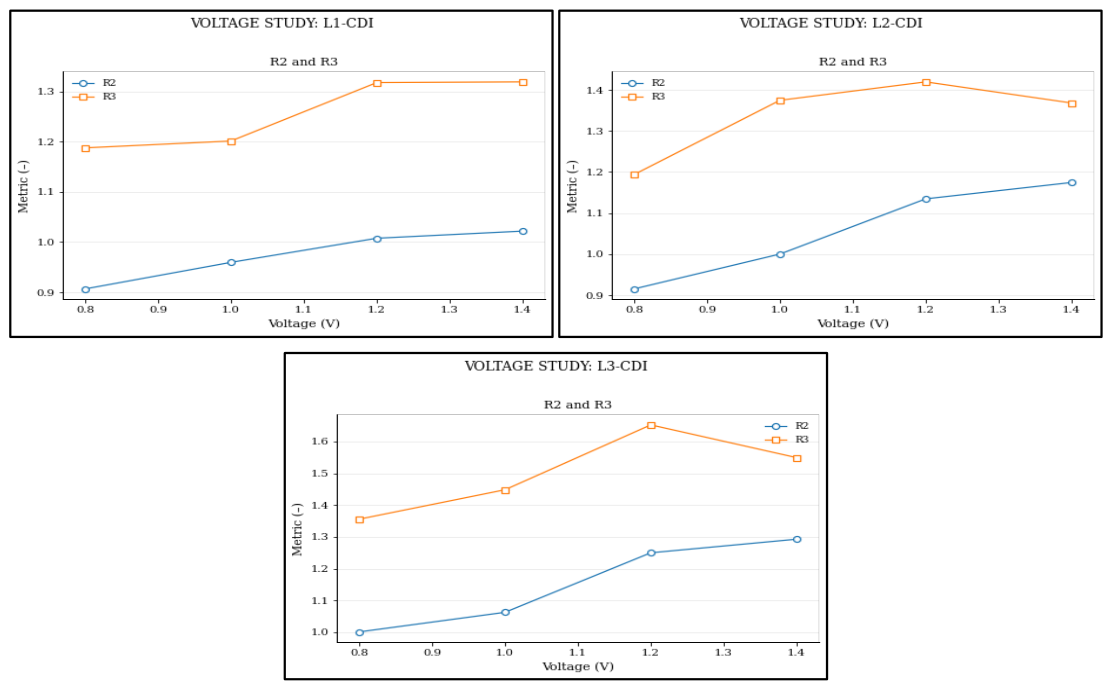
Figure 6.
Effect of adsorption time on lithium enrichment (R2) and Li/Na selectivity (R3) for the evaluated CDI electrodes: (a) preliminary CDI electrode, (b) L2 electrode with higher active-material mass loading, and (c) L3 electrode with the highest active-material mass loading.
Figure 6.
Effect of adsorption time on lithium enrichment (R2) and Li/Na selectivity (R3) for the evaluated CDI electrodes: (a) preliminary CDI electrode, (b) L2 electrode with higher active-material mass loading, and (c) L3 electrode with the highest active-material mass loading.
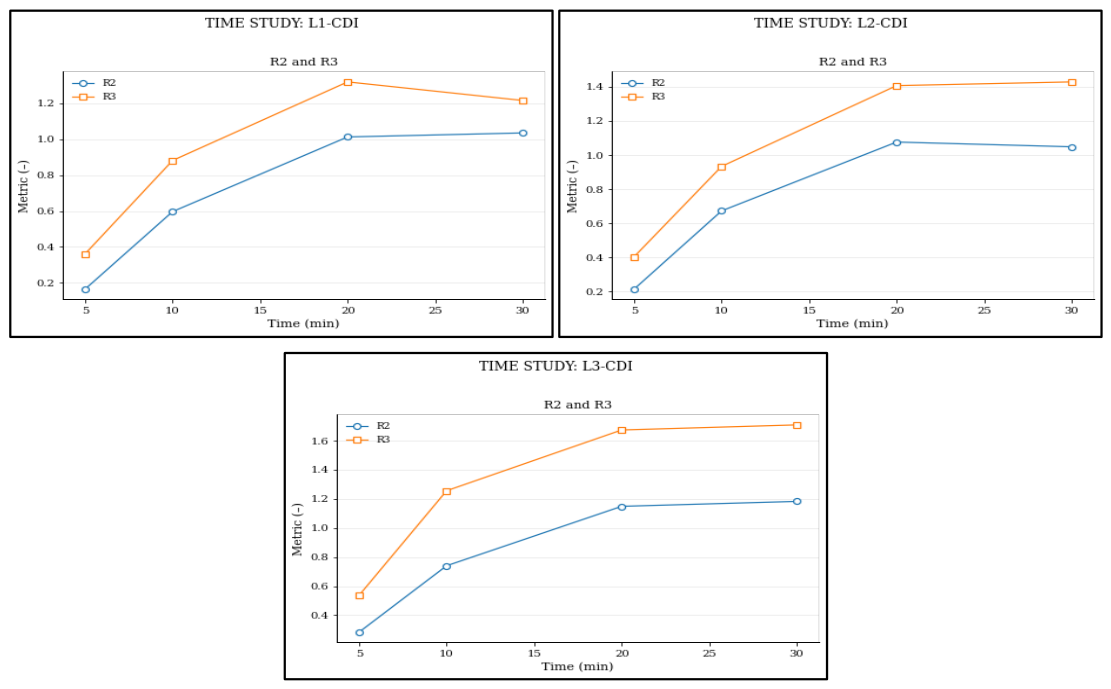
Figure 7.
Response surfaces of lithium recovery as a function of adsorption time and applied voltage for the CDI electrodes: (a) L1, (b) L2, and (c) L3.
Figure 7.
Response surfaces of lithium recovery as a function of adsorption time and applied voltage for the CDI electrodes: (a) L1, (b) L2, and (c) L3.
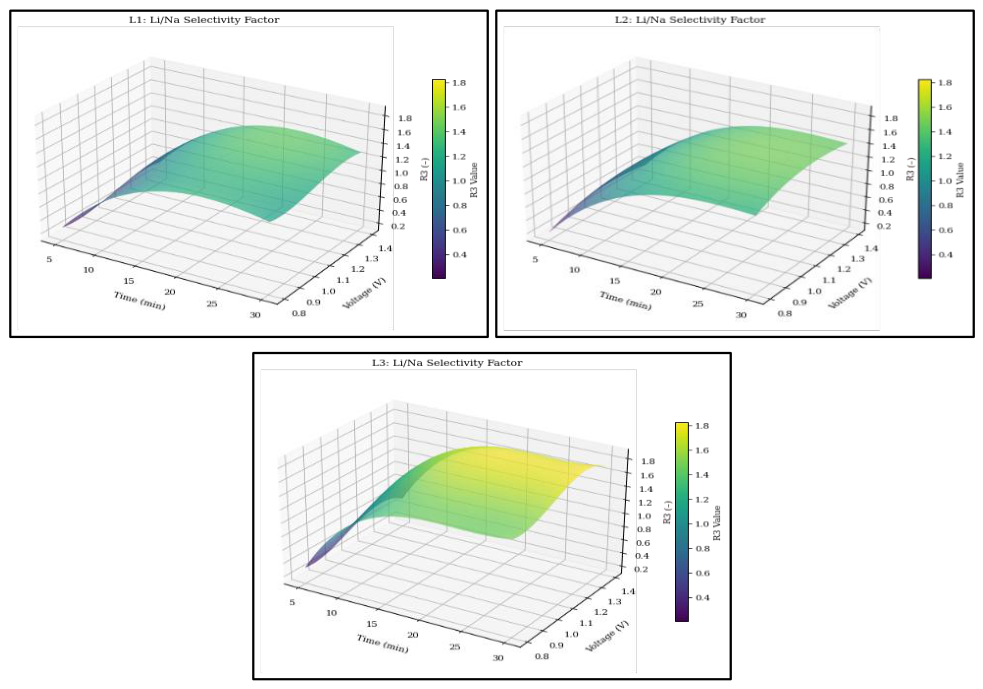
Figure 9.
Li and Na concentration profiles in the acid, base, and feed streams during the EDU stage of the integrated continuous EDU→CDI run (0–60 min).
Figure 9.
Li and Na concentration profiles in the acid, base, and feed streams during the EDU stage of the integrated continuous EDU→CDI run (0–60 min).
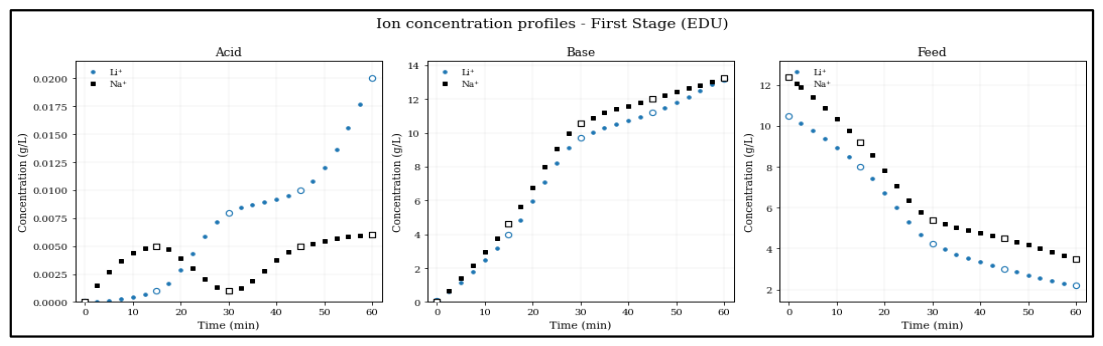
Figure 10.
Li and Na concentration profiles in the concentrate, dilute, and feed streams during the CDI stage of the integrated continuous EDU→CDI run.
Figure 10.
Li and Na concentration profiles in the concentrate, dilute, and feed streams during the CDI stage of the integrated continuous EDU→CDI run.
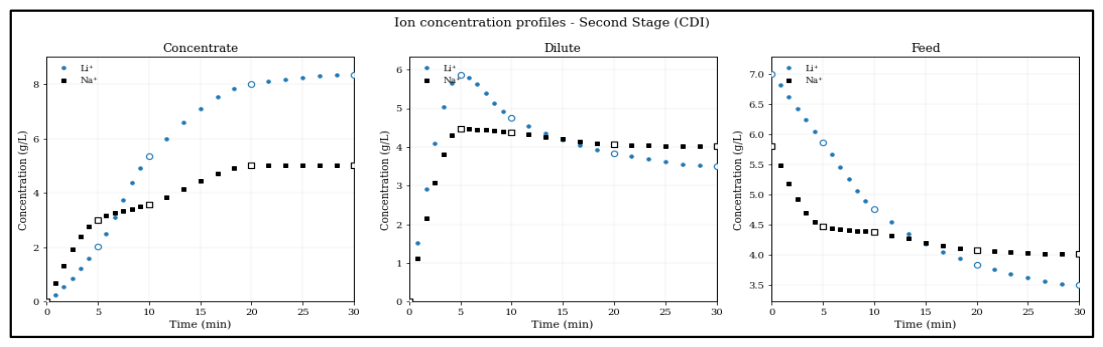
Table 2.
Operating conditions for the continuous hybrid run (ED - CDI).
| Block | Variable | Value | Block | Variable | Value |
|---|---|---|---|---|---|
| EDU | 2.5 V | CDI | 1.2 V | ||
| EDU | 6 mL/min | CDI | 20 min | ||
| EDU | 60 min | CDI | Regeneration | 3 min |
Disclaimer/Publisher’s Note: The statements, opinions and data contained in all publications are solely those of the individual author(s) and contributor(s) and not of MDPI and/or the editor(s). MDPI and/or the editor(s) disclaim responsibility for any injury to people or property resulting from any ideas, methods, instructions or products referred to in the content. |
© 2026 by the authors. Licensee MDPI, Basel, Switzerland. This article is an open access article distributed under the terms and conditions of the Creative Commons Attribution (CC BY) license (http://creativecommons.org/licenses/by/4.0/).
Copyright: This open access article is published under a Creative Commons CC BY 4.0 license, which permit the free download, distribution, and reuse, provided that the author and preprint are cited in any reuse.