

Submitted:
11 September 2026
Posted:
14 September 2026
You are already at the latest version
Abstract
Rapid urban growth in Latin America challenges municipal solid waste (MSW) man-agement. This study models energy recovery from landfill gas (LFG) and associated carbon credit generation in the Cuernavaca metropolitan area, Mexico. Based on pop-ulation projections (1.47% annual growth) and per capita generation (0.8832 kg capi-ta/day), a landfill with a 10-year lifespan would receive 3.93×10⁶ Mg of MSW, produc-ing 2.65×10⁵ Mg of CH4 over a 21-year horizon, estimated using the US EPA Landfill Gas Emissions Model. Accounting explicitly for gas-collection efficiency (75%), cover oxidation, and excluding biogenic CO₂, enclosed flaring reduces greenhouse gas emis-sions by 66.7%, while modular electricity generation in gas engines (12 MW, staged) achieves 71.8% and delivers 1.12×10⁶ MWh of renewable electricity. Techno-economic analysis indicates financial viability (net present value USD 15.7 million; internal rate of return 20.2%; levelized cost of energy USD 0.065 kWh⁻¹; discounted payback 10 years). Carbon credits contribute 28% of revenue under full baseline crediting (USD 32.4 million) but fall to USD 2.3 million if regulatory flaring defines the baseline, mak-ing additionality the decisive question for credit revenue, but not for project viability. Fuel cells maximize mitigation but are financially unviable; gas engines offer the best overall compromise.
Keywords:
carbon certificates
; circular economy
; greenhouse gases
; landfill gas
; renewable energy
; Sustainable Development Goals
; techno-economic analysis
1. Introduction
Rapid urbanization in Latin America has increased pressure on municipal solid waste (MSW) management systems, making the collection, treatment, and final disposal of MSW among the region’s most significant economic, social, and environmental challenges [1,2]. The integration of circular economy principles with smart city technologies constitutes a transformative strategy for urban sustainability, with the potential to address both inadequate waste management and environmental conservation simultaneously [3,4]. Within this framework, energy recovery from waste facilitates the transition from a linear “extract-produce-dispose” model to a circular model in which waste is converted into a resource [5].
A considerable proportion of MSW in the region is still sent to open dumps and, increasingly, to controlled landfills, whose operation entails severe environmental challenges: soil and water pollution caused by inadequate leachate management, and emissions of methane and carbon dioxide produced by the decomposition of organic matter [6,7]. Recent aerial measurement campaigns have revealed that actual methane emissions from landfills substantially exceed the values reported in official inventories, largely because a significant fraction of the gas generated is never captured by collection systems [8,9]. Any credible assessment of landfill gas (LFG) mitigation must therefore represent collection efficiency explicitly, rather than assuming that all generated methane reaches the destruction device.
Capturing and utilizing LFG reduces greenhouse gas (GHG) emissions while generating electricity, transforming an environmental liability into a renewable energy source, and is regarded as a cornerstone of the circular economy [5,10]. In Mexico, estimates of biogas production and GHG emissions have been reported for central regions of the country, including the states of Michoacán, Morelos, and Oaxaca [1,10,11]. Several international studies have combined first-order decay modeling with techno-economic evaluation and, in some cases, carbon-revenue estimation. However, most of these assessments share three simplifications that bias results optimistically: they implicitly assume 100% gas-collection efficiency, they count the biogenic CO₂ released by methane combustion as a project emission while simultaneously using a non-fossil global warming potential (a double-counting inconsistency), and they size the power plant at peak gas flow with the full capital cost incurred at the start of the project. In addition, carbon-credit revenue is typically computed against a no-action baseline without examining regulatory additionality. This work addresses these four gaps for a mid-sized Latin American city.
The Cuernavaca metropolitan area, Mexico (1.14 million inhabitants in 2024), provides a relevant case. The municipality of Cuernavaca alone collects between 416 and 450 Mg d⁻¹ of MSW, of which approximately 60 Mg d⁻¹ are generated in the Historic Center [12]; at the metropolitan scale, generation is close to 1 000 Mg d⁻¹ (Section 2.2). The management system has shown recurring signs of fragility: during 2025, contractual disputes with collection contractors threatened to paralyze operations, while in 2026 the accumulation of waste in public spaces was identified by civil protection authorities as a direct cause of drainage blockages and flooding [13]. These incidents add to the precedent of the open dump that served the region for years without environmental control before being closed under public pressure.
In Mexico, the siting, design, construction, operation, monitoring, and closure of final disposal sites, including the control of biogas, are governed by Norma Oficial Mexicana NOM-083-SEMARNAT-2003 [14]. This regulatory framework matters for two reasons. First, any new landfill for Cuernavaca must comply with it, so gas control is not optional. Second, it directly affects carbon-credit accounting: if flaring is a regulatory requirement, a crediting baseline of uncontrolled venting may not satisfy the additionality tests of crediting standards, and only the increment achieved beyond flaring would be creditable. To our knowledge, no previous Mexican LFG study has quantified the economic consequence of this distinction.
The purpose of this study is to evaluate, through modeling, the potential to reduce GHG emissions, generate renewable electricity, and assess the economic viability of LFG utilization in the Cuernavaca metropolitan area. The main contributions are: (i) quantification of methane generation and avoided emissions for two LFG management strategies under an emissions-accounting framework that includes gas-collection efficiency, cover oxidation, and the exclusion of biogenic CO₂, consistent with IPCC guidance [17,40]; (ii) a sensitivity analysis covering both the LandGEM parameters (k, L₀) and the economic and operational parameters that actually govern financial viability; (iii) a techno-economic analysis with modular, staged generation capacity (NPV, IRR, LCOE, simple and discounted payback); (iv) a comparison of four biogas-to-electricity conversion technologies on a common basis that includes their methane-destruction efficiency; (v) an estimation of carbon-credit revenue under two accounting bases: full baseline crediting, and regulatory-additionality crediting given NOM-083; and (vi) an organics-diversion scenario that tests the compatibility of the project with the waste hierarchy and circular economy principles.
Research question
To what extent does capturing and using LFG in the metropolitan area of Cuernavaca, Mexico, reduce GHG emissions, generate renewable electricity, and achieve financial viability? How do various management strategies and available conversion technologies compare?
General objective
Evaluate, through modeling, the potential to reduce GHG emissions, generate renewable electricity, and assess the economic viability of utilizing LFG in the metropolitan area of Cuernavaca, Mexico, within the framework of the circular economy and the SDGs.
Specific Objectives
- a)
- Estimate the generation of municipal solid waste and methane over the landfill’s lifespan (10 years) and the project’s timeframe (21 years), applying the US EPA’s LandGEM model.
- b)
- Quantify and compare the GHG emission reductions of two landfill management strategies: (i) capture and combustion in an industrial flare; and (ii) capture and conversion to electricity.
- c)
- Determine the uncertainty of the estimates through a sensitivity analysis of the model’s key parameters (k and L0).
- d)
- Evaluate the financial viability of the electricity generation scenario using techno-economic indicators (NPV, IRR, LCOE, and payback period).
- e)
- Compare four biogas-to-electricity conversion technologies (gas engine, microturbine, gas turbine, and fuel cell) in terms of efficiency, mitigation, and capital cost.
- f)
- Estimate the carbon credits generated by each strategy and analyze the project’s contribution to the Sustainable Development Goals of the 2030 Agenda.
2. Methods
2.1. General Framework of the Study
The study was structured in six stages: (i) population projection and MSW generation over the landfill’s useful life (10 years, 2024–2033); (ii) estimation of annual methane generation over a 21-year project horizon (2024–2044) using the LandGEM model; (iii) calculation of GHG emissions for the baseline and two management scenarios under an accounting framework with explicit collection efficiency and cover oxidation; (iv) techno-economic analysis of the electricity scenario with staged capacity; (v) sensitivity analysis of physical, economic, and operational parameters, including an organics-diversion scenario; and (vi) estimation of carbon-credit revenue under two accounting bases.
2.2. Study Area and Waste Projection
In 2024, the Cuernavaca metropolitan area had approximately 1 140 000 inhabitants, with an average annual growth rate of 1.47% observed since 2000, and a per-capita MSW generation of 0.8832 kg cap⁻¹ d⁻¹. These inputs yield a metropolitan generation of approximately 1 007 Mg d⁻¹ in 2024. This figure is consistent with the 416–450 Mg d⁻¹ reported for the municipality of Cuernavaca alone [12], which accounts for roughly 40% of the metropolitan population; the remainder corresponds to Jiutepec, Temixco, Emiliano Zapata, Xochitepec, and neighboring municipalities served by the same disposal infrastructure. The base case assumes that all generated waste is disposed of in the proposed landfill; because collection coverage and informal recovery reduce the mass actually landfilled, a −30% variation in disposed mass is included in the sensitivity analysis (Section 2.7).
2.3. Estimation of Methane Generation: LandGEM Model
Methane generation was estimated using the Landfill Gas Emissions Model (LandGEM, version 3.03), developed by the United States Environmental Protection Agency (US EPA) [15]. The model is based on a first-order decomposition equation that quantifies methane generation from the degradation of organic matter in the deposited waste:
Where:
: annual methane generation in the calculation year (m3 year-1)
i: year increment (1 year)
n: difference between the calculation year and the initial year of waste reception
j: increment in tenths of a year (0.1 year)
k: methane generation rate (year⁻¹)
L0: methane generation potential (m3 Mg-1)
Mi: mass of waste accepted in year i (Mg)
tij: age of fraction j of the waste mass Mi (years)
The methane generation rate (k) determines the rate at which methane is generated per unit mass of MSW. Its value depends on the moisture content of the waste, the availability of nutrients for methanogenic microorganisms, the pH, and the average ambient temperature. The base case uses the US EPA “CAA conventional” defaults, k = 0.05 yr⁻¹ and L₀ = 170 m³ Mg⁻¹ [15]. This parameter set was designed for regulatory screening and is deliberately conservative toward high generation; the alternative “inventory conventional” set (k = 0.04 yr⁻¹, L₀ = 100 m³ Mg⁻¹) is covered by the sensitivity ranges in Section 2.7, which span k = 0.02–0.07 yr⁻¹ and L₀ = 100–200 m³ Mg⁻¹. Regional calibration with field data or machine-learning methods can reduce estimation error by 54–84% [16], and first-order decay models have been applied successfully to analogous Mexican landfills [[10,16]. LFG is assumed to contain 50% methane by volume; methane volume was converted to mass using a density of 7.168 × 10⁻⁴ Mg m⁻³ [15].
2.4. Emissions Accounting Framework
Three accounting conventions are applied consistently across all scenarios. First, the CO₂ produced by the oxidation or combustion of landfill methane is biogenic and is not counted as a project emission, consistent with IPCC national-inventory guidance for the waste sector. This convention is also internally required by the choice of global warming potential: the IPCC Sixth Assessment Report assigns non-fossil methane a GWP₁₀₀ of 27, versus 29.8 for fossil methane, precisely because the CO₂ end-product of non-fossil methane oxidation is excluded from the metric [17]; counting that CO₂ again as a combustion emission would double-count it. Second, methane migrating through the landfill cover is partially oxidized by methanotrophic bacteria; the IPCC default oxidation factor for managed, covered sites, OX = 0.1, is applied to all methane not captured by the collection system [40]. Third, the gas-collection system captures only a fraction ηcol of the methane generated. The base value ηcol = 0.75 corresponds to the typical efficiency of well-designed collection systems reported by the US EPA Landfill Methane Outreach Program, with a plausible range of 0.50–0.85 examined in the sensitivity analysis. Baseline emissions (no capture) are then:
Where:
: baseline annual emissions (Mg CO₂eq)
: methane generated annually (Mg year-1)
Mg CO₂eq Mg CH₄-1
The captured and uncaptured methane flows are:
2.5. Scenario A: Capture and Combustion in an Industrial Flare
In the first strategy, captured methane is destroyed in an enclosed flare. A methane destruction efficiency ηflare = 0.90 is adopted, the default value of the CDM methodological tool for flaring (open flares are assigned only 0.50, and vendor-reported efficiencies are not accepted for crediting without monitoring). Uncaptured methane passes through the cover and is partially oxidized. Net emissions are:
2.6. Scenario B: Capture and Electricity Generation
Captured methane can fuel internal combustion engines, microturbines, gas turbines, or fuel cells [18]. The choice depends on the quantity and quality of the available biogas. For the baseline scenario, the TCG 2020 gas engine from Caterpillar Energy Solutions GmbH was selected, with an average electrical efficiency(ηelec) of 42% and a methane combustion efficiency (ηCE) of 87% [19]. Emissions are calculated in the same way as in scenario A.:
Electricity is generated only by the methane actually combusted in the engine; the uncombusted fraction (methane slip) is emitted and cannot simultaneously produce energy. With the lower heating value HP(CH₄) = 55 500 MJ Mg⁻¹:
The renewable electricity displaces generation from the National Electric System (SEN), whose 2024 emission factor is EFSEN = 0.438 Mg CO₂e MWh⁻¹, as published annually by SEMARNAT through the National Emissions Registry (RENE) [20]. A sensitivity case with the emission factor declining 3% per year reflects grid decarbonization. Avoided grid emissions and net Scenario B emissions are:
Finally, the net emissions for this scenario are:
2.6. Sensitivity Analysis and Alternative Scenarios
Two families of sensitivity analyses were performed. The first varies the physical LandGEM parameters one at a time: k = 0.02–0.07 yr⁻¹ (arid to humid climates) and L₀ = 100–200 m³ Mg⁻¹ (waste compositions), and the collection efficiency ηcol = 0.50–0.85. The second varies the economic and operational parameters that the physical analysis cannot reach: electricity price (0.060–0.090 USD kWh⁻¹), unit CAPEX (1.4–2.5 million USD MW⁻¹), carbon price (4–12 USD tCO₂e⁻¹), discount rate (8–12%), annual operating hours (7 000–8 400 h), disposed mass (−30% to +10%), a declining grid emission factor, and the crediting basis (Section 2.10). Finally, a circular-economy scenario diverts 30% of the disposed mass (source-separated organics to composting or anaerobic digestion), which also lowers the methane potential of the remaining waste; this is represented as a 30% mass reduction combined with L₀ = 136 m³ Mg⁻¹.
2.8. Techno-Economic Analysis
Because LFG flow rises for a decade and then declines, sizing the full plant at peak flow leaves capacity idle for years. Generation capacity is therefore installed in 2 MW modules (the approximate unit size of the selected engine class) added whenever the annual energy requirement exceeds installed capacity at 8 000 operating hours per year. The gas-collection system, enclosed flare, and grid interconnection, estimated at 35% of the full-build capital cost, are installed at project start. Economic parameters follow the LFG-to-energy literature [21,22]: a capital expenditure (CAPEX) of 1.8×10⁶ USD MW-1, operating and maintenance costs (OPEX) equivalent to 6% of the annual CAPEX, an electricity selling price of 0.075 USD kWh-1, a discount rate of 10%, and a carbon certificate price of 7 USD tCO₂e-1. Net present value (NPV), internal rate of return (IRR), payback period, and levelized cost of energy (LCOE) were calculated.
The NPV is:
Where:
: cash flow for year t (revenue from electricity and carbon certificates less OPEX)
: discount rate
: project’s horizon
Each annual net cash flow was calculated as the sum of revenues from electricity sales and carbon certificates, minus annual operation and maintenance costs:
Where:
: electrical energy generated during the year (kWh)
: electricity selling price = 0.075 USD kWh⁻¹
: emissions avoided in year t compared to the baseline (tCO₂e)
: price of carbon certificate = 7 USD tCO₂e⁻¹
: annual operation and maintenance costs = 6% of CAPEX per year
The internal rate of return (IRR) is the discount rate r* that makes the net present value (NPV) of the project equal to zero. It is solved implicitly for r* in the equation:
2.9. Comparison of Conversion Technologies
Four technologies were compared within the same accounting and staging framework: gas engine, microturbine, gas turbine, and fuel cell. Each technology is characterized by its electrical efficiency, its methane destruction efficiency ηCE, which the corrected accounting makes as consequential as electrical efficiency, since undestroyed methane carries a GWP of 27, and its unit CAPEX [18,23,24,25]. For each technology, the generated electrical energy, the reduction in GHG emissions, and the associated carbon certificates were estimated.
2.10. Estimation of Carbon Certificates
One carbon certificate is equivalent to a reduction of 1 Mg CO₂eq. Certificates were calculated as the difference between baseline emissions and each scenario’s emissions, multiplied by the unit price. Although the market price is variable, ranging from 0.25 to 27 USD tCO2e-1 depending on the type of project and the certification standard [26,27], LFG capture and utilization projects in Mexico typically fall within the range of 4–10 USD tCO₂e⁻¹, so an average value of 7 USD tCO₂e⁻¹ was adopted [28]. Because NOM-083 already mandates biogas control at sanitary landfills, the additionality of reductions achieved by flaring alone is questionable under crediting standards. Two accounting bases are therefore reported: (i) full baseline crediting, , applicable where the counterfactual is uncontrolled venting (e.g., retrofit of an existing uncontrolled site); and (ii) regulatory-additionality crediting, , where flaring is the regulatory baseline and only the increment from electricity generation is creditable. Monitoring, reporting, and verification (MRV) costs—typically 50 000–150 000 USD for validation plus annual verification fees—are noted qualitatively but not modeled.
3. Results
3.1. Projection of MSW Generation
To estimate the emissions reduction, the MSW generation of the population of the Cuernavaca metropolitan area in Morelos was used as a reference. In 2024, the metropolitan area had 1 140 000 inhabitants, with an average annual growth rate of 1.47% observed since 2000 and a per capita MSW generation is 0.8832 kg hab⁻¹ d⁻¹ [29]. Considering a landfill lifespan of 10 years, Figure 1 shows the combined evolution of population and waste generation. During its lifespan, the landfill would receive a cumulative total of 3.93×10⁶ Mg of MSW.
3.2. Methane Generation
Annual MSW values were entered into the LandGEM model to estimate LFG generation from natural decomposition. Considering a 21-year project horizon (2024–2044) and the waste deposited during the 10-year lifespan, methane generation peaks at 1.89×10⁴ Mg year⁻¹ in 2033, the last year of waste reception, and subsequently declines exponentially (Figure 2). The cumulative methane generation over the entire horizon is 2.65×10⁵ Mg CH4. This pattern, with a peak coinciding with landfill closure followed by a gradual decline, is consistent with that reported in analogous LandGEM applications in cities in developing countries [30,31].
3.3. GHG Emissions and LFG Management Strategies
Baseline emissions, calculated using Equation (2), amount to 6.45×10⁶ Mg CO₂eq accumulated over the project horizon (Figure 3, curve a). This value represents the climate impact that the landfill would have without any mitigation measures.
In Scenario A (75% collection, enclosed flaring at 90% destruction), net emissions fall to 2.15 × 10⁶ Mg CO₂eq, a 66.7% reduction (curve b). In Scenario B (electricity generation in gas engines plus displacement of grid generation), net emissions fall to 1.82×10⁶ Mg CO₂eq, a 71.8% reduction (curve c), while delivering 1.12×10⁶ MWh of renewable electricity for on-site use or supply to neighboring industry under an industrial-symbiosis scheme. The difference between the two scenarios is explained by the emissions avoided in the National Electric System (SEN) through the displacement of conventional power generation, which are in addition to the direct methane mitigation. These reductions are lower than the 76–89% figures commonly reported by studies that assume complete gas capture and count biogenic CO₂ [32,33] because the two corrections act in opposite directions and collection efficiency dominates. The difference between scenarios (5.1 percentage points) is smaller than under the conventional accounting, but it is a more defensible estimate of the additional climate value of energy recovery over flaring.
In addition to the environmental benefit, scenario B generates 1.72×10⁶ MWh of renewable electricity over the project horizon, energy that can be used for the landfill’s own consumption or shared with neighboring industries and communities in an industrial symbiosis scheme in accordance with the circular economy [5,27].
3.4. Sensitivity Analysis of the Model Parameters
Since the results depend on the LandGEM model’s k and L0 parameters, their influence on generated electricity and carbon credits was evaluated and shown in Table 1. Methane generation, and therefore energy and revenue, varies almost linearly with both parameters. As k varies between 0.02 and 0.07 year-1, accumulated electricity ranges from 0.56 to 1.37 TWh, while carbon credits range from USD 16.3 to USD 39.5 million. Similarly, as L0 varies between 100 and 200 m3 Mg-1, electricity ranges from 0.66 to 1.32 TWh and carbon credits range from USD 19.1 to USD 38.1 million. the financial indicators remain comfortably viable across the full ranges (NPV 6.6–22.5 million USD; IRR 17.8–23.5%). The small non-monotonicities in IRR arise from the 2 MW granularity of capacity additions.
It is important to note that the percentage reduction in emissions is practically independent of k and L0, as these parameters scale proportionally with both the baseline and the scenario emissions. This confirms the robustness of the study’s environmental conclusion, and regardless of the exact amount of methane generated, the electricity generation strategy maintains superior mitigation performance. Then, the main source of uncertainty lies in the absolute magnitudes of energy and revenue, which underscores the advisability of calibrating the model parameters regionally before the detailed design phase [10,16].
Collection efficiency behaves differently (Table 2): unlike k and L₀, it changes the percentage reductions themselves, from 44.4/47.9% at ηcol = 0.50 to 75.6/81.4% at ηcol = 0.85. The environmental conclusion of the study is therefore robust to the gas-generation parameters but conditional on achieving a well-operated collection system, the single most important design and operation variable.
3.5. Techno-Economic Analysis
Peak generation of 8.0 × 10⁴ MWh yr⁻¹ requires 12 MW at full build. Staged installation adds one 2 MW module in 2024 and further modules in 2025, 2027, 2029, 2031, and 2033, keeping the fleet capacity factor at 53% in the first year and above it thereafter—versus 10% in year one under single-build sizing. Total CAPEX is 21.6 million USD, of which 7.6 million (collection system, flare, interconnection) is incurred at project start. Table 3 summarizes the indicators; Figure 4 shows the cumulative cash flow.
3.6. Comparison of Conversion Technologies
Table 4 compares the four technologies on a common basis. Two results stand out. First, once methane slip is priced at its GWP, destruction efficiency contests electrical efficiency in importance: the microturbine and gas turbine, with near-complete combustion, achieve larger GHG reductions (80.8% and 82.2%) than the more electrically efficient gas engine (71.8%) under the engine’s reported 13% slip. Second, the fuel cell maximizes both energy (1.53 TWh) and mitigation (85.0%) but its capital cost makes it decisively unviable at current prices (NPV −22.2 M USD, IRR 3.0%), a finding that quantifies, rather than merely asserts, its prematurity for this application.[24,35].
On paper the gas turbine shows the highest NPV, driven by the lowest unit CAPEX. This result must be read with its caveats: landfill gas is delivered at near-atmospheric pressure and turbines require fuel compression to 15–20 bar (a parasitic load and additional CAPEX not modeled here); turbine efficiency degrades sharply at part load, which is unavoidable under a rising-then-declining gas curve; and turbines are not available in the 2 MW increments that make staged installation possible. Reciprocating engines, by contrast, tolerate gas quality, operate efficiently across the load range, and match the modular strategy, which is why they dominate operating LFG projects worldwide. The gas engine is therefore retained as the recommended technology, with the gas turbine flagged for site-specific evaluation should gas flows prove higher and steadier than projected.
3.7. Carbon Credits Under Two Accounting Bases
Table 5 presents the creditable volumes and revenues. Under full baseline crediting, Scenario B generates 4.63×10⁶ Mg CO₂eq of reductions worth 32.4 million USD (Scenario A: 4.30×10⁶ Mg, 30.1 million USD). If, however, NOM-083 flaring defines the regulatory baseline, only the increment of Scenario B over Scenario A is creditable: 3.3 × 10⁵ Mg CO₂eq worth 2.3 million USD; a fourteen-fold reduction in credit revenue. Critically, the project remains financially viable under every basis: NPV is 15.7, 4.9, and 4.1 million USD, and IRR is 20.2%, 13.6%, and 13.0%, under full crediting, incremental crediting, and no credits, respectively, all above the 10% hurdle rate. Carbon credits are therefore an upside for this project, not a condition of viability, a more robust conclusion than reliance on credit revenue would permit, given carbon-price volatility and the methodological rigor demanded by certification [28,36].
3.8. Organics-Diversion Scenario
Diverting 30% of the disposed mass (with L₀ reduced to 136 m³ Mg⁻¹) lowers cumulative generation to 0.63 TWh and requires only four 2 MW modules, but the project remains clearly viable: NPV of 9.6 million USD and IRR of 21.0%, with the same 71.8% relative emission reduction. LFG recovery is therefore compatible with, not in tension with, a progressive organics-diversion policy: the two can be planned jointly without the energy project creating an economic incentive to keep organics in the landfill.
3.9. Contribution to the Sustainable Development Goals
Applying circular economy principles to the sustainable management of landfills directly contributes to several Sustainable Development Goals of the United Nations’ 2030 Agenda. The literature has established that solid waste management is linked to up to 12 of the 17 SDGs and that circular approaches are key enablers of their achievement [36,37,38]. In the specific case of this study, the following contributions are identified:
SDG 3 (Good Health and Well-being). Inadequate management of municipal solid waste (MSW) directly affects the health of nearby communities through air and water pollution. Operating landfills under strict regulations, supported by IoT monitoring, is essential to safeguarding the well-being of the population.
SDG 6 (Clean Water and Sanitation). Landfill design must incorporate waterproofing and leachate treatment systems that protect water resources, preventing contamination of nearby water sources.
SDG 7 (Affordable and Clean Energy). Generating electricity from LFG provides a renewable and affordable source that diversifies the energy mix and reduces dependence on fossil fuels.
SDG 8 (Decent Work and Economic Growth). The transition to a circular economy creates jobs in the recycling, energy recovery, and waste management sectors.
SDG 11 (Sustainable Cities and Communities). Efficient municipal solid waste management and energy recovery from low-flow gas improve air quality and contribute to cleaner, healthier cities.
SDG 12 (Responsible Consumption and Production). Energy recovery transforms waste into resources, promoting more efficient use of materials and waste reduction.
SDG 13 (Climate Action). Capturing and utilizing methane, a greenhouse gas with a high global warming potential, substantially reduces emissions and has a direct climate impact.
SDG 15 (Life on Land). Management practices that prioritize recovery and recycling protect local biodiversity and promote the restoration of degraded lands.
4. Discussion
4.1. Interpretation of the Main Findings
Under an accounting framework that represents what actually happens to landfill methane—partial capture, cover oxidation, incomplete destruction, and a biogenic CO₂ end-product—energy recovery in the Cuernavaca metropolitan area reduces GHG emissions by 71.8%, versus 66.7% for enclosed flaring. Both figures are lower than the 76–89% range this and comparable studies [32,33] report under the conventional assumptions of complete capture, and the gap between them (5.1 percentage points) is correspondingly narrower. Two variables dominate the result. The first is collection efficiency: no downstream technology can destroy methane that never reaches it, which is precisely the failure mode that aerial campaigns have documented at operating landfills [8,9]. The second is engine methane slip: at the reported ηCE = 0.87 [19], slip erodes nearly ten percentage points of mitigation; if the true slip is the 2–4% typical of modern lean-burn engines (ηCE ≈ 0.97), the Scenario B reduction rises to 81.0% and generation to 1.25 TWh.
4.2. Economic Implications and Additionality
The financial indicators (NPV 15.7 M USD; IRR 20.2%; LCOE 0.065 USD kWh⁻¹) fall within the profitability range reported for LFG-to-energy facilities of similar scale, whose IRRs typically span 14–29% [21,22,39]. Two findings qualify the economics beyond that comparison. First, staged 2 MW capacity additions add 6.7 million USD of NPV over single-build sizing because they align capital deployment with the gas curve, a larger effect than most price variations examined. Second, and contrary to a common framing in the literature, carbon credits are not what makes this project viable: even with no credit revenue, the IRR of 13.0% exceeds the 10% hurdle. What the crediting basis decides is the size of the upside. Full baseline crediting yields 32.4 million USD, but because NOM-083 mandates biogas control, certifiers applying regulatory-additionality tests [26,40] may recognize only the flaring-to-electricity increment of 2.3 million USD. Municipalities planning to pledge credit revenue as project finance should treat the full-crediting figure as contingent, obtain an eligibility opinion under the intended standard before financial close, and budget MRV costs. Under the incremental basis the break-even electricity price rises to 0.063 USD kWh⁻¹, leaving a thinner but still positive margin against the assumed 0.075 USD kWh⁻¹.
4.3. Technological Selection
The gas turbine’s superior paper NPV rests on a unit CAPEX that excludes fuel-gas compression, on full-load efficiency it would rarely achieve against a rising-then-declining gas curve, and on unit sizes incompatible with staged installation. The fuel cell’s 85.0% reduction comes at an NPV of −22.2 million USD, and its stringent gas-cleanup requirements (H₂S, siloxanes, halogenated compounds) are a recognized cause of cost and reliability problems with landfill and digester gas [24,35]. The reciprocating engine remains the robust choice at this scale, with the warning that specifying low-slip engines, or oxidation catalysts where available, is now visible as a mitigation lever worth roughly ten percentage points of GHG reduction (Section 4.1). Fuel cells merit reconsideration in future phases if their costs decline [23], particularly in cogeneration schemes within an industrial-symbiosis framework.
4.4. Circular Economy and the Waste Hierarchy
Landfilling with energy recovery occupies the lowest stage of the waste hierarchy above uncontrolled disposal, so a circular-economy framing must confront an apparent tension: a project whose revenue depends on methane could inhibit diverting the organics that generate it [36,37,38]. The diversion scenario dissolves this tension quantitatively: with 30% of the mass diverted to composting or anaerobic digestion, the LFG project still returns an IRR of 21.0%. LFG recovery is best understood as a transitional technology that monetizes the legacy of waste already destined for disposal while separate policies raise diversion rates. Its verifiable contributions to the Sustainable Development Goals are those the analysis quantifies: renewable electricity (SDG 7), resource recovery from waste (SDG 12), and methane mitigation (SDG 13). Contributions to health, water, and urban quality of life (SDGs 3, 6, 11) are conditional on landfill design, leachate management, and air-quality permitting, none of which this study evaluates, and are therefore claimed here only as potential co-benefits.
4.5. Uncertainty and Robustness
The sensitivity structure separates what the model can tell a decision-maker. Percentage reductions are invariant to k and L₀, so the environmental superiority of energy recovery over flaring is robust to gas-generation uncertainty. Absolute magnitudes (energy, revenue) are not, varying by a factor of about 2.4 across the k range, which is why regional calibration with field measurements or machine-learning approaches [10,16] is recommended before detailed design. Financial viability, in turn, is governed by parameters outside LandGEM entirely, such as CAPEX, electricity price, crediting basis, and collection efficiency. Two conservative biases are acknowledged: the horizon truncates at 2044 although methane generation continues beyond it, understating both baseline emissions and recoverable energy; and the constant grid emission factor slightly overstates late-horizon avoided emissions, although the declining-factor case shows the effect on NPV is under 0.3 million USD.
4.6. Implementation Pathway
Implementation requires steps this study identifies but does not cost in detail. The landfill itself must comply with NOM-083-SEMARNAT-2003, including liner, leachate, and biogas-control specifications. At 12 MW, the plant exceeds Mexico’s 0.5 MW distributed-generation threshold and therefore requires a generation permit from the energy regulator and participation in the wholesale electricity market or a supply arrangement with qualified users. The natural offtakers are the industries of the CIVAC industrial park in Jiutepec, within the metropolitan area, which supports the industrial-symbiosis configuration assumed here; identifying anchor offtakers and the applicable wheeling charges is a priority for the pre-feasibility stage. Finally, the engines themselves are a new local source of NOₓ, CO, and formaldehyde subject to air-quality permitting; this study makes no claim of local air-quality improvement, and a criteria-pollutant assessment should accompany detailed design.
4.6. Limitations
Beyond the uncertainties above, the following limitations are identified. The analysis is pre-tax, unlevered, and in constant 2024 USD, with no price escalation. Disposal is assumed equal to generation; informal recovery and incomplete collection would reduce landfilled mass (partially bound by the −30% mass case). Leachate management and criteria air pollutants are not quantified. Waste composition data specific to Cuernavaca were not available to calibrate L₀. MRV costs for carbon certification are noted but not modeled. Post-closure methane beyond 2044 is excluded. These limitations affect magnitudes, not the ordering of the strategies
5. Conclusions
Using the Cuernavaca metropolitan area as a case study of a mid-sized Latin American city, this work quantified the emission-reduction and energy-recovery potential of landfill gas under an accounting framework that represents gas-collection efficiency, cover oxidation, methane slip, and the biogenic nature of combustion CO₂. A landfill receiving 3.93×10⁶ Mg of MSW over ten years would generate 2.65×10⁵ Mg of methane over a 21-year horizon. Capturing 75% of it and destroying it in enclosed flares reduces GHG emissions by 66.7%; using it in staged gas-engine generation raises the reduction to 71.8% and delivers 1.12×10⁶ MWh of renewable electricity.
The corrected accounting yields four conclusions that conventional assumptions obscure. First, collection efficiency, not the gas-generation model, is the variable that governs environmental performance, shifting reductions by more than thirty percentage points across its plausible range. Second, the project is financially viable on electricity sales alone (IRR 13.0% without credits; 20.2% with full crediting; NPV 15.7 million USD; LCOE 0.065 USD kWh⁻¹), so carbon credits are an upside rather than a condition of viability, which matters because regulatory additionality under NOM-083 could reduce creditable revenue from 32.4 to 2.3 million USD. Third, staging capacity in 2 MW modules adds 6.7 million USD of NPV and is a first-order design decision, not a refinement. Fourth, once methane slip is priced at its warming potential, the gas engine’s destruction efficiency becomes as important as its electrical efficiency, identifying low-slip specification as a mitigation lever worth roughly ten percentage points of reduction; fuel cells, despite the highest mitigation (85.0%), are decisively unviable at current costs (NPV −22.2 million USD).
The project remains viable under a 30% organics-diversion scenario (IRR 21.0%), demonstrating that landfill-gas recovery can be planned jointly with, rather than against, waste-hierarchy policies. Its quantified contributions are to renewable energy supply, resource recovery, and methane mitigation (SDGs 7, 12, and 13); broader benefits to health, water, and urban environments depend on design and permitting decisions outside this study’s scope.
Author Contributions
Conceptualization, R.F., A.R. and R.S.B.; methodology, R. F., M.J.C. and A. R.; software, N. L. and B.G.H.J.; validation, R.F. and R.S.B.; formal analysis, N.L., B.G.H.J., M.J.C. and A.R.; investigation, R.F., N.L. and B.G.H.J.; resources, R.F., M.J.C. and A.R.; data curation, N.L., M.J.C. and B.G.H.J; writing—original draft preparation, R.F., N.L. and B.G.H.J.; writing—review and editing, A.R. and R.S.B.; visualization, A.R. and R.S.B.; supervision, R.F. and R.S.B.; project administration, R.F. All authors have read and agreed to the published version of the manuscript.
Funding
This research received no external funding.
Informed Consent Statement
Not applicable.
Data Availability Statement
The original contributions presented in this study are included in the article. Further inquiries can be directed to the corresponding author(s).
Acknowledgments
During the preparation of this manuscript, the authors used Grammarly for the purposes of checking grammar and spelling. The authors have reviewed and edited the output and take full responsibility for the content of this publication.
Conflicts of Interest
The authors declare no conflicts of interest.
Abbreviations
The following abbreviations are used in this manuscript:
| AR6 | Sixth Assessment Report of the IPCC |
| CAPEX/OPEX | Capital/Operating expenditure |
| CH4 | Methane |
| CO2 | Carbon dioxide |
| CO2eq | Carbon dioxide equivalent |
| EE | Electrical energy generated |
| GHG | Greenhouse gas |
| GWP | Global warming potential |
| IoT | Internet of Things |
| IPCC | Intergovernmental Panel on Climate Change |
| IRR | Internal rate of return |
| LandGEM | Landfill Gas Emissions Model |
| LCOE | Levelized cost of energy |
| LFG | Landfill gas |
| MSW | Municipal solid waste |
| NOM-083 | Norma Oficial Mexicana NOM-083-SEMARNAT-2003 |
| NPV | Net present value |
| OPEX | Operating expenditure (operation and maintenance costs) |
| SDG | Sustainable Development Goal |
| SEN | Sistema Eléctrico Nacional (Mexican National Electric System) |
| tCO2e | Tonne (Mg) of carbon dioxide equivalent |
| US EPA | United States Environmental Protection Agency |
| USD | United States dollar |
The following symbols are used in this manuscript:
| EGHG,A, EGHG,B | Net annual emissions of scenarios A and B (Mg CO2eq) |
| EGHG,baseline | Baseline annual emissions (Mg CO2eq) |
| EEt | Electrical energy generated in year t (kWh) |
| EFSEN | Emission factor of the National Electric System (Mg CO2 MJ-1) |
| FCt | Net cash flow in year t (USD) |
| GWPCH4 | Global warming potential of methane (27 Mg CO2eq Mg CH4-1) |
| HPCH4 | Lower heating value of methane (55 500 MJ Mg-1) |
| i | Year increment (1 year) |
| j | Increment in tenths of a year (0.1 year) |
| k | Methane generation rate (year-1) |
| L0 | Methane generation potential (m3 Mg-1) |
| MCH4, MCO2 | Molar masses of methane and carbon dioxide (16 and 44 g mol-1) |
| Mi | Mass of waste accepted in year i (Mg) |
| n | Difference between the calculation year and the initial year of waste reception |
| OX | Oxidation factor |
| pcarbon | Price of one carbon certificate (USD tCO2e-1) |
| pelec | Electricity selling price (USD kWh-1) |
| QCH4 | Annual methane generation in the calculation year (m3 year-1) |
| r | Discount rate |
| r* | Discount rate that makes NPV = 0 (i.e., the IRR) |
| RE | Emissions avoided in the grid by displaced generation (Mg CO2eq) |
| t | Year of the project horizon |
| tij | Age of fraction j of the waste mass Mi (years) |
| T | Project horizon (21 years) |
| ẆCH4 | Mass of methane generated annually (Mg year-1) |
| ẆCH4,col, ẆCH4,unc | Captured and uncaptured methane flows |
| ηCE | Methane combustion efficiency of the gas engine |
| ηcol | Collection efficiency |
| ηelec | Electrical efficiency of the conversion technology (%) |
| ηflare | Combustion efficiency of the industrial flare |
References
- Castrejón-Godínez, M.L.; Sánchez-Salinas, E.; Rodríguez, A.; Ortiz-Hernández, Ma.L. Analysis of Solid Waste Management and Greenhouse Gas Emissions in México: A Study Case in the Central Region. JEP 2015, 06, 146–159. [Google Scholar] [CrossRef]
- Hettiarachchi, H.; Ryu, S.; Caucci, S.; Silva, R. Municipal Solid Waste Management in Latin America and the Caribbean: Issues and Potential Solutions from the Governance Perspective. Recycling 2018, 3, 19. [Google Scholar] [CrossRef]
- Pérez-Morales, L.Y.; Guzmán-López, A.; Miranda-López, R.; Bravo-Sánchez, M.G.; Botello-Álvarez, J.E. A Review of Organic Municipal Waste Management in Medium Cities in Latin America. Recycling 2026, 11, 73. [Google Scholar] [CrossRef]
- Ulloa-Murillo, L.M.; Villegas, L.M.; Rodríguez-Ortiz, A.R.; Duque-Acevedo, M.; Cortés-García, F.J. Management of the Organic Fraction of Municipal Solid Waste in the Context of a Sustainable and Circular Model: Analysis of Trends in Latin America and the Caribbean. IJERPH 2022, 19, 6041. [Google Scholar] [CrossRef] [PubMed]
- Brunner, P.H.; Morf, L.S. Waste to energy, indispensable cornerstone for circular economy: A mini-review. Waste Manag Res. 2025, 43, 26–38. [Google Scholar] [CrossRef] [PubMed]
- Rueda-Avellaneda, J.F.; Gomez-Gonzalez, R.; Rivas-García, P.; Benitez-Bravo, R.; Botello-Álvarez, J.E.; Wang, Z. Application of a sustainable location index approach to landfill site selection in Monterrey, Mexico. Waste Manag Res. 2023, 41, 1014–1025. [Google Scholar] [CrossRef] [PubMed]
- Scharff, H.; Soon, H.-Y.; Rwabwehare Taremwa, S.; Zegers, D.; Dick, B.; Villas Bôas Zanon, T.; Shamrock, J. The impact of landfill management approaches on methane emissions. Waste Manag Res. 2024, 42, 1052–1064. [Google Scholar] [CrossRef] [PubMed]
- Cusworth, D.H.; Duren, R.M.; Ayasse, A.K.; Jiorle, R.; Howell, K.; Aubrey, A.; Green, R.O.; Eastwood, M.L.; Chapman, J.W.; Thorpe, A.K.; Heckler, J.; Asner, G.P.; Smith, M.L.; Thoma, E.; Krause, M.J.; Heins, D.; Thorneloe, S. Quantifying methane emissions from United States landfills. Science 2024, 383, 1499–1504. [Google Scholar] [CrossRef] [PubMed]
- Scarpelli, T.R.; Cusworth, D.H.; Duren, R.M.; Kim, J.; Heckler, J.; Asner, G.P.; Thoma, E.; Krause, M.J.; Heins, D.; Thorneloe, S. Investigating Major Sources of Methane Emissions at US Landfills. Environ. Sci. Technol. 2024, 58, 21545–21556. [Google Scholar] [CrossRef] [PubMed]
- Merab, P.B.N.; Sadoth, S.T.; Isidro, B.J.S. First-Order Decay Models for the Estimation of Methane Emissions in a Landfill in the Metropolitan Area of Oaxaca City, Mexico. Waste 2025, 3, 14. [Google Scholar] [CrossRef]
- Vera-Romero, I.; Reyes, J.M.; Espíritu-Barragán, C.C.; Estrada-Jaramillo, M.; Ortiz-Soriano, A.; Medina-Orozco, L.E. Biogas Estimation as a Basis for the Implementation of an Intermunicipal Landfill: Michoacan, Mexico. JEP 2014, 05, 577–582. [Google Scholar] [CrossRef]
- Hasta 60 toneladas de basura se producen al día solo en el centro de Cuernavaca—El Sol de Cuernavaca. Available online: https://oem.com.mx/elsoldecuernavaca/local/hasta-60-toneladas-de-basura-se-producen-al-dia-solo-en-el-centro-de-cuernavaca-20848712 (accessed on 2026/07/17).
- García, M. La factura de la negligencia: Pagan ciudadanos de Cuernavaca, Cuautla y Jiutepec falta de prevención de inundaciones. Available online: https://www.diariodemorelos.com/noticias/factura-negligencia-pagan-ciudadanos-cuernavaca-cuautla-jiutepec-falta-prevencion-inundaciones (accessed on 2026/07/17).
- Secretaría de Medio Ambiente y Recursos Naturales: Norma Oficial Mexicana NOM-083-SEMARNAT-2003, Especificaciones de protección ambiental para la selección del sitio, diseño, construcción, operación, monitoreo, clausura y obras complementarias de un sitio de disposición final de residuos sólidos urbanos y de manejo especial; Diario Oficial de la Federación: Ciudad de México, México, 2004.
- US EPA, O. Landfill Gas Emissions Model (LandGEM). Available online: https://www.epa.gov/land-research/landfill-gas-emissions-model-landgem (accessed on 2026/07/17).
- Saeedi, M.; Mohammadi, M.; Esmaeili, N.; Farjami Niri, F.; Gol, H. Optimizing LandGEM model parameters using a machine learning method to improve the accuracy of landfill methane gas generation estimates in the United States. J. Environ. Manag. 2025, 373, 124029. [Google Scholar] [CrossRef] [PubMed]
- Intergovernmental Panel On Climate Change (Ipcc): Climate Change 2021—The Physical Science Basis: Working Group I Contribution to the Sixth Assessment Report of the Intergovernmental Panel on Climate Change; Cambridge University Press, 2023. [CrossRef]
- Abanades, S.; Abbaspour, H.; Ahmadi, A.; Das, B.; Ehyaei, M.A.; Esmaeilion, F.; El Haj Assad, M.; Hajilounezhad, T.; Hmida, A.; Rosen, M.A.; Safari, S.; Shabi, M.A.; Silveira, J.L. A conceptual review of sustainable electrical power generation from biogas. Energy Sci. Eng. 2022, 10, 630–655. [Google Scholar] [CrossRef]
- Gas Engine TCG 2020. Available online: https://www.mwm.net/en/gas-engines-gensets/gas-engine-tcg-2020/ (accessed on 2026/07/17).
- Naturales, S. de M.A. y R.: Registro Nacional de Emisiones RENE. Available online: http://www.gob.mx/semarnat/acciones-y-programas/registro-nacional-de-emisiones-rene (accessed on 2026/09/04).
- Abuhelwa, M.; Abusafa, A. Selection and analysis of the optimal technology to produce electrical energy from landfill gas in Palestine, case study. Energy Sources Part B Econ. Plan. Policy 2025, 20, 2478457. [Google Scholar] [CrossRef]
- Vourdoubas, J.; Skoulou, V.K. Case Study of Viability of Bioenergy Production from Landfill Gas (LFG). JAS 2016, 8, 165. [Google Scholar] [CrossRef]
- Chuahy, F.D.F. ; Kokjohn, S.L. Solid oxide fuel cell and advanced combustion engine combined cycle: A pathway to 70% electrical efficiency. Appl. Energy 2019, 235, 391–408. [Google Scholar] [CrossRef]
- Langnickel, H.; Rautanen, M.; Gandiglio, M.; Santarelli, M.; Hakala, T.; Acri, M.; Kiviaho, J. Efficiency analysis of 50 kWe SOFC systems fueled with biogas from waste water. J. Power Sources Adv. 2020, 2, 100009. [Google Scholar] [CrossRef]
- Zhang, X.; Wu, Y.; Zhang, W.; Wang, Q.; Wang, A. System Performance and Pollutant Emissions of Micro Gas Turbine Combined Cycle in Variable Fuel Type Cases. Energies 2022, 15, 9113. [Google Scholar] [CrossRef]
- Haya, B.; Cullenward, D.; Strong, A.L.; Grubert, E.; Heilmayr, R.; Sivas, D.A.; Wara, M. Managing uncertainty in carbon offsets: insights from California’s standardized approach. Clim. Policy 2020, 20, 1112–1126. [Google Scholar] [CrossRef]
- Octavianthy, D.; Purwanto, W.W. Designing Smart Energy System for Smart City through Municipal Solid Waste to Electricity: Techno-Economic Analysis. E3S Web Conf. 2018, 67, 02044. [Google Scholar] [CrossRef]
- Offset Carbon Footprint—ClimateTradeTM. Available online: https://climatetrade.com/ (accessed on 2026/07/17).
- Sustentable, S. de D. Programa Estatal de la Gestión y Manejo Integral de Residuos Sólidos Urbanos y de Manejo Especial en Morelos 2019–2024; Gobierno del Estado de Morelos: Morelos, México, 2019. [Google Scholar]
- Chandra, S.; Ganguly, R. Assessment of landfill gases by LandGEM and energy recovery potential from municipal solid waste of Kanpur city, India. Heliyon 2023, 9, e15187. [Google Scholar] [CrossRef] [PubMed]
- Ramprasad, C.; Teja, H.C.; Gowtham, V.; Vikas, V. Quantification of landfill gas emissions and energy production potential in Tirupati Municipal solid waste disposal site by LandGEM mathematical model. MethodsX 2022, 9, 101869. [Google Scholar] [CrossRef] [PubMed]
- Abbas, Z.; Waqas, M.; He, S. Environmental evaluation of electricity generation from landfill gas by using LEAP and IPCC model: a case study of Karachi. Energy Syst. 2025, 16, 205–226. [Google Scholar] [CrossRef]
- Alzate, S.; Restrepo-Cuestas, B.; Jaramillo-Duque, Á. Municipal Solid Waste as a Source of Electric Power Generation in Colombia: A Techno-Economic Evaluation under Different Scenarios. Resources 2019, 8, 51. [Google Scholar] [CrossRef]
- U.S. Environmental Protection Agency. Landfill Methane Outreach Program: Landfill Gas Energy Project Development Handbook; U.S. Environmental Protection Agency (EPA): Washington, D.C., 2024. [Google Scholar]
- Wasajja, H.; Al-Muraisy, S.A.A.; Piaggio, A.L.; Ceron-Chafla, P.; Aravind, P.V.; Spanjers, H.; Van Lier, J.B.; Lindeboom, R.E.F. Improvement of Biogas Quality and Quantity for Small-Scale Biogas-Electricity Generation Application in off-Grid Settings: A Field-Based Study. Energies 2021, 14, 3088. [Google Scholar] [CrossRef]
- Rodić, L.; Wilson, D. Resolving Governance Issues to Achieve Priority Sustainable Development Goals Related to Solid Waste Management in Developing Countries. Sustainability 2017, 9, 404. [Google Scholar] [CrossRef]
- González-Sánchez, R.; Alonso-Muñoz, S.; Medina-Salgado, M.S. Circularity in waste management: a research proposal to achieve the 2030 Agenda. Oper. Manag Res. 2023, 16, 1520–1540. [Google Scholar] [CrossRef]
- Sharma, H.B.; Vanapalli, K.R.; Samal, B.; Cheela, V.R.S.; Dubey, B.K.; Bhattacharya, J. Circular economy approach in solid waste management system to achieve UN-SDGs: Solutions for post-COVID recovery. Sci. Total Environ. 2021, 800, 149605. [Google Scholar] [CrossRef] [PubMed]
- Kurbatova, T.; Sidortsov, R. Trash to Hryvnias: The economics of electricity generation from landfill gas in Ukraine. IJSEPM 2022, 33. [Google Scholar] [CrossRef]
- United Nations Framework Convention on Climate Change: Large-scale Consolidated Methodology: Flaring or use of landfill gas (ACM0001); Clean Development Mechanism (CDM) Executive Board: Bonn, Germany, 2019.
Figure 1.
Projection of population and annual MSW generation in the Cuernavaca metropolitan area during the landfill’s service life (2024–2033). Source: Authors.
Figure 1.
Projection of population and annual MSW generation in the Cuernavaca metropolitan area during the landfill’s service life (2024–2033). Source: Authors.
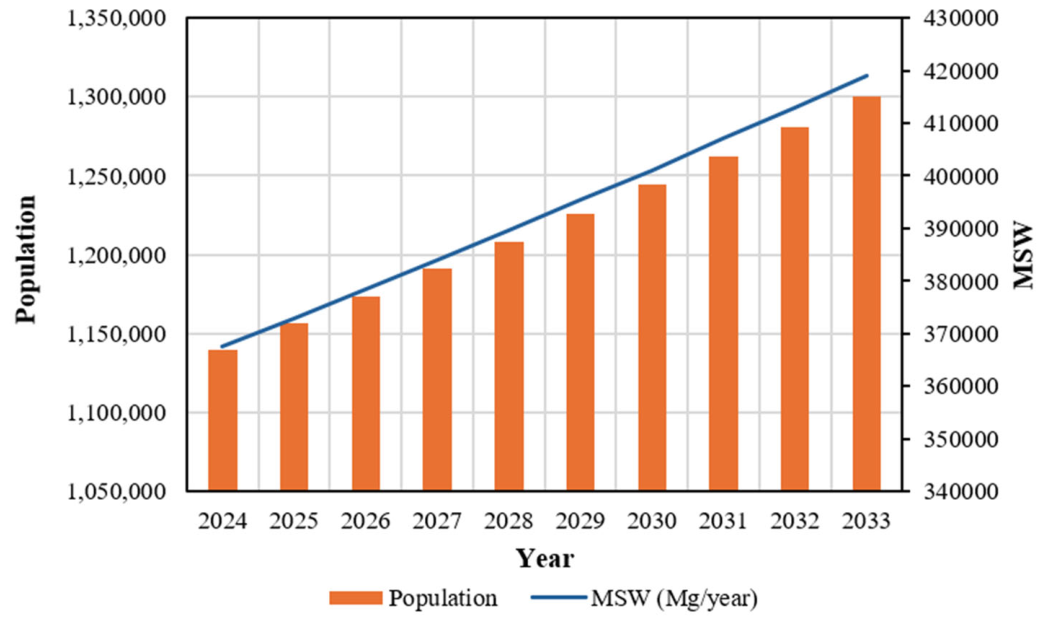
Figure 2.
Annual methane generation estimated with LandGEM over the project horizon (2024–2044), base case (k = 0.05 year⁻¹, L₀ = 170 m³ Mg⁻¹). Source: Authors.
Figure 2.
Annual methane generation estimated with LandGEM over the project horizon (2024–2044), base case (k = 0.05 year⁻¹, L₀ = 170 m³ Mg⁻¹). Source: Authors.
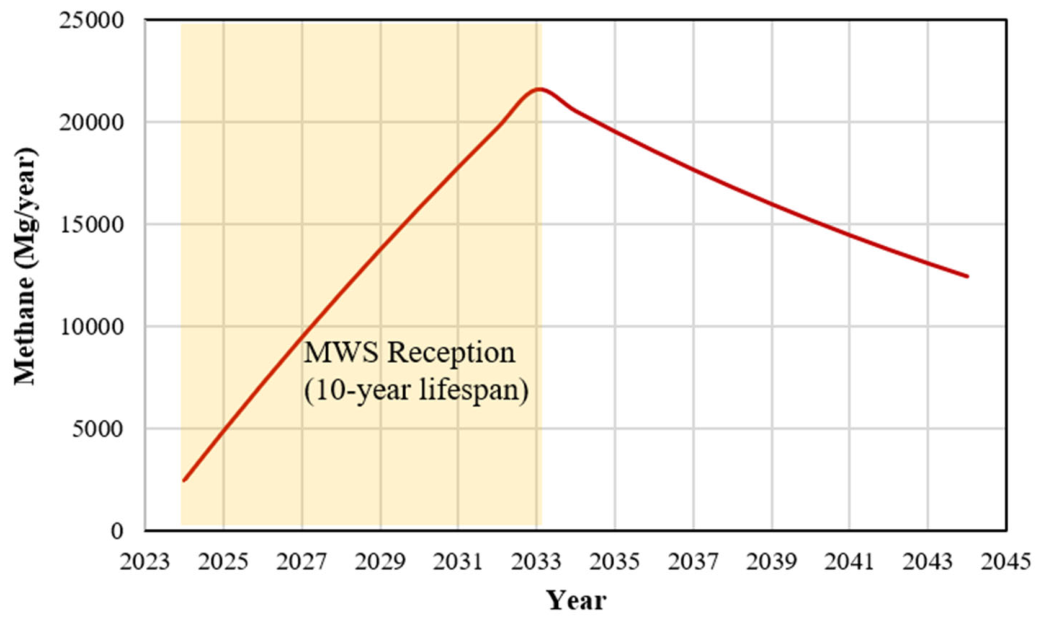
Figure 3.
Annual GHG emissions: (a) baseline without intervention; (b) Scenario A, capture and enclosed flaring; (c) Scenario B, capture and electricity generation in gas engines. Biogenic CO₂ excluded; ηcol = 0.75, OX = 0.1. Source: Authors.
Figure 3.
Annual GHG emissions: (a) baseline without intervention; (b) Scenario A, capture and enclosed flaring; (c) Scenario B, capture and electricity generation in gas engines. Biogenic CO₂ excluded; ηcol = 0.75, OX = 0.1. Source: Authors.
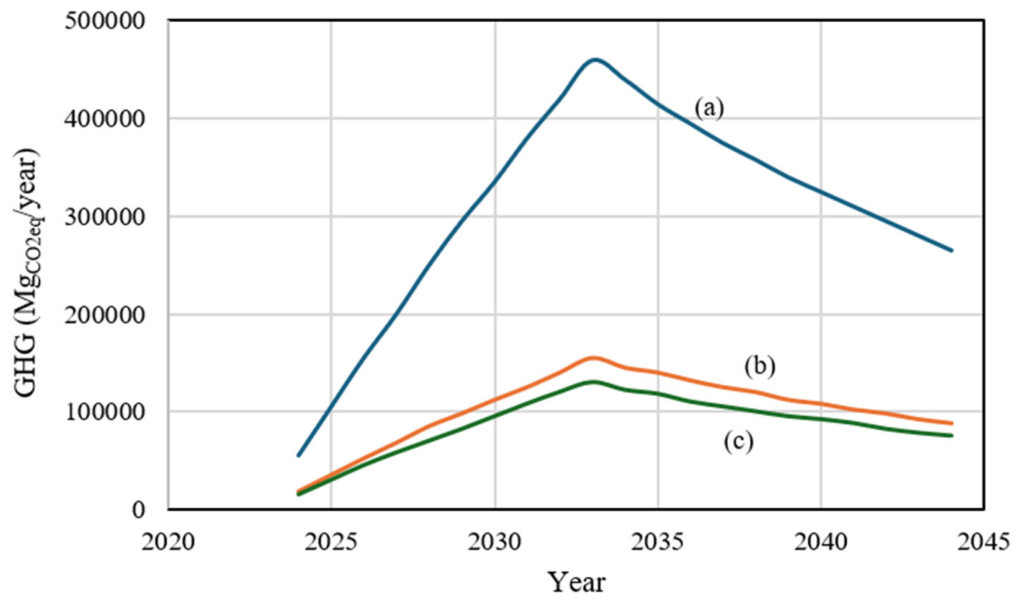
Figure 4.
Cumulative cash flow of Scenario B with staged capacity. The simple payback occurs in year 7; the discounted payback in year 10. Source: Authors.
Figure 4.
Cumulative cash flow of Scenario B with staged capacity. The simple payback occurs in year 7; the discounted payback in year 10. Source: Authors.
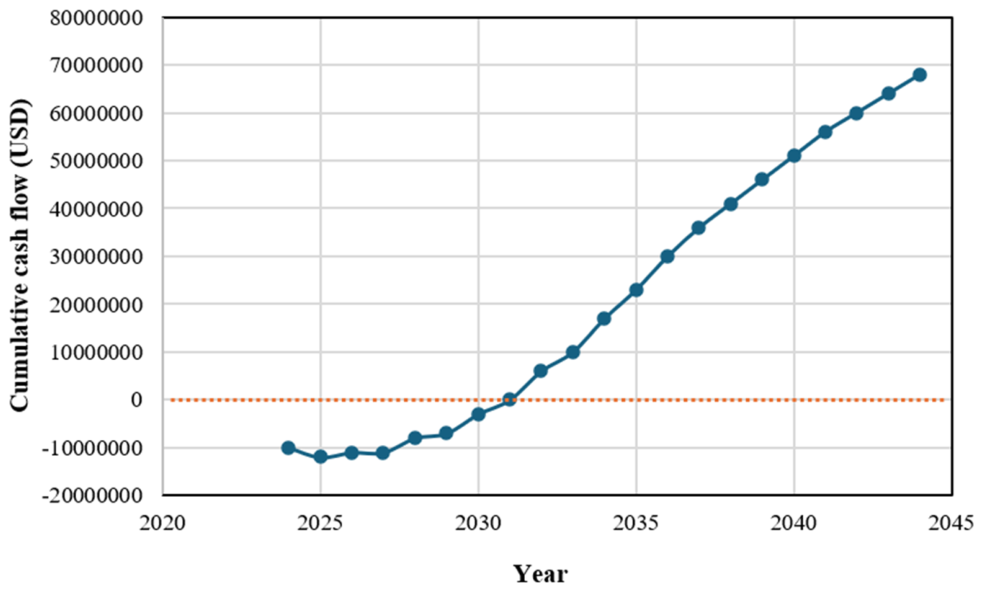

Table 1.
Sensitivity of results to the LandGEM parameters k and L₀.. Source: Authors.
| Parameter | Value | CH₄ (10³ Mg) | Electricity (TWh) | Credits, full basis (M USD) | NPV (M USD) | IRR (%) |
|---|---|---|---|---|---|---|
| k (year⁻¹) | 0.02 | 133.1 | 0.56 | 16.3 | 6.6 | 17.8 |
| k (year⁻¹) | 0.04 | 228.4 | 0.96 | 27.9 | 13.6 | 20.4 |
| k (year⁻¹) | 0.05a | 265.4 | 1.12 | 32.4 | 15.7 | 20.2 |
| k (year⁻¹) | 0.06 | 296.8 | 1.25 | 36.2 | 21.0 | 23.1 |
| k (year⁻¹) | 0.07 | 323.4 | 1.37 | 39.5 | 22.2 | 22.7 |
| L₀ (m³ Mg⁻¹) | 100 | 156.1 | 0.66 | 19.1 | 10.8 | 22.1 |
| L₀ (m³ Mg⁻¹) | 130 | 203.0 | 0.86 | 24.8 | 13.8 | 22.0 |
| L₀ (m³ Mg⁻¹) | 170 ᵃ | 265.4 | 1.12 | 32.4 | 15.7 | 20.2 |
| L₀ (m³ Mg⁻¹) | 200 | 312.2 | 1.32 | 38.1 | 22.5 | 23.5 |
ᵃ US EPA default (base case). GHG reductions (66.7% / 71.8%) are unchanged across all rows.
Table 2.
Sensitivity of emission reductions and financial indicators to gas-collection efficiency. Source: Authors.
Table 2.
Sensitivity of emission reductions and financial indicators to gas-collection efficiency. Source: Authors.
| ηcol | Reduction A (%) | Reduction B (%) | Electricity (TWh) | NPV (M USD) | IRR (%) |
|---|---|---|---|---|---|
| 0.50 | 44.4 | 47.9 | 0.75 | 10.1 | 19.5 |
| 0.60 | 53.3 | 57.4 | 0.90 | 12.0 | 19.7 |
| 0.75ᵃ | 66.7 | 71.8 | 1.12 | 15.7 | 20.2 |
| 0.85 | 75.6 | 81.4 | 1.27 | 20.7 | 22.6 |
ᵃ Base case (typical well-designed system [34]).
Table 3.
Techno-economic indicators of Scenario B (staged gas-engine generation), constant 2024 USD, pre-tax. Source: Authors.
Table 3.
Techno-economic indicators of Scenario B (staged gas-engine generation), constant 2024 USD, pre-tax. Source: Authors.
| Indicator | Value |
|---|---|
| Full-build capacity (6 × 2 MW modules, staged 2024–2033) | 12 MW |
| Total CAPEX (7.6 M USD upfront infrastructure + staged modules) | 21.6 M USD |
| Annual OPEX at full build (6% of installed CAPEX) | 1.30 M USD |
| Electricity revenue (cumulative) | 84.1 M USD |
| Carbon-credit revenue, full crediting basis (cumulative) | 32.4 M USD (27.8% of revenue) |
| Net present value (r = 10%) | 15.7 M USD |
| Internal rate of return | 20.2% |
| Levelized cost of energy | 0.065 USD kWh⁻¹ |
| Payback period (simple / discounted) | 7 / 10 years |
| Single-build alternative (12 MW in year 0): NPV / IRR | 9.1 M USD / 14.0% |
| Break-even electricity price (full crediting / incremental crediting) | 0.036 / 0.063 USD kWh⁻¹ |
Table 4.
Comparison of LFG-to-electricity technologies under the corrected accounting framework (full crediting basis). Gas-turbine figures exclude fuel-gas compression CAPEX and part-load derating; ηCE values for the microturbine, gas turbine, and fuel cell are literature-typical and should be confirmed against equipment datasheets. Source: Authors.
Table 4.
Comparison of LFG-to-electricity technologies under the corrected accounting framework (full crediting basis). Gas-turbine figures exclude fuel-gas compression CAPEX and part-load derating; ηCE values for the microturbine, gas turbine, and fuel cell are literature-typical and should be confirmed against equipment datasheets. Source: Authors.
| Technology | ηelec (%) | ηCE (%) | Capacity (MW) | Total CAPEX (M USD) | Electricity (TWh) | GHG reduction (%) | Credits (M USD) | NPV (M USD) | IRR (%) |
|---|---|---|---|---|---|---|---|---|---|
| Gas engine | 42 | 87 [20] | 12 | 21.6 | 1.12 | 71.8 | 32.4 | 15.7 | 20.2 |
| Microturbine | 30 | 99.5 [25] | 10 | 24.0 | 0.92 | 80.8 | 36.5 | 9.1 | 15.9 |
| Gas turbine | 35 | 99.9 [19] | 10 | 13.0 | 1.07 | 82.2 | 37.1 | 25.9 | 31.9 |
| Fuel cell | 50 | 99.5 [23,24] | 14 | 63.0 | 1.53 | 85.0 | 38.4 | −22.2 | 3.0 |
Table 5.
Carbon credits over the project horizon at 7 USD tCO₂e⁻¹ under alternative accounting bases, and the corresponding financial indicators for Scenario B. Source: Authors.
Table 5.
Carbon credits over the project horizon at 7 USD tCO₂e⁻¹ under alternative accounting bases, and the corresponding financial indicators for Scenario B. Source: Authors.
| Crediting basis | Creditable volume (10⁶ Mg CO₂eq) | Credit revenue (M USD) |
NPV (M USD) |
IRR (%) |
|---|---|---|---|---|
| Full baseline—Scenario B | 4.63 | 32.4 | 15.7 | 20.2 |
| Full baseline—Scenario A (flare only) | 4.30 | 30.1 | — | — |
| Regulatory additionality (B—A) | 0.33 | 2.3 | 4.9 | 13.6 |
| No credits | 0 | 0 | 4.1 | 13.0 |
Disclaimer/Publisher’s Note: The statements, opinions and data contained in all publications are solely those of the individual author(s) and contributor(s) and not of MDPI and/or the editor(s). MDPI and/or the editor(s) disclaim responsibility for any injury to people or property resulting from any ideas, methods, instructions or products referred to in the content. |
© 2026 by the authors. Licensee MDPI, Basel, Switzerland. This article is an open access article distributed under the terms and conditions of the Creative Commons Attribution (CC BY) license (http://creativecommons.org/licenses/by/4.0/).
Copyright: This open access article is published under a Creative Commons CC BY 4.0 license, which permit the free download, distribution, and reuse, provided that the author and preprint are cited in any reuse.