

Submitted:
09 September 2026
Posted:
14 September 2026
You are already at the latest version
Abstract
The future of developmental population neuroscience lies in transforming the brain’s life landscape into personalized, context‑sensitive, and actionable predictions.
Keywords:
brain chart
; lifespan
; brainality
; genetics
; connectomics
; epibrainnetomics
Sixteen years ago, Tomas Paus formally articulated Population Neuroscience as an integrative framework that bridges neuroscience, genetics, and epidemiology to uncover factors shaping the human brain [1]. Over the past decade and a half, the explosive growth of large-scale neuroimaging datasets combined with advances in analytical methods, has propelled the field far beyond its initial scope. A particularly fertile direction has emerged along the developmental dimension of the human lifespan, giving rise to what we now call Developmental Population Neuroscience [2]. This subfield leverages population-based sampling, longitudinal designs, and multilevel data (from genes and molecules to circuits, behaviour, and community contexts) to map the development of normative brain trajectories and identify sources of individual variation across development [3]. Yet, despite remarkable empirical progress [4], the field still lacks a unifying biophysical framework that can coherently link processes operating at vastly different scales, from molecular gradients and synaptic pruning to social environments and cultural embedding. Such a framework is urgently needed to move Developmental Population Neuroscience from descriptive curve-fitting towards a mature, predictive discipline capable of generating mechanistic insights and guiding targeted interventions.
In 1942, the developmental biologist Conrad Hal Waddington introduced a metaphor that has shaped developmental biology for generations [5]. He imagined a ball rolling down a landscape of hills and valleys. At the summit stands a pluripotent cell, brimming with potential. As the ball descends, it encounters branching valleys. Each fork is a developmental turning point. The valley walls, steep and protective, channel the ball toward a specific fate, ensuring that despite genetic noise and environmental perturbations, the embryo reliably becomes a healthy organism. Waddington called this buffering capacity canalization, and his model of the epigenetic landscape illustrated how development achieves robustness without deterministic pre-specification. It describes a process that takes place largely before birth. The ball’s trajectory is determined by the shape of the landscape, which is prespecified by the genetic makeup of the organism, though the chosen path can be altered by extrinsic events. The organism does not choose its path; the path chooses the organism. And when the ball finally comes to rest in a deep valley, development is complete. The journey ends.
Human brain development tells a different story. Unlike cell differentiation, which largely finishes before birth, the human brain undergoes an extraordinarily protracted period of postnatal maturation, lasting well into the third decade of life and beyond [6]. Cortical gray matter volume peaks around age 6 and then declines, while white matter volume increases steadily through adolescence and into young adulthood. Synaptic density in the prefrontal cortex does not reach its peak until after the first year of life and does not reach adult levels until the third decade. Myelination of association cortices continues into the second decade, and cortical thinning accelerates during adolescence before gradually stabilizing. These are not the dynamics of a ball rolling passively toward a predetermined basin. They are the dynamics of a system that is actively sculpted by experience, choice, and interaction.
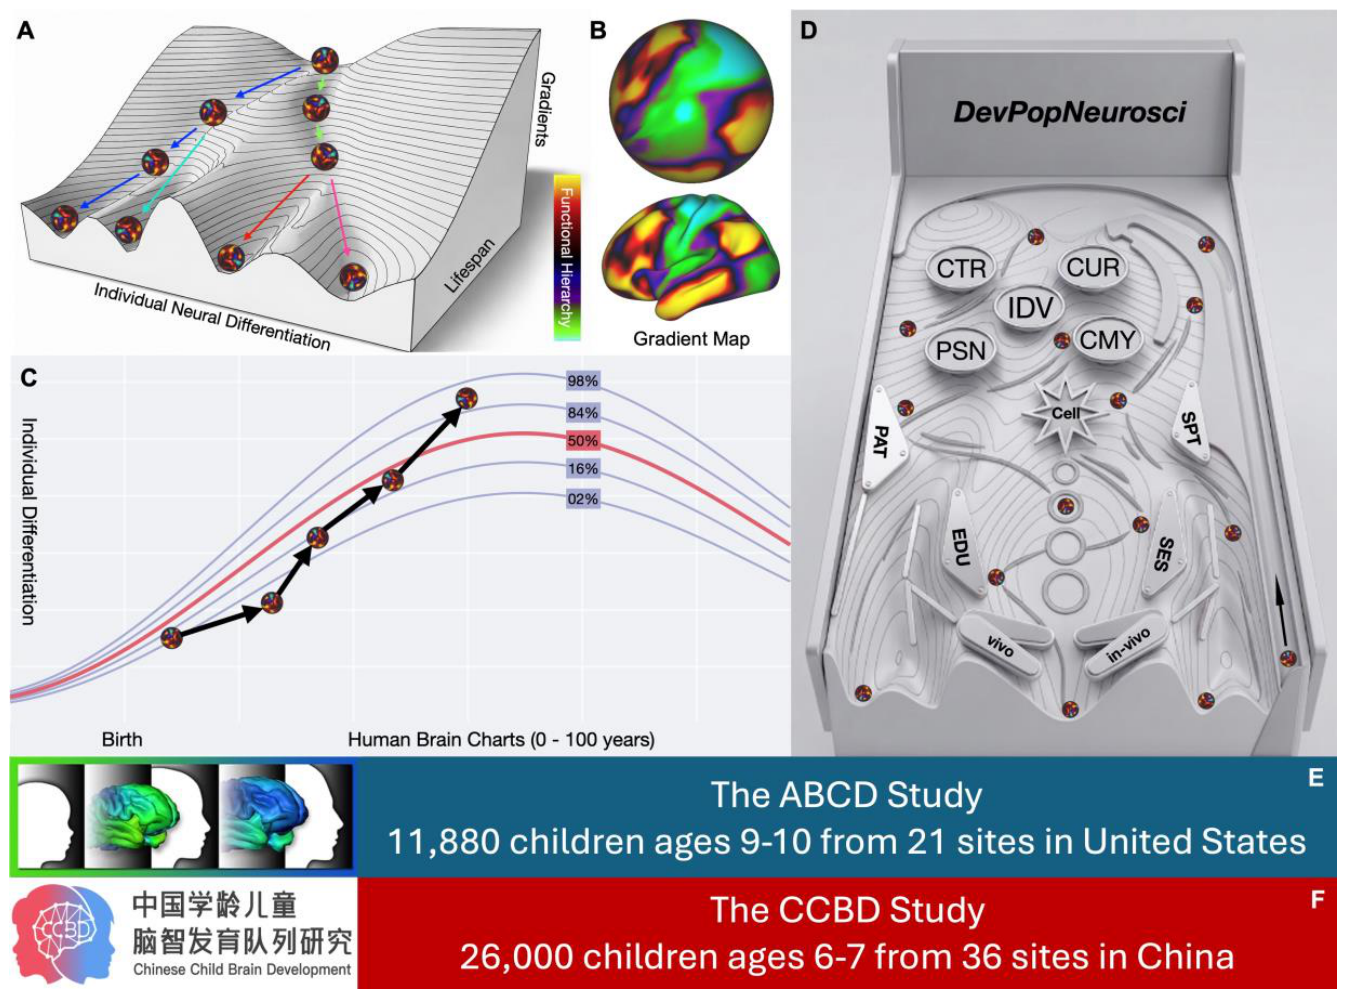
Here, we revise the Waddington landscape by replacing the cell with the brain and delineating its structure from three dimensions: gradients, lifespan, and individual neural differentiation (Figure 1a). This brainlife landscape is introduced for Developmental Population Neuroscience to achieve biophysical modeling of human neurodevelopment at different scales across the life span.
Gradients as the Driving Force of Landscape Organization
Central to the brainlife landscape is the concept of functional connectivity, which refers to the temporal correlation of spontaneous low-frequency fluctuations measured across spatially distinct brain regions [7,8]. These intrinsic correlations reveal the brain’s large-scale functional architecture without requiring any explicit task, and they are present even in the absence of conscious awareness, as demonstrated in anaesthetized animals [9]. Over the past three decades, functional connectivity has enabled the reliable identification of multiple reproducible large-scale brain networks such as default and salience ventral attention networks that recapitulate spatial topographies observed during task-evoked activity [10,11,12,13]. Importantly, individual differences in functional connectivity are stable over time and can serve as “fingerprints” for identifying individuals [14,15]. These properties make functional connectivity a powerful lens for mapping the normative and atypical trajectories of brain development and provide the empirical foundation for the gradients and brain charts that follow in the landscape.
The foundational insight that cortical organization can be understood through large-scale spatial gradients emerged from the observation that functional connectivity does not fall into discrete, sharply bounded parcels but rather varies continuously across the cortical sheet. A landmark study [16] identified a principal gradient spanning from primary sensorimotor areas at one end to regions of the default network at the other. This gradient captured the dominant axis of variance in functional connectivity patterns and was shown to be phylogenetically conserved in the macaque monkey, suggesting that it reflects a fundamental organizing principle of primate cortical architecture. Converging evidence from microstructure, connectivity, and gene expression formalized the sensorimotor-to-association (SA) gradient as a core organizational axis of the human cerebral cortex [17].
Recent advances have deepened our understanding of this axis across multiple scales. At the molecular and cellular scale, integrated whole-brain spatial transcriptomics, MRI, and retrograde tracing in the marmoset monkey discovered an opposing molecular gradient axis that underlies primate cortical organization [18]. One gradient emanates from allocortical and periallocortical regions (e.g., piriform and entorhinal cortices), whereas the opposing gradient originates from primary sensory areas, with association cortices residing at their intersection. This Pr–Al axis is present at birth but undergoes prominent postnatal refinement, suggesting that it is actively shaped by sensory experience. This molecular axis is mirrored in thalamic gene expression and aligns with thalamocortical connectivity, indicating that the SA axis is not merely a cortical phenomenon but reflects a coordinated cortico-subcortical organizational principle. Gene ontology analyses reveal that the SA axis is enriched for synaptic signaling and vesicle-cycle genes, with gene-gradient coupling peaking early in life and declining into adulthood, consistent with a transient genetic scaffold for early functional differentiation.
From an evolutionary and developmental perspective, the multimodal induction-exclusion in network development model demonstrates that the SA axis is shaped by competing molecular programs [19]: a central program induced by first-order thalamocortical inputs that establishes primary sensorimotor areas, and a pericentral program emerging from the frontotemporal poles that defines higher-order association cortex. These two programs antagonistically interact, with the pericentral program expanding inward while being excluded from primary territories. Key effector molecules such as SEMA7A (enriched in primary areas) and PLXNC1 (enriched in association cortex) mediate mutual axonal repulsion between primary and association cortices, providing a mechanistic basis for the topographic segregation captured by the SA gradient. Notably, this opposing gradient architecture is evolutionarily conserved across birds, marsupials, and primates, suggesting that it represents an ancient organizational motif that has been co-opted and elaborated during cortical expansion.
At the macro-scale level of human neuroimaging, the canonical SA axis exhibits a protracted inverted-U-shaped lifespan trajectory revealed by the first continuous normative atlas of functional connectome gradients from birth to 100 years of age [20]: its range expands across infancy, childhood and adolescence, peaking in early adulthood (≈18.8 years), before contracting during ageing. The fidelity of an individual’s SA gradient to the population template is robustly associated with cognitive performance across multiple domains, from fluid intelligence to processing speed and memory, and this association consolidates with age. Moreover, structure–function coupling along the SA axis decreases nonlinearly across the lifespan, with the most rapid decoupling occurring during infancy and early childhood [21,22,23], suggesting that early functional organization is more tightly tethered to microstructural scaffolds, whereas mature hierarchies become increasingly driven by distributed patterns of functional co-activation.
Together, these converging lines of evidence, from lifespan functional connectomics, molecular transcriptomics, and evolutionary developmental biology, establish the SA gradient as the primary axis of human cortical hierarchy. It is not a static topographic feature but a dynamic, multi-scale organizing principle that serves as a driving force propelling the human brain along its developmental trajectory toward the frontier of higher-order cognition (Figure 1b). The SA axis captures the progressive differentiation from perception and action to abstraction and integration, and its normative trajectory across the lifespan provides a quantitative scaffold for understanding both typical neurodevelopment and its deviations in psychiatric and neurodegenerative disorders [6]. The gradient dimension thus provides a spatial coordinate system that links molecular identity, cellular composition, and functional specialization, offering a biological substrate for the topographic features of Waddington’s original landscape, which we refer to as the brainlife landscape.
Lifespan Brain Charts and Individual Differentiation
Given the immense complexity of neurodevelopmental diversity at the individual level across the entire human lifespan, a unifying methodological framework is required to reconcile general population laws with personalized trajectories. Brain charts provide precisely such a framework. They extend Waddington’s classic epigenetic landscape metaphor by translating the abstract concept of canalized developmental channels into an empirical, data-driven visualization. In this view, brain charts do not merely summarize group averages; they integrate two orthogonal dimensions of the brainlife landscape, lifespan (the temporal unfolding of normative trajectories) and individual neural differentiation (the extent to which each individual deviates from, or converges toward, the population-level channel). By doing so, brain charts transform the static valley-and-ball imagery into a dynamic, quantifiable atlas of human brain development.
The methodological groundwork for brain charts was laid through efforts to establish reliable, scalable pipelines for macroscale connectome discovery (see [24] for a review). Using generalized additive models for location, scale and shape (GAMLSS), Connectome Computation System [25] demonstrated the feasibility of delineating normative trajectories of cortical thickness and surface area across seven large-scale functional networks, highlighting distinct developmental and aging patterns that vary systematically across neural systems. This early work established a critical principle: brain charts are not a single curve, but a family of trajectories across multiple phenotypes, each with its own maturational chronology. The consolidation of brain chart methodology reached a milestone with the aggregation of 123,984 MRI scans from over 100 primary studies, spanning 115 days post-conception to 100 years of age [6]. This effort employed GAMLSS to produce the first comprehensive normative growth curves for multiple global and regional brain morphometric phenotypes. These charts achieved several key advances (Figure 1c):
- 1)
- Centile scores translate population-level normative channels into precise coordinates for each individual brain, thereby quantifying where any brain sits within Waddington’s “valley”, transforming abstract developmental stability into a measurable distance.
- 2)
- Neurodevelopmental milestones delineate the “contour lines” of the developmental landscape, revealing spatiotemporal nodes where the slope (growth velocity) and topography (tissue volume) of the canalized channel change most abruptly, providing empirical yardsticks for understanding sensitive periods.
- 3)
- By tracking individual centile shifts over time, we can quantify the rate at which a person traverses the landscape, i.e., the dynamic process of deviating from or returning to the population channel, thereby upgrading Waddington’s canalization from a static cross-section to a kinetic description with velocity and acceleration.
- 4)
- Centile deviations in clinical cohorts, together with enhanced heritability, jointly anchor the biological bottom line of landscape deviation, indicating that the “depth” (variability) of the valley possesses a specific genetic architecture, and providing a biological basis for defining risk thresholds beyond which a trajectory departs from typical neurodevelopment.
From a landscape perspective, the brain chart is an empirical instantiation of Waddington’s valley: the centile curves trace the boundaries of the developmentally accessible channel, while the dispersion of individual centile scores captures the width and depth of the canalized path at each age. The finding that variability itself changes over time, increasing in gray matter during infancy, peaking in subcortical structures during adolescence, and rising sharply in ventricles during ageing, reveals that the canalized channel is not of uniform width; it widens or narrows across developmental epochs, reflecting changing constraints and opportunities for plasticity.
Despite its utility, the biological validity of brain charts has faced persistent challenges. Brain charts are primarily derived from structural MRI phenotypes, whose cellular and molecular underpinnings are only partially understood. A low centile score for cortical thickness does not inherently inform the clinician or scientist about the underlying biological processes, whether it reflects reduced synaptic density, altered myelination, shifts in dendritic arborization, or simply the influence of head size. This ambiguity limits the translational power of brain charts, as the same centile deviation could arise from vastly different causal mechanisms. Within the brainlife landscape framework, this biological validity challenge can be substantially addressed through multiscale cross-validation. By embedding brain charts within the three-dimensional coordinate system of the landscape, gradients, lifespan, and individual neural differentiation, we can interrogate the biological meaning of centile deviations in a principled manner.
- 1)
- Linking centile deviation to gradient dimensions: A child with low centile scores in the SA gradient might show delayed maturation of association cortex, whereas low centile scores in the visual-somatosensory axis might reflect modality-specific differences. By mapping centile deviations onto gradient topographies, we can distinguish local from global atypicalities and link them to known molecular or functional axes.
- 2)
- Connecting centile trajectories to gene expression and cellular profiles: Using transcriptomic atlases and virtual histology, we can ask which genes or cell types are enriched in brain regions where centile deviations are most pronounced. This allows us to move from descriptive centile scores to mechanistic hypotheses, e.g., that early life reduction in gray matter centiles is associated with synaptic signaling genes, or that late-life centile decline in white matter tracks myelination-related transcripts.
- 3)
- Validating centile predictions with functional and behavioural measures: The same individuals whose brain structure falls at a given centile can be assessed for cognitive performance, psychiatric symptoms, or real-world outcomes. This establishes a direct link between normative structural benchmarks and functional relevance.
In practice, this multiscale approach turns brain charts into a richer instrument: a given centile score is no longer a standalone number but is interpreted in the context of gradient position, developmental stage, and available multimodal evidence. For example, an adolescent whose subcortical gray matter volume lies at the 5th centile, whose SA gradient is within normal range, and whose amygdala-centile deviation aligns with expression of serotonergic genes, might be interpreted very differently from a similar centile deviation in a different gradient context. Ultimately, brain charts serve as the operational link between the macroscopic laws of neurodevelopment and the idiosyncratic trajectories of individual lives. They transform Waddington’s landscape from a qualitative metaphor into a quantitative, empirically grounded reference system. The lifespan dimension anchors each individual in developmental time; the centile dimension situates each individual relative to the population channel; and the gradient dimension adds spatial and biological specificity. The road ahead lies in refining these charts with greater demographic diversity, extending them to multimodal phenotypes (functional connectivity, diffusion metrics, perfusion), and integrating them with longitudinal tracking to capture dynamic changes within individuals. The brainlife landscape framework provides the conceptual and analytical scaffolding to interpret brain chart deviations not as isolated anomalies but as signals that arise from the interplay of molecular gradients, developmental timing, and individual experience, a true multiscale integration that enhances biological validity and accelerates clinical translation.
Toward a Unified Biophysical Framework
The brainlife landscape, defined by three orthogonal dimensions: gradients (space), lifespan (time), and individual neural differentiation (variation), provides a conceptual scaffold for integrating phenomena across multiple scales. To transform this conceptual scaffold into a predictive, quantitative framework, we must formalize it using the mathematics of stochastic dynamical systems (see Box 1). Here we draw on approaches developed in statistical mechanics and systems biology [26] to model neurodevelopment as a stochastic process evolving on a complex landscape. Let the state of a developing brain at time be described by a high-dimensional vector representing, for example, the position of an individual along the three dimensions of the brainlife landscape. In the spirit of Waddington’s canalization, the dynamics of are governed by both deterministic forces (the shape of the landscape, reflecting genetic and epigenetic constraints) and stochastic fluctuations (arising from molecular noise, environmental variability, and individual experience).
Box 1. Stochastic Differential Equations—A quantitative language for the brainlife landscape.
Biological development is inherently stochastic. At the molecular level, gene expression fluctuates; at the circuit level, neural activity is noisy; and at the environmental level, experience is variable. To capture these dynamics in a quantitative framework, we turn to stochastic differential equations (SDEs), a mathematical formalism that combines deterministic forces with random fluctuations. SDEs describe how the state of a system, such as an individual’s position on the brainlife landscape, evolves over time under the influence of both predictable (canalized) and unpredictable (noise) influences. The Boltzmann-Gibbs equation provides the empirical bridge between large-scale neuroimaging data and the landscape. If we can estimate the probability that an individual at a given age occupies a particular position in the landscape, we can reconstruct the underlying landscape topography. Regions of high probability correspond to deep attractors; regions of low probability correspond to barriers or rarely visited states.
How do we estimate the probability and the landscape parameters from real data? The answer lies in the convergence of three pillars of Developmental Population Neuroscience: 1) brain charts provide the empirical distributions of structural and functional brain phenotypes across age. By quantifying centile scores for multiple phenotypes (e.g., gray matter volume, cortical thickness, surface area, diffusion metrics), we obtain a joint probability distribution P(x(t)|age), the likelihood of observing a given brain state at a given developmental stage. 2) Gradients offer a low-dimensional embedding of cortical organization, providing a natural coordinate system for x, reducing the high-dimensional brain state space to a manageable set of continuous dimensions that capture the dominant modes of variation. The normative trajectory of these gradients across the lifespan, as well as their inter-individual variability, directly informs the time-dependent parameters. 3) Longitudinal tracking of individuals over time provides the dynamic data needed to estimate not only the stationary distribution, but also transition probabilities between states. The rate at which an individual’s centile scores change (velocity) and the acceleration of those changes reveal the local slope of the landscape and the strength of the restoring force toward the canalized channel.
Integrating these three sources, we can fit the landscape parameters at each age by: 1) Estimating the empirical distribution from cross-sectional brain chart data; 2) Extracting the dominant gradient coordinates; 3) Modeling the longitudinal trajectories to infer the deterministic drift and the noise amplitude. Mathematically, this is equivalent to solving the inverse problem: given observed trajectories, find the landscape and noise that best reproduce the data. This can be achieved through maximum likelihood estimation or Bayesian inference. This SDE framework, grounded in empirical brain charts and gradient atlases, provides a principled way to: 1) Identify critical periods when the landscape is most sensitive to perturbations; 2) Simulate the effects of specific interventions on individual trajectories; 3) Quantify the risk of deviation from typical development for a given individual; 4) Design personalized “flipper actions” that steer the trajectory toward healthier basins.
By bridging the gap between descriptive growth curves and predictive dynamical models, the brainlife landscape moves beyond metaphor, it becomes a testable, data-driven, and mathematically grounded framework for precision life management in developmental neuroscience.
We propose the following Langevin equation as a general model for neurodevelopmental dynamics:
where:
is the quasipotential landscape that defines the attractor states of the system. This landscape is parameterized by , a set of time-dependent parameters that capture the lifespan dimension, the fact that the landscape itself changes over developmental time.
is the deterministic force that pushes the system toward local minima (attractors) of the landscape, corresponding to canalized developmental outcomes.
is a stochastic noise term, representing intrinsic and extrinsic sources of variability that drive individual neural differentiation.
Crucially, the quasipotential is not directly observable but can be inferred from the probability distribution of states using the Boltzmann-Gibbs relation:
This relationship provides a direct link between empirically measured distributions (e.g., brain charts, gradient atlases) and the underlying landscape. The ultimate goal of the brainlife landscape framework is to predict how perturbations, genetic variants, early adversity, educational interventions, socioeconomic status, shift an individual’s trajectory within the landscape. For a given perturbation (a change in the parameters that define the landscape, or the parameter space of the landscape), we can compute the resulting shift in the probability distribution of states using linear response theory:
This equation formalizes the essence of a Pinball Life Machine. In this metaphor (Figure 1d), the perturbation represents the player’s action, pressing a flipper, adjusting a bumper, or introducing a targeted environmental change, while the resulting shift captures the altered odds of landing in a particular developmental outcome. Without quantitative modeling, such actions are guesses; with it, they become informed interventions whose effects on the entire distribution of developmental trajectories can be forecast. Just as a skilled pinball player learns the machine’s physics to redirect the ball, quantitative landscape modeling allows us to predict which perturbations at which critical windows will most effectively steer an individual’s trajectory away from maladaptive attractors and toward healthier basins of attraction. This shift from qualitative description to quantifiable prediction is precisely what transforms the brainlife landscape from a compelling metaphor into a rigorous, testable framework for precision life management. This allows us to predict, for example, how a specific genetic variant that affects synaptic pruning might shift the trajectory of the SA gradient, or how an early educational intervention might increase the fidelity of the SA gradient to the canonical template and thereby enhance cognitive outcomes.
Conclusion
The brainlife landscape framework, formalized through stochastic differential equations and grounded in the mathematics of quasipotential landscapes, provides a biophysical scaffold for Developmental Population Neuroscience. By linking the three dimensions of the landscape, gradients, lifespan, and individual differentiation, to quantitative models of attractor dynamics, entropy, and response to perturbations, this framework transforms the landscape from a metaphor into a predictive, testable model. The application to Pinball Life Machine illustrates how the framework can accommodate both trait-like (topological) and state-like (connectivity) features of brain disorders, and suggests new directions for intervention: targeting the landscape itself (e.g., by reshaping attractors) rather than merely treating symptoms. As we continue to populate this framework with mechanistic models and empirical data [27,28,29,30] (see Box 2), we move closer to a mature, predictive science of human neurodevelopment, one that can guide not only our understanding but also our ability to steer individual brains toward healthier paths.
Box 2. Population neuroscience resources for the Brainlife Landscape modeling.
In 2016, the National Institutes of Health in the United States initiated the Adolescent Brain Cognitive Development (ABCD) study[31]. The ABCD study is a large longitudinal cohort study of 11,880 children and their parents that is currently continuing data collection at research sites in 21 metropolitan areas of the United States. The baseline ABCD sample was ethnically diverse by design (51% White, 21.4% Hispanic, 15.2% African American, 2.3% Asian, 10.01% multiracial/other). The full sample includes siblings as well as twins. Children are followed annually for 10 years starting at approximately 9-10 years of age. The baseline visit consisted of clinical interviews, surveys, neurocognitive tests, biospecimens, and neuroimaging. Subsequent data collection timepoints alternate between on-line assessments and in-lab assessments with full cognitive and neuroimaging data collection. Over 2000 publications have already resulted from this large population neuroscience dataset, which continues to be used by researchers worldwide to answer questions relevant to youth mental health, substance use, and brain development [32].
In 2021, the China Brain Project (CBP) [33] initiated the Chinese Child Brain Development (CCBD) study. The CCBD study aims to investigate the environmental and genetic factors that affect brain and cognitive development, academic performance, and psychological well-being. A cross-sectional sample of more than 5,000 participants aged 6-18 years has been collected during the first five years. The CCBD study contains a large longitudinal cohort of more than 26,000 children aged 6-7 years, who will be followed annually until they are 18 years old [34]. The CCBD study also includes a prospective cohort that follows 10,000 children aged 3-8 years to investigate the causes of Chinese dyslexia, and the extension cohort from the existing Born in Guangzhou Cohort Study [35] to follow up 10,000 children aged 6-12 years for investigating the early predictors of learning difficulties and mental health problems. Extensive cognitive and behavioural, socioemotional, environmental, EEG, neural and genetic data have been collected for the CCBD baseline visits and ongoing for the follow-up visits. Combined with existing big data resource such as the ABCD study, the CCBD study will expand the scope of questions that can be explored through the brainlife landscape framework. With these big data of developmental population neuroscience, the CCBD study expects to substantially improve the reliability and generalizability of scientific discovery.
Author Contributions
XNZ drafted the manuscript and revised it with LQU.
Funding
The Brain Science and Brain-like Intelligence Technology-National Science and Technology Major Project grant 2021ZD0200500 (XNZ). The National Institute of Child Health and Human Development grant R21HD111805 and R01HD11669 (LQU).
Acknowledgments
The intellectual journey that has culminated in this Perspective spans more than a decade of interdisciplinary collaboration, sustained institutional support, and countless conversations across laboratories, conferences, and classrooms. It is a privilege to express our gratitude to the many individuals and organizations whose contributions have shaped Developmental Population Neuroscience into the vibrant field it is today. The International Conference on Human Brain Development (ICHBD, https://www.brain-net.cn/ichbd2026) has been the foundational engine of this enterprise. Over the past twelve years, seven ICHBD meetings have brought together developmental neuroscientists, geneticists, epidemiologists, clinicians, methodologists, and computational scientists from around the world. These conferences were not merely venues for presenting results; they were incubators of ideas, crucibles of cross-disciplinary synthesis, and the social fabric from which Developmental Population Neuroscience emerged. We thank the Chinese Academy of Sciences (CAS) and the CAS Institute of Psychology for hosting and supporting multiple ICHBD meetings, and the Beijing Normal University for its unwavering commitment to advancing brain science through international dialogue. The spirit of openness, rigor, and collegiality that has characterized ICHBD from its first meeting in 2014 to its most recent gathering is the very spirit that has propelled this field forward. The scientific foundation of Developmental Population Neuroscience rests on large-scale, population-based neuroimaging cohorts. We are deeply grateful to all members of the Chinese Color Nest Project (CCNP) and its successors, the CCBD (Chinese Child Brain Development) and DLPFC (Decade circLe CCNP Family Cohort) studies, whose collective efforts have transformed the vision of developmental brain mapping into a tangible, longitudinal reality. We thank the investigators, research coordinators, data managers, MRI technologists, and administrative staff at the Beijing Normal University, the CAS Institute of Psychology, the Science Data Bank (https://brain-net.cn/ccndc), and our partner institutions for their tireless dedication. Their meticulous work has made it possible to chart the brain’s developmental landscape with unprecedented precision. We are equally indebted to the broader international consortia that have shaped the conceptual and empirical infrastructure of the field, including the Adolescent Brain Cognitive Development (ABCD) Study, the Functional/Human Connectome Project (FCP/HCP), and the UK Biobank. These initiatives have demonstrated that large-scale data sharing and collaborative harmonization are not merely aspirational ideals but achievable realities. They have provided normative reference data, empirical maps, that underpin brain charts and gradient atlases. We thank the principal investigators, funding agencies, and participating scientists who have championed open science and built the infrastructure that enables population neuroscience to flourish. Finally, and most personally, we thank the students of our courses on Developmental Cognitive Neuroscience and Developmental Population Neuroscience across all levels, from undergraduate and graduate students to postdoctoral fellows and visiting scholars. Teaching is often described as a one-way transmission of knowledge, but our experience has been quite the opposite: it is a dialogue, a shared exploration, and a constant source of renewal. The classroom has been a laboratory of ideas, where the abstractions of landscapes, gradients, and charts are tested against the lived realities of human development. Your energy and curiosity have been the catalyst that keeps us engaged, humble, and excited about the future of this discipline. We also acknowledge the families and children who have participated in our longitudinal studies. Your trust and generosity, sharing your time, your brains, and your stories, are the real foundation of Developmental Population Neuroscience. As we submit this Perspective, we are mindful that the landscape we describe is itself a work in progress. It will be reshaped by the next generation of students, the next wave of data, and the next iteration of ICHBD. We look forward to that unfolding with anticipation and hope.
Conflicts of Interest
Authors declare that they have no competing interests.
References
- T. Paus, Population neuroscience: why and how. Hum. Brain Mapp. 31, 891-903 (2010). [CrossRef]
- X.N. Zuo, Y. He, X. Su, X.H. Hou, X. Weng, Q. Li, Developmental population neuroscience: emerging from ICHBD. Sci. Bull. 63, 331-332 (2018). [CrossRef]
- E.B. Falk et al., What is a representative brain? Neuroscience meets population science. Proc. Natl. Acad. Sci. U. S. A. 110, 17615-176122 (2013). [CrossRef]
- T. Paus, Population neuroscience: Principles and advances. Curr. Top. Behav. Neurosci. 68, 3-34 (2024). [CrossRef]
- C.H. Waddington, Canalization of development and the inheritance of acquired characters. Nature 150, 563-565 (1942). [CrossRef]
- R.A.I. Bethlehem et al., Brain charts for the human lifespan. Nature 604, 525-533 (2022). [CrossRef]
- B.B. Biswal, F.Z. Yetkin, V.M. Haughton, J.S. Hyde, Functional connectivity in the motor cortex of resting human brain using echo-planar MRI. Magn. Reson. Med. 34, 537-541 (1995). [CrossRef]
- B.B. Biswal, L.Q. Uddin, The history and future of resting-state functional magnetic resonance imaging. Nature 641, 1121-1131 (2025). [CrossRef]
- J.L. Vincent et al., Intrinsic functional architecture in the anaesthetized monkey brain. Nature 447, 83-86 (2017). [CrossRef]
- B.T.T. Yeo et al., The organization of the human cerebral cortex estimated by intrinsic functional connectivity. J. Neurophysiol. 106, 2322-2345 (2011). [CrossRef]
- L.Q. Uddin, Salience processing and insular cortical function and dysfunction. Nat. Rev. Neurosci. 16, 55-61 (2015). [CrossRef]
- S.M. Smith et al., Correspondence of the brain’s functional architecture during activation and rest. Proc. Natl. Acad. Sci. U. S. A. 106, 13040-13045 (2009). [CrossRef]
- R. Kong et al., A network correspondence toolbox for quantitative evaluation of novel neuroimaging results. Nat. Comms. 16, 2930 (2025). [CrossRef]
- J. Dubois, R. Adolphs, Building a science of individual differences from fMRI. Trends Cogn. Sci. 20, 425-443 (2016). [CrossRef]
- E.S. Finn et al., Functional connectome fingerprinting: identifying individuals using patterns of brain connectivity. Nat. Neurosci. 18, 1664-1671 (2015). [CrossRef]
- D.S. Margulies et al., Situating the default-mode network along a principal gradient of macroscale cortical organization. Proc. Natl. Acad. Sci. U. S. A. 113, 12574-12579 (2016). [CrossRef]
- J.M. Huntenburg, P.L. Bazin PL, D.S. Margulies, Large-scale gradients in human cortical organization. Trends Cogn. Sci. 22, 21-31 (2018). [CrossRef]
- Z. Huang et al., An opposing molecular gradient axis underlies primate cortical organization. Science 392, eaea2673 (2026). [CrossRef]
- J. Tsyporin et al., Competing programs shape cortical sensorimotor–association axis development. Nature 656, 688-699(2026). [CrossRef]
- H.P. Taylor et al., Functional hierarchy of the human neocortex across the lifespan. Nature 652, 955-964 (2026). [CrossRef]
- H.M. Dong, D.S. Margulies, X.N. Zuo, A.J. Holmes. Shifting gradients of macroscale cortical organization mark the transition from childhood to adolescence. Proc. Natl Acad. Sci. USA 118, e2024448118 (2021). [CrossRef]
- V.J. Sydnor et al., Neurodevelopment of the association cortices: patterns, mechanisms, and implications for psychopathology. Neuron 109, 2820-2846 (2021). [CrossRef]
- V.J. Sydnor et al., Intrinsic activity development unfolds along a sensorimotor–association cortical axis in youth. Nat. Neurosci. 26, 638-649 (2023). [CrossRef]
- L.Z Chen, A.J. Holmes, X.N. Zuo, Q. Dong, Neuroimaging brain growth charts: A road to mental health. Psychoradiology 1, 272-286 (2021). [CrossRef]
- T. Xu, Z. Yang, L. Jiang, X.X. Xing, X.N. Zuo, A Connectome Computation System for discovery science of brain. Sci. Bull. 60, 86-95 (2015). [CrossRef]
- A.P. Feinberg, A. Levchenko, Epigenetics as a mediator of plasticity in cancer. Science 379, eaaw3835 (2023). [CrossRef]
- J.C. Pang et al., Geometric constraints on human brain function. Nature 618, 566-574 (2023). [CrossRef]
- F. Normand et al., Geometric constraints on the architecture of mammalian cortical connectomes. Cell 189, 5283-5303.e17 (2026). [CrossRef]
- S. Marek et al., Patterns of brain-wide associations reflect socioeconomics. Science 392, eaee6213 (2026). [CrossRef]
- X.N. Zuo, The BrainNet imperative: why global brain science needs its own ImageNet moment. Sci. Bull. 71, 1587-1590 (2026). [CrossRef]
- D.M. Barch et al., Demographic and mental health assessments in the adolescent brain and cognitive development study: Updates and age-related trajectories. Dev. Cogn. Neurosci. 52, 101031 (2021). [CrossRef]
- N.R. Karcher, D. M. Barch, The ABCD study: understanding the development of risk for mental and physical health outcomes. Neuropsychopharmacology 46, 131-142 (2021). [CrossRef]
- X. Liu, T. Gao, T. Lu, Y. Bao, G. Schumann, L. Lu, China Brain Project: from bench to bedside. Sci. Bull. 68, 444-447 (2023).. [CrossRef]
- L. Zhang, G. Xue, Diverse and large-scale brain data in child development research. Nat. Hum. Behav. 9, 1070-1072 (2025). [CrossRef]
- S. Huang et al., The Born in Guangzhou Cohort Study enables generational genetic discoveries. Nature 626, 565-573 (2024). [CrossRef]
Figure 1.
The brainlife landscape for developmental population neuroscience. A) The brainlife landscape is revised from Waddington’s landscape in epigenetics. The colorful ball represents a topological equivalent of the human brain. The color indicates functional hierarchy. This landscape contains three dimensions including gradients, lifespan and individual neural differentiation. B) Gradient mapping on brain surface and its topologically transformed sphere. This sensorimotor (blue)-association (yellow) map is from the seminal gradient work [16]. C) Human brain charts characterize the group-level development trajectories and individual differentiation of the white matter volumes at different levels (from 2% to 98%). These data are from the seminal chart work [6]. Multiple occasions of individual records from the same person are plotted on the normative chart graph with arrows indicating the individual developmental curve. D) A pinball life machinery is visualized for developmental population neuroscience (DevPopNeurosci). It summarizes various factors to modify the trajectories on the landscape by using vivo or in-vivo approaches. The factors cover from micro- to macro-scales including cell, individual (IDV), personal networks (PSN), community (CMY), country and region (CTR), culture (CUR). Each scale contains many different factors, which are documented with details in [3]. Several slingshots are set to highlight the key variables for changing the ball’s trajectories: the patient model (PAT), sports (SPT), education (EDU) and socioeconomic status (SES). E) The Adolescent Brain Cognitive Development (ABCD) study. F) The Chinese Child Brain Development (CCBD) study.
Figure 1.
The brainlife landscape for developmental population neuroscience. A) The brainlife landscape is revised from Waddington’s landscape in epigenetics. The colorful ball represents a topological equivalent of the human brain. The color indicates functional hierarchy. This landscape contains three dimensions including gradients, lifespan and individual neural differentiation. B) Gradient mapping on brain surface and its topologically transformed sphere. This sensorimotor (blue)-association (yellow) map is from the seminal gradient work [16]. C) Human brain charts characterize the group-level development trajectories and individual differentiation of the white matter volumes at different levels (from 2% to 98%). These data are from the seminal chart work [6]. Multiple occasions of individual records from the same person are plotted on the normative chart graph with arrows indicating the individual developmental curve. D) A pinball life machinery is visualized for developmental population neuroscience (DevPopNeurosci). It summarizes various factors to modify the trajectories on the landscape by using vivo or in-vivo approaches. The factors cover from micro- to macro-scales including cell, individual (IDV), personal networks (PSN), community (CMY), country and region (CTR), culture (CUR). Each scale contains many different factors, which are documented with details in [3]. Several slingshots are set to highlight the key variables for changing the ball’s trajectories: the patient model (PAT), sports (SPT), education (EDU) and socioeconomic status (SES). E) The Adolescent Brain Cognitive Development (ABCD) study. F) The Chinese Child Brain Development (CCBD) study.
Disclaimer/Publisher’s Note: The statements, opinions and data contained in all publications are solely those of the individual author(s) and contributor(s) and not of MDPI and/or the editor(s). MDPI and/or the editor(s) disclaim responsibility for any injury to people or property resulting from any ideas, methods, instructions or products referred to in the content. |
© 2026 by the authors. Licensee MDPI, Basel, Switzerland. This article is an open access article distributed under the terms and conditions of the Creative Commons Attribution (CC BY) license (http://creativecommons.org/licenses/by/4.0/).
Copyright: This open access article is published under a Creative Commons CC BY 4.0 license, which permit the free download, distribution, and reuse, provided that the author and preprint are cited in any reuse.